GEOTECHNICAL ENGINEERING RECONNAISSANCE OF THE … · GEOTECHNICAL ENGINEERING RECONNAISSANCE OF...
92
Geotechnical Extreme Events Reconnaissance Association Report No. GEER-055A 16 October, 2017 GEOTECHNICAL ENGINEERING RECONNAISSANCE OF THE 19 SEPTEMBER 2017 Mw 7.1 PUEBLA-MEXICO CITY EARTHQUAKE Version 1.0 Editors: Juan M. Mayoral, Tara C. Hutchinson, and Kevin W. Franke Geotechnical Extreme Events Reconnaissance Association www.geerassociation.org DOI: 10.18118/G6JD46
Transcript of GEOTECHNICAL ENGINEERING RECONNAISSANCE OF THE … · GEOTECHNICAL ENGINEERING RECONNAISSANCE OF...
Geotechnical Extreme Events Reconnaissance Association Report No. GEER-055A
16 October, 2017
GEOTECHNICAL ENGINEERING RECONNAISSANCE OF THE 19
SEPTEMBER 2017 Mw 7.1 PUEBLA-MEXICO CITY
EARTHQUAKE Version 1.0
Editors: Juan M. Mayoral, Tara C. Hutchinson, and Kevin W. Franke
Geotechnical Extreme Events Reconnaissance Association www.geerassociation.org
DOI: 10.18118/G6JD46

1
Geotechnical Engineering Reconnaissance of the 19 September 2017 Mw 7.1 Puebla-Mexico
City Earthquake: Version 1.0 DOI: 10.18118/G6JD46
UNAM Team Leader: Juan Manuel Mayoral Villa (UNAM)
GEER Co-Team Leaders: Tara C. Hutchinson (UCSD) and Kevin W. Franke (BYU)
Contributing Authors (in Alphabetical Order):
Mauricio Alcaráz, Universidad Nacional Autónoma de México Pedro Arduino, University of Washington
Domniki Asimaki, California Institute of Technology Adriana Badillo, Universidad Nacional Autónoma de México Gabriel Candia, Universidad del Desarrollo-CIGIDEN, Chile
Ernesto Castañón, Universidad Nacional Autónoma de México Jake Dafni, University of Washington
Shideh Dashti, University of Colorado, Boulder Chadi S. El Mohtar, University of Texas, Austin
Kevin W. Franke, Brigham Young University Tara C. Hutchinson, University of California, San Diego
Christian Ledezma, Pontificia Universidad Católica de Chile Anne Lemnitzer, University of California, Irvine
Eric Lo, University of California, San Diego Alejandro Martinez, University of California, Davis
Juan Manuel Mayoral Villa, Universidad Nacional Autónoma de México
Jorge Meneses, California Seismic Safety Commission Gonzalo Montalva, Universidad de Concepción
Jack Montgomery, Auburn University Alesandra C. Morales-Vélez, University of Puerto Rico at Mayaguez
Menzer Pehlivan, CH2M Azucena Román, Universidad Nacional Autónoma de México Simón Tepalcapa, Universidad Nacional Autónoma de México
Clinton M. Wood, University of Arkansas Mark Yashinsky, California Dept. of Transportation (Caltrans)
Other Contributors (in Alphabetical Order):
Diego Allendes, Universidad del Desarrollo Gustavo Ayala, Universidad Nacional Autónoma de México
Benjamin Barrett, Brigham Young University Jenny Blonquist, Brigham Young University
Jingwen He Liang, Brigham Young University Falko Kuester, University of California, San Diego
Dominique Meyer, University of California, San Diego Eduardo Miranda, Stanford University Thomas O’Rourke, Cornell University
Saul Ramirez, Brigham Young University Xavier Vera-Grunauer, Geoestudios, Ecuador

2
Acknowledgements The work of the GEER Association is based in part on work supported by the National Science Foundation
through the Geotechnical Engineering Program under Grant No. CMMI-1266418. Any opinions, findings,
and conclusions or recommendations expressed in this material are those of the authors and do not
necessarily reflect the views of the NSF. The GEER Association is made possible by the vision and support
of the NSF Geotechnical Engineering Program Directors: Dr. Richard Fragaszy and the late Dr. Cliff Astill.
GEER members also donate their time, talent, and resources to collect time-sensitive field observations
of the effects of extreme events.
We acknowledge and thank UNAM for the resources, space, and personnel provided to the GEER team
during this reconnaissance effort. Acknowledgement and thanks are also extended to Arup, Parsons, and
the National Aeropuerto Internacional de Ciudad de México (NAICM) project personnel for providing the
team with a tour of the NAICM site, particularly Tom Wilcock (Arup), Bashar Altabba (Parsons), Marco
Reyes (Parsons), Ricardo Hidalgo (NAICM), and Luis R Velázquez (NAICM). We also acknowledge and thank
the support given to professors Gonzalo Montalva and Christian Ledezma by SOCHIGE (Sociedad Chilena
de Geotecnia) and their corresponding home universities. Professor Gabriel Candia was partly funded by
Universidad del Desarrollo and by the National Research Center for Integrated Natural Disaster
Management CONICYT/FONDAP/15110017 (CIGIDEN).
3
Executive Summary An intraslab subduction zone earthquake of moment magnitude 7.1 occurred on September 19, 2017
approximately 60 km southwest of Puebla, Mexico, and 120 km southeast of Mexico City, Mexico. The
earthquake occurred at a depth of 57 km as a normal faulting mechanism near the point of maximum
curvature of the Cocos plate, which is being subducted beneath the North American plate. The event was
recorded by over 80 strong ground motion instruments located in Mexico, and produced strong ground
motions that exceeded an intensity level VII in Mexico City and Puebla according to the Modified Mercalli
Index (MMI).
Immediately following the September 19 event, a joint geotechnical engineering reconnaissance effort
was organized between the Universidad Nacional Autónoma de México (UNAM) and the Geotechnical
Extreme Events Reconnaissance Association (GEER), which is sponsored by the U.S. National Science
Foundation (NSF). Two UNAM-GEER teams of researchers were sent to the region to investigate and
document the effects from the earthquake: an advance team (from September 24 to September 30) and
a main team (from September 29 to October 6). This Version 1 summary report presents the preliminary
observations from the UNAM-GEER advance team, which were used to inform and assist the UNAM-GEER
main team in its investigation. The forthcoming Version 2 of this report will contain the detailed
observations and recommendations from both the advance and main UNAM-GEER teams.
At the time of preparing this report, only a portion of the recorded ground motions were available to the
UNAM-GEER team and the public. However, available ground motion records that were recorded on soft
rock showed a much higher frequency content in this event than was recorded previously in the 1985
Michoacan earthquake that ravaged Mexico City. Based on the few ground motion records that the team
could study at the time of preparing this report, the rock ground motions appeared to resonate in
transition zone soils (Zone II) and lake zone soils (Zone IIIb) in the western half of Mexico City, causing
large horizontal spectral accelerations at periods between 0.8 seconds and 1.5 seconds and resulting in
significant damage to many structures between five to eight stories in height. As would be expected,
unreinforced masonry and adobe structures did not perform well in this earthquake, particularly when
approaching the epicentral region through the state of Morelos. Relatively little structural damage was
observed by the advance team in Puebla, but more was observed by the main team, which will be
described in the Version 2 report.
Observed foundation performance in areas of structural damage varied considerably. Despite the high
plasticity lacustrine clays that are predominant in Mexico City, numerous cases of seismic-induced
settlements ranging from 1 to 15 cm were observed in the free-field soils around end-bearing pile-
supported structures. Several cases of tilted structures (1 to 3 degrees) were observed. These structures
generally were supported on a combined friction pile and mat slab foundation system.
Beyond settlements, several other instances of ground deformation were observed by the UNAM-GEER
advance team. These deformations included cases of slope instability near the southern boundaries of
Mexico City in throughout the state of Morelos, as well as groundwater subsidence cracks near Xochimilco
and Colonia del Mar that were worsened and accelerated by the earthquake. These subsidence cracks
caused significant damage to structures and lifelines in the area.
The UNAM-GEER advance team observed relatively little damage to dams, bridges, and other lifelines
from the September 19 event.

4
Contents Acknowledgements ....................................................................................................................................... 2
Executive Summary ....................................................................................................................................... 3
Introduction .................................................................................................................................................. 5
Earthquakes and Mexico City........................................................................................................................ 7
Soil Conditions in Mexico City ................................................................................................................... 7
Significant Past Earthquakes and Corresponding Observations ............................................................. 14
Summary of the Observations Made by the UNAM-GEER Advance Team ................................................. 16
1. Recorded Ground Motions ................................................................................................................. 18
2. Site Response and Structural Damage ................................................................................................ 26
3. Performance of Building Foundations ................................................................................................ 33
4. Observed Ground Deformations ......................................................................................................... 37
5. Performance of Bridges ...................................................................................................................... 40
6. Performance of Dams ......................................................................................................................... 42
7. Observations of Slope Instability ........................................................................................................ 43
8. Observations at Sites of Social and Cultural Interest .......................................................................... 45
Summary ..................................................................................................................................................... 51
References .................................................................................................................................................. 52
Appendix: Recommended Sites for Additional Study ................................................................................. 54

5
Introduction An earthquake of moment magnitude (Mw) 7.1 (USGS) struck the central region of Mexico on September
19th of 2017 at 18:14:40 GMT (13:14:40 local time) (Figure 1). The epicenter was located at 18.40 north
latitude and -98.72 west longitude according to The National Seismological Service of Mexico (SSN) at a
depth of 57 km. The United States Geological Survey (USGS) located the epicenter at 18.5838N and
98.3993E at a depth of 51 km. This earthquake occurred in a complex region of normal and reverse faults
with a regional tectonic mechanism associated with the subduction of the Cocos plate under the North
American plate. The focal mechanism was normal faulting. The strike of the rupture plane was
approximately 112 degrees and dipped to the north or south at about 42 degrees. The epicenter was
located 12 km southeast of the city of Axochiapan in the state of Morelos. As expected, there was no
surface expression of the fault rupture reported by any of the reconnaissance teams dispatched to the
area.
Figure 1. Map of Mexico showing the epicenter and intensity contours of the September 19th 2017
event (USGS, 2017)
According to USGS (2017), the focal mechanism solutions indicate that the earthquake occurred on a
moderately dipping fault, striking either to the southeast, or to the northwest. Further, the USGS final

6
fault interpretation suggest that the rupture occurred right at the “elbow” of the Cocos plate, where it
turns sharply and is subducted beneath the North American plate, as depicted in Figure 2.
Figure 2. Cross section of the subducting Cocos plate and the overriding North American Plate, with the
approximate location of the September 19th fault rupture (modified from USGS, 2017)
This event was similar in nature to several large-magnitude (Mw>6.5) intermediate-depth (60-100 km)
events that have occurred in the central region of Mexico (e.g., Singh et al. 1999, Alcantara et al. 1999).
Particularly on September 7th, just twelve days before the event, an 8.2 Mw earthquake occurred in the
Tehuantepec Gulf at 133 km southeast of Pijijiapan in the Chiapas state. The epicenter was at 14.85 north
latitude and -94.11 west longitude at a depth of 58 km (SNN). This earthquake caused major damage in
houses in the states of Oaxaca and Chiapas. These states have a population of approximately four million
people. Several geotechnical problems like landslides, topographic effects, and site effects were observed
in these areas. Specifically, in Oaxaca 325 historical buildings suffered important damage according to the
National Institute of Anthropology and History (INAH).
Other recent earthquakes with a similar moment magnitude (Mw ~7.0) that occurred near the area were
the 1999 events of June 15 and June 21, with depths ranging from 60 to 90 km (Pestana et al., 1999) which
also affected the central region of Mexico. According to Servicio Sismológico Nacional, SSN, the focus for
the 15 June 1999 event was located at 18.40 north latitude and 97.45 west longitude at a depth of 71 km
and for the 21 June event, at 18.34 north latitude and 101.49 west longitude with a depth of 50 km.

7
The NSF-funded Geotechnical Extreme Events Reconnaissance (GEER) Association mobilized an advance
team to the Mexico City - Puebla area from September 24-30 2017, and a Main team from September 29
to October 6, 2017. Both teams (hereafter referred to as “the team”) worked closely with Mexican
research colleagues from the Universidad Nacional Autónoma de México (UNAM). In addition to these,
geotechnical engineers from Chile and Ecuador independently joined the reconnaissance effort and were
incorporated into the team. The objective of the UNAM-GEER team was to collect and document
perishable data that is essential to advance knowledge of earthquake effects, which ultimately leads to
improved procedures for characterization of seismic hazard and mitigation of seismic risk.
The UNAM-GEER team was comprised of geotechnical and structural engineering experts with experience
in a wide range of disciplines within the fields of geotechnical and structural earthquake engineering. For
the collection of data from this event, the team combined published information and lessons learned from
prior earthquakes in Mexico City with traditional field observations on the ground and state-of-the-art
geomatics and remote sensing technologies.
To better serve the technical community, emergency responders, and the public this brief report has been
prepared to communicate the preliminary activities, principal findings, and recommendations of the
UNAM-GEER advance team. A more complete presentation of the UNAM-GEER team activities and
findings will subsequently be developed and shared in a Version 2 report.
Earthquakes and Mexico City Mexico City presents an interesting but dangerous combination of high seismicity and challenging soil
conditions. Observations from previous earthquakes in Mexico City have led to many important lessons
learned regarding ground motion amplification and site effects, but at a tragically high cost. To establish
context for the observations made by the UNAM-GEER team from this event, a brief background regarding
soil conditions in Mexico City and significant past earthquake is provided here.
Soil Conditions in Mexico City Mexico City and its surroundings are located within an old basin that comprises the former Texcoco Lake
and the Xochimilco-Chalco Lakes. These lakes have largely disappeared due to both underground water
extraction and land reclamation for urban development (Figure 3). Thus, while the peripheral part of the
city is underlain by rock and hard soil deposits (layer of fractured lava overlying soft rock with a shear
wave velocity of 450 m/s to 600 m/s), the central part of the city is located on soft lacustrine clay deposits
of variable thickness (Seed et al., 1988). The former Texcoco Lake is located to the north of the city, and
is separated by a ridge of hills across the northern edge of the Xochimilco-Chalco Lake. Both of the lake
beds are now essentially filled with clay deposits, but the clays have different characteristics. The
Xochimilco-Chalco Lake clays are stiffer and stronger than the Texcoco Lake clays.
8
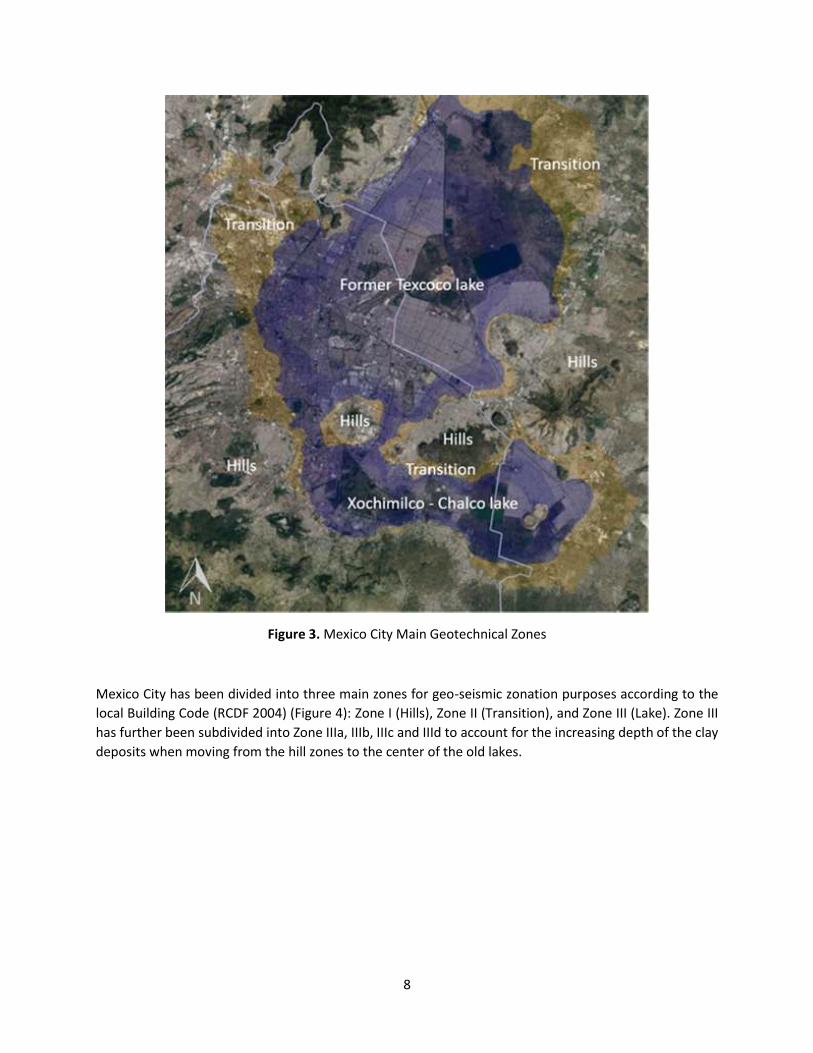
Figure 3. Mexico City Main Geotechnical Zones
Mexico City has been divided into three main zones for geo-seismic zonation purposes according to the
local Building Code (RCDF 2004) (Figure 4): Zone I (Hills), Zone II (Transition), and Zone III (Lake). Zone III
has further been subdivided into Zone IIIa, IIIb, IIIc and IIId to account for the increasing depth of the clay
deposits when moving from the hill zones to the center of the old lakes.
9
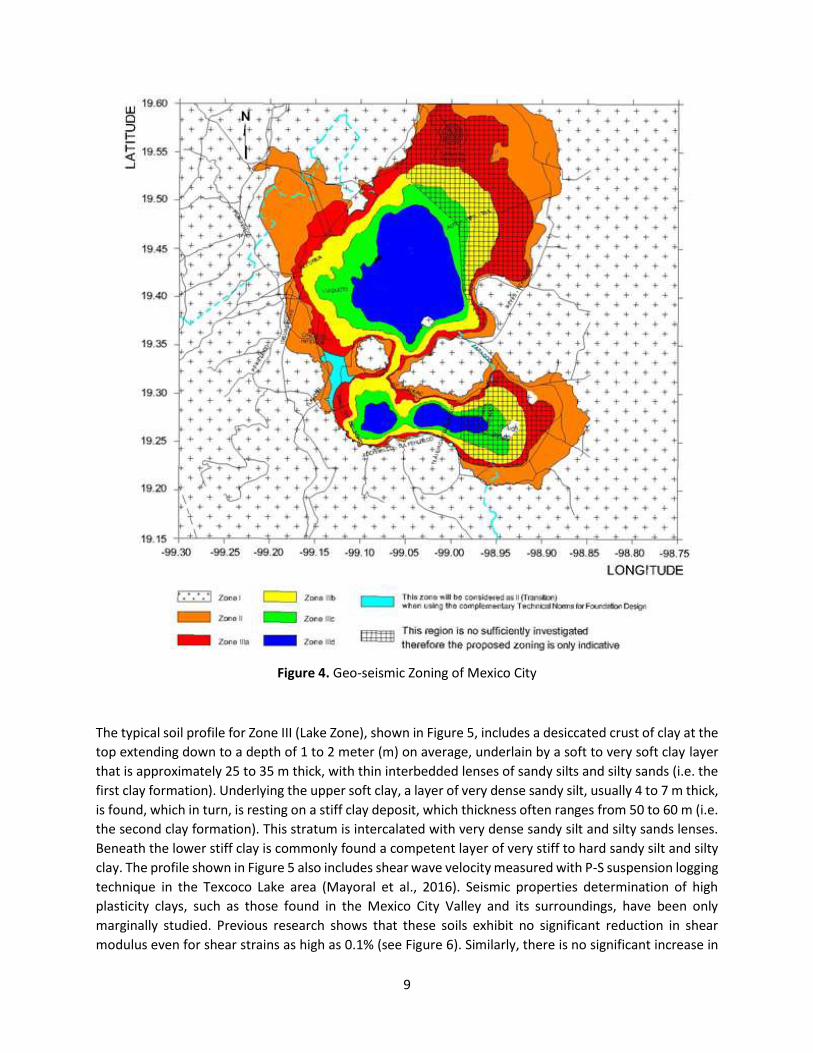
Figure 4. Geo-seismic Zoning of Mexico City
The typical soil profile for Zone III (Lake Zone), shown in Figure 5, includes a desiccated crust of clay at the
top extending down to a depth of 1 to 2 meter (m) on average, underlain by a soft to very soft clay layer
that is approximately 25 to 35 m thick, with thin interbedded lenses of sandy silts and silty sands (i.e. the
first clay formation). Underlying the upper soft clay, a layer of very dense sandy silt, usually 4 to 7 m thick,
is found, which in turn, is resting on a stiff clay deposit, which thickness often ranges from 50 to 60 m (i.e.
the second clay formation). This stratum is intercalated with very dense sandy silt and silty sands lenses.
Beneath the lower stiff clay is commonly found a competent layer of very stiff to hard sandy silt and silty
clay. The profile shown in Figure 5 also includes shear wave velocity measured with P-S suspension logging
technique in the Texcoco Lake area (Mayoral et al., 2016). Seismic properties determination of high
plasticity clays, such as those found in the Mexico City Valley and its surroundings, have been only
marginally studied. Previous research shows that these soils exhibit no significant reduction in shear
modulus even for shear strains as high as 0.1% (see Figure 6). Similarly, there is no significant increase in

10
the damping ratio until angular distortions of the order of 0.3% are reached (e.g., Romo et. al., 1988; Seed
et al., 1988; Mayoral et al., 2008; Mayoral et al., 2015).
Figure 5. Typical soil profiles for Zone III (Mayoral et al., 2016)

11
(a)
(b)
Figure 6. (a) Typical strain-dependent normalized shear modulus reduction and (b) typical strain-
dependent material damping curves for Texcoco clays (Mayoral et al., 2016)
12
The dynamic response of Mexico City clay deposits is nearly elastic even for shear strains as high as 0.3%,
which leads to a high potential of amplification of seismic waves. During the 1985 Mw 8.1 Michoacán
earthquake, recorded peak ground acceleration (PGA) on soft soils was on the order of five (5) times larger
than the corresponding PGA on rock outcrop, while the corresponding spectral acceleration ordinates for
5% structural damping of recorded ground acceleration at the surface ranged from about 0.4g to 1.0g at
periods of approximately 2.0 seconds (s) (e.g., Seed et al., 1988; Mayoral et al., 2008). The Lake Zone, due
to its unique clay properties, has been extensively studied since the 1985 event; among others, seminal
publications [Romo et al. 1988, Romo 1995, Mayoral et al. 2008]. Table 1 shows a summary of some typical
index properties of the Lake Zone soils, as summarized by Mayoral et al. (2016).
In Zone II soils (i.e., Transition Zone), soft clay deposits interbedded by series of thin silty sand and sandy
silt layers and lenses, which range in thickness from 0-20 m are underlain by stiffer soil deposits that are
comprised of sandy silts and silty sands with interbedded clay layers of varying thickness ranging from a
few tens of centimeters to meters. A typical soil profile and corresponding shear wave velocities from the
Transition Zone is presented in Figure 7.

13
Table 1. Soils characteristics and index properties of the Lake Zone soils (Mayoral et al., 2016)
Site Hole Sample
Water
Content
w (%)
Liquid
Limit
LL (%)
Plastic
Limit
PL (%)
Plasticity
Index
PI (%)
Specific
Gravity
Gs
Rigidity
index
IR
USCS
TXS1 SM-2 M-7 370 284 90 194 2.65 -0.44 CH
TXS1 SS-1 M-1 275 311 107 204 2.78 0.17 CH
TXS1 SS-1 M-2 303 360 71 288 2.82 0.2 CH
TXS1 SS-1 M-3 280 243 108 135 2.53 -0.27 CH
TXS1 SS-1 M-6 139 173 122 51 2.4 0.66 MH
TXS2 SM-1 M-7 308 302 75 226 2.7 -0.03 CH
TXS2 SM-1 M-15 399 326 125 201 2.51 -0.37 CH
TXS2 SM-1 M-40 280 310 81 229 2.82 0.13 CH
SOSA SM-1 M-1 331 368 159 210 2.45 0.18 CH
SOSA SM-1 M-9 311 306 156 150 2.74 -0.03 CH
TX-TP SS1-TP M2 264 287 153 135 2.58 0.17 CH
TX-TP SS1-TP M4 247 284 91 193 3.03 0.19 CH
TX-TP SS1-TP M7 118 182 59 122 2.71 0.52 CH
TX-TP SS4-TP 1A 106 113 53 60 2.65 0.12 MH
TX-TP SS4-TP 4A 247 271 75 195 3.24 0.12 CH
TX-TP SS6-TP M1 251 268 114 154 2.49 0.11 CH

14
Figure 7. Typical soil profile for the Transition Zone (after Mayoral et al., 2016)
In Zone I (i.e., the Hills Zone), the soil deposits are generally comprised of volcanic rock and/or stiff soil,
with occasional superficial or interbedded loose sand deposits and/or relatively soft cohesive materials.
In this zone, it is common to encounter undocumented and uncontrolled landfills, cavities in volcanic
rocks, and caves and underground excavations in the stiff soils due to past mining activities.
Significant Past Earthquakes and Corresponding Observations Over the years, Mexico City has suffered the effects of many earthquakes, including the devastating
September 19th, 1985 event. Although the epicenter of this Mw 8.1 event was more than 300 km from
Mexico City, along the Michoacán coast, it led to significant damage in Mexico City. Other important cities

15
near the coast and in central Mexico also suffered severe damage, but Mexico City was the most affected
due to its particular site conditions. One of the most interesting effects of this earthquake was the
enormous difference in shaking intensity and associated building damage in different parts of the city.
Similar patterns of building damage intensities have been observed in previous earthquakes, but these
differences were particularly accentuated during the 1985 event. Major structural damage from this event
was concentrated in the central and north-west part of the city in the Lake Zone (i.e., Zone III). In the
south-west part of the city, ground motions were moderately intense, and building damage was generally
minor. Interestingly, the majority of the structural damage from this 2017 event is concentrated in the
western and south-western part of the city. Figure 8 shows a map of building collapse locations from the
1985 event (plotted in green) and preliminary building collapse locations from the 2017 event (plotted in
red) in the central area of the city.
Seed et. al (1988) investigated the pattern of building damage from the 1985 event. Ground motions
recorded on rock and hard soil had peak ground accelerations (PGA) on the order of 0.04 g, peak spectral
accelerations (PSA) for 5% damping of about 0.11 g, and a predominant period of about 2.0 s. However,
ground motions recorded in soft clay deposits had a PGA of about 0.17 g and a PSA for 5% damping of
about 1.0 g at a period of about 2.0 s. Sites that might be considered very similar from an engineering
standpoint, but slightly different in soil conditions (i.e., depth and stiffness of the underlying soils),
exhibited significant differences in the observed spectral response of the ground surface motions. Thus,
the site response in areas of Mexico City underlain by lacustrine clay is extremely sensitive to small
changes in the clay shear wave velocity, clay thickness, and overall soil layering.

16
Figure 8. Collapsed buildings in the central region of Mexico City during the September, 19 1985 event
and the September 19, 2017 event (preliminary mapping, in blue, Google maps, 2017)
Summary of the Observations Made by the UNAM-GEER Advance Team Figure 9 presents the site vicinity of the Mexico City/Puebla/Morelos region, including the surface fault
rupture projection and the GPS tracks of the advance team members between September 24 and
September 30, 2017.

17
Figure 9. Site vicinity map of the Mexico City/Puebla/Morelos area including surface projection of the
Mw 7.1 fault rupture and the GPS tracks of the advance UNAM-GEER team
This initial (version 1) report will present the most important preliminary observations from the UNAM-
GEER advance team regarding the following:
1. Recorded Ground Motions
2. Site Response
3. Performance of Foundations and Structures
4. Observed Ground Deformations
5. Performance of Bridges
6. Performance of Dams
7. Observations of Slope Instability
8. Observations at Sites of Social and Cultural Interest
More detailed observations regarding these and additional topics will be provided in Version 2 of this
report.

18
1. Recorded Ground Motions Various organizations were operating and maintaining ground motion recording instruments at the time
of the September 19th event. Among others, Centro de Instrumentación y Registro Sísmico (CIRES) was
operating 53 strong motion stations at the time of the event, Red Acelerográfica de Movimientos Fuertes
del Instituto de Ingeniería (IINGEN) at UNAM was operating 18 stations, and the Servicio Sismológico
Nacional (SSN) del Instituto de Geofísica (IGEOF) of UNAM was operating 10 stations. However, not all of
the CIRES, IINGEN, and IGEOF stations were working properly during the time of the earthquake. The
locations of the IINGEN and IGEOF stations are presented in Figure 10.
Figure 10. Locations of IINGEN (triangles) and IGEOF (squares) ground motion stations relative to the
Mw 7.1 epicenter (modified from IINGEN 2017)

19
At the time of preparing this report, 25 of the IINGEN and IGEOF ground motion records and 49 of the
CIRES ground motion records were made available to the UNAM-GEER team. A preliminary report
prepared by UNAM (IINGEN, 2017) provided peak ground acceleration (PGA, g) for the 18 stations
operated by UNAM. Figure 11 shows the seismological stations locations along with the corresponding
seismic zonation, and Figures 12 and 13 present the response spectra of the measured free-field response
in the Hill and Lake Zones, respectively. The only station operated by II-UNAM, located in the Transition
Zone (LEAC), was placed within a structure, therefore will not be presented here because the record is not
representative of a free-field response. Neither will be presented the PISU strong ground motion station,
which is located near Impulsora Bridge.
Figure 11. Seismological station location overlaid with Mexico City geo-seismic zoning

20
(a)
(b)
Figure 12. Acceleration response spectra (5% damped) of ground response measured at Hill Zone I:
(a) TACY seismological station and (b) CUP5 station for the three earthquake components

21
(a)
(b)
Figure 13. Seismic site response in Lake Zone IIIb at: (a) CCCL seismological station, and at (b) PCJR
seismological station for the Sep 19, 2017 Event
Tables 2 and 3 present the peak ground accelerations, velocities and displacements recorded at the
seismological stations operated by the Institute of Engineering at UNAM and CIRES, respectively.
0
0.1
0.2
0.3
0.4
0.5
0.6
0.7
0.8
0.01 0.1 1
VN90EN00E
Spe
ctr
al accele
ration,
Sa(g
)
Period, T(s)
5

22
Table 2. Peak ground accelerations in the east-west and north-south directions at select stations
operated by the Institute of Engineering, at UNAM
Station Zone Coordinates PGA (g)
NTC04 Latitude N Longitude W EW NS
CCCL IIIb 19.4498 99.137 0.07 0.09
CUP5 I 19.3302 99.1811 0.06 0.05
PCJR IIIb 19.4228 99.1591 0.1 0.1
SCT IIIb 19.3947 99.1487 0.09 0.09
TACY I 19.4045 99.1952 0.06 0.06
Table 3. Peak ground accelerations in the east-west and north-south directions at select stations
operated by CIRES
Station Zone Coordinates PGA (g)
NTC04 Latitude N Longitude W EW NS
AL01 IIIb 19.4356 99.1453 0.11 0.12
AO24 II 19.358 99.1539 0.12 0.11
AU46 II 19.3832 99.1681 0.1 0.08
BA49 IIIb 19.4097 99.145 0.12 0.09
BL45 IIIb 19.4253 99.1481 0.12 0.1
CH84 II 19.33 99.1254 0.23 0.15
CI05 IIIb 19.4186 99.1653 0.12 0.11
CJ03 IIIb 19.4097 99.1567 0.1 0.11
CO47 II 19.3714 99.1703 0.1 0.07
CO56 IIIb 19.4215 99.159 0.12 0.11
DX37 II 19.3322 99.1439 0.12 0.19

23
Table 3. Peak ground accelerations in the east-west and north-south directions at select stations
operated by CIRES (continued)
Station Zone Coordinates PGA (g)
NTC04 Latitude N Longitude W EW NS
EO30 II 19.3885 99.1772 0.08 0.07
FJ74 I 19.299 99.21 0.09 0.09
GA62 IIIb 19.4385 99.1401 0.09 0.1
GC38 IIIb 19.3161 99.1059 0.12 0.13
HJ72 IIIc 19.4251 99.1301 0.1 0.09
JC54 II 19.313 99.1272 0.21 0.22
LI33 IIIa 19.3064 98.9631 0.11 0.14
LI58 IIIb 19.4263 99.1569 0.09 0.1
MI15 IIIa 19.2834 99.1253 0.14 0.21
MY19 IIIc 19.3461 99.0433 0.11 0.12
RM48 IIIb 19.4359 99.128 0.08 0.06
SI53 IIIa 19.3753 99.1483 0.18 0.13
TH35 IIIc 19.2786 99 0.19 0.19
TL08 IIIb 19.45 99.1336 0.08 0.08
TL55 IIIb 19.4536 99.1425 0.07 0.08
TP13 I 19.2922 99.1708 0.07 0.06
UC44 IIIb 19.4337 99.1654 0.13 0.13
UI21 I 19.37 99.2642 0.08 0.08
XP06 IIIc 19.4198 99.1353 0.11 0.08
Figures 14 and 15 present PGA Shakemaps based on the recorded UNAM data (IINGEN, 2017). More
detailed observations regarding ground motions recorded from the September 19 Mw 7.1 event will be
provided in Version 2 of this report.

24
Figure 14. Regional PGA (cm/sec2) map from the September 19 Mw 7.1 event (after IINGEN 2017)

25
Figure 15. PGA (cm/sec2) map of Mexico City from the September 19 Mw 7.1 event (after IINGEN 2017)

26
2. Site Response and Structural Damage During the September 19th 2017 earthquake, most of the major structural damage in Mexico City was
located in the west and southwest Transition (Zone II) and Lake zones, IIIa, and IIIb, as depicted in Figure
16. These zones exhibit 1D predominant periods ranging from 0.8 to 1.5 s according to the map by Arroyo
et al. (2013), which accounts for the changes in predominant periods due to regional subsidence effects
(Figure 17). This map is slightly different from that included in the Mexico City Seismic Design Code, NTCs.
The UNAM-GEER team conducted H/V test at selected locations in the City. These 1D site response periods
are expected to be slightly smaller than those reported in 2013, due to its continuous evolution over time.
Figure 16 demonstrates that a majority of the notable structural damage is located within a 7 km by 20
km area adjacent to the boundary between Lake Zone (Zone III) sediments (in blue) and stiffer Transition
Zone (Zone II) sediments (in yellow) on the western side of the city. The green boundaries in Figure 16
represent stiff/dense Hill Zone (Zone III) sediments and volcanic rocks. Based on the mapped damages
and the field observations from the UNAM-GEER team, the neighborhoods of Mexico City that were most
severely impacted by site response and structural damage/collapse from the September 19th event
appeared to be Cuauhtemoc, Juarez, La Condesa, Roma, Hipodromo, Hipodromo Condesa, Roma Sur,
Roma, Col del Valle NTE, Narvarte Poniente, and Col del Valle Centro.
Interestingly, Figure 12 in the previous section presents the surface ground motion response spectra
measured during the September 19th, 1985 and the September 19th, 2017 earthquakes in firm Hill Zone
soil. As can be noticed from comparing these spectra, the peak spectral response from the 2017 event for
the horizontal components ranges from 0.23 to 0.27 g, and the predominant period varies from about
0.22 to 0.24 s. However, there remains a substantial amount of energy concentrated within periods
ranging from 0.6 to 1.1 s, which led to ground motion amplification in the affected Transition and Lake
Zone areas. Table 4 shows the corresponding predominant periods and amplification factors between a
soft rock site (i.e. CUP5 seismological station), and the rest of the stations. This data shows that the
maximum amplification factor occurs at the stations located within the Lake Zone IIIb.

27
Figure 16. Mapped structural damage and collapse (Google Maps, 2017) combined with mapped soil
zones for Mexico City. Green is stiff Zone I (Hill Zone), yellow is Zone II (Transition Zone), and blue is soft
Zone III (Lake Zone). Red points indicate structural collapse, yellow and orange points indicate moderate
and minor structural damage, respectively.

28
Figure 17. Map of predominant periods proposed by Arroyo et al. (2013) as a modification to the NTC

29
Table 4. Amplification ratios at seismological stations operated by II-UNAM
Zone Station
Component
RCDF-04 Vertical N-S E-W
I CUP5 1.00 1.00 1.00
I TACY 1.02 1.06 1.06
IIIb CCCL 1.21 1.55 1.25
IIIb SCT2 1.23 1.63 1.56
IIIb PCJR 1.57 1.71 1.68
The amplification of the earthquake ground motion at select periods in the lacustrine deposits below
certain parts of Mexico City predominantly affected structures with similar natural frequencies. Table 5
shows the number of buildings severely damaged in each of the geo-seismic zones. The periods reported
by Arroyo et al. (2013) in La Condesa and Roma Sur were verified in situ by the UNAM-GEER team at
several locations (Figure 18 and Table 6). H/V ratios measured by the team in the east-west direction
across La Condesa, Hipodromo, and Roma Sur using passive geophysical sensors indicate site periods
generally ranging from about 0.73 s (in La Condesa) to 1.25 s (in Roma Sur) (Table 6). Site periods therefore
increased as the Lake Zone sediments were approached going from west to east. Buildings that collapsed
or that were heavily damaged in these areas generally ranged from about 5 to 8 stories in height (i.e. stiff
buildings with periods of T ≅ 0.1N ≅ 0.5 → 0.8 sec; or more flexible buildings T ≅ 0.2N ≅ 1.0 → 1.6 sec). It
must be noted, however, that the observed distribution of structural damage in Mexico City from the
September 19th event cannot solely be attributed to 1-D site response. Other important factors such as
age of the structure, structural design and symmetry, accrued and unrepaired damage from prior
earthquake events, as well as quality of construction certainly contributed to the structural performance
observed by the UNAM-GEER team; while the inhomogeneous concentration of damage in the west-
southwest sections of the transition zone could be also suggestive of more complex, three-dimensional
site effects such as basin edge focusing.

30
Table 5. Number of severely damaged building cases reported in each geo-seismic zone (Google Maps,
2017)
Zone Number of
buildings
I 13
II 35
IIIa 45
IIIb 49
IIIc 5
IIId None

31
Figure 18. Layout of ambient noise measurements taken by the UNAM-GEER advance team (Test date:
September 26 and 28, 2017).

32
Table 6. Data sheet of micro-vibration measurements, with GPS locations and fundamental periods
Point Latitude Longitude Fundamental Frequency (Hz) Fundamental Period (s)
F01 19.412576° -99.183767° 1.37 0.73
F02 19.411324° -99.179979° 1.15 0.87
F03 19.411359° -99.178563° 1.14 0.88
F04 19.411388° -99.177896° 1.13 0.88
F05 19.411389° -99.177505° 1.07 0.93
F06 19.411391° -99.176875° 1.05 0.95
F07 19.411408° -99.175824° 1.10 0.91
F08 19.411432° -99.175251° 1.00 1.00
F09 19.411445° -99.174821° 0.99 1.01
F10 19.411449° -99.174411° 1.11 0.90
F11 19.411457° -99.172319° 0.84 1.19
F12 19.411468° -99.171637° 0.86 1.16
F13 19.412673° -99.170838° 0.86 1.16
F14 19.411486° -99.170505° 0.86 1.16
F15 19.411314° -99.169838° 0.90 1.11
F16 19.410172° -99.166193° 0.80 1.25
F17 19.410897° -99.164459° 0.82 1.22
F18 19.411118° -99.163356° 0.83 1.21
As would be expected, unreinforced masonry and adobe construction in many of the towns throughout
the state of Morelos suffered heavy damage. Numerous towns, particularly Jojutla and Tlaquiltenango,
experienced a large number of collapses of these types of structures. Somewhat surprisingly, little
significant structural damage was observed in the city of Puebla by the UNAM-GEER advance team.
However, a more thorough investigation was performed by the main UNAM-GEER team in Puebla, and
more structural damage was observed that will be documented in the Version 2 report.

33
3. Performance of Building Foundations In general, the UNAM-GEER team observed three types of structural foundations commonly used in the
affected areas of Mexico City: (1) end-bearing piles, (2) friction piles combined with mat foundations, and
(3) shallow or excavated mat foundations with floating superstructure. The end-bearing pile foundations
that were observed were either permanent and fixed (e.g. Figure 19), or incorporated adjustable controls
(termed “control pile”, e.g. Figure 20) to mechanically lower the superstructure incrementally in an effort
to level the structure with the ground surface, which is settling at an average rate of 10 cm per year due
to groundwater extraction from beneath the city.
Figure 19. An end-bearing pile structure built in 1966 that experienced approximately 3 cm of
settlement in the soil surrounding the structure; otherwise, the structural components of the building
were generally undamaged. Note that the building entrance used to be level with the sidewalk, but is
now 1.25 meters above the sidewalk elevation, due primarily to pre-event settlement (GPS: 19.4146,
-99.1705)

34
Figure 20. End-bearing control piles supporting the La Plaza Condesa building (19.4132, -99.1721)
Performance of the different types of foundations was observed to be the worst in the affected western
portions of Mexico City in the Transition Zone II soils and Lake Zone IIIb soils. End-bearing piles generally
performed well, with occasional settlements ranging from 3 to 8 cm in the ground or hardscape
surrounding the structure, as shown in Figure 19 (as shown on the stairs) and in Figure 21. The only tilt
that was observed by the GEER advance team in an end-bearing pile structure was at the La Plaza Condesa
(19.4129, -99.1722; see Figure 22), which is supported by controlled piles. While up to 1 degree of tilt was
measured on the north side of the building, the team was not able to determine whether this tilt is due
to the earthquake or to uneven maintenance/adjustments of the controlled pile foundations.

35
Figure 21. Settlement of approximately 15 cm in the soil surrounding an end-bearing pile-supported
structure (19.4146, -99.1684)
Figure 22. The 12-story La Condesa building (19.4129, -99.1722), which was tilting approximately 1
degree to the north

36
Many structures founded on friction piles with mat foundations did not perform well in the earthquake.
While little to no differential settlement between the structure and the surrounding soil was generally
apparent because the structure tended to settle over time with the surrounding ground, there were
observed cases of permanent structural tilt following the earthquake, as shown in Figure 23. This damage
likely occurred as the rocking structure with its corresponding friction piles weakened the underlying
lacustrine clays sufficiently to induce cyclic softening and reduced shear strengths beneath the structure
and along the friction piles. As a result, piles on one side of the building were uplifted, and the mat
foundation on the opposite side of the structure caused shear-induced deformation and bearing capacity
failure in the underlying clay. While is it certainly possible that many of the damage that affected areas of
Mexico City were caused by structural deformations following the 1985 and 2017 earthquakes, many of
the tilted buildings that the UNAM-GEER advance team inspected in La Condesa showed no signs of
structural distress (e.g., cracking, exposed rebar, spalling, etc.). The advance team did not address
whether the observed damage was due to the 1985 or 2017 earthquakes; however, future efforts should
do so to refine the observations that were gathered.
Figure 23. Permanent tilt of approximately 2 degrees in the friction pile-supported structure on the left;
the structure on the right is vertical (19.4118, -99.1711)

37
Relatively few structures in the affected areas of western Mexico City appeared to be constructed on
shallow mat foundations. Those that were confirmed as such were usually more than 70 years old and
less than two stories in height. Among these structures and their foundations, the ones that were
inspected by the advance team performed relatively well
4. Observed Ground Deformations The advance team reconnaissance revealed few incidences of co-seismic ground deformation, most likely
due to highly plastic lacustrine clays that are abundant in Mexico City. This observation does not include
slope instabilities and landslides, which will be summarized in Section 7 below. As described in Section 3
above, the UNAM-GEER observed several occurrence of settlements on the order of 1 to 15 cm in the
lacustrine clays of Mexico City. These settlements became apparent when the soil surrounding end-
bearing pile-supported structures settled relative to the fixed structure, as demonstrated in Figure 24.
Figure 24. Settlement of the ground surrounding a pile-supported structure in La Condesa (19.4126, -
99.1719)
Extensive ground deformation was observed by the UNAM-GEER team in the vicinity of Colonia del Mar,
Tlahuac, near the southern rim of Mexico City. A series of cracks and trench-like depressions were
observed throughout the neighborhood that rendered settlements as large as 50 cm, with widths ranging
from 15 meters to 25 meters across. These bands of settlement extended over several city blocks, passing
beneath structures and causing damage to several pipelines. Figure 25 shows a band of settlement passing
38
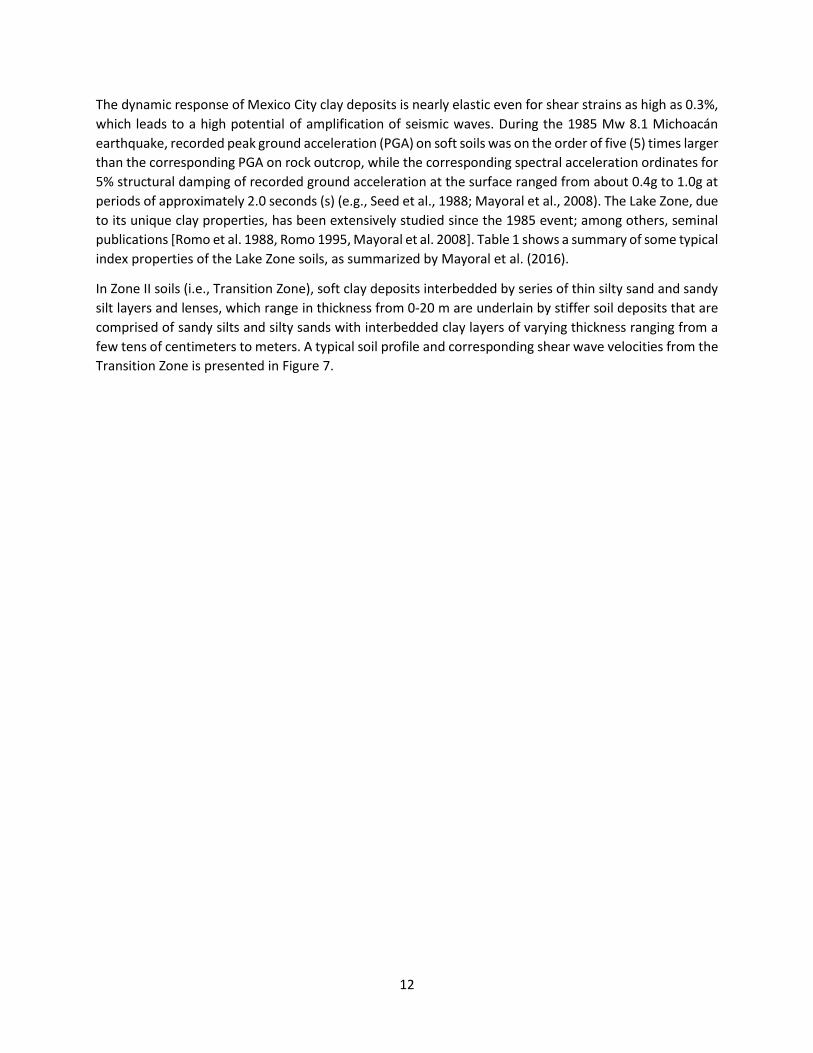
beneath residences, causing many of the structures to tilt. The UNAM-GEER team originally postulated
that these bands of settlement may have been caused by buried alluvial stream deposits with varying
thickness that may have settled or moved laterally during the earthquake. However, subsequent
investigation by team members revealed that numerous cracks from settlement-induced subsidence had
been previously mapped throughout that portion of the city (CENEPRED, 2017). The mapped location of
the cracks (Figure 26) corresponded well with our observed cracks in Colonia del Mar. While it is clear that
the earthquake likely initiated additional settlement and lateral displacement along existing cracks,
preliminary assessment suggests that new cracks may have developed. This assessment is currently being
refined, and new findings will be reported in Version 2 of this report.
Figure 25. Images of ground cracking from subsidence in Colonia del Mar at: (top) 19.2839, -99.0571,
and (bottom) 19.2846, -99.0578

39
Figure 26. Mapped groundwater subsidence cracks in the Colonia del Mar neighborhood in Tlahuac
(after CENAPRED, 2017)

40
5. Performance of Bridges More than 70% of the bridges in Mexico were constructed before 1970 without any seismic design (Landa-
Ruiz, 2008). Moreover, no bridge retrofit program has occurred since then to address this vulnerability. In
contrast, most new bridges are designed using the American Association of State Highway and
Transportation Officials (AASHTO) Bridge Design Specifications (BDS), which includes some seismic design
criteria. However, they also have to comply with local codes such as the Normas Técnicas
Complementarias para Diseño por Sismo (Complementary Technical Standards for Earthquake Design)
(NTS), which is part of the Mexico City Building Code or with the CFE (Civil Engineering) Seismic Design
Manual.
Bridges performed very well during the September 19th 2017 earthquake. Only a few cases of damage
and collapse were reported. No extensive information is available about the bridge’s shear and
displacement capacities, and only a few cases of damage associated with seat displacement were
observed (e.g., Metro Viaduct in CDMX). Many bridges with short superstructure seats were identified,
yet no movement during the earthquake (Figure 27 and 28) was observed. Photographs of bridges at sites
investigated by the UNAM-GEER team and by Prof. Eduardo Miranda are shown below.
Figure 27. Left: Two span Pedestrian OC across 95D in Coajomulco (19.0323, -99.2057), Right: 3 Span OC
across 438D in Santiago Atzitz Huacan (18.8268, -98.6038).
Figure 28. Two bridges in Cuautla, assessed on September 27th 2017, no visible sign of damage across
both structures, left: Carlos Pacheco Bridge (18.8091, -98.9490), right: Solidaridad Bridge (18.8106,
-98.9473).

41
Despite the overall good bridge performance that was observed, some bridge damage and even bridge collapse did occur. A pedestrian overcrossing in Mexico City collapsed during the earthquake, unfortunately falling onto a taxi (Figure 29). In the town of Puente de Ixtla the GEER team drove past a collapsed bridge (18.6122, 99.3182), but were unable to stop. The main UNAM-GEER team was able to collect more information regarding this bridge, which will be presented in the Version 2 report.
Figure 29. Left: Collapsed POC across Blvd. Adolfo Ruiz Cortines (19.2913, -99.1105), Right: POC (taken
from Google Earth) shown before the earthquake (19.2913, -99.1105).
Other bridges like the Metro Viaduct (see Appendix) were damaged but did not collapse due to the light
shaking. Collaborator Prof. Miranda of Stanford shared some photos of the Circuito Interior Avenida Rio
Churubusco (19.3696, -99.12248) in Mexico City. These parallel box girder viaducts on pier walls rocked
during the earthquake (the pier walls were too stiff to bend) and a masonry abutment was damaged
(Figure 30). More information regarding this and other bridge inspections conducted by the UNAM-GEER
Main team will be included in Version 2.
Figure 30. Damage to the Circuito Interior Avenida Rio Churubusco (19.2913, -99.1105).

42
6. Performance of Dams No damage was reported at dams in the Puebla-Mexico City vicinity following the September 19th 2017
earthquake. A dam, located in the epicentral region, was visited for potential damage observations. The
Manuel Ávila Camacho (Valsequillo) Dam, built in 1946, is located at 18.9123 N -98.1084 W (see Figure
31) and is a 3,900 m long and 23 m high rockfill dam. The dam has created the largest reservoir in the
State of Puebla (with a surface area of 740,000 acres). The dam site is located approximately 49 km
northeast from the epicenter. The dam site was visited on September 28th, and was at full capacity with
excess water running through the spillway during the visit. The crest and both upstream and downstream
slopes of the dam did not show any signs of distress or longitudinal or transverse cracks, as shown in
Figure 32. No permanent displacements or deformations were observed either. At the toe of the
downstream slope no cracks or impounded water were noticed. The spillway structure did not show any
apparent damage and was properly working releasing water during the visit. It seems that during the
earthquake the dam was also at full capacity. Overall the seismic performance of the dam was satisfactory.
Figure 31. Location of the Valsequillo Dam with respect to Epicenter, Puebla and Mexico City

43
Figure 32. Downstream side of the Valsequillo Dam (18.9123, -98.1084)
7. Observations of Slope Instability Relatively moderate slope stability problems were observed within the city boundaries of Mexico City.
The UNAM-GEER advance team investigated one site located near Xochimilco and several more outside
Mexico City. The Xochimilco slope instability (Figure 33) was of concern as ongoing deformation due to
groundwater pumping and increasing ground earthquake-induced deformation indicated concurrent slide
movement. The site is fully inhabited with residential construction. In addition, the district’s water
pumping station is located at the bottom of the slope.
More frequent slope instability cases were observed in the rural regions of the state of Morelos.
Noticeable case studies include the Tlayacapan rockslide, the Totolapan landslide, the Atlatlahucan
landslide series, and the Lake Tequesquitengo bank failure (Figure 34). Locations and details regarding
each of these are provided in the Appendix. Some of the slope instabilities were expected given previous
movements and slide activities at the respective location. Ongoing rain storms in the region during the
visit made both the Totolapan and Atlatlahucan landslides of further interest given preliminary
observations of additional extension cracks at the top plateau of each slide. Both landslides appear to
consist of clayey and residual soils and volcanic deposits. The Atllatlahucan and Totolapan site seemed to
be an old quarry with occasional mining activity according to google earth imagery. Limited slope
instabilities were reported near the epicenter (e.g., Mount La Malinche slide), which caused no visible
damage.

44
Figure 33. Photo of unstable hill site Xochimilco, red lines indicated documented cracking
Figure 34. Totolapan debris slide in old quarry (top left; 18.9816, -98.9246), Tlayacapan debris (rock)
flow (top right; 18.9486, -98.9837), and Atlatlahucan landslide region (18.9378, -98.8784)

45
8. Observations at Sites of Social and Cultural Interest Significant damage was observed in historic church buildings throughout the entire regions visited by the
UNAM-GEER team. Many churches lost bell towers, showed cracked facades, severe interior damage, roof
(and/or dome) collapse and were closed for further inspection. World Heritage buildings, such as the
Cuernavaca Cathedral in the state of Morelos, suffered moderate structural damage, while other churches
in the southern region of Morelos suffered significant damage and will require significant repair or
demolition. Municipal buildings with similar architectural features (e.g. free-standing facades with towers,
etc.) showed similar damage patterns. Many historical buildings were adobe construction, with limited to
no reinforcing elements. Figures 35 through 38 show several examples of damage to churches and
municipal buildings observed by the team.
Figure 35. Severe damage at the historical municipality building in Tlayacapan, a 2 story unreinforced
masonry building (18.9565, -98.9832)
Figure 36. Damage at the historical Tlayacapan Church (complete closure) (18.9561, -98.9821)

46
Figure 37. Left: Collapsed Church tower in Cuautla (18.8125, -98.9542), right: Crack on bell tower of
church in Juitepec (19.0285, -99.2675)
Figure 38. Left: Severe cracking of the Tlaquiltenango church (18.6296; -99.1607), Right: damage to
municipality building and entire historic downtown district of Cuautla (18.8122, -98.9553)
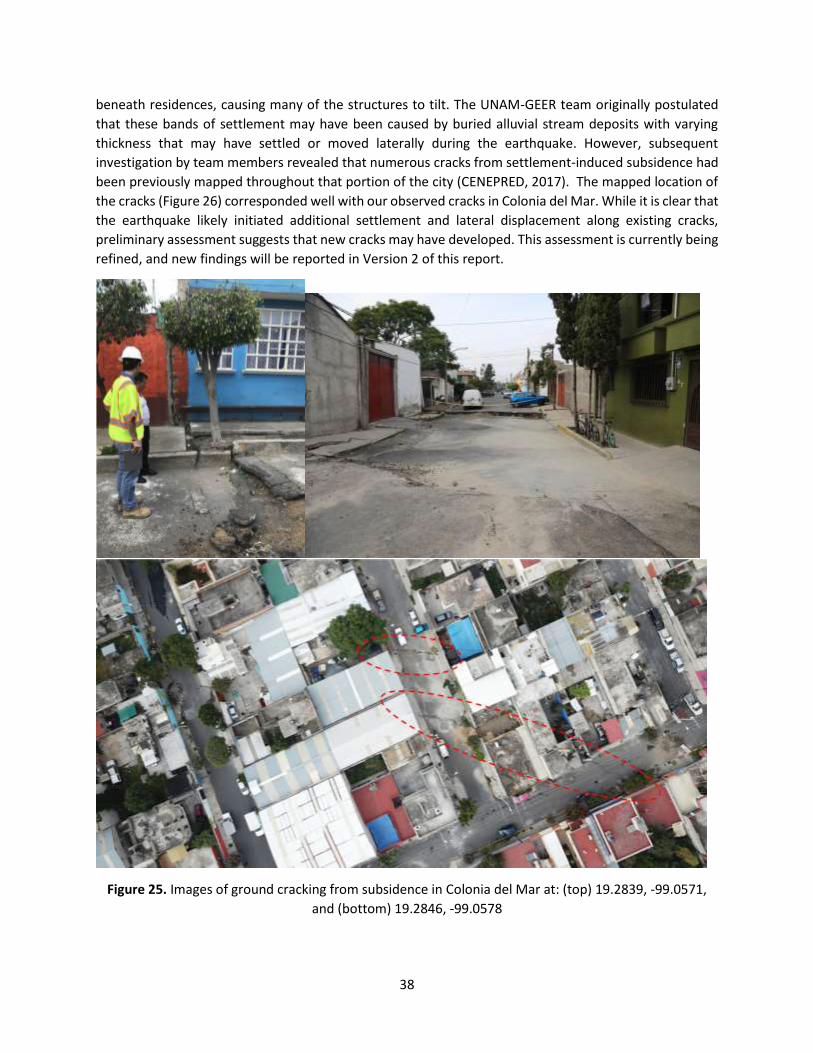
Investigation of the culturally important historical structures in the historical portion of Mexico City
revealed little to no damage from the 2017 event. Google Maps (2017) identified damaged historical
structures were all unreinforced masonry structures such as that shown in Figure 39, many of which had
allegedly remained abandoned since the 1985 earthquake. While many of the historical masonry
structures in this part of Mexico City showed significant tilting and evidence of differential settlement, as
is presented in Figure 40, local residents and employees confirmed that the structures were already in
that condition prior to the earthquake.
47
Figure 39. Unreinforced masonry structure that collapsed from the 2017 event in the historical district
of Mexico City (19.4388, -99.1413), and San Gregorio Church with collapsed bell tower (19.2535, -
99.0568)
Figure 40. Common example of the type of structural tilting that is prevalent in the historic district in
Mexico City; local residents confirm that these structures were already tilting prior to the 2017 event
48
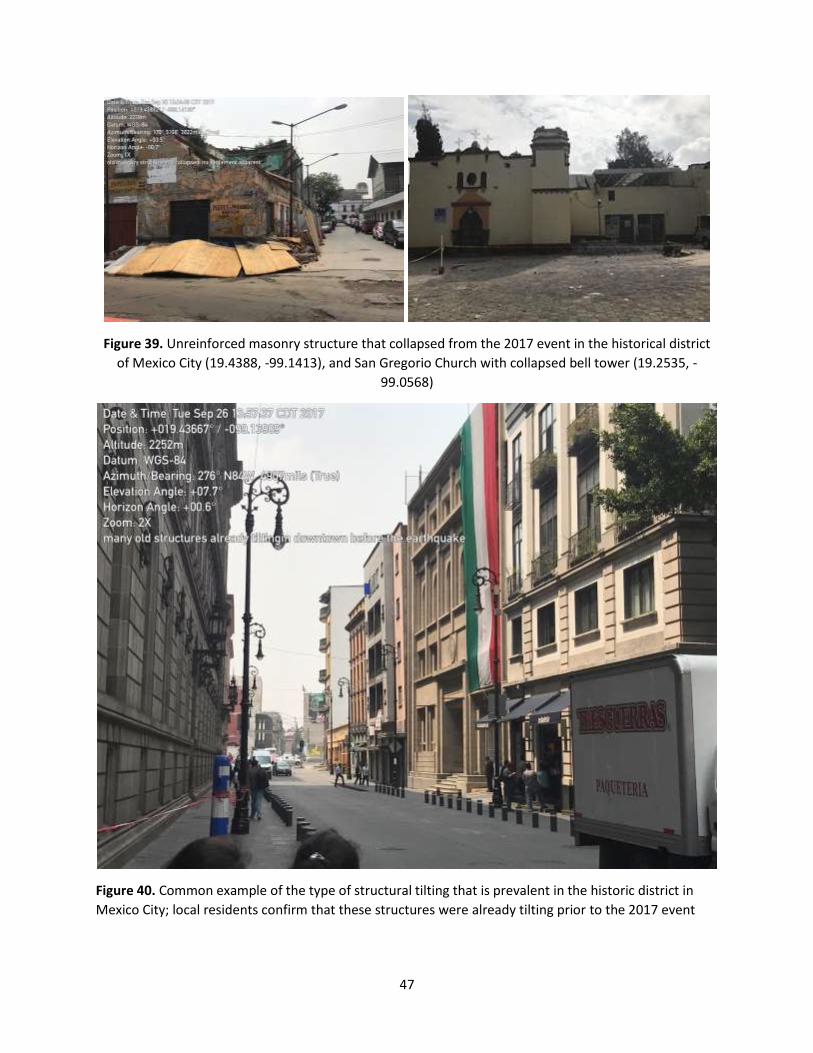
The UNAM-GEER advance team was specifically requested to investigate the performance of the New
Aeropuerto Internacional de Ciudad de México (NAICM) construction site. This multi-billion dollar project
is located in the northeastern portion of Mexico City on top of very soft and deep Texcoco Lake clays.
Figure 41 shows an approximate site vicinity map of the NAICM site and its relative location to Mexico
City.
At the time of the UNAM-GEER team site visit at NAICM, the reinforced concrete slab for the main terminal
was being constructed (Figure 42). The slab consists of 1.6 meter thick concrete heavily reinforced with
#12 high strength steel rebar. The slab had already settled 8 cm at its center, causing it to pond water
from the rain the night before the team visit (see the visible water on the slab in Figure 42). The slab is
connected by reinforced grade beams to various driven friction piles across the site. We observed that
many of the piles located around the perimeter of the site were bent out of plum, as shown in Figure 43.
The site foreman informed us that these piles were out already tilted before the earthquake, but the
earthquake made them worse.
Figure 41. Site vicinity map showing the approximate location of the NAICM airport project in white

49
Figure 42. UAV image of the NAICM terminal construction site at the time of the UNAM-GEER team site
visit (19.5052, -98.9967)
Figure 43. Tilted driven pile near the perimeter of the excavation for the NAICM terminal construction

50
Flights with the UAV around the perimeter of the 5 m deep excavation showed numerous small tension
cracks forming in places. Many of these cracks had apparently been in place before the September 19th
2017 earthquake, but the earthquake widened existing cracks and also precipitated new cracks. An
example of these observed cracks are shown in Figure 44.
Figure 44. Tension crack observed in the NAICM excavation from a UAV flown at an altitude of 50
meters; driven pile is visible towards the left of the image (19.5050, -98.9957)
The final part of the NAICM construction project that was visited by the UNAM-GEER advance team was
the construction site for the new control tower. At the time of the team visit, the foundation was under
construction, and no superstructure was yet in place. The foundation design consisted of friction piles
combined with a parabolic reinforced mat foundation. The system will eventually support the base-
isolated control tower for the NAICM. An aerial image of the control foundation tower being constructed
is presented in Figure 45.

51
Figure 45. UAV image of the construction of the new control tower foundation at NAICM (19.5223,
-98.9971)
Summary The September 19th, 2017 Mw 7.1 intraslab subduction zone earthquake that impacted the regions of
Mexico City, Puebla, and Morelos caused significant damage to many structures between 5 and 8 stories
in height and collapse of over 40 buildings. Unfortunately, it resulted in the loss of more than 350 lives
and significantly affected three states. Most of the damage to modern infrastructure is concentrated near
the mapped boundary of the Transition Zone sediments (Zone II) and the Lake Zone sediments (Zone IIIb)
along the western portion of Mexico City. Ground motions appeared to be amplified between periods of
1 and 2 seconds based on ground motion recordings near the Transition Zone boundary. Settlements of 1
to 15 cm were observed in the clayey soils surrounding many deep-founded structures. With a few
exceptions, little damage was observed within the bridge infrastructure, though some individual cases of
damage ranging from slight to collapse were observed by the UNAM-GEER team. No significant damage
of dams was observed by the UNAM-GEER team. Several instances of slope instability were observed near
the southern rim of Mexico City and to the south in the state of Morelos.
This report is intended to provide a concise and brief summary of the observations, findings, and
recommendations of the UNAM-GEER advance team. More detailed information will be presented in the
Version 2 report that is forthcoming.

52
References Alcántara, L., Gonzalez-Pomposo, G., Posada-Sanchez, E., Torres, M., Vazquez, R., Macias, M., Aguilar, A.,
Jimenez, J., Perez, C., and Sandoval, H., (1999). El Temblor de Tehuacán, Puebla, del 15 de Junio
de 1999 (M56.7) registrado por la red de acelerografos de la ciudad de Puebla (RACP) UNAM
internal report, RACP-II/BUAP-04 Engineering Institute, UNAM.
Arroyo D., Ordaz M., Ovando-Shelley E.,Guasch J., Lermo J., Perez C., Alcantara L., Ramírez-Centeno M.
(2013). Evaluation of the change in dominant periods in the lake-bed zone of Mexico City
produced by ground subsidence through the use of site amplification factors. Soil Dynamics and
Earthquake Engineering, Elsevier, 44, 54-66.
CENEPRED, (2017). National Risk Atlas (in Spanish). Available at
http://www.atlasnacionalderiesgos.gob.mx/. Last accessed on October 7, 2017.
Google Maps, (2017). Mapeo Colaborativo 19s (Datos Necesitan Verificar), Google Maps. Retrieved from
https://www.google.com/maps/d/u/0/viewer?mid=1_-V97lbdgLFHpx-
CtqhLWlJAnYY&ll=19.378689896581427%2C-99.15070127080776&z=15. Last accessed on
October 2, 2017.
Landa-Ruiz L, Jara-Diaz M, Jara-Guerrero J, and H. Hernandez-Barrios, (2008). Seismic Assessment Analysis
of Bridges in Mexico. Proceedings, 14th World Conference in Earthquake Engineering, October 12-
17, Beijing, China.
Mayoral JM, Castañon E, Sarmiento N. (2015). Seismic response of high plasticity clays during extreme
events. Soil Dynamics and Earthquake Engineering, Elsevier, 77, 203–207.
Mayoral, J.M., M.P. Romo, L. Osorio. (2008). Seismic parameters characterization at Texcoco lake, Mexico.
Soil Dynamics and Earthquake Engineering, Elsevier, 28(7), 507-521.
Mayoral, J.M., E. Castañon, L. Alcántara, S. Tepalcapa. (2016). Seismic response characterization of high
plasticity clays. Soil Dynamics and Earthquake Engineering, Elsevier, 84, 174-189.
RCDF. Reglamento de Construcciones para el Distrito Federal, Administración Pública del Distrito Federal,
Jefatura de Gobierno, Normas Técnicas Complementarias para el Diseño por Sismos, México;
2004.
Romo M.P. (1995). Clay behavior, soil response and soil structure interaction studies in Mexico city.
Earthquake Spectra, EERI 4(2), 731–52.
Romo M.P., Jaime A, Reséndiz D. (1988). General soil conditions and clay properties in the Valley of
Mexico. Proceedings of the third international conference on recent advances in geotechnical
earthquake engineering and soil dynamics, vol 2., San Luis Missouri, USA; p. 1039–1051. 4(2), 731–
52.
Seed HB, Romo MP, Sun J, Jaime A, Lysmer J. (1988). Relationships between soil conditions and
earthquake ground motions. Earthquake Spectra, EERI, 4(2), 687–730.

53
Seed, H.B., M.P. Romo, J.I. Sun, A. Jaime and J. Lysmer. (1988). The Mexico earthquake of September 19,
1985 – Relationships between soil conditions and earthquake ground motions. Earthquake
Spectra, EERI, 4(3), 687-729.
Singh, S. K., Ordaz, M., Pacheco, J. F., Quaas, R., Alcántara, L., Alcocer, S., Gutiérrez, C., Meli, C., and
Ovando, E., (1999). A preliminary report on the Tehuacán, Mexico earthquake of June 15, 1999
(Mw57.0), Seismol. Res. Lett. 70 (2), 489–504.
USGS (2017). Executive Summary of M7.1 - 0 km NE of Ayutla, Mexico. Retrieved from
https://earthquake.usgs.gov/earthquakes/eventpage/us2000ar20#executive. Last accessed on
October 3, 2017.

54
Appendix: Recommended Sites for Additional Study This section incorporates 17 sites/activities that the advance team recommended for additional study by
the UNAM-GEER main team. These sites had geotechnical, structural or geo-structural features worth
examining with UAV and/or LiDAR survey methods, seismic testing, and/or additional structural
inspections.
A1. Mexico City - Zone 1 Zone 1 in Mexico City was delineated as is shown in Figure A1 below, and included the heavily damaged
neighborhoods of La Condesa, Hipódromo, and La Roma. The zone also includes historic downtown
Mexico City, in which relatively little damage was reported at the time of the advance reconnaissance. A
few of the most interesting potential case histories are briefly described below.
Figure A1. Delineation of Zone 1 for the UNAM-GEER advance reconnaissance mission
A1.1. Site 1: La Condesa, Hipódromo, and Roma Structural and Site Period
Assessment (approximately 19.4130, -99.1710)
Description of Buildings: Based on a rapid assessment by UNAM-GEER team personnel in the city blocks
located between La Parque de Mexico and La Parque Espana (see Figure A2), numerous building and
foundation types were observed, as well as a wide range of building performance. Structures generally

55
ranged from two to 12 stories in height. Observed foundations included end-bearing piles (both fixed and
controlled), friction piles with mat slabs, and floating mat slabs.
Description of Damage: Damage ranged from minor cracking in the exterior masonry to total collapse.
Several multi-story buildings were tilting between one to three degrees, and numerous buildings were
observed to be resting on the adjacent building. Several gas line breaks were reported in the area, but the
gas supply had apparently been shut off to the affected area prior to our team’s arrival.
Description of Response: Numerous streets were closed off to the public and were under police and/or
military guard. All of the structures in the investigated vicinity had been evacuated. Various teams of
engineers were working to identify and classify damage states at the various structures.
Data obtained: Area was assessed via drone flight. Detailed video images of two collapsed structures was
obtained, as was overhead images of the entire highlighted area in Figure A2. Site response measurements
(i.e., H/V ratios) were taken across the affected area along Avenida Michoacan and Avenida Coahuila.
Measured site periods ranged from 0.73 to 1.25 seconds, and generally increased as the team progressed
to the east towards the mapped Lake Zone III deposits.
Follow up/Interest: This area in many ways comprises the heart of the structural damage from this
earthquake. More structures were damaged in these neighborhoods than in any other neighborhood in
Mexico City. Additionally, two CIRES ground motion stations are located very near this area (see Figure
A2). The team could not access these ground motion stations because they are located inside schools, and
were under military guard at the time of advance reconnaissance. However, it is known that significant
structural damage occurred in the vicinity of both of these ground motions stations. It would be
interesting for future researchers to carefully classify the structural and foundation performance in this
area of the city, and compare that performance against the CIRES recorded ground motions once they
become available. It would also be interesting to perform north-south and east-west lines of Vs and site
period measurements across this area, and use that information to see if our current site response analysis
methods can match the observed ground motion response in this area. In particular, the city blocks to the
north of the UAV flight zone, just west of the ground motion station C105, would be very interesting to
study further. Note that Google Maps (2017) currently shows few of the damaged structures that were
observed by the UNAM-GEER team in this area. However, the map continues to include more damaged
and collapsed buildings each day.

56
Figure A2. Delineated zone of preliminary UAV flight in La Condesa and Hipódromo; note the relatively
high number of collapsed and damaged structures from Google Maps (2017) to the north of the
preliminary UAV flight area, as well as the CIRES ground motion station C105
A1.2. Site 2: La Plaza Condesa Structural and Foundation Performance (19.4129 N
99.1722 W)
The Plaza Condesa building described in Section 3. Performance of Building Foundations is a particularly
interesting structure for future studies because of its significance
Description of Building: The Plaza Condesa building is described in Section 3. Performance of Building
Foundations is a particularly interesting structure for future study because of its significance to the
community, its adequate performance in an area where other surrounding structures were heavily
damaged, it's confirmed use of controlled end-bearing piles, and its unique U-shaped design.
Description of Damage: Some settlement of the ground around the structure. Up to 10 cm of settlement
of the ground was observed along the east side of the building (see Figure 25 of the report). A slight tilt of
less than 1 degree to the north was observed in the La Plaza Condesa building, but it is not clear if this tilt
occurred because of the earthquake or uneven leveling/maintenance of the controlled pile foundation.
The building was occupied and in use at the time of the UNAM-GEER advance reconnaissance.

57
Description of Response: No response was occurring at the building. The building owner talked with the
UNAM-GEER team and allowed us to investigate and photograph the controlled pile foundation of the
structure. However, our investigation was limited due to the advance team’s mission objective to rapidly
collect preliminary information of interest.
Data obtained: Aerial images of the structure were captured with UAV. Photographs were captured of the
controlled pile foundations supporting portions of the structure. The Theodolite app was used to optically
measure the structural tilt of approximately 1 degree to the north.
Follow up/Interest: It would be interesting to study why the structural response of La Plaza Condesa was
so favorable, particularly when the U-shaped structure likely should have contributed to significant
structural torsion during the earthquake. Also, many Mexican engineers communicated to the team that
controlled pile foundations gained a poor reputation following the 1985 Michoacan earthquake. However,
the performance of the foundation system in this earthquake seemed quite good based on our
preliminary assessment.
A2. Mexico City - Zone 2
Zone 2 (see Figure below) was characterized by numerous moderate and small cases of structural damage.
Several buildings that reported damage during the 1985 earthquake were visited. Most retrofitted
buildings performed well, several buildings showed cracking along exterior walls, and internal masonry
walls. Not all buildings were accessible, a few of the most interesting cases are described below:

58
Figure A3. Delineation of Zone 2 for the UNAM-GEER advance reconnaissance mission
A2.1. Site 1: Escocia 4, De Valle (19.3877, -99.1637)
This site is located at the intersection of Escocio and Calle Gabriel Mancera. Two buildings experienced
complete collapse, and are currently being demolished.
Description of Building: Based on google earth pre-earthquake photos, the collapsed corner building was
a 7-story residential structure, likely confined masonry construction
Description of Damage: Total Collapse
Description of Response: Building and surrounding streets were completely closed off, search of
survivors and fatalities ongoing, manual demolition of all building components by hand through
volunteers
Follow up/Interest: Immediately adjacent to the collapsed building were 2 structures that experienced
severe damage, but no collapse. Buildings were evacuated but area was not accessible at the time for
further investigation. Of interest are the different site conditions, foundation types, structural lateral
force resisting system.
Data obtained: Area was assessed via drone flight. Site response measurements (i.e., H/V ratios) were
taken nearby. A site period of 0.87 seconds was measured.

59
Figure A4. Before (left) and after (right) shots of the Escocia 4 Building (19.3877, -99.1637)

60
Figure A5. The Building across Escocia 4 (i.e., Escocia 14) also seemed to have collapsed, but was not
listed as one of the damaged/collapsed buildings in the initial list (19.3877, -99.1637)
A2.2. Site 2: Enrique Rebsamen and La Morena (19.3984, -99.1587)
This site also consisted of a group of buildings that showed significantly different behavior. One building
experienced severe damage (corner building), one building showed only sign of small damage, and one
building experienced total collapse. The response of each individual structure might be related to the
foundation type (unknown), age and structural system. A smaller structure adjacent to the green
(collapsed) building was also majorly damaged and demolished. Overview Photos:
Figure A6. UAV photographs of the Escocia/La Morena intersection with 4 buildings of interest (19.3984,
-99.1587)
1. Corner Building at Enrique Rebsamen 249 and La Morena (19.3987, -99.1589)
Description of Building: 8 story residential structure, ground floor seemed to be constructed as a
reinforced concrete system.

61
Description of Damage: Major damage/collapse of the concrete elements (shear walls and columns) at
the ground floor. Lack of transverse reinforcement, and/or rebar spacing beyond allowable spacing limits.
Building currently stabilized with temporary wood columns. Building showed strong tilt.
Follow up /Interest: Around the corner of this site (i.e., at Calle J Enrique and La Morena) a similar building
as the corner building experienced very modest damage but seemed to have a similar configuration.
Description of Response: All Buildings were evacuated; the entire area is closed off to the public.
Figure A7. Top: Before and after shots of the corner building (19.3987, -99.1588), Middle and Bottom: Damage observed at the ground level

62
2. Enrique Rebsamen 241 (19.3990, -99.1588), Narvarte Poniente, 03020 Ciudad de México,
CDMX, Mexico
This building, which was located extremely close to the above mentioned structure experienced a total
collapse and was being demolished at the time of our visit.
Description of Building: Based on google earth pre-earthquake photos, the collapsed building (#241) was
a 5 story residential structure. This building was reported to have been damaged before the earthquake,
and residents repeatedly requested inspection. There is a potential lawsuit going on with respect to this
building collapse.
Description of Damage: First floor (soft story) collapse led to completed building collapse. Building might
have rocked during the EQ, significant impact damage (pounding) is visible at the adjacent building (the
center building that did not show any damage)
Description of Response: Building and surrounding streets were completely closed off, the collapsed
building was currently being demolished
Follow up/Interest: Between the two damaged/collapsed structure there was one structure with no
damage. Structural configurations are of interest.
Data obtained: Area was assessed via drone and on-site photography. Site response measurements (i.e.,
H/V ratios) were taken nearby.

63
Figure A8. Enrique Rebsamen #241 photographs during site visit; top left: google pre-earthquake shot,
remaining photos: frontal shots taken on site of damaged structure (19.3990, -99.1588)

64
3. Intersection of La Morena and Calle J. Enrique Pestalozzi (19.3986, -99.1581)
This building was located just one short block away from the above described structures. The corner
building seemed similar in construction as the Enrique Rebsamen 249 building, but showed only modest
damage compared to the building above.
Description of Building: 8 story residential structure
Description of Damage: Moderate damage, cracks in wall elements, pounding damage between this
structure and the adjacent structure over the height of the first 3 stories.
Description of Response: Building and surrounding streets were completely closed off, building was
evacuated
Follow up/Interest: Even though damage was observed in this structure and the nearby structures
described above, almost no structural damage was observed in any of the nearby 5-6 story buildings along
La Morena street.
Data obtained: Area was assessed via drone/ and on-site photography. Site response measurements (i.e.,
H/V ratios) were taken nearby.
Figure A9. Moderate damage at 8 story residential structure (19.3986, -99.1581)

65
A3. Mexico City - Zone 3 Significant damage and extensive collapse was reported in CDMX Zone 3. This zone included the
neighborhoods of Campestre Churubusco, Pueblo Culhuacan, Los Reyes, STA. Ursula Coapa, and Huipulco.
This zone is located in the lake-bed zone (see Figure 17).
Figure A10. Delineation of Zone 3 for the UNAM-GEER advance reconnaissance mission
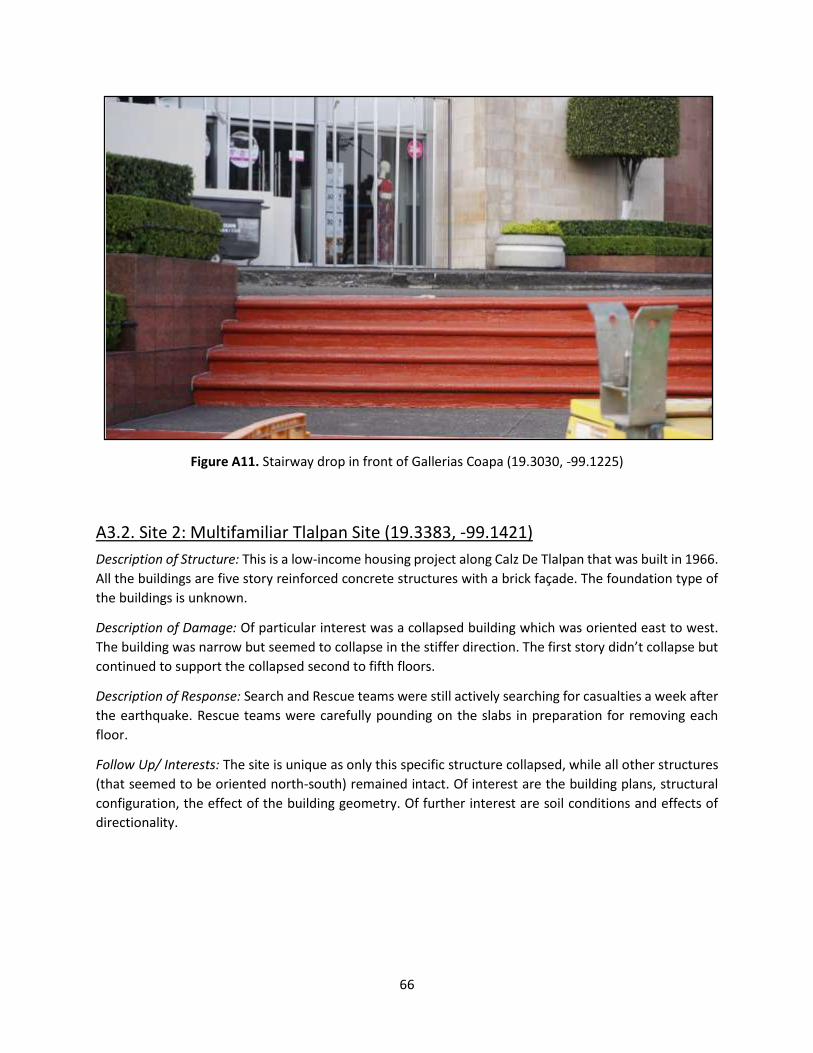
A3.1 Site 1: Gallerias Coapa (19.3030, -99.1225)
Description of Structure: Two story reinforced concrete structures on piles.
Description of Damage: Brick facing cracked and spalled and ground settled above stairs (due to
underground parking structure?)
Description of Response: Buildings were closed until repairs could be made.
Follow Up: Find out why this ground settlement occurred.
66
Figure A11. Stairway drop in front of Gallerias Coapa (19.3030, -99.1225)
A3.2. Site 2: Multifamiliar Tlalpan Site (19.3383, -99.1421)
Description of Structure: This is a low-income housing project along Calz De Tlalpan that was built in 1966.
All the buildings are five story reinforced concrete structures with a brick façade. The foundation type of
the buildings is unknown.
Description of Damage: Of particular interest was a collapsed building which was oriented east to west.
The building was narrow but seemed to collapse in the stiffer direction. The first story didn’t collapse but
continued to support the collapsed second to fifth floors.
Description of Response: Search and Rescue teams were still actively searching for casualties a week after
the earthquake. Rescue teams were carefully pounding on the slabs in preparation for removing each
floor.
Follow Up/ Interests: The site is unique as only this specific structure collapsed, while all other structures
(that seemed to be oriented north-south) remained intact. Of interest are the building plans, structural
configuration, the effect of the building geometry. Of further interest are soil conditions and effects of
directionality.

67
Figure A12. Photograph (left) and Location (right) of collapsed residential structure in Multifamilia
Tlaplan (19.3383, -99.1421)
A4. Mexico City - Zone 4 Zone 4 in southern Mexico City consisted of the Xochimilco, Tlahuac and Colonia del Mar neighborhoods.
Significant damage was observed in this zone, with an unstable embankment, damaged churches, and
collapsed of 1 and 2 story houses in Xochimilco, and an intricate network of cracks and depression bands
in Tlahuac and Colonia del Mar. As described in the executive summary, the soils in this zone consist of
lacustrine clays which are somewhat stiffer than the clays found in zones 1, 2 and 3.
Figure A13. Delineation of Zone 4 for the UNAM-GEER advance reconnaissance mission

68
A4.1. Site 1: Xochimilco Slope Instability (19.2467; -99.0872)
Description of Site: A large slope (suspected to be a fill slope) directly above several residential structures,
a local market and one of the major pump stations for CDMX. Local residents reported ongoing slope
displacements both before and following the earthquake. The retaining wall supporting the embankment
was built in 1906; the preexisting slope instability is most likely due to water pumping that causes
subsidence of terrain around extraction station.
Description of Damage: Approximately 450 m of intermittent surface cracks indicating slope failures on
lower step above market, and 50 m of cracks along upper step. infill slope with the failure occurring along
the interface between natural soil and the fill used to create the road paths.
Description of Response: The road (see photo below) was closed to cars, residents were not evacuated.
No traffic access on the cracked road was permitted.
Follow up: UAV or Lidar flight, along with measurements of crack widths and other displacement
indicators might be of interest.
Figure A14. Aerial view of the slope instability with cracks marked along the road

69
Figure A15. Surface cracks along lower step above market(left: 19.2469; -99.0895), (right: 19.2467; -
99.0872)
Figure A16. Crack along the street (left) and cracks on retaining wall holding upper step (right),
(19.2470, -99.0875)

70
A4.2. Site 2: Colonia Del Mar Cracks and Settlement, Tlahuac
Description of Site: Two interesting failure features were apparent in the Colonia del Mar neighborhood.
One set of failures is comprised of a series of pipeline cracks, and another one consisting of a series of
curving surface cracks with terrain settlement that crossed several city blocks. While the pipeline failure
was an earthquake induced failure, the general settlement and subsidence cracking along a longer stretch
in the neighborhood was noticed before, although to a much a lesser magnitude.
Description of Damage: Large sewage pipelines (5 to 6 m in diameter) and fresh water pipelines (1 m in
diameter) broke at several sections along parallel streets (separated by several blocks). The breaks
occurred in several sections along the same street, some of which were already being repaired. The soil
on that street settled as much as 2 ft relative to the houses and small structures, which did not show signs
of settlement. The depression bands crossed streets and entire city blocks. A UAV flight revealed, and
later data from CENAPRED corroborated, that the network of depression bands extended for kilometers.
The soils were clayey, possibly transitional sediments between the lake soils and the rocky soils close to
the hills in the south.
Description of Response: Pipeline repair was currently underway. Roads with pipe breakage were closed.
Water supply in the neighborhood was initially provided through water trucks. Partial pipeline repair
enabled freshwater supply (observed during a later visit).
Follow up: UAV or Lidar flight, of the entire region, including adjacent neighborhoods, as cracking pattern
is known to extend beyond the area investigated. Shear wave measurements of soil within and outside
depression bands.
Figure A17. Aerial representation of damages in Colonia del Mar, showing pipeline breaks and ground
depression bands (yellow pins indicate locations where pipelines broke; green lines indicate streets with
pipeline breaks; white squares indicate ground depression bands, with the five located on the left side of
the image being mapped from observations on foot, bottom right one observed while driving on the
road, and remaining ones mapped from aerial photographs; blue line indicates interpreted extent of
ground depression band; red squares showing other ground depression bands).

71
Figure A18. Damage in pipes due to ground settlement (19.28687; -99.0544)
Figure A19. Settlement along ground depression band (left) (19.2868, -99.0604), sidewalk settlement
close to damaged pipeline (19.2868, -99.0604), aerial shot of cracks on pavement.

72
A4.3. Site 3: Metro Elevated Train Viaduct (19.2982, -99.0339) and (19.3017, -
99.0520) Two damage locations were reported for the Metro Train Viaduct. Site one showed damage at the
superstructure (pounding) and ground cracking due to column rocking (floating foundations), on another
site a support column was severely damaged. Both sites are summarized below.
Site 3.1: 19.2982 , -99.0339
Description of Structure: The viaduct superstructure is composed of simply supported steel girders
supporting a concrete deck. The wide deck carries two sets of tracks and an occasional train station. The
substructure is 7’ diameter, single column bents and big hammerhead bent caps, supported on hollow
floating foundations to protect the structure from sinking. The columns have a 5” notch for a drainage
pipe that prevents rainwater from accumulating on the roadway. This detail is considered poor since it
requires at least 5 inch of concrete cover to provide increased column stiffness. Support spacing varies
around an average of 60 ft.
Description of Damage: Severe cracking in the road indicated the columns rocking during the earthquake
(see Figure A22 below). Rocking is considered a good phenomenon since it protects the columns from
more serious damage during an earthquake. Shear Key Damage was observed on the west side of Juan de
Dios Peza (19.2982, -99.0339), as well as damage to the bent caps. In addition, minor damage cracks and
spalls from the spans banging together at expansion joints was noticed (19.2982, -99.0339).
Description of Response: No interruption of traffic and Metro Service, engineering assessment of road
cracking and superstructure damage underway during visit.
Follow-Up: Given the unique foundation system of the bridge pier (Floating foundations), it would be of
interest to gather information of potential foundation damage. Furthermore, the available amount of
bridge seat the ends of the girders would be of interest to assess if the girders have any restraint (or
enough seat) left to prevent them from falling.
Figure A20. Photo showing ‘S’ shaped viaduct (19.2982, -99.0339)
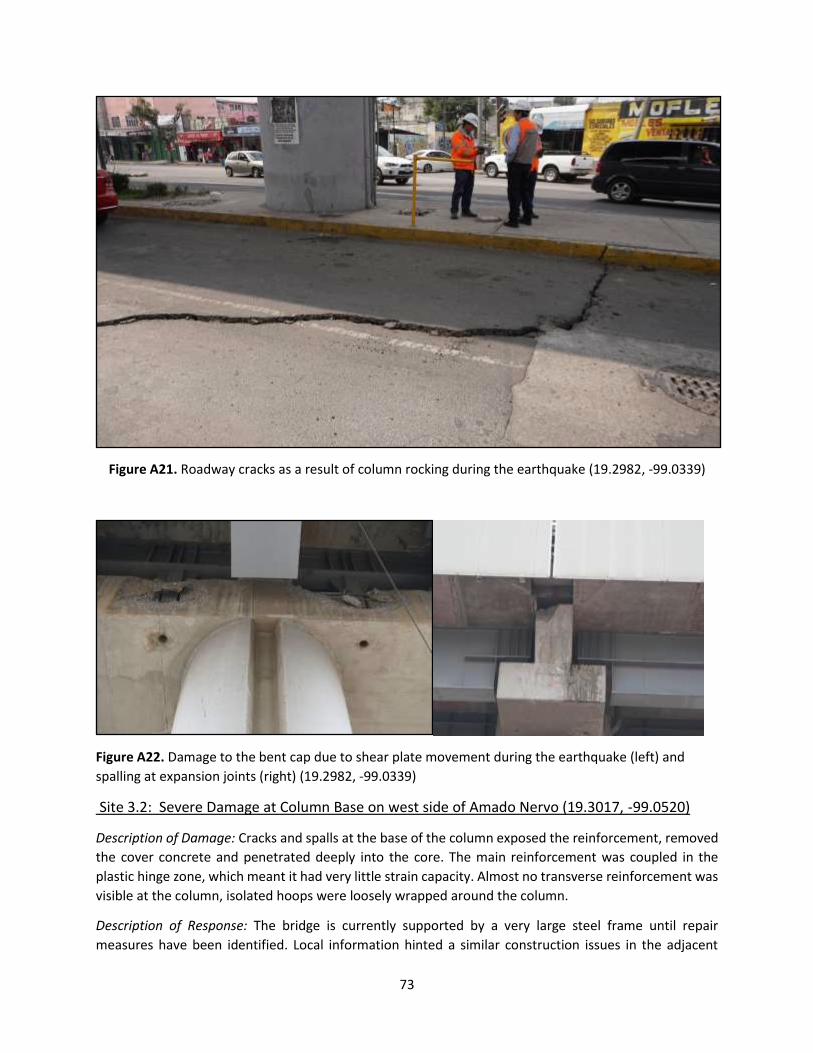
73
Figure A21. Roadway cracks as a result of column rocking during the earthquake (19.2982, -99.0339)
Figure A22. Damage to the bent cap due to shear plate movement during the earthquake (left) and
spalling at expansion joints (right) (19.2982, -99.0339)
Site 3.2: Severe Damage at Column Base on west side of Amado Nervo (19.3017, -99.0520)
Description of Damage: Cracks and spalls at the base of the column exposed the reinforcement, removed
the cover concrete and penetrated deeply into the core. The main reinforcement was coupled in the
plastic hinge zone, which meant it had very little strain capacity. Almost no transverse reinforcement was
visible at the column, isolated hoops were loosely wrapped around the column.
Description of Response: The bridge is currently supported by a very large steel frame until repair
measures have been identified. Local information hinted a similar construction issues in the adjacent

74
columns of the bridge segment. X-ray measurements are anticipated to ensure this column is an anomaly
and not typical along the viaduct.
Follow-Up: X-Ray results are of interest and whether this is a localized construction issue or a repeated
construction error along the metro line.
Figure A23. Cracks extending into the column core (shown on top) and superstructure shoring with
tubular steel frame sections (shown on bottom). (19.3017, -99.0520).
A5. Puebla and Epicentral Region
The city of Puebla is located approximate 150 km southeast of Mexico City. A walking survey around the
the city center revealed several buildings had been damaged by the earthquake. A drive south from Puebla
toward the epicenter revealed the roads changed from asphalt to gravel, shepherds driving their livestock,

75
and groups of people walked along the side of the road dressed in holiday attire. We stopped in Chiautla
near the epicenter, where President Nieto had given a speech after the earthquake but we saw few signs
of damage. We drove through many rural towns but we didn’t see much damage until we arrive in San
Juan Pilcaya. 30 miles southwest of the epicenter.
Figure A24. Travel from Puebla to the Epicentral Area and to San Juan Pilcaya.
A.5.1. Site 1: Downtown Puebla (19.0429, -98.1975)
Puebla is a beautiful city which was designed to resemble Paris. Walking around the Parque Centro we
were disappointed to see shoring, yellow tape, and damaged roofs on several buildings. Even the Catedral
de Puebla had shoring on the gables facing the square. This was the only damage we saw in Puebla.

76
Figure A25. This restaurant (Portal Morales) has signboard covering its damaged roof and shoring
supporting its windows, doors, and balconies, all suggesting severe damage (19.0429, -99.1975).
Figure A26. The building next door, the Periodicos El Sol (The Sun Newspaper) had yellow tape around
the exterior and signs posted on the doors suggesting damage inside (19.0429, -99.1975).
A5.2. Site 2: San Juan Pilcaya (18.2330, -98.7050) Description of Town: Thirty miles southwest of the epicenter and several miles south of Chiautla is the
ancient village of San Juan Pilcaya built from adobe bricks. The main streets in the center of town are
cobblestone and there is a beautiful 400 year old church surrounded by homes and businesses.
Description of Damage: The church was severely damaged and most of the walls of the houses and stores
were crumbling after the earthquake. Fortunately, there were no casualties. The bridge leading into the

77
hills behind the town had pier damage and people were being cautioned not to use it. We were told that
the town of Palantar was also seriously damaged but we didn't have time to visit.
Description of Response: Food and other goods were being distributed in a big outdoor shelter that had
previously been built next to the church.
Follow-Up: Was the extensive damage simply due to adobe construction or were there site effects that
contributed to the damage?
Figure A27. Damaged church (left) (18.2330, -98.7050), and typical adobe damage from earthquake
(right) (18.2334, -98.7055).
Figure A28. Building Damage (left) (18.2286, -98.7045) and damage observed at center pier of the
bridge (right) (photo taken while standing on the bridge) (18.2335, -98.7040).
A6. Morelos State
Morelos is a 1884 sq mile large state with a population of about 1.777 million people. Given its proximity
to the epicenter, significant damage was observed and reported throughout the entire state. Two UNAM-
GEER teams visited the eastern and western regions of the state (i.e., along highways #950 and 1150/160
respectively) to document structural, geotechnical and infrastructure damage.

78
Figure A29. Map showing the state of Morelos
A6.1. Site 1: Tlayacapan Rockslide (18.9486, -98.9837)
Description of Damage: Rockslide with houses right below it. The path of the boulders is visible in the
vegetation; boulders were slowed down due to (1) the vegetation above the houses, (2) the soft soil
conditions and (3) existing boulder from previous events. Imprints from tumbling boulders were visible in
the soft soils along the slide path. Only damage to the one residential house was observed, this structure
was unoccupied. Preliminary UAV flight performed.

79
Figure A30. Top: Location and profile of rockfall slide, Left: ‘Before” view from Google and Right: current
view after earthquake (18.9486, -98.9837)

80
Figure A31. Photographs from main highway (left) and UAV (right) (18.9486, -98.9837)
Figure A32. Damage to a resident under construction by massive boulder (~9 m3) from rockfall (18.9488,
-98.9840)
A6.2. Site 2: Totolapan Landslide (18.9816, -98.9246)
This site is an old lava rock (Tezontle) quarry which is currently being used as landfill. The cuts of the quarry are overly steep and possibly undercut. Aerial imagery shows an existing cut area where previous landslides might have occurred (on the left - Source: Google Earth). Given the quarry geometry, the new landslide (triggered by the earthquake) was somewhat anticipated. New material covered about half of the landfill (i.e., waste) area and left nearby houses unstable. The instability of the slope is clearly observed by extension cracks meters north of the houses and a medium size failure during the reconnaissance team

81
visit to the site. Short duration rain storms can potentially produce more failures in the site, substantial cracking was identified via aerial photographs. Soil type: clay and lava material.
Figure A33. Google earth before shots of Totolapan Landslide (18.9816, -98.9246)
Figure A34. Photographs showing slope failure after the earthquake (18.9816, -98.9246)

82
A6.3. Site 3:Atlatlahucan Landslides (18.9378, -98.8784)
Over six “landslides” were observed along the hills that run parallel to Route 115, to the SE, over a distance
of about 2 km. These slides were associated with old mining quarries, according to google earth images
from 2011 – 2017. Open cut mining activities did not seem to be continuous. A comparison of “before and
after” imagery indicated potential for additional slide movement at all individual mines. In addition to
individual slides, substantial cracking of the surface at the top plateau of the landslides was observed. This
was not as extensive in previous years based on google earth observations.
Figure A35. Extent of the observed Atlatlahucan landslides, but it is possible that the slides continue
beyond our observation (18.9409, -98.8709)
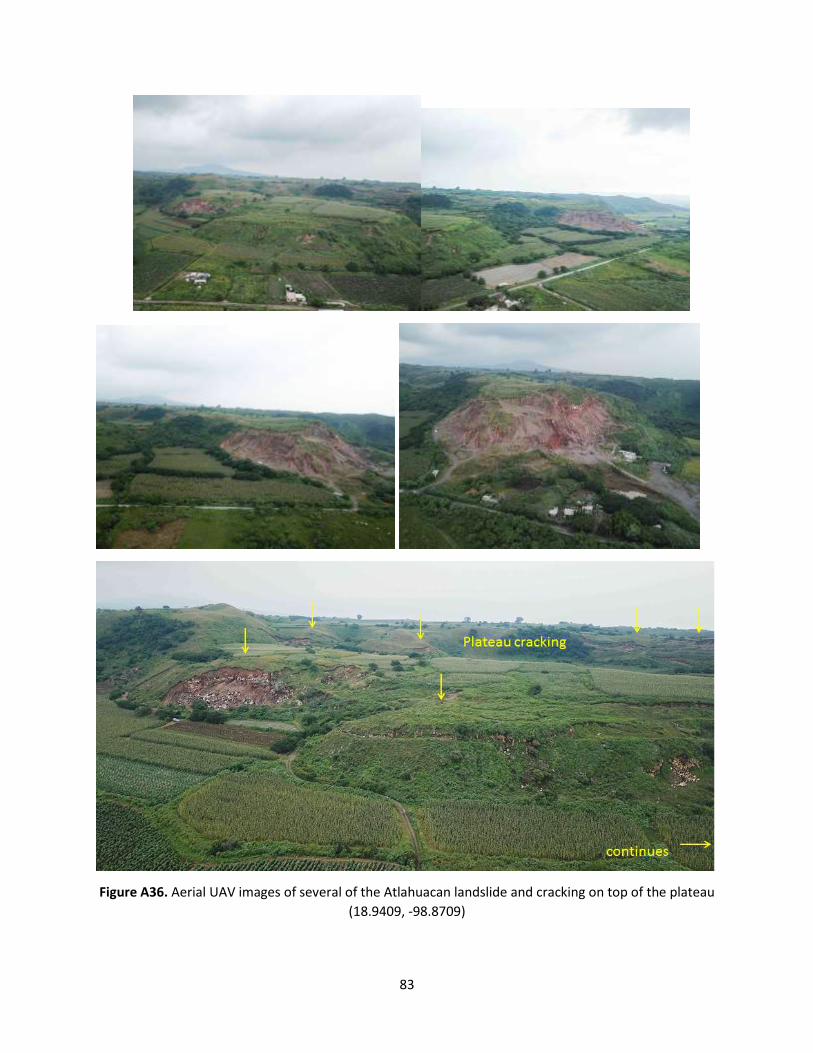
83
Figure A36. Aerial UAV images of several of the Atlahuacan landslide and cracking on top of the plateau
(18.9409, -98.8709)
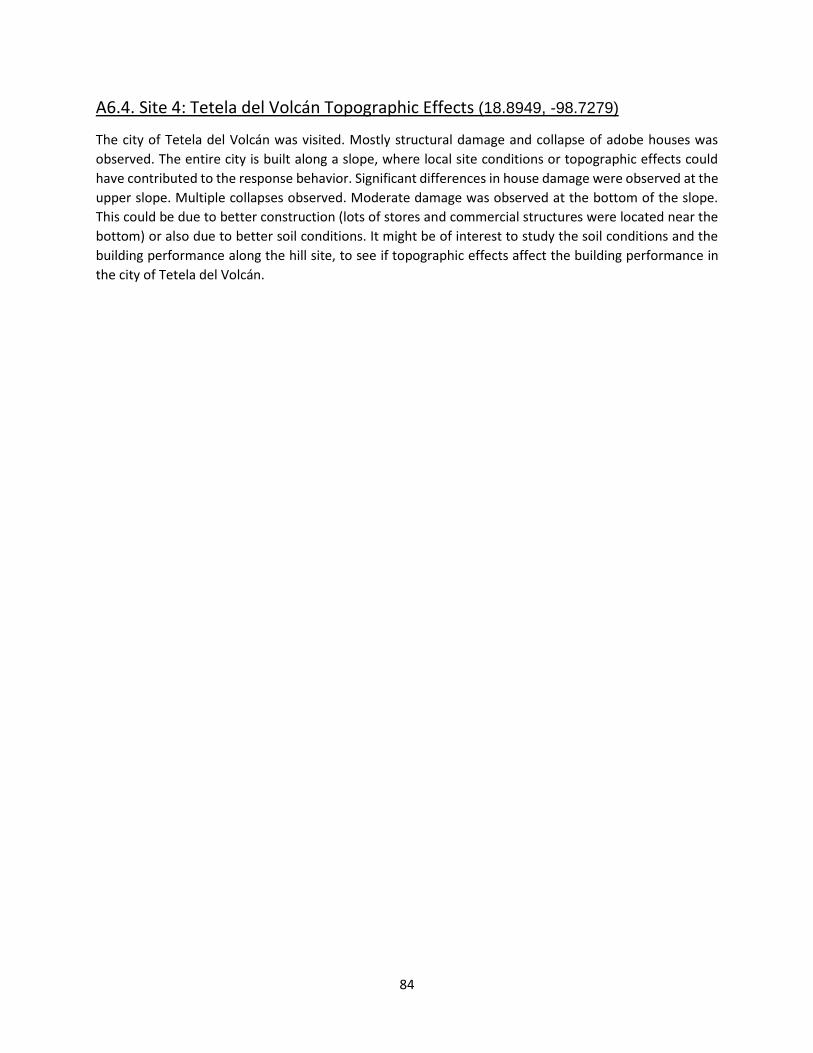
84
A6.4. Site 4: Tetela del Volcán Topographic Effects (18.8949, -98.7279)
The city of Tetela del Volcán was visited. Mostly structural damage and collapse of adobe houses was
observed. The entire city is built along a slope, where local site conditions or topographic effects could
have contributed to the response behavior. Significant differences in house damage were observed at the
upper slope. Multiple collapses observed. Moderate damage was observed at the bottom of the slope.
This could be due to better construction (lots of stores and commercial structures were located near the
bottom) or also due to better soil conditions. It might be of interest to study the soil conditions and the
building performance along the hill site, to see if topographic effects affect the building performance in
the city of Tetela del Volcán.

85
Figure A37. City map (top), structural damage and collapse to residential buildings (middle and bottom;
18.8949, -98.7279)

86
A6.5. Site 5: Embankment failure in Tejalpa-Zacatepec Highway (18.7146, -99.1835)
Description of Area: Embankment supporting part of the highway.
Description of Damage: A portion of an embankment partially supported on a retaining wall suffered
significant damage manifested as medium to large cracks on the pavement for a length of 70 ft. The failure
occurred on the section of the embankment that was not supported by the retaining wall, indicating a
failure due to suboptimal design.
Description of Response: The road was closed due to the damages.
Figure A38. Significant deformations along pavement due to embankment deformation (18.7146,
-99.1835).
A6.6. Site 6: Transition zone from CDMX to the town of Jojutla & Surrounding
areas
Description of Area: Plenty of damages were found in Mexico City on structures on soft lake or transitional
sediments. South of Mexico city, up until the town of Emiliano Zapata, there were very few damages
observed. However, further south, starting at the Town of Tlaltizapan, damages became more common,
with extent of damage increasing as one moves south. Geologic maps of the area revealed a transition
from intrusive and extrusive igneous rock and limestone geologic strata in Cuernavaca and Emiliano
Zapata where few damages were observed to alluvial soils in Jojutla where widespread damage to 1 to 2
story structures was observed.
Description of Damage: The majority of the damaged structures consisted of 1 to 2 story houses
constructed with masonry and reinforced concrete or adobe. Section A6.7 provides further details.

87
Description of Response: Food and other living supplies were being distributed at various areas. Many
partially collapsed buildings were being demolished, and the rubble was being removed.
Follow-Up: Characterize the soil conditions (e.g. shear wave velocity) as one moves from Mexico City to
Jojutla with the intention to reveal potential site effects and ground motion amplification that resulted in
relatively little damage in the zone in between. This characterization could be completed by taking, for
example, shear wave profiles in the following sites: Cuernavaca, Emiliano Zapata, Tlaltizapan, and Jojutla
(from North to South)
Figure A39. Map of western Morelos (left) and Geologic map of southern Morelos region (from INEGI’s
website) (right)
A6.7. Site 7: Towns of Jojutla, Tlaquiltenango, Tlaltizapan, and Lake
Tequesquitengo
Description of Area: These areas are in the southern part of Morelos. Jojutla has about 53,000 habitants,
Tlaquiltenango has about 30,000 habitants, Tlaltizapan has about 45,000 habitants. Lake Tequesquitengo
is a manmade lake located to the west of Jojutla.
Description of Damage:
● Jojutla: Widespread damage to 1 to 2 story structures. In some blocks most of the buildings
collapsed or partially collapsed. No drone flights were made at this location to take aerial
photographs and map the extent of the damage; however, from ground observations it appeared
that the damage was widespread and a relatively large portion of buildings were significantly
damaged (about 5 buildings collapsed or partially collapsed per block in the most affected area).
Most of the collapsed or partially collapsed structures were either constructed out of masonry with
reinforced concrete columns or out of older adobe bricks. It appears that many of the affected
structures were originally designed as 1 story structures, and some time later a second story was
added. The structural failures indicated shear wall failures and collapse of first story due to buckling

88
of the columns on the first story. Close to the Río Apatlaco, there were about 5 to 10 collapsed
buildings on either side of the river (FIG), and the bridge connecting both sides suffered significant
damages. One of the banks along the river failed, showing signs of lateral spreading potentially due
to loss of strength due to the seismic load. The bank failure damaged a two story structure and a
significant portion of the sidewalk leading to this structure.
● Tlaquiltenango: The town of Tlaquiltenango suffered significant damages on many 1 to 3 story
buildings, as well as on its main church. Many of the damaged structures had already been
demolished, thus it was impossible determining the potential causes for failure. However, several
undemolished buildings showed clear signs of failure of the first story, possibly due to failure of the
columns of the first story or the connections between the columns and the slab of the second story.
In a few places groups of 3 to 4 buildings had collapsed, indicating the possibility of localized weak
or soft soils that further amplified the ground motions, poor construction of that group of buildings,
or interaction between those buildings. The town’s main church exhibited large cracks that
extended through its entire height failure. However, it should be noted that on this case the bell
tower of the church did not show clear signs of damage, possibly due to its less slender shape as
opposed to those of other churches as described above.
● Tlaltizapan: There were several 2 story structures in the town of Tlaltizapan that either completely
or partially collapsed. The structural failures indicated shear wall failures and collapse due to
buckling of columns, most likely because of inappropriate design or poor construction. A different
structure suffered significant damage on its second story while its first story remained relatively
intact.
● Lake Tequesquitengo: Along the northeast shore of Lake Tequesquitengo there was a failure on the
road caused by failure and lateral spreading of the lake bank, shown as large cracks and significant
displacement of the road. The side of the road closer to the lake settled about 2 feet, and its
horizontal displacement was of about 1 foot. The length of the failure, as measured from the cracks
on the pavement’s surface, was of about 170 feet.
Description of Response: Food and other living supplies were being distributed at various areas. Many
partially collapsed buildings were being demolished, and the rubble was being removed.
Follow-Up: UAV flight over the towns of Jojutla and Tlaquiltenango to map the extent of the damage to
structures as well as other ground deformations along Río Apatlaco.
Figure A40. Group of partially collapsed and undamaged buildings in Jojutla (18.6176; -99.1775)

89
Figure A41. Partially collapsed building (18.6176; -99.1775)
Figure A42. Block with several collapsed buildings (rubble already removed) (18.6153; -99.1744), and
and collapsed building with second story on ground after first story collapsed (18.6154, -99.1746)

90
Figure A43. Map of Jojutla with heavily affected area by Rio Apatlaco highlighted in red (top), partially
collapsed buildings close to Rio Apatlaco (middle, 18.6123, -99.1817), structure with failed first story and
second story fallen on top (bottom left, 18.6113, -99.1821), and Apatlaco River bank failure and
affected structures.

91
Figure A44. Cracks along pavement on Lake Tequesquitengo (top left), vertical displacement of road (top
right), (c) and (d) large cracks opened on pavement (bottom, 18.8313, -99.2538).