GEOMORPHOLOGY AND DRAINAGE BASIN CHARACTERISTICS...
37
II CHAPTER Ill II GEOMORPHOLOGY AND DRAINAGE BASIN CHARACTERISTICS
-
Upload
truongkhuong -
Category
Documents
-
view
221 -
download
2
Transcript of GEOMORPHOLOGY AND DRAINAGE BASIN CHARACTERISTICS...

II CHAPTER Ill II
GEOMORPHOLOGY
AND
DRAINAGE BASIN
CHARACTERISTICS

CONTENTS
3.1 Introduction
3.2 Regional Geomorphology
3.3 Geomorphic units of Parrl Basin
3.4 Drainage Basin Characteristics of Parr! Nadl
3.4.1 Linear P ropertles
3.4.2 Areal Properties
3.4.3 Relief Properties
3.5 Slope analysis and Landforms
3.6 Lineament/Fracture Analysis
FIGURE :-
3.1 Regional Geomorphology
3.2 Geomorphology of Parri Basin
3.3 Fluvial Features
3.4 Stream order/Drainage map of Parri Basin
3.5 Drainage density variation map of Parri Basin
3.6 Stream Frequency variation map of Parri Basin
3.7 A Longitudinal profile of Parri Stream
3.78 Area distance curve
3.8 Hypsometric curve
3.9 Slope category map of Parri Basin
3.10 Slope Profile and Geomorphic units.

3.11 Lineament map.
TABLE:-
3.1 Linear properties of Parr! Basin
3.2 Areal properties of Parri Basin
3.3 Relief properties of Parri Basin
3.4 Spatial Variation of Drainage Density
3.5 Spatial Variation of Drainage Frequency
3.6 Slope and associated Landform Features.
PLATE:-
3.1 Field Photograph Showing Formation of Kankar Nodules as Secondary
· Deposits.
3.2 Field Photograph Showing Meandering of Stream South East of
Rajnandgaon.
3.3. Rocky and Stony Slopes with Scanty Vegetation Seen 1n the Thelkadih
Chaweli area.
3.4 Uplands Geomorphic Unit without Shrubs occurs near Chaweii Muhrum
Khurd Road.
3.5 Field Photograph showing intensive agriculture in the Alluvial Belts, South
of Rajnandgaon.
3.6. Rolling upland slopes merging into lowiying undulating plains.
3.7. Field Photooraoh :Waste Lands in unrlul>ltinn PPrlinl<~in<>

3.1 INTRODUCTION:-
The geomorphological set up of an area largely determine the water
resource occurrence,distribution and management. II provides a sound basis for
evaluating and integrating the natural resources such as water,soll,vegetatlon
and lauduse (Verstappen 1966, Nossln 1970, Singh. 1982, Sudershan 1996,
Ramesh 1999.)The recognition of the drainage basin as fundamental unit of
landform in fluvial terrain {Chorley, 1969) and the drainage basin is the most
commonly analysed in morphometry (Gardiner, 1981 ).The geomophometric
Characteristics of a basin help in understanding the hydrological properties of
the basin.(Horton, 1932, 45, Lambgein, 1947, Miiler1953, Schumm 1956, :.~orisowa
1958, Strahler,1952, 1964, Singh,1997, Singh 1992, Singh & Diwan 1988,1989,
Nair 1994). Hydromorphologicai thematic maps are useful in demarcation of
recharge areas and can be integrated with lauduse/iandcover & soil of watershed
for water resource development.
3.2 REGIONAL GEOMORPHOLOGY:-
The Rajnandgaon tract exhibits contrasting topograghy in relation to
geology.Geomorphology of the study area has been strongly influenced by
iithoiogy,structure and climatic conditions. The area exhibits bonteous geomorphic
set up comprising different geomorphic units belonging Archean to Recent alluvium
deposits.
Regionaily,the study area is dominated by erosional Land forms.The
north western part represents a fairly rugged relief of structural hills of Maika!
range (741 metres amsl) belonging to metasediments and Archeans.The Linear
ridges of quartzites are common. Major streams originate from this zone. To the
east,this zone is bordered by piedmont and pedimented areas,as well as
pedipiains.ln the foot hills the area depicts a vast pediment, the monotony of

which is broken by the residual hill relief around Dongargarh. The famous Mala
Dongrl lies (565 metres amsl) to the north west of Parrl basin. A number of
isolated residual Granitic hills scattered In this zone.The terrain eastwardly
lowering down towards Rajnandgaon plains where Chhattisgarh sedimentary
horizon occupies the lowlying area (below 360 metres).The uplands of
Chhattisgarh undulating plains are characterized by occurrence of laterite as
capping material throughout the area (above 340m-amsl) area. The occurrence of
alluvial sand and gravel deposits Is confined to stream banks and river courses.
A regional geomorphological map (Fig 3.1) has been prepared by
using IRS Satellite imagery.The following predominant geomorphic units have
been delineated.
1) Structural Hills 3) Slopes & Piedmont zone.
2) Residual Hills 4) Pediments
5)Undulating plains 6) Flood plains
3.2.1 STRUCTURAL HILLS:-
The structural hills show clear dip slope and steep escarpment
slopes,occuring in the western part of the study area.The structural hill ranges
trend more or less NNE-SSW. These hills comprises Archean, granite, gneiss,
quartzite, meta sediments of Maikal Range. The exogenic and endogenic forces
that have acted in mounting the landforms most of the region.Maikals had their
impact on the geomorphic characters of the basin as well. Most of these land
forms are covered with thick mixed forests. The forested part of hills exhibit dark
red colour on FCC imagery.
;m

-
80145
difi
To
p
lil -
.,
Tu
mn
bo
d
fJ,~ .0!
~~~ scr•4s'
Stru
ctu
ral
Hills
IND
EX
IIIIJJIJIJIJI P
ed
ime
nt
1111 u
st· 1o
~
Hill S
iop
estP
ied
mo
ntl
I U
nd
ula
ting
Pe
dip
lain
OIIV
SC
AL
E
:15 o
sok
m
:\'I
.. ~
~ .. r: .. z ·(· ·;o
.. : : w
'...
··._(/)
I or(S'o I R
esid
ua
l Hrlls
rtr.·/1 S
trea
m 1 R
ive
r Flo
od
Plar
FIG
3.1 R
egio
nal
Geo
mo
tph
olo
gy
(B
ased on IR
S
sate
llite
data
inte
rpre
tatio
n)

is dominated by Mahanadl fluvial system. This zone exhibits horizontal to gently
sloping lands(3°·5°) with few scattred uplands with laterite cap. This unit shows
high cultivation practice. Mohara, Madanpur, Musra, Tumrlbod, Tllal, Rajnandgaon,
& Durg falls in this zone.
3.2.6 FLOOD PLAINS :-
The flood plain is restricted to seasonal and ephemeral rivers and
streams. it is composed of gravel and alluvial sand. The Seonath and Kharkhara
are the perennial source of water,others are ephemeral in nature. High cultivation
practice is common in this belt as this zone is confined along the banks of river
and its major tributaries.
3.3 GEOMORPHOLOGY OF PARRI NADI BASIN :-
e Parri Nadi lies in the west margin of Great Chhattisgarh plains wl}are
the area is feeded by Seonath fluvial system.The present landscape evolved
predominantly under the fluvial erosion system. Fluvial geomorphological
evaluation is quite useful for water resource study in river basin planning. The
evolution of the landscape of the Parri basin is mainly resulted due to various
natural geomorghic processes like erosion,deposition and peneplanation.
A detailed geomorphic map prepared using aerial photographs
(Panchromatic B & W) scale 1:40,000 photoscale and IRS FCC LISS II data. The
standard recognition criteria for visual interpretation tone, texture, colour, pattern,
association, size and shape have been utilized during mapping of geomorphic
units. Following geomorphic units have been identified and delineated (Fig. 3.2).
1) Uplands
3) Deep buried pediplain
2) Shallow buried pediplain
4) Alluvium I Valley fills

so·
IND
EX
c=J U
pla
nd
/Mo
un
d
~ ~
~
lllililllill ~
~
,.
Pe
dip
lain
s
Sh
allo
w b
urie
d p
ed
ipla
in
De
ep
bu
ried
pe
dip
loin
Ero
sio
n p
ron
e zo
.ne
o' ,
:~~tj~~ B
osu
la
• I
• •
55
' 0
'
SC
AL
E
1.5 0
1.5 f<m
I I
I
f.\(o"'Q,::.,~
~~~~nd
iku1
an
FIG
. 3.2· G
eomorphology o
f Parri
Basin (B
ased o
n A
erial Ph
oto
Interp
retation
)
21°
lo'

The geomorphological map shows that the area Is characterized by gently
undulating pediplain country with uplands,slopes,shallow and burled pedlplains
and valley fills.
3.3.1 UPLAND:-
The upland occurs as capping of laterlte in the basin peripheries and
water divide zones.lt shows a typical erosional surface of pediplains because
these dissected mounds have a flat convex top indicating an earlier erosion
surface. laterite is the product of sub-aerial residual physico-chemical weathering
of country rock. This acts as a recharge zone to the basin ground water and run
off zone for surface water resource.
3.3.2.SHALLOW BURIED PEDIPLAIN :-
The undulating pediplains have concealed with thin soil covers.lt occurs
in the slopes of uplands where terrain lowering down towards middle part of the
basin.The thickness of soil mantle varies from 1 to 2 metres and slope
(2°-2.5°). Limited cultivation is practicised in this unit The ground water potential
zone occur where two or more lineament I fracture intersected.
3.3.3 DEEP BURIED PEDIPLAIN :-
In lowiying areas and deeper zones of the basin thick sediments and
soil concealed the pedipiain.This unit shows mostly agticuitural lands. It is confined
to inner belt of the basin and acts as discharge zone for g.w.
3.3.4 ALLUVIUM FLOOD PLAINS & VALLEY FILLS :-
A narrow belt of alluvial and colluvial flats occupies along the Parri,
Seonath and its major tributaries. Most of the streams have a zone of colluvial
fiat of channel fill with very gentle slope(0°-1°).The alluvial deposits comprising
•

silt, sand & clay have a thickness ranging from,! metre to 4 metres as seen In
some bank sections. The quarternary alluvial deposits found along river course
are good discharge zone.
3.3.5 FLUVIAL FEATURES :-
River Seonath flows from west to east In the south of Rajnandgaon
city and a wide flood plain has been developed by river courses of Seonath. The
most conspicuous geomorphic feature include river cliff, unpaired valley fill terraces
(Fig 3.3).The river on the flood plain have a shifting tendency and develop
meandering scars.Paleochannels in form of meander scars were identified to the
south east of Bharregaon and south of Jhola. Paleochannels acts as potential
ground water reservoirs.(Gautam,1994).
In the flood plain the occurrence of meander scars/old Channels
indicate that the Seonath river has shifted its course from south to north.ln the
flood plain the deranged drainage pattern developed to the south west of Khuteri.A
sand island has been identified at the mouth of Parri. Here the Parri meets with
high water channel of Seonath river which leads to the development of sand
island. The higher part of the channel and island forms nuclei of further deposition
by over bank flows(Sharma,1986).Fioods of moderate discharge build the flood
plains and high flow destroy the earlier flood plain topography. It appears from
aerial photographs that the island can be diveded into two levels, the low level(t1)
and high level terraces(t2).The level t1,has been dissected by channel and this
level shows convexity towards Parri Nadi mouth. The Seonath shows meandering
phenomenon over a long distance. In meandering stream,abandoned channel
depression due to cut off and avulsion lie at different distance from the active
channels(Schumm & Litchy,1963).The old channel seems to spread about 2 Km.
from present active channel of Seonath in the south east of Bharregaon and
between doab of Seonath and Kharkhara river which need detail investigation in

e 25
2!_ os,
_!P
126
~ O
FP
18:1 Kh
ute
ri ip
~7
. . • • .
I ,
/
': -</~;:_~ "!JJ/IfA'f#_ :..=:.---;.-------
-'.V
'{
-'
',
--.o:o.-
... ? -FP, , I"'"'"'
: ':/
' ..
' ' ,
I "
--'
'
' ' •
st,IO'
IN
DE
X
Sca
le
OS
0 IO
km
181 I ro
I~ I S~ep
rive
r bo
nk
--l#
l R
ive
r ch
an
ne
l
;~--i I i[fr'! T
erra
ce le
ver
( FP
! F
loo
d p
loin
• fQ
rn O
ld t lo
od
pro
in
2) I
iis' locij
Old
cha
nn
el
~
Ph
9to
-prin
cipa
l p
orn
t IW
P I W
ate
r po
ol
/--~
/£
(/-
-~ ~~-.-_=-"'::. ~-""'!>-.... ~ -~ ... v-.-r.~>-~v..Y..
181r -
Jrgo
sf' to'
00
S
ettle
me
nt
65
0-B
F
IG3
3 F
LU
VIA
L
. -
GE
OM
OR
PH
OL
OG
Y <
Based o
n A
erial Ph
oto
grap
hs
43A;-2S
'"TO
"'l g )

order to evaluate the water resource utility In adjoining areas.
3.4. DRAINAGE BASIN CHARACTERISTICS OF PARRI NADI:-
The drainage basin is considered as a geomorphic unit. The drainage
area of a basin is the area which contributes water to a particular channel or set
of channels within a drainage basin.
A drainage basin provides a limited unit of the earth's surface within
which basic climatic quantities can be measured and characteristic landforms
described and a system within which a balance can be struck in terms of inflow
and outflow of energy.(Luna B. Leopold,Wolman,Mlller, 1964).Parri Nadi constitutes
a subbasin of Seonath river which is a major tributary of Mah< 1di river system
in western part of Chhattisgarh plains. Drainage Basir, '"' .. ,l<..l is tics of Parri
Nadi has been worked out under linear,areal and relief aspects.The basin has
been analysed morphometrically using Survey of India toposheets as base map,
linear & areal measurement was done by rotameter and plannimeter respectively.
3.4.1 (A) LINEAR PROPERTIES OF PARRI BASIN:-
3.4.1 AI. STREAM ORDER:-
Stream order is the process of identification of links in a stream network
within drainage basin.The Strahler's method (1952, 1964) of stream ordering
system has been adopted in determining stream order in Parri Basin.The stream
order analysis reveals that the Parri Nadi basin belongs to 4th order
basin(Fig.3.4).The run off zone constituted by 1st order streams covering is 63
Sq. Km in Parri basin upper catchment.

8 55
IN DE X Stream Order
J .. ~·'· 151 ORDER
I~
I . p I
J------1 3rd ORDER
4th ORDER
8 55'
8( 0'
I,,
sf o·
8 05'
SCALE 1.5 0 1.5 Km.
\
) .\ )_ .· · .• \'~ ,V •, I
t.·
sf os'
FIG3.4 Stream Order & Drainage Pattern of Parri Basin, RJN.
• 21 IS
2i 10

TA
BL
E-
3.1
LIN
EA
R P
RO
PE
RT
IES
OF
PA
RR
I BA
SIN
Stre
am
N
o. of
Total le
ng
th
Me
an
len
gth
B
ifurca
tion
W
eig
hte
d
Stream
length O
rde
r S
tea
rm
of stre
am
s o
f strea
ms
Ra
tio
B.R
. R
atio u
ord
er
of o
rde
r U
of o
rde
r u R
b=
Nu
/Nu
+1
R
=Lu/Lu-1
Nu
Lu km
L
u=
Lu
/Nu
km
I 161
14
9.6
0
.92
7
4.1
2
2.1
16
II 3
9
76
.7
1.9
66
2
.18
2
3.9
4.5
III 1
0
42
.9
4.2
9
10 5
.78
0
IV
1 2
4.8
2
4.8
0
TO
TA
L IV
211
29
4
Mean V
alue 7
.99
6
.0
4.5 3
.35
9

Nu Rb = Nu+l
Where Rb = Bifurcation ratio, Nu = Number of segment of a given
number, Nu+l =Number of segments of the next higher order.
Bifurcation ratio gives an Idea of the development of drainage In an
area because it is an index of the degree of Integration of streams of various
orders in drainage basin.Low value shows higher degree of drainage
integration. The Parri basin shows an average bifurcation ratio 6.0 is little above
from normal value which ranges between 2 to 5.Thls Indicates that higher
concentration of water from low order (lllrd order)lnto high order(IVth
order)streams because a higher value 10.0 Is observed between these
streams. The high value in lower Parri basin area is influenced by fluvial
geomorphology of Seonath and lithology of the Parri basin.The master Seonath
river is flowing to the south of Rajnandgaon in a meandering channel with a wide
flood plain.Evolution of drainage network in lower reaches decreased
(i-e.frequency) and length of 4th order stream increased,which is responsible for
high bifurcation value between 3rd and 4th order. It is evidenced by sudden
decrease in the width of basin in lower reaches which promote elongation of basin
shape to accomodate itself adjacent to master river.
3.4. A6 WEIGHTED MEAN BIFURCATION RATIO:-
Weighted mean bifurcation ratio (Strahler, 1952) is a representative
value for basin because the average bifurcation value 6.0 does not holds true
value for whole basin.lt is obtained by following formula:-
Rb N + Rb N + -------Rb N Rbw= 1 1 2 2 n n
N + N + N + -----------N 1 2 3 N
Where Rbw = Weighted mean bifurcation ratio Rb1 =Bifircation ratio
between 1st and 2nd order stream N1 =total no. of stream segments involved in

determination of Rb 1 and so on (Singh etal.1997). This Parr! basin gives 4.5004
weighted mean bifurcation ratio which is considered as a representive value for
complete basin.
3.4 A7. STREAM LENGTH RATIO :-
The average stream length ratio of Parrl basin Is 3.359 and value ranges
from 2.116 to 5. 780.11 is the ratio of the mean length of stream of one order to the
next lower order(Horton, 1945).
RL= Lu
Lu-1
Where RL = Stream length ratio, Lu =The mean stream of all stream
segments of the order u, Lu-1 =The mean length of stream segments of the next
lower order.
It is observed that the stream length ratio between 3rd and 4th order
streams shows high value 5.780.This high value is due to excessive length of 4th
order stream which in turn depends on geomorphic stage or development of the
basin.
3.4. 2 B AREAL PROPERTIES OF PARRI BASIN:-
Areal properties of a drainage basin of catchment includes basin
area,length,width and perimeter which determines the areal extent and shape
parameter.(Table 3.2)
3.4.2. B. 1 ELONGATION RATIO :-
It is the ratio of the diameter of a circle having the same area as the
basin and the maximum basin length (Schumm, 1956).
Re = d/Lb or Re = "-.] 2 A I '1T
Lb

TA
BL
E-
3.2
AR
EA
L P
RO
PE
RT
IES
OR
PA
RR
I BA
SIN
Ba
sin
Le
ng
th o
f W
idth
of
Pe
rime
ter
Circu
la-
Elo
ng
atio
n
Are
a
Ba
sin
Ba
sin
tory
Ra
tio
Ra
tio
Au
(Km
2)
Br(K
m)
P(K
m)
E=
2~AITT Lb (K
m)
Rc=
4T
TA
--
p2 L
b
23
5
32 1
3.6
7
4.3
2
35
0
.54
06
Fo
rm F
acto
r L
em
insca
te
Dra
ina
ge
S
trea
m
Ove
rlan
d
Co
nsta
nt o
f ch
an
ne
l D
en
sity F
req
ue
ncy
Flo
w
Ma
inte
na
nce
F=
A/L
2 K
= L2
2L
u
2N
u
1 1
/Dd
4
A
Dd
=
Au
D
f =
Au
2D
C
=
0.2
29
4
Km
2/km
Km
/Km
2 N
o. K
m2
0.2
29
4
1.0
89
3
1.2
51
0
0.8
97
8
0.4
0
.79
93
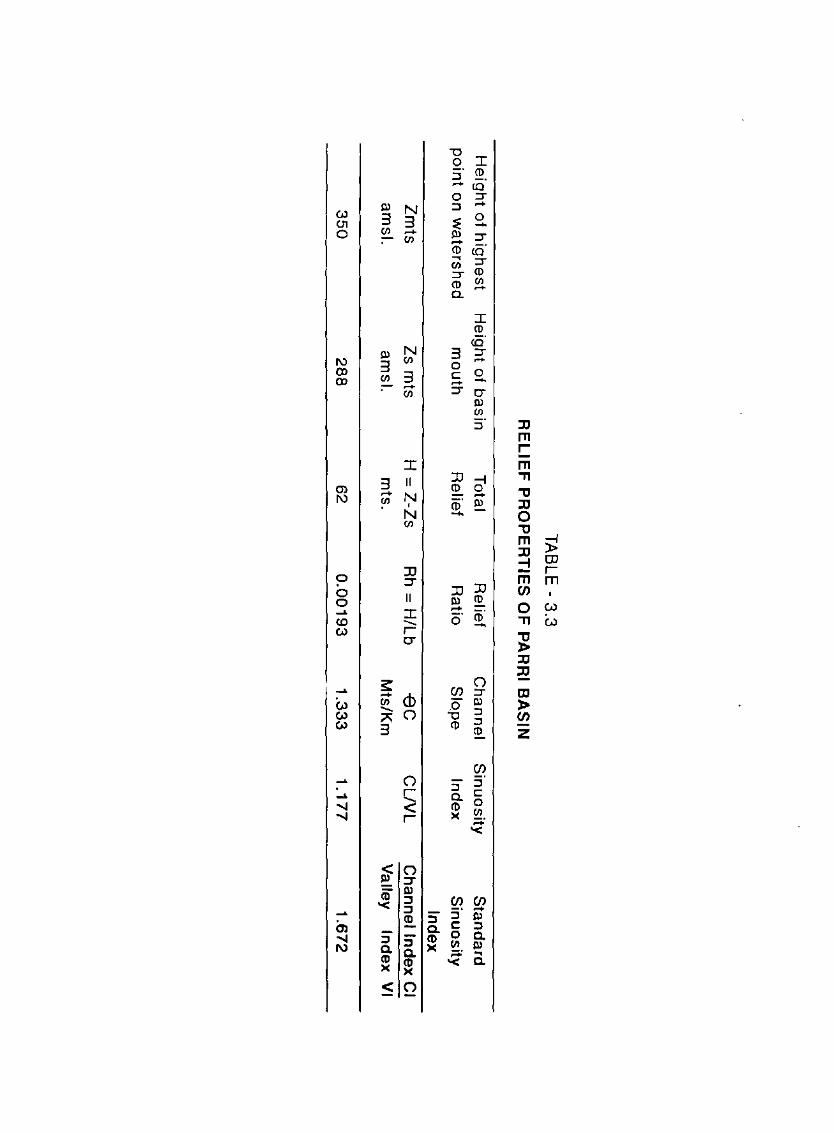
TA
BL
E-
3.3
RE
LIE
F P
RO
PE
RT
IES
OF
PA
RR
I BA
SIN
He
igh
t of h
igh
est
He
igh
t of b
asin
T
ota
l R
elie
f C
ha
nn
el
Sin
uo
sity S
tan
da
rd
po
int o
n w
ate
rshe
d
mo
uth
R
elie
f R
atio
S
lop
e
Ind
ex
Sin
uo
sity
Ind
ex
Zm
ts Z
s mts
H =
Z-Z
s R
h = H
/Lb
-ec
CU
VL
C
ha
nn
el In
de
x Cl
am
sl. a
msl.
mts.
Mts/K
m
Va
lley
Ind
ex
VI
35
0
28
8
62
0
.00
19
3
1.3
33
1
.17
7
1.6
72

Where Re is elongation ratio d Is diameter of a circle of the same area
as the basln,Lb Is max.basln length parallel to the principal drainage line.The
value vary between 0.6 to 1.0.1t Is categorized Into four classes:
Circular
Oval
Less elongated
Elongated
above 0.9
0.8 to 0.9
0.7 to 0.8
below 0.7
Parri basin gives 0.5406 elongation ratio which falls under elongated
class.The ratio gives an idea about hydrological behaviour or character of basin
i-e.a circular basin is more efficient in the discharge of runoff than an elongated
basin i.e. Tc or time of concentration of runoff is less in elongated basin which
leads peak runoff.
3.4.2. 8.2 FORM FACTOR:-
It is the ratio of basin area to the square of basin length (Horton, 1932).
Rf = A/Lb2
Where Rf = Form factor, A = Area of The basin, Lb = Length of the
basin.
Parri basin represents form factor of 0.2294.This low value indicates
elongated shape of the basin in which geometrical relationship of the basin area
and length involved.
3.4.2.8.3 CIRCULATORY RATIO:-
This shape factor is influenced by drainage density,drainage
frequency, geological structure,vegetation and land cover of catchment.lt is a ratio

of basin area to the area of circle having the same perimeter as the basin
(Miller, 1953).
Rc = Area of Basin
=
Area of Circle with same perimeter as Basin
4TIA p2
Where Rc = Basin Circulatory, A= Area of Basin, P = Basin Perimeter.
The Parri basin having 0.5346circulatory ratio which exhibits elongated
basin shape.
3.4.2.B.4 LEMINSCATE:-
Chorley (1957) introduced leminscate as shape parameter of drainage
basin.lt is stated as:-
L2 K= --
4A
Where L = Length of Basin, A= Basin Area.
The Parri basin having above one leminscate (1.0893) which reveals
that the basin is elongate. it is concluded that elongation ratio, circulatory ratio, form
factor,and Jeminscate parameters indicates that the Parri basin is elongate in
shape and hydroligically it signifies accordingly.
3.4.2.8.5 DRAINAGE PATTERN:-
Drainage pattern is the spatial arrangement of the streams
segments.The drainage patterns classified into eight basic
categories(Howard, 1967) but Parvis(1950) have described six basic and twenty
four modified basic patterns.The Parri basin shows dendritic drainage pattern
which indicates uniform resistance and homogenity in lithology. (Fig. 3.4)

3.4.2.8.6 DRAINAGE DENSITY:-
It is a ratio between total length of stream of all orders within a basin
and the basin area (Horton, 1932).The Parrl basin shows an average drainage
density value of 1.2510 Km/Km 2 • This gives an Idea of spacing of stream
segments.Low drainage density is favoured In region of highly resistant or highly
permeable sub soil materials. Under dense vegetation and low relief. Where as
high drainage density is favoured In region of weak or Impermeable subsoil
materials, sparse vegetation and mountain relief(Chow, 1964). The drainage density
of Parri basin has been found high as It is influeuced by shaly terraln.A drainage
variation map (Fig 3.5) of Parri basin is prepared from 1:50,000 scale toposheet.For
the measurement of density toposheet is divided into one square Km grid.This
map depicts that one third area comes under v.low drainage density zone and low
drainage density occupies half of the basin whereas high drainage density found
over laterite mounds with limited extent. The map also shows that values above 2
Km/Km 2 occurs in pockets in central part of the basin and confined particularly
within low lying areas. (Table 3.4)
Drainge density is the network extent and is of considerable
hydrogeological and geomorphological significance since it is an index of which
measures both the nature of dissection within the basin and extent of
hydrogeologically significant network (Gardiner, 1981 ).
3.4.2.87 DRAINAGE FREQUENCY:-
It is an index of drainage texture of the basin (Horton, 1945) and denotes
total numberofchannel of streams per unit area within basin. The Parri Nadi basin
shows average drainage frequency of 0.8978/Km2. The drainage frequency ranges
from 1 to 8.0 (west of Madanpur).A drainage frequency variation map (Fig. 3.6)
has prepared which shows that about 40% of the basin area comes under very

TA
BL
E-
3.4
SP
AT
IAL
VA
RIA
TIO
N O
F D
RA
INA
GE
DE
NS
ITY
S.N
o. C
lass
D.O
. Va
lue
A
rea
%
C
um
mu
lative
%
km I km
2 K
m2
Are
a
Are
a
1. H
igh
a
bo
ve 3
0.5
6
0.2
4
0.2
4
2. M
ed
ium
2
-3
34
.10
1
4.5
1
14
.75
3. L
ow
1 -
2 1
23
.57
5
2.5
8
67
.33
4. V
ery L
ow
le
ss tha
n1
7
6.7
7
32
.67
1
00
.00
TA
BL
E-
3.5
SP
AT
IAL
VA
RIA
TIO
N O
F D
RA
INA
GE
FR
EQ
UE
NC
Y
S.N
o.
Cla
ss S
trea
m
Are
a
%
Cu
mm
ula
tive %
F
req
ue
ncy
Km
2
Are
a
Are
a
No. km
2
1. V
ery H
igh
a
bo
ve 6
4 1
.70
1
.70
2. H
igh
4
-6
1.4
4
4.2
6
45
.96
3. M
ed
ium
2 -4
3
3
14
.04
6
0.0
0
4. L
ow
b
elo
w 2
94
4
0.0
0
10
0.0
0

D ' '
'
~ ITIII1lliiill
Seale 1.5 0 1.5 I I I
DUM TARA
INDEX DRAINI,GE DENSITY Km/ Km2
Less than 1
1-2
2-3
Above 3
J.S Drainage- Density variation map, Parri Basin
zf IS'

--
INDEX !Hream 1 reqLiency Km/Km2
above 6 KM/KM2
4-6 KM/KM2
2-4 KM/KM2
Below 2 r.M/KM2
• Ghoturo
I
\ \ I I
\
••
'· ! I
I 6""' ,
Stream Frequency Variation Map,Parri Basin, RJ N.

basin (Schumm,1963).This is evidenced in Parri basin where due to low relief,
the mean channel gradient of the main valley, decreases the carrying capacity of
load in the channel. The sediments of bed load deposited between Nawagaon
Khapri Kalan and Dhaba to confluence point due to low carrying capacity of stream
bed load of the channel & pronounced soil erosion In upper reaches.
3.4.3.A3 SINUOSITY INDEX:-
The term meandering is applied to sinuous channel that exhibits a
certain degree and regularity of sinuosity. Seonath river and Parri Nadi both
contains sinuous channels.Sinuosity index is the ratio between Channel length
(CL) and river valley length (VL).It varies from 1.0 to 4.0 or more,stream having
sinuosity index below 4.0 are called sinuous and more than this are called
meandering (Leopold,Woolman,and Miller, 1969). According to this classification
Parri is a sinuos river which gives sinuosity index 1.177.
3.4.3.A4 STANDARD SINUOSITY INDEX :-
It is the ratio of channel index and valley index which obtained by
dividing channel and valley length with their respective air distances. On the basis
of this index basin may be classified into three stages of development 1. youthful
(less than 1.5) 2. Early Mature (1.15 to 1.30) 3. mature (more than 1.30) (Mueller,
1968). It is observed that Parri basin attains mature stage. (SSI 1.672)
3.4.3. AS LONGITUDINAL PROFILE:-
A longitudinal profile of Parri Nadi (Fig 3.7 A)' is concave to sky,but some
portions are convex. It shows that there is a maximum fall in relief occurs in the
first 1.4 km.lingth of stream then it gradually decline when it reaches to the plain.lt
shows concave sloping curve between 350 and 320 metres above mean sea level. it
represents that the river posses mature stage and equilibrium condition. Area

NN
W
NN
E
36
0
35
0
en 34
0
E
111 33
0
en ll>
3]0
... ll>
= 3
10
c: ll>
3:1
)
"'0 ~
~ 2~#0
...... <
(
' J.6
mtk
m ~~:711] /frll]
2 4
6 8
10 12
14 16
18 2
0
22
2
4
26
2
8
30
3
2
34
3
6
38
4
0
42
4
4
46
Ho
rizo
nta
l d
ista
nce
in
( ,o oo
me
tres)
FIG
. 3.7
A
PA
RR
I M
AIN
S
TR
EA
M
PR
OF
ILE

Distance curve (Fig 3. 7B) Indicates that mid profile of Parrl represents 73% of
the basin area.
3.4.3. A6 HYPSOMETRIC ANALYSIS :-
The hypsometric curve of Parri basin is obtained by plotting h/H and a/
A perecentages in ordinate and absissa.The hypsometrlc analysis of Parr! basin
indicates that 51.93% of basin area remains as solid mass arrJ the basin has
progressively reaching monadnock phase of erosion and at present, It attained
the mature stage of equilibrium.(Fig 3.8).
3.5 SLOPE ANALYSIS :-
The slope of a drainage basin is an important variable which not only
shaping the geometry of the basin but also determines the development and
management practices of drainage basin or watershed.A slope map of Parri basin
was prepared from Topo sheets on 1:50,000 Scale with 10 metres contour interval
to understand the terrain, nature of upland and river valleys. (fig. 3.9)
The Parri basin is divided into grids of one sq. km. and average slope
value is determined by using Wentworth's (1930) formula which is stated as.
Tan 8 = Nc xI
636.6
Where Nc = Number of Contour crossing I Km2 , I =Contour interval in
metres.
3.5. A SPATIAL DISTRIBUTION OF SLOPE & GEOMORPHIC UNIT:-
The Parri basin has been into four high (above 3°), moderate (2°-3°),1ow
(1°-2°) and very low (below 1°) slope classes. The area represents an undulating
plain country except a small area in the northern part of dissected upland which

~ 9
c:: t'll
-~ u u Q
)
-Ill t> "'0 c::
5 u c:: 0
4' >-Q
)
.0
Ill Q
) .._
<(
7 3'/o
, .... , "' ~ :l
~ lO_l_ ______ ,_-----.-------r------~-----,----~~------~~----~~-----::-----~~--~~~~
~
0
0 8
16 3
2
36 4
0
44
46.5
20
24
28
4
12
Dis
tan
ce
in
K
m
from
p
oin
t of
ou
tflOw
o
f P
arri
Na
di
FIG
3.7
8 A
RE
A-
DIS
TA
NC
E
CU
RV
E

--h--.4
J: ...... .c. ..... .c. .2> Q
)
J: Q
.l >
·-..... ctl Q
)
a:
roT----------~
8 6 4 2
Eq
uilib
rium
(Ma
ture
) Sta
ge
Y=
htH
Hyp
so
me
tric
Integral..:-0
-5193
X=
a/A
04
------.-
-----.-
-----.-
-----r-----4
0
2 4
6 8
10
Re
lativ
e
Are
a
a1A
FIG
. 3.8
H
YP
SO
ME
TR
IC
CU
RV
f S
HO
WIN
G
ER
OS
ION
S
TA
GE
O
F
PA
RR
I BA
SIN

-1
1
TlkRAPARA
IN DE X
o'
Slcipe in degree
Above 3
2-3
1- 2
Below 1
o'
Scale 115 0 1.5 KM
I!!~ !!!!!51 iiiiiit'
21°
10'
FJG3.9 Slope category map,Parri Basin,RJ N.

shows convexity, with more than 3° slopes. The areal extent of different slope
classes shows that slope category less than 2° occupy 73% while the slope class
above 3° occupy only 7% of the area.Thls Indicates pedlplalned nature of the
terrain.The slope categories are correlated with landforms of the basin (Table
3.6) which can be utilised for landuse management practices. It Is observed that
buried pediplains having low to very low slope classes and mostly occupied by
agricultural lands.A slope profile of Thelkadih-Hardl section Is Illustrated in
Fig.(3.1 0) which shows major geomorphic units adjacent to Parrl & Seonath.
3.6. LINEAMENT/FRACTURE ANALYSIS:-
A lineament map (Fig. 3.11) of Parri basin has been prepared using
satellite data IRS LISS II FCC,1 :125,000 scale. it shows that the Parri basin exhibits
two major directions of lineament striking NNW-SSE and NNE-SSW. Lineament
map depicts that NNW-SSE is the prominent direction along which fracture and
joints have been oriented,because in this direction 60% fractures aligned, which
is also the main axes of Parri basin in Upper reaches.On the basis of lineament
study and well inventory studies cross sections A, B, C & Dare m,•;ke· tS G.W.
potential sites for exploitation. Here major lineaments cut perpendicular to each
other leads development of favourable zone for groundwater occurrence.Being
poor aquifer zones available in the Parri basin the lineaments are major tool in
targetting g. w.

--,. $ E
NN
E
I i3 <>: "' __, w
I
.s • 1--
::I: 3
40
iii E
32
0
UP
LA
ND
ti
:t45
' Q
) "0
3
00
S
LOP
E
..3 5"56'
:.::; -
;;: 2
80
--
--+--I
-+-s.o
Ho
rizo
nta
l
ssw
s. s~ .....
-~o
------------~.~.n~.~~-~~----~.--.-.-.. -.----' -~
0 a: <(
I
iJo D
ista
nce
in
<poo me
tresl
FIG
.3.10 Geom
orph
ic -
Units
in T
heJkadih -Hard
i Slope P
rofile, Parri
Basin

st' o'
SCALE
If i L5Km
I
INDEX
1----1 Lineament
1-=-o-::.:: I G W Potential Site
1----·-·-j Drainage Basin Boundary
FIC'J.ll,Lineament Map or Parri,leads G.W. Targetting
21" 15'

PLATE 3.1 FIELD PHOTOGRAPH SHOWING FORMATION OF KANKAR NODULES AS SECO NDARY DEPOSITS.
PLATE 3.2. FIELD PHOTOGRAPH SHOWING MEANDERING OF STREAM SOUTH EAST OF RAJNANDGAON .
-

PLATE 3.3. ROCKY AND STONY SLOPES WITH SCANTY VEGETATION SEEN IN THE THE LKAD IH CHAWELI AREA.
PLATE 3.4 UPLAND S GEOMORPHIC UNIT WITHOUT SHRUBS OCCURS NEAR CHAWELI MUHRUM KHURD ROAD.

PlATE 3.5. FIELD PHOTOGRAPH SHOWING INTENSIVE AGRICULTURE IN THE ALLUVIAL BELTS SOUTH OF RAJNANDGAON.
PLATE 3.6. ROLLING UPLAND SLOPES MERGING INTO LOWLYING UNDULATING PLAINS.

.
I
\ ,
PLATE 3. 7. FIELD PHOTOGRAPH;WASTE LANDS IN UNDULATING PEDIPLAINS.
PLATE 3.8. OCCURRENCE OF SHALLOW BURIED PEDIPLAIN IN LOWLYING AREAS : SUBDUED TOPOGRAPHY.