African Civilizations West East Axum Ghana, Mali Songhai South Great Zimbabwe.

INTERNATIONAL JOURNAL OF SCIENTIFIC & TECHNOLOGY RESEARCH VOLUME 5, ISSUE 10, OCTOBER 2016 ISSN 2277-8616
84 IJSTR©2016 www.ijstr.org
Geological And Geotechnical Investigations Of Axum Dam Site, Tigray, Northern Ethiopia
Leulalem, S.B., Dr. Kifle W., Prof.Nata T.
Abstract: Geological and geotechnical study was conducted in concrete gravity dam which is planned to be constructed in the Maychew River 40 km south of Axum town for the purpose of water supply for the town. The objectives of this research were: to map geology of the area, to characterize geological defects within and around dam site, to evaluate the water tightness of the dam site, and to determine the bearing capacity of the dam foundation. The research involved: review of different literatures, lithological and structural mapping, characterizing rock masses by using different rock mass classification methods, interpretation of subsurface data (geophysical, core drilled data, test pit data etc.). Results of the study indicate that the area is underlain by Quaternary sediments, metasedimentary and metavolcanic rocks. The Quaternary sediments are characterized by low permeability, low plasticity and are poorly graded nature. Metasedimentary rocks are found covering the right abutment of the dam whereas at reservoir area it is found intercalating with metavolcanic rocks. These rocks are moderately jointed and sheared with faulting and folding noticed; due to these they have a relatively high permeability. Metavolcanic rocks which are found covering the left abutment are strong, less permeable and fractured. Most of discontinuities such as fractures, bedding and foliation in the study area are oriented E-W, NNW-SSE and NNE-SSW. The VES, tomography and drilled core result revealed that the potential problems (seepage/leakage) could occur due to presence of faults, joints, karstified black limestone, lithological variations, groundwater depth and topography at right abutment. Differential settlements may also occur because empirically estimated moduli of deformation (Ed) of rock masses indicate that for right abutment much less than left abutment and different geological defects across the dam axis. To minimize these problems contact grouting and consolidation grouting are recommended as mitigation measurements. Keyword: Geological, geotechnical, Maychew, watertighness, Axum, Dam, Water supply, investigation.
————————————————————
I. Introduction
1.1 Background and Justification
Globally, dams are built to store water for irrigation, municipal use, hydropower electricity generation, and/or flood prevention. Size and complexity of dams range from small and structurally simple constructions in small streams to large and structurally more complex dams in large rivers. The type and design of individual dams depends on factors such as amount of available water, topography, geology, and type and amount of local material available for constructing the dam. Because dam is, almost always, a unique work, adapted to the morphology and the strength of the foundation, and also to the hydrological regime of the river. The dam, and the impounded water, interact with a great mass of terrain, very far away sometimes from the dam itself. The design and construction of a dam are complex and casuistic, difficult to standardize. It is widely accepted as good practice to fix the most important properties of a dam foundation referring them to some quality index (i.e. seismic history of the area, weathering degree of the rocks and discontinuity conditions). The other important engineering properties of rocks and/soils were evaluated for dam are mainly permeability (frequently expressed in Lugeon units and cm/s), shear strength of the foundation (mass cohesion and friction in most cases), and terrain deformability. The dam must retain water, have enough safety against sliding and adjust itself to the terrain deformations without too much cracking in service. Dams are used for water supply, irrigation, hydropower and many other purposes.
The failures of dams; not only cause economic consequences, but also adversely affects the environment and value of life. In addition, the populations are at risk in locations down streams of major dams. As solution to these problems [48] stated that geological and geotechnical investigation of a dam site selected for detailed evaluation is directed to determination of geological structures, stratigraphy, and faulting, foliation and groundwater conditions at dam foundation and reservoir area, including the abutments. Previous experiences of dam construction in Tigray and other parts of Ethiopia show that many of the dams have defects related to several factors, among which are geological and geotechnical problems. This research deals with investigation of a newly planned dam to be constructed in Axum area (across the Maychew River) in Tigray, northern Ethiopia at approximately 40km south of Axum town.
1.2. Objectives of the study
1.2.1 General Objective The major objective of this research were the watertighness, foundation condition and stability of the dam site and to recommend mitigation measures 1.2.2 Specific Objectives
To map lithological distribution of rocks present in the area,
To identify and describe structural defects such as faults, joints, solution channels in the rocks,
To determine and characterize the depth of groundwater, and
To determine the geotechnical properties of rocks and soils in the dam foundation and reservoir area.
________________________
Leulalem, S.B., Dr. Kifle W., Prof.Nata T.
Arba Minch University Department of Geology, Arba Minch, Ethiopia
Mekelle University Department of Earth Science, Mekelle, Ethiopia Email: [email protected]

INTERNATIONAL JOURNAL OF SCIENTIFIC & TECHNOLOGY RESEARCH VOLUME 5, ISSUE 10, OCTOBER 2016 ISSN 2277-8616
85 IJSTR©2016 www.ijstr.org
1.3 Materials and Methods
1.3.1 Materials used The following materials were used in this research work: The basic materials were topographic map (scale 1:10,000), Burton compass, Geological hammer, full equipment of imaging terrameter, drilling rig to take rock samples, measuring tape, HCl (diluted) , Altimeter, Hand lenses and sampling bugs etc. 1.3.2 Methods To achieve the major objective and the specific objectives, the following methods and activities were used. These are review of previous works; geological method, drilling and geophysical methods. 1.3.2.1Geological method This method/activity is very important method to decide the purposed area is suitable to construct hydraulic structures. The shape of river valley and the geological formation of both abutments were well identified through this method. Based on this method different rock types are classified stand on their genetic type. The thickness of each lithology and the orientation of geological structures were measured in the field in different out crops. Identification of vertical and horizontal extent of each lithology was characterized on out crops, river cuts, road cuts and hill sides. The orientations of geological structures were measured by using Burton compass and thickness of each lithology was measured by using tape meter. For the detailed engineering geological study, traverses were made on and around the proposed reservoir area, dam axis, downstream, upstream and abutments. The engineering properties of the rock and soil were noted based on observation. From the rocky outcrops, the rock type, discontinuities, infilling materials, weathering degree, strength, and probable seepage/leakage condition were recorded. The geomorphological features, types of surface deposits and their depth were also noted in the field. During soil survey, the field identification made on their origin and geologic features i.e. alluvial, colluvial and residual soil. The rock samples were used geologic hammer by estimating their geotechnical properties of rocks. Rock mass condition along the dam axis and abutments was based on geological mapping on rock outcrops. 1.3.2.2 Test pit and Core drilling method Totally 19 test pits drilled on the reservoir area. These test pits were drilled by man power up to 0.7-2.6m to take soil sample and measure the thickness of layered soil. In this stage the research work seriously observed and characterized the in situ setting or arrangement of different soil layers on the walls of drilled test pits. These test pits also used to analyze the weathered topography of rock beneath different soil layers. Finally, the permeability potential of the rock was characterized based on the freshness of fracture, type of infill material and aperture of discontinuities noted out from each test pit. Rotary core drilling rig selected to take rock sample from
different depth. The focused lines to drill for core samples were dam axis, abutments, downstream and reservoir area. The drilled samples were put in sampling box. In the graduated sample box simply measured to calculate RQD and to identify different parameters for RMR classification. The major parameters characterized during core drilling and from sample box were moisture conditions of rock, discontinuity spacing, discontinuity conditions and groundwater depth. 1.3.2.3 Permeability measuring method To characterize the soil permeability by using constant head and falling head methods. Constant head method used to characterize the permeability of coarse soil in the laboratory. Falling head method used for test the permeability of fine soil in the field. For laboratory test disturb and undisturbed soil samples collected from reservoir, abutments and around dam axis. Lugeon test used to characterize the permeability of weathered and fractured rock in the dam axis and abutments. By using this method, the research work characterized the average hydraulic properties of rock mass. The test conducted in five stages; with particular water pressure magnitude associated with each stage. A single stage consists of keeping a constant water pressure at the test interval for 10 minutes by pumping as much water as required. The first stage is held at a low water pressure, increasing the pressure in each subsequent stage until reaching PMAX. Once PMAX is reached, pressures are decreased following the same pressure stages used on the way up, thus describing a ―pressure loop‖. 1.3.2.4 Rock classification method As we know there are a number of engineering classification methods of rock for different design purpose. Although there are different types of rock classification, this research works was used rock mass rating system to characterize rocks in the area. This geo-mechanics classification of rock is the special method which applied during rock classification because it is used for foundation, mining, tunneling and slope stability. This classification system to calculate RMR value of rock by using different parameters such as uniaxial compressive strength of rock material, rock quality designation, spacing of discontinuities, condition of discontinuities, groundwater condition and orientation of discontinuities. 1.3.2.5 Geophysical method This special method is used to know the geological defects at very great depth and to know the lithological horizontal and vertical variation in the area as well as groundwater condition. The imaging and VES locations identified along dam axis, downstream, abutments and reservoir area. To measure vertical electrical sounding the selected method was Schlumberger electrode array. The Schlumberger array is particularly suited to this technique, because Schlumberger array has some specific advantages. This method basically to know the vertical
INTERNATIONAL JOURNAL OF SCIENTIFIC & TECHNOLOGY RESEARCH VOLUME 5, ISSUE 10, OCTOBER 2016 ISSN 2277-8616
86 IJSTR©2016 www.ijstr.org
succession of each lithology, the depth of ground water level, the presence of buried geological defects and to
identify thin weak layer sandwiched between two lithological layers.
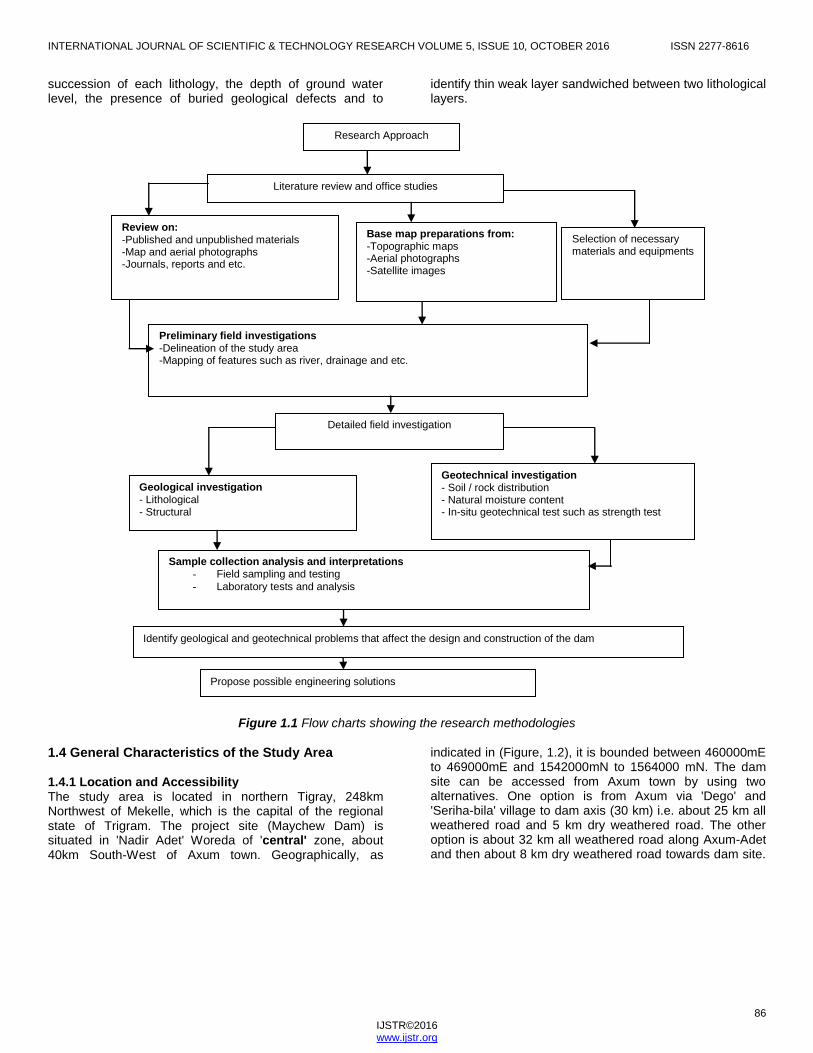
Figure 1.1 Flow charts showing the research methodologies
1.4 General Characteristics of the Study Area 1.4.1 Location and Accessibility The study area is located in northern Tigray, 248km Northwest of Mekelle, which is the capital of the regional state of Trigram. The project site (Maychew Dam) is situated in 'Nadir Adet' Woreda of 'central' zone, about 40km South-West of Axum town. Geographically, as
indicated in (Figure, 1.2), it is bounded between 460000mE to 469000mE and 1542000mN to 1564000 mN. The dam site can be accessed from Axum town by using two alternatives. One option is from Axum via 'Dego' and 'Seriha-bila' village to dam axis (30 km) i.e. about 25 km all weathered road and 5 km dry weathered road. The other option is about 32 km all weathered road along Axum-Adet and then about 8 km dry weathered road towards dam site.
Research Approach
Literature review and office studies
Review on: -Published and unpublished materials -Map and aerial photographs -Journals, reports and etc.
Base map preparations from: -Topographic maps -Aerial photographs -Satellite images
Selection of necessary materials and equipments
Preliminary field investigations -Delineation of the study area -Mapping of features such as river, drainage and etc.
Detailed field investigation
Sample collection analysis and interpretations - Field sampling and testing
- Laboratory tests and analysis
Geotechnical investigation - Soil / rock distribution - Natural moisture content - In-situ geotechnical test such as strength test
Geological investigation - Lithological - Structural
Identify geological and geotechnical problems that affect the design and construction of the dam
Propose possible engineering solutions

INTERNATIONAL JOURNAL OF SCIENTIFIC & TECHNOLOGY RESEARCH VOLUME 5, ISSUE 10, OCTOBER 2016 ISSN 2277-8616
87 IJSTR©2016 www.ijstr.org
Figure 1.2 Location map 1.4.2 Physiography, Climate and Vegetation Cover 1.4.2.1 Physiographic Conditions Topographically, the study area is characterized by mountain ridges, gentle to steep slopes, gorges and valley plains. It is highly undulated and rugged terrain. Due to its rugged topographic nature, settlement is widely sparse.Thus, the communities living around the area are settled in the valley plains which are morphologically flat plain and around gentle slope hillsides.
Figure 1.3 Topographic map of the study
1.3. 1.4.2.2 Climate The area is characterized by one rainy season and two dry seasons during the year. The rainy season is in the month of May-September and the dry seasons are January-April, and October-December. The mean annual rainfall in the Axum and its surrounding area is 737.57mm [47]. The highest rainfall of the area is recorded in July and August,
which accounts above 57% of the total mean annual rainfall of the study area where as the minimum rainfall is exhibited in December and January, which only accounts about 1.3% of the total mean annual rainfall [47]. The monthly air temperature of the area is ranging from 17.7
0C in
December to 20.90C May/June and the mean annual air
temperature is 19.70C.The highest values of maximum
INTERNATIONAL JOURNAL OF SCIENTIFIC & TECHNOLOGY RESEARCH VOLUME 5, ISSUE 10, OCTOBER 2016 ISSN 2277-8616
88 IJSTR©2016 www.ijstr.org
mean temperature was found to be 11.20C at August and
the lowest values of minimum temperature was 6.30C in
December, whereas the highest and the lowest values of maximum mean temperature were 32 .1
0C in May and
28.20C in September, respectively. The minimum and
maximum mean temperatures are 8.90c and 30.4
0C,
respectively. The annual average of temperature is 3.20C.
1.4.2.3 Vegetation Cover The vegetation cover of the study area is mainly bushes, shrubs, grasses and with scattered trees such as eucalyptus, and others in certain areas especially along hillsides and valley plains of the study area. Besides to the vegetation condition, the major crops that grow in the area are teff, sorghum and maize.
2. GEOLOGY The Precambrian basement rocks of the Axum area comprise weakly metamorphosed acidic to basic lava and pyroclastics and, volcanoclastic, detrital and chemically precipitated marine sediments. Pioneers [11;12; and 27] have indicated that the Precambrian low grade rocks of the Axum area, by and large, have preserved primary igneous and sedimentary structures. The rocks of metavolcanic category outcrop mostly all around the dam reservoir forming topographically high (elevated) area. Exposures of this unit within the study area have also been observed in different locations together with the metasediments [20]. The metavolcanics mostly have a sharp contact with the metasediments particularly those cropping out with in the study area; a mean orientation of N40ºE was measured, in fact parallel to the orientation of the foliation. Those forming the surrounding big mountains on the other hand show a tectonic or fault contact with similar mtavolcanics units in the downthrown side. The rocks of these units characterized by fine-to coarse-grained metavolcanic rocks which specifically expose in the north, east, central part of the reservoir area and left abutment of the dam foundation. Their colour varies from greenish to whitish grey. This lithologic unit is relatively massive but there are some open joints around foundation and left abutment. There are joints which are open but there are also some joints oriented northeast-southwest and filled by quartz, calcite and clay. Fine grained metavolcanic rock has fresh colors of mostly grey to green. When it is altered, its weathering colors are variable; it turns black, purple and yellow to yellowish white. It is fine grained with no visible crystals. The outcrop of this unit is found at the bottom of the left dam axis where it is ―overlain‖ by the crystal rich metavolcanics. It also outcrops in small proportions on the mountainous hills of the Metavolcanics. It is massive and highly to moderately welded. In areas where it is friable it has tuffaceous nature. It is also affected by clear and persistent foliation oriented across the river with strike and dip between N34º–42ºE/60–75ºNW. The foliation orientation, which is again the same as the bedding has strike and dip between N27º–30ºE/39-56ºNW. Coarse crystalline metavolcanic rock which has light green color to grayish green color with visible dark grey colored crystals in a grey green to yellowish green
matrix. The diameter of these crystals reaches 0.5cm. The crystal appears to be a mafic mineral (either amphibole or pyroxene. This unit is the dominant unit throughout the areas mapped as metavolcanic units. In the mountain made of the metavolcanics it is a dominant units. It also outcrops on the downstream of the proposed dam site. Its outcrop is also found on the core of the antiform at the reservoir area. This metavolcanic unit in addition to the units described below also has minor calcareous sandstones [2], quartzites, welded tuffs, and topographic bump forming granite intrusions at all the places. These granites mostly cut across the foliation in some places are affected by two sets of fractures; N60ºW/52ºSW with joint aperture of ~3cm and spacing ranging from 2- 50cm, and a second set oriented due N/77ºNW.
2.1 Intercalation of Metasediment and Metavolcanic Rocks
These intercalated units outcrop dominantly within the dam reservoir and rims of the reservoir area. The intercalation consists of fine and coarse grained metavolcanic units, and metasediments such as black limestone, phyllite and slate. The metavolcanic rock intercalated with metasedimentary rocks is massive and highly to moderately deformed [1], and dipping 240
0-310
0/10
0-40
0 together with
metasedimentary rocks. Although rocks of this unit is relatively massive than metasediment, but in areas where it is friable it has tuffaceous nature. It is also affected by clear and persistent foliation oriented parallel to the bedding with strike and dip between N34º–42ºE/60–75ºNW.
2.2 Metasedimentary Rocks
The meta-sedimentary units outcrop fundamentally within the Dam reservoir area occurred within a depression intercalated with metavolcanics unit and these rock units mostly cover northwestern and western parties of the study area. The lithological units grouped under this include, black limestone, phyllites, greywackes, slates and fine grained metavolcanic rocks. 2.2.1 Phyllite/ Slate These phyllite and slate are more prominent in western side of the reservoir area and right abutment of the proposed dam foundation.Megascopically the rocks are fine-grained and show well developed foliation in phyllite and slaty cleavage in slate (Figure 2.1). These rocks are characterized by different types of local folds, relicts of sedimentary beddings, highly weathered and show a range of colours such as light grey, dark grey and green. The top highly weathered rock is filled by clay leachates and expected to have low permeability but the underlying materials have foliations and open joints parallel to the river direction and can have adverse effects on leakages of the expected reservoir water. In the phyllite and slate units there are quartz veins widespread in the right abutment of the study area. They occur along shear zones and other discontinuities. These quartz veins are commonly metamorphic upset and occur almost in all metamorphic rocks mapped in the study area.

INTERNATIONAL JOURNAL OF SCIENTIFIC & TECHNOLOGY RESEARCH VOLUME 5, ISSUE 10, OCTOBER 2016 ISSN 2277-8616
89 IJSTR©2016 www.ijstr.org
Figure 2.1 Phyllite/slate along the right abutment
2.2.2 Black Limestone The black limestone is black in color and the weathered part is grayish in colour (Figure 2.1). It outcrops within the dam reservoir area and at the top of right abutment, as two layers of narrow ridge forming unit. These two layers of black limestone rocks are developed between other metasediment rocks (e.g. slate and phyllite). They are almost parallel to each other and their alignment is north-east and south-west strike; and the distance between two layers is wider towards the right abutment. The one which found in the right or down side ridge(block) forming black limestone layer of the
measured thickness about 4 to 10 m and at one point it’s bulged maximum 18 m in thickness. This layer is grayish black in color and sometimes pink, interbedded with clay component. The one in the left side block forming black limestone layer is thicker than right one and its thickness is 15 to 20 m. At the bottom of this layer there is lenticular quartzites are intermittently occurred and 10 to 20 m in length and 0.5 to 1 m in thickness. These two black limestone layers form small ridges in the top and back of the right abutment ridges of the dam foundation (Figure 2.1).
Figure 2.2: Limestone unit from right abutment
Near to reservoir area on the right side, there is also black limestone which is characterized by thinly laminated white and black bands and thin bedding with bed thickness from few cm to 15 cm. It also forms blocks of many smaller beds with individual block size between about 20cm to 60cm. Moreover, variegated phyllite intercalated with this limestone was observed (Figure 2.2) at several places. The limestone also shows hollow structures and other dissolution features across the strike. The thin beds and the foliation planes are sub-parallel within the two observed bands of the limestone. 2.3.3 Meta-Greywacke The term greywacke is used for dark grey, firmly indurated, coarse grained sandstone that consist of poorly sorted, angular to subangular grains of quartz and feldspar, with a
variety of rock and mineral fragments embedded in a compact clayey matrix and containing an abundance of very fine grained illite, sericite and chlorite minerals [10]. This rock unit outcrop western side of the proposed reservoir area or right abutment of the dam axis and covers small area. It is typically characterized by dark grey and green or brown sandstone, owing to secondary clay cement (Figure 2.3). Petrographical and mineralogical analyses have been used to know the fabric and mineralogical properties of greywacke. It is weakly metamorphosed. Under microscope it is composed of subrounded grains of quartz and feldspar as major constituents with rock fragments as well. The plagioclase feldspar and rock fragments white in specimen makes up around 43% and are highly altered with dominantly clays materials covering the feldspar surfaces; the quartz has also a dirty surface

INTERNATIONAL JOURNAL OF SCIENTIFIC & TECHNOLOGY RESEARCH VOLUME 5, ISSUE 10, OCTOBER 2016 ISSN 2277-8616
90 IJSTR©2016 www.ijstr.org
and constitutes about 25% of the field of view but relatively their surface is clean. The matrix shows some sheering appearances with dark colored materials probably clay minerals occurring between grains. Fine grained sericite and epidote occur in small quantities replacing the highly altered plagioclases. Because the percentage of the white colored feldspar is high, the original rock could be partly
arkosic. So, this rock is a weakly metamorphosed greywacke to the lower parts of greenschist facies. Weathering is the main factor that weakens the greywacke. The thickness of the highly weathered closely jointed sandstone measured from borehole 8 is about 2-4 meters. The weathering of the greywackes decreases gradually and progressively with increasing depth.
Figure 2.3: Metagreywacke in the northwestern area
2.3.4 Unconsolidated Deposits The Quaternary deposits that identified during field investigation include colluvial and alluvial types. 2.3.4.1 Colluvial Deposits Colluvium occurs at the base of the steeper slopes and consists of clayey silt and sand with angular cobble and boulder rock fragments. This deposit ranges from 0.2 to 0.8m in thickness. The colluvial deposits is found at the right and left sides of the central valley of the dam foundation and at the foot of mountains/ ridges. The grain size characterization of these deposits shows that, they are with large variations consisting clay, silt, sand, cobbles and large fragments of rocks. As encountered by borehole MA-BH3 the thickness is about 0.8m.
2.3.4.2 Alluvial Deposits The alluvial deposits are found along the banks and bed of the prevailing Maychew River. It is a thin layer where the depth decrease as one ascends on both sides of the banks. The depth adjacent to the river is 3-4m and these soils are composed of clayey-silt, sand, gravel and cobble. The gravels and cobbles are mostly derived from basalt, sandstone and metavolcanics. Their source is from upstream including Axum town and nearby catchments. The upper parts of alluvial deposit more dominated by clayey-silt and at bottom are dominated by sand, gravel and cobbles.

INTERNATIONAL JOURNAL OF SCIENTIFIC & TECHNOLOGY RESEARCH VOLUME 5, ISSUE 10, OCTOBER 2016 ISSN 2277-8616
91 IJSTR©2016 www.ijstr.org
Figure 2.4: Geological map of Axum dam site and cross section along B-B’
3. Result and discussion
3.1 Engineering Properties of Soils and Rocks.
3.2. Description and Characterization of Soils and Rocks As described in chapter two, in addition to colluvial-alluvial deposits, the typical lithological units that make up geology of the area are: metasediment and metavolcanic rocks. As can be noted from the geological map of the area (Figure 2.4) there is surficial lithological variations along the dam axis and different geological defects were found in the dam foundation and reservoir area. However, to confirm the above mentioned variability subsurface geological and geotechnical investigations were carried out. Data from, borehole logging, packer testes, geophysical resistivity imaging and vertical electrical sounding, and different laboratory geotechnical data were used to interpret the subsurface geological conditions. 3.2.1Test Pit Log Descriptions of Soils Several soil units with different engineering properties were encountered and mainly include alluvial, colluvial, and residual soils. Soils from test pits excavated on alluvium were found to fine dominant in the shallow depth and coarser at depth. The color of these soils is reddish brown and with depth the wetness of soil was found to increase. These alluvial soils are stream deposited sediments consisting of silt, sand, gravel, cobbles and boulders which become coarser with depth. This unit has an observed thickness up to 1-3.2m. Residual soil- this type of soil was identified in the test pits which were excavated in the flat land in the reservoir area. It is dominated by fine soil in upper part and then rock fragments of meta-sediments and meta-volcanic are followed. These soils, mostly characterized by their reddish brown color are moist at the contact with the underlain rock. These residual soils are found to have low plasticity and permeability. The thickness of the residual soils ranges from 0.8 to 1m; with greater thickness at the center of the proposed reservoir area. Colluvial soil- this type of soil was recognized nearby foots of mountains; and test pit logs excavated in these area shown that the soil is a mixture of clay, silt, sand and large fragments of rocks. This soil is characterized by reddish to yellowish brown color, dry and weathered with highly fractured rock fragments. The observed thickness ranged from 1 to 3m, and no gradational sequence was observed. Generally, all the trial pits of vertical log show that at shallower depth the soils are dominated by silty-clay to fine
sand, loose, and dry with low plasticity and permeability. Underlying these soils are dull to dark gray, highly to moderately weathered fine grained metavolcanics and dull to light gray, moderately to highly weathered fine grained metasediments; degree of weathering decreases with depth. Near to river channel the upper layer of soil is composed of dark brown, stiff, dry, low plastic silt clay with angular to sub rounded gravel size rock fragments of different origin; followed by boulders and cobbles of metavolcanic origin. 3.2.2 Description of Soils Soil samples collected from field were analyzed in the laboratory for their physical characteristics which include grain size, density, moisture, and soil consistency. 3.2.2.1 Grain Size Distribution The particle size analyses for the samples from clay borrow area, sand borrows, and near to foundation area was analysised as follows. The dominant grain size by percentage passed is silt; therefore most of the result shows that soil is silty-clay and some of them also silty-sand. The grain size distribution (Figure 3.1) of the soil particles shows that the soil in study area contains from fine material to coarse materials. The soil is named as poorly sorted or well graded. Due to poorly sorted and fine dominated behavior of soil, the permeability of the soil in the study area is very low as shown in (Table 16). As can be observed from Figure 3.1, the representative soils are non uniform.

INTERNATIONAL JOURNAL OF SCIENTIFIC & TECHNOLOGY RESEARCH VOLUME 5, ISSUE 10, OCTOBER 2016 ISSN 2277-8616
92 IJSTR©2016 www.ijstr.org
Figure 3.1: Grain size distribution
3.2.2.2 Atterberg Limits Soil samples collected from dam (foundation and borrow area) were analyzed in the laboratory to determine the consistency of the different soils. As indicated in Table 3.1, the liquid limit values of the soils range from 30% to 34%,
and the plasticity index varies from 10% to 14%. The soils in the study area are therefore classified under low Plasticity and liquid limit values. The evaluated laboratory results (Table 3.1) shows the minimum and maximum plasticity limit of 18% and 20% respectively.
Table 3.1: Plasticity of soil
Test pit no Locations Depth,(m) Sample type Atterberg Limit
LL% PL% PI%
TP25 Reservoir 2 m Disturbed 30 20 10
TP24 Riverbank 2 m Disturbed 34 20 14
TPD1 Downstream 0.85 m Disturbed 30 18 12
TPD2 Downstream 0.8 m Disturbed 32 19 13
3.2.3 Engineering Characterization of Soils 3.2.3.1 Compaction Behavior of Soils Soil samples were analyzed for their compaction behavior in the laboratory using impact Peroctor compaction apparatus. The maximum dry density ranges from 1.55-2.12g/cm
3;and optimum moisture content fall between 8.75-
25.7%.
3.2.3.2 Unconsolidated-Undrained Shear Strength of Soils One of the most important design input parameters needed for geotechnical design is soil’s shear strength. Shear strength tests were carried out on representative soils samples and results are indicated in (Table 3.2) The cohesion values of soils in the study area have minimum 17kPa and maximum 85kPa; and friction angles of soils of the study area also ranges from 4
0-50
0.
Table 3.2: Shear strength parameters
Test p no Depth (m) Sample type OMC % MDD (g/cc) δ3(kPa) δ1(kPa) С (kPa) Φ deg.
TPU1 0.8 Undisturbed -- -- 97 104 28 38
TPU2 0.8 Undisturbed -- -- 97 151 66 41
TP5 2.3 Disturbed 17.7 1.74 -- -- 17 9
TP7 2 Disturbed 25.7 1.55 300 543 49 8
TP14 1.3 Disturbed 17.5 1.73 450 662 23 9
TP23 2 Disturbed 12.8 2.05 -- -- 185 19
TP35 2.4 Disturbed 19.6 1.73 97 172 117 29
SMS02 -- Disturbed 8.75 2.22 97 136 43 44
SMS04 -- Disturbed 11.7 1.99 97 135 35 47

INTERNATIONAL JOURNAL OF SCIENTIFIC & TECHNOLOGY RESEARCH VOLUME 5, ISSUE 10, OCTOBER 2016 ISSN 2277-8616
93 IJSTR©2016 www.ijstr.org
SMS05 ---- Disturbed 6.5 2.26 97 182 69 50
SMS06 -- Disturbed 9.1 1.96 97 140 54 41
SMS07 -- Disturbed 8.8 2.14 97 151 58 45
SS02 2.3 Disturbed 12.4 1.92 97 156 56 46
TP02 2.2 Disturbed -- -- 300 432 48 4
TP03 1.0 Disturbed -- -- 300 431 185 19
TP06 -- Disturbed -- -- 300 1134 185 19
Note: OMC=optimum moisture content; MDD= Maximum Dry Density, δ3= confining stresses of soil;δ1= Uniaxial stress of soils; С=Cohesion and Φ=friction angle
3.2.4 Characterizations of Rocks Rocks of the study area are characterized by lithological and structural discontinuities. The lithological variation as indicated in geological map of the dam site ( Figure 4.19) the right abutment is dominated by more fractured and weathered metasediment rocks and left abutments characterized by relatively less fractured and weathered metavolcanic rock. The reservoir area is dominated by intercalation of metasediments and metavolcanics. The dominant geological structures, as described in chapter four, include: fault, joint, fold, shear zone and bedding planes. The following sections deal with detailed characterization of the rock masses in the study area. 3.2.4.1 Core Log Description of Rocks A total six boreholes (oriented vertically) were drilled during feasibility geotechnical study of Maychew dam site. As can
be noted from Table 5, boreholes MA-BH3 and MA-BH4 were drilled at dam foundation, whereas MA-BH1, MA-BH2, MA-BH5 and MA-BH7 were drilled on the abutments. A total depth of 196.5m was drilled. The total depth of MA-BH1 is about 50m (log is shown in Figure 3.2) and was drilled at the right abutment. The core samples of these boreholes show that at shallow depth discontinuities are filled by fine grained soils but at depth (beyond 25m) almost all discontinuities are filled with calcite minerals In addition to core logging about 36 Lugeon tests were conducted in conjunction with the drilling. The core logging information from exploratory drilling works includes depth to bedrock and groundwater Table, lithology, color, and degree of weathering, discontinuity conditions, total core recovery (TCR), rock quality designation (RQD) and bedding. Detailed information on core descriptions is presented in Tables 5.
Figure 3.2. Core log from borehole one, (MA-BH1) (Note: Log depth measured in metre)

INTERNATIONAL JOURNAL OF SCIENTIFIC & TECHNOLOGY RESEARCH VOLUME 5, ISSUE 10, OCTOBER 2016 ISSN 2277-8616
94 IJSTR©2016 www.ijstr.org
Table 3.3: Average Lugeon value
No BH-ID Location Depth(m)
Coordinates
Field Permeability Tests
Easting Northing Elevation
Lugeon values
1 MA-BH1 Right abutment/top 50.55 467637 1541963 1717 7
2 MA-BH2 Right abutment/slope
23.85 467687 1542024 1684 2
3 MA-BH3 Terrace/right (foundation)
29.60 467725 1542072 1672 5
4 MA-BH4 River bed(foundation)
36.12 467788 1542151 1663 7
5 MA-BH5 Left abutment/slope 15.13 467808 1542173 1677 1
6 MA-BH7 Left abutment 41.25 467847 1542224 1712 1
3.2.4.2 Unconfined Compressive Strength of Rocks The mechanical properties of core samples were established from tests such as RQD and TCR measures and UCS tests. Unconfined compressive strength (UCS)
values of metasediment and metavolcanic rocks at the Maychew dam site are categorized as very low to low strength rocks according to [22].
Table 3.4: Physical properties and UCS of rocks
Description Depth,(m) Unit Wt (Kg/m3) UCS MPa
Standards, source: Brown, 1981. Range of UCS of intact rock in MPa
MA-BH2 6.8-7.02 2807 16.326 >250 Extremely strong
MA-BH3 6.76-6.95 100-250 Very strong
MA-BH3 23.4-23.6 2745 22.717 50-100 Strong
MA-BH4 6.62-6.93 2745 24.534 25-50 Medium strong
MA-BH4 16.34-16.5 5-25 Weak rock
MA-BH4 26.21-26.4 33.970 1-5 Very weak
MA-BH5 3.40-3.60 2827 36.216 <1 Extremely weak
3.2.4.3 Rock Quality Designations (RQD) of Rocks Table 3.5, shows the calculated RQD values of the rocks at the research site. This value shows that the frequency of fracture or fracture density decreases from right to left side of the dam (MA-BH1 to MA-BH7). The locations of the boreholes are plotted on the geological map of the dam site
(Figure 4.21). According to RQD classification proposed by [23], the rock quality designations of the rocks at Maychew dam site have the following distribution: 66.67% fair and 33.33% poor (Table 3.5). RQD values of the rocks dam site were found increase with depth. At deeper levels, the fractures are filled with calcite.
Table 3.5: Average TCR and RQD values
Borehole No Location Total Depth (m) TCR and RQD (Av. Value)
Rock classes
TCR RQD
MA-BH1 Right abutment 50 85.6 43.3 Poor
MA-BH2 Right abutment 23.85 91.75 31.6 Poor
MA-BH3 Terrace/R 29.60 87.7 54.4 Fair
MA-BH4 River bed 36.12 96 61.7 Fair
MA-BH5 Left abutment 15.13 86.9 72.2 Fair
MA-BH7 Left abut. 41.25 96.9 72 Fair
Note: TCR=Total Core Recovery; RQD= Rock Quality Designation
3.3 Rock Mass Characterization of the Study Area
Rock masses of the dam site were characterized by using spatial distribution of rock fractures, borehole log descriptions, evaluation of packer test and unconfined compressive strength in the laboratory. This rock mass characterization is needed because the proposed dam will be constructed on rock foundation. The stability and deformability of the rock is dependent on the strength and deformability of the rock mass [34]. The index properties of intact samples were evaluated in the laboratory. The factors
that affect the rock masses are presence of discontinuities, which include bedding surfaces, joints, faults, shear zones and well developed metamorphic foliation. 3.3.1 Characterizations of Discontinuities Orientation, spacing, continuity, surface characteristics, the separation of discontinuity surfaces, and the accompanying thickness and nature of filling material are most consistently measured fractures properties, or factors.

INTERNATIONAL JOURNAL OF SCIENTIFIC & TECHNOLOGY RESEARCH VOLUME 5, ISSUE 10, OCTOBER 2016 ISSN 2277-8616
95 IJSTR©2016 www.ijstr.org
a. Orientation of discontinuities The most willingly obvious influence of the orientation of discontinuities on rock mass strength is noticeable in the failure of rock slopes along one or more discontinuities [58]. During discontinuity surveying, this research work mostly focusing the steepness of discontinuities and how they intercept the existing slope (i.e. include dip and strike). However, in the following Tables 8and9 the dip direction of discontinuities is opposite to slope face. This confirms that
there is almost no slope problem in the study area at right abutment but in left abutment generally the slope is gentle and there is no exposed slope faces. But the main potential problems related to orientation of discontinuities around right abutment are seepage/leakage. Because there is another valley beyond the right abutment and most of those discontinuities dipping towards this valley, specially bedding partitions outcrop in the next valley.
Figure 3.3: Orientations of fold limbs
b. Aperture and frequency of discontinuities During field study frequency is surveyed in terms of unit length of a sample from a given rock mass. Closely spaced discontinuities are dominantly observed on metasediment in the right abutment of dam site. The average aperture of the discontinuities represented in Table 8 and 9. These show that relatively apertures in metha-volcanic rocks are less than in metasediment; and frequency of discontinuities in metasedimentary rocks is also denser than metavolcanic rocks. c. Continuity of Discontinuities Although it appears to be contradictory, discontinuities are themselves discontinuous. During field investigation of discontinuities were measured on an exposed rock surface. Major discontinuities such as faults and relicts of bedding planes extend from about a meter to a few kilometers. Smaller features (for example, joints) extend for much shorter distances. Some joint sets extend through a number of beds in the study area, whereas other sets terminated after a few bed thicknesses or even a single bed. Different discontinuities such as faults and bedding partition about
1m-2km are found in right abutment and reservoir area. These need special consideration during construction phase because they may affect excavation and water tightness of the dam site as well as bearing capacity of foundation. d. Surface characteristics of discontinuities During field work fracture surface irregularies were considered as one factor. As identified in the field the discontinuity surfaces characterized as wavy or undulating, rough and the side of wall conditions. Fracture surface roughness is a measure of the inherent surface unevenness and waviness of the discontinuity relative to its mean plane. The roughness of discontinuities of the dam site is characterized by small scale waviness and large scale unevenness of a discontinuity. It is the principal governing factor the direction of shear displacement and shear strength. Roughnesses also distinguished in north-western part of the study area are small scale surface irregularity or unevenness and large scale undulation or waviness of the discontinuity surface.

INTERNATIONAL JOURNAL OF SCIENTIFIC & TECHNOLOGY RESEARCH VOLUME 5, ISSUE 10, OCTOBER 2016 ISSN 2277-8616
96 IJSTR©2016 www.ijstr.org
Figure 3.4: Some kinematic indicators and steps on the proposed fault surface.
e. Infilling Materials The infilling materials of discontinuities in the dam site include clay, silt and fine sand materials that occur between the walls of the fracture. Where aperture or separations occur, the space is mostly filled by clay and calcite mineral. Not only clay material filled opening of discontinuities but also some are filled by calcite. Moreover, core log revealed
that discontinuities at relatively greater depth are filled with calcite mineral than clay mineral. From engineering point of view the discontinuities filled by calcite mineral is stronger than filled by clay mineral. Although the type of infill material has influence on engineering behavior, its thickness in all study area is immeasurable.
Table 3.6: Summary of discontinuity measurements (right abutment) Station-01(0467694, 1541962, 1713m; 0467686, 1542023, 1685m)
Type Dip/ Dip direction Spacing(cm) Aperture(mm) Infill
Bedding 32/280 20-40 0.1-0.9 Clay
Joint 40/310 19-55 0.6-1 Open
Joint 55/240 21-62 0.3-2 Clay
Joint 33/300 10-95 0.7-2.1 Open
Table 3.7: Summary of discontinuity measurements (left abutment and foundation)
Station-o2 (0467725, 1542071; 0467404, 1542189)
Type Dip/ Dip direction Spacing (cm) Aperture (mm) Infill
Joint 82/220 100-120 0.2-0.8 Open
Fault 19/280 - - Open
Joint 60/020 80-140 0.1-0.31 Open
Joint 80/160 60-70 0.22-0.9 Open
Joint 40/290 70-130 Tight Clay
Joint 80/350 60-90 Tight Open
Figure 3.5: Orientation of fractures (rose diagram one-from right abutment and two from left abutment) 3.3.2 Weathering Condition of Rocks The weathering of the metamorphic rock has resulted in formation of a crust of weathering, the thickness of which is negligible at the river bed and thickness increases towards the upper elevations of the banks. In the dam foundation, the gorge slopes are composed of talus and alluvial
deposits having a maximum total thickness about 5 m. These deposits are characterized by low shear strength and permeability. The river channel section is composed of slightly jointed hard rock. In the upper part of the river bank the thickness of the highly weathered rock reaches 4-6 m.

INTERNATIONAL JOURNAL OF SCIENTIFIC & TECHNOLOGY RESEARCH VOLUME 5, ISSUE 10, OCTOBER 2016 ISSN 2277-8616
97 IJSTR©2016 www.ijstr.org
Figure 3.6: Weathered phyllite and slate
Weathering is exceptionally deep under the left bank ridge of the right abutment of the dam, especially in the phyllite and slate bed. The bedrock of this part is distorted and sheared by faults, through which calcite and quartz intrusion has developed in to the bedrock. The depth of weathering depends on the composition and degree of fissuring of bedrock. Along faults in rocks which are more susceptible to weathering, the penetration of weathering reached more than 23.6 m (BH1).This deep weathering is common along the bands of limestone and phyllite/slate. The limestones within the zone of weathering are subjected to karstification. In the weathering profile the following sequence of layers has been identified from core log; (from top to bottom):
1. Residual soil; 2. Completely weathered rock; 3. Highly weathered rock; 4. Moderately weathered rock; 5. Slightly weathered rock; 6. Fresh rock.
The above items 2 to 6 are commonly referred to as the bedrock. Residual soil/weathered rock mantle covers most of the right side of the project area. Fresh rock is exposed along the river channels and high ridges. 3.3.3 Rock Mass Rating (RMR) [15] of the South African Council for Scientific and Industrial Research (CSIR) used ―rock mass rating RMR‖ to classify rock quality, which is as follows [33]: Very good (RMR = 100-80); Good (80-60); Fair (60-40); Poor (40-20); and Very poor (20-0). This geomechanics classification system provides a general rock mass rating (RMR) increasing with rock quality from 0 to 100. It is based upon five universal parameters: strength of the rock, drill core quality, groundwater conditions, joint and fracture spacing, and joint characteristics. A sixth parameter, orientation of joints, is entered differently for specific application in tunneling, mining, and foundations. By using the above mentioned six parameters RMR was calculated and provided Table3.8.
Table 3.8: Rock mass rating (RMR) values and its classification of rocks in the dam site
ID UCS(MPa) RQD% GW condition Joint spacing
Joint characteristics Joint orientation
RMR Classification of rock mass
ABH2 16 (R1=2) 31.6(R=8) Damp(R3=10) 200-600mm (R4=10)
Slightly rough surfaces Separation < 1mm Highly weathered walls(R5=20)
Dip 30
0-60
0
Favorable (R6=-2)
RT=48 Fair
ABH3 23(R1=2) 54.4(R2=13) ---(R3=10) RT=53 Fair
ABH4 25(R1=4) 61.7(R2=13) ----(R3=10)
0.6-2m (R4=15)
Slightly rough surfaces Separation < 1mm slightly weathered walls (R5=25)
Dip 60
0 -90
0
Very favorable (R6=0)
RT=67 Good
ABH4 34(R1=4) 61.7(R2=13) Wet(R3=7) RT=64 Good
ABH5 36(R1=4) 72.2(R2=13) ---(R3=10) RT=67 Good
Bieniawski (1989); RT=R1+R2+R3+R4+R5+R6
(Note: UCS= Unconfined Compressive Strength; GW= Groundwater; RMR=Rock Mass Rating) 3.3.4 Rock Mass Deformability Rock masses are far from being continua and consist essentially of two constituents: intact rock and discontinuities. The existence of one or several sets of discontinuity planes in a rock mass creates anisotropy in its response to loading and unloading (Serafim and Pereira, 1983). Also, compared to intact rock, jointed rock shows increased deformability in directions normal to those planes. Furthermore, discontinuities create scale effects.
Since laboratory tests on small scale samples are usually found inadequate, to predict the deformability of rock masses, field tests are necessary (Bieniawski and Orr, 1976). All in situ measurements of the modulus of deformation used today are time – consuming, expensive, imply operational difficulties, and the reliability of the results of these tests are sometimes questionable (Palmstrom and Singh, 2001; Hoek and Diederichs, 2006). Because of this, the deformation modulus is often estimated indirectly from

INTERNATIONAL JOURNAL OF SCIENTIFIC & TECHNOLOGY RESEARCH VOLUME 5, ISSUE 10, OCTOBER 2016 ISSN 2277-8616
98 IJSTR©2016 www.ijstr.org
classification systems (Palmstrom and Singh, 2001). There are empirical equations for indirect estimation of the deformation modulus of the rock mass (Em). Three approaches can be followed to account for the effect of joints on rock mass deformability: an empirical approach, a discrete approach, an equivalent approach. But in this research work due to data limitations, an empirical approach was used to estimate deformability of rocks. To classify rock mass quality and to estimate rock mass
modulus equation 2.2 was used. Results of the calculations are summarized in Table 11. 3.3.5 Estimation of Rock Mass Shear Parameter/ Strength The shear parameters of the rock masses are calculated using the relation of Bieniawski (1989): this the following table (11) estimated by using different related cohesion formulae.
Table 3.9: Rock mass deformation modulus of Maychew dam site
Class Deformation modulus (GPa) Cohesion (C), MPa
Angle of friction(Ф)
RMR-RMR1989 Obtained from empirical equations.
II(good) 67 26.6 3.35 38.5
II(good) 64 22.4 3.2 37
II(good) 67 26.6 3.35 38.5
III(fair) 53 11.9 2.65 31.5
IV(poor) 48 8.9 2.4 29
The calculated values of rock mass rating in Table 3.9 reveal that the RMR value increase from left to right. Similarly, modulus of deformation values increase from right to left.
3.4 Assessment of Rock Slope Stability
The study area is dominated by different rock types. Though assessment of slope stability in rocks is usually done through kinematical analyses, limit equilibrium analyses and numerical methods such as finite element
method, in this research work slope mass rating method was used. Slope Mass Rating (SMR), is calculated based on values of Rock Mass Rating (RMR), other joints and slope orientation calculated according to [51]. The calculated value of SMR are given in Table 12, which indicates the calculated value lies on I and II class (very good and good), stable having not planner or big wedges failure of SMR and don’t needs to be corrective measures in the slope. The calculated result matches the slope condition and characteristics of the Maychew dam site.
Table 3.10.Adjustment rating of F1, F2, F3 and F4 for joints
Table 3.11: Classification of Rock Slope according to SMR
SMR Class Description Stability Failure Support
SMR3, SMR4, and SMR6 I Very good Completely stable None None
SMR1,SMR2 and SMR5 II Good Stable Some blocks
Some times
(Note SMR= Slope Mass Rating)
The rock slopes having different orientation and height are cut at the dam site. It is important to determine if these rock slopes are safe. The right slope has a slope angle of 42° and dip direction angle of 060° and the left slope has a slope angle of 30° and dip direction angle of 240°.
According to slope mass rating classification there is no slope instability problem.
Location P|αj –αs| T|(αj -αs) -180| |βj| βj –βs
SMR=RMR+(F1.F2.F3)+F4
N1541976, 467638E
800
(F1=0.15) -------- 82
0
(F2=0.1 32
0 (F3=0) SMR1=63
N1542025, 467687E
200
(F1=0.7) ----- 19
0 (F2=0.15 -21
0 (F3= -60) SMR2=68
N1541896, 467723E
500
(F1=0.15) ---- 60
0 (F2=1) 10
0 (F3= -6) SMR3=81.1
N1542224, 467847E
400
(F1=0.15) ----- 80
0 (F2=1) 30
0 (F3=0) SRM4=82
N1542175, 467812E
100
(F1=0.85) ---- 40
0 (F2=0.85) 10
0 (F3= -6) SRM5=77.7
N1542193, 467839E
500
(F1=0.15) ----- 80
0 (F2=1) 30
0 (F3=0) SRM6=82
Method Natural slope
Presplitting Smooth blasting Blasting/Ripping Deficient blasting
F4 +15 +10 +8 0 -8

INTERNATIONAL JOURNAL OF SCIENTIFIC & TECHNOLOGY RESEARCH VOLUME 5, ISSUE 10, OCTOBER 2016 ISSN 2277-8616
99 IJSTR©2016 www.ijstr.org
3.5 Groundwater Conditions
The knowledge of groundwater condition is essential for various engineering works. Because the engineering
behaviors of ground conditions are depend on fluctuation and depth of groundwater level affects the foundation of different engineering structure.
Table 3.12: Measurement of Groundwater levels at Foundation and abutments
BH No Location Reference points Elevations Depth to water
(m) Borehole Depth
(m)
MA-BH1 Right abut. O.G.L 1717 46.6 50
MA-BH2 Right abut. - 1684 Null 23.85
MA-BH3 Terrace/R -- 1672 14 29.6
MA-BH4 River bed - 1663 0.5 36.12
MA-BH5 Left abut. - 1677 10.3 15.13
MA-BH7 Left abut. - 1712 25.8 41.25
Groundwater levels were measured during core drilling. As can be, noted from Table 3.12, the static groundwater level varies along the dam axis: higher at both sides of the river. In the right abutment the groundwater level is deeper than left abutment. When the dam is impounded, the gradient of groundwater flow could be toward the right abutment.
3.6 Hydraulic Properties of Rocks
In order to analyze the water tightness of the geological formations; hydraulic conductivity testing has been carried out using two approaches: gravity permeability test in weak portion of the formations, and pressure test (Packer test) in relatively hard rock formations. 3.6.1 Packer /Lugeon Test This method was used to estimate rock mass permeability in the field, and was conducted in boreholes drilled at the proposed dam foundation and abutments. Results of the packer test revealed the following conditions (Table 3.13):
a) Turbulent Flow: The hydraulic conductivity of the rock mass was found to decreases as the water pressure increases. As can be observed in Table 3.13 and Appendix E, there are different turbulent flows. This behavior is characteristic of rock masses exhibiting partly open to moderately wide cracks. These types of discontinuities are interpreted to exist at surface and at depth.
b) Dilation: Similar hydraulic conductivities are observed at low and medium pressures. However, a much greater value of permeabilities are recorded at the maximum pressure. This behavior – which is sometimes also observed at medium pressures – occurs when the water pressure applied is greater than the minimum principal stress of the rock mass, thus causing a temporary dilatancy (hydro-jacking) of the fissures within the rock mass. Dilatancy causes an increase in the cross sectional area available for water to flow, and thereby increases the hydraulic conductivity.
c) Wash-Out: Hydraulic conductivities were found to increase as the test proceeds, regardless of the changes observed in water pressure. This behavior indicates that seepage induces permanent and irrecoverable damage on the rock mass, usually due to infillings wash out and/or permanent rock movements.
d) Void Filling: Hydraulic conductivities were found to decrease as the test proceeds, regardless of the changes observed in water pressure. This behavior indicates that either: (i) water progressively fills isolated/non-persistent discontinuities, (ii) swelling occurs in the discontinuities, or (iii) fines flow slowly into the discontinuities building up a cake layer that clogs.
Table 15: Summary of Lugeon interpretation practice
Flo
w
typ
e Pressure stages
Lugeon pattern calculated for 10min. run
Description RepresentativeLugeon value
Dil
ati
on
(B
H1)
Lugeon values vary proportionally to the water pressures. The maximum Lugeon value is observed at the stage with the maximum water pressure.
Lowest Lugeon value recorded, corresponding either to low or medium water pressures (1st, 2nd, 4th, 5th stage).
T otal pres s ure vs Intake
0 100 200
3.68
4.65
5.55
4.65
3.68
To
tal
pre
ssu
re (
bar
)
0
0
7
4
1
0 5 10

INTERNATIONAL JOURNAL OF SCIENTIFIC & TECHNOLOGY RESEARCH VOLUME 5, ISSUE 10, OCTOBER 2016 ISSN 2277-8616
100 IJSTR©2016 www.ijstr.org
Tu
rbu
len
t (
BH
1)
Lugeon values decrease as the water pressures increase. The minimum Lugeon value is observed at the stage with the maximum water pressure.
Lugeon value corresponding to the highest water pressure (3
rd
stage)
W
ash
ou
t (B
H3)
Lugeon values increase as the test proceeds. Discontinuities’ infillings are progressively washed-out by the water
Highest Lugeon value recorded (5
th stage)
3.6.2 Falling Head Test The variable head (falling head) test was done within soil or different formations where the packer test is not applicable to perform. This method was applied in MA-BH3 and MA-BH7 in section length of 3.39m and 4m respectively. The test value is summarized in the Table 16. The values of falling head test, minimum of 2.42x10
-5and maximum of
2.75X10⁻⁵
.
3.6.3 Constant Head Test The test was conducted within different sections where the packer test is not applicable to perform and the drop down is relatively fast. This method was applied in MA-BH1, MA-BH2 and MA-BH5 and their measured value is summarized in the Table 3.14.
Table3.14. Summary of permeability (Falling and Constant head) result
Borehole Locations Stage depth Stage length Permeability k(cm/s)
MA-BH1 Right abutment 2.9-4.7 1.8 7.51X10⁻⁵
-- 3-9.1 6.1 6.09X10⁻⁴
--- 40-45 5 2.02X10⁻⁴
MA-BH2 Right abutment 0.3-7.55 7.25 High intake
-- 6.8-11.8 5 5.76X10⁻⁴
MA-BH3 Terraces to right. 3-6.39 3.39 2.42X10⁻⁵
MA-BH5 Left abutment 3.6-8.6 5 1.66X10⁻⁴
MA-BH7 Left abutment 1-5 4 2.75X10⁻⁵
Generally, the above Table reveals that the permeability of soils and rocks of the left abutment is greater than the right abutment. 3.6.4 Laboratory Permeability Test To determine and characterize hydraulic conductivities of the soil deposits, laboratory permeability test was conducted using falling head test method. The results are described in the following table (3.15).
19
17
15
17
19
0 10 20
T otal pres s ure vs Intake
0 20 40 60 80 100 120
2.30
3.30
4.20
3.30
2.30
0
2
5
6
9
0 5 10
T otal pres s ure vs Intake
0 200 400 600 800
6.35
7.90
9.52
7.90
6.35
To
tal p
res
su
re (
ba
r)

INTERNATIONAL JOURNAL OF SCIENTIFIC & TECHNOLOGY RESEARCH VOLUME 5, ISSUE 10, OCTOBER 2016 ISSN 2277-8616
101 IJSTR©2016 www.ijstr.org
Table3.15: Laboratory permeability value
Test Pit No Location
Depth,(m) Sample Type Specific Gravity
Permeability (cm/s) Northing Easting
TP05 1542213 467507 0-2.3 Disturbed 2.74 1.27X10⁻⁷
TP07 1542362 467570 0-2 ----- 2.69 9.75X10⁻⁹
TP14 1542403 467365 0-1.3 ----- 2.61 5.64X10⁻⁹
TP18 1542627 467790 0.6-2 ----- 2.75 7.6X10⁻⁹
TP22 1543044 468546 1.7-2.6 ------ 2.65 3.86X10⁻⁸
TP23 1543171 468739 0-2.2 ------ 2.63 3.08X10⁻⁶
Figure 3.7. Engineering geological map of the dam site and surrounding

INTERNATIONAL JOURNAL OF SCIENTIFIC & TECHNOLOGY RESEARCH VOLUME 5, ISSUE 10, OCTOBER 2016 ISSN 2277-8616
102 IJSTR©2016 www.ijstr.org
3.7 Geoelectric Resistivity Survey
The aim of this study was to investigate the continuities and/or discontinuities of subsurface lithologies and structures, which could have considerable engineering implications for the dam. Two types of electrical resistivity techniques were used to evaluate the subsurface rock masses, which are: A.2-D resistivity imaging survey was applied to obtain images of the lateral extension of the subsurface materials. B.Vertical Electrical Sounding ―VES‖ was used to determine the depths of the subsurface rock boundaries and their electrical resistivities. Geoelectric
resistivity measurements using Schlumberger configuration on 3 Vertical Electrical Sounding stations were carried out around the proposed dam foundation. 2D resistivity imaging was done along dam axis and on the both abutments. From the geoelectric resistivity survey geological conditions were interpreted, which include delineation of the different layers, and geological structures identified by using the distribution of resistivity in the subsurface layers. In addition, the lateral and vertical extents of the resistivity anomalies were determined. Location of the geoelectric survey is given in Figure 3.8.
Figure 3.8: Measured Resistivity Imaging Lines and VES points (WWD, 2009)
3.7.1 Resistivity Imaging Section Interpretation
a) Resistivity Imaging along the Dam Axis The results of surveying work are represented by contour lines of apparent resistivity as a function of electrode spacing and investigation depth. The interpretation was normally done using inverse model resistivity values, the
gradient, form and density of contour lines. In order to determine correctly the geological condition of the investigation target, other sub-surface geological data must be combined with this information. For the purpose borehole log data indicated in Table 19 used. Results of the geophysical data were also correlated with information on local geology of the study area.
Table 3.16: Model classification of lithology and resistivity from the data obtained
Rock and soil conditions Resistivity (Ωm)
Moist to dry slity/sandy soil <150
Highly weathered and fractured basement 150-300
Moderately to slightly weathered and fractured basement 300-1000
Fresh basement >1000
The different geoelectric segments in the inverse model resistivity section constitute four distinct geologic layers (Table 3.16):
The top layer with resistivity value ranging from 90 to 150 Ωm and thickness of 3 m to 8 m is interpreted as a moist to dry slity/sandy soil with varied moisture content. The relatively low resistivity layer is underlain by a moderate resistivity layer (150 - 300 Ωm) with average thickness of 10 m. This layer is interpreted as a highly weathered portion of the metasediment/metavolcanic bedrock with the
relatively moderate resistivity value due to moisture content.
A resistive layer with resistivity range from 300 to 1000 Ωm is observed at a depth ranging from 10 to 25 m estimated from the abutment elevations or foundation surface. This zone represents a fairly weathered and more saturated portion of the bedrock.
The fresh basement rock associated with resistivity value of 1000 Ωm is observed at depth ranging from 25 to 55m.

INTERNATIONAL JOURNAL OF SCIENTIFIC & TECHNOLOGY RESEARCH VOLUME 5, ISSUE 10, OCTOBER 2016 ISSN 2277-8616
103 IJSTR©2016 www.ijstr.org
Table 3.17: Log from feasibility study
Depth (m) of occurrence Thickness Lithology
Borehole BH1
From To
0 3 3 Highly weathered phyllite/slate
3 5.6 2.6 Slightly weathered phyllite
5.6 12.6 7 Highly weathered phyllite
12.6 23.6 11 Slightly weathered phyllite
23.6 50 27 Fresh, strong slate
Borehole BH3
From To
0 2.29 2.29 Colluviam deposits mixed with large fragments of rocks.
2.29 9 6.71 Moderately to slightly weathered and closely jointed slate.
9 19.95 10.95 Fresh, moderately to widely spaced joints filled with clay and calcite, slate.
19.95 24.66 4.71 Fractured zone 19.95-23.30m, and fractured zone and high circulation water loss 24-24.12m, 24.50-24.66m highly weathered slate.
24.66 29.60 4.94 Fresh to slightly weathered, widely spaced joints.
Borehole BH4
0 1.07 1.07 Gravel, sand, slit
1.07 17 15.93 Slightly weathered slate
8 36 18 Fresh phyllite
Borehole BH5
0 2.15 2.15 Highly to moderately weathered coarse grained MV
2.15 6 3.85 Slightly weathered MV (metavolcanic rocks)
6 15 9 Fresh slate
The interpretation result of resistivity imaging along the dam axis is shown in (Figure 3.9). As can be noted from Figure 3.9, here is a wide part with the low apparent resistivity between index point 2 and 3 at the left abutment, which may indicated that the basement rock is fractured, disturbed and weathered. There exist three geological structures (dotted lines); two of them intersect at the great depth. The
low appearance resistivity zone under the index point 9 and 10 is probably due to the presence faults which could have created weak zone. The thickness of top soil is 12 m between index point 1 and 3, and 10 m between index point 8 and 10. These thick pockets of soil/gouge are formed most probably due to geological structures.
Figure 3.9: Apparent resistivity profile along the dam axis b) Resistivity imaging upstream of dam axis Result of the resistivity imaging upstream of the dam axis is given in Figure 3.10. As indicated in Figure 3.10 the basement rocks are intensely fractured, shattered and weathered index point 2 and 3 at the left abutment. This
shattering of the basement is likely to the intrusive body between the index points 4 and 5.5. There also exist three geological structures around index point 6, 14 and 15.The thickness of top soil is 12 m between index point 1 and 4, and about 6 m around index point 6, 14 and 15.

INTERNATIONAL JOURNAL OF SCIENTIFIC & TECHNOLOGY RESEARCH VOLUME 5, ISSUE 10, OCTOBER 2016 ISSN 2277-8616
104 IJSTR©2016 www.ijstr.org
Figure 3.10: Apparent resistivity profile of upstream of the dam axis
c) Resistivity imaging cross line of dam axis The following geoelectrical cross section indicates that at the right abutment area there is deep weathered rock. This
cross section was taken from with some angle deviation across dam axis.
Figure 3.11: Apparent resistivity profile of cross line of dam axis The cross line intersects Dam axis line at the index point 2 (index point 9 of Dam axis line) and upstream line at the index point 5 (index point 9 of upstream).As can be noted from Figure 3.11, there exist two geological structures between index point 2 and 3, and around index point 4. A geological structure between index point 2 and 3. The thickness of top soil is 3 to 5 m around index point 2.
d) Resistivity imaging downstream line of dam axis This cross section was measuring along downstream line of dam axis, it (figure:3.12) reveals that around the reference point 20 or at the middle point of the index points of 3 and 2 there is fault zone with highly weathered rock.

INTERNATIONAL JOURNAL OF SCIENTIFIC & TECHNOLOGY RESEARCH VOLUME 5, ISSUE 10, OCTOBER 2016 ISSN 2277-8616
105 IJSTR©2016 www.ijstr.org
Figure 3.12: Apparent resistivity profile of downstream line of dam axis The downstream line is 20 m away from dam axis line (downstream) and parallel to dam axis. This survey line was selected in order to find out the strike direction of the geological structures that occur between index point 8 and 10 of dam axis survey line. From this profiling between the index point 13 and 32 are soils with thickness of about 6m. 3.7.2 Vertical Electrical Sounding Data and Results Vertical electrical sounding (VES) was carried out on dam site in the study area. Summary of the apparent resistivity and corresponding thickness are given in Appendix, Table
12. Result of VES investigations are summarized as follows:- a) VES #1: as can be observed from the one dimensional
model curve indicated in Figure 5.13. - The upper 3.1m is considered as soil and below
the soil about 1.7m weathered and fractured bedrock.
- From 4.8 to 20.5m is strong and slightly jointed basement rock.
- The low resistivity value below depth of 20.5m is believed to be due to fault zone.
Figure 3.13: VES #1, Dam site (data source: WWDSE, 2009).
b) VES#2: it was taken across the dam axis. The one dimensional model curve (Figure 3.14) shows that: - Upper 1m is colluvial soil. - Closely jointed and highly weathered metasediment underlain the soils (thickness up to 3.5m). - From 3.5-14.4m is massive metasediment.

INTERNATIONAL JOURNAL OF SCIENTIFIC & TECHNOLOGY RESEARCH VOLUME 5, ISSUE 10, OCTOBER 2016 ISSN 2277-8616
106 IJSTR©2016 www.ijstr.org
Figure 3.14 VES #2, Dam site, Maychew (data source: WWDSE, 2009)
c) VES #3 it was taken from upstream of the dam axis. The one dimensional model curve (Figure 3.15) show that: - The top layer 4.7 m is highly fractured and weathered meta-sediment. - The resistivity rapidly increasing up to depth of 44.1m reveals the massive/sound rock
Figure 3.15: VES #3, upstream line of Dam, Maychew (data source: WWDSE, 2009).
d) VES #4: as can be observed from the one dimensional model curve indicated in Figure 3.16 - The upper 9.1m is weathered and highly jointed rock. - From 9.1m to 26.7m is strong and slightly fractured rock. - Highly fractured zone is expected below 26.7m.

INTERNATIONAL JOURNAL OF SCIENTIFIC & TECHNOLOGY RESEARCH VOLUME 5, ISSUE 10, OCTOBER 2016 ISSN 2277-8616
107 IJSTR©2016 www.ijstr.org
Figure 3.16: VES #4, left abutment (data source: WWDSE, 2009)
3.9 Discussion 3.9.1 Geological and Geotechnical Properties Soils and Rocks The engineering geological and geotechnical conditions of soils and rocks of the dam site are discussed as follows:
The dominant soil types found in the study area are clay, silt, sand, and gravel. They are characterized by low to medium plasticity; low permeability and low shear strength parameters ranging from 17kPa to 85kPa.
The major rock units found in the area are metasediments and metavolcanic. The metasedimentary rocks are characterized by fine grained, permeable (1-20 Lugeon), and highly jointed. Metavolcanic rocks are characterized by massive and medium strength values with maximum (UCS values of 36 MPa).
In terms of water tightness, at the reservoir area, the soil materials are characterized by low to medium permeability. Along the dam axis the degree of permeability was found to decrease from right to left abutment.
In terms of slope stabilities, the rock mass along the two abutments have different orientations and height. A number of discontinuities were analyzed for their slope stability using slope mass rating classification. Results revealed that no major slope instability problems are expected in the reservoir area as well as in dam foundation except for minor rock block failure.
3.9.2 Potential Problems From the detail investigation, leakage/seepage and differential settlement in the dam foundation and right abutment are potential problems. Among the dominant factors that have a capacity to create seepage/leakage and differential settlement are geological structures (faults, joints, and beddings), groundwater level, permeability of soil, topographic and slope profile features.
As geological section map of the dam foundation shown (Figure 3.17) that the groundwater level from right side of central valley is very deeper than the left side. It is filled with water and the gradient of water inclined outward from reservoir.
The dip direction of metasediments that occur at the right abutment is outward from the reservoir. As a result potential seepage/leakage problem could be expected.
There are deep-seated weak zones (faults, joints, beddings, intensely weathered zones etc) within the bedrock of the right abutment and along the main river channel which could cause potential seepage/leakage problems.
The presence of rocks with different modulus of deformation along the dam axis 26.6GPa at left and 8.9GPa at right indicate that there might be differential settlement which needs to be causes in the design.

INTERNATIONAL JOURNAL OF SCIENTIFIC & TECHNOLOGY RESEARCH VOLUME 5, ISSUE 10, OCTOBER 2016 ISSN 2277-8616
108 IJSTR©2016 www.ijstr.org
Figure 3.23: Risk area for seepage.
3.9.3 Problems related to Gold mining The low-grade metamorphic rocks in northern Ethiopia are known to have different mineralization including gold and other base metals whose reserve and tonnage has yet to be studied in detail. Local residents have been ―panning for
gold‖ along the Maychew River. These activities may cause the following problems:
Initiate slope instability problems around the proposed dam site.
The residue of ore or tailings may pollute the quality of water.
Figure 3.24: The area where traditional gold Mining taking place around the river.
4. CONCLUSIONS AND RECOMMENDATIONS
4.1 Conclusions
The following points are concluded from this study:
The Rocks at the dam site are classified in to meta-volcanic rocks and metasedimentary, and include coarse and fine grained metavolcanics, black limestone, metagraywacke, phyllite and slate. The
various units show considerable lateral variations around reservoir area and right abutments.
Detailed surface and subsurface geological mapping of the project area revealed that the right side of the dam axis and reservoir area is underlain by metasediment rocks. These rocks are foliated, jointed, faulted, sheared and weathered (on the surface).
Alluvial and colluvial soils deposited in the dam site are dominated by silty soil. The colluvial soils found

INTERNATIONAL JOURNAL OF SCIENTIFIC & TECHNOLOGY RESEARCH VOLUME 5, ISSUE 10, OCTOBER 2016 ISSN 2277-8616
109 IJSTR©2016 www.ijstr.org
near to foot of the slope are mixtures of clay, silt and rock fragments. Results from laboratory test shows that the colluvial and alluvial dominated by silt, and are characterized by poorly graded, low to medium plasticity and low permeability soils.
Bedrocks overlain by unconsolidated deposits and exposed around the proposed dam site are affected by regional and local structures.
Different sets of joints are widespread throughout the various lithologies in the dam site. Different faults oriented averagely northeast are dominant in the study area. Moreover, anticlinal folds are found in the northern part of the reservoir area. Shear zone is identified in the right abutment on metasediment rocks. The foliation and the original bedding plane (which are also sub-parallel to each other) are dominated in the right abutment and reservoir area. Neither the bedding plane nor the foliation plane pose sliding problem along the Dam axis because they are dipping outward of the proposed dam foundation.
The geotechnical investigations show that rocks at the dam site, especially at the foundation area have low to moderate strength. Unaxial compressive strength of metavolcanic and metasediment rocks are 36MPa and 16-34MPa respectively.
The permeability of the rock mass, as evaluated in the field by packer test show that the different rock units along dam axis have low to moderate permeability. In addition to packer test, open tube method (which includes approach to falling and constant head test in laboratory) was applied in more weathered and fractured zones of different rock units. These test revealed that the weathered and fractured rock units have high to moderate permeability.
Soil samples were taken from dam site and determined for therepermeabilities in the laboratory using constant and falling head method. Results of the laboratory test show that the soils at the dam site have low permeability.
From the geological and geotechnical investigations, it is possible to conclude that there could be potential seepage/leakage and settlement problems within dam foundation and right abutment of the proposed dam site. There is no slope instability problem around the planned dam site, because the discontinuities in the right side of dam site which is with steeply dipping slope face, are dipping opposite to slope face and some are vertical.
4.2 Recommendations
The following points are recommended from this study. This research work suggested that during
construction phase the engineering geologist should take worry of horizontal lithological variation by taking photos and mapping the foundation geology.
Data on the permeability and other geotechnical properties of soils and rocks show that the half of the dam foundation, especially the right side
requires grouting (consolidation grouting or curtain grouting).
During construction the shear strength of the dam foundation and deformation behavior of rocks at dam foundation should be evaluated by using different field methods and be correlated with estimated value in this research work.
The faults that are recognized in the dam site are very close to the dam axis; therefore, engineering geological measurements have to be taken to ensure water tightness and foundation stability condition of the dam.
The intact rocks evaluated in the laboratory are variable and moderately to poorly strong in terms of in their intact strength. But particular attention has to be given for the right abutment of the dam where phyllites and slate are very fractured and weathered.
The limestone at the right side of the dam axis is thinly bedded, folded and has intercalations of phyllites. This situation might pose serious leakage problem and the further investigation is required.
Gold panning should be prohibited from the area because part of it could be filled with the water in the dam, in which case several issues may have to be addressed. 1. There needs to be discussions with the local
administration and regional bureau if they are aware of this planned project and as to what would be the decision on the future of the dam.
2. If both the dam and mining has to coexist: then one has to address the critical problem related to the pollution of the water in the reservoir area from various sources related to the gold mining. This includes the residue of ore (tailings), acid-mine drainage, cyanide, arsenic, lead, copper and mercury, some of them used to purify the gold.
3. The slope of the northwestern wall of the reservoir could also be affected in terms of slope instability.
REFERENCES [1] Alene, M., Secco, L., Dal Negro, A. and Sacchi, R.,
2000. Geochemistry and Geotechnical setting of Neoproterozoic Rocks from Northern Ethiopia (Arabian Nubian Shield), Gondwna Res-3,333-347.
[2] Asrat, A., Barbey, P & Gleizes, G. 2001. The
Precambrian Geology of Ethiopia: A review-Africa Geoscience. Review 18, 271-288.
[3] Balkema, A.A. (1993). The engineering geology of
weak rocks.Civ. Engrs, vol. 15, pp 335-344.
[4] Baria, R., Hearn, K., and Batchelor, 1985. Induced seismicity during the hydraulic stimulation of the potential hot dry rock geothermal reservoir, proceedings 4
th conference on acoustic emission
microseismic activity, Pennsylvania State University, University Park, PA, Oct.

INTERNATIONAL JOURNAL OF SCIENTIFIC & TECHNOLOGY RESEARCH VOLUME 5, ISSUE 10, OCTOBER 2016 ISSN 2277-8616
110 IJSTR©2016 www.ijstr.org
[5] Barton, N. (1976). Rock mechanics review. The shear strength of rock and rock joints. Int. J. Rock Mech. Min., 13, 255-279.
[6] Barton, N and Choubey, V. (1977). The shear
strength of rock joints in theory and practice, Rock Mechanics, 10, pp. 1-54.
[7] Barton, N.R., Lien, R. and Lunde, J. (1985).
Engineering classification of rock masses for the design of tunnel support. Rock, 6, 189-239.
[8] Bell F.G (1993). Fundamentals of engineering
geology. Newns-Butterworths, London, UK.
[9] Bell, F. Engineering Geology, 2nd
ed. 2007. Basic Principle of Soil and Rocks.
[10] Beyth M et al, 2003. Crustal Exhumation and
indication for Snawball earth in the East Africa Orogen: North Ethiopia and East Eritrea.
[11] Beyth M., 1972a. The Geology of Central and
Western Tigray. PhD Thesis, University of Bon, Germany.
[12] Beyth, M., (1971). The Geology of Central and
Western Tigre. Unpubl. Report, Min. Mines, Addis Ababa.
[13] Bieniawski, Z. T. (1984). Engineering classification
in rock engineering. In : Proceedings of the Symposium on Exploration for Rock Engineering, Johannesburg, 97-106.
[14] Bieniawski Z.T. (1978) Determining rock mass
deformability: experience from cases historys. Int J Rock Mech and Min. Sc., Vol. 15, 237-247.
[15] Bieniawski Z.T., 1976, Rock mass classification in
rock engineering. Int. J. Rock Mech. Min. Sci and Geomech. Abstr. 15, pp.237-247.
[16] Bieniawski, Z.T. (1989) Engineering Rock Mass
Classifications. J. Wiley and Sons, New York, 25lpp.
[17] Bieniawski, Z.T. and Orr, C.M. (1976) Rapid site
appraisal for dam foundations. By the Geomechnics classification.-12
th Congr. Grands
Barrages, III, p.483-501. [18] Brown, E. T. (Ed) (1981). Rock characterization
testing and monitoring, ISRM suggested methods. Pergamon Press.
[19] Christopher R.J.Kilburn and David N. Ptley, 2003.
Forecasting Giant, Catastrophic Slope Collapse: Lesson from Vajont, Journal, 2003. Dams, Leiden A.A. Balkema.
[20] Chuaqui, M., D.A. Bruce. (2003). Mix Design and
Quality Control Procedures for High dams.
[21] Dearman, W.R., 1991. Engineering geological mapping, Netherland: ISBN 0750610107.
[22] Deere.D.U. and Miller R.P.1966. Engineering
classification and index properties for intact rock. Tech. Rept. No. AFWL-TR-65-116, Air Force Weapons Lab., Kirtland Air Force Base, New Mexico.
[23] Deere, D. U. (1968). Geological consideration. In:
Rock mechanics in engineering practice, (R. G. Stagg and D. C. Zienkiewicz. (Eds.)), Division of Civil Engineering, School of Engineering, University of Wales, Swansea, John Wiley and sons, New York, 1-20.
[24] Fell R., MacGregor, P., Stapledon, D., and Bell, G.
(2005). Geotechnical engineering of dam site. [25] Foster M., Fell R., Spannagle M., (2000). The
statistics of embankment dam failures. Geomechanics classification, Proc. 12th Int. Cong. on Large Dams, Mexico, pp. 483-501.
[26] Friedrich-Karl, 1994. Rock Permeability and
Groutability Related to Dams and Reservoirs, lecture notes, University of Paderborn, Germany.
[27] Garland C.R., 1980. Geology of Adigrat area.
Ministry of Mines, Addis Ababa Memoir No.1. [28] Goodman R. E. (1980). Introduction to Rock
Mechanics, John Wiley and Sons. [29] Gouin, P., (1979). Earthquake History of Ethiopia
and the Horn of Africa. Report. Geophys. Observatory. AAU.
[30] Ghafoori, M. The Engineering Geology of the
Tabork Abad Dam. Journal of Engineering Geology, 66 2002. 233-239.
[31] Gupta, Hersh k., (2002). ―A review of recent
studies of triggered earthquakes by artificial water reservoirs with especial emphasis on earthquakes in Koyna, India.‖ Earth Sciences Reviews 58279-310.
[32] Hagos, M., Koeberl, C., Kabeto, K. and Koller, F.,
2010. Geology, petrology and geochemistry of the basaltic rocks of the Axum area, northern Ethiopia. In: J. Ray, G. Sen, B. Ghosh (eds.) Topics in Igneous Petrology: A Tribute to Prof. Mihir K. Bose, Springer, Heidelberg , in press.
[33] Hoek. E., J. W. Bray (1981). Rock slope
engineering, London, Instn Min. and Metall. [34] Houlsby, A. (1976). Routine Interpretation of the
Lugeon Water-Test. Q. J. Eng. Geol. Vol. 9, pp. 303-313.

INTERNATIONAL JOURNAL OF SCIENTIFIC & TECHNOLOGY RESEARCH VOLUME 5, ISSUE 10, OCTOBER 2016 ISSN 2277-8616
111 IJSTR©2016 www.ijstr.org
[35] Houlsby, A. C, (1990). Construction and design of cement gouting, (John Wiley and Sons Inc: New York).
[36] Hunt R.E (1984). Geotechnical Engineering
Investigation manual. McGraw Hill, New York. [37] ISRM (1978). Suggested methods for quantitative
description of discontinuities in rock masses, International Journal of Rock Mechanics and Mining Sciences and Geomechanics, 15: 319 – 368.
[38] ISRM (1981). International Society for Rock
Mechanics (ISRM), Commission on classification of rocks and rock masses, Int. J. Rock Mech. Min., 18: 85–110.
[39] ISRM (1983). Suggested methods for determining
the strength of rock materials in triaxial compression: revised version.
[40] Jauhari, V.P., 1999. Prepared for Thematic Review
IV-5. ―Options Assessment- Large Dams in India-Operation, Monitoring and Decommissioning of Dams.‖ www.dams.orq.
[41] John R. McMahon, 2004. Engineering Geology and
Seismology for Geologic Hazards. [42] Joseph E. Bowles (1992). Engineering properties
of soils and their measurement. [43] K.M.Bangar (2005). Principles of engineering
geology. [44] Kazmin, V., (1975). The Precambrian of Ethiopia
and some aspects of the Geology of the Mozambique Belt. Bull. Geophys. Obs. Addis Ababa 15, 27-45.
[45] Kazmin V., 1978. Geology of Ethiopia basement
and possible relation between the Mozambique and the Red Sea Belt. Egyption Journal of Geology 22, 73-86.
[46] Kocbay, A.and Kilic, R.2006. Engineering
Geological of assessment of the Obruk Dam site, accidents. Can. Geotech. J.37: 1000-1024.
[47] Nata Tadesse, Asmelash Berhane and
Bheemalingeswara K., (2008), Initiatives, Opportunities and Challenges in Shallow Groundwater Utilization: a Case Study from Debrekidane Watershed, Hawzien Woreda, Tigray Region, Northern Ethiopia, Agricultural Engineering International: the CIGR Ejourna l. Manuscript LW 08 008. Vol. X.
[48] Novak. P, (2009). Foundation of Engineering
Geology 4th ed. Hydraulic Structures.
[49] Robert B. Johnson and Jerome V. Degraff (1988). Principles of engineering geology.
[50] Robert B. Johnson, Jerome V. Degraff (1988).
Principles of Engineering geology, John wiley and sons, Inc.
[51] Romana M. R. 1993. A geomechanics
classification for slopes: Slope Mass Rating. (In ―Comprehensive Rock Engineering‖. Ed. J. Hudson). Pergamon. Vol 3. Pp 575-600.
[52] Seraphim J.L., Pereira J.P. (1983). Considerations
on the geomechnical classification of Bieniawski, Proc. Int. Symp. On Engineering Geology and underground Construction, LNEC, Lisbon, Portugal, vol. 1, pp. II. 33-II.42.
[53] Shackleton R.M., 1986. Precambrian collision
Tectonics in Africa. In: collision Tectonics-Geological Society London, Especial Publication 19,329-341.
[54] Shakoor, A. and Bonelli, R.E. 1991. Relationship
between Petrographic characteristics, Engineering Index Properties, and Mechanical Properties of Selected Sandstone.
[55] Singh, B. and Geol, R. K. (1999). Rock mass
classification-A practical approach in civil engineering. Elsevier, Netherlands.
[56] Stern R.J., 1994. Arc assembles and continental
Collision in the Neoproterozoic East Africa Orogen: Implication for the consolidation of Gondwnaland. Annual reviews of earth and planetary Sciences 22, 319-351.
[57] Tadesse T, Hoshino, M & Sawada, Y. (1999).
Geochemistry of Low grade Metavolcanic Rocks from The Pan- Africa of the Axum area, Northern Ethiopia.
[58] Terry R.West (1995). Geology applied to
engineering. Chapman and Hall, London, p. 216. [59] Terzaghi, K., Peck, R., Mesri, G. (1996). Soil
Mechanics in Engineering Practice. Third edition. [60] Tsegaye H., (2000). The Geology of the Adi Arkai
(Ras Dashen), Geol. Survey. Ethiopia [61] Zhang Chuhan et al., 2001. Numerical Modelling
of Concrete Dam –Foundation-Reservoir System.