Geo-referenced spatiotemporal analysis of the urban citrus canker ...
17
Vol. 92, No. 4, 2002 361 Epidemiology Geo-Referenced Spatiotemporal Analysis of the Urban Citrus Canker Epidemic in Florida Tim R. Gottwald, Xiaoan Sun, Tim Riley, James H. Graham, Frank Ferrandino, and Earl L. Taylor First and sixth authors: U.S. Department of Agriculture, Agricultural Research Service, Ft. Pierce, FL 34945; second author: Florida Department of Agriculture and Consumer Services, Division of Plant Industry, Gainesville; third author: USDA, Animal and Plant Health Inspection Service, Citrus Canker Eradication Program, Ft. Pierce, FL; fourth author: University of Florida, IFAS, Lake Alfred; and fifth author: Department of Plant Pathology and Ecology, Connecticut Agricultural Experiment Station, New Haven. Accepted for publication 21 November 2001. ABSTRACT Gottwald, T. R., Sun, X., Riley, T., Graham, J. H., Ferrandino, F., and Taylor, E. L. 2002. Geo-referenced spatiotemporal analysis of the urban citrus canker epidemic in Florida. Phytopathology 92:361-377. Five areas in urban Miami were identified to study the spread of Xanthomonas axonopodis pv. citri to determine if the practice of re- moving exposed citrus trees within 38.1 m of trees affected by citrus canker was adequate to curtail further bacterial spread. To accomplish this, 18,769 trees in dooryards were surveyed, geo-referenced by differ- ential global positioning systems (GPS), and assayed for disease severity, age of infection, citrus cultivar, location of infection in tree, and canopy size. For each tree, the date the tree became infected was estimated and used to separate trees into contiguous 30-day categories. For each area studied, distance measurements between focal trees and newly infected trees were calculated for various temporal periods of 30, 60, 90, and 120 days in duration, corresponding to intervals of inspection survey. A visual basic application was used to calculate the distances between each newly diseased tree and all prior focal trees. The nearest distance was used because it was considered the most conservative estimate possible. It is therefore likely to be an underestimate of spread but is a good estimate of the minimum possible distances of spread. For the first four 30-day periods among the five study areas, calculated maximum dis- tances of spread ranged from 12 to 3,474 m, indicating a broad con- tinuum of distance for bacterial spread was possible. Disease increased during the first two-thirds of the time studied and reached an asymptote due to dry conditions in the final one-third of the duration of the study. Cross correlation analysis indicated that disease was best visualized 107 days following rainstorms with wind. Analysis of regional spatial point patterns was performed temporally for each 30-day period via a modified Ripley’s K-function. Spatiotemporal analyses between periods over areas larger than previously examined were accomplished via spatiotemporal semivariogram analysis. These methods in combination demonstrated rapid increases in range of spatial dependency and range of spatiotemporal dependency for all study sites. This corresponded to rapid spread of disease across the regions studied in response to rain- storms with wind followed by a “filling in” of disease on remaining noninfected susceptible trees through time by less intense rain events. A stochastic quadratization technique demonstrated that disease incidence and disease severity were not greatly affected by urban host density but were positively correlated to host susceptibility within local 0.25-km 2 quadrats. Additional keywords: disease eradication, dooryard citrus, exposed trees, regulatory policy. Asiatic citrus canker (ACC) caused by Xanthomonas axono- podis pv. citri is a disease known worldwide in the majority of commercial citrus production areas and has intermittently plagued the Florida citrus industry since the early 1910s (27). In Florida, ACC was discovered for the second time in 1986 in Manatee County in Florida and was subsequently declared eradicated in 1992 (10). Citrus canker was discovered for a third time in Florida in residential citrus in Dade County in September 1995. When detected in 1995, the infected area was believed to encompass approximately 36.3 km 2 (14 mi 2 ) of urban properties southwest of the Miami International Airport. In response to the 1995 detection of ACC, a cooperative state/federal Citrus Canker Eradication Program (CCEP) was established by the Florida Department of Agriculture and Consumer Services, Division of Plant Industry in collaboration with the U.S. Department of Agriculture, Animal and Plant Health Inspection Service. Despite extensive eradication efforts that have resulted in the removal or cutting back of over 1.3 million commercial trees statewide and 580,000 infected and exposed dooryard citrus trees, the infected area in urban Miami has increased to 1,386 km 2 (535 mi 2 ) as of July 2001. The sur- rounding quarantine area is presently over 2,590 km 2 (1,000 mi 2 ). Concurrently, ACC was rediscovered in commercial citrus in Manatee County on the west coast of Florida in June 1997, where a similar eradication effort is currently in progress. Subsequent commercial and residential outbreaks of ACC have also occurred in Collier, Desoto, Hendry, Palm Beach, Martin, and Brevard counties of Florida whose origins are believed to be related predominantly to the inoculum reservoir in residential Dade and Broward counties (10). ACC is characterized by erumpent lesions on fruit, foliage, and young stems of susceptible cultivars of citrus. When disease is severe, defoliation, dieback, and fruit drop can occur and infected fruit that remain are less valuable or entirely unmarketable (17,19). In an attempt to prohibit the introduction of the disease, many citrus-growing areas restrict the importation of citrus from areas or countries known to be infested. During seasons when spring and summer rains are combined with wind speeds in excess of 8 m/s, damage from the disease can range from nominal to significant (28). The situation in Florida was exacerbated by the introduction of Asian leafminer, Phyllocnistis citrella, in 1993. ACC has increased significantly as a consequence of the insect’s feeding activities which exposes leaf mesophyll tissues, thus increasing the probability of infection by X. axonopodis pv. citri (9). Corresponding author: T. Gottwald; E-mail address: [email protected] Publication no. P-2002-0130-01R This article is in the public domain and not copyrightable. It may be freely re- printed with customary crediting of the source. The American Phytopathological Society, 2002.
Transcript of Geo-referenced spatiotemporal analysis of the urban citrus canker ...

Vol. 92, No. 4, 2002 361
Epidemiology
Geo-Referenced Spatiotemporal Analysis of the Urban Citrus Canker Epidemic in Florida
Tim R. Gottwald, Xiaoan Sun, Tim Riley, James H. Graham, Frank Ferrandino, and Earl L. Taylor
First and sixth authors: U.S. Department of Agriculture, Agricultural Research Service, Ft. Pierce, FL 34945; second author: Florida Department of Agriculture and Consumer Services, Division of Plant Industry, Gainesville; third author: USDA, Animal and Plant Health Inspection Service, Citrus Canker Eradication Program, Ft. Pierce, FL; fourth author: University of Florida, IFAS, Lake Alfred; and fifth author: Department of Plant Pathology and Ecology, Connecticut Agricultural Experiment Station, New Haven.
Accepted for publication 21 November 2001.
ABSTRACT
Gottwald, T. R., Sun, X., Riley, T., Graham, J. H., Ferrandino, F., and Taylor, E. L. 2002. Geo-referenced spatiotemporal analysis of the urban citrus canker epidemic in Florida. Phytopathology 92:361-377.
Five areas in urban Miami were identified to study the spread of Xanthomonas axonopodis pv. citri to determine if the practice of re-moving exposed citrus trees within 38.1 m of trees affected by citrus canker was adequate to curtail further bacterial spread. To accomplish this, 18,769 trees in dooryards were surveyed, geo-referenced by differ-ential global positioning systems (GPS), and assayed for disease severity, age of infection, citrus cultivar, location of infection in tree, and canopy size. For each tree, the date the tree became infected was estimated and used to separate trees into contiguous 30-day categories. For each area studied, distance measurements between focal trees and newly infected trees were calculated for various temporal periods of 30, 60, 90, and 120 days in duration, corresponding to intervals of inspection survey. A visual basic application was used to calculate the distances between each newly diseased tree and all prior focal trees. The nearest distance was used because it was considered the most conservative estimate possible. It is therefore likely to be an underestimate of spread but is a good estimate of the minimum possible distances of spread. For the first four 30-day periods among the five study areas, calculated maximum dis-
tances of spread ranged from 12 to 3,474 m, indicating a broad con-tinuum of distance for bacterial spread was possible. Disease increased during the first two-thirds of the time studied and reached an asymptote due to dry conditions in the final one-third of the duration of the study. Cross correlation analysis indicated that disease was best visualized 107 days following rainstorms with wind. Analysis of regional spatial point patterns was performed temporally for each 30-day period via a modified Ripley’s K-function. Spatiotemporal analyses between periods over areas larger than previously examined were accomplished via spatiotemporal semivariogram analysis. These methods in combination demonstrated rapid increases in range of spatial dependency and range of spatiotemporal dependency for all study sites. This corresponded to rapid spread of disease across the regions studied in response to rain-storms with wind followed by a “filling in” of disease on remaining noninfected susceptible trees through time by less intense rain events. A stochastic quadratization technique demonstrated that disease incidence and disease severity were not greatly affected by urban host density but were positively correlated to host susceptibility within local 0.25-km2 quadrats.
Additional keywords: disease eradication, dooryard citrus, exposed trees, regulatory policy.
Asiatic citrus canker (ACC) caused by Xanthomonas axono-
podis pv. citri is a disease known worldwide in the majority of commercial citrus production areas and has intermittently plagued the Florida citrus industry since the early 1910s (27). In Florida, ACC was discovered for the second time in 1986 in Manatee County in Florida and was subsequently declared eradicated in 1992 (10). Citrus canker was discovered for a third time in Florida in residential citrus in Dade County in September 1995. When detected in 1995, the infected area was believed to encompass approximately 36.3 km2 (14 mi2) of urban properties southwest of the Miami International Airport. In response to the 1995 detection of ACC, a cooperative state/federal Citrus Canker Eradication Program (CCEP) was established by the Florida Department of Agriculture and Consumer Services, Division of Plant Industry in collaboration with the U.S. Department of Agriculture, Animal and Plant Health Inspection Service. Despite extensive eradication efforts that have resulted in the removal or cutting back of over 1.3 million commercial trees statewide and 580,000 infected and
exposed dooryard citrus trees, the infected area in urban Miami has increased to 1,386 km2 (535 mi2) as of July 2001. The sur-rounding quarantine area is presently over 2,590 km2 (1,000 mi2). Concurrently, ACC was rediscovered in commercial citrus in Manatee County on the west coast of Florida in June 1997, where a similar eradication effort is currently in progress. Subsequent commercial and residential outbreaks of ACC have also occurred in Collier, Desoto, Hendry, Palm Beach, Martin, and Brevard counties of Florida whose origins are believed to be related predominantly to the inoculum reservoir in residential Dade and Broward counties (10). ACC is characterized by erumpent lesions on fruit, foliage, and young stems of susceptible cultivars of citrus. When disease is severe, defoliation, dieback, and fruit drop can occur and infected fruit that remain are less valuable or entirely unmarketable (17,19). In an attempt to prohibit the introduction of the disease, many citrus-growing areas restrict the importation of citrus from areas or countries known to be infested. During seasons when spring and summer rains are combined with wind speeds in excess of 8 m/s, damage from the disease can range from nominal to significant (28). The situation in Florida was exacerbated by the introduction of Asian leafminer, Phyllocnistis citrella, in 1993. ACC has increased significantly as a consequence of the insect’s feeding activities which exposes leaf mesophyll tissues, thus increasing the probability of infection by X. axonopodis pv. citri (9).
Corresponding author: T. Gottwald; E-mail address: [email protected]
Publication no. P-2002-0130-01R This article is in the public domain and not copyrightable. It may be freely re-printed with customary crediting of the source. The American Phytopathological Society, 2002.

362 PHYTOPATHOLOGY
Previous studies on increase and spread of citrus canker have concentrated on citrus nurseries and commercial plantations. In citrus nurseries, dissemination of X. axonopodis pv. citri is pri-marily by splash dispersal (13,29). The result is the development of numerous secondary foci that eventually coalesce in larger, irregularly shaped areas of disease, which makes the description and quantification of disease gradients difficult and of limited value. Slopes of disease gradients associated with ACC in nurseries fluctu-ate over time because of disease-induced defoliation on severely diseased nursery plants and infection of newly emerging foliage (13). Highly significant aggregation of citrus canker-infected trees was associated with splash dispersal, which decreased as the secondary foci coalesced (13). Ordinary-runs analysis demonstrated a slightly higher within-nursery row than across-nursery row aggre-gation, although aggregation was demonstrable in all nurseries studied throughout the epidemics, irrespective of direction (13).
For ACC epidemics in citrus orchards in Argentina, slopes of disease gradients also fluctuated in response to disease-induced defoliation. However, unlike citrus nurseries, gradient slopes were related to wind-blown rain direction. Gradients were shallowest downwind and steepest upwind from the foci of infection (11). Slopes of disease progress curves calculated with the linear form of the Gompertz model also were significantly greater in the downwind direction. Aggregation of diseased trees was indicated throughout the epidemics by both ordinary-runs analysis and doublet analysis (11). In an earlier study, linearized disease gradi-ents became steeper through time due to a more rapid increase in disease near the focus of infection (4).
Spatial autocorrelation and spatiotemporal autocorrelation methods have been used to examine the spread of citrus canker in nurseries and orchards through time (12). Spatiotemporal autocor-relation analysis (24) provides the ability to examine the evolution of an epidemic in both space and time simultaneously (1,22,25). The results of spatiotemporal autocorrelation analysis led to the description of an spatiotemporal transfer function in the form of a mixed spatiotemporal autoregressive integrated moving average (STARIMA) model (24). Spatial and spatiotemporal patterns of ACC were examined in three nurseries and two orchards (grape-fruit and orange) in Argentina. Data from each assessment date were analyzed by spatial autocorrelation analysis and by spatio-temporal autocorrelation analysis (12). Changes in significantly correlated spatial lags closely followed the changes in the disease progress curves for each plot and although nursery and orchard results differed, both demonstrated disease relationships that per-sisted through one or more lags spatial and/or temporally.
Semivariance analysis has gained considerable popularity in recent years for the exploration of geostatistical data. Although variogram estimation has been accomplished using spatial point pattern data for plant pathogens, it is perhaps more appropriately applied to quantitative data. More robust approaches to measures of spatial randomness of discrete (i.e., binary) spatial point pattern data are the stochastic modeling approaches proposed by Ripley (5,26) and have found application predominantly in ecological studies. For Ripley’s methods, first order properties of a spatial point process describe how the mean number of points per unit area (intensity) varies through space. Point-to-point nearest neigh-bor and origin-to-point nearest neighbor statistics provide objec-tive methods to examine small-scale interactions between points (first order intensity) by calculation of their respective empirical distribution functions (EDF). If the respective point-to-point and origin-to-point nearest neighbor EDFs differ significantly, then a departure from randomness is assumed. The second-order proper-ties (second order intensity) of spatial point processes describe the interaction or spatial dependence between points through space and can be described by Ripley’s K-function. In this case, if y is the mean number of diseased plans per unit area (a density), then yK(d) is the number of diseased plants within the distance (d) of an arbitrary (or randomly selected) diseased plant.
By plotting estimates of K̂ as a function of distance, and comparing it to a plot of estimates of complete spatial random- ness (CSR), the range of spatial dependency (RSD), i.e., the range of distance over which there is a departure from CSR, and the maximum spatial dependency (MSD), i.e., the distance at which the maximum departure from randomness occurs, can be estimated. Ripley’s original method ignores the finite size of the plot in calculating the CSR prediction and uses a weighting that inflates the pairs counts to compensate for the reduced numbers of pairs near the plot boundaries, i.e., edge effects. At low incidence, this weighting tends to overestimate the number of pairs at the boundaries of the plot. An alternative method for calculating the K-function has recently been presented that directly incorporates the edge effect into CSR model predictions, yielding more accurate estimates of the variance (32). In what follows, this approach is extended to a sample space consisting of an irregular lattice of points (trees). For this case, the prediction of infected point pairs based on CSR is obtained by direct enumera-tion of tree pairs. Thus, no edge correction is necessary and expectation values and confidence limits can be obtained by direct statistical inference.
Although semivariance analysis is perhaps less useful for analy-sis of spatial point pattern data, it has been used for spatiotem-poral geo-referenced data. In this context, semivariance analysis allows the examination of spatiotemporal relationships of diseased plants either between two time periods or over the duration of an epidemic consisting of several assessment periods, for which di-seased plants were assigned a quantitative value corresponding to length of time infected (2,6,31).
Until recently, the scientific basis for the eradication effort was provided by previous data from Argentina indicating that canker bacteria can spread up to 38.1 m (125 ft) during rainstorms associ-ated with wind (30). This was translated into regulatory policy that resulted in the location of diseased citrus trees by survey teams, and the removal and destruction of these trees and of “ex-posed trees” within a 38.1-m (125 ft) radius of a diseased tree (10). Brazil used a similar distance, 30 m (98 ft), to define ex-posed trees for removal. However, despite the use of the “125-ft rule” by the CCEP, the disease continued to increase in southeast Florida urban areas and spread to numerous commercial citrus plantations across south Florida (9). Thus, questions arose con-cerning the appropriateness of the 38.1-m radius around diseased trees to identify exposed trees for eradication in an urban setting and resulted in a request by the CCEP for a study to examine the appropriateness and effectiveness of the rule. The main concerns are: (i) Are the experimental and meteorological conditions under which the data were collected in Argentina applicable to Florida? (ii) Because the Argentine data were collected under orchard conditions, are these findings applicable to the urban situation where much of the eradication effort is ongoing in Florida? In response to these queries, a cooperative CCEP, ARS, and University of Florida research effort was established in August 1998.
No prior information or studies exist on the spread of ACC in urban areas where dooryard citrus is the major source of inocu-lum. Therefore, a series of studies were conducted in an attempt to provide accurate information on the spread of X. axonopodis pv. citri for the development of biologically sound and effective eradication/suppression procedures under urban conditions. The objectives of the studies were to (i) determine the distance of spread from point sources (foci of infection) in an urban setting and thereby evaluate use of the 38.1-m (125-ft) radius for defining exposed trees; (ii) provide evidence for any adjustment of radius distance that would more effectively define the distance of bac-terial spread that might occur between regulatory inspection cycles of 30, 60, 90, or 120 days; and (iii) examine and describe the spatial and spatiotemporal characteristics of ACC under urban conditions.

Vol. 92, No. 4, 2002 363
MATERIALS AND METHODS
Experimental design. During 1998, three study sites were selected within the urban Dade County area with a few widely spaced focal trees from which to measure disease spread. Two additional sites north of the ACC quarantine boundary as it existed at that time were subsequently selected in Broward County. With-in the Dade County sites, the CCEP did not undertake eradication efforts during the study but rather continued to address the large backlog of ACC-affected trees elsewhere in the Dade County area. Miami, Dade County sites D1 and D2, consisted of ≈10.3 and 5.2 km2 (4 and 2 mi2) of urban area, respectively, as defined by section-township-range (STR) boundaries. Site D3 consisted of three infected trees all within 15.2 m (50 ft) of each other at the beginning of the study, and spread was measured from this small focus of infection to the surrounding area circumscribed by a 1.6-km (1.0-mi) radius. The Broward County sites B1 and B2 consisted of 2.6 and 15.5 km2 (1.0 and 6.0 mi2) of urban areas, respectively. Because the Broward County sites were north of the quarantine boundary and were considered a potential imminent source for continued northward spread of the disease, they were treated differently. In Broward County, ACC-affected trees were removed as they were identified. The majority of tree removals occurred within 2 to 4 weeks of detection.
Within each site, surveys were conducted to identify all di-seased and asymptomatic citrus trees. Over 16 inspectors, experi-enced at recognizing ACC symptoms, conducted inspections in the experimental sites. The diseased trees were visually examined, evaluated, and rated by a single inspector, X. Sun, to maintain consistency. A total of 18,769 trees among the five study sites were assayed. Using differential global positioning system (GPS), latitudinal and longitudinal coordinates were recorded for each tree. Other data recorded relative to each tree included (i) species/ cultivar, (ii) tree age, (iii) age of oldest lesion, (iv) severity of in-fection, and (v) section of tree infected (i.e., directional quad-rant—N, E, S, and W, and portion of tree infected—top third, middle third, and bottom third). Surveys were conducted at least three times in each study area approximately 60 days apart. The age of lesions during a given survey can be based on phenotypic characteristics of infected host tissue. From the above data, the infection initiation date (IID), i.e., the date that the oldest lesion found in a tree, was estimated to have been established, relative to the date discovered and taking into account latency of infection of approximately 14 days. The oldest infection among the five study sites was used to establish the temporal origin of the study period, and all IIDs were referenced to that date. IID for each tree was estimated as survey date (expressed as the number of days post-temporal origin) minus age of oldest lesion expressed in days for each tree. This date was used in all future calculations.
Differential GPS measurements. When measuring distances between two points, GPS accuracy was taken into account. For this project, hand-held GPS units were modified by the addition of differential GPS (DGPS) modules (Model GPS 12XL and GRB21 Differential GPS Beacon Receiver; Garmin Corp., Olathe, KS). These modules used a U.S. Coast Guard transponder in Biscayne Bay, Miami as a known reference point to correct the signal from individual satellites for the United States. At the time of the study, the U.S. Military imposed an inaccuracy algorithm on civilian GPS units for national security reasons. The use of DGPS pro-vided routine readings in the Miami area with accuracy of ±7.5 m (±24.6 ft) or less as described previously. Therefore, when calcu-lation distances between two points determined by DGPS, the dis-tance calculation is considered at most twice the maximum error or ±15 m (±49 ft), considering the worst case measurement error between two points. In practice, the majority of position readings were more accurate than ±7.5 m (as low as ±2.0 m), and thus, in most cases, this error is an over estimate. Latitudinal and longi-tudinal coordinates for each tree were taken in decimal degree
format and converted to universal transverse mercator (UTM) via a series of spreadsheet calculations. UTM provides a flat Car-tesian coordinate plane for more accurate calculation of distances between points, as opposed to latitude/longitude measurements based on the surface of a sphere, i.e., the earth. This transfor-mation was performed for all trees in all sites.
Nearest neighbor distance calculations. The distance between any two trees was calculated as the length of the hypotenuse of a right triangle whose perpendicular sides represent the north-south and east-west distances between the two points determined by DGPS. Each tree was assigned an IID value based on an estimate of the date the tree became infected. For the purposes of the study, the IID values were separated into contiguous 30-day categories. This was done because some error in visual estimation of the infection date was assumed. For each site, nearest neighbor distance measurements between focal trees and newly infected trees were calculated for various temporal periods. These temporal periods were 30, 60, 90, and 120 days in duration and were chosen for their relevance to regulatory procedures. That is, the ability of the CCEP to return to resurvey an area every 30, 60, 90, or 120 days. Resurveys were dependent upon the expanding quaran-tine area and available manpower. For example, to accommodate a 30-day survey period, the infected trees that existed in the area during the first 30 days were considered focal or “alpha trees” that gave rise to the subsequent diseased trees that had IIDs in the second 30-day period. For the next 30-day temporal period, the diseased trees, which occurred in the first 60 days of the study, were considered focal trees that gave rise to the subsequent di-seased trees, which had IIDs in the third 30-day period, etc. The entire data set was parsed into 25 time periods (designated T1 to T25), each 30 days in duration, encompassing the period from 26 October 1997 through 15 November 1999. A visual basic application (VBA) was used to calculate the distances between each newly diseased tree and all prior focal trees. The shortest distance was stored and the process was repeated for each new diseased tree in the study area. This “nearest infected neighbor” concept was used throughout the study. Although it is very possible that pathogen spread occurred from source trees to secon-dary infected trees that were not nearest neighbors, this nearest distance was used because it was considered to be the most con-servative estimate of spread. Minimum distances of spread are therefore likely to be an “underestimate” of spread. Distances of spread were parsed into consecutive 15.24-m (50-ft) distance categories and plotted as frequency distributions. This was done by a second VBA. A third VBA was used to calculate the distance from focal trees to all possible subsequent infected trees. For ease of calculation, these distances were parsed into contiguous 30.5-m (100-ft) distance categories. This calculation represented an “over-estimate” of spread but provided the longest or maximum distance of spread that could have occurred. It is unknown which focal trees gave rise to infections in subsequent infected trees. Thus, the actual distance of spread intuitively would be between these two extremes described above.
Temporal disease progression. Disease progress curves for all five study sites were plotted versus time based on the nearest 30-day estimates of age of oldest lesions in each tree as was the first derivative (dy/dt) of the increase in incidence. Wind and rain records for the Miami airport site were obtained from the National Weather Service. A simple index (Iw×r) was calculated for each day over the time period corresponding to the duration of the study in which Iw×r = wind gust (m/s) × rainfall (cm). Graphically, it could be seen that a relationship existed between wind-blown rain events, reflected in the cumulative Iw×r, and major increases in di-sease progress, however these were offset in time. Cross correla-tion analyses were conducted to determine the temporal offset, based on the highest coefficient of correlation, between disease progress (in this case using the IID value estimated to the nearest day) for each study site in relation to the weather indices.

364 PHYTOPATHOLOGY
Evaluation of the spatial point pattern by modified Ripley’s K-function methods. Evaluation of the spatial point pattern (SPP) of citrus canker from a regional perspective in Dade and Broward counties entailed an examination of differences between the
spatial distribution of citrus canker-infected trees versus citrus trees in general within the respective study sites. This was accom-plished by the comparison of two cumulative distribution func-tions (cdfs): one representing the fraction of infected tree pairs less than or exactly a distance (d) apart [cdfI(d)] and the second distribution for the total population of trees [cdfT(d)]. Assuming that out of a total of N trees in the study site, I are citrus canker-infected. These cdfs can be expressed as
)1(
2
)( 1
−⋅=
∑ ∑= >
NN
m
dcdf
N
j
N
jkjk
T (1)
)1(
2)( 1
−⋅=
∑ ∑= >
II
s
dcdf
I
j
I
jkjk
I (2)
where m = 1 for tree pairs that are ≤di apart and m = 0 otherwise, and likewise, s = 1 for infected tree pairs that are ≤di apart and s = 0 otherwise. The CSR assumption translates to the expected equivalence of equations 1 and 2 so a constant fraction {I(I – 1)/ [N(N – 1)]} of tree pairs are infected, irrespective of distance (d). The factor of ‘2’ in the numerators of equations 1 and 2 accounts for the fact that the pairs are unordered (i.e., k > j in second sum-mations for equations 1 and 2). For a particular distance (d), the probability of selecting infected pairs in a sample of N(N – 1)/ 2cdfT(d) tree pairs chosen randomly from a population of size N(N – 1)/2 of which I(I – 1)/2 are infected is given by the hyper-geometric distribution:
−−⋅−
2
)1(,
2
)1(,
2
)()1(,
NNIIdcdfNNiH T (3)
with mean value
2
)()1(exp
dcdfIIi T⋅−= (4)
and variance
−
−−⋅−⋅=σ)1(
)1(1)](1[exp
22exp NN
IIdcdfi T (5)
For the range of incidence and sample size examined in this study, the hypergeometric function is well approximated by a normal distribution with the same mean and variance. This fact can be used to estimate confidence intervals.
The citrus canker-infected trees are tested for spatial depend-ency by applying the one-sample single-tailed Kolmogorov-Smirnov test to the maximum distance {D = max[cdfI(d) – cdfT(d)]} between the above two cumulative distributions (3). The above describes a new analytical approach to SPP analysis that is an outgrowth of the modification to Ripley’s K-function presented by Ward and Ferrandino (32). Note this analysis is equivalent to Ripley’s K-function in the limit of an infinite number of trees uniformly covering the study site.
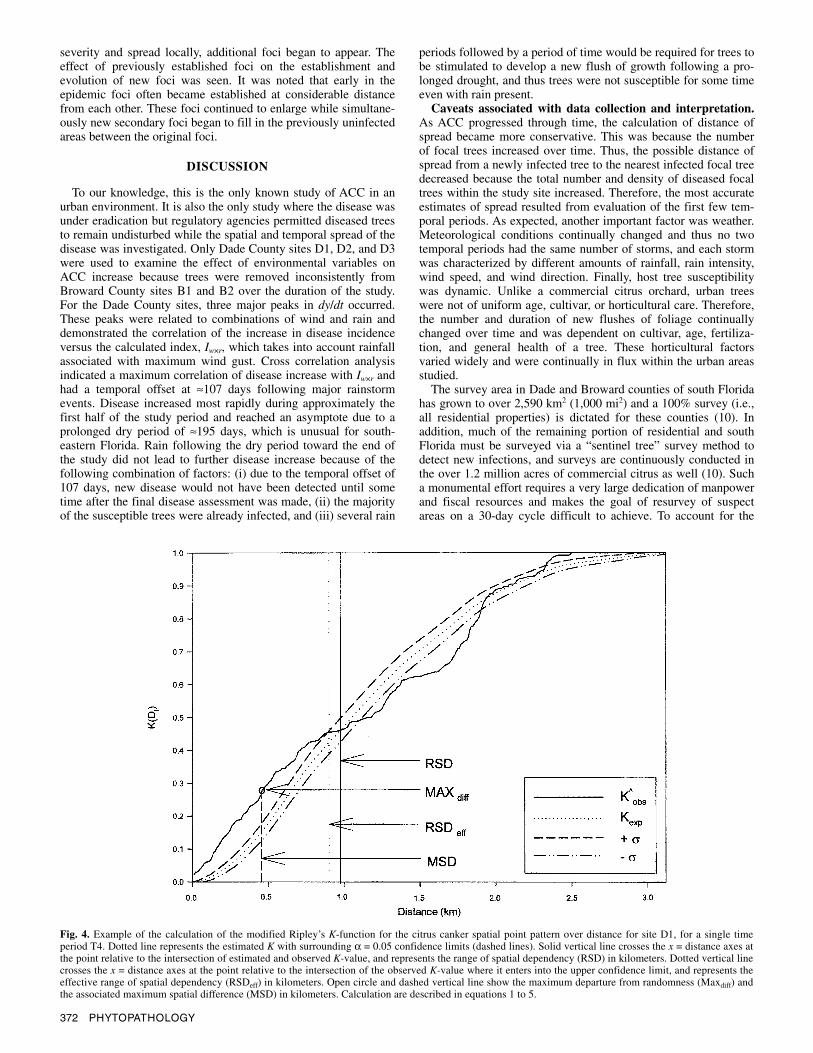
The above analysis was accomplished through the use of a VBA written by F. Ferrandino and compares the infected SPP to the total SPP. This generalized Ripley’s K-function was used to examine SPP of the five research sites regardless of time period and subsequently to examine the cumulative disease incidence for each site by time period T1 through T25. Via this method, analytical results were obtained for the range of spatial dependency (RSD), i.e., the distance at which the estimated and observed cdfs in equation 1 intersect; the effective range of spatial dependency (RSDeff), i.e., the distance over which the cdfs in equation 1 were significantly (P < 0.05) different; and the distance
Fig. 1. Temporal dynamics of citrus canker in urban Miami, Dade and Broward counties, Florida. A, Temporal increase of citrus canker in five study sites. B, The change in the rate of disease increase over time. C to F,Rainfall associated with study sites D1 and D2, D3, B1, and B2, respectively.

Vol. 92, No. 4, 2002 365
at which maximal spatial difference (MSD) occurred, and the cdf (K-value) associated with the maximum spatial difference (Maxdiff).
Spatiotemporal analysis of the spatial point pattern. Semi-variance analysis was used to further examine the spatiotemporal relationships among ACC-affected trees for each urban study site. Data sets for each site were prepared for analysis by assigning diseased trees a temporal value (t) based on the number of 30-day periods infected relative to the final assessment period. That is, if a tree remained healthy over the majority of time during which the epidemic was monitored but its disease status changes during the last four 30-day periods, then t = 4. Whereas if a tree remained in-fected for the duration of the time during which the epidemic was monitored, then t = 25. Thus, an individual tree was quantitatively weighted more heavily (by a larger t value) if it became infected earlier in the epidemic. Semivariogram analysis was performed using GS+ geostatistical software (version 5.1, Gamma Design
Software, Plainwell, MI) for 0° (omnidirectional with an angle of inclusion of 180°) and 0, 45, 90, and 135° relative to North, and each site with an angle of inclusion of 90°. The semivariance γ(h) (the variance about the mean difference in disease between all sampling units for a given distance = h) versus distance in meters was plotted. By convention, the distance between locations is designated as h for semivariance analyses, whereas it is desig-nated as d for the Ripley’s K-function. Linear, linear to sill, expo-nential, spherical, and Gaussian transitional models were fitted to the semivariance γ(h) versus distance data by means of nonlinear regression analysis performed via a model-fitting subroutine. The resulting two-dimensional spatiotemporal structure was consider-ed anisotropic when directional semivariograms diverged from one another over distance (15). The range of spatiotemporal de-pendency (RSTD = A0) was estimated using the chosen model as the point at which semivariance reached a plateau for each com-parison among temporal periods.
TABLE 1. Nearest neighbor distance calculations from citrus trees previously infected with Asiatic citrus canker caused by Xanthomonas axonopodis pv. citri to newly infected citrus trees in Miami, Dade County, site D1a
Distance (m) needed to circumscribe
Temporal period
Dates
Alpha tree age (30-day period)
Secondary tree age (30-day period)
No. of focal
(alpha) trees
No. of secondary infected
trees
%
Captured at 38.1 m 90% 95% 99%
Max.
distance (m)
Disease
incidence (DI)
Delta disease
incidence (DDI)
30-day 1st 10/26/97–11/24/97 >25 >24 4 10 0.00 1,127.76 1,159.32 1,159.32 1,159.32 0.0007 0.0007 2nd 11/25/97–12/24/97 >24 >23 14 9 22.22 769.35 769.35 769.35 769.35 0.0023 0.0017 3rd 12/25/97–1/23/98 >23 >22 23 17 0.00 548.64 599.16 599.16 599.16 0.0038 0.0015 4th 1/24/98–2/22/98 >22 >21 40 31 19.35 441.96 441.96 494.59 494.59 0.0066 0.0028 5th 2/23/98–3/24/98 >21 >20 71 51 50.98 137.16 228.60 360.40 360.40 0.0117 0.0051 6th 3/25/98–4/23/98 >20 >19 122 142 35.21 228.60 289.56 457.20 496.65 0.0201 0.0084 7th 4/24/98–5/23/98 >19 >18 264 216 44.44 152.40 228.60 441.96 552.98 0.0436 0.0234 8th 5/24/98–6/22/98 >18 >17 480 55 50.91 167.64 182.88 205.35 205.35 0.0793 0.0357 9th 6/23/98–7/22/98 >17 >16 535 68 63.24 106.68 106.68 135.10 135.10 0.0883 0.0091
60-day 1st 10/26/97–12/24/97 >25 >23 4 19 0.00 1,219.20 1,738.76 1,738.76 1,738.76 0.0007 0.0007 2nd 12/25/97–2/22/98 >23 >21 23 48 10.42 548.64 609.60 624.15 624.15 0.0038 0.0031 3rd 2/23/98–4/23/98 >21 >19 71 193 27.46 304.80 426.72 502.92 571.68 0.0117 0.0079 4th 4/24/98–6/22/98 >19 >17 264 271 42.44 152.40 228.60 441.96 552.98 0.0436 0.0319 5th 6/23/98–8/21/98 >17 >15 535 337 63.20 91.44 106.68 228.60 284.90 0.0883 0.0447 6th 8/22/98–10/20/98 >15 >13 872 339 79.06 76.20 91.44 121.92 239.55 0.1440 0.0556 7th 10/21/98–12/19/98 >13 >11 1,211 352 74.72 76.20 91.44 167.64 209.88 0.2000 0.0600 8th 12/20/98–2/17/99 >11 >9 1,563 195 75.38 60.96 91.44 198.12 229.31 0.2581 0.0581 9th 2/18/98–4/18/99 >9 >7 1,758 0 0.00 … … … 0.00 0.2903 0.0322
90-day 1st 10/26/97–1/23/98 >25 >22 4 36 0.00 1,767.84 1,767.84 1,783.39 1,783.39 0.0007 0.0007 2nd 12/25/97–3/24/98 >23 >20 23 99 23.23 548.64 563.88 633.51 633.51 0.0038 0.0031 3rd 2/23/98–5/23/98 >21 >18 71 409 25.43 304.80 411.48 487.68 747.59 0.0117 0.0079 4th 4/24/98–7/22/98 >19 >16 264 339 43.36 137.16 213.36 274.32 552.98 0.0436 0.0319 5th 6/23/98–9/20/98 >17 >14 535 589 64.01 91.44 106.68 228.60 284.90 0.0883 0.0447 6th 8/22/98–11/19/98 >15 >12 872 404 81.19 60.96 76.20 121.92 239.55 0.1440 0.0556 7th 10/21/98–1/18/99 >13 >10 1,211 520 70.19 76.20 91.44 137.16 209.88 0.2000 0.0560 8th 12/20/98 –3/19/99 >11 >8 1,563 195 75.38 60.96 91.44 198.12 229.31 0.2581 0.0581 9th 2/18/98–5/18/99 >9 >6 1,758 0 0.00 … … … 0.00 0.2903 0.0322
120-day 1st 10/26/97–2/22/98 >25 >21 4 67 1.49 1,767.84 1,767.84 1,837.27 1,837.27 0.0007 0.0007 2nd 12/25/97–4/23/98 >23 >19 23 241 14.52 518.16 563.88 716.28 965.00 0.0038 0.0031 3rd 2/23/98–6/22/98 >21 >17 71 464 24.35 289.56 411.48 502.92 747.59 0.0117 0.0079 4th 4/24/98–8/21/98 >19 >15 264 608 40.30 152.40 228.60 457.20 552.98 0.0436 0.0319 5th 6/23/98–10/20/98 >17 >13 535 676 64.64 91.44 106.68 228.60 284.90 0.0883 0.0447 6th 8/22/98–12/19/98 >15 >11 872 691 72.94 76.20 91.44 182.88 239.55 0.1440 0.0556 7th 10/21/98–2/17/99 >13 >9 1,211 547 69.47 76.20 91.44 167.64 229.31 0.2000 0.0560 8th 12/20/98–4/18/99 >11 >7 1,563 195 75.38 60.96 91.44 198.12 229.31 0.2581 0.0581 9th 2/18/99–6/17/99 >9 >5 1,758 0 0.00 … … … 0.00 0.2903 0.0322
a Repeated surveys were conducted of 6,056 citrus trees in Miami, Dade County, Florida. The location of all trees was determined via differential global positioning system, as was their disease status and, for infected trees, age of the oldest lesion. In each successive time period, the distances from all trees newly infected to the nearest identified previously infected (focal) tree were calculated via a visual basic application. The results thus provide conservative estimates of dispersal distances for the citrus canker pathogen. Time periods are 30 days in duration. The 30-day and 60-day time periods are consecutive and thus the number of existing focal trees plus the number of new infected trees is equivalent to the number of focal trees at the beginning of the next temporal period. However, the 90-day and 120-day time periods overlap with previous periods by 30 and 60 days, respectively, and thus, the number of focal trees is not additive from one period to the next. Prior to January 2000, the Citrus Canker Eradication Program used a distance of 38.1 m (125 ft) from known citrus canker-infected trees to define trees “exposed” to X. axonopodis pv. citri inoculum, and therefore, the percentage of new trees circumscribed by a 38.1-m radius is important for comparison.

366 PHYTOPATHOLOGY
Effects of plant density and cultivar susceptibility on disease incidence and severity were examined via a repeated stochastic sampling of square quadrats of 0.25, 0.5, 1.0, 1.5, and 2.0 km2 areas, respectively. Sites D1 and D2 were utilized because they represented large study areas where no disease trees were re-moved during the study. A VBA was used to randomly select a centroid point for each of 500 quadrats within sites, so as not to bias the calculations by location. A criterion was imposed such that only quadrats containing citrus trees and only quadrats with at least two diseased trees were accepted as part of the 500 quadrat population. For each quadrat, density of citrus trees, final disease incidence, and index of citrus species/cultivar susceptibility were calculated. During data collection surveys, citrus species/cultivar were assigned to 13 categories. Each category was given a suscep-tibility rating (0 to 6) based on a combination of prior published studies of susceptibility/resistance (7,14,18,20,21,23). Subse-quently, an alternative susceptibility rating was utilized that was
based on the actual disease incidence of each of the 13 species/ cultivar categories within each respective site. Trees were also assigned four height categories and their canopies divided into 12 sectors (north, east, south, and west and top, middle, and bottom). The following three indices were calculated for each tree and average indices for each quadrat. The index of disease suscep-tibility was calculated as
tcIt
iisus /
1
= ∑
= i = 0, 1,…..t, (6)
where c = the normalized cultivar susceptibility rating for each tree and t = the number of trees in each quadrat. The index represents a composite estimation of susceptibility based on all trees and accounted for the diversity of cultivar mixture within a given quadrat.
TABLE 2. Nearest neighbor distance calculations from citrus trees previously infected with Asiatic citrus canker caused by Xanthomonas axonopodis pv. citri to newly infected citrus trees in Miami, Dade County, site D2a
Distance (m) needed to circumscribe
Temporal period
Dates
Alpha tree
age (30-day period)
Secondary tree age (30-day period)
No. of focal
(alpha) trees
No. of secondary infected
trees
%
Captured at 38.1 m 90% 95% 99%
Max.
distance (m)
Disease
incidence (DI)
Delta disease
incidence (DDI)
30-day 1st 10/26/97–11/24/97 >25 >24 0 10 0.00 … … … 0.00 0.0000 0.0000 2nd 11/25/97–12/24/97 >24 >23 10 16 18.75 285.02 285.02 285.02 285.02 0.0016 0.0016 3rd 12/25/97–1/23/98 >23 >22 26 2 50.00 41.03 41.03 41.03 41.03 0.0043 0.0026 4th 1/24/98–2/22/98 >22 >21 28 6 0.00 200.90 200.90 200.90 200.90 0.0046 0.0003 5th 2/23/98–3/24/98 >21 >20 34 39 58.97 137.16 182.88 618.79 618.79 0.0056 0.0010 6th 3/25/98–4/23/98 >20 >19 73 35 62.86 137.16 167.64 309.19 309.19 0.0120 0.0064 7th 4/24/98–5/23/98 >19 >18 108 84 55.95 167.64 228.60 583.94 583.94 0.0178 0.0058 8th 5/24/98–6/22/98 >18 >17 192 141 64.54 91.44 182.88 228.60 416.56 0.0316 0.0138 9th 6/23/98–7/22/98 >17 >16 333 7 85.71 213.36 213.36 213.36 216.31 0.0548 0.0232
60-day 1st 10/26/97–12/24/97 >25 >23 0 26 0.00 … … … 0.00 0.0000 0.0000 2nd 12/25/97–2/22/98 >23 >21 26 8 12.50 200.90 200.90 200.90 200.90 0.0043 0.0043 3rd 2/23/98–4/23/98 >21 >19 34 74 58.11 137.16 167.64 618.79 618.79 0.0056 0.0013 4th 4/24/98–6/22/98 >19 >17 108 225 45.33 228.60 274.32 579.12 585.23 0.0178 0.0122 5th 6/23/98–8/21/98 >17 >15 333 32 68.75 76.20 213.36 216.31 216.31 0.0548 0.0371 6th 8/22/98–10/20/98 >15 >13 365 309 67.96 91.44 121.92 243.84 508.62 0.0601 0.0053 7th 10/21/98–12/19/98 >13 >11 674 25 84.00 60.96 60.96 104.91 104.91 0.1110 0.0509 8th 12/20/98–2/17/99 >11 >9 699 228 78.07 76.20 121.92 182.88 326.33 0.1151 0.0041 9th 2/18/98–4/18/99 >9 >7 927 41 63.41 91.44 121.92 131.69 131.69 0.1527 0.0375
90-day 1st 10/26/97–1/23/98 >25 >22 0 28 0.00 … … … 0.00 0.0000 0.0000 2nd 12/25/97–3/24/98 >23 >20 26 47 38.30 131.16 182.88 618.79 618.79 0.0043 0.0043 3rd 2/23/98–5/23/98 >21 >18 34 158 46.20 167.64 365.76 929.58 929.58 0.0056 0.0013 4th 4/24/98–7/22/98 >19 >16 108 232 45.69 228.60 289.56 579.12 585.23 0.0178 0.0122 5th 6/23/98–9/20/98 >17 >14 333 150 70.67 91.44 167.64 320.04 508.62 0.0548 0.0371 6th 8/22/98–11/19/98 >15 >12 365 334 65.57 91.44 121.92 259.08 508.62 0.0601 0.0053 7th 10/21/98–1/18/99 >13 >10 674 147 81.63 60.96 106.68 176.61 176.61 0.1110 0.0509 8th 12/20/98 --3/19/99 >11 >8 699 268 72.39 91.44 152.40 213.36 331.78 0.1151 0.0041 9th 2/18/98–5/18/99 >9 >6 927 42 64.29 91.44 121.92 131.69 131.69 0.1527 0.0375
120-day 1st 10/26/97–2/22/98 >25 >21 0 34 1.00 … … … 0.00 0.0000 0.0000 2nd 12/25/97–4/23/98 >23 >19 26 82 42.68 152.40 182.88 618.79 618.79 0.0043 0.0043 3rd 2/23/98–6/22/98 >21 >17 34 299 36.45 426.72 685.80 929.64 935.78 0.0056 0.0013 4th 4/24/98–8/21/98 >19 >15 108 257 43.19 228.60 304.80 594.36 662.60 0.0178 0.0122 5th 6/23/98–10/20/98 >17 >13 333 341 66.86 91.44 121.92 243.84 508.62 0.0548 0.0371 6th 8/22/98–12/19/98 >15 >11 365 334 65.57 91.44 121.92 259.08 508.62 0.0601 0.0053 7th 10/21/98–2/17/99 >13 >9 674 253 77.87 76.20 121.92 182.88 326.33 0.1110 0.0509 8th 12/20/98–4/18/99 >11 >7 699 269 72.49 91.44 152.40 213.36 331.78 0.1151 0.0041 9th 2/18/99–6/17/99 >9 >5 927 44 65.91 91.44 121.92 131.69 131.69 0.1527 0.0376
a Repeated surveys were conducted of 6,072 citrus trees in Miami, Dade County, Florida. The location of all trees was determined via differential global positioning system, as was their disease status and, for infected trees, age of the oldest lesion. In each successive time period, the distances from all trees newly infected to the nearest identified previously infected (focal) tree were calculated via a visual basic application. The results thus provide conservative estimates of dispersal distances for the citrus canker pathogen. Time periods are 30 days in duration. The 30-day and 60-day time periods are consecutive and thus the number of existing focal trees plus the number of new infected trees is equivalent to the number of focal trees at the beginning of the next temporal period. However, the 90-day and 120-day time periods overlap with previous periods by 30 and 60 days, respectively, and thus, the number of focal trees is not additive from one period to the next. Prior to January 2000, the Citrus Canker Eradication Program used a distance of 38.1 m (125 ft) from known citrus canker-infected trees to define trees “exposed” to X. axonopodis pv. citri inoculum, and therefore, the percentage of new trees circumscribed by a 38.1-m radius is important for comparison.

Vol. 92, No. 4, 2002 367
The index of disease severity was calculated as
nqhIt
iiiisev /)DSB(
1
××= ∑
= i = 0, 1,……t, (7)
where n = the total number of quadrats in the study area, DSB = the binary disease status of the tree (0,1), h = the normalized height of the tree, and q = the proportion of sectors infected for each tree. This index represents a composite estimation of disease
severity across all trees in a given quadrat and takes into account tree size and the relative volume of the canopy expressing disease.
The index of host density was calculated as
Ihd = t/(QS) (8)
where QS = quadrat size in square kilometers. This index repre-sents a calculation of the citrus tree population saturation (relative to the quadrat with the highest density) of a given quadrat. Each of
TABLE 3. Nearest neighbor distance calculations from citrus trees previously infected with Asiatic citrus canker caused by Xanthomonas axonopodis pv. citri to newly infected citrus trees in Miami, Dade County, site D3a
Distance (m) needed to circumscribe
Temporal period
Dates
Alpha tree
age (30-day period)
Secondary tree age (30-day period)
No. of focal
(alpha) trees
No. of secondary infected
trees
%
Captured at 38.1 m 90% 95% 99%
Max.
distance (m)
Disease
incidence (DI)
Delta disease
incidence (DDI)
30-day 1st 10/26/97–11/24/97 >25 >24 2 1 100.00 35.52 35.52 35.52 35.52 0.0025 0.0025 2nd 11/25/97–12/24/97 >24 >23 3 1 0.00 177.91 177.91 177.91 177.91 0.0038 0.0013 3rd 12/25/97–1/23/98 >23 >22 4 0 0.00 … … … 0.00 0.0050 0.0013 4th 1/24/98–2/22/98 >22 >21 4 1 100.00 12.19 12.19 12.19 12.19 0.0050 0.0000 5th 2/23/98–3/24/98 >21 >20 5 2 0.00 48.38 48.38 48.38 48.38 0.0063 0.0013 6th 3/25/98–4/23/98 >20 >19 7 0 0.00 … … … 0.00 0.0088 0.0025 7th 4/24/98–5/23/98 >19 >18 7 0 0.00 … … … 0.00 0.0088 0.0000 8th 5/24/98–6/22/98 >18 >17 7 0 0.00 … … … 0.00 0.0088 0.0000 9th 6/23/98–7/22/98 >17 >16 7 0 0.00 … … … 0.00 0.0088 0.0000 10th 7/23/98–8/21/98 >16 >15 7 0 0.00 … … … 0.00 0.0088 0.0000 11th 8/22/98–9/20/98 >15 >14 7 0 0.00 … … … 0.00 0.0088 0.0000 12th 9/21/98–10/20/98 >14 >13 7 1 100.00 3.72 3.72 3.72 3.72 0.0088 0.0000 13th 10/21/98–11/19/98 >13 >12 8 6 33.33 587.88 587.88 587.88 587.88 0.0100 0.0013 14th 11/20/98–12/19/98 >12 >11 14 0 0.00 … … … 0.00 0.0175 0.0075 15th 12/20/98–1/18/99 >11 >10 14 0 0.00 … … … 0.00 0.0175 0.0000 16th 1/19/99–2/17/99 >10 >9 14 4 25.00 274.64 274.64 274.64 274.64 0.0175 0.0000 17th 2/18/99–3/19/99 >9 >8 18 8 25.00 239.51 239.51 239.51 239.51 0.0226 0.0050 18th 3/20/99–4/18/99 >8 >7 26 0 0.00 … … … 0.00 0.0326 0.0100
60-day 1st 10/26/97–12/24/97 >25 >23 2 2 50.00 189.62 189.62 189.62 189.62 0.0025 0.0025 2nd 12/25/97–2/22/98 >23 >21 4 1 100.00 12.19 12.19 12.19 12.19 0.0050 0.0025 3rd 2/23/98–4/23/98 >21 >19 5 2 0.00 48.38 48.38 48.38 48.38 0.0063 0.0013 4th 4/24/98–6/22/98 >19 >17 7 0 0.00 … … … 0.00 0.0877 0.0025 5th 6/23/98–8/21/98 >17 >15 7 0 0.00 … … … 0.00 0.0877 0.0000 6th 8/22/98–10/20/98 >15 >13 7 1 100.00 3.72 3.72 3.72 3.72 0.0088 0.0000 7th 10/21/98–12/19/98 >13 >11 8 6 33.33 587.88 587.88 587.88 587.88 0.0100 0.0013 8th 12/20/98–2/17/99 >11 >9 14 4 25.00 274.64 274.64 274.64 274.64 0.0175 0.0075 9th 2/18/98–4/18/99 >9 >7 18 8 25.00 239.51 239.51 239.51 239.51 0.0226 0.0050
90-day 1st 10/26/97–1/23/98 >25 >22 2 2 50.00 189.77 189.77 189.77 189.77 0.0025 0.0025 2nd 12/25/97–3/24/98 >23 >20 4 3 33.33 48.38 48.38 48.38 48.38 0.0050 0.0025 3rd 2/23/98–5/23/98 >21 >18 5 2 0.00 48.38 48.38 48.38 48.38 0.0063 0.0013 4th 4/24/98–7/22/98 >19 >16 7 0 0.00 … … … 0.00 0.0088 0.0025 5th 6/23/98–9/20/98 >17 >14 7 0 0.00 … … … 0.00 0.0088 0.0000 6th 8/22/98–11/19/98 >15 >12 7 7 42.86 587.88 587.88 587.88 587.88 0.0088 0.0000 7th 10/21/98–1/18/99 >13 >10 8 6 33.33 587.88 587.88 587.88 587.88 0.0100 0.0013 8th 12/20/98–3/19/99 >11 >8 14 12 16.67 274.64 274.64 274.64 274.64 0.0175 0.0075 9th 2/18/98–5/18/99 >9 >6 18 8 25.00 239.51 239.51 239.51 239.51 0.0226 0.0050
120-day 1st 10/26/97–2/22/98 >25 >21 2 3 66.67 189.77 189.77 189.77 189.77 0.0025 0.0025 2nd 12/25/97–4/23/98 >23 >19 4 3 33.33 48.38 48.38 48.38 48.38 0.0050 0.0025 3rd 2/23/98–6/22/98 >21 >17 5 2 0.00 48.38 48.38 48.38 48.38 0.0063 0.0013 4th 4/24/98–8/21/98 >19 >15 7 0 0.00 … … … 0.00 0.0088 0.0025 5th 6/23/98–10/20/98 >17 >13 7 1 100.00 3.72 3.72 3.72 3.72 0.0088 0.0000 6th 8/22/98–12/19/98 >15 >11 7 7 42.86 587.88 587.88 587.88 587.88 0.0088 0.0000 7th 10/21/98–2/17/99 >13 >9 8 10 30.00 587.88 587.88 587.88 587.88 0.0100 0.0013 8th 12/20/98–4/18/99 >11 >7 14 12 16.67 274.32 274.64 274.64 274.64 0.0175 0.0075 9th 2/18/99–6/17/99 >9 >5 18 8 25.00 239.51 239.51 239.51 239.51 0.0226 0.0050
a Repeated surveys were conducted of 798 citrus trees in Miami, Dade County, Florida. The location of all trees was determined via differential global positioning system, as was their disease status and, for infected trees, age of the oldest lesion. In each successive time period, the distances from all trees newly infected to the nearest identified previously infected (focal) tree were calculated via a visual basic application. The results thus provide conservative estimates of dispersal distances for the citrus canker pathogen. Time periods are 30 days in duration. The 30-day and 60-day time periods are consecutive and thus the number of existing focal trees plus the number of new infected trees is equivalent to the number of focal trees at the beginning of the next temporal period. However, the 90-day and 120-day time periods overlap with previous periods by 30 and 60 days, respectively, and thus, the number of focal trees is not additive from one period to the next. Prior to January 2000, the Citrus Canker Eradication Program used a distance of 38.1 m (125 ft) from known citrus canker-infected trees to define trees “exposed” to X. axonopodis pv. citri inoculum, and therefore, the percentage of new trees circumscribed by a 38.1-m radius is important for comparison.

368 PHYTOPATHOLOGY
the above indices was normalized, resulting in values from 0 to 1 for each quadrat sampled.
Index of disease severity values were also used to perform a semivariance analysis followed by a kriging of the data by the block method to visualize the occurrence and position of foci and the development and spread of disease through time. Kriging was performed at four time periods selected to best represent periods following significant increases in disease.
RESULTS
Temporal progress and interaction with meteorological events. Study sites B1 and B2 were not used to examine the relationship to specific meteorological events because trees were removed from these sites throughout the study. This condition undoubtedly affected disease progress. Disease increased within all plots but was most evident during the first approximately
540 days. After this period, disease increase slowed dramatical- ly and reached a plateau due to the prevalence of dry weather and the depletion of the noninfected susceptible host trees (Fig. 1A). The rate of disease increase (dy/dt) varied through time and peaked at three times (for sites D1, D2, and D3) over the duration of the study depending on research site (Fig. 1B). Peaks were generally offset in time following significant rain events (Fig. 1C to F). The more rapid changes in disease incidence followed meteorological events with a corresponding combination of wind gust and precipitation represented by Iw×r. Cross correlation analyses were conducted to determine the temporal offset of disease progress for combined data from study sites D1, D2, and D3 in relation to the combined weather parameters (Iw×r). Maximum correlation (r = 0.988) occurred ≈107 days following major rainstorm events. These results indicated that disease was visually detected with the highest accuracy by survey teams ≈107 days after infection.
TABLE 4. Nearest neighbor distance calculations from citrus trees previously infected with Asiatic citrus canker caused by Xanthomonas axonopodis pv. citri tonewly infected citrus trees in Miami, Broward County, site B1a
Distance (m) needed to circumscribe
Temporal period
Dates
Alpha tree
age (30-day period)
Secondary tree age (30-day period)
No. of focal
(alpha) trees
No. of secondary infected
trees
%
Captured at 38.1 m 90% 95% 99%
Max.
distance (m)
Disease
incidence (DI)
Delta disease
incidence (DDI)
30-day 1st 10/26/97–11/24/97 >25 >24 2 28 10.71 441.96 533.40 3,474.06 3,474.06 0.0004 0.0004 2nd 11/25/97–12/24/97 >24 >23 30 27 29.63 198.12 335.28 875.38 875.38 0.0063 0.0059 3rd 12/25/97–1/23/98 >23 >22 57 4 25.00 139.04 139.04 139.04 139.04 0.0121 0.0057 4th 1/24/98–2/22/98 >22 >21 61 8 25.00 893.52 893.52 893.52 893.52 0.0129 0.0008 5th 2/23/98–3/24/98 >21 >20 69 56 44.64 350.52 487.68 962.69 962.69 0.0146 0.0017 6th 3/25/98–4/23/98 >20 >19 125 35 71.43 198.12 406.96 406.96 406.96 0.0266 0.0121 7th 4/24/98–5/23/98 >19 >18 160 27 40.74 243.84 411.48 518.19 518.19 0.0342 0.0076 8th 5/24/98–6/22/98 >18 >17 187 79 32.91 198.12 365.76 679.28 679.28 0.0397 0.0055 9th 6/23/98–7/22/98 >17 >16 266 85 40.00 152.40 228.60 294.01 294.01 0.0562 0.0165
60-day 1st 10/26/97–12/24/97 >25 >23 2 55 5.45 441.96 2,606.04 3,539.94 3,539.94 0.0004 0.0004 2nd 12/25/97–2/22/98 >23 >21 57 12 25.00 868.68 893.52 893.52 893.52 0.0121 0.0116 3rd 2/23/98–4/23/98 >21 >19 69 91 46.15 320.04 670.56 981.56 981.56 0.0146 0.0025 4th 4/24/98–6/22/98 >19 >17 160 106 28.30 243.84 381.00 685.80 700.46 0.0342 0.0197 5th 6/23/98–8/21/98 >17 >15 266 98 45.92 152.40 228.60 347.62 347.62 0.0562 0.0220 6th 8/22/98–10/20/98 >15 >13 364 68 50.00 121.92 167.64 190.33 190.33 0.0772 0.0209 7th 10/21/98–12/19/98 >13 >11 432 18 88.89 41.09 41.09 41.09 41.09 0.0913 0.0142 8th 12/20/98–2/17/99 >11 >9 450 0 0.00 … … … 0.00 0.0951 0.0038 9th 2/18/98–4/18/99 >9 >7 450 0 0.00 … … … 0.00 0.0951 0.0000
90-day 1st 10/26/97–1/23/98 >25 >22 2 59 5.08 441.96 3,474.72 3,539.94 3,539.94 0.0004 0.0004 2nd 12/25/97–3/24/98 >23 >20 57 68 35.29 838.20 868.68 962.69 962.69 0.0121 0.0116 3rd 2/23/98–5/23/98 >21 >18 69 118 38.98 411.48 670.56 975.36 981.56 0.0146 0.0025 4th 4/24/98–7/22/98 >19 >16 160 191 26.70 335.28 426.72 685.80 700.46 0.0342 0.0197 5th 6/23/98–9/20/98 >17 >14 266 130 42.31 182.88 228.60 304.80 347.62 0.0562 0.0220 6th 8/22/98–11/19/98 >15 >12 364 81 55.70 121.92 167.64 190.33 190.33 0.0772 0.0209 7th 10/21/98–1/18/99 >13 >10 432 18 88.89 41.09 41.09 41.09 41.09 0.0913 0.0142 8th 12/20/98 --3/19/99 >11 >8 450 0 0.00 … … … 0.00 0.0951 0.0038 9th 2/18/98–5/18/99 >9 >6 450 0 0.00 … … … 0.00 0.0951 0.0000
120-day 1st 10/26/97–2/22/98 >25 >21 2 67 5.97 960.12 2,606.04 3,539.94 3,539.94 0.0004 0.0004 2nd 12/25/97–4/23/98 >23 >19 57 103 37.86 807.72 868.68 975.36 981.56 0.0121 0.0116 3rd 2/23/98–6/22/98 >21 >17 69 197 27.92 462.72 579.12 975.36 981.56 0.0146 0.0025 4th 4/24/98–8/21/98 >19 >15 160 204 28.43 335.28 411.48 563.88 700.46 0.0342 0.0197 5th 6/23/98–10/20/98 >17 >13 266 166 39.16 198.12 228.60 304.80 347.62 0.0562 0.0220 6th 8/22/98–12/19/98 >15 >11 364 86 57.14 106.68 152.40 190.33 190.33 0.0772 0.0209 7th 10/21/98–2/17/99 >13 >9 432 18 88.89 41.09 41.09 41.09 41.09 0.0913 0.0142 8th 12/20/98–4/18/99 >11 >7 450 0 0.00 … … … 0.00 0.0951 0.0038 9th 2/18/99–6/17/99 >9 >5 450 0 0.00 … … … 0.00 0.0951 0.0000
a Repeated surveys were conducted of 4,730 citrus trees in Miami, Broward County, Florida. The location of all trees was determined via differential global positioning system, as was their disease status and, for infected trees, age of the oldest lesion. In each successive time period, the distances from all trees newly infected to the nearest identified previously infected (focal) tree were calculated via a visual basic application. The results thus provide conservative estimates of dispersal distances for the citrus canker pathogen. Time periods are 30 days in duration. The 30-day and 60-day time periods are consecutive and thus the number of existing focal trees plus the number of new infected trees is equivalent to the number of focal trees at the beginning of the next temporal period. However, the 90-day and 120-day time periods overlap with previous periods by 30 and 60 days, respectively, and thus, the number of focal trees is not additive from one period to the next. Prior to January 2000, the Citrus Canker Eradication Program used a distance of 38.1 m (125 ft) from known citrus canker-infected trees to define trees “exposed” to X. axonopodis pv. citri inoculum, and therefore, the percentage of new trees circumscribed by a 38.1-m radius is important for comparison.

Vol. 92, No. 4, 2002 369
Results from the spatiotemporal studies of disease spread are presented in Tables 1 to 5 associated with Dade and Broward counties. Each table presents the proportion of newly diseased trees that was estimated to occur within 38.1 m (125 ft) of nearest focal trees. Subsequent table columns represent the distance cate-gory ±15.2 m (50 ft) that was necessary to circumscribe 90, 95, 99, and 100% (maximum distance) of all newly infected trees during the indicated time period. Example histograms of the fre-quency distribution for selected temporal periods are provided as examples (Fig. 2). Table 1 demonstrates that as the density of infected trees increases through time, the distance calculation be-tween temporal periods becomes more conservative. This results because more infected trees lie closer to each other and thus dis-tance measurements to newly infected trees decreased through time.
Therefore, the most important estimates of spread resulted from consideration of the first few temporal periods, during which long-
er distance estimates were less obscured. For site D1, the ranges of the maximum distances of spread measured for the first four 30-, 60-, 90-, and 120-day periods were 494 to 1,159, 552 to 1,739, 552 to 1,768, and 441 to 1,829 m (1,622 to 3,803, 1,814 to 5,705, 1,814 to 5,801, and 1,450 to 6,000 ft), respectively. In this site, during the first 30-day period, four ACC-affected trees gave rise to 10 newly infected trees, the farthest was 1,159 m distant and none were within the first 38 m. For site D2, the ranges of distance measurements were considerably less at first but longer distance measurements up to 618 m (2,030 ft) were obtained for 30-day periods after 23 February 1998. Site D3 is of interest be-cause there were only two diseased trees in the area at the onset of the epidemic and all surrounding areas for several miles were free of disease. When the 30-day period measurements were examined, they represented the emergence of only a few new diseased trees from very few previously infected trees, and thus provided rela-
TABLE 5. Nearest neighbor distance calculations from citrus trees previously infected with Asiatic citrus canker caused by Xanthomonas axonopodis pv. citri to newly infected citrus trees in Miami, Broward County, site B2a
Distance (m) needed to circumscribe
Temporal period
Dates
Alpha tree
age (30-day period)
Secondary tree age (30-day period)
No. of focal (alpha) trees
No. of secondary infected
trees
%
Captured at 38.1 m 90% 95% 99%
Max.
distance (m)
Disease
incidence (DI)
Delta disease
incidence (DDI)
30-day 1st 10/26/97–11/24/97 >25 >24 1 8 0.00 350.81 350.81 350.81 350.81 0.0009 0.0009 2nd 11/25/97–12/24/97 >24 >23 9 9 33.33 189.70 189.70 189.70 189.70 0.0081 0.0072 3rd 12/25/97–1/23/98 >23 >22 18 3 33.33 399.51 399.51 399.51 399.51 0.0162 0.0081 4th 1/24/98–2/22/98 >22 >21 21 5 40.00 150.27 150.27 150.27 150.27 0.0189 0.0027 5th 2/23/98–3/24/98 >21 >20 26 29 72.41 121.92 198.12 224.37 224.37 0.0234 0.0045 6th 3/25/98–4/23/98 >20 >19 55 14 57.14 60.96 103.72 103.72 103.72 0.0494 0.0261 7th 4/24/98–5/23/98 >19 >18 69 11 0.36 55.30 55.30 55.30 55.30 0.0620 0.0126 8th 5/24/98–6/22/98 >18 >17 80 33 0.45 334.59 334.59 334.59 334.59 0.0719 0.0099 9th 6/23/98–7/22/98 >17 >16 113 40 62.50 213.36 335.28 474.49 474.49 0.1015 0.0297
60-day 1st 10/26/97–12/24/97 >25 >23 1 17 0.00 274.32 350.81 350.81 350.81 0.0009 0.0009 2nd 12/25/97–2/22/98 >23 >21 18 8 37.50 399.51 399.51 399.51 399.51 0.0162 0.0153 3rd 2/23/98–4/23/98 >21 >19 26 43 65.12 106.68 121.92 224.37 224.37 0.0234 0.0072 4th 4/24/98–6/22/98 >19 >17 69 44 34.09 121.92 334.59 334.59 334.59 0.0620 0.0386 5th 6/23/98–8/21/98 >17 >15 113 40 62.50 213.36 335.28 474.49 474.49 0.1015 0.0395 6th 8/22/98–10/20/98 >15 >13 153 41 58.54 91.44 106.68 171.37 171.37 0.1375 0.0359 7th 10/21/98–12/19/98 >13 >11 194 31 74.19 60.96 76.20 87.93 87.93 0.1743 0.0368 8th 12/20/98–2/17/99 >11 >9 225 4 50.00 55.40 55.40 55.40 55.40 0.2022 0.0279 9th 2/18/98–4/18/99 >9 >7 229 0 0.00 … … … 0.00 0.2058 0.0036
90-day 1st 10/26/97–1/23/98 >25 >22 1 20 0.00 365.76 548.64 749.25 749.25 0.0009 0.0009 2nd 12/25/97–3/24/98 >23 >20 18 37 62.16 198.12 274.32 399.51 399.51 0.0162 0.0153 3rd 2/23/98–5/23/98 >21 >18 26 54 53.70 106.68 121.92 224.37 224.37 0.0234 0.0072 4th 4/24/98–7/22/98 >19 >16 69 84 30.95 289.56 335.28 573.87 573.87 0.0620 0.0386 5th 6/23/98–9/20/98 >17 >14 113 56 58.93 198.12 335.28 474.49 474.49 0.1015 0.0395 6th 8/22/98–11/19/98 >15 >12 153 72 54.17 152.40 167.64 172.54 172.54 0.1375 0.0359 7th 10/21/98–1/18/99 >13 >10 194 33 69.70 60.96 76.20 87.93 87.93 0.1743 0.0368 8th 12/20/98–3/19/99 >11 >8 225 4 50.00 55.40 55.40 55.40 55.40 0.2022 0.0279 9th 2/18/98–5/18/99 >9 >6 229 0 0.00 … … … 0.00 0.2058 0.0036
120-day 1st 10/26/97–2/22/98 >25 >21 1 25 0.00 426.72 548.64 749.25 749.25 0.0009 0.0009 2nd 12/25/97–4/23/98 >23 >19 18 51 56.86 152.40 274.32 399.51 399.51 0.0162 0.0153 3rd 2/23/98–6/22/98 >21 >17 26 87 37.93 137.16 320.04 507.97 507.97 0.0234 0.0072 4th 4/24/98–8/21/98 >19 >15 69 84 30.95 289.56 335.28 573.87 573.87 0.0620 0.0386 5th 6/23/98–10/20/98 >17 >13 113 81 55.56 121.92 213.36 474.49 474.49 0.1015 0.0395 6th 8/22/98–12/19/98 >15 >11 153 72 54.18 152.40 167.64 172.54 172.54 0.1375 0.0359 7th 10/21/98–2/17/99 >13 >9 194 35 71.43 60.96 76.20 87.93 87.93 0.1743 0.0368 8th 12/20/98–4/18/99 >11 >7 225 4 50.00 55.40 55.40 55.40 55.40 0.2022 0.0279 9th 2/18/99–6/17/99 >9 >5 229 0 0.00 … … … 0.00 0.2058 0.0036
a Repeated surveys were conducted of 1,113 citrus trees in Miami, Broward County, Florida. The location of all trees was determined via differential global positioning system, as was their disease status and, for infected trees, age of the oldest lesion. In each successive time period, the distances from all trees newly infected to the nearest identified previously infected (focal) tree were calculated via a visual basic application. The results thus provide conservative estimates of dispersal distances for the citrus canker pathogen. Time periods are 30 days in duration. The 30-day and 60-day time periods are consecutive and thus the number of existing focal trees plus the number of new infected trees is equivalent to the number of focal trees at the beginning of the next temporal period. However, the 90-day and 120-day time periods overlap with previous periods by 30 and 60 days, respectively, and thus, the number of focal trees is not additive from one period to the next. Prior to January 2000, the Citrus Canker Eradication Program used a distance of 38.1 m (125 ft) from known citrus canker-infected trees to define trees “exposed” to X. axonopodis pv. citri inoculum, and therefore, the percentage of new trees circumscribed by a 38.1-m radius is important for comparison.

370 PHYTOPATHOLOGY
tively unobscured measurements of spread. The longest distance measurement for D3 occurred during the 30-day period following 21 December 1998, when eight previously infected trees gave rise to six newly infected trees with a maximum distance of 588 m (1,929 ft). Site B1 had the longest calculated distance of spread measurement, 3,474 m (11,398 ft), which occurred during the first 30-day period when two previously infected trees gave rise to 28 newly infected trees. Site B2 resulted in maximum calculated distances of spread during 30-day intervals that ranged from 55 to 475 m (181 to 1,557 ft).
Figure 3 represents frequency distributions for each study site for all possible distances of spread from minimum to maximum. Peaks in this distribution that represented the most common dis-tance categories calculated were 640, 457, 60, 518, 243, and 335 m (2,100, 1,499, 197, 1,699, 797, and 1,099 ft) for D1, D2, D2, D3, B1, and B2, respectively, based on 30-day intervals. Note that D2 was bimodal and had two equivalent high frequency peaks. Maximum possible distances of spread based on the data from each area were 3,444, 2,133, 914, 4,754, and 1,432 m (11,299, 6,998, 2,999, 15,597, and 4,698 ft) for D1, D2, D3, B1, and B2, respectively.
Ripley’s K-function. Modified Ripley’s K analysis of the citrus canker SPP for each of the study sites was performed encom-passing the entire study period. That is, the SPP evident in each time period, T1 to T25, was calculated and examined in order to better understand and explain the change among successive SPP associated with the spread of ACC in the study sites. The SPP examined in each time period consisted of the new infections occurring in that time period, as well as all diseased citrus trees from previous time periods. The dynamics of the range of spatial dependency (RSD = the distance at which the estimated and observed modified Ripley’s K cdf values intersect), the effective range of spatial dependency (RSDeff) at α = 0.05, and the maxi-mum departure from randomness (MaxDif) and its associated dis-tance (MSD) were calculated for each 30-day period (Figs. 4 and 5A to D). Aggregation of the SPP, exhibited by a significant dif-ference between the cumulative distribution functions in equations 1 and 2 above, was exhibited in all of the respective sites through the entire range of time. By applying this method across the 25
temporal periods of the study, the regional spatiotemporal rela-tionships of ACC were examined for each study site and among study sites. In general, aggregation increased concomitantly with disease incidence. This aggregation was expressed by the RSDeff that increased across all study sites and approached a maximum during the first few temporal periods. The RSDeff associated with sites D2, D3, and B2 increased through time until it reached a maximum plateau, whereas for D1 and B1, the RSDeff occurred during T3 and T7, respectively, and decreased over the next several temporal periods before reaching a lower plateau. The maxi-mum RSDeff for sites D1, D2, D3, B1A, and B1B was 1.53, 2.13, 0.85, 3.78, and 1.61 km and corresponded to 30-day periods T3, T2, T18, T6, and T9, respectively. The greatest departures from randomness, Maxdiff, for D1, D2, D3, B1A, and B1B were K-values of 0.45, 0.69, 1.00, 0.73, and 0.71 and corresponded to dis-tances of 1.03, 0.69, 0.01, 0.95, and 0.31 km, respectively. Exami-nation of the SPP maps for each plot revealed that for D1, D2, and D3, the distribution of citrus canker-infected trees over the extents of each plot was first seen at T3, T2, and T17, respectively, and related to RSDeff spatiotemporal distance relationships of 1.5, 2.2, and 1.6 km, respectively.
Analyses of the spatiotemporal relationships of the SPP of ACC were conducted to compare consecutive 30-day periods over the duration of all 25 temporal periods. The spherical model was the best descriptor of the spatiotemporal structure of the point patterns for sites D1, D2, and D3 through time based on residuals of re-gression and the r2 of regression. This model provided a definitive estimation of the RSTD = the range of spatiotemporal depend-ency. That is, for the associations of diseased trees, the model was capable of expressing the significant range of distance over which this association occurred and the dynamics of this range through time. The isotropic RSTD increased rapidly for site D1. The spatiotemporal structure had a RSTD of 0.119 km for the com-parison of the first versus the second 30-day period. The RSTD exceeded the maximum active lag distance (80% of the longest diagonal axes of the site) with the comparison of the second and third 30-day periods, which corresponded to spread of citrus canker across the entire site by T3. For site D2, no focal trees existed during T1, but at T2, ACC-affected trees were widely dis-
Fig. 2. Examples of the frequency of occurrence of new infections relative to the nearest preexisting citrus canker-infected tree (calculated to the nearest 15.25 m[50 ft]) during a 30-day period for A, site D1 for period T2; B, site D1 for period T5; C, site D2 for period T5; and D, site D2 for period T7. Tables 1 through 5 provide complete data presentation.

Vol. 92, No. 4, 2002 371
persed across the site. Thus, the first comparison that could be made was between T2 and T3 for which the RSTD exceed the maximum active lag distance. For site D3, disease started with a single isolated focal tree and increased intermittently through time. Only very few diseased trees existed until T6 and thus no spatiotemporal comparisons could be made until that time. Sub-sequent periods of disease increase were related to T13, T14, T17, and T25. RSTD values associated with T1 to T6, T1 to T13, and T1 to T14 were 0.037, 0.009, and 0.033 km, respectively. Spatio-temporal comparisons of T1 to T17 and T1 to T25 resulted in RSTD values that exceeded the active lag distance extents of the plot.
The effects of host plant density and cultivar/species susceptibility on disease incidence and disease severity. Of the various quadrat sizes tested, the 0.25-km2 quadrat size resulted in the clearest relationship among those variables and indices examined, and therefore, was used for all further analyses. The random distribution of the centroids of each of the quadrats was selected by the stochastic process for sites D1 and D2. The appro-priateness of the stochastic quadratization method was evaluated against a simple nonoverlapping quadratization method, the latter of which resulted in far fewer quadrats for comparison. The same data trends were found with both methods, indicating no unique outcomes associated with the use of stochastic overlapping quadratization, and led to its application for all further com-parisons.
Linear regression of disease incidence versus host plant density resulted in low coefficients of regression and slightly positive slopes for both D1 and D2, indicating little or no effect of host plant density on disease incidence. However, the variance associ-ated with the relationship of disease incidence to host plant den-sity decreased as density increased. That is, at lower host densities, disease incidence was more variable and variability decreased with increased host density. This decrease was more apparent for site D1 than for D2. Similarly, linear regression of disease severity (the proportion of diseased sectors of individual trees) versus host density indicated a slight positive slope for both sites, indicating little or no effect of host plant density on disease severity (Fig. 6A and F). The associated variance for this relationship also de-creased as density increased. Linear regression of disease inci-dence versus the index of disease severity resulted in a positive slope and high r2 values for both sites, indicating that much of the variation due to regression was accounted for and indicated a direct relationship between increasing disease incidence and in-creasing disease severity, as expected.
Susceptibility was best expressed as a function of proportion of diseased individuals in each cultivar/species category that became infected relative to each site (data not shown), and this index of susceptibility was used for all further comparisons. For both sites, linear regression resulted in positive slopes for both disease inci-dence and the index of disease severity versus the index of sus-ceptibility (Fig. 6B and G). The associated r2 of regression values accounted for more of the variation due to regression for site D2 compared with site D1, and for D2 demonstrated a much greater effect of host susceptibility on incidence and severity. Normalized susceptibility was heavily clustered in the low and midrange for sites D1 and D2, respectively, with considerable variation in disease incidence and disease severity. This clustering of values represented a high population of plants with similar susceptibility in both sites that was independent of host density.
The combined effect and interaction of host density and the index of susceptibility of quadrats on incidence and severity was also investigated (Fig. 6C and H). The associated r2 of regression values, although low, still accounted for more of the variation due to regression for site D2 than site D1, and for D2 demonstrated a more positive slope, indicating a greater effect of the suscep-tibility–density index on incidence and severity. Although more prevalent for D1 than D2, the variance associated with the rela-
tionship decreased as incidence and severity increased, indicating a better relationship of higher values of the susceptibility–density index with incidence and severity.
Kriging of the Isev demonstrated the occurrence and develop-ment of foci of disease in each of the urban areas (Fig. 7). For each of the study sites, foci of infection that established early in the study can be seen. As these foci continued to increase in
Fig. 3. Frequency distributions of occurrence of new infections relative to all possible preexisting citrus canker-infected trees to the nearest 30.5 m (100 ft) for A, site D1; B, site D2; C, site D3; D, site B1; and E, site B2. Distances represent the full range from minimum to maximum distances based on 30-day periods.
372 PHYTOPATHOLOGY
severity and spread locally, additional foci began to appear. The effect of previously established foci on the establishment and evolution of new foci was seen. It was noted that early in the epidemic foci often became established at considerable distance from each other. These foci continued to enlarge while simultane-ously new secondary foci began to fill in the previously uninfected areas between the original foci.
DISCUSSION
To our knowledge, this is the only known study of ACC in an urban environment. It is also the only study where the disease was under eradication but regulatory agencies permitted diseased trees to remain undisturbed while the spatial and temporal spread of the disease was investigated. Only Dade County sites D1, D2, and D3 were used to examine the effect of environmental variables on ACC increase because trees were removed inconsistently from Broward County sites B1 and B2 over the duration of the study. For the Dade County sites, three major peaks in dy/dt occurred. These peaks were related to combinations of wind and rain and demonstrated the correlation of the increase in disease incidence versus the calculated index, Iw×r, which takes into account rainfall associated with maximum wind gust. Cross correlation analysis indicated a maximum correlation of disease increase with Iw×r and had a temporal offset at ≈107 days following major rainstorm events. Disease increased most rapidly during approximately the first half of the study period and reached an asymptote due to a prolonged dry period of ≈195 days, which is unusual for south-eastern Florida. Rain following the dry period toward the end of the study did not lead to further disease increase because of the following combination of factors: (i) due to the temporal offset of 107 days, new disease would not have been detected until some time after the final disease assessment was made, (ii) the majority of the susceptible trees were already infected, and (iii) several rain
periods followed by a period of time would be required for trees to be stimulated to develop a new flush of growth following a pro-longed drought, and thus trees were not susceptible for some time even with rain present.
Caveats associated with data collection and interpretation. As ACC progressed through time, the calculation of distance of spread became more conservative. This was because the number of focal trees increased over time. Thus, the possible distance of spread from a newly infected tree to the nearest infected focal tree decreased because the total number and density of diseased focal trees within the study site increased. Therefore, the most accurate estimates of spread resulted from evaluation of the first few tem-poral periods. As expected, another important factor was weather. Meteorological conditions continually changed and thus no two temporal periods had the same number of storms, and each storm was characterized by different amounts of rainfall, rain intensity, wind speed, and wind direction. Finally, host tree susceptibility was dynamic. Unlike a commercial citrus orchard, urban trees were not of uniform age, cultivar, or horticultural care. Therefore, the number and duration of new flushes of foliage continually changed over time and was dependent on cultivar, age, fertiliza-tion, and general health of a tree. These horticultural factors varied widely and were continually in flux within the urban areas studied.
The survey area in Dade and Broward counties of south Florida has grown to over 2,590 km2 (1,000 mi2) and a 100% survey (i.e., all residential properties) is dictated for these counties (10). In addition, much of the remaining portion of residential and south Florida must be surveyed via a “sentinel tree” survey method to detect new infections, and surveys are continuously conducted in the over 1.2 million acres of commercial citrus as well (10). Such a monumental effort requires a very large dedication of manpower and fiscal resources and makes the goal of resurvey of suspect areas on a 30-day cycle difficult to achieve. To account for the
Fig. 4. Example of the calculation of the modified Ripley’s K-function for the citrus canker spatial point pattern over distance for site D1, for a single time period T4. Dotted line represents the estimated K with surrounding α = 0.05 confidence limits (dashed lines). Solid vertical line crosses the x = distance axes at the point relative to the intersection of estimated and observed K-value, and represents the range of spatial dependency (RSD) in kilometers. Dotted vertical line crosses the x = distance axes at the point relative to the intersection of the observed K-value where it enters into the upper confidence limit, and represents the effective range of spatial dependency (RSDeff) in kilometers. Open circle and dashed vertical line show the maximum departure from randomness (Maxdiff) and the associated maximum spatial difference (MSD) in kilometers. Calculation are described in equations 1 to 5.

Vol. 92, No. 4, 2002 373
probable inability to resurvey every 30 days, longer temporal periods of disease increase and spread were examined also.
In January 2000, a “1,900-ft regulation” was adopted by CCEP to define exposed trees for removal within that radius of an infected tree (10). If we consider the first four 30-day temporal periods over all of the study sites during which spread occurred, 3 of 12, 4 of 12, 7 of 12, and 7 of 12 of these 30-day periods had calculated distances of spread that required >579 m (1,900 ft) to circumscribe 90, 95, 99, and 100% of the newly infected trees, respectively. Thus, 579 m is a distance that is neither the longest nor the shortest distance calculated but rather a compromise that represents a common distance of disease spread during a 30-day period. It should be considered that spread of the disease over some of the larger distances measured could have been the result of movement of inoculum or infected plant materials by human or mechanical means. Thus, the distance estimates needed to circum-scribe 95 or 99% of the newly infected trees, rather than 100%, would be a conservative estimate of maximum possible spread. Even so, it would appear from examination of results of the calcu-lations presented that radii of ≥579 m would be necessary to define exposed trees for removal to contain spread in many cases.
If we consider the temporal results mentioned previously, cross correlation analysis indicated that the maximum visual detection of disease was a little over 3 months (107 days) after a dissemi-nation event. From a survey and detection point of view, there has been consideration given to increasing survey frequency, i.e., decreasing the time period between repeat surveys of an area, in an attempt to offset the need to increase the radius from 38-m (125 ft), as previously used by the eradication program, to some greater distance in an effort to circumscribe the majority of new
infections. This approach was not supported by the results of this study for the following reasons: (i) for some of the 30-day tem-poral periods, only a single storm event occurred, yet this event resulted in spread of the disease far in excess of the 38.1-m distance; (ii) the ever-expanding ACC quarantine area makes it less and less possible to resurvey all infested sections in a timely manner even with increased manpower; (iii) surveys crews are unlikely to detect all disease in an area because they rarely have 100% access to all properties within a survey area; and (iv) most importantly, maximum visual detection does not occur until about 107 days following dissemination, indicating that a portion of the infections are subclinical. Because visual surveys are less sensi-tive than desired, numerous small infestations of disease are not accounted for until subsequent surveys. Therefore, the conclusion that the 38.1-m radius could still be used if combined with more frequent survey cycles could lead to a false sense of security that the disease can be managed simply by increasing the frequency of resurvey. In our estimation, this is unlikely to hold true.
The effect of meteorological events on the spread of ACC is significant and not addressed here other than to recognize that spread was not consistent from one time period to the next. The complexities of meteorological events, especially the interaction of wind and rain in pathogen dispersal and infection, has been examined in commercial plantings previously (4,8,9,11–13,16) and will be examined in urban settings in future work. Although these further analyses will likely provide greater insight into the spatial distribution and dynamics of ACC in an urban environ-ment, they will not change the measurements of distances of spread determined by this study. For regulatory purposes, the most important results were the establishment of distances of spread
Fig. 5. Modified Ripley’s K-function analysis for the citrus canker spatial point pattern for five study sites in Miami, Dade and Broward counties, Florida, over 25 30-day contiguous temporal periods. A, Calculation of the change of the range of spatial dependency (RSD) in kilometers over time. B, Calculation of the change of the effective range of spatial dependency (RSD) in kilometers over time. C, The change in the maximum departure from randomness (Maxdiff) over time. D, The change in the maximum spatial difference (MSD) in kilometers associated with Maxdiff.

374 PHYTOPATHOLOGY
Fig. 6. The effect of citrus host plant density and cultivar/species susceptibility on disease incidence and severity for site D1 (A to E) and D2 (F to J) based on stochastic placement of 500, 0.25-km2 centroids. A and F, The effect of host density on disease severity. B and G, The relationship of the normalized index of susceptibility and disease severity. C and H, The relationship of the normalized index of susceptibility–normalized host density and normalized index of disease severity. D and I, The relationship of the normalized index of susceptibility–normalized host density and quadrat disease incidence. E and J, The relationship of the normalized index of susceptibility–normalized host density and disease incidence. Calculations are described in equations 6 to 8.

Vol. 92, No. 4, 2002 375
from focal trees to newly infected trees in the study areas. As indicated above, these distances are conservative underestimates of disease spread because they are based solely on measurements of nearest neighbor distances. In many cases, spread of ACC was undoubtedly due to dissemination of inoculum from focal trees at greater distance than to the nearest nondiseased tree. Unfor-tunately, actual distances of spread cannot be definitely deter-mined from the present data sets. However, the data presented here does conclusively demonstrate that spread of ACC in urban Miami occurs over distances considerably greater than 38.1 m (125 ft), the distance previously used by the CCEP to define ex-posed trees. The application of the “125-ft rule” to define exposed trees for eradication was inadequate to contain the disease and curtail further spread and was likely one of the main contributing factors that resulted in the inability to suppress disease spread between 1996 and 2000 (27).
Consistency of findings. The findings of the current study for the spread of ACC in urban Dade and Broward counties are con-sistent with those previously described for spread of the disease first discovered in October 1990 in commercial citrus in South Central Florida (8). In the case of an epidemic in a commercial citrus orchard, inoculum originating from lemon trees in an adjacent residential property was disseminated to the neighboring commercial planting. Meteorological data from the National Weather Service were examined to reconstruct the relationship of inoculum spread with weather. The age of the oldest lesions in the commercial planting coincided with a mid-August 1989 storm that passed through the area. No other storms of significance occurred at the location of the commercial planting around this time period. Source to secondary-foci distances for the commercial outbreak were 230 m (754 ft), 410 m (1,345 ft), and 810 m (2,657 ft) for the three secondary foci. The urban environment is considerably
Fig. 7. Kriging estimate maps based on the normalized index of disease severity (Isev) of citrus canker-infected trees in five study sites in Miami, Dade and Broward counties. Columns of panel graphs from left to right represent 30-day periods T5, T10, T14, and T18, respectively. Rows of panel graphs from top to bottom represent study sites D1, D2, D3, B1, and B2, respectively. UTM-W and UTM-N = universal transverse mercator west and north, respectively. UTM is a geo-referenced measurement system used to locate points on the earth’s surface. UTM measurements are in kilometers. Note establishment of primary foci early in the epidemic that enlarge through time combined with spread due to the development of secondary foci that fill in the areas between.

376 PHYTOPATHOLOGY
different from that of a commercial orchard. Citrus plant age, cultivar, horticultural health, etc., vary widely among residential properties and affects susceptibility both quantitatively and tem-porally. In addition, plant density is much less than in commercial orchards and exposure of citrus trees to wind-blown rain can be affected by physical windbreaks such as buildings, enclosures, and trees of other species. Wind can also be irregularly channeled between such obstacles and numerous complex eddies likely also affect inoculum dispersal. Even so, the range of distances of spread measured in the present study corresponded with those distances of spread determined in the 1990 commercial citrus study. Thus, even though the urban and commercial citrus envi-ronments are vastly different, the underlying spatial dynamics appear to have a commonality of spatial process. That is, inocu-lum dissemination via wind-blown rain occurred over similar distances in both situations regardless of variability of citrus plant species/cultivar, density, susceptibility, horticultural health, etc.
To our knowledge, the regional increase and spread of ACC has not been previously examined. Spatiotemporal autocorrelation was used previously to examine relationship among ACC-affected citrus trees in small experimental nursery and orchard plantings (11–13). In the present study, the modified Ripley’s K-function and semivariance analyses were used to examine the SPP of citrus canker for each study site, temporally for each 30-day period and spatiotemporally between periods over areas larger than previ-ously examined. In sites D1 and D2, disease spread rapidly across the extents of the sites during the second and third 30-day periods (T2 and T3), respectively. Site D3 provided the most insight into the spatiotemporal structure and dynamics of ACC in an urban setting. Disease increase was recorded relative to only a few 30-day temporal periods, and was aggregated and constrained to the area immediately surrounding the initial focal tree until T17. However, during T17, disease spread extended over the extents of the study site. These disease dynamics were well reflected in the rapid increase of the RSDeff associated with the Ripley’s analyses of sites D1 and D2 versus the more gradual increase of the RSDeff associated with site D3 through time. A rapid increase of RSTD was also associated with spatiotemporal disease dynamics by semi-variance analyses for D1 and D2 versus a less rapid increase of RSTD for site 3. This represents a rapid increase in the associ-ation of disease in both spatial and temporal scales, simultaneous-ly. Examination of the SPP maps for each plot revealed that for D1, D2, and D3, the distribution of infected trees over the extents of each plot occurred at T3, T2, and T17, respectively, and related to RSDeff, spatiotemporal distance relationships of 1.5, 2.2, and 1.6 km, respectively. Following these events, the disease quickly began to fill in the sites. The distances related to the spatio-temporal analyses indicate that in the urban environment, diseased trees located at relatively long distances from each other are related through time. The kriging of the index of severity through time visually demonstrated the establishment of foci of infection and the spatial evolution of secondary foci that caused the filling in of the uninfected areas with disease. This is not surprising and has been demonstrated many times on the plot or field scale, but here was demonstrated on a regional spatial scale in large urban areas.
It is known that two spatial processes affect ACC increase and spread. Splash dispersal is generally a local mechanism for bac-terial inoculum dispersal within individual trees and among trees in close proximity to one another (9,11,13,16,28,29). Some of the trees within urban Miami, especially large grapefruit trees, can achieve heights of 8 m and it is common to find infections in the exposed tops of these trees. Simple splash dispersal from the tops of such trees could disperse the bacteria several meters hori-zontally especially in light but directional airflows. Conversely, wind-blown rain can disperse small droplets laden with inoculum over a wide range of short to very long distances. In the Miami area, 70 to 80 rainstorms typically occur per year, the majority of
which are associated with low wind speeds but some are quite violent with wind speeds reaching up to 160 km/h. What was interpreted from the data sets in this study was that apparently the less frequent rainstorms associated with strong winds dispersed inoculum over large areas and resulted in a low incidence SPP of disease throughout large areas. The more frequent nonviolent rain-storms contributed by locally dispersing bacterial inoculum. That is not to say that during rainstorms that both short-distance and long-distance dispersal mechanisms were not occurring simul-taneously. Wind speeds often vary greatly over the duration of rainstorms, and thus both mechanisms are likely to be functioning at different times or simultaneously in inoculum dispersal at different points in the storm. It is our belief that the interaction of these two spatial processes (local rain splash of inoculum and long-distance dispersal by blowing inoculum-laden rain) in combi-nation with occasional human movement of inoculum or infected plant material led to the spatial patterns of disease and spatio-temporal dynamics of citrus canker examined in this study and the overall spatial structure of disease in urban southeast Florida.
ACKNOWLEDGMENTS
We thank the many disease surveyors and officials in the Citrus Canker Eradication Program, the Florida Department of Agriculture and Consumer Services, Division of Plant Industry, and the USDA, Animal and Plant Health Inspection Service who dedicated large amounts of time, manpower, and effort toward the study and G. Hughes for sug-gestions on analytical approaches to investigate.
LITERATURE CITED
1. Bennett, R. J. 1975. The representation of identification of spatio-temporal systems: An example of population diffusion in North-West England. Trans. Inst. Br. Geogr. 66:73-94.
2. Broadbent, P., Gottwald, T. R., Gilkeson, C. F., Franks, N., and Dephoff, C. M. 1996. Identification of citrus blight in the Riverina, New South Wales. Australas. Plant Pathol. 25:126-34.
3. Conover, W. J. 1980. Practical Nonparametric Statistics. John Wiley & Sons, New York.
4. Danos, E., Berger, R. D., and Stall, R. E. 1984. Temporal and spatial spread of citrus canker within groves. Phytopathology 74:904-908.
5. Diggle, P. J. 1987. Statistical Analysis of Spatial Point Patterns. Aca-demic Press, London.
6. Gottwald, T. R., Cambra, M., Moreno, P., Camarasa, E., and Piquer, J. 1996. Spatial and temporal analyses of citrus tristeza virus in eastern Spain. Phytopathology 86:45-55.
7. Gottwald, T. R., Graham, J. H., Civerolo, E. L., Barrett, H. C., and Hearn, C. J. 1993. Differential host range reaction of citrus and citrus relatives to citrus canker and citrus bacterial spot determined by leaf mesophyll susceptibility. Plant Dis. 77:1004-1009.
8. Gottwald, T. R., Graham, J. H., and Egel, D. S. 1992. Analysis of foci of Asiatic citrus canker in a Florida citrus orchard. Plant Dis. 76:389-396.
9. Gottwald, T. R., Graham, J. H., and Schubert, T. S. 1997. An epidemi-ological analysis of the spread of citrus canker in urban Miami, Florida, and synergistic interaction with the Asian citrus leafminer. Fruits (Paris) 52:383-390.
10. Gottwald, T. R., Hughes, G., Graham, J. H., Sun, X., and Riley, T. 2001. The citrus canker epidemic in Florida: The scientific basis of regulatory eradication policy for an invasive species. Phytopathology 91:30-34.
11. Gottwald, T. R., McGuire, R. G., and Garran, S. 1988. Asiatic citrus canker: Spatial and temporal spread in simulated new planting situations in Argentina. Phytopathology 78:739-745.
12. Gottwald, T. R., Reynolds, K. M., Campbell, C. L., and Timmer, L. W. 1992. Spatial and spatiotemporal autocorrelation analysis of citrus canker epidemics in citrus nurseries and groves in Argentina. Phytopath-ology 82:843-851.
13. Gottwald, T. R., Timmer, L. W., and McGuire, R. G. 1989. Analysis of disease progress of citrus canker in nurseries in Argentina. Phytopath-ology 79:1276-1283.
14. Graham, J. H., Gottwald, T. R., Riley, T. D., and Achor, D. 1992. Penetration through leaf stomata and growth of strains of Xanthomonas campestris in citrus cultivars varying in susceptibility to bacterial di-seases. Phytopathology 82:1319-1325.
15. Isaaks, E. H., and Srivastava, R. M. 1989. Applied Geostatistics. University Press, Oxford, New York.
Vol. 92, No. 4, 2002 377
16. Koizumi, M. 1977. Factors related to the occurrence of spring canker caused by Xanthomonas citri (Hasse) Dowson. Bull. Fruit Tree Res. Stn. Ser. B (Okitsu) 4:115-129.
17. Koizumi, M. 1981. Citrus canker. Pages 8-12 in: Citrus Diseases in Japan. A. T. Miyakawa, ed. Japan Plant Protection Association, Tokyo.
18. Koizumi, M. 1982. Resistance of citrus plants to bacterial canker di-sease. Proc. Int. Soc. Citriculture 1:402-405.
19. Koizumi, M. 1985. Citrus canker: The world situation. Pages 2-7 in: Citrus Canker: An International Perspective. L. W. Timmer, ed. Univer-sity of Florida, Lake Alfred.
20. Koizumi, M., and Kuhara, S. 1982. Evaluation of citrus plants for resis-tance to bacterial canker disease in relation to the lesion extension. Bull. Fruit Tree Res. Stn. Ser. D 4:73-92.
21. Lee, H. A. 1918. Further data on the susceptibility of Rutaceous plant to citrus canker. J. Agric. Res. 12:661-672.
22. Madden, L. V., Reynolds, K. M., Pirone, T. P., and Raccah, B. 1998. Modeling of tobacco virus epidemics as spatio-temporal autoregressive integrated moving-average processes. Phytopathology 78:1361-1366.
23. Peltier, G. L. 1920. Relative susceptibility to citrus canker of different species and hybrids of the genus Citrus, including the wild relatives. J. Agric. Res. 8:339-362.
24. Reynolds, K. M., and Madden, L. V. 1988. Analysis of epidemics using
spatio-temporal autocorrelation. Phytopathology 78:240-246. 25. Reynolds, K. M., Madden, L. V., and Ellis, M. A. 1988. Spatio-temporal
analysis of epidemic development of leather rot of strawberry. Phyto-pathology 78:246-252.
26. Ripley, D. B. 1977. Modeling spatial patterns. J. R. Stat. Soc. Bull. 39:172-212.
27. Schubert, T. S., Rizvi, S. A., Sun, X., Gottwald, T. R., Graham, J. H., and Dixon, W. N. 2001. Meeting the challenge of eradicating citrus canker in Florida–again. Plant Dis. 85:340-356.
28. Serizawa, S., and Inoue, K. 1974. Studies on citrus canker, Xanthomonas citri. III. The influence of wind on the infection of citrus canker. Bull. Schizuoka Pref. Citrus Exp. Stn. 11:54-67.
29. Serizawa, S., Inoue, K., and Goto, M. 1969. Studies on citrus canker. I. Dispersal of the citrus canker organism. Bull. Schizuoka Pref. Citrus Exp. Stn. 8:81-85.
30. Stall, R. E., Miller, J. W., Marco, G. M., and de Echenique, B. I. C. 1980. Population dynamics of Xanthomonas citri causing cancrosis of citrus in Argentina. Proc. Annu. Meet. Fla. State Hortic. Soc. 93:10-14.
31. Van De Lande, H. L. 1993. Spatio-temporal analysis of spear rot and ‘marchitez sorpresiva’ in African oil palm in Surinam. Neth. J. Plant Pathol. 99:129-138.
32. Ward, J. S., and Ferrandino, F. J. 1999. New derivation reduces bias and increases power of Ripley’s L index. Ecol. Model. 116:225-236.