Gentrification and the Philadelphia Housing Authority
48
Gentrification and the Philadelphia Housing Authority: The Impact of PHA Property Sales from 2011-2019 on Local Communities Matt Beierschmitt, Lauren Klapper, Jason Linderman, Kyle McIntyre, Cassidy Tarullo, Chelsea Williams Policy Analysis Project PLCY 8127 Dr. Patricia Amberg-Blyskal Temple University May 11, 2021
Transcript of Gentrification and the Philadelphia Housing Authority

Gentrification and the Philadelphia Housing Authority:
The Impact of PHA Property Sales from 2011-2019 on Local Communities
Matt Beierschmitt, Lauren Klapper, Jason Linderman, Kyle McIntyre,
Cassidy Tarullo, Chelsea Williams
Policy Analysis Project
PLCY 8127
Dr. Patricia Amberg-Blyskal
Temple University
May 11, 2021

2
Table of Contents
Acknowledgments 3
Executive Summary 4
Background 5
Literature Review: Housing Authorities’ Role in Changing Neighborhoods 7
State-Sponsored Redevelopment 9
Hope VI: Predecessor to The Choice Neighborhoods Initiative 10
Empowerment Zones 11
RAD Program 12
Scattered-Site Housing 12
Quantitative Data Analysis: PHA’s Potential Impact on Gentrification 14
Overview 14
Research Question 14
Methods 15
Analysis 18
Results 19
Qualitative Data Analysis: Community and Government Relations 25
Interviews 25
Government Role in Affordable Housing 26
Community Involvement 27
Qualitative Case Studies: Houston and Seattle 29
Houston Case Study: Elimination of Scattered Sites to Raise Revenue 29
Seattle/King County: Hands-On Approaches to Portfolio Realignment and Integration 31
Policy Recommendations 34
Local Government Initiatives 35
PHA Operational Changes 36
PHA Internal Changes 37
Additional Considerations 38
Conclusion 41

3
Acknowledgments
On behalf of the Temple University Master of Public Policy Program, the authors of this research
would like to thank Temple University professors Dr. Elise Chor, for her consultation regarding
the statistical analysis, Dr. Kevin Henry for his assistance with the GIS geocoding, and Dr.
Patricia Amberg-Blyskal for serving as our primary faculty advisor. The team would also like to
thank their advisors Dr. William Snyder, Dr. Davin Reed, and Professor John Kromer, for
lending their vast knowledge and expertise to this body of work. Finally, we would like to thank
the interviewees for their time and contributions, and we acknowledge their significant, positive
impact on the research at large.

4
Executive Summary
The Philadelphia Housing Authority (PHA) is the fourth-largest public housing agency in
the United States and the largest landlord in Pennsylvania, providing housing assistance for
approximately 80,000 low-income individuals in Philadelphia (MPP Capstone 2021). In October
2020, PHA came to an agreement with Occupy PHA that ended a four-month-long protest. As part
of the agreement, PHA agreed to institute a temporary moratorium on market-rate property sales
and to work together with the encampment organizers on an independent study to examine PHA’s
practice of selling vacant properties to raise revenue. Encampment organizers contend that such
sales contribute to gentrification, displacement of people of color, and the loss of community
identity in low-income, minority neighborhoods. PHA argued that such sales are needed to offset
decades-long cuts to the federal subsidy. PHA and Occupy PHA both agreed to a partnership with
Temple’s MPP Capstone Program to lead the independent study. It is important to highlight that
our initial findings and correspondences revealed some discrepancies between PHA and Occupy
PHA’s expectations and goals of the study. After consulting with Temple’s administrators and
both partners, the MPP Program concluded that it was best to dissolve the official partnership with
PHA and Occupy PHA and move forward as an independent study.
The authors’ research methods consist of quantitative and qualitative approaches to
answering whether dispositions by PHA are contributing to gentrification. The research team also
addresses the consequences of gentrification on the community. The research team first modeled
gentrification in Philadelphia between 2012 and 2019. The model uses census data on changes in
poverty, educational attainment, rent, housing value, and racial demographics. With property data
provided by PHA on the 1,021 scattered sites sold between 2011 and 2019, the research team used
GIS software to geolocate the sold affordable housing units.
The team ran a regression analysis on the number of PHA sales per capita compared to the
gentrification index, finding a fairly weak but statistically significant correlation, concluding that
PHA property sales are weakly associated with increased gentrification. The team felt these
findings to be worth noting. The team ran additional regressions on the gentrification index and
changes in racial demographics, showing there is moderate association between gentrification and
the displacement of minorities. The team did not conduct a cost-benefit analysis on property sales,
and suggests PHA conduct this analysis, in addition to the policy recommendations.
The team also conducted an extensive literature review around the above issues will help
contextualize gentrification and neighborhood change. The team reviewed case studies about
Houston and Seattle housing authorities and their approach to the affordable housing crisis. The
teams’ interviewers also conducted several interviews with PHA residents, city officials, activists,
and nonprofits to further understand the relationship between PHA, the communities they serve,
and their impact on the community.
Considering the history of PHA, review of case studies, interviews from varying
perspectives, and extensive data analysis, we have outlined policy changes and new policies for
PHA’s consideration. The team broke these into two categories: initiatives for local government
collaboration and internal PHA actions. Finally, given the current state of affordable housing in
Philadelphia, public perception of PHA, and PHA’s growing capital deficit, we recommend a
series of short and long-term approaches, as shown in Table 3. The team’s recommendations aim
to ensure PHA’s long-term sustainability, allowing them to continue their mission of providing
affordable housing, increasing productivity, and preserving existing communities.

5
Background
Philadelphia Housing Authority
Issues around gentrification, lack of affordable and adequate public housing, and chronic
street homelessness represent the most significant housing authorities’ challenges in the United
States. In August 1937, public housing authorities were created as a part of both the New Deal's
Public Works Administration (PWA) program and the US Housing Act of 1937. The Act provided
subsidies to construct, own, and manage public housing to local public housing agencies for
"families whose incomes are so low that they cannot afford adequate housing provided by private
enterprise" (Pennsylvania Historical and Museum Commission, 2015). Around the same time, the
United States Housing Authority (USHA) was created and empowered by Congress to provide 3%
interest development loans to local governments to construct low-rent housing projects. As a result,
Philadelphia received $20,000,000 from the Act. Following the Pennsylvania Legislature’s
approval in the Act of Assembly, the Philadelphia Housing Authority (PHA) was established.
PHA is responsible for developing, acquiring, leasing, and operating affordable housing
for city residents with limited incomes and authorized to “exercise the power of eminent domain
to clear slum areas and provide safe and sanitary dwellings through new construction or
rehabilitation of existing structures" (PHMC 2015). PHA followed Harold Ickes' PWA formula to
construct much of the earliest public housing in the United States from 1933 to 1937; however,
the "neighborhood composition rule" that the formula dictated only resulted in further segregation
in existing neighborhoods. Unfortunately, PWA and PHA’s consequential practice of segregating
public housing became a template for future publicly funded residential construction projects in
the United States (Jennings 2020).
According to the 2020 Data Snapshot from the Office of Homeless Services (OHS) in
Philadelphia, there are over 5,600 people in Philadelphia who are considered “homeless,” of which
nearly 1,000 are “unsheltered” (OHS 2020). There are currently 14,266 applicants on PHA’s
waiting list for public housing, the highest numbers of which include the Tioga, Brewerytown,
Kingsessing, and Allegheny West neighborhoods (Ragen 2021). As the Philadelphia Asset and
Property Management Corporation (PAPMC) and Alternatively Managed Entities (AMEs)
manage their waitlists separate from PHA, it is important to note that the share of applications for
all public housing for Philadelphia is over 50,000.
As a result of imbalances between demand for affordable housing and supply, PHA has
faced criticism for property divestment practices and tenant relations. In the summer of 2020,
existing frustration with PHA, the pandemic, and growing awareness of systemic racism amplified
Occupy PHA’s movement and led to the creation of two encampments protesting PHA policies.
Led by organizer Jennifer Bennetch, “Camp Teddy” was located on Ridge Avenue outside the new
PHA office. The other, larger encampment of about 150 people was located on the Benjamin
Franklin Parkway and named “Camp James Talib-Dean,” in memory of an advocate who passed
away during the early weeks of the protest (McMenamin 2020).
Camp Teddy was created on June 27, 2020, and blocked the construction of a $52 million
mixed-use development, including a long-anticipated supermarket, retail spaces, an urgent care
center, and 98 housing units (Ralph 2020). After four months of protesting, negotiations, and
national media coverage, camp organizers and PHA struck a deal on October 5, 2020. As part of
that deal, PHA announced that it had created a pilot program alongside the Building and

6
Construction Trades Council (BCTC) called “Working for Home Repair Training Program.” The
program aims to build housing and economic opportunities through the renovation of long-term
vacant structures, some of which have been unoccupied for over 20 years. PHA states that the
program “will allow those without homes to put in sweat equity alongside union workers to
become invested in their home and the community” (Lubrano and McCrystal 2020). Encampment
residents will be trained by building and construction trades to rehabilitate nine properties on
Westmont Street, and PHA will secure the necessary funding, materials, and additional labor.
According to the agreement, the now-uninhabitable properties will be placed in a land trust,
renovated, and brought to code so that the housing can be made available to eligible residents at
just 15% of their income.
Camp James Taleb-Dean also reached an agreement with PHA on October 14, 2020. As a
result of that agreement, organizers and encampment participants will eventually control a
community land trust through a non-profit organization in coordination with the city. The land
trust will include 50 public housing properties, and the city plans to build two tiny-house villages,
available mid-2021 (McMenamin 2020). Last, PHA decided to institute a temporary moratorium
on market-rate property sales and to examine the effects of PHA's practice of selling vacant
properties, particularly scattered sites, and whether PHA should be enacting requirements for
affordable housing under those property sales agreements. It is important to note that PHA's
practice of selling scattered sites is driven by its backlog of unfunded capital needs, estimated to
exceed $1 billion (MPP Capstone 2021).

7
Literature Review: Housing Authorities’ Role in Changing Neighborhoods
In cities and municipalities across the United States, the ever-changing economic and
demographic landscape is rapidly shifting neighborhoods. Once underfunded and low-income
neighborhoods are now up-and-coming areas where modern, efficiency-unit apartment buildings
replace traditional multi-family homes. These changes often lead researchers, politicians, and
residents to question the impact of new residents on a neighborhood: who bears the burden and
reaps the rewards. Whereas past research has primarily focused on the causes of gentrification
(e.g., local rental markets, lack of affordable housing, “trendiness” of a neighborhood, and crime
probability), few studies have addressed the role local public housing authorities play in
revitalizing low-income neighborhoods and any subsequent gentrification and displacement of
long-term residents. When many U.S states face catastrophic affordable housing shortages,
developing a better understanding of the relationship between local housing authorities and the
communities they serve is crucial in crafting effective policy strategies.
This literature review will document some of the extensive scholarship that has been done
thus far around these issues. First, the literature review will contextualize gentrification and
neighborhood change. Second, the literature will delve into both local and state-sponsored
neighborhood revitalization efforts (Figure 1). Last, we will examine the role that housing
authorities play in gentrification by looking at case studies from Houston, Texas, and Seattle,
Washington.
Neighborhood Change and Gentrification
On a basic level, neighborhoods see regular, consistent change as new buildings are
constructed, old structures are destroyed or replaced, and city infrastructure and amenities are
improved. Although these changes ultimately contribute to shifts in neighborhood makeup, this
review seeks to examine changes that impact the demographics of residential areas. Over the last
50-60 years, residential moves have vastly changed the demographics of inner-city neighborhoods.
The first shifts came from the Great Migration, in which 6 million African Americans fled to urban
Northeast and Midwest cities from oppressive, rural Southern states (Wilkerson 2016). The second
shift was due to the passage of the 1965 Hart-Celler Act, which eased immigration restrictions and
allowed for the rise of Asian and Hispanic immigrants moving into central cities (Hackworth and
Smith 2001). Paired with the deindustrialization of cities, some neighborhoods in inner cities
became ethnic enclaves when Whites fled to the suburbs in the late ‘60s and ‘70s (Hwang 2016).
The suburbanization movement saw social capital and a robust labor force leave cities, which
created a vacuum of underpaid and undereducated minority residents (Teitz and Chapple 1998).
This mass exodus of middle- and upper-middle-class Whites led U.S cities to face a significant
population decline as immigrants, African Americans, and low-income Whites started to settle into
low-income affordable neighborhoods during the ‘70s and ‘80s. As a result, this new population
of residents spearheaded an ethno-demographic renewal by increasing the demand for housing and
populating vacant commercial storefronts, changes that ultimately and inadvertently created
conditions that would attract future gentrifiers (Hwang 2016).
Though the first wave of gentrification was minority-led, cities were facing a persistent
poverty problem related to the shortage of local tax funding and federal programs to support the
growing, low-income population (Zuk et al. 2018). The Urban Renewal Movement sought to
revitalize downtown business districts and provide ample housing; however, opposing opinions

8
among various stakeholders, legislators, and advocates ultimately led to prioritizing downtown
redevelopment without adequate, affordable housing. The diluted, confusing policies set the tone
of urban policy wherein the solution to revitalize low-income areas took an anti-poverty approach,
with public housing developments serving as both a physical and social buffer to the central
business district neighborhoods.
In the late 1980s, social and economic equality gaps widened and were left largely
unaddressed, and in some cases were exacerbated by state and local policies. Economic shifts and
changing migration patterns created neighborhood concentrations, in which residents are leaving
the inner city were isolated from businesses, politics, and institutions. This resulted in the
involuntary creation of the Black ghetto neighborhood, as well as the ethnic enclaves where
residents chose to congregate with their own race or ethnicity to achieve economic goals (e.g.,
Chinatown, Little Italy). These shifts further complicated the creation of coherent urban policies.
After decades of both public (state and local) and private initiatives to regenerate the inner city,
the revitalization we now see can be categorized in two ways: incumbent upgrading (where already
existing residents improve the conditions of their neighborhoods) and gentrification (Clay 1979).
The act of gentrification is a process in which low-income inner-city neighborhoods
experience (1) reinvestment and revitalization by the creation of new city amenities and
reconstruction of buildings and (2) an inward migration of middle- and upper-middle-class
residents moving into that neighborhood (Smith 1998). At the very core of gentrification is
something that most studies overlook: neighborhood selection, not just by new residents but also
by developers, businesses, and policymakers who choose to change these neighborhoods. This
neighborhood selection causes a “physical, cultural and demographic transformation” that
transforms a low-income area into a higher-valued middle- and upper-middle-class neighborhood
(Hwang 2016). As middle-class residents are drawn to economic or recreational opportunities in
the city, including low-appreciating housing prices, lifestyle aesthetic appeal, and political policies
that stabilize urban social conditions, current residents are priced out of their neighborhoods (Zuk
et al. 2018). It is important to note that displacement is a direct consequence of gentrification and
is not present in incumbent upgrading. Gentrification-induced displacement occurs when demand
for housing, goods, and services in an area drives up the costs associated with living or staying,
pushing out long-term, low-income residents (Atkinson 2000). Research has found that
gentrification-induced displacement is more likely to occur in communities close to wealthy
neighborhoods (Guerrieri et al. 2013), near city centers, or that have a well-served mass transit
system alongside a large holding of older housing (Helms 2003). Additionally, research by
Brummet and Reed (2019) found that the majority of neighborhood change is primarily driven by
“in-migration” as opposed to “out-migration”; however, framing displacement in terms of in-or-
out migration assigns more individual agency than what may be realistic for people living in
neighborhoods undergoing rapid change.
The scale in the model by Brummet and Reed (2019) is immense, including over 100
metropolitan regions. What is not included in the research, however, are nuanced factors of the
various housing markets within. These factors include public transit, infrastructure, and job
proximity. The model also did not include racial demographic change. The possible ramifications
of this on current theory should not be overlooked. In 2020, Preis et al. explored four distinct
methodologies for mapping gentrification and analyzed the 2016 model by Ding et al., which also
overlooked potential impacts of racial demographic shifts. The authors wrote:
9
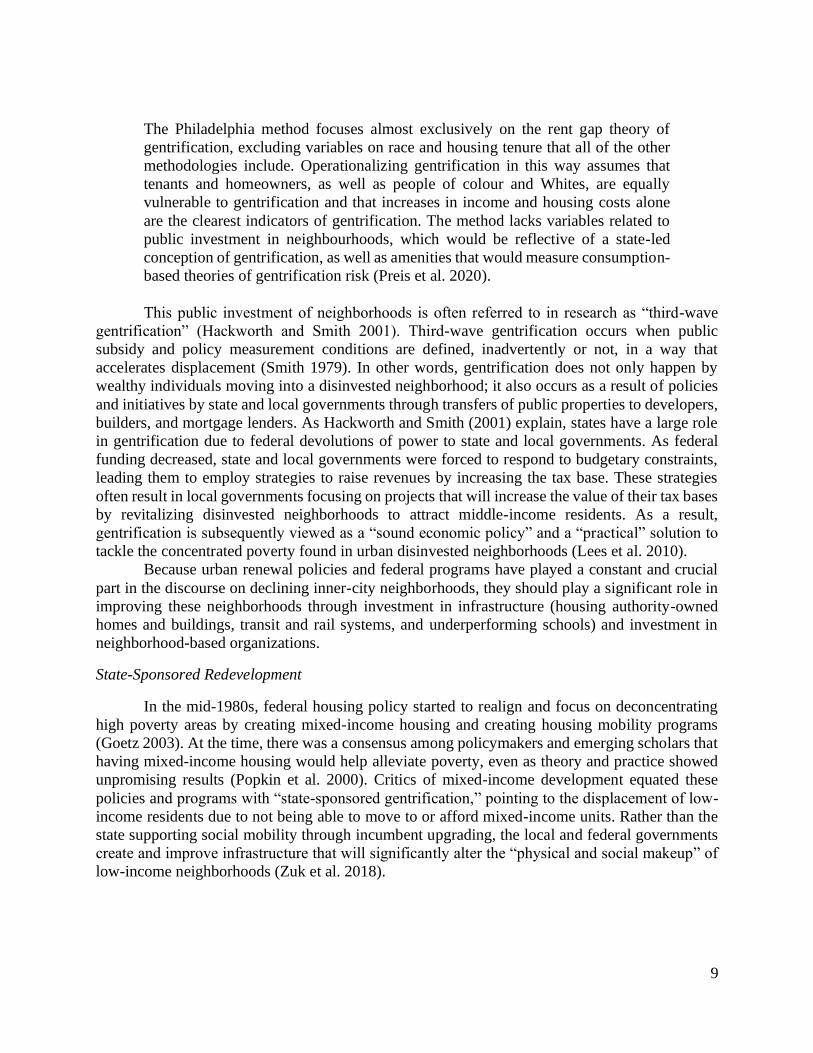
The Philadelphia method focuses almost exclusively on the rent gap theory of
gentrification, excluding variables on race and housing tenure that all of the other
methodologies include. Operationalizing gentrification in this way assumes that
tenants and homeowners, as well as people of colour and Whites, are equally
vulnerable to gentrification and that increases in income and housing costs alone
are the clearest indicators of gentrification. The method lacks variables related to
public investment in neighbourhoods, which would be reflective of a state-led
conception of gentrification, as well as amenities that would measure consumption-
based theories of gentrification risk (Preis et al. 2020).
This public investment of neighborhoods is often referred to in research as “third-wave
gentrification” (Hackworth and Smith 2001). Third-wave gentrification occurs when public
subsidy and policy measurement conditions are defined, inadvertently or not, in a way that
accelerates displacement (Smith 1979). In other words, gentrification does not only happen by
wealthy individuals moving into a disinvested neighborhood; it also occurs as a result of policies
and initiatives by state and local governments through transfers of public properties to developers,
builders, and mortgage lenders. As Hackworth and Smith (2001) explain, states have a large role
in gentrification due to federal devolutions of power to state and local governments. As federal
funding decreased, state and local governments were forced to respond to budgetary constraints,
leading them to employ strategies to raise revenues by increasing the tax base. These strategies
often result in local governments focusing on projects that will increase the value of their tax bases
by revitalizing disinvested neighborhoods to attract middle-income residents. As a result,
gentrification is subsequently viewed as a “sound economic policy” and a “practical” solution to
tackle the concentrated poverty found in urban disinvested neighborhoods (Lees et al. 2010).
Because urban renewal policies and federal programs have played a constant and crucial
part in the discourse on declining inner-city neighborhoods, they should play a significant role in
improving these neighborhoods through investment in infrastructure (housing authority-owned
homes and buildings, transit and rail systems, and underperforming schools) and investment in
neighborhood-based organizations.
State-Sponsored Redevelopment
In the mid-1980s, federal housing policy started to realign and focus on deconcentrating
high poverty areas by creating mixed-income housing and creating housing mobility programs
(Goetz 2003). At the time, there was a consensus among policymakers and emerging scholars that
having mixed-income housing would help alleviate poverty, even as theory and practice showed
unpromising results (Popkin et al. 2000). Critics of mixed-income development equated these
policies and programs with “state-sponsored gentrification,” pointing to the displacement of low-
income residents due to not being able to move to or afford mixed-income units. Rather than the
state supporting social mobility through incumbent upgrading, the local and federal governments
create and improve infrastructure that will significantly alter the “physical and social makeup” of
low-income neighborhoods (Zuk et al. 2018).

10
Hope VI: Predecessor to The Choice Neighborhoods Initiative
In 1992, the U.S Department of Housing and Urban Development (HUD) created the
HOPE VI program to address distressed city public housing projects and turn them into mixed-
income developments. This program was largely influenced by both the new urbanism
development approach and the defensible space theory. The New Urbanism (CNU) Congress
describes New Urbanism as a planning and development approach that focuses on human-scaled
urban design, prioritizing placemaking and public space (Congress for the New Urbanism 2015).
Aligned with New Urbanism is the defensible space theory, which can be defined as a residential
environment whose physical characteristics enable its inhabitants to ensure their safety and
security (Rao 2016). With these approaches in mind and pursuit of a social-mixing goal, state and
local governments invested millions of dollars in demolishing public housing sites.
Under HOPE VI, 98,592 units were demolished, and 97,389 mixed-income units were
created. Of the 97,389 mixed-income units, 55,318 (or 57%) replaced public housing units. Of the
remaining units, 30% were designated as affordable, and 13% were market-rate (U.S. Department
of Housing and Urban Development 1994). This resulted in a loss of 43,274 units from the public
housing stock. Consequently, many researchers have raised concerns about the efficacy of the
HOPE VI program in promoting desegregation. Research from Fullilove and Wallace (2011) found
that displaced residents who lived in the public housing projects before they were demolished
rarely had the chance to return to the mixed-income units once built. During the construction of
the new mixed-income units, existing residents had to relocate for weeks to years. Of the 55,318
revitalized units, only 36% of original residents returned to the new units (USHUD 1994).
Similarly, Davidson (2008) showed that HOPE VI and other state-sponsored redevelopment
programs were more likely to cause displacement, as residents who cannot return with the social
structures and support they are accustomed to are therefore not incentivized to return at all
(Betancur 2011). In state-sponsored redevelopment projects where “social mixing” is the ultimate
goal, research shows that “spatial cohabitation” does not lead to a shared social identity in
redeveloped neighborhoods and instead contributes to a greater social divide and increased tension
among the residents (Davidson 2010). This is observed in Chicago, which is often seen as the
frontrunner of mixed-income developments. Chicago’s efforts to improve social mixing were
achieved in terms of spatial proximity, but they resulted in other forms of exclusion for low-income
residents (Chaskin 2013). Though many residents were able to move into better neighborhoods,
most residents ended up in neighborhoods that were economically and racially segregated (Popkin
et al. 2000). Mixed-income developments are arguably the most effective at changing the physical
infrastructure and shifting the demographics within a neighborhood, but they fail to achieve
holistic economic and racial integration (Chaskin 2013). Despite suggestions that state-sponsored
social-mixing policies alleviated displacement of low-income residents, evidence showed that
low-income residents were either (1) not welcome into the newly renovated buildings or (2) moved
to a new location where they do not have any social safety measures in place to support and protect
them.
The Choice Neighborhoods program in 2010 succeeded HOPE VI, replacing it as an
incentive program that leverages public and private funding to support local and federal housing
strategies via neighborhood transformation. Choice Neighborhood’s goal is to maintain the
emphasis on public-private partnerships in mixed-income buildings. The key difference between
HOPE VI and Choice is that Choice allows for privately-owned, federally subsidized

11
developments to qualify for grant funding (Pendall and Hendey 2013). Instead of focusing on
individual properties, the Choice Neighborhood program focuses on the greater potential
neighborhood improvements, even soliciting community input before any actions are taken. In the
three public housing neighborhoods chosen for Choice (Salisbury, North Carolina; Suffolk,
Virginia; and Norfolk, Virginia), residents were given surveys that provided crucial information
to understand resident needs and the issues they faced, versus any perceived issues by agencies
and actors outside those communities. The survey results pointed to areas in need of increased
community input, which contributed to a greater sense of cohesion and understanding between the
agencies and residents (ICMA 2015). Choice Neighborhoods is just one example of a program that
leverages positive relationships between housing authorities and residents to transform
neighborhoods into livable, affordable areas.
Empowerment Zones
Created by HUD in 1993, Empowerment Zones (EZ) are areas that are economically
distressed and therefore eligible for tax incentives and grants (Government Accountability Office
2010). The program was intended to create economic opportunities in distressed neighborhoods
and communities, and it was based on four key principles: (1) expanding economic opportunity,
(2) promoting sustainable community development, (3) fostering community-based partnerships,
and (4) crafting a strategic vision for change. The second principle asserted that any economic
development could be successful only when it was part of a coordinated and comprehensive
strategy that included physical development and human development (USHUD 1994). This
fundamental principle was different from any other proposal put forth by the federal government
in that most policies of the 1980s focused on tax incentives and relief solely for businesses and did
little for community development. This addition of the second principle made EZ one of the first
initiatives aimed at revitalizing economically- and socially distressed communities (Rich and
Stoker 2010).
In the first round of implementation, six cities were named “Empowerment Zones”:
Atlanta, Baltimore, Chicago, Detroit, New York, and Philadelphia. These six cities each received
a $100 million block grant over 10 years, which allowed local agents to plan and develop various
strategies that would reflect local opportunities, community needs, and possible constraints. These
six cities were also eligible for a $150 million federal tax credit. Despite the initial promise of EZ,
several evaluations in the years following its inception have shown that changes made in these
neighborhoods could not be attributed outright to the initiative. Research by Rich and Stoker
(2010) found that “although several local programs did produce improvements that could likely be
attributed to the EZ initiative, the results are not consistent across all cities, or outcomes, and so
the EZ program has shown to produce disparate local outcomes.” Additionally, the research found
that in three of the EZ cities (Atlanta, New York, and Philadelphia), most of the $100 million EZ
funds were allocated for business development. Particularly in Baltimore and Philadelphia, top
priority was given to providing access to capital by creating loan programs. Though several local
EZ programs produced some improvements in EZ neighborhoods that could be attributed to the
initiative, the gains were modest at best, and no program brought about any fundamental
transformations to distressed urban neighborhoods.

12
RAD Program
In 2013, HUD launched the Rental Assistance Demonstration (RAD) program with the
goal of preserving public housing. RAD was also meant to address the failure of federal funding
to meet the capital needs of public housing, and it aimed to reverse the physical deterioration of
the public housing stock. RAD allows public housing agencies to access new funding sources to
finance needed and essential rehabilitation (Schwartz 2017). To qualify for RAD, a housing
authority must enter a multi-year Housing Assistance Payment (HAP) contract with HUD. This
contract enables a housing authority to turn those housing units into project-based Section 8 to
allow for mortgage financing, tax credits, and other funding. The project-based Section 8 can
remain under housing authority ownership or be transferred over to a nonprofit organization.
Tenant advocates have expressed concerns about the RAD program because it allows for
the privatization of the affordable housing industry. In essence, should the government curtail or
reduce the subsidies that pay for the homes, the property could be foreclosed, and the residents
could be displaced (Lee 2015). As a result, many homes and units could be converted to private
properties with owners who will enforce their own rules for their properties. In Maryland, resident
advocates in Baltimore filed a complaint in 2018 that alleges that RAD residents have routinely
been evicted without access to grievance procedures and without proper notification, and HUD
responded by opening an investigation that is still ongoing (Broadwater 2018). In Spokane,
Washington, public housing residents whose units were converted to RAD were evicted because
they did not meet the low-income housing tax-credit income limits, even though evictions on this
basis are directly against RAD rules (Office of Audit 2018). Opponents of RAD assert that these
conversions are especially popular with public housing authorities because the nature of the
program allows for a wholesale divestment and exit from public housing altogether (Gerken,
Popkin, Hayes 2019).
Scattered-Site Housing
During the influx of low-income minorities into the cities during the 1950s and 1960s,
government agencies built massive public housing projects that could accommodate large
populations of people at relatively low costs (Hogan 1996). By the early 1960s, housing specialists,
planners, and affordable housing activists shifted their focus to providing low-income housing in
areas that were located away from already economically distressed areas, now commonly referred
to as “scattered sites.” The idea of scattered-site housing came as a result of a Housing
Commissions’ experimental project, measuring whether a housing authority could produce single-
to four-person family homes on individual lots already publicly owned (Hogan 1996).
In 1965, the Housing and Urban Development Act was authorized by Congress to provide
quality, affordable homes for low-income residents in dwellings that were not traditional public
housing, essentially officially endorsing the purchase of scattered sites. The goal was to integrate
public housing tenants into mixed-income neighborhoods and allow residents to blend in
seamlessly with their middle-class neighbors. Popularity grew for scattered-site housing after the
1969 lawsuit, Gautreaux v. Chicago Housing Authority, wherein the ruling forced the Chicago
Housing Authority to redistribute public housing to non-Black neighborhoods. By the 1970s the
scattered-site model had emerged as a promising vessel for social mobility.

13
Figure 1: Housing Authority Programming and Community Effects Timeline

14
Quantitative Data Analysis: PHA’s Potential Impact on Gentrification
Overview
The Philadelphia Housing Authority (PHA) holds the largest inventory of scattered sites in
the United States. PHA divested of scattered sites that they determined to be non-viable for
rehabilitation or too costly to maintain in their already expensive inventory of properties. Divested
sites are sold at a market rate to both private developers and non-profit organizations, and the
proceeds are used to help fill the growing capital deficit in their budget. For the purposes of this
research, PHA granted the research team access to data pertaining to all their properties sold from
2011 and 2020. The year 2020 is excluded from the analysis, due to lack of census data, leaving
1,021 scattered site sales between 2011 and 2019 to be examined. The first step of the analysis
compares the independent variable, PHA’s property sales, to the dependent variable, the
gentrification index. This analysis determines whether or not PHA’s property sales are associated
with gentrification. The second step of the analysis uses the gentrification index as the independent
variable and compares it to the dependent variable, changes in minority population. Together, these
two analyses examine PHA’s impact on gentrification and subsequently, gentrification’s impact
on displacement.
Research Question
The goal of the research is to “examine the role of publicly owned property sales in City
and neighborhood change,” per the Project Proposal Agreement reached between the Philadelphia
Housing Authority, Occupy PHA, and Temple University (MPP Capstone 2021). The proposal
assumes there may be some level of gentrification occurring in Philadelphia:
Encampment organizers contend that such sales contribute to gentrification,
displacement of people of color and the loss of community identity and character
in low-income and predominantly minority neighborhoods, while PHA contends
that such sales are needed to offset decades-long cuts to federal subsidy. Since both
ideas may have some truth, the question is how to balance the two... (MPP Capstone
2021).
Rather than seek solely to prove or disprove the existence of gentrification in Philadelphia
and measure how it may be occurring, the research team also asks three primary questions for the
quantitative analysis:
1. What is the relationship between the sale of PHA scattered and gentrification?
2. What communities are most affected by gentrification?
3. Is the sale of affordable housing the driving force behind gentrification, or do property
sales only play a minor role in reshaping many Philadelphia neighborhoods?

15
Methods
The research team created an index of gentrification in Philadelphia at the census tract
level, which most accurately reflects city neighborhoods and uses available census data. Using
research from the Pew Charitable Trusts Report (2016), the research team identified the six most
essential factors markers of gentrification:
● Decreased individuals in poverty
● Increased median rent
● Increased median owner-occupied home value
● Increased high school diploma holders aged 25
● Increased Bachelor’s Degree holders aged 25+
● Increased proportion of Whites and decrease in the proportion of non-Whites
The research team collected American Community Survey (ACS) census data from 2012
and 2019 and measured the percent change in each variable by census tract (U.S. Census Bureau
2012-2019). The year 2012 was chosen as the first year in the model because this was the first year
that some of the required ACS data became available and because it was one year after PHA began
selling their scattered sites. After measuring the percent change across each variable from 2012 to
2019, the percent change was normalized on a scale of 0–1, using the min-max normalization
method as depicted below.
After normalizing the variables on the same scale, the research team established the
geometric mean of all six factors of gentrification. This created a gentrification coefficient for each
census tract, which is the value used to measure how much or how little a census tract has
gentrified. The geometric mean was selected in place of the average because it is most accurately
applied when using normalized data. The concept of calculating normalized socioeconomic
development variables and constructing an index from the variables’ geometric mean was inspired
by the Human Development Index (HDI), which seeks to measure the development of nation states
(United Nations Development Programme 2020). The research team reworked this concept and
applied it to calculate each tract’s gentrification coefficient at the census tract level. The following
formula was used to calculate the gentrification coefficient, by multiplying the normalized value
of each of the six factors of gentrification and finding the geometric mean.

16
The list of gentrification coefficients by census tract completed the final gentrification
index used in analysis. This was calculated on a scale of 0–1 but with the final values lying between
0.09 and 0.85. A gentrification coefficient of 0 indicates no gentrification, or even a neighborhood
that has deteriorated, and a gentrification coefficient of 1 indicates a very significant level of
gentrification. In 12 of the 372 census tracts, some data points used to calculate the gentrification
index were adjusted or excluded. Five tracts did not have data available on property value, so the
index excluded property value from the calculation. One tract included a variable outside of the 0-
1 scale, due to an extreme outlier. Finally, as a byproduct of the normalization process, 6 tracts
had variables of 0. The zeros were adjusted to 0.001, to avoid multiplying by zero and resulting in
a gentrification coefficient of zero, which would negate the other factors in the gentrification
coefficient. Table 1 provides an example calculation using data from Census Tract 1 in
Philadelphia.
Upon completion of the gentrification index, the research team began analyzing the list of
scattered sites sold by PHA as provided. The team was initially assigned a list of roughly 300
properties sold between 2017 and 2020, but the years were expanded to 2011-2019, to include as
large of a sample size as possible in order to better understand the potential effects of each year
individually. Properties sold in 2020 were excluded from the data, as the 2020 census data was not
yet made available. The final list of properties includes 1,021 scattered sites sold by PHA,
including the 113 properties sold to use towards future affordable housing. Similar results were
found when the 113 properties were excluded, so they were included in the final calculation to
bolster the sample size. The team would recommend further examination into the potential impact
on gentrification of these 113 properties sold for affordable housing purposes. For the final
analysis, the team found the number of properties sold in each census tract per 1,000 residents,
based upon the 2012 census data, to weight the properties sold by population.
Using the geographic information systems software ArcGIS, the team geocoded, or
spatially located, each of the sold PHA scattered sites on a map of Philadelphia and tied the number
of properties sold in each census tract by the year and in aggregate. Next, the median household
income in 2012 was used to limit previously developed or gentrified census tracts from the
analysis. A total of 56 tracts were excluded from the analysis based on an income threshold of
greater than $60,000 a year in household income, as these tracts are already developed and
ineligible for further gentrification. Eight PHA property sales in these tracts were also excluded.
The gentrification index from 2012 - 2019 of the remaining 316 census tracts, combined with the
excluded tracts, are mapped alongside the PHA sales from 2011 - 2019 in Figure 2.
Table 1: Calculations of Gentrification Model Variables

17
Figure 2: Gentrification model from 2012-2019, with ineligible tracts, compared to PHA scattered-site sales from
2011-2019

18
Analysis
To analyze the potential impact of PHA’s scattered site sales on gentrification and examine
the broader effects of gentrification in the City of Philadelphia, the research team ran several
bivariate regression analyses and calculated the correlation coefficients on the gentrification index,
the number of PHA properties sold per 1,000 population, and the percent change of the population
of minorities, all at the census tract level. The models measure the impact of the ‘x’ variable, on
the ‘y’ variable, to determine the correlation between the two factors. The three models are as
follows:
Model 1: PHA & Gentrification
● ‘x’ = PHA sales by tract per 1,000 population, separately by year, and also in aggregate
from 2011 - 2019
● ‘y’ = gentrification index coefficients from 2012 - 2019
Model 2: Gentrification and Demographic Composition Change
● ‘x’ = gentrification index coefficients from 2012 - 2019, excluding demographic data
● ‘y’ = percent change in proportion of White to non-White residents from 2012 - 2019
Model 3: Gentrification and Raw Population Change
● ‘x’ = gentrification index coefficients from 2012 - 2019, excluding demographic data
● ‘y’ = raw population change in non-White residents from 2012 - 2019
Model #1 on PHA and gentrification is the regression most essential to our primary
research question and seeks to identify any possible correlation between PHA’s scattered site sales
and gentrification in the neighborhoods where the sales took place. The regression was performed
on the sum of all properties sold, and then performed separately by year.
Model #2 on gentrification and demographic change examines the link between
gentrification and demographic change. As neighborhoods develop and see increases in property
value, education, and income, it is essential to understand whether the minorities in these
communities see the benefits of development or if the development statistics are simply increasing
because educated White people with higher incomes are moving into the neighborhood. To
accurately reflect the regression and avoid duplicating data, the demographic component of the
gentrification model was excluded in Model #2.
Model #3 analyzes the gentrification index and the raw data of non-White residents and
measures any increase or decrease in the non-White population. Whereas Model #2 examines the
demographic proportions of each census tract and cannot prove or disprove the displacement of
minorities, Model #3 examines the raw population numbers and how people in the community
may be impacted by gentrification. To accurately reflect the regression and avoid duplicating data,
the demographic component of the gentrification model was also excluded from Model #3.
The three regression models allowed the research team to answer the three research
questions: (1) What is the relationship between gentrification and the sale of PHA scattered sites?
(2) Which communities are most affected by gentrification? (3) Is the sale of affordable housing
the driving force behind gentrification, or do property sales only play a minor role in reshaping
many Philadelphia neighborhoods?
19
Results
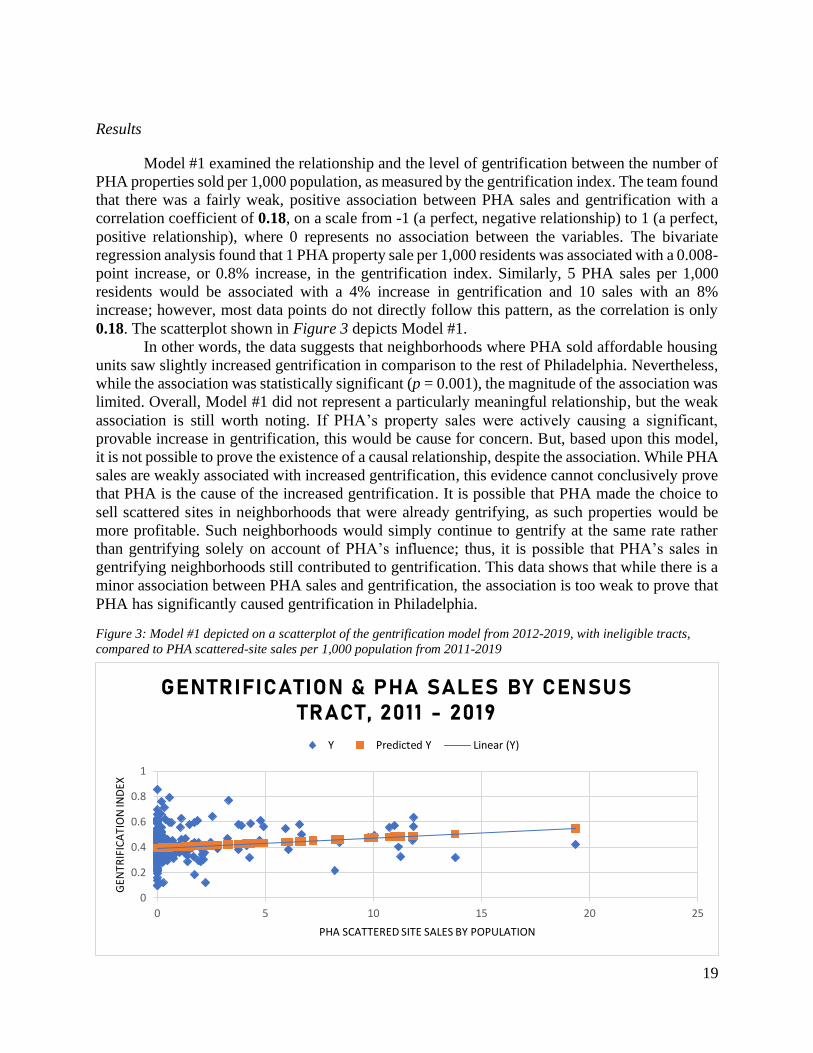
Model #1 examined the relationship and the level of gentrification between the number of
PHA properties sold per 1,000 population, as measured by the gentrification index. The team found
that there was a fairly weak, positive association between PHA sales and gentrification with a
correlation coefficient of 0.18, on a scale from -1 (a perfect, negative relationship) to 1 (a perfect,
positive relationship), where 0 represents no association between the variables. The bivariate
regression analysis found that 1 PHA property sale per 1,000 residents was associated with a 0.008-
point increase, or 0.8% increase, in the gentrification index. Similarly, 5 PHA sales per 1,000
residents would be associated with a 4% increase in gentrification and 10 sales with an 8%
increase; however, most data points do not directly follow this pattern, as the correlation is only
0.18. The scatterplot shown in Figure 3 depicts Model #1.
In other words, the data suggests that neighborhoods where PHA sold affordable housing
units saw slightly increased gentrification in comparison to the rest of Philadelphia. Nevertheless,
while the association was statistically significant (p = 0.001), the magnitude of the association was
limited. Overall, Model #1 did not represent a particularly meaningful relationship, but the weak
association is still worth noting. If PHA’s property sales were actively causing a significant,
provable increase in gentrification, this would be cause for concern. But, based upon this model,
it is not possible to prove the existence of a causal relationship, despite the association. While PHA
sales are weakly associated with increased gentrification, this evidence cannot conclusively prove
that PHA is the cause of the increased gentrification. It is possible that PHA made the choice to
sell scattered sites in neighborhoods that were already gentrifying, as such properties would be
more profitable. Such neighborhoods would simply continue to gentrify at the same rate rather
than gentrifying solely on account of PHA’s influence; thus, it is possible that PHA’s sales in
gentrifying neighborhoods still contributed to gentrification. This data shows that while there is a
minor association between PHA sales and gentrification, the association is too weak to prove that
PHA has significantly caused gentrification in Philadelphia.
Figure 3: Model #1 depicted on a scatterplot of the gentrification model from 2012-2019, with ineligible tracts,
compared to PHA scattered-site sales per 1,000 population from 2011-2019
0
0.2
0.4
0.6
0.8
1
0 5 10 15 20 25
GEN
TRIF
ICA
TIO
N IN
DEX
PHA SCATTERED SITE SALES BY POPULATION
GENTRIFICATION & PHA SALES BY CENSUS TRACT, 2011 - 2019
Y Predicted Y Linear (Y)

20
In addition to the primary analysis on the total number of PHA properties sold between
2011 and 2019, the research team also broke down the property sales by year to better understand
which years were most associated with gentrification. In conversations with PHA employees, the
research team gathered that PHA was most concerned about the impact of properties sold between
2011 and 2012, before PHA began reducing their property sales due to public criticism. PHA began
selling more properties again in 2017 and onward, so the team analyzed these years as well.
The following line graph, Figure 4, and bar graph, Figure 5, show the annual sales of PHA’s
scattered sites, and their correlation with the 2012-2019 gentrification model. The year-to-year
data shows that if any of PHA’s properties did have any influence gentrification, those sold in
2011 to 2012 are the most likely candidates. Properties sold from 2011 and 2012 both had stronger
correlations than later years and occurred long enough ago that there may have been time for the
properties to influence gentrification. The year 2016 shows the strongest correlation, but as there
were only a few properties sold during this time, this correlation is likely an outlier. Years 2018
and 2019 also showed stronger than average correlations, but those properties sales likely occurred
too recently to effect gentrification. Additionally, the properties from 2018 and 2019 may have
been sold intentionally in neighborhoods that had already gentrified between 2012 and 2019, as
selling properties in more valuable neighborhoods would result in more income for PHA.
Understanding that PHA’s earliest property sales were the most likely to have any discernable
impact on gentrification will better inform the research team as to what policy recommendations
might be made.
Figure 4: Line graph of annual sales of PHA’s
scattered sites and their yearly correlation with the
2012-2019 gentrification model
The resulting weak but statistically significant correlation between PHA sales and
gentrification aligns with the original assumption of the research team. Initial research for the
literature review, case studies, interviews, and meetings with PHA officials pointed to a likelihood
of some influence by PHA on gentrification; however, the team felt that the impact on
Philadelphia’s gentrifying communities would be limited, as the sale of only 1,000 to 1,200 homes
over 10 years was unlikely to directly cause a significant level of gentrification.
Figure 5: Bar graph of annual sales of PHA’s
scattered sites and their yearly correlation with the
2012-2019 gentrification model
0
0.05
0.1
0.15
0.2
0.25
2010 2012 2014 2016 2018 2020
CORRELATION BY YEAR
0
50
100
150
200
250
300
350
400
PHA SALES BY YEAR

21
Whereas the findings of Model #1 indicate
only a fairly weak correlation between PHA and
gentrification, the map shown in Figure 2a may
paint a different picture. The excerpt from the
primary map, Figure 2, shows most of the scattered
sites sold by PHA between 2011 and 2019 and two
major clusters of gentrifying neighborhoods in
North Philadelphia, depicted in dark brown. This
section of the map encapsulates the complexity of
the weak correlative relationship between PHA and
gentrification. The research team hopes the
following explanation will resolve any confusion.
The correlation of 0.18 is relatively low for
two reasons. First, many neighborhoods, such as
Fishtown and South Philadelphia, gentrified without any influence from PHA. (Note that these
neighborhoods are not pictured in the Figure 2a subsection of the map.) Too few PHA properties
were sold in these areas of the city, so other factors are the sole cause of gentrification. Second,
many PHA properties were sold in majority Black, low-income neighborhoods such as Strawberry
Mansion, which have not shown any signs of gentrification. The census tracts on each side of the
spectrum—those that have gentrified without PHA influence and others that showed no changes
despite dozens of PHA sales—result in a weak correlation coefficient, make it difficult to prove
that there is a strong link or a causal relationship between PHA’s scattered site sales and
gentrification.
However, in the middle of the spectrum lie many communities, including Brewerytown,
Spring Garden, Sharswood, and Cecil B. Moore, which all experienced significant levels of
gentrification and saw many PHA property sales over the past decade. Many of these
neighborhoods are the same communities that activists cite as evidence of PHA’s impact on
gentrification. Although Model #1 indicates there is only a weak link between PHA and
gentrification, anecdotal evidence from activists, media, and community interviews may tell a
different story, as found in the interviews and case studies conducted by the research team. Some
argue that simply the act of PHA selling low-income housing to real-estate developers for the
construction of luxury apartments and university housing is enough to push more minorities out
of an already-gentrifying neighborhood. If PHA’s property sales have any discernible impact on
gentrification over this period, it is likely to be found in these neighborhoods.
Despite only the modest correlation between PHA and gentrification, the pain caused by
gentrification and experienced by many community members should be noted and addressed. This
pain manifested into community advocacy organizations, protest movements, encampments, and
in general distrust in PHA and city government by many Philadelphia residents. Many
Philadelphians believe that the redevelopment of inner cities should benefit everyone. However,
if PHA is not truly to blame for gentrification in Philadelphia, then the following questions should
be considered: Who or what is causing gentrification in Philadelphia? What communities are being
the most negatively affected by gentrification? Is the displacement of minorities occurring in these
communities? How can the government, property developers, and PHA intervene and make the
development of neighborhoods more equitable for all community members? Such questions are
worth exploring and expanding upon in further research.
Figure 2a: Subset of Figure 2
22
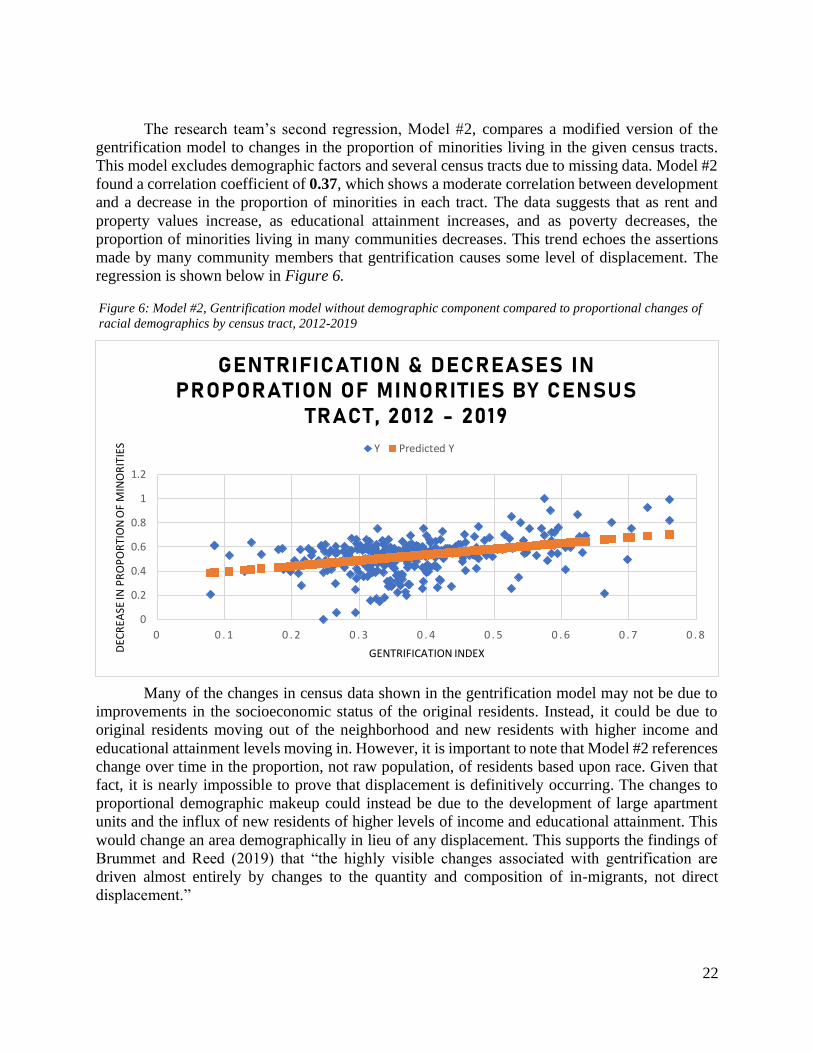
The research team’s second regression, Model #2, compares a modified version of the
gentrification model to changes in the proportion of minorities living in the given census tracts.
This model excludes demographic factors and several census tracts due to missing data. Model #2
found a correlation coefficient of 0.37, which shows a moderate correlation between development
and a decrease in the proportion of minorities in each tract. The data suggests that as rent and
property values increase, as educational attainment increases, and as poverty decreases, the
proportion of minorities living in many communities decreases. This trend echoes the assertions
made by many community members that gentrification causes some level of displacement. The
regression is shown below in Figure 6.
Many of the changes in census data shown in the gentrification model may not be due to
improvements in the socioeconomic status of the original residents. Instead, it could be due to
original residents moving out of the neighborhood and new residents with higher income and
educational attainment levels moving in. However, it is important to note that Model #2 references
change over time in the proportion, not raw population, of residents based upon race. Given that
fact, it is nearly impossible to prove that displacement is definitively occurring. The changes to
proportional demographic makeup could instead be due to the development of large apartment
units and the influx of new residents of higher levels of income and educational attainment. This
would change an area demographically in lieu of any displacement. This supports the findings of
Brummet and Reed (2019) that “the highly visible changes associated with gentrification are
driven almost entirely by changes to the quantity and composition of in-migrants, not direct
displacement.”
Figure 6: Model #2, Gentrification model without demographic component compared to proportional changes of
racial demographics by census tract, 2012-2019
0
0.2
0.4
0.6
0.8
1
1.2
0 0 . 1 0 . 2 0 . 3 0 . 4 0 . 5 0 . 6 0 . 7 0 . 8
DEC
REA
SE IN
PR
OP
OR
TIO
N O
F M
INO
RIT
IES
GENTRIFICATION INDEX
GENTRIFICATION & DECREASES IN PROPORATION OF MINORITIES BY CENSUS
TRACT, 2012 - 2019
Y Predicted Y

23
The research team does not have access to census microdata, but by using raw population
data in Model #3, the team examined not only the proportional demographic changes but the raw
numbers of minority residents migrating into and out of census tracts. Model #3, depicted in Figure
7, found a moderate correlation of 0.27. With a slope of -2035 across the entire gentrification
model, this data indicates that a 10% increase in gentrification is associated with a decrease of
about 200 minority residents per census tract; likewise, a 5% increase in gentrification is associated
with a decrease in 100 minority residents. Although not as strong as the proportional demographic
data, this regression on the raw population data shows there is a moderate association between
neighborhood development and minorities moving out of census tracts. In other words, the
outcome of Model #3 compared with that of Model #2 suggests that the in-migration of White
residents with higher educational attainment and socioeconomic status may be partially
responsible for much of the proportional demographic changes; however, the displacement of
minorities still appears to be occurring in Philadelphia.
Our findings partially align with those of the Federal Reserve Bank of Philadelphia but
based upon the available data and current iteration of the gentrification model, the research team
contends that the demographic changes occurring in Philadelphia are not entirely explained by an
increase in available housing and the influx of White residents but that the displacement of
minorities due to gentrification may also still be a problem in many neighborhoods.
The question of why gentrification is occurring remains. It is difficult to pin gentrification
and its potential negative impacts on a single entity, be it PHA, real estate developers, or the local
government. The research team would be remiss to overlook the consequential effects of
Philadelphia’s universities on gentrification, specifically the University of Pennsylvania, Drexel
University, the Community College of Philadelphia, and Temple University, the school of
enrollment of those authoring this report. Key findings from Pew Charitable Trusts Report (2016)
Figure 7: Gentrification model without demographic component compared to changes in raw minority population
data by census tract, 2012-2019
-3000
-2000
-1000
0
1000
2000
3000
4000
0 0 . 1 0 . 2 0 . 3 0 . 4 0 . 5 0 . 6 0 . 7 0 . 8 0 . 9
RA
W D
EMO
GR
AP
HIC
CH
AN
GE
GENTRIFICATION INDEX
GENTRIFICATION & DECREASES IN MINORITY POPULATION BY CENSUS TRACT, 2012 - 2019
Y Predicted Y

24
found that the neighborhoods in West Philadelphia surrounding Penn and Drexel saw steep
declines in minority residents and significant increases in White residents. Similarly, the Pew
Report found that many of the historical Black communities in North Philadelphia surrounding
Temple University saw substantial decreases in minority populations, because of initiatives by
Temple that were taken in the early 2000s to recruit more out-of-state and international graduate
students (Pew 2016). Philadelphia’s universities may stimulate gentrification in the city, but again,
they are by no means the sole cause.
Ultimately, the research team found that PHA’s scattered site sales may have contributed
to gentrification in select communities in Philadelphia. The team also found that, as a result of
gentrification, minorities are being displaced from their communities. However, PHA’s scattered-
site sales are not entirely to blame for gentrification or displacement, as there are countless factors
at play in urban revitalization, including a public relations crisis and a severe lack of trust from the
Philadelphia community that needs to be addressed. The following interviews with community
members, advocates, and city officials further expand upon the problem of community distrust.

25
Qualitative Data Analysis: Community and Government Relations
Interviews
Informational interviews were conducted to gain context and insight into the realities of
Philadelphia’s housing landscape and the relationships between the community members and city
government agencies. To collect a wide array of perspectives, interviews were requested from City
Council members, city officials, nonprofit leaders, affordable housing advocates, community
members, and current PHA tenants (Table 1). Councilmember Darrell Clarke, whose district
houses the largest portion of PHA-owned properties, was contacted early and frequently for an
interview or comment. There was no correspondence received from Councilmember Clarke or his
staff at the time of research completion.
Table 2: Interviewees
Name Organization Title Notes
Melissa Long City of Philadelphia Division of
Housing and Community
Development
Director —
Marcella Maguire Health Systems Integration
Corporation for Supportive
Housing
Director Former Director of
Homeless Services at
Philadelphia DBHIDS
Jennifer Bennetch Occupy PHA Founder Community member,
housing activist
Unnamed Tenant — — Community member,
PHA tenant
Sterling Johnson Legal Science, LLC Legal
Analyst
Housing activist
Jennifer Ragen Philadelphia Housing Authority Director,
Policy
Research team’s point
of contact with PHA
Interview questions included perspectives on gentrification as a component of community
development; government agencies’ responsibilities in responding to gentrification, displacement
prevention, and affordable housing needs; PHA’s current practice of selling scattered sites; and
cooperation between PHA, land banks, nonprofits, and community members in addressing
affordable housing. The perspectives gathered through these interviews have been formulated into
the following narratives on the government’s role in affordable housing and community
involvement.

26
Government Role in Affordable Housing
Community members and activists spoke on the government’s responsibility in providing
affordable housing, and they shared concerns around state-sponsored redevelopment efforts that
result in widespread displacement. They also expressed a similar view that communities should be
empowered to address community and property concerns and given more robust support for
maintenance of existing structures. Individuals who spoke on PHA’s practice of selling scattered
sites and their role in addressing Philadelphia’s current housing crisis shared various opinions,
underscoring this issue’s contentious status.
Marcella Maguire, who is also the former Director of Homeless Services for the City of
Philadelphia, felt that PHA should use all its resources to improve the community and support
people in finding affordable housing. She went on to say, “PHA currently seems to operate much
more like a profit-driven developer. That is not their mission.” The mission referenced is “to open
doors to affordable housing, economic opportunity and safe, sustainable communities to benefit
Philadelphia residents with low incomes” (PHA 2020a).
Continuing the topic of PHA’s responsibilities, Sterling Johnson, a legal analyst and
community activist, felt that PHA’s job should be to work with the city government and
Department of Homeless Services to create a policy environment that allows for affordable
housing to occur naturally. He went on to say, “When you sell the scattered sites, more people will
be unhoused! It’s that simple.”
Melissa Long, Director of City of Philadelphia’s Division of Housing and Community
Development, emphasized the number of programs that currently exist to keep people in their
homes. Among many, these programs include the Basic Systems Repair Program, which provides
free repairs for electrical, plumbing, heating, structural, and roofing emergencies in owner-
occupied homes in Philadelphia; and Tangled Title Fund, a program funded by the City of
Philadelphia’s Division of Housing and Community Development that awards grants to low-
income individuals struggling with homeownership. She also recommended further research into
the City of Philadelphia’s Department of Revenue, which provides an expansive list of services.
Identified programs include Longtime Owner Occupants Program (LOOP), a Real Estate Tax
relief program for eligible homeowners whose property assessments increased by 50% or more
from last year; Low-income Senior Citizen Real Estate Tax Freeze; Homestead Exemption, which
reduces the taxable portion of a property’s assessed value; Owner-occupied Real Estate Tax
Payment Agreement (OOPA), which allows homeowners to make affordable monthly payments
on property taxes that are past due; and Real Estate Tax installment plan, a program for all senior
citizens and low-income homeowners to pay current-year Real Estate Tax in monthly installments.
The array of programs offered to low-income residents of Philadelphia compared with the number
of people in Philadelphia facing housing insecurity raises the question of awareness of these
services. There is undoubtedly an opportunity for improvement in communication with residents
about their options. Director Long agreed to an extent, citing resource gaps as the main issue
around awareness: “There just are not enough resources.” Other interviewees shared that they have
observed a significant lack of collaboration between the Office of Homeless Services and public
housing organizations, like PHA.

27
Community Involvement
When dealing with an issue that affects residents’ lives so profoundly, it is crucial to
involve community members in the decision-making process; however, the community members
interviewed did not feel overall that PHA practiced due diligence. Jennifer Bennetch, community
member and Founder of Occupy PHA, said that PHA and city agencies, land banks, and other
involved entities need to be willing to solicit and accept more input from existing neighborhood
residents. She went on to say that when PHA plans to make changes to a property, they only
communicate with tenants of that property rather than the whole surrounding community, leading
community members to feel that this approach ignores the significant impacts that PHA’s actions
have on them. She explained that changes to properties in such communities result in a shift in
culture that leads to folks being pushed out of their own neighborhood or feeling like outsiders if
they remain. Another interviewee further asserted that PHA is “notorious” for not engaging with
the community or applying any best practices for community engagement. According to this
interviewee, PHA has historically operated on its own terms with a closed board and does not seem
interested in learning from comparable cities or states experiencing similar issues.
This research included one interview with a current PHA tenant, who we will refer to as
“Tenant.” Tenant credits the agency for “coming at the right time” when she needed a home most.
Although she was hesitant and anxious at first to apply for aid, she took the first place PHA showed
her, reflecting: “When you are homeless, you will take any house.” There is a common expression
that someone “can’t see the forest for the trees,” but the opposite applies to the Tenant. She quickly
dismisses the significant hurdles she faced under PHA’s care, given her prior lack of any housing.
To the question of how long she was on a waiting list for housing - “8 years” - she views the
agency as the only reason she and her children stopped sleeping on a “roach-infested floor,” rather
than questioning why they had to wait at all. When asked about how quickly PHA responds to
maintenance requests - “same-day for emergencies” - she explains how reliably they have not only
responded to all five burst pipes and eight floods but also helped with clean up. She views the job
that PHA has as a big one and has learned to be patient, and she admits that she would make the
same decision to sell if she were in PHA’s position: “You can’t stay somewhere forever for free -
not in this economy.” Tenant is now looking into buying her first home through PHA’s Housing
Choice Homeownership program and feels that PHA is doing the best they can while giving the
neighborhood a chance to “shape up.”
This input on working with community groups also provides more context regarding the
tense relationship between PHA and Occupy PHA and why the client-capstone relationship with
Temple was ultimately dissolved. Jennifer Bennetch of Occupy PHA was glad that the official
relationship was terminated, as she asserts that PHA outlined the scope of the study without input
from Occupy PHA. Occupy PHA also felt that the provided data purposefully did not include all
properties to lead to a more favorable conclusion for PHA. On the other side of the issue, PHA
reported that they were too far along in the process to widen the scope as Occupy PHA wanted. A
solution to avoid similar misunderstandings in the future would be to ensure that all parties
involved agree on goals and expectations before developing and executing the contract.
Additionally, suppose multiple parties are to be involved in the same project. In that case, it is
essential that each party feels they have equal say and representation to avoid the perception of
having one's requests ignored or overlooked.

28
Public housing authorities have a responsibility to their most vulnerable and valuable
stakeholders, those dependent on affordable housing. In operating outside their public housing
mission, they risk further displacement of the residents under their care. Until residents of housing
authorities are brought into neighborhood revitalization efforts, they will continue to be
disproportionately harmed by the very policies aimed at helping them. In the next section, two
cities will be analyzed for the efficacy of their scattered-site programs and affordability measures:
Houston, Texas, and Seattle, Washington.

29
Qualitative Case Studies: Houston and Seattle
Houston Case Study: Elimination of Scattered Sites to Raise Revenue
Introduction
The Houston Scattered Sites Homeownership Program collapsed in 2009, due in part to a
deteriorating housing market and lack of eligible purchasers. As a result, the Houston Housing
Authority (HHA) decided to offer the remaining properties for sale on the open market (Houston
Housing Authority 2009). Reactions by the community to this decision were swift, and many
blamed the HHA for abandoning “empty and dilapidated properties” and rejecting or creating
barriers for qualified, potential buyers (Wang 2011a). Nevertheless, 171 homes and three lots
auctioned in 2011, netting $8 million for the HHA (Houston Business Journal 2011). This case
study will review the factors leading to this decision and the actions and results that followed.
Background
HHA acquired 366 properties in various conditions from the Resolution Trust Corporation
(RTC) in 1987 and 1988. (HHA 2009) At the time the properties were acquired, they were
upgraded and made available to residents under the Low Rent Public Housing Program. Many of
the homes were single-family and allowed families the opportunity to have an experience similar
to that of a typical homeowner.
After about a decade of renting, the HHA created the Scattered Sites Homeownership
Program in the mid-1990s to promote homeownership. The Program was offered first to the rental
occupants and second to other public housing and Section 8 families. As HHA believed areas with
fewer renters to be attractive to potential buyers, they began in 2004 to stop the rental of properties
that were vacated. They attribute further sales success to this practice: in 2009, more than 10 years
after creating the Scattered Sites Homeownership Program, 191 properties, which represented just
over half from the initial RTC acquisition, had been sold to qualified income eligible families. The
remaining 25% unsold, non-vacant properties (approximately 92 properties) continued as rentals.
By 2011, there were no remaining rental properties in HHA’s portfolio (Wang 2011b).
The recession and market deterioration led the HHA to reach an “income-eligible
purchasing threshold,” and sales in the Scattered Sites Homeownership Program leveled off. As a
result, HHA officials recommended the board of commissioners to sell the remaining scattered site
properties on the open market.
The HHA believed that the decision to auction on the open market would meet the following goals:
1. Generate sales revenue to reinvest in further affordable housing opportunities; and
2. Eliminate the problems caused by vacant properties, which include vandalism. According
to HHA reports, each property would cost the agency $50,000 to rehabilitate (Wang
2011a).
Response
The HHA faced a lot of backlash for the open market decision, particularly following an
investigative piece published by the Chronicle in April 2011, titled “Program's empty promises
leave poor without homes” (Wang 2011b). The Chronicle found that 40,000 people were on the
waiting list for public housing, and many had been evicted or “terminated” from their leases, only

30
for the properties to remain vacant. It is unclear whether the properties could have remained as
rental options if it were not for the HHA’s practice of freezing rentals on vacant properties (HHA
2009). Vacated properties became targets for vandalism and fell into disrepair. At the time, the
Chronicle reported that “Many of the vacant homes are now uninhabitable. Planks block windows.
Weeds grow wildly. Vandalism is rampant. Shingles are missing and mold climbs the walls”
(Wang 2011b). With so many on the waiting list for public housing, many wondered why houses
were sitting vacant in the first place and falling into disrepair. Although HHA maintained that they
did not have the money for repairs and could not sell the properties in the current Houston housing
market, many people interviewed by the Chronicle contended otherwise and cited various barriers
put in place by the HHA that kept the properties from potential buyers. These include not making
necessary repairs or turning on utilities for appraisals, not responding to requests or appeals for
purchases, and turning away offers from non-cash bidders. Though HHA eventually decided to
auction the remaining scattered site properties, there was considerable pushback from newly
appointed members of the board of commissioners, including Assata-Nicole Richards, who felt
that "If we go with the auction plan, then we forgo [an affordable housing] mission."
Results
On November 12, 2011, the HHA auctioned 171 homes and three lots, netting nearly $8M
for the agency (Houston Business Journal 2011). HHA used “professional assistance” to price all
properties as starting bids. (HHA 2009) The neighborhoods where the scattered sites were located
ranged in assessed values of $50,000–$150,000 (Houston Agent 2011). There were no affordable
housing requirements placed on non-profits or developers, for which the former was given first
priority (Thiele 2021).
Properties were divided into three blocks at the dual in-person and online auction, with one
block representing sales exclusively to pre-approved 501(c)(3) non-profit organizations (National
Residential Auctioneers 2011). The properties were sold on an "as-is, where-is" basis, and there
was a 5% buyer's premium added to the high bid price. The only requirements for buyers in the
two public blocks were a government-issued ID, a required 10% deposit, and registration with the
auction company.
Conclusion
The research team reached out to HHA to discuss the results 10 years after the auction, but
significant staffing changes within HHA over the last decade made it difficult for substantial
lessons learned to be shared. Mark Thiele, Interim President and CEO of HHA, shared that total
proceeds from the auction were $7.6 million in 2011 and $294,000 in 2012 (Thiele 2021). He
identified steep maintenance costs as the reason behind the sales, and noted that properties faced
roof, tree, and foundational damage due to Hurricane Ike. Additionally, HHA received many letters
from various homeowner associations complaining of neglect, which resulted in a few lawsuits
against the agency. Thiele asserts that the ultimate sale of the homes met the objective by removing
the heavy financial burden and any liability to the agency. Based on this research and the
communications with HHA, there are many factors to weigh in determining whether the negative
press and decline in public trust were worth the nearly $8 million netted in revenue after sale.
Ultimately, a decade later, Thiele believes the decision to have been a good one, as the scattered
sites did not generate enough revenue to cover the costs of maintaining them.

31
Seattle/King County: Hands-On Approaches to Portfolio Realignment and Integration
Introduction
In the early 2000s, the Seattle Housing Authority (SHA) adopted the cost-saving measure
of portfolio realignment for 200 of the 787 scattered-site units under their care (Seattle Housing
2004). The majority of the properties slated for sale were single-family homes that were expensive
to manage and maintain. The scattered sites were subject to evaluation on a cost-benefit basis to
preserve low-density units that were seen as racial and economic integration program successes
since the creation of the scattered-site program (SHA 2012). Separate from this realignment, a
collaboration between researchers and SHA in 2018 and 2019 paired housing vouchers with
educational materials, an assigned “navigator,” and additional financial assistance to promote
further integration of public housing residents into the greater Seattle area. The voucher program
is viewed as a national success: in 2019, economist Raj Chetty remarked that Seattle’s program
has “the largest effect I’ve ever seen in a social science intervention” (Matthews 2019).
Background
SHA began their scattered-site program in 1978 after HUD granted Seattle $150,000 in
Bonus Block Grant funds to start the Areawide Housing Opportunities Program (AHOP) (Hogan
1996). At that time, the city and mayor, Mayor Charles Royer, contracted with SHA to act as a
developer. Additionally, the mayor set a goal for Seattle to develop up to 1,500 family-housing
units over five years, contingent on federal funding. The objectives at the time were to 1) develop
housing opportunities for families where there were few low-income units, 2) construct low-
density projects visually compatible with Seattle's neighborhoods, and 3) rehabilitate housing to
prevent neighborhood decline or stimulate improvement in areas where such decline had already
occurred.
By 1993 the program had achieved 752 scattered-site dwellings, despite federal funding
falling steeply in the ‘80s. The program was also successful in reaching integration: a research
study conducted in 1996 found that racial and economic integration was achieved by 1981. In
2004, SHA began the process of adjusting the mix of housing in the portfolio in response to
budgetary constraints (Seattle Housing 2004). The units were slated to be replaced by ones that
were more cost-effective to manage and better located to serve resident needs. Over 700 scattered
sites properties were evaluated through a cost-benefit lens, which considered property condition,
quality of neighborhoods, area concentrations of poverty, and estimated market values. This
resulted in the “high priority” identification of 146 units of the approved 200 for sale. By 2008,
the program had sold about 100 properties and netted over $35 million, which was reinvested in
higher-density units in the North End and West Seattle neighborhoods (Eskenazi 2008). SHA
reports that despite the sales, both small and large, single-family homes were retained for residents
with disabilities and families too big for small apartment units, respectively.
Response
The portfolio realignment was met with mixed reviews from residents in the affordable
housing programs. Residents forced to move would have preferred to stay where they were, but
for the most part, individual needs and preferences were taken into consideration during the
relocations. In an article published in the Seattle Times, one SHA tenant, Dolores Wilson, was
32
relocated from a property slated for sale to a nearby house in North End (Eskenazi 2008). She
expressed concern for her youngest son, who has disabilities and needs to live close to the
Children’s Hospital. The new house was able to accommodate those needs, with Dolores
remarking: “We were totally blessed...It has a wheelchair ramp, a nice deck, a big backyard, a
double-car garage, and two full baths. What more could I ask for?” Another resident purchased the
scattered-site home where she had lived with her family for 18 years (Seattle Housing 2005). SHA
reports that all the residents of the other units that were sold have been relocated to other SHA
housing and continue to pay an affordable rent. This approach of needs-matching helped in the
relocation process, not just from a process standpoint but also from a public relation one.
Seattle has many demonstrations and protests in recent years as a result of racial and civil
unrest nationwide. Most recently, the Capitol Hill Occupied Protest (CHOP) has occupied a six-
block stretch of a Seattle neighborhood and called for broad reforms in the criminal justice and
healthcare systems (Rahman 2020). They have also called for the “de-gentrification of Seattle,
starting with rent-control.” The agency did come under fire in 2014 for proposed public housing
rent hikes as part of their “Stepping Forward” proposal, but for the most part SHA has been able
to dodge scrutiny that plagues other housing authorities nationwide, and they were not implicated
in the summer CHOP protests (Knox 2014). In other words, they have not been blamed for
gentrification happening in Seattle. This can be seen as a result, in part, of the success of many
housing programs and developments including High Point, which was transformed from one of
the highest crime areas in the city to a thriving, diverse community (Barnett 2017).
Results
In response to the success of the portfolio realignment program and positive press, SHA
piloted a program, “Rightsizing,” in 2019. The program was designed to increase the number of
people SHA can house by relocating families living in units larger than their needs to new sites
better suited to their size (Seattle Housing 2020). Households identified for relocation receive
resources to support the move, including their choice of two SHA housing options for a suitable
new home, reimbursement for moving costs or professional moving services, and funds for
incidental expenses and a free month of rent. SHA reports that in one year of the program, 40
households were relocated, and twice as many people as were previously housed in the larger units
were able to come off the waiting list. El Paso (HACEP) received acclamation from Hogan for a
similar “rightsizing” approach in the Scattered-Site Housing HUD Report (Hogan 1996). Hogan
refers to the program as “tenant placement,” defining it as an evaluation of the needs of individual
tenants in the public housing program. HACEP credits tenant placement for more efficient
maintenance of scattered sites, because tenants become better known to the Authority and typically
maintain “good records of tenancy” as a result.
Continuing this thread of promoting positive tenant relations, in 2018 and 2019, SHA
partnered with researchers for a social science intervention that paired housing choice vouchers
with the tools and support needed to promote further integration into the greater Seattle area
(Matthews 2019). The experiment found that the additional support raised the share of families
moving to high-opportunity neighborhoods from just 14% to 54%, highlighting the power of
agency support in dismantling residential segregation (Bergman et al. 2020). Navigators provided
support that went beyond informational: they helped in the housing search, met with landlords in
high-opportunity neighborhoods to dispel any negative Section 8 impressions, and aided those
landlords in expediting inspections and other red tape typical to the voucher process. Additionally,

33
the experiment gave participants a new lens through which to view government bureaucracy, with
one resident remarking, “People say that Seattleites don’t smile at you, or look up to say hi to you,
but these people were really, really nice. They just took all the worry and stress away from me”
(Matthews 2019). The intervention cost on average $2,700 per family, but this cost could be offset
by lifetime benefits to children who gain new opportunities through relocation. Earlier research
found the economic consequences of relocation result in an 8.1% increase in lifetime earnings,
which could contribute to higher tax revenue and less reliance on public assistance in the future.
Conclusion
The SHA’s approach to needs-matching and their active promotion of positive tenant
relations contributes to greater public trust in the agency. Additionally, the housing voucher
experiment conducted in 2018 was arguably a vehicle of reverse-gentrification, in that residents
were encouraged and supported to move to new areas rather than forced out to the fringes of
existing ones. SHA reaps many benefits from such programs that not only engage meaningfully
within existing communities but also build a strong foundation for future residents to break
generational cycles of poverty.
Case Studies: In Summary
These case studies surrounding housing authorities facing similar financial constraints are
meant to inform PHA about how they may (1) rebuild trust with the community and (2) improve
their practices in consideration of future development in Philadelphia that may benefit all residents.

34
Policy Recommendations
After reviewing the census data, conducting interviews, analyzing gentrification in
Philadelphia, examining how PHA’s property sales may have contributed to gentrification in select
neighborhoods, and better understanding the potential for displacement in neighborhoods
undergoing gentrification, the research team has compiled a matrix of changes for PHA’s
consideration in reforming their programs and initiatives. After the initial proposal, the research
team identified three options for PHA depending on if they were found to have had any statistical
effect on gentrification and or an observable negative impact on the community:
Option #1: PHA makes no changes and continues to dispose of properties,
Option #2 PHA halts the sales of all future dispositions permanently, or
Option #3 PHA reforms their disposition policy with a hybrid approach.
After conducting extensive research, the team strongly recommends the third option, as a
marginal community impact can be observed in the qualitative and quantitative data. The team has
established several recommendations below to help PHA pursue the goal of improving relations
and mitigating any negative effects on the community while balancing any fiscal constraints. The
hybrid approach combines initiatives for local government collaboration and internal PHA actions.
Table 3 describes the recommendations concisely and details the expected implementation
timeline for PHA.
Policy Recommendation Implementation
#1 Amend Fair Housing Ordinance Long Term
#2 Implement Tax Increment Financing and
Special Service Tax District Long Term
#3 Establish sale and development requirements specifically for PHA sales Short Term
#4 Consult with local communities on market-rate sales Short Term
#5 Incorporate waiting lists in market-value assessments Short Term
#6 Establish and retain a set percentage of vacant lots per neighborhood Short Term
#7 Establish specific caps on annual PHA property sales Short Term
#8 Notify City Council members about relevant district property dispositions Short Term
#9 Expand existing non-profit partnerships and seek out new partnerships Short & Long Term
#10 Expand Housing Choice Homeownership Program (HCHP) Long Term
Table 3: Policy Recommendation Matrix
35
Local Government Initiatives
Local government collaboration can be built through two suggested initiatives: an
amendment to the Fair Housing Ordinance and special service tax districts or tax-increment
financing. The first recommendation (#1) is that PHA petition the City Council of Philadelphia to
amend the Fair Housing Ordinance with a preservation clause that includes a Right of First Refusal
(ROFR) for properties under fair market value consideration for sale. Right of First Refusal allows
the rights holder to purchase the property over other potential buyers or decline and allow the
initial offer to clear. The inclusion of ROFR would represent a formal codification of existing PHA
policy into city code and significantly expand the rights of average community members.
Furthermore, the successes of PHA’s homeownership programs would be replicated at the city
level by promoting affordable homeownership. Finally, any existing PHA residents would have
an additional avenue for enforcement separate from PHA to keep families in their units; however,
landlords may push back, as they may not want to first offer to existing tenants at a lower rate than
what could be earned from a developer.
Although the team’s research does not directly examine PHA’s budget, the following
recommendations do address the deficit that underlines PHA’s motivation to sell off scattered sites.
The second recommendation (#2) is for PHA to coordinate with the City Council to create special
service tax districts or tax increment financing (TIF) districts throughout the city. The districts will
be used to direct funding toward PHA’s capital improvement deficit. TIFs are similar to special
services districts in that they require the city to levy a small tax in a defined area; however, TIFs
leverage state funding and work toward paying off a specific loan instead of continuously
providing a service. Over time, the TIF will be paid off, and the project would be completed. The
special districts’ creation would institute a minimal tax on development and local construction
projects in the private market to fund the repair and maintenance of existing public housing units
in the area. Operationally, the City of Philadelphia would establish and collect the funds from
either the special service or TIF district and dedicate those funds to maintaining PHA scattered
sites and new construction of housing units on vacant lots.
Additional considerations could include imposing a minimum tax on local universities and
colleges that construct student housing in rapidly gentrifying neighborhoods, as they have had an
outsized impact on the amount and pace of gentrification in these areas. PHA should also consider
partnering with PIDC, a non-profit public-private economic development corporation founded by
the city and Chamber of Commerce. PIDC has supported the use of TIF funding to rehabilitate
public infrastructure in the recent past (PIDC 2018). Nationally, local governments have used TIF
funding to fund housing projects over the last two decades. In the early 1970s, TIF funding was
utilized by the Salt Lake City Redevelopment Agency (RDA) to fund housing projects, raising
over $6,656,687 from 1999-09 alone (National Housing Conference 2021). It is important to note
that Salt Lake City had only dedicated a portion of its TIF to housing. In addition, the City of
Sacramento and the Sacramento Redevelopment Agency partnered to use TIF funds to purchase
and redevelop 116 formerly private buildings for low-income families and seniors in 2001
(National Housing Conference 2021). The research team proposes that Philadelphia work with
PHA to create a specific, housing-dedicated TIF, because utilizing TIF as a dedicated funding
stream and collaborating with the local government can provide a structural solution to addressing
the agency’s billion-dollar capital deficit.

36
PHA Operational Changes
The team recommends that PHA make two internal changes to their operations to help
reduce any further gentrification in the communities surrounding their scattered-site properties.
These changes include amending the Scattered Site Strategic Repositioning plan to address
developer accountability and revising market-value assessments to weight waiting lists as a part
of valuations.
First, the research team recommends PHA make operational changes to the Scattered Site
Strategic Repositioning plan, which, as of the proposed 2021 MTW annual plan, includes the sale
of 1,292 additional vacant properties. PHA has sold 1,516 properties since 2009, without any of
the proposed developer requirements for affordability. If these additional proposed 1,292
properties are sold, PHA should consider protections and developer restrictions (#3) to (1) cap
annual private market sales and (2) require that a percentage of new development units meet
affordable housing standards. This percentage of affordable units per property should be decided
in consultation with community leaders and in consideration of the government and existing PHA
standards. The requirements would only apply to PHA properties under consideration for
disposition. The required percentages for affordable housing in the sale to developers should
include a percentage match that favors occupant-for-occupant over unit-for-unit to minimize
family displacement and avoid the demographic changes emblematic of gentrification. The buyer
conditions can model those implemented by Montgomery County Maryland’s Moderately Priced
Dwelling Unit (MPDU) Program. The MPDU purchases and builds, with public-private
partnerships, new and existing affordable townhouses, and condominiums. The units under the
MPDU have controls on them and come with legal documents of restrictive covenants that
preserve the units’ affordability (Department of Housing and Community Affairs 2021). The need
for improved standards aligns with PHA’s mission to provide affordable housing: a recent PEW
Research Report found that the majority of the cost-burdened renters and homeowners exist in the
areas of the city wherein PHA has the most scattered sites (Howell 2020). In fact, the area that saw
the steepest increase in rent hikes was North Philadelphia, which increased from $713 per month
in 2009 to $917 in 2018. These areas also saw “significant losses of rental units priced below $750
per month” (Howell 2020), which underscores the effect on affordability in those neighborhoods.
Furthermore, PHA should prioritize sales, where possible, to land banks and non-profits in
continuation of existing practices (#4). As previously mentioned, this recommendation will help
address community concerns and preserve PHA’s financial flexibility. Overall, market-rate sales
should be given the lowest priority and considered only after the local community is consulted.
PHA as a landowner can address the issues raised by the community by allowing them to
participate in the form of ROFR. Sales would be considered only after determining that the
property could not be sold to either community members, a non-profit, or a land bank for the
creation of community gardens, playgrounds, or even public parking. This is an important step in
promoting positive community relations, as there have existed issues in the past between PHA and
land banks: notably, a vacant lot-turned-community garden that was terminated by PHA in 2015
(Melamed 2016). PHA did resolve the issue by granting the community a different vacant lot, but
only after protests put the issue in the public spotlight. In the future, PHA should help to
communicate and coordinate the necessary zoning variances for such projects and work with the
community to achieve grassroots goals.

37
The second operational recommendation (#5) is for PHA to include the current public
housing waiting lists in their market value assessments for respective zip codes. The
recommendation to change market value assessments follows the economic formula of supply and
demand: in summary, the longer the waiting list, the higher the starting bid must be for properties
within that zip code. The waiting list assessment incorporates the current demand for public
housing into the market value, reflecting the vast need for affordable housing while ensuring larger
PHA revenues. This recommendation has no similar counterpart in the public sector when applying
market demand based on housing waiting lists, as PHA's inventory of scattered sites is significantly
larger than any other housing authority in the country, and there are no comparable policies that
exist except in the private market. In the private market, incorporating regional demand for housing
is typical in assessing market value for a property.
If PHA decides to continue to dispose of vacant scattered sites, they should consider the
pace and alternatives to sale. Regarding the speed of dispositions (#6), PHA should set a specific
limit on the number of properties they sell each year to prevent a destabilization of the housing
market. PHA should also hold a moderate percentage of their vacant lot and property stock for
future development (#7). The market-rate sales that the PHA has conducted, though able to
generate revenue according to sales data provided, could counterintuitively increase the cost of
housing in the immediate area as high-income households are attached by the new building and
amenities offered (Asquith, Mast, and Reed 2019). Additionally, the drop in supply for the lowest-
rent units compounds the existing undersupply of affordable housing that Howell (2020) discussed.
Furthermore, PHA should consider the 2014 report from the Federal Reserve Bank of Philadelphia,
which found that “rising housing prices in gentrifying areas are not only fueled by new
construction but are also driven by the loss of low-cost housing — a loss that occurs at nearly five
times the rate of loss seen in neighborhoods that were eligible for gentrification but did not
gentrify” (Chizeck 2017). PHA should thus incorporate land development into future planning to
be better positioned to respond to population growth and affordable housing demand. Retaining
housing stock in areas that will continue to see supply-related price inflations could mitigate any
potential strains on the agency’s ability to provide affordable housing in the future. Finally, PHA
should institute a 90-day notification, before divestment, for City Council members in the
respective district (#8). This will improve communications with City Council members and help
strengthen relationships by opening new lines of dialogue in those communities.
PHA Internal Changes
Separate from these operational changes, we also recommend that PHA continue to grow
and improve relationships with local community groups (#9), including partnerships with
nonprofits such as Habitat for Humanity, Project HOME, and Jumpstart, as well as relationships
with private developers. External partnerships have helped improve their community perception
and were praised in interviews with activists and leaders (PHA 2016). The research team
recommends that PHA focus on their partnership with Jump Start because of their focus on
diversity and small businesses (JumpStart 2017). They have a proven record of helping minority-
owned small businesses establish and thrive. Additionally, PHA would benefit from partnering
with the Division of Housing and Community Development (DHCD), which already has various
housing programs in place, knowledge of the local market, and an impressive success rate of
brokering public-private partnerships to create affordable housing opportunities (DHCD 2020).
Finally, existing programs such as the Housing Choice Homeownership Program (HCHP) should

38
be expanded wherever possible, as the HCHP has been very successful at building community
relationships and restoring public trust (#10).
Additional Considerations
Given the project’s depth and scope, there were some considerations that the team was
unable to research thoroughly enough to make recommendations; however, the relevance and
importance of the following considerations could not be overlooked. As a result, we have included
the following topics to provide meaningful context: (1) the PHA Police Department, separate from
the Philadelphia Police Department (PPD); (2) the impact of the COVID-19 pandemic; (3)
dispositions of scattered sites to nonprofits; and (4) President Joseph Biden’s 2021 Infrastructure
bill. Finally, the research team would like to include two recommendations made by one of the
experts mentioned in the acknowledgements, John Kromer, as he had meaningful final
contributions that should be noted by PHA.
1. PHA’s public reports show that PHA’s private police force, which represents a large
portion of their capital budget, was established in response to the high crime rates in the
older housing project towers not feasibly policed by the PPD. However, the subsequent
demolition of such buildings in recent years has rendered the department redundant in its
current existence. According to PHA, “Those sites have been rebuilt into the city's street
grid and patrolled by Philadelphia Police like any other neighborhood” (PHA 2021). The
duplication of security services represents wasted expenditure that PHA cannot absorb,
given their inability to raise taxes as a local or city government would. The team
recommends that PHA consider eliminating the housing police force, thereby increasing
savings to address the capital deficit, before resorting to dispositions of vacant lots and
scattered sites. In 2013, PHA had 28 officers, and by 2020, they had expanded the force to
over 110 officers (PHA 2014). Factoring in salaries, from 2013 to 2020, PHA has spent
approximately $3,608,000 to $4,100,000 annually in additional salary expenditures based
on 2012 estimates after inflation (PHA 2012). The estimates of additional police salary
expenditures are calculated from PHA’s base starting salaries, which range from $44,000
to $50,000 per officer (PHA 2014). The team believes that this could have a significantly
larger financial impact than the sale of vacant properties; however, there was not enough
research conducted to make a recommendation definitively. Instead, the research team
suggests that PHA evaluate their spending priorities to identify whether a duplication of
efforts has occurred. A potential solution would be to contract a small-scale security force
for any properties where such needs exist.
2. The research team would like to note the potential significance of COVID-19 on the current
recommendations. Recent publications regarding COVID-19’s effect on housing policy
have stated the housing market may be severely impacted. According to Jeffrey Lubell
(2020), the Director of Housing and Community Initiatives at Abt Associates, new housing
stock construction halted for an extended period following the 2009 Recession. Lubell
states clearly that many cities were already lagging demand before COVID-19, “and it is
not at all clear that the production volume of new housing will be able to increase to the
levels needed to ensure affordability.” (Lubell 2020). In the short term, this will likely
lower costs, but in the long term, as the demand for housing builds, it can lead to rapid
gentrification in new areas. Furthermore, PHA should note that some affordable housing
developers (especially nonprofits) may struggle to maintain their operations because of any

39
prolonged recession. The looming eviction crisis poses a significant challenge to PHA’s
services, given the eviction moratorium’s eventual expiration. As a result, PHA should
consider options to expand their supply of housing. As social distancing restrictions lax,
PHA should assess the capacity of developers within the jurisdiction to meet production
and rehabilitation needs and, if necessary, develop policies and support to expand this
capacity. On a positive note, PHA may have an opportunity: land value fell drastically in
the immediate aftermath of the 2009 recession, and Lubell cites a missed opportunity for
public agencies to capitalize on land acquisition in areas experiencing affordable housing
deficits. Finally, PHA should note that the pandemic could cause an acceleration of
gentrification: “Faced with the loss of income, some households may voluntarily give up
their housing while others may be evicted” (Lubell 2020). After displacement begins,
“investors could purchase and seek to reposition the properties to a higher rent level once
the crisis has subsided.” In essence, if PHA divests of scattered-site properties in
gentrifying areas or the neighboring communities, they would directly contribute to this
new wave of gentrification.
3. Throughout this research, there have been recommendations to consider the efficacy of
wholesale scattered-site divestment by PHA to nonprofits. Any losses in profit or housing
stock could be calculated, and PHA could ask the city to fund the loss to the agency.
Although this may help ease the burden of the capital deficit on agency operations,
community members raised concerns in the interviews regarding the type of housing that
nonprofits provide. In particular Jen Bennetch of Occupy PHA felt that nonprofits
exchange family housing opportunities for efficiency units, replacing property-for-
property instead of occupant-for-occupant. In a 2013 HUD periodical, the importance of
mixed-income residential development, which combines a variety of pricing, size, and
type, was found to be an effective tool to reduce and combat concentrations of poverty
(Office of Policy Development and Research 2013). The report continues: “HUD aims to
use the mixed-income strategy to improve the economic viability of multifamily housing—
particularly former public housing developments—and strengthen neighborhoods” (Office
of Policy Development and Research 2013). Additionally, due to the ongoing financial
effects of COVID-19, many non-profits and land banks may not be able to purchase such
properties at a price for which PHA would financially benefit. The scale of sale would
require nonprofits and land banks to raise money that they have been unable to effectively
fundraise during the Pandemic (Lubell 2020). For these reasons, the research team decided
against the adoption of this point as a formal recommendation.
4. PHA should factor in the potential passage of President Biden’s 2021 Infrastructure bill.
The legislation currently has around $40 billion allocated for public housing infrastructure.
If it were to pass, it is important to note that PHA could receive a fraction of that money
and should dedicate all, where possible, to rehabilitation and new acquisition efforts.
Promising results from Brummet and Reed (2019) found that accommodative policies,
such as supply increases in high-demand areas, could mitigate displacement and promote
long-term affordability. Yet, because this bill is a one-time investment, PHA should still
consider the recommendations made by the research team to create and sustain long-term,
systemic change. Reliance on the infrastructure bill will only temporarily solve PHA’s
capital deficit; therefore, PHA should consider the viability of any properties slated for
disposition in the wake of new possible funding for repairs.

40
5. Finally, it is worth noting the suggestions made by panel experts including John Kromer,
the former Director of Housing for the City of Philadelphia from 1992-2001. These include
(1) the pursuit of additional community land trust approaches, separate from Occupy
negotiations and (2) the exploration of similar Seattle tenant management programs and
whether PHA can feasibly replicate those successes. Kromer pointed out that because the
majority of PHA properties are owned by known parties with no encumbrances, they are
in an advantageous position to adopt and implement new initiatives. The research team
concurs and hopes that PHA thoroughly considers all of the recommendations made in this
body of work.

41
Conclusion
The intangible nature of gentrification leads to many residents placing the blame on
organizations such as PHA, even if they are not necessarily the sole driving factor behind
inequitable community development. Twenty-first-century urban revitalization and the influx of
capital and White suburbanites with college degrees and higher incomes naturally leads to
development, which in and of itself is not problematic. What is troubling, is when the positive
effects of neighborhood development only benefit certain populations or harm historically
marginalized communities, via displacement or rapid demographic shifts. If an existing resident is
not displaced outright but rather sees profound changes in the cultural fabric of their community,
forcing them to go farther for goods and services, worship, or work, what is the likelihood that
they remain or benefit from the development?
In conclusion, the research team has found that (1) PHA’s scattered site sales may have
contributed to gentrification in some communities in Philadelphia, (2) minorities are being
displaced as a result, and (3) PHA has a significant public relations crisis with the surrounding
community. Although the research team understands PHA’s significant financial constraints,
public perceptions of PHA as a profit-driven developer only contribute to growing community
frustration and the Occupy movement against the agency. Given the outcome of the protests from
Occupy PHA and other groups over the past year, many of the recommendations provided aim to
give PHA the toolset to construct a more careful approach in improving the agency’s financial
stability without harming underprivileged communities. PHA properties are commonplace across
city neighborhoods, and as such, they are inextricably tied to the ability of any resident to live and
thrive. In accordance with PHA’s 12 strategic priority areas of the Moving to Work Annual Plan,
PHA’s number one priority is to “preserve and expand the supply of affordable housing available
to Philadelphia’s residents with low-incomes,” (PHA 2020b). In other words, the sale of affordable
housing units is in contention with the organization’s mission.
Divestment of scattered sites may better equip the agency to address their second strategic
priority, to “achieve excellence in the provision of management and maintenance services,” but
PHA must reflect on whether the Scattered Site Strategic Repositioning plan is in conflict with
both their first and eleventh priority to “Ensure that PHA is a good neighbor and reliable
community partner” (PHA, 2020b). The intricacies of how PHA meets its mission, along with the
question of whether divestment can meet that mission at all, can only be answered by the agency
itself. The research team hopes that PHA can take this body of work and the recommendations
within into consideration as they continue to make strategic decisions that will undoubtedly shape
the lives of Philadelphians under their care.

42
References
Asquith, Brian J., Evan Mast, and Davin Reed. 2019. "Supply Shock Versus Demand Shock:
The Local Effects of New Housing in Low-Income Areas." Upjohn Institute Working Paper.
Kalamazoo, MI: W.E. Upjohn Institute for Employment Research.
Atkinson, Rowland. 2000. “The Hidden Costs of Gentrification: Displacement in Central
London.” Journal of Housing and the Built Environment 15 (4): 307–326.
www.jstor.org/stable/41107148.
Barnett, Erica C. 2017. “One of Seattle’s Highest Crime Areas Has Transformed into a Thriving,
Diverse Community.” Seattle Magazine. https://www.seattlemag.com/news-and-
features/once-one-seattles-highest-crime-areas-high-point-has-transformed-thriving-diverse
(accessed March 19, 2021).
Bergman, Peter, Raj Chetty, Stefanie DeLuca, Nathaniel Hendren, Lawrence F. Katz, and
Christopher Palmer. 2020. “Creating Moves to Opportunity: Experimental Evidence on
Barriers to Neighborhood Choice.” https://opportunityinsights.org/wp-
content/uploads/2019/08/cmto_paper.pdf.
Betancur, John. 2011. “Gentrification and Community Fabric in Chicago.” Urban Studies, 48
(2): 383-406.
Brummet, Quentin, and Davin Reed. 2019. The Effects of Gentrification on the Well-Being and
Opportunity of Original Resident Adults and Children.
https://cdn.theatlantic.com/assets/media/files/gentrification_final.pdf (March 16, 2021).
Broadwater, Luke. 2018. “Tenants Evicted Improperly from Baltimore’s Privatized Public
Housing, Complaint Alleges.” Baltimore Sun.
https://www.baltimoresun.com/maryland/baltimore-city/bs-md-ci-public-housing-evictions-
20180208-story.html (accessed April 07, 2021).
“Changes Coming in Scattered Sites Portfolio.” 2004. Seattlehousing.org.
https://www.seattlehousing.org/news/changes-coming-scattered-sites-portfolio (accessed
March 19, 2021).
Chaskin, R. J. 2013. “Integration and Exclusion: Urban Poverty, Public Housing Reform, and the
Dynamics of Neighborhood Restructuring.” The ANNALS of the American Academy of
Political and Social Science 647(1): 237-267.
Chizeck, Seth. 2017. “Gentrification and Changes in the Stock of Low-Cost Rental Housing in
Philadelphia, 2000 to 2014.” Federal Reserve Bank of Philadelphia.
https://www.philadelphiafed.org/-/media/frbp/assets/community-development/reports/0117-
cascade-focus-gentrification-and-changes.pdf (accessed April 4, 2021).
Clay, Phillip L. 1979. Neighborhood Renewal: Middle-Class Resettlement and Incumbent
Upgrading in American Neighborhoods. Lexington, Mass: Lexington Books.

43
Davidson, Mark. 2008. “Spoiled Mixture: Where Does State-led `Positive’ Gentrification End?”
Urban Studies 45(12): 2385-2405.
Davidson, Mark. 2010. “Social Sustainability and the City.” Geography Compass 4(7): 872-880.
Department of Housing and Community Affairs. 2021. “How to Apply to the MPDU Sales
Program.” Montgomery County Government.
https://www.montgomerycountymd.gov/DHCA/housing/singlefamily/mpdu/programsales.ht
ml#Description (accessed April 2, 2021).
Ding, Lei, Jackelyn Hwang, and Eileen Divringi. 2016. “Gentrification and Residential Mobility
in Philadelphia.” Regional Science and Urban Economics 61: 38-51.
Division of Housing and Community Development. 2020. “Find Affordable Rental Housing:
Service.” City of Philadelphia. www.phila.gov/services/property-lots-housing/buy-sell-or-
rent-a-property/find-housing/find-affordable-rental-housing/ (accessed April 2, 2021).
Eskenazi, Stuart. 2008. “Selling Houses Makes Agency Less ‘Scattered.’” The Seattle Times.
https://www.seattletimes.com/seattle-news/selling-houses-makes-agency-less-scattered/
(accessed March 19, 2021).
“First Phase of Scattered Sites Sales Nearly Complete.” 2005. Seattlehousing.org.
https://www.seattlehousing.org/news/first-phase-scattered-sites-sales-nearly-complete
(accessed March 19, 2021).
Fullilove, Mindy T., and Rodrick Wallace. 2011. “Serial Forced Displacement in American
Cities, 1916-2010.” Journal of Urban Health 88(3): 381-389.
Gerken, Matthew., Susan J. Popkin., and Christopher R. Hayes. 2019. How Has HUD’s
Controversial Rental Assistance Demonstration Affected Tenants?
https://www.urban.org/urban-wire/how-has-huds-controversial-rental-assistance-
demonstration-affected-tenants
Goetz, Edward G. 2003. “Housing Dispersal Programs.” Journal of Planning Literature 18(1): 3-
16.
Government Accountability Office. 2010. Revitalization Programs: Empowerment Zones,
Enterprise Communities, and Renewal Communities. https://www.gao.gov/assets/gao-10-
464r.pdf.
Guerrieri, Veronica., Daniel Hartley, and Erik Hurst. 2013. “Endogenous Gentrification and
Housing Price Dynamics.” Journal of Public Economics, Elsevier 100(C):45-60.
Hackworth, Jason, and Neil Smith. 2001. “The Changing State of Gentrification.” Tijdschrift
voor Economische en Sociale Geografie, 92(4): 464-477.
Helms, Andrew C. 2003. “Understanding Gentrification: An Empirical Analysis of the
Determinants of Urban Housing Renovation.” Journal of Urban Economics 54 (1): 474-498.
44
Hogan, James. 1996. Scattered Site Housing: Characteristics and Consequences.
https://www.huduser.gov/publications/pdf/Scattered_site_housing.pdf.
“Houston Agency Nets $8M in Real Estate Auction.” 2011. Houston Business Journal.
https://www.bizjournals.com/houston/morning_call/2011/11/houston-agency-nets-8m-in-real-
estate.html.
Houston Housing Authority. 2009.
http://dig.abclocal.go.com/ktrk/DolcefinoMessage072309rescattered%20sites.pdf.
“Houston Housing Authority Hosts Auction of Scattered-Site Properties.” 2011. Houston Agent.
https://houstonagentmagazine.com/2011/10/20/houston-housing-authority-hosts-auction-of-
scattered-site-properties/.
Howell, Octavia. 2020. “The State of Housing Affordability in Philadelphia.” The Pew
Charitable Trusts. https://www.pewtrusts.org/en/research-and-analysis/reports/2020/09/the-
state-of-housing-affordability-in-philadelphia (accessed April 10, 2021).
Hwang, Jackelyn. 2016. “Pioneers of Gentrification: Transformation in Global Neighborhoods in
Urban America in the Late Twentieth Century.” Demography 53(1): 189-213.
ICMA. 2015. “Evaluating the Role of Local Government and Project Stakeholder Engagement in
Choice Neighborhoods Transformation Planning and Implementation.”
https://www.transformgov.org/sites/transformgov.org/files/307994_HUD%20Neightborhood
s%20study.pdf (accessed April 11, 2021).
Jennings, Rohan. 2020. “The Color of Law Term: Public Works Administration (PWA).”
LitCharts. https://www.litcharts.com/lit/the-color-of-law/terms/public-works-administration-
pwa (accessed March 2, 2021).
JumpStart. 2017. A New Model of Community Development. https://www.gojumpstart.org/
(accessed April 4, 2021).
Knox, Curran. 2014. “Residents Call ‘Stepping Forward’ a Huge Step Backwards.” South Seattle
Emerald. https://southseattleemerald.com/2014/11/02/residents-call-stepping-forward-a-
huge-step-backwards/ (accessed March 19, 2021).
Lee, Jaime A. 2015. “Rights at Risk in Privatized Public Housing.” Tulsa Law Review 50(3):
759-803.
Lees, Loretta, Tom Slater, and Elvin Wyly. 2010. The Gentrification Reader (1st ed.).
Oxfordshire: Routledge.
Lubell, Jeffrey. 2020. The Storm after the Calm: The Profound Implications of COVID-19 for
U.S. Housing Policy. https://www.abtassociates.com/insights/publications/white-paper/the-
storm-after-the-calm-the-profound-implications-of-covid-19.

45
Lubrano, Alfred, and Laura McCrystal. 2020. “One of the Last Occupants to Leave the Now-
Closed PHA Homeless Encampment Looks Forward to a House.” Philadelphia Inquirer.
https://www.inquirer.com/news/homeless-encampment-philadelphia-housing-authority-
20201006.html (accessed April 2, 2021).
Matthews, Dylan. 2019. “America Has a Housing Segregation Problem. Seattle May Just Have
the Solution.” Vox. https://www.vox.com/future-perfect/2019/8/4/20726427/raj-chetty-
segregation-moving-opportunity-seattle-experiment (accessed March 19, 2021).
McMenamin, Lexi. 2020. “With Victory, Philly’s Unhoused Activists Close Camp James Talib-
Dean.” ShadowProof. https://shadowproof.com/2020/10/19/philly-encampment-city-plan-
unhoused/ (accessed April 13, 2021).
Melamed, Samantha. 2016. “Seeds of Hope, Transplanted: After PHA Plans Displaced Their
Garden, a North Philadelphia Community Dug in and Designed a New One.” Philadelphia
Inquirer Dec. 30.
MPP Capstone. 2021. PHA Project Proposal.
National Housing Conference. 2021. “Program Profiles.” National Housing Conference.
nhc.org/policy-guide/tax-increment-financing-the-basics/program-profiles-tif/ (accessed
April 5, 2021).
National Residential Auctioneers. 2011. “Massive Absolute Auction of 171 Homes and Three
Lots in Houston Set for Nov. 12.” PR Newswire. https://www.prnewswire.com/news-
releases/massive-absolute-auction-of-171-homes-and-three-lots-in-houston-set-for-nov-12-
132990383.html (accessed March 19, 2021).
Office of Audit, Region 10, Seattle, WA. 2018. Rental Assistance Demonstration Program.
https://www.oversight.gov/sites/default/files/oig-reports/2018-SE-1001.pdf.
Office of Homeless Services. 2020. FY2020 Data Snapshot.
http://philadelphiaofficeofhomelessservices.org/wp-content/uploads/2020/11/OHS-Data-
Snapshot-FY-2020.pdf.
Office of Policy Development and Research (PD&R). 2013. Confronting Concentrated Poverty
With a Mixed-Income Strategy.
https://www.huduser.gov/portal/periodicals/em/spring13/highlight1.html (accessed April 20,
2021).
Pendall, Rolf, and Leah Hendey. 2013. A Brief Look at the Early Implementation of Choice
Neighborhoods. Washington, DC: The Urban Institute.
Pennsylvania Historical and Museum Commission. 2015. “Public Housing.” PHMC.
http://www.phmc.state.pa.us/portal/communities/pa-suburbs/urban-development/public-
housing.html (accessed April 11, 2021).

46
Philadelphia Housing Authority. 2012. “PHA Increases Police Force for the First Time in Over a
Decade.” www.pha.phila.gov/pha-news/pha-news/2012/pha-increases-police-force.aspx.
(accessed April 1, 2021).
Philadelphia Housing Authority. 2014. Philadelphia Housing Authority Accomplishments Report
2014. http://www.pha.phila.gov/media/149514/pha_accomplishments_report_10_24_14.pdf
(accessed March 31, 2021).
Philadelphia Housing Authority. 2016. “PHA & Habitat for Humanity to Preserve and Build
More Homes in Sharswood.” http://www.pha.phila.gov/pha-news/pha-news/2016/pha-
habitat-for-humanity-to-preserve-and-build-more-homes-in-sharswood.aspx (accessed April
4, 2021).
Philadelphia Housing Authority. 2020a. “About PHA.”
http://www.pha.phila.gov/media/189728/pha_fact_sheet_2020_july_10.pdf (accessed March
31, 2021).
Philadelphia Housing Authority. 2020b. Moving to Work Annual Report 2020.
http://www.pha.phila.gov/media/191137/pha_mtw_annual_report_fy2020.pdf (accessed
March 31, 2021).
Philadelphia Housing Authority. 2021. “PHA Police Department.”
www.pha.phila.gov/aboutpha/departments/pha-police-department.aspx. (accessed April 1,
2021).
PIDC. 2018. “Tax-Increment Financing.” www.pidcphila.com/product/tax-increment-financing-
tif#:~:text=The%20Commonwealth%20of%20Pennsylvania%20has,improvements%20in%2
0the%20TIF%20District (accessed April 2, 2021).
Popkin, Susan J., Larry F. Buron, Diane K. Levy, and Mary K. Cunningham. 2000. “The
Gautreaux Legacy: What Might Mixed-Income and Dispersal Strategies Mean for the
Poorest Public Housing Tenants?” Housing Policy Debate 11(4): 911–942.
Preis, Benjamin, Aarthi Janakiraman, Alex Bob, and Justin Steil. 2020. “Mapping Gentrification
and Displacement Pressure: An Exploration of Four Distinct Methodologies.” Urban Studies
Journal 58(2): 405-424.
Ragen, Jennifer. 2021. ‘Summary of Waitlist Data by Zip’.
Rahman, Khaleda. 2020. “Protesters Want Seattle De-Gentrified—This Is How It Could
Happen.” Newsweek. https://www.newsweek.com/seattle-capitol-hill-protesters-
gentrification-black-lives-matter-1511192.
Ralph, Pat. 2020. “City Officials, Homeless Encampment Leaders Reach Deal to End Protest
Camp at Ridge Ave.” PhillyVoice. https://www.phillyvoice.com/philadelphia-housing-
authority-occupy-pha-homeless-encampment-ridge-avenue/ (accessed April 2, 2021).

47
Rao, Sridevi. 2016. A Measure of Community: Public Open Space and Sustainable Development
Goal 11.7 (1st ed.). Mountain View: Notion Press, Inc.
Rich, Michael J., and Robert P. Stoker. 2010. “Rethinking Empowerment: Evidence from Local
Empowerment Zone Programs.” Urban Affairs Review 45(6): 775-796.
“‘Rightsizing’ Helps SHA House More People.” 2020. Seattlehousing.org.
https://www.seattlehousing.org/the-voice/rightsizing-helps-sha-house-more-people (accessed
March 19, 2021).
Schwartz, Alex. 2017. “Future Prospects for Public Housing in the United States: Lessons from
the Rental Assistance Demonstration Program.” Housing Policy Debate 27(5): 789-806.
Seattle Housing Authority. 2012. “Scattered Sites - Seattle Housing Authority.”
https://web.archive.org/web/20120722215214/http://www.seattlehousing.org/redevelopment/
scattered/ (accessed March 19, 2021).
Smith, Neil. 1979. “Toward a Theory of Gentrification A Back to the City Movement by Capital,
not People.” Journal of the American Planning Association 45(4): 538-548.
The Pew Charitable Trusts. 2016. Philadelphia’s Changing Neighborhoods: Gentrification and
Other Shifts Since 2000.
https://www.pewtrusts.org/~/media/assets/2016/05/philadelphias_changing_neighborhoods.p
df (March 16, 2021).
Thiele, Mark. 2021. ‘Request for Interview’.
Teitz, Michael B., and Karen Chapple. 1998. “The Causes of Inner-City Poverty: Eight
Hypotheses in Search of Reality.” Cityscape: A Journal of Policy Development and Research
3(3): 33-70. https://www.huduser.gov/Periodicals/CITYSCPE/VOL3NUM3/article3.pdf.
United Nations Development Programme. 2020. “Human Development Index (HDI).”
http://hdr.undp.org/en/content/human-development-index-hdi.
U.S. Census Bureau. 2012 - 2019. “The American Community Survey.”
https://data.census.gov/cedsci/.
U.S. Department of Housing and Urban Development. 1994. The President’s Community
Enterprise Board: Building Communities Together: Empowerment Zones and Enterprise
Communities Application Guide. Washington, DC: U.S. Department of Housing and Urban
Development and U.S. Department of Agriculture.
Wang, Yang. 2011a. “Homes Still Empty in Houston Housing Program for the Poor.” Houston
Chronicle. https://www.chron.com/news/houston-texas/article/Homes-still-empty-in-
Houston-housing-program-for-2078029.php.

48
Wang, Yang. 2011b. “Program’s Empty Promises Leave Poor without Homes.” Houston
Chronicle. https://www.chron.com/news/houston-texas/article/Program-s-empty-promises-
leave-poor-without-homes-1693248.php.
“What Is New Urbanism?” 2015. Congress for the New Urbanism.
https://www.cnu.org/resources/what-new-urbanism (accessed April 06, 2021).
Wilkerson, Isabel. 2016. “The Long-Lasting Legacy of the Great Migration.” Smithsonian
Magazine. https://www.smithsonianmag.com/history/long-lasting-legacy-great-migration-
180960118/ (accessed April 06, 2021).
Zuk, Miriam, Ariel H. Bierbaum, Karen Chapple, Karolina Gorska, and Anastasia Loukaitou-
Sideris. 2018. “Gentrification, Displacement, and the Role of Public Investment.” Journal of
Planning Literature 33(1): 31-44.