EEB Hub Regional Sankey Diagram: Philadelphia Authority...
37
LLNL-TR-643762 EEB Hub Regional Sankey Diagram: Philadelphia Authority for Industrial Development Historical and Forecast Energy by Planned Use at the Philadelphia Navy Yard S. L. Singer, A. J. Simon, N. Goldstein September 12, 2013
Transcript of EEB Hub Regional Sankey Diagram: Philadelphia Authority...

LLNL-TR-643762
EEB Hub Regional Sankey Diagram:Philadelphia Authority for IndustrialDevelopment Historical and ForecastEnergy by Planned Use at thePhiladelphia Navy Yard
S. L. Singer, A. J. Simon, N. Goldstein
September 12, 2013

Disclaimer
This document was prepared as an account of work sponsored by an agency of the United States government. Neither the United States government nor Lawrence Livermore National Security, LLC, nor any of their employees makes any warranty, expressed or implied, or assumes any legal liability or responsibility for the accuracy, completeness, or usefulness of any information, apparatus, product, or process disclosed, or represents that its use would not infringe privately owned rights. Reference herein to any specific commercial product, process, or service by trade name, trademark, manufacturer, or otherwise does not necessarily constitute or imply its endorsement, recommendation, or favoring by the United States government or Lawrence Livermore National Security, LLC. The views and opinions of authors expressed herein do not necessarily state or reflect those of the United States government or Lawrence Livermore National Security, LLC, and shall not be used for advertising or product endorsement purposes.
This work performed under the auspices of the U.S. Department of Energy by Lawrence Livermore National Laboratory under Contract DE-AC52-07NA27344.

EEB Hub Regional Sankey Diagram:
Philadelphia Authority for Industrial Development Historical and Forecast
Energy by Planned Use at the Philadelphia Navy Yard
LLNL-TR-643762
Suzanne L. Singer, A.J. Simon, Noah Goldstein
Lawrence Livermore National Laboratory
September 16, 2013

2
ContentsExecutive Summary ................................................................................................................................. 3
Introduction ............................................................................................................................................ 4
Analysis ................................................................................................................................................... 5
Results: Forecasted usage and Sankey diagrams...................................................................................... 7
Conclusions ........................................................................................................................................... 22
Acknowledgements ............................................................................................................................... 22
References: ........................................................................................................................................... 23
Appendix A: Data and Assumptions ....................................................................................................... 24
Appendix B: Navy Yard Master Plan 2013 Update Details....................................................................... 27
Appendix C: Potential for Sankey Diagrams in Building Energy............................................................... 33

3
Executive Summary
The Energy Efficient Buildings Hub (EEB Hub) is a DOE-funded center, focused on improving
the energy use in commercial and large-scale residential buildings. One of the Hub’s goals has
been to develop the means and methods to reduce energy use in commercial buildings by 20
percent by 2020. Understanding energy use in buildings is a key component to managing energy
use at multiple scales, from the building to the city, to the region. Sankey diagrams are an
accessible tool to visualize energy flows, and help identify opportunities to deploy energy saving
technologies.
A campus-level Sankey diagram was previously generated from 2010-2011 data for ~100
metered Navy Yard buildings to quantify natural gas and electricity usage by principal building
activity [4]. As these properties are renovated, the energy consumption and building principal
activities are being updated and modified.
To depict the multi-year time lapse of regional electricity distribution in the Navy Yard, LLNL
generated Sankey diagrams using data from 36 properties (buildings, developments, equipment)
used to develop Philadelphia Authority for Industrial Development’s (PIDC) Navy Yard Master
Energy Plan (NYEMP). The diagrams presented in this report depict ~10 building use types and
the yearly changes in forecasted usage in GWh from 2011 to 2022.
The forecast captures increases in regional energy use from planned building additions and
renovations and yearly increases for existing buildings. From 2009 to 2022, there is
approximately 5.6 million square feet of planned additions and renovations. The largest addition
of properties are for office (~ 2.3 million square feet for dedicated office, and larger for shared
office space) and residential space (~1 million square feet). Until 2014, the largest user of
energy is for flex space, reaching a forecasted 11.4 GWh. In 2015-2016, the largest forecasted
user is for a data center reaching ~25.7 GWh. After 2016, the largest consumers are either for
office space (reaching 63.2 GWh forecast in 2022), or heavy industry (68 GWh forecast in
2022).

4
Introduction
The Navy Yard
The Navy Yard is on 1,200 acres containing roughly 282 existing buildings (233 historic
structures), 7 miles of waterfront, and more than 10,000 employees working in more than 6.5
million square feet of facilities [2]. There are commercial, Naval, and industrial facilities.
Establishments currently based at the Navy Yard include the EEB Hub, Penn State, Urban
Outfitters, GlaxoSmithKline, Tasty Baking Company, Unique Industries, WuXi AppTec
Laboratory Services, Rhoads Industries, and Iroko Pharmaceuticals.
Philadelphia Authority for Industrial Development (PIDC) and the Navy Yard Master
Plan
PIDC manages the independent unregulated electric distribution grid that serves the Navy Yard.
They led efforts to develop a 10 year Energy Master Plan that implements smart grid
technologies to reduce the need for off-site external energy consumption. The plan is also
organized around stakeholder involvement around distributed generation and energy efficiency.
PIDC contributed to the 2013 Navy Yard Master Plan update which addresses infrastructure
improvements and additions, recreation, residential and commercial development, and research
space. The plan integrates sustainable design including green spaces, carbon footprint reduction,
redevelopment of existing sites, LEED designed buildings, mass transit, and storm water
retention.
EEB Hub and Penn State University
The EEB Hub, located in the Philadelphia Navy Yard, was created by the U.S. DOE as an energy
regional innovation hub. One of the Hub’s goals has been is to develop the means and methods
to reduce energy use in commercial buildings by 20 percent by 2020. Understanding energy use
in buildings is a key component to managing energy use at multiple scales, from the building to
the city, to the region.
Previously, EEB Hub requested qualitative visualizations of regional energy flows for the Navy
Yard. These energy flows or Sankey diagrams are an accessible tool to help identify
opportunities to deploy energy saving technologies. LLNL generated a campus-level Sankey
diagram using metered natural gas and electricity data for the fleet of ~100 buildings in the Navy
Yard. The Sankey showed energy flow from natural gas and electricity to end use based on the
principal activity of the building. The energy consumption and building principal activities are
being updated and modified as properties in the Navy Yard get renovated.

5
Analysis
To provide a transient aspect to regional energy use, LLNL developed annual Sankey diagrams
showing actual usage from 2009 to mid-2011 and forecast usage from mid-2011 to 2022. The
main source of data is contained in a spreadsheet used to develop Navy Yard Master Energy Plan
(NYEMP). The data for four quarters each year is organized by the usage in MWh, substation
(SS 93 and SS 664) that supplies electricity, and by building use type (residential, industrial,
office, data center, etc.).
Existing property at the start of the NYMEP consumed an estimated amount of electricity,
known as the baseline, from 2009 to mid-2011. The forecast analysis beyond 2011 assumes a
1% annual usage increase for the baseline for most1 properties. The forecast also accounts for
approximately 5.6 million square feet of planned building renovations and property (buildings,
developments, equipment) additions in the Navy Yard starting in 2011. Tables A1 and A2 show
the Watt per square foot for each building type. Other assumptions about the forecast analysis
are in Appendix A.
Figure 1 shows the location of the two substations in the Navy Yard (yellow dots) and the areas
of the Navy Yard they cover. Loads from SS 93 are all industrial, while those for SS 664 are
generally commercial.
Figure 1. Map of the Navy Yard and substation locations. Property data for the Sankey diagrams are fed by substations 93 and 664, shown as yellow dots. The green shaded area is served by substation 93 and substation 664
serves the brown shaded area. [5]
1 Except East End development and equipment

6
Data from 2 substations and 36 properties were grouped into 10 building use types (industrial,
residential, etc.), some of which are a combination of others. We chose building use as the
Sankey diagrams “end flow” because in a previous report, regional Sankey diagrams were
organized by building type and end use [4]. In that report, the Commercial Buildings Energy
Consumption Survey (CBECS) was used to approximate end-use energy loads for a given
building type since sub-metering was not available.
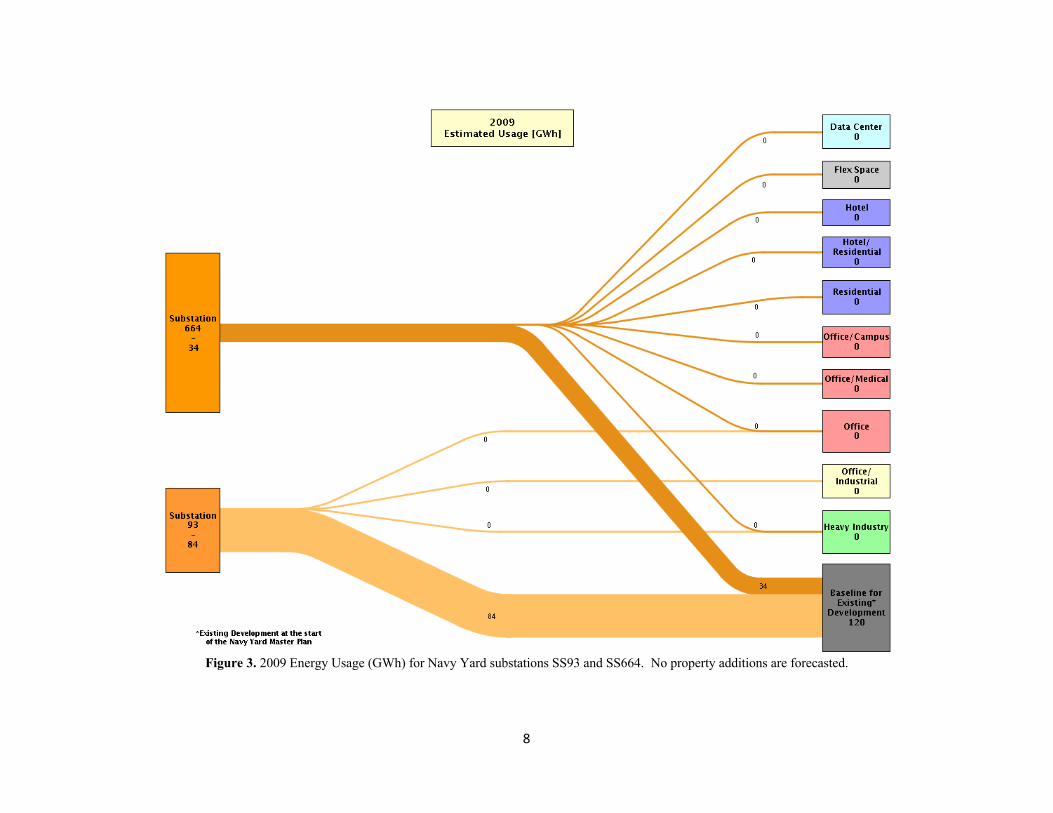
Figure 2 shows the annual cumulative (both substations) forecast total in GWh from 2011-2022.
Each Sankey diagram shows the split of distribution from SS93 and SS664 to baseline and each
building type. Figure 3 and 4 depicts estimated energy use in 2009 and 2010 respectively.
Similarly, one Sankey diagram per year from 2012 to 2022 (figures 6 through 16) shows forecast
energy usage. 2011 had a combination of estimated energy usage and forecast for added
property. The captions for each figure note the approximate square footage of property that is
being added.
The forecast captures increases in regional energy use from planned building additions and
renovations and yearly increases for existing buildings. The largest addition of property is ~ 2.3
million square feet for office space (larger for shared office space) which is forecasted to be the
largest energy consumer, reaching 63.2 GWh forecast in 2022. The second and third largest
consumers in 2022 are expected to be for heavy industry (68 GWh) and a data center (25.7
GWh), both of which are energy resource intensive. The fourth largest consumer by 2022 is
forecasted to be for residential use which accounts for ~ 1 million square feet of added space.
Data used to generate the Sankey diagrams are shown in Appendix A. Table A1 shows use
forecast in GWh organized by year and building use for properties from substation SS664, and
table A2 shows properties from substation SS93. Table A3 shows total forecast usage when
combining SS93 and SS664.
The Sankey diagrams are semi-automated to retrieve data from a spreadsheet. As the
understanding of the Navy Yard energy use is updated and refined, Sankey diagrams can be
updated and modified relatively easily.
It should be noted that data is organized such that the information given here may also be
available in the NYMP, and specific details about each property remain confidential.

7
Results: Forecasted usage and Sankey diagrams
Figure 2. 2009-2022 Baseline and Forecast Usage (GWh) by building end use for Navy Yard substations SS93 and SS664.
0
50
100
150
200
250
300
350
400
2009 2010 2011 2012 2013 2014 2015 2016 2017 2018 2019 2020 2021 2022
Historical and forecasted energy use by planned building type (GWh)
Office/Campus
Hotel/Residential
Residential
Office/Industrial
Heavy Industry
Data Center
Hotel
Office/Medical
Office
Flex Space
Baseline
8
Figure 3. 2009 Energy Usage (GWh) for Navy Yard substations SS93 and SS664. No property additions are forecasted.

9
Figure 4. 2010 Energy Usage (GWh) for Navy Yard substations SS93 and SS664. No property additions are forecasted.

10
Figure 5. 2011 Energy Usage (GWh) for Navy Yard substations SS93 and SS664. Additions to SS664 usage include 200,000 sq. ft. of flex space.

11
Figure 6. 2012 Energy Usage (GWh) for Navy Yard substations SS93 and SS664. Additions to SS664 usage include 2,125,000 sq. ft. of office space.

12
Figure 7. 2013 Energy Usage (GWh) for Navy Yard substations SS93 and SS664. Additions to SS664 usage include offices (50,000 sq. ft.), hotel (100,000 sq.
ft.), and office/medical (236,000 sq. ft.). Additions to SS93 consist of 207,000 sq. ft. of office space

13
Figure 8. 2014 Energy Usage (GWh) for Navy Yard substations SS93 and SS664.

14
Figure 9. 2015 Energy Usage (GWh) for Navy Yard substations SS93 and SS664. Additions to SS664 usage include 750,000 sq. ft. of heavy industrial space.

15
Figure 10. 2016 Energy Usage (GWh) for Navy Yard substations SS93 and SS664.

16
Figure 11. 2017 Energy Usage (GWh) for Navy Yard substations SS93 and SS664. Additions to SS664 usage include 1,070,000 sq. ft. of residential space.
Additions to SS93 consist of 300,000 sq. ft. of office/industrial space
17
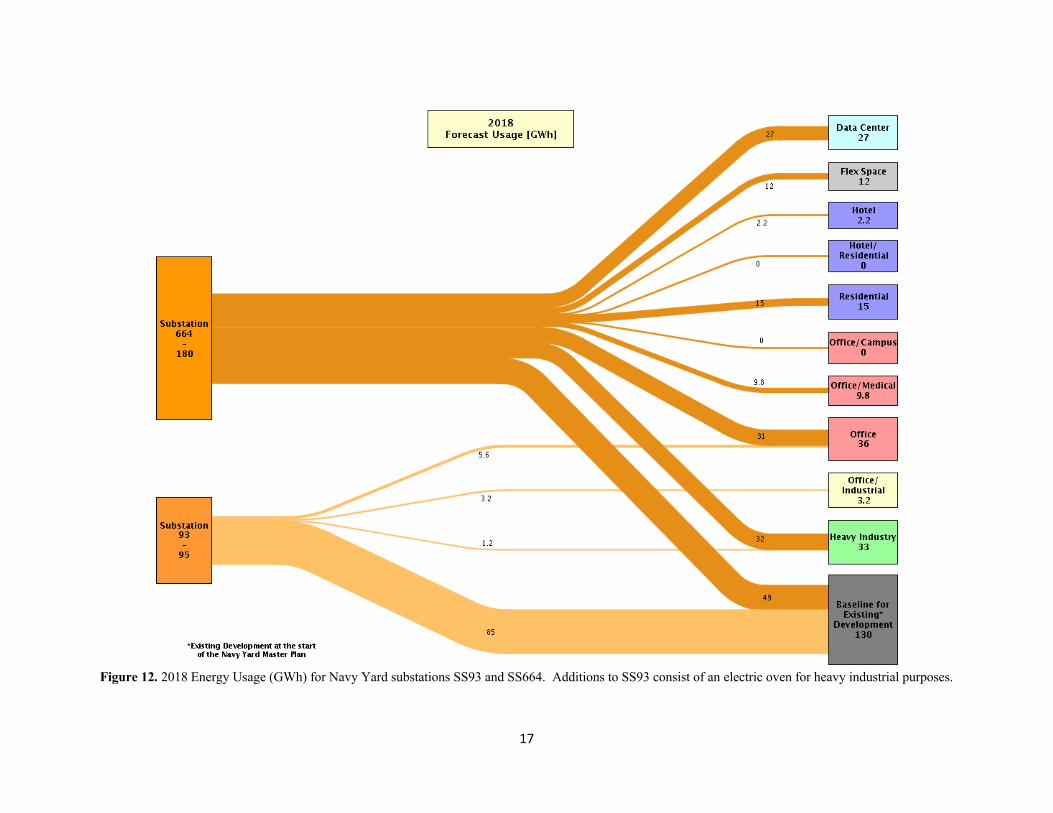
Figure 12. 2018 Energy Usage (GWh) for Navy Yard substations SS93 and SS664. Additions to SS93 consist of an electric oven for heavy industrial purposes.

18
Figure 13. 2019 Energy Usage (GWh) for Navy Yard substations SS93 and SS664. Additions to SS664 usage include 108,000 sq. ft. of hotel/residential space.

19
Figure 14. 2020 Energy Usage (GWh) for Navy Yard substations SS93 and SS664.

20
Figure 15. 2021 Energy Usage (GWh) for Navy Yard substations SS93 and SS664. Additions to SS664 usage include 490,000 sq. ft. of office/campus space.

21
Figure 16. 2022 Energy Usage (GWh) for Navy Yard substations SS93 and SS664.

22
Conclusions
The Sankey flow diagrams provide a visual compact form of estimated annual energy
consumption for reporting and informing stakeholders. The energy flows capture details about
the division of energy consumption by building type, property additions, building renovations,
and assumed yearly increased in energy use. The regional energy flow details provide the
framework to share and discuss electricity distribution, sub-metering needs, and renovation
details at the Navy Yard and EEB Hub. It also provides another metrics tools for tracking
milestones of the Navy Yard Master Energy Plan with each addition or retrofit and analyzing
building or regional performance. While relatively easy to update, it can also be a visualization
to explain future plans and help prioritize efforts.
The Sankey diagrams show that with each year and increase in property square footage,
substation 664 is expected to manage majority of the load from additions and renovations. There
are plans to expand the electrical distribution system of the Navy Yard to provide the capacity
and reliability for users [7]. One possibility is the addition of a third substation after 2015 to
accommodate the added electrical load.
Ultimately, the prototype annual Sankey diagrams serve as a template for regional energy
consumption. The annual time frames are meant to depict transitional effects of major property
changes on regional energy usage. The added “transient” details provide a new way to depict
energy flows over time as opposed to a single year snapshot Sankey diagram. The visual can be
modified and formatted in alternate configurations to capture important details about the Navy
Yard energy distribution. This data for this report is from the Energy Master Plan completed in
February 2013 and represents projected data at that time. Modifications or updates to Sankey
diagrams can be made to reflect changes in the NYMEP plans.
Acknowledgements
Thanks to Rudy Terry and Will Agate at PIDC for their help in developing the Sankey diagrams.

23
References:
[1] “The Navy Yard,” Retrieved from http://smartenergyacademy.org/sites/default/files/04%20PIDC--GridSTAR%20Strategic%20Planning%208-16-2012wWJA.pdf.
[2] Philadelphia Industrial Development Corporation, Liberty Property Trust, Synterra Partners, Robert A.M. Stern Architects. Philadelphia Navy Yard Master Plan, January 2004. Retrieved from http://www.navyyard.org/userfiles/file/FinalReport.pdf.
[3] Philadelphia Authority for Industrial Development, Philadelphia Industrial Development Corporation, Liberty Property Trust, Synterra Partners, Robert A. M. Stern Architects, Michael Van Valkenburgh Associates, Pennoni Associates. The Navy Yard Master Plan2013 Update: Philadelphia, Pennsylvania, 2013. Retrieved from http://www.navyyard.org/master-plan-2013/.
[4] Singer, S., Simon, A.J., “EEBHub Navy Yard Sankey Diagram Energy Analysis Final Report,” Lawrence Livermore National Laboratory, Livermore, CA, Tech. Rep. LLNL-TR-613594, 2013.
[5] Terry, R., “The Navy Yard,” conference talk, Grid 20/20: Insights on Energy Flow, Norristown, Pa., April 17, 2013. Retrieved from http://www.pjm.com/~/media/committees-groups/stakeholder-meetings/grid-2020-insights/20130417-distributed-generation-panel-1-terry.ashx.
[6] Singer, S., Simon, A.J., “EEBHub Building 101 Sankey Diagram Energy Analysis,” Lawrence Livermore National Laboratory, Livermore, CA, Tech. Rep. LLNL-TR-614312, 2013.
[7] The Navy Yard – RFP for Energy Master Plan Consultant Services, Retrieved from http://www.pidc-pa.org/uploads/files/rfps/Energy_Master_Plan_RFP_31_June_2011_Final.pdf

24
Appendix A: Data and Assumptions
Assumptions:
2 substations, SS664 has 26 properties while SS93 has 10
Range of usage: 6-120 W/sf
LF 60% for baseline, 50% all else
- LF projection is based on historical, aggregate NY load profile for typical recent
year. [R. Terry]
1% inc/yr (except East End Development N/A)
Definitions:
Baseline: the load for all existing development at the start of the Master Plan (2008-2009). The
current load includes a mix of commercial and industrial uses on two substations.
Feeder: In electric power distribution, a medium-voltage power line transferring power from a
distribution substation to the distribution transformers
Flex Space: A term used for lightly zoned buildings. It is mainly used when referring to industrial or office space. Flex space evolved from light industrial warehouses being converted to office space. Includes shared office space among employees and visitors. [Wikipedia]
Load Factor (LF): Corresponds to the ratio between actual energy consumption (kWh) and the
maximum power recorded (demand) for that period of time

25
Table A1 Use Forecast (GWh) for substation SS664 organized by year and Building Use
SS 664 USAGE FORECAST (GWh)
sq. ft. (10^3)
W/sf 2009 2010 2011 2012 2013 2014 2015 2016 2017 2018 2019 2020 2021 2022
Baseline 34.3 45.5 47.0 46.4 46.9 47.4 47.8 48.3 48.8 49.3 49.8 50.3 50.8 51.3
Data Center 50 120.0 0 0 0 0 1.6 9.9 18.6 25.7 26.5 26.8 27.1 27.3 27.6 27.9
Flex Space 200 27.0 0 0 0.7 4.2 9.9 11.4 11.5 11.6 11.8 11.9 12.0 12.1 12.2 12.4
Heavy Industry 750 21.3 0 0 0 0 0 0 5.5 14.2 23.0 31.8 40.5 49.3 58.0 66.8
Hotel 100 5.0 0 0 0 0 0.8 2.2 2.2 2.2 2.2 2.2 2.3 2.3 2.3 2.3
Hotel/Residential 108 6.0 0 0 0 0 0 0 0 0 0 0 2.3 2.8 2.9 2.9
Office 2125 62.0 0 0 0 0.1 5.0 8.3 8.7 12.9 23.6 30.7 34.1 46.0 55.7 57.4
Office/Campus 490 6.0 0 0 0 0 0 0 0 0 0 0 0 0 8.0 12.9
Office/Medical 236 27.5 0 0 0 0 0.3 4.2 8.0 9.6 9.7 9.8 9.9 10.0 10.1 10.2
Residential 1070 18.0 0 0 0 0 0 0 0 0 4.8 14.7 19.0 19.2 19.4 25.3
TOTAL 34.3 45.5 47.8 50.7 64.5 83.2 102.3 124.6 150.4 177.1 196.9 219.3 247.0 269.3
Table A2 Use Forecast (GWh) for substation SS93 organized by year and Building Use
SS 93 USAGE FORECAST (GWh)
sq. ft. (10^3)
W/sf 2009 2010 2011 2012 2013 2014 2015 2016 2017 2018 2019 2020 2021 2022
Baseline 84.5 87.0 75.3 79.7 80.5 81.3 82.1 83.0 83.8 84.6 85.5 86.3 87.2 88.1
Heavy Industry 0 0 0 0 0 0 0 0 0 0 0 1.2 1.2 1.2 1.2 1.2
Office 207 18 0 0 0 0 0.1 0.6 2.5 5.5 5.5 5.6 5.6 5.7 5.7 5.8
Office/Industrial 300 54 0 0 0 0 0 0 0 0 1.2 3.2 5.2 7.2 9.2 11.3
TOTAL 84.5 87.0 75.3 79.7 80.7 82.0 84.6 88.4 90.5 94.6 97.5 100.4 103.4 106.3

26
Table A3 Use Forecast (GWh) combined (substation SS93 and SS664) organized by year and Building Use
USE FORECAST (GWh) SS 664 AND SS 93
sq. ft. (10^3) 2009 2010 2011 2012 2013 2014 2015 2016 2017 2018 2019 2020 2021 2022
Baseline 118.7 132.5 122.3 126.2 127.4 128.7 130.0 131.3 132.6 133.9 135.3 136.6 138.0 139.4
Flex Space 200 0 0 0.7 4.2 9.9 11.4 11.5 11.6 11.8 11.9 12.0 12.1 12.2 12.4
Office 2332 0 0 0 0.1 5.2 8.9 11.1 18.3 29.1 36.3 39.7 51.6 61.4 63.2
Office/Medical 236 0 0 0 0 0.3 4.2 8.0 9.6 9.7 9.8 9.9 10.0 10.1 10.2
Hotel 100 0 0 0 0 0.8 2.2 2.2 2.2 2.2 2.2 2.3 2.3 2.3 2.3
Data Center 50 0 0 0 0 1.6 9.9 18.6 25.7 26.5 26.8 27.1 27.3 27.6 27.9
Heavy Industry 750 0 0 0 0 0 0 5.5 14.2 23.0 33.0 41.7 50.5 59.2 68.0
Office/Industrial 300 0 0 0 0 0 0 0 0 1.2 3.2 5.2 7.2 9.2 11.3
Residential 1070 0 0 0 0 0 0 0 0 4.8 14.7 19.0 19.2 19.4 25.3
Hotel/Residential 108 0 0 0 0 0 0 0 0 0 0 2.3 2.8 2.9 2.9
Office/Campus 490 0 0 0 0 0 0 0 0 0 0 0 0 8.0 12.9
Total 118.7 132.5 123.1 130.4 145.2 165.2 186.9 213.0 241.0 271.7 294.4 319.7 350.4 375.7
Without Baseline 0 0 0.7 4.2 17.8 36.5 57.0 81.7 108.4 137.8 159.2 183.1 212.4 236.3

27
Appendix B: Navy Yard Master Plan 2013 Update Details
Figure B1. Table from NYMP showing the occupied, planned renovations, and new construction square footage of each district. [2]

28
Figure B2. Canal District zoning map from NYMP and table summarizing square footage of new construction. [2]

29
Figure B3. Historic Core table from NYMP summarizing square footage of new construction and renovations. [2]

30
Figure B4. Historic Core zoning map from NYMP. [2]

31
Figure B5. Mustin Park District table from NYMP summarizing square footage of new construction. [2]

32
Figure B6. Mustin Park District zoning map from NYMP. [2]

33
Appendix C: Potential for Sankey Diagrams in Building Energy
How Are Sankey Diagrams Useful for Building Energy?
Previously the EEB Hub requested Sankey diagrams depicting energy use in Building 101
(B101) [6]. LLNL developed a template showing building envelope energy exchanges, energy
consumption from electricity and natural gas, as well as the end uses. EnergyPlus models and
basic approximations about B101 were used to estimate energy flows and generate an annual
Sankey diagram, and a representative winter (figure C1) and summer (figure C2) month. The
comparison from winter and summer captures the vast differences in natural gas usage for
heating and electricity for cooling needs. It is easy to recognize the building’s interactions with
its environment, and the strain that induces on its energy consumption.
Nowhere else has the engineered and environmental fluxes of energy been consolidated into a
single visual reference. These visualizations help stakeholders and building managers identify
large sources of energy consumption, gaps in data, and points of needed equipment
improvements.
Figure C1. Representative B101 winter Sankey diagram using data from January 2012. Much of the thermal load
is lost to the exterior through heat losses to the walls, windows and infiltration. The largest source of energy
consumption is natural gas that provides a large amount of heating to the building. [6]

34
Figure C2. Representative B101 summer Sankey diagram using data from July 2011. In summer, the boilers are
turned off as is reflected in the Sankey diagram. Heating to the building is reflected in contributions from several
sources: the exterior environment (i.e. solar) provides heat, and interior components give off heat (lights,
equipment). The largest energy loss from the building is due to the cooling. [6]
Potential Projects
EnergyPlus models incorporate building parameters, material properties, meteorological data,
equipment and their efficiencies, and to some extent, the behavior of its occupants. Sankey
diagrams rely on simulated heat gains and some equipment and environmental data to estimate
the energy flows within and around the building.
A. A goal of the building Sankey diagrams is to assist in building retrofits and planning.
One approach is to use run comparative EnergyPlus models (i.e. Baseline vs. a case study
that incorporates building retrofits). Retrofits could include changing the windows,
insulation (R-values and U-values), or equipment (efficiency). Sankey diagrams can be
generated for the Baseline and case study. The goal is to visually inform how retrofits
change energy usage.
B. Currently, the process of transferring output from EnergyPlus into a format such that
Sankey diagrams can be easily generated is not automated. Developing the platform

35
necessary to streamline this process can be done with OpenStudio2 and support from
NREL software development team as part of a multiple lab effort. Currently,
conversations with NREL OpenStudio developers have led to an interest to integrate
Sankey Diagrams into the OpenStudio platform. Ideas include: using Ruby code in the
OpenStudio software development kit (SDK) to retrieve output and write a Sankey
generation script. This could be done:
a. Under the current EEBHub Task 2 project, modeling and simulation. The focus
of Task 2 is a “suite of simulation tools for predicting energy use in buildings
deployed via a platform for use by architects, designers, engineers, contractors,
buildings operators and others. Tools include a Design Advisor intended for the
early design stages of a retrofit project, an Energy Auditing Tool to support
understanding and investment decisions for advanced energy retrofit (AER)
projects, and a Retrofit Manager Tool (RMT) to address needs of facility mangers
that make critical decisions for building renovation and maintenance.”
b. An external (non-Hub) effort. NREL has plans for modular and extensible
visualizations within the OpenStudio SDK. A starting point would be to get
access to the results reporting framework and work on a prototype to apply
Sankey visualizations to whole building simulation results.
C. Future work may include re-rendering this energy flow diagram as a part of a “live”
building energy display based on real-time metered energy data and a reduced-order
model of environmental fluxes of energy.
2
“OpenStudio is DOE’s platform for rapid, collaborative development of energy analysis applications.” [K. Benne and D. Macumber, OpenStudio Overview, Building Energy Informatics Summit, May 15, 2013.] OpenStudio has several applications, including a GUI to edit building parameters; SketchUp plug-in to create building geometry; ParametricAnalysis tool to modify baseline models; ResultsViewer to organize and compare data output; and RunManager to facilitate simulation queues.