GenomeLab GeXP - Beckman
56
A53995 AB January 2008 Beckman Coulter, Inc. 4300 North Harbor Boulevard, Fullerton, CA 92834-3100 © Copyright 2008 Beckman Coulter, Inc. GenomeLab ™ GeXP Troubleshooting Guide
Transcript of GenomeLab GeXP - Beckman

A53995 ABJanuary 2008
Beckman Coulter, Inc.4300 North Harbor Boulevard, Fullerton, CA 92834-3100
© Copyright 2008 Beckman Coulter, Inc.
GenomeLab™
GeXP
Troubleshooting Guide

ii
Copyright, Licenses and Trademarks
Copyright
© Beckman Coulter, Inc., 2008. All rights reserved. No part of this publication may be reproduced, transcribed, transmitted, or translated into any language in any form by any means without the written permission of Beckman Coulter, Inc.
Licenses and Trademarks
Beckman Coulter® is a registered trademark of Beckman Coulter, Inc.
GenomeLab™ is a trademark of Beckman Coulter, Inc.
All other trademarks and registered trademarks are property of their respective owners.

Table of Contents
Section 1 Introduction . . . . . . . . . . . . . . . . . . . . . . . . . . . . . . . . . . . . . . 1
Section 2 General Diagnostic Guidelines . . . . . . . . . . . . . . . . . . . . . . . . . 31.1 Evaluating the Raw Data . . . . . . . . . . . . . . . . . . . . . . . . . . . . . . . . . . . . . . . . . . . . . . . . . . . . . . 4
Examining Signal Strength and Multiplex Profile . . . . . . . . . . . . . . . . . . . . . . . . . . . . . . . . . . . . .4Checking the Raw Data. . . . . . . . . . . . . . . . . . . . . . . . . . . . . . . . . . . . . . . . . . . . . . . . . . . . . . . . .5
1.2 Evaluating the Current Profiles . . . . . . . . . . . . . . . . . . . . . . . . . . . . . . . . . . . . . . . . . . . . . . . . . 6Confirming the Separation Current . . . . . . . . . . . . . . . . . . . . . . . . . . . . . . . . . . . . . . . . . . . . . . . .6Causes of Current Abnormalities . . . . . . . . . . . . . . . . . . . . . . . . . . . . . . . . . . . . . . . . . . . . . . . . .8
Section 3 Instrumentation & Chemistry . . . . . . . . . . . . . . . . . . . . . . . . . . . 92.1 Performing Instrument Diagnostics . . . . . . . . . . . . . . . . . . . . . . . . . . . . . . . . . . . . . . . . . . . . . 9
Running Size Standard-400 . . . . . . . . . . . . . . . . . . . . . . . . . . . . . . . . . . . . . . . . . . . . . . . . . . . . .9Interpreting the Results . . . . . . . . . . . . . . . . . . . . . . . . . . . . . . . . . . . . . . . . . . . . . . . . . . . . . . .10Running the Sequencing Test Sample . . . . . . . . . . . . . . . . . . . . . . . . . . . . . . . . . . . . . . . . . . . .10Interpreting the Results . . . . . . . . . . . . . . . . . . . . . . . . . . . . . . . . . . . . . . . . . . . . . . . . . . . . . . .11
2.2 Testing the Chemistry . . . . . . . . . . . . . . . . . . . . . . . . . . . . . . . . . . . . . . . . . . . . . . . . . . . . . . . 11Testing the GeXP Start Kit and Experimental Process . . . . . . . . . . . . . . . . . . . . . . . . . . . . . . . .11Interpreting the Results . . . . . . . . . . . . . . . . . . . . . . . . . . . . . . . . . . . . . . . . . . . . . . . . . . . . . . .12Examining the Experimental Process . . . . . . . . . . . . . . . . . . . . . . . . . . . . . . . . . . . . . . . . . . . . .12
2.3 Testing Third-Party Products . . . . . . . . . . . . . . . . . . . . . . . . . . . . . . . . . . . . . . . . . . . . . . . . . 12Interpreting the Results . . . . . . . . . . . . . . . . . . . . . . . . . . . . . . . . . . . . . . . . . . . . . . . . . . . . . . .13Testing the Experimental RNA and Custom Multiplex Primer . . . . . . . . . . . . . . . . . . . . . . . . . . .13Interpreting the Results . . . . . . . . . . . . . . . . . . . . . . . . . . . . . . . . . . . . . . . . . . . . . . . . . . . . . . .14
Section 4 Reference Tables . . . . . . . . . . . . . . . . . . . . . . . . . . . . . . . . . . 173.1 Multiplex Primer Design . . . . . . . . . . . . . . . . . . . . . . . . . . . . . . . . . . . . . . . . . . . . . . . . . . . . . 173.2 GeXP Chemistry . . . . . . . . . . . . . . . . . . . . . . . . . . . . . . . . . . . . . . . . . . . . . . . . . . . . . . . . . . . 203.3 GeXP Separation and Fragment Analysis . . . . . . . . . . . . . . . . . . . . . . . . . . . . . . . . . . . . . . . . 253.4 eXpress Profiler and Analysis . . . . . . . . . . . . . . . . . . . . . . . . . . . . . . . . . . . . . . . . . . . . . . . . . 28
Section 5 Questions & Answers . . . . . . . . . . . . . . . . . . . . . . . . . . . . . . . 314.1 eXpress Profiler. . . . . . . . . . . . . . . . . . . . . . . . . . . . . . . . . . . . . . . . . . . . . . . . . . . . . . . . . . . . 314.2 Multiplex Primer Design . . . . . . . . . . . . . . . . . . . . . . . . . . . . . . . . . . . . . . . . . . . . . . . . . . . . . 314.3 GeXP Chemistry and Fragment Analysis . . . . . . . . . . . . . . . . . . . . . . . . . . . . . . . . . . . . . . . . . 324.4 eXpress Analysis . . . . . . . . . . . . . . . . . . . . . . . . . . . . . . . . . . . . . . . . . . . . . . . . . . . . . . . . . . . 34
Section 6 Appendix A . . . . . . . . . . . . . . . . . . . . . . . . . . . . . . . . . . . . . . 37Troubleshooting How Tos 37
Troubleshooting Multiplex Design with Verbose Mode . . . . . . . . . . . . . . . . . . . . . . . . . . . . . . .37Repairing a Corrupt TDF File. . . . . . . . . . . . . . . . . . . . . . . . . . . . . . . . . . . . . . . . . . . . . . . . . . . .37Creating a Multiplex without an Internet Connection . . . . . . . . . . . . . . . . . . . . . . . . . . . . . . . . .38Designing Primers to Detect Alternative Transcripts . . . . . . . . . . . . . . . . . . . . . . . . . . . . . . . . .38Modifying a Previously Designed Multiplex . . . . . . . . . . . . . . . . . . . . . . . . . . . . . . . . . . . . . . . .39
Troubleshooting GuidePN A53995-AB
iii

Importing Two or More Plates into eXpress Analyzer . . . . . . . . . . . . . . . . . . . . . . . . . . . . . . . ..39
Section 7 Appendix B . . . . . . . . . . . . . . . . . . . . . . . . . . . . . . . . . . . . . . 41Reference Figures 41
GenomeLab GeXPPN A53995-AB
iv

IntroductionOverview
1Introduction
OverviewThe GeXP Troubleshooting guide has been designed to help you identify and correct the issues most commonly encountered with the GenomeLab GeXP Genetic Analysis System. Read through the entire GeXP Troubleshooting Guide first, before performing troubleshooting experiments.
Begin with General Diagnostics, which will inform you on the data you will need and where it can be found. Next, Instrumentation & Chemistry will provide a systematic approach to enable you to effectively diagnose the problem. See Figure 1.1 on page 2 for the GeXP Troubleshooting Workflow. This serves as a visual aide for the troubleshooting process.
Finally, the Reference Tables and Questions & Answers sections are particularly helpful for resolving specific problems. These sections can also aid in rapid identification of the most likely suspects for poor results.
Troubleshooting GuidePN A53995-AB
1

View the
Are the resolutiocurrent o
s.
Peak resoand curre
okay
Go to CheTroublesh
al s
Yes
GeXP Troubleshooting Workflow
Figure 1.1 GeXP Troubleshooting Workflow
No
No
Yes Yes
YesNo
YesNo
Yes
data
Is the problem with the GeXP
instrument?
I’m not sure where
the problem is.
Is it the problem with the chemistry?
Run the Size Standard-400
Use the GeXP Start Kit and control multiplex gene set
kit to perform GeXP reactions
peak n and kay?
Are there current abnormalities?
Do you have a KANr peak?
I don’t have a KANr peak.
I have KANr withall multiplex peak
Kit and process are
okay.
lution nt are .
I have poor peak resolution.
Run the Sequencing Test Sample (PN 608070)
Is the current okay?
Contact your Beckman Coulter Field Service
Representative
mistry ooting
I have current abnormalities.
ReviewGeXP
protocol
Test a new kit
Test experimentRNA and primer
Do you have a KANr peak?
I still don’t have a KANr peak.
No
Test third-party
products
Contact your Beckman Coulter Technical Support
Representative
General Diagnostic GuidelinesOverview
1General Diagnostic Guidelines
OverviewThe GenomeLab GeXP™ provides software functions that will help you to identify and resolve GeXP problems. Two key features in this regard are the Raw Data and Current Profile.
NOTE The Analyzed Data can also be used for troubleshooting, but only after the Raw Data and Current Profile have been shown to be acceptable.
Use the raw data, current profile and analyzed data to determine whether the issue is caused by GeXP instrumentation or chemistry or possibly both. Be sure to note the following aspects of each type of data for all of the affected samples and appropriate controls:
Raw and Analyzed Data r Baseline for D4 (blue) and D1 (red)
r Signal strength
r Signal profile (level or drop-off)
r Landmarks
r unincorporated primers (raw only)
r multiplex peaks
r KANr peak
r size standard peaks
See "Evaluating the Raw Data" on page 4 for more information.
Current Profile r Ramping profile
r Maximum separation current (µA)
r Level of current throughout separation
See "Evaluating the Current Profiles" on page 6 for more information.
Troubleshooting GuidePN A53995-AB
3
General Diagnostic GuidelinesEvaluating the Raw Data
1.1 Evaluating the Raw DataThe raw data generated by the GeXP is displayed in the Data Monitor window of the Run Control module, during the actual separation. The data is also accessible by using Fragment Analysis.
Examining Signal Strength and Multiplex ProfileRefer to the signal strength and multiplex profile as the first step in diagnosing problems, when looking at raw data.
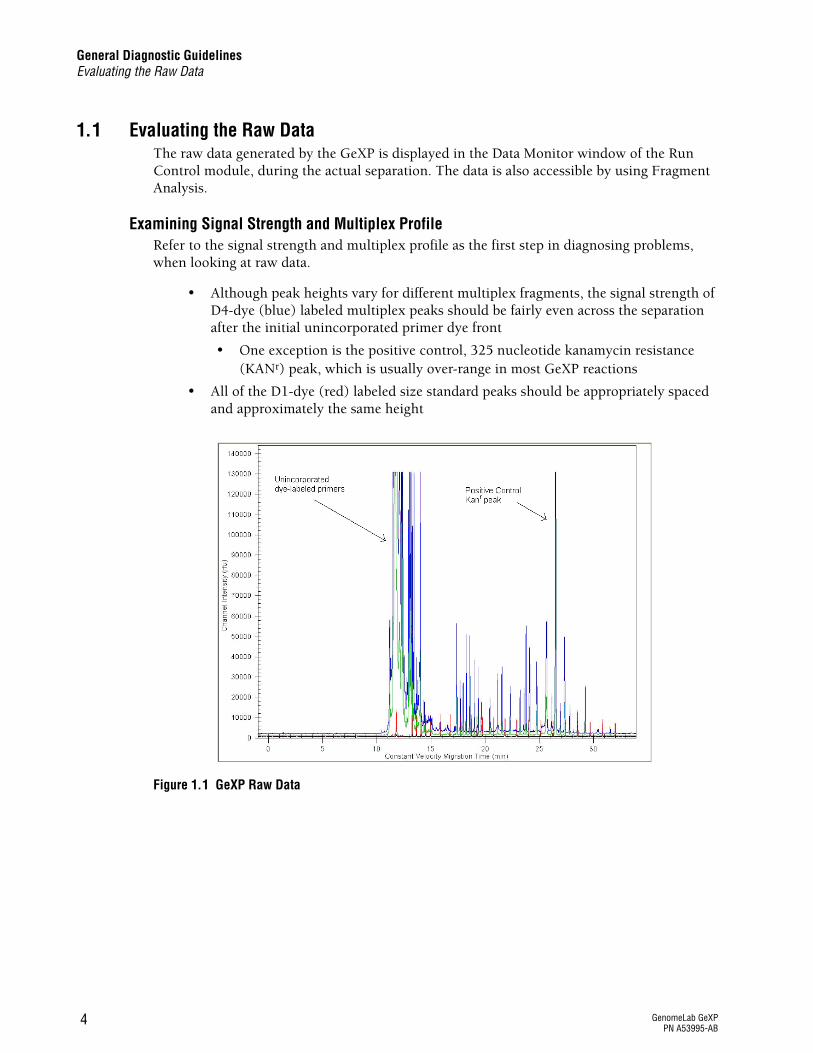
r Although peak heights vary for different multiplex fragments, the signal strength of D4-dye (blue) labeled multiplex peaks should be fairly even across the separation after the initial unincorporated primer dye front
r One exception is the positive control, 325 nucleotide kanamycin resistance (KANr) peak, which is usually over-range in most GeXP reactions
r All of the D1-dye (red) labeled size standard peaks should be appropriately spaced and approximately the same height
Figure 1.1 GeXP Raw Data
GenomeLab GeXPPN A53995-AB
4

General Diagnostic GuidelinesEvaluating the Raw Data
Checking the Raw DataThe electropherogram shown in Figure 1.1 shows a typical GeXP separation with a start time at approximately 11 minutes for the Frag-3 separation method. The signal strength at the beginning of the separation is over-range due to excess primers remaining in the PCR reaction. This is common for GeXP reactions. The multiplex fragments begin appearing at approximately 17.5 minutes for this particular sample. The positive control KANr fragment appears at approximately 26.5 minutes. The D1-dye (red) labeled Size Standard-400 peaks are appropriately spaced and even in height.
The data is displayed as signal intensity, measured in relative fluorescence units (RFU) vs. time. The above example shows excellent signal strength. However, it is not necessary for each sample to have such high signal in order to obtain accurate peak area measurements. More important is that all the peaks fall within the limits of detection (below 130,000 RFU in the raw data) and the electropherogram shows a balanced profile with no signal drop-off.
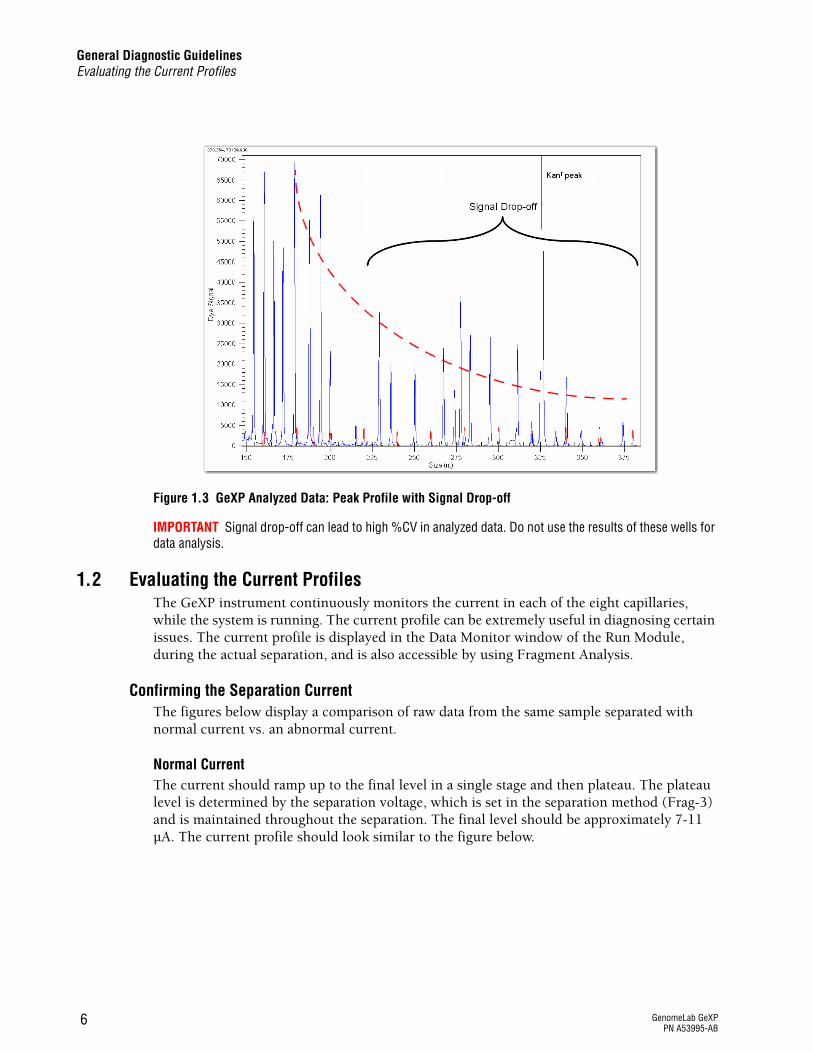
Signal Drop-OffThe example of analyzed data in Figure 1.2 shows a balanced profile, whereas the analyzed data in Figure 1.3 shows signal drop-off. Signal drop-off is characterized by relatively high signal for shorter fragments and significantly lower signal for the longer fragments. The result is a multiplex profile with a downward slope toward the larger fragments, while the size standard peaks are even and appear normal. The KANr peak may or may not appear to be affected by signal drop-off.
Irregularities in PCR cycling conditions, particularly the extension temperature, are the most likely cause of signal drop-off. This is often seen in the edge wells of a thermal cycler. Ensure that the thermal cycler is calibrated and consider using only the non-edge wells to avoid signal drop-off. See "GeXP Chemistry" on page 20 for more information.
NOTE Signal drop-off can be caused by using the wrong DNA Polymerase. ThermoStart DNA Polymerase (A25395) has been validated for use with the GenomeLab GeXP system.
Figure 1.2 GeXP Analyzed Data: Normal Peak Profile
Troubleshooting GuidePN A53995-AB
5
General Diagnostic GuidelinesEvaluating the Current Profiles
Figure 1.3 GeXP Analyzed Data: Peak Profile with Signal Drop-off
IMPORTANT Signal drop-off can lead to high %CV in analyzed data. Do not use the results of these wells for data analysis.
1.2 Evaluating the Current Profiles The GeXP instrument continuously monitors the current in each of the eight capillaries, while the system is running. The current profile can be extremely useful in diagnosing certain issues. The current profile is displayed in the Data Monitor window of the Run Module, during the actual separation, and is also accessible by using Fragment Analysis.
Confirming the Separation CurrentThe figures below display a comparison of raw data from the same sample separated with normal current vs. an abnormal current.
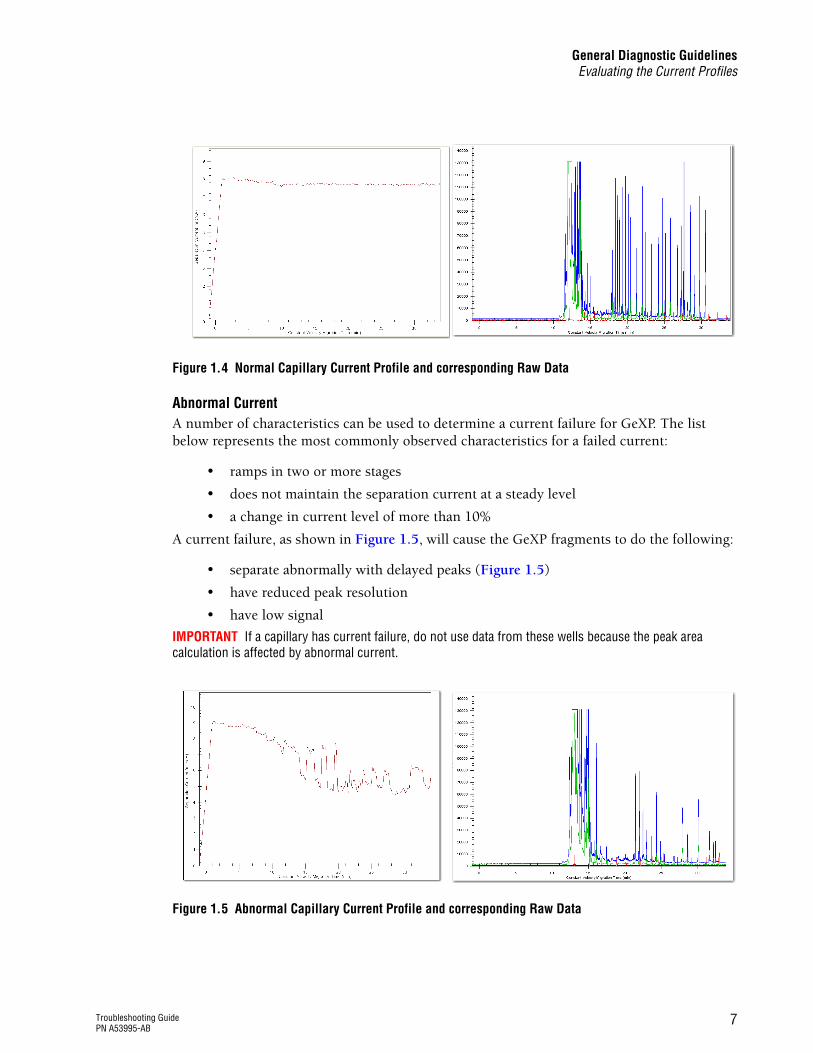
Normal CurrentThe current should ramp up to the final level in a single stage and then plateau. The plateau level is determined by the separation voltage, which is set in the separation method (Frag-3) and is maintained throughout the separation. The final level should be approximately 7-11 µA. The current profile should look similar to the figure below.
GenomeLab GeXPPN A53995-AB
6
General Diagnostic GuidelinesEvaluating the Current Profiles
Figure 1.4 Normal Capillary Current Profile and corresponding Raw Data
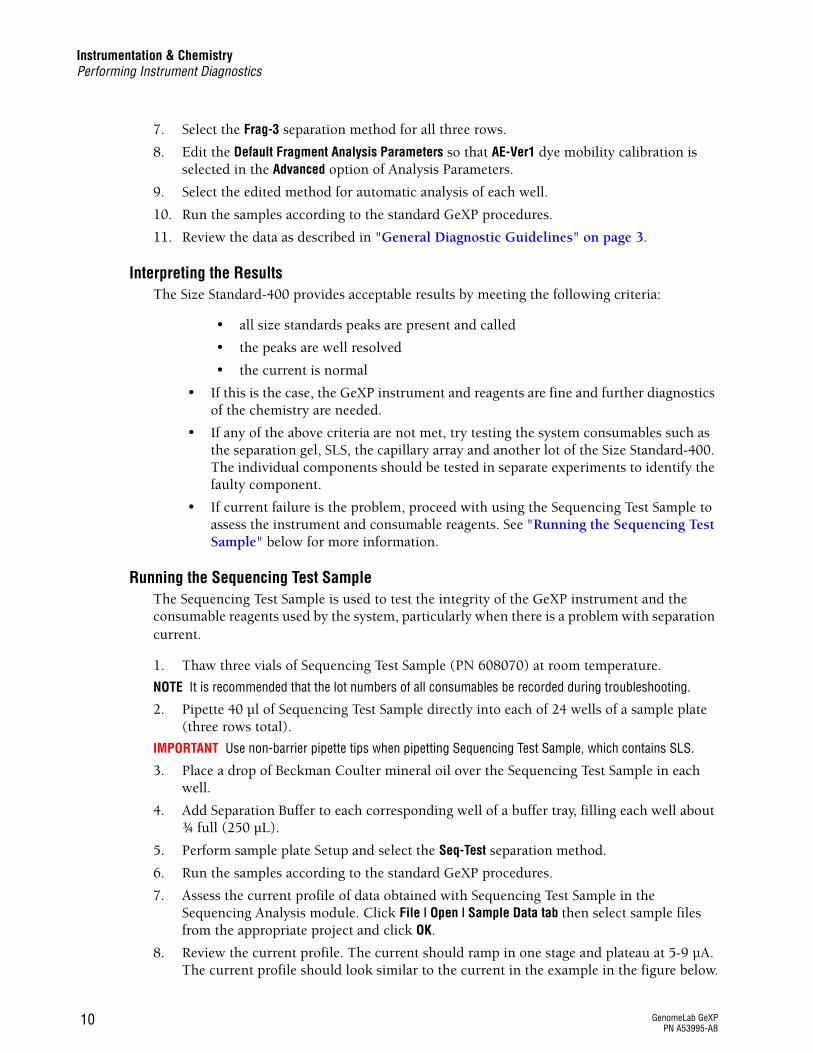
Abnormal CurrentA number of characteristics can be used to determine a current failure for GeXP. The list below represents the most commonly observed characteristics for a failed current:
r ramps in two or more stages
r does not maintain the separation current at a steady level
r a change in current level of more than 10%
A current failure, as shown in Figure 1.5, will cause the GeXP fragments to do the following:
r separate abnormally with delayed peaks (Figure 1.5)
r have reduced peak resolution
r have low signal
IMPORTANT If a capillary has current failure, do not use data from these wells because the peak area calculation is affected by abnormal current.
Figure 1.5 Abnormal Capillary Current Profile and corresponding Raw Data
Troubleshooting GuidePN A53995-AB
7

General Diagnostic GuidelinesEvaluating the Current Profiles
Causes of Current AbnormalitiesCurrent profile abnormalities can be caused by the following:
r a bubble in the manifold
r no separation buffer
r impurities or debris in the sample
See "Performing Instrument Diagnostics" on page 9, for instructions on how to verify the cause of the problem.
GenomeLab GeXPPN A53995-AB
8

Instrumentation & ChemistryOverview
2Instrumentation & Chemistry
OverviewIssues encountered with the GeXP process can be divided into two areas: instrumentation and chemistry.
A systematic approach to troubleshooting is described below, to enable the user to effectively diagnose a problem with the GeXP process.
First, use the raw data, current profile and analyzed data to determine whether the issue is caused by one of the following:
Initial Indications r If the size standard peaks and/or current are abnormal, then begin by
troubleshooting the instrument. See "Performing Instrument Diagnostics" on page 9.
r If the size standard peaks and current are normal, then begin by troubleshooting the Chemistry. See "Testing the Chemistry" on page 11.
r If you are unsure where to start, begin by troubleshooting the GeXP instrument.
2.1 Performing Instrument Diagnostics The separation of Size Standard-400, in the absence of GeXP reaction products, is performed to test the integrity of the GeXP instrument and the various reagents used by the system. These reagents include:
Running Size Standard-400
1. Thaw Size Standard-400 (PN 608098) and Sample Loading Solution (PN 608082) at room temperature.
NOTE It is recommended that the lot numbers of all consumables be recorded during troubleshooting.
2. Combine 13 µL of ss-400 with 1027 µL of SLS in a microcentrifuge tube and mix.
IMPORTANT Use only Beckman Coulter SLS. Do not substitute SLS with fomamide from a third-party.
IMPORTANT Use non-barrier pipette tips when pipetting SLS.
3. Pipette 40 µL of the ss-400 + SLS mixture into each of 24 wells of a sample plate (three rows total).
4. Place a drop of Beckman Coulter mineral oil (PN 608114) over the ss-400 + SLS mixture in each well.
5. Add Separation Buffer to each corresponding well of a buffer tray, filling each well about ¾ full (250 µL).
6. Perform Sample Plate Setup.
r GeXP instrument r GeXP chemistry r GeXP instrument and chemistry
r separation gel r sample loading solution r capillary array
Troubleshooting GuidePN A53995-AB
9
Instrumentation & ChemistryPerforming Instrument Diagnostics
7. Select the Frag-3 separation method for all three rows.
8. Edit the Default Fragment Analysis Parameters so that AE-Ver1 dye mobility calibration is selected in the Advanced option of Analysis Parameters.
9. Select the edited method for automatic analysis of each well.
10. Run the samples according to the standard GeXP procedures.
11. Review the data as described in "General Diagnostic Guidelines" on page 3.
Interpreting the ResultsThe Size Standard-400 provides acceptable results by meeting the following criteria:
r all size standards peaks are present and called
r the peaks are well resolved
r the current is normal
r If this is the case, the GeXP instrument and reagents are fine and further diagnostics of the chemistry are needed.
r If any of the above criteria are not met, try testing the system consumables such as the separation gel, SLS, the capillary array and another lot of the Size Standard-400. The individual components should be tested in separate experiments to identify the faulty component.
r If current failure is the problem, proceed with using the Sequencing Test Sample to assess the instrument and consumable reagents. See "Running the Sequencing Test Sample" below for more information.
Running the Sequencing Test Sample The Sequencing Test Sample is used to test the integrity of the GeXP instrument and the consumable reagents used by the system, particularly when there is a problem with separation current.
1. Thaw three vials of Sequencing Test Sample (PN 608070) at room temperature.
NOTE It is recommended that the lot numbers of all consumables be recorded during troubleshooting.
2. Pipette 40 µl of Sequencing Test Sample directly into each of 24 wells of a sample plate (three rows total).
IMPORTANT Use non-barrier pipette tips when pipetting Sequencing Test Sample, which contains SLS.
3. Place a drop of Beckman Coulter mineral oil over the Sequencing Test Sample in each well.
4. Add Separation Buffer to each corresponding well of a buffer tray, filling each well about ¾ full (250 µL).
5. Perform sample plate Setup and select the Seq-Test separation method.
6. Run the samples according to the standard GeXP procedures.
7. Assess the current profile of data obtained with Sequencing Test Sample in the Sequencing Analysis module. Click File | Open | Sample Data tab then select sample files from the appropriate project and click OK.
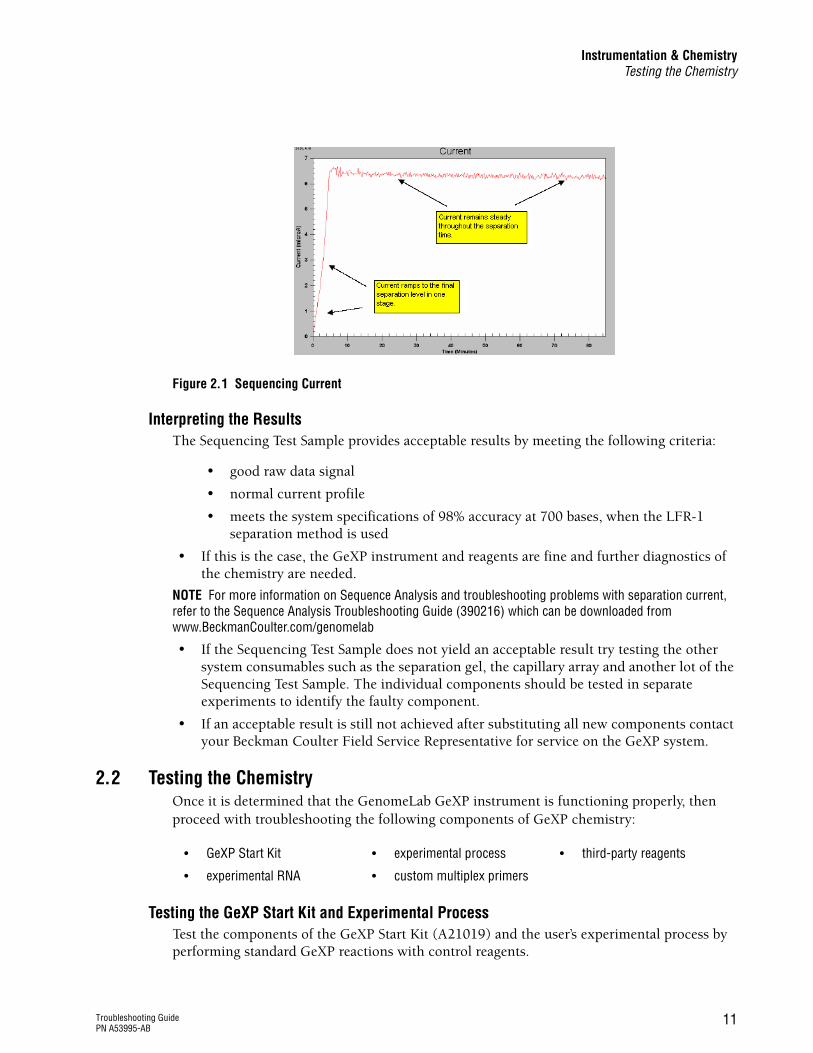
8. Review the current profile. The current should ramp in one stage and plateau at 5-9 µA. The current profile should look similar to the current in the example in the figure below.
GenomeLab GeXPPN A53995-AB
10
Instrumentation & ChemistryTesting the Chemistry
Figure 2.1 Sequencing Current
Interpreting the ResultsThe Sequencing Test Sample provides acceptable results by meeting the following criteria:
r good raw data signal
r normal current profile
r meets the system specifications of 98% accuracy at 700 bases, when the LFR-1 separation method is used
r If this is the case, the GeXP instrument and reagents are fine and further diagnostics of the chemistry are needed.
NOTE For more information on Sequence Analysis and troubleshooting problems with separation current, refer to the Sequence Analysis Troubleshooting Guide (390216) which can be downloaded from www.BeckmanCoulter.com/genomelab
r If the Sequencing Test Sample does not yield an acceptable result try testing the other system consumables such as the separation gel, the capillary array and another lot of the Sequencing Test Sample. The individual components should be tested in separate experiments to identify the faulty component.
r If an acceptable result is still not achieved after substituting all new components contact your Beckman Coulter Field Service Representative for service on the GeXP system.
2.2 Testing the Chemistry Once it is determined that the GenomeLab GeXP instrument is functioning properly, then proceed with troubleshooting the following components of GeXP chemistry:
Testing the GeXP Start Kit and Experimental ProcessTest the components of the GeXP Start Kit (A21019) and the user’s experimental process by performing standard GeXP reactions with control reagents.
r GeXP Start Kit r experimental process r third-party reagents
r experimental RNA r custom multiplex primers
Troubleshooting GuidePN A53995-AB
11
Instrumentation & ChemistryTesting Third-Party Products
1. Perform GeXP reactions with Control RNA and a set of GeXP multiplex primers previously demonstrated to generate size-specific amplicons, such as those provided in the GenomeLab GeXP multiplex gene set kits from Beckman Coulter, as listed below:
r Human ReferencePlex (A54651)
r Human MetastasisPlex (A32712)
r Human Breast CancerPlex (A32700)
r Rat MultitoxPlex (A21066)
2. Analyze the reactions with the GeXP instrument and examine the analyzed results.
Interpreting the Results r If all of the multiplex peaks and one KANr peak are present, this confirms the
functional quality of the GeXP Start Kit reagents and third-party-supplied materials. These results also confirm that the user’s experimental process is satisfactory.
r These results do not confirm the functional quality of any custom-designed multiplex primers and RNA template. See "Testing the Experimental RNA and Custom Multiplex Primer" on page 13 and continue in the troubleshooting process with these reagents.
r If the test does not yield all multiplex peaks and one KANr peak, with good raw data signal and normal current profiles, perform the test again using a new GeXP Start Kit.
r Failure to yield all multiplex peaks and one KANr peak with a second kit would indicate that third-party reagents or the experimental process are suspect. See "Examining the Experimental Process" below and "Testing Third-Party Products" on page 12.
Examining the Experimental ProcessThe following are items to review as part of a successful GeXP Experimental Process:
r Reagent handling and storage
r RNA handling and storage
r Accurate pipetting
r Protocol Steps
See the GeXP Chemistry Protocol (A29143) for additional instructions on performing this process.
2.3 Testing Third-Party ProductsSome reagents and plasticware, supplied by third-parties can have a negative impact on the GeXP RT-PCR reaction, raw data signal and the current profile. Third-party products includes the chemicals and plasticware used for suspension and dilution of RNA and primers, the RT-PCR reactions and the pre-dilution of the PCR reaction products.
Third-Party Products: Do’s & Don’ts r Use high-quality, nuclease-free plasticware.
r Suspend primer multiplexes in 10 mM Tris-HCl, pH 8.0.
GenomeLab GeXPPN A53995-AB
12

Instrumentation & ChemistryTesting Third-Party Products
r Store stock solutions of RNA samples in a buffered solution, such as The RNA Storage Solution (Ambion PN AM7000).
r Store stock solutions of RNA in small aliquots at -80°C to preserve RNA integrity.
r Suspend working concentrations of RNA in nuclease-free, non-DEPC treated water, as supplied in the GenomeLab GeXP Start Kit or from USB (PN 71786) or Invitrogen (PN 10977-015).
IMPORTANT Do not use DEPC-treated water or plasticware with the GeXP process. Residual DEPC can inhibit the PCR reaction and result in low signal strength and a high baseline in the electropherogram.
r Use aerosol-resistant barrier pipette tips with a dedicated set of pipettes for the setup of reverse transcription (RT) and PCR reactions to prevent cross-contamination of samples.
r Do not allow amplified product to enter the area of RT and PCR reaction setup (amplicon-free zone).
r Use non-barrier pipette tips and a separate set of pipettes, when handling the PCR products, Sample Loading Solution (SLS) and Size Standard-400 in a PCR amplicon zone. The SLS reagent may dislodge filter particles of aerosol-resistant barrier tip into the sample and this contamination can cause current failure in the GeXP System.
r Perform pre-dilution of the PCR reaction with 10 mM Tris-HCl, pH 8.0
Interpreting the ResultsThe common symptoms for poor quality reagents or the wrong reagent concentration are low raw data signal, high baseline and erratic current profiles.
r If the GenomeLab GeXP multiplex gene set kit reactions with Control RNA as outlined in "Testing the GeXP Start Kit and Experimental Process" on page 11, yield all the multiplex peaks and one KANr peak and the raw data signal baseline and current profiles look good, then third-party reagents are satisfactory.
r If the control multiplex reactions did not yield all of the multiplex peaks or the raw data or current profile were abnormal, then replace each third-party reagent in a systematic approach (one at a time) to identify the faulty reagent. Perform GeXP control reactions as described in "Testing the GeXP Start Kit and Experimental Process" on page 11, and analyze them with the GenomeLab GeXP.
r If the experimental RNA and custom multiplex primers still do not yield acceptable results, and a specific third-party product was not identified as the cause, proceed to the next section.
Testing the Experimental RNA and Custom Multiplex PrimerAfter confirming that the GenomeLab GeXP multiplex gene set kit and Control RNA function correctly with the GeXP instrument, test the experimental RNA and custom multiplex primers. Test the reagents independently. This is the most efficient means of identifying the source of the problem.
Testing the Experimental RNANOTE Use high quality experimental RNA that has a 28S/18S ratio greater than 1.0 with GeXP. Confirm that the ribosomal RNA 28S and 18S bands are readily visible and predominant when analyzed on an agarose gel.
Use a set of control GeXP multiplex primers that are known to produce size-specific amplicons from the source of experimental RNA, in order to test the functional integrity of
Troubleshooting GuidePN A53995-AB
13

Instrumentation & ChemistryTesting Third-Party Products
the experimental RNA. For example, experimental human RNA sample(s) can be tested with multiplex primers from the GenomeLab GeXP Human ReferencePlex Kit (PN A54651) which contains 24 sets of primers that target human housekeeping and other reference genes.
See "Interpreting the Results" on page 14 for more information.
Testing the Custom Multiplex PrimersNOTE Order custom multiplex primers with the universal tag sequences fused to the gene-specific sequence. The oligos should be of standard desalted, deprotected processing.
During the initial evaluation of the multiplex, the chimeric primers must be evaluated for their ability to produce the expected size amplicon with Control RNA (RNA template known to contain the target transcript). For example, the Human Reference Control RNA from the GenomeLab GeXP Human ReferencePlex Kit (PN A54651) can be used as a template to test custom multiplex primers that target human transcripts.
NOTE While the Human Reference Control RNA provides broad gene coverage, not all the gene transcripts are necessarily present. It is highly advisable to have a thorough understanding of the gene expression patterns for the transcripts detected by the custom multiplex primers.
r Develop a custom Control RNA by mixing RNA from several sources to achieve full transcript representation. Generally, this mixture will contain 50% of normal and 50% treated RNA.
NOTE If more than one treatment is being studied, combine the treatments so that each one is equally represented in the 50% treated RNA.
r Evaluate reverse primers in a multiplex context.
r Evaluate forward primers in both multiplex and singlet reactions. See the GeXP Chemistry Protocol (PN A29143) for more information.
Interpreting the Results r If all of the multiplex peaks and one KANr peak are present, with no significant
undesigned peaks (UDPs), the functional quality of the experimental RNA and custom multiplex primers are confirmed. See "Reference Tables" on page 17 for more information on UDPs.
r If a reaction containing experimental RNA and control multiplex primers yields a KANr peak, but no multiplex peaks or multiplex peaks with low signal, then it is likely that the quality of the RNA is poor. Re-evaluate the RNA source or purification process to yield higher quality RNA.
r If a reaction containing custom multiplex primers and Control RNA yields a KANr peak, but is missing one or more peaks in the multiplex, then it is likely that redesign is required for the primer(s) of the missing peak(s). See "Multiplex Primer Design" on page 17 for more information on troubleshooting this issue.
r If a reaction containing custom multiplex primers and Control RNA yields a KANr peak and all the multiplex peaks, but has significant UDPs, then primer redesign is necessary. See "Multiplex Primer Design" on page 17 for more information on troubleshooting this issue.
r If no reaction yields a KANr peak (positive control), then see "Testing the GeXP Start Kit and Experimental Process" on page 11 to re-evaluate the start kit components and experimental process.
GenomeLab GeXPPN A53995-AB
14

Instrumentation & ChemistryTesting Third-Party Products
By using the previously described process, you should have been able to identify many of the most common causes of GeXP problems associated with instrumentation and chemistry in capillary electrophoresis-based gene expression profiling.
Refer to the "Reference Tables" on page 17 or the "Questions & Answers" on page 31 for additional causes and corrective actions for troubleshooting purposes.
Troubleshooting GuidePN A53995-AB
15

Instrumentation & ChemistryTesting Third-Party Products
GenomeLab GeXPPN A53995-AB
16

Reference TablesMultiplex Primer Design
3Reference Tables
The following tables list issues that might be encountered while analyzing GeXP multiplex reactions with the GenomeLab GeXP Genetic Analysis System.
r Multiplex Primer Design on page 17
r GeXP Chemistry on page 20
r GeXP Separation and Fragment Analysis on page 25
r eXpress Profiler and Analysis on page 28
For specific solutions or examples, look for references to sample figures in Appendix B.
3.1 Multiplex Primer Design
Issue Cause Solution
Some of the accession numbers or genes entered into eXpress Multiplex are not incorporated into the multiplex
Incorrect accession number format
The accession number is not recognized by eXpress Profiler. Use Verbose Mode to identify which genes are not incorporated by executing the multiplex.
See "Troubleshooting Multiplex Design with Verbose Mode" on page 37.
Use the correct accession number format, including underscores (_), if present.
Incorrect gene sequence format
The gene sequence is not recognized by eXpress Profiler.
Use the FASTA function to verify that the accession number refers to nucleotide sequence, not protein sequence.
eXpress Profiler only recognizes the characters: A,C,G, T and N for gene sequence. If the gene sequence contains other IUPAC code, create a proprietary sequence that excludes this region of the sequence.
IMPORTANT Do not use a sequence with any other IUPAC code (i.e. R, Y, S, W).
Alternatively, search GenBank for another accession number referring to the same gene with sequence containing only A,C,G,T and N.
Troubleshooting GuidePN A53995-AB
17
Reference TablesMultiplex Primer Design
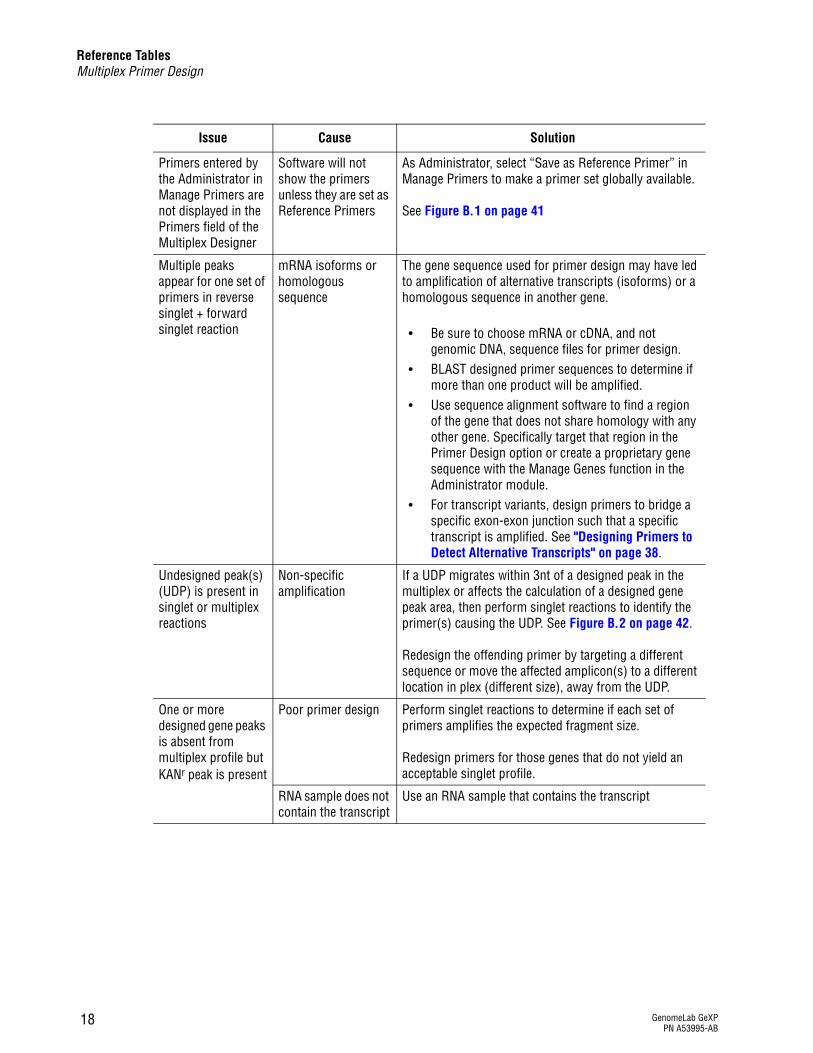
Primers entered by the Administrator in Manage Primers are not displayed in the Primers field of the Multiplex Designer
Software will not show the primers unless they are set as Reference Primers
As Administrator, select “Save as Reference Primer” in Manage Primers to make a primer set globally available.
See Figure B.1 on page 41
Multiple peaks appear for one set of primers in reverse singlet + forward singlet reaction
mRNA isoforms or homologous sequence
The gene sequence used for primer design may have led to amplification of alternative transcripts (isoforms) or a homologous sequence in another gene.
r Be sure to choose mRNA or cDNA, and not genomic DNA, sequence files for primer design.
r BLAST designed primer sequences to determine if more than one product will be amplified.
r Use sequence alignment software to find a region of the gene that does not share homology with any other gene. Specifically target that region in the Primer Design option or create a proprietary gene sequence with the Manage Genes function in the Administrator module.
r For transcript variants, design primers to bridge a specific exon-exon junction such that a specific transcript is amplified. See "Designing Primers to Detect Alternative Transcripts" on page 38.
Undesigned peak(s) (UDP) is present in singlet or multiplex reactions
Non-specific amplification
If a UDP migrates within 3nt of a designed peak in the multiplex or affects the calculation of a designed gene peak area, then perform singlet reactions to identify the primer(s) causing the UDP. See Figure B.2 on page 42.
Redesign the offending primer by targeting a different sequence or move the affected amplicon(s) to a different location in plex (different size), away from the UDP.
One or more designed gene peaks is absent from multiplex profile but KANr peak is present
Poor primer design Perform singlet reactions to determine if each set of primers amplifies the expected fragment size.
Redesign primers for those genes that do not yield an acceptable singlet profile.
RNA sample does not contain the transcript
Use an RNA sample that contains the transcript
Issue Cause Solution
GenomeLab GeXPPN A53995-AB
18

Reference TablesMultiplex Primer Design
A gene peak disappears from the multiplex profile when it is expected to be present in the RNA sample
Poor primer design If the peak is present in some wells, but not others prepared from the same RNA sample and Master Mix reagents (RT, PCR), then the primer may not have good binding specificity. Polymorphism(s) in the primer sequence, especially at the 3' end, may result in amplification from one sample RNA but not another.
Redesign the primer set to a better region of the gene (not too close to either the 5' or 3' end of the transcript, no repeat sequences, no GC rich regions, no homologous regions, no polymorphisms).
Low or no signal for a particular peak in a multiplex reaction with RNA expected to contain the transcript, using primers that generate a peak in a singlet reaction.
Primer interference It is most efficient to redesign the affected primer(s).
However, if it is necessary to determine which primer is the interfering primer, perform duplex reactions containing the affected primer with each of the other primer sets in the multiplex, then redesign the interfering primer.
A particular amplicon has two or more shoulders or stutter peaks.
Repeats in amplicon sequence cause polymerase slippage
See Figure B.3 on page 42
Check the designed amplicon for repeat sequences.
Redesign the primers to a region of the gene that does not contain repeat sequences.
Significantly higher %CV in biological replicates compared to technical replicates
There is a SNP in the 3' end of primer sequence
Check the primers for single nucleotide polymorphisms (SNPs). Redesign the primer if any SNPs are present.
SNPs can have profound impact on the priming efficiency depending on how much of the instability is introduced. A biological sample with the perfect match to the primers will generate a higher signal than a sample with a mismatch due to the presence of SNPs. This will result in high %CV in biological replicates, but not technical replicates.
Biological replicates generally have slightly higher %CV than technical replicates, due to the natural variation between organisms or the variation that was introduced during sample preparation.
Issue Cause Solution
Troubleshooting GuidePN A53995-AB
19

Reference TablesGeXP Chemistry
3.2 GeXP Chemistry
Issue Cause Solution
A variation in multiplex quantitative results is seen from build-to-build of custom primer plexes for the same RNA sample
The multiplex formulation has changed
Once optimized, do not change the multiplex formulation (primer concentrations). Carefully assemble each multiplex build for consistency.
Remake the multiplex consistent with the optimized formula.
Make sure to use the same primer plex formulation throughout a study.
Multiple designed gene peaks are present in reverse multiplex + forward singlet reactions
Primer contamination The reverse primer stocks or reverse primer multiplex is contaminated with forward primers. Alternatively, forward primer stocks are cross-contaminated with other forward primers.
r Decontaminate the lab bench, pipettes, etc. with a nucleic acid-destroying solution
r Use fresh reagents and remake primer stocks and/or reverse multiplex
r Use aerosol-barrier filter tips for making multiplexes and assembling RT and PCR reactions
GenomeLab GeXPPN A53995-AB
20

Reference TablesGeXP Chemistry
Low signal Primer Design See this topic in "Multiplex Primer Design" on page 17.
DEPC interference IMPORTANT Do not use DEPC-treated water for GeXP as residual DEPC can interfere with PCR amplification.
Use Nuclease-free water (USB 71786 or Invitrogen 10977-015) when making Resuspension Buffer (10 mM Tris-HCl, pH 8) for primer plexes.
Primer degradation Use 10mM Tris-HCl, pH 8 (Resuspension Buffer) for making primer plexes.
Store multiplex primers at -20°C.
Primer quality Primers can contain residual amounts of organic solvent. Order new primers from well-respected oligo vendors, such as Integrated DNA Technologies (IDT).
Reagents - expired and/or improper storage/handling
r Check reagent storage conditions and expiration dates. All kit components, except RNA, should be stored at -20°C.
r Avoid excessive freeze-thaw cycles. Control RNA and KANr RNA should be aliquoted into single use volumes after the first thaw and always stored at -80°C.
r Use fresh reagents that have been properly stored.
Vortex the 5x RT Buffer containing DTT and the 25 mM MgCl2 to dissolve any precipitant before use.
RNA template - quality, quantity
Verify that the RNA is of high quality and adequate quantity. Ribosomal RNA 28S and 18S bands should be prominent on agarose gel and 28S/18S ratio > 1.0.
Recheck calculations for amount of input total RNA (25-100 ng is recommended). Increase the amount of RNA template used.
Thermal cycler Check thermal cycler calibration and protocol cycling temperatures.
Raise the PCR extension temperature to 70°C to overcome variation in thermal cycler wells.
Use a thermal cycler with a heated lid to prevent evaporation and verify that the lid temperature is the same temperature as the incubation chamber.
Issue Cause Solution
Troubleshooting GuidePN A53995-AB
21
Reference TablesGeXP Chemistry
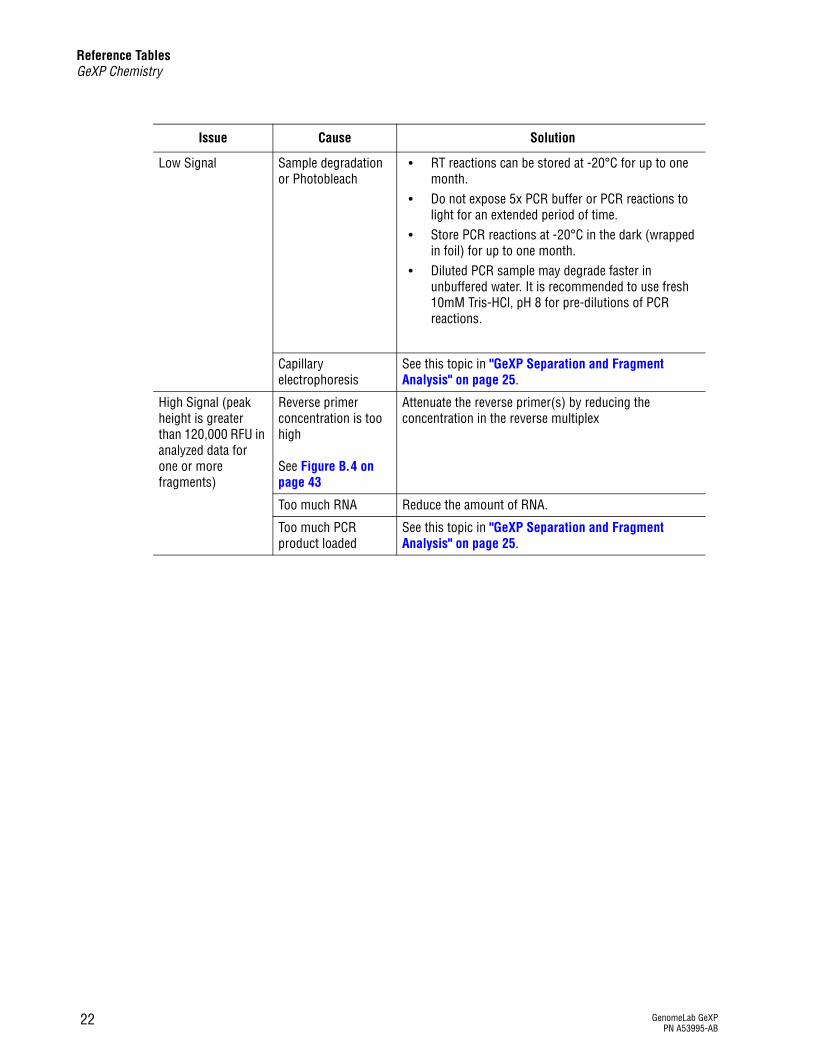
Low Signal Sample degradation or Photobleach
r RT reactions can be stored at -20°C for up to one month.
r Do not expose 5x PCR buffer or PCR reactions to light for an extended period of time.
r Store PCR reactions at -20°C in the dark (wrapped in foil) for up to one month.
r Diluted PCR sample may degrade faster in unbuffered water. It is recommended to use fresh 10mM Tris-HCl, pH 8 for pre-dilutions of PCR reactions.
Capillary electrophoresis
See this topic in "GeXP Separation and Fragment Analysis" on page 25.
High Signal (peak height is greater than 120,000 RFU in analyzed data for one or more fragments)
Reverse primer concentration is too high
See Figure B.4 on page 43
Attenuate the reverse primer(s) by reducing the concentration in the reverse multiplex
Too much RNA Reduce the amount of RNA.
Too much PCR product loaded
See this topic in "GeXP Separation and Fragment Analysis" on page 25.
Issue Cause Solution
GenomeLab GeXPPN A53995-AB
22

Reference TablesGeXP Chemistry
One or more designed gene peaks are absent from multiplex profile but KANr peak is present
Poor primer design See this topic in "Multiplex Primer Design" on page 17.
RNA The RNA sample may not contain the transcript(s) or the gene is downregulated in that sample.
r Use more RNA in the reverse transcription reaction (up to 100ng per reaction)
r Use an RNA source known to contain the gene transcript of interest to validate the primer design
r Combine RNA samples/sources such that all genes in multiplex are represented at a relatively moderate detectable level and use this RNA as a positive control for gene detection and multiplex optimization
RNA may be degraded. Verify the RNA quality (Ribosomal RNA 28S/18S ratio should be > 1.0).
Store stock RNA samples in The RNA Storage Solution (Ambion AM#7000), at -80°. Aliquot to working volumes, and thaw aliquots only once to ensure RNA integrity.
Primer concentration Increase reverse primer up to 150 nM per reaction (1.5 µM in the reverse multiplex) for each low expresser.
Additionally, decreasing the high signal of high expressers through attenuation may bring up the signal of low expressers.
Peaks are present in RT minus reactions.
Genomic DNA contamination
See Figure B.6 on page 44
Treat RNA with RNase-free DNase during RNA purification.
Amplification contaminated with another DNA template or DNA amplicons
r Use aerosol-resistant barrier tips during RT and PCR reaction preparation to minimize contamination from external sources.
r Use fresh tips for each step in preparing the GeXP reactions
r Separate pre- and post-PCR work areas. r Do not bring amplified product into pre-PCR area.
Well-to-well contamination
Contamination across wells can occur during set up for PCR or separation, especially with single channel pipetting.
Use multichannel pipette to reduce pipetting error and contamination.
Issue Cause Solution
Troubleshooting GuidePN A53995-AB
23
Reference TablesGeXP Chemistry
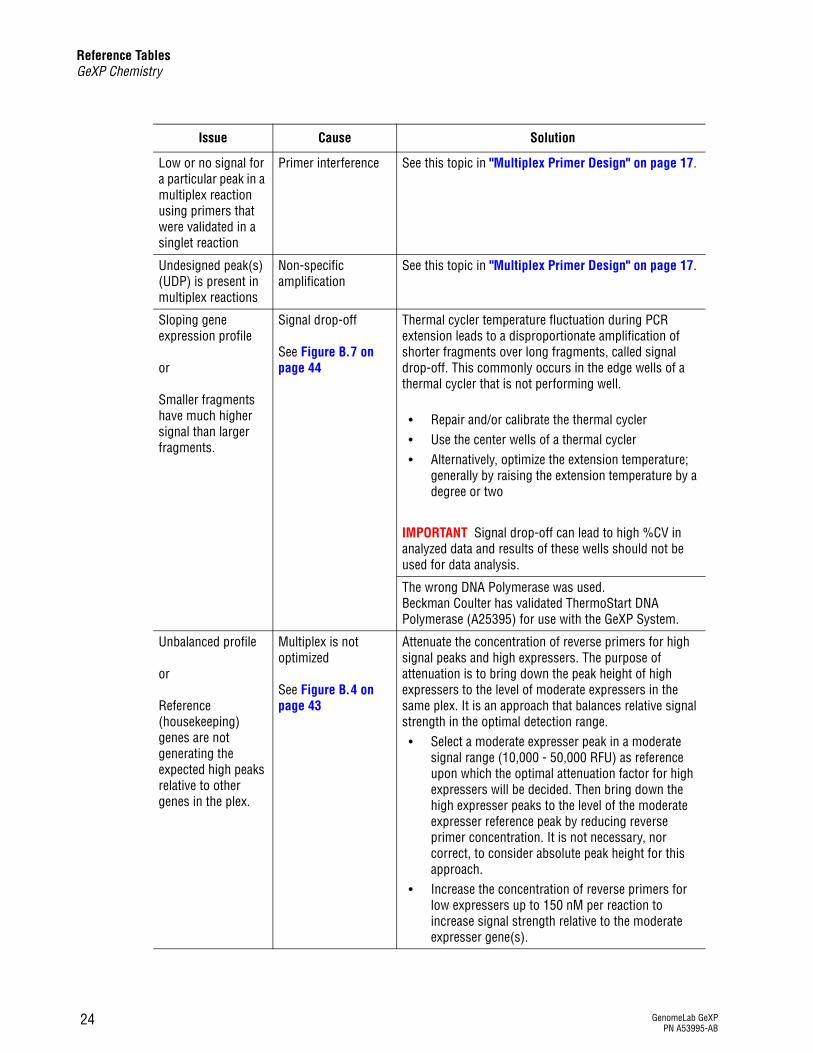
Low or no signal for a particular peak in a multiplex reaction using primers that were validated in a singlet reaction
Primer interference See this topic in "Multiplex Primer Design" on page 17.
Undesigned peak(s) (UDP) is present in multiplex reactions
Non-specific amplification
See this topic in "Multiplex Primer Design" on page 17.
Sloping gene expression profile
or
Smaller fragments have much higher signal than larger fragments.
Signal drop-off
See Figure B.7 on page 44
Thermal cycler temperature fluctuation during PCR extension leads to a disproportionate amplification of shorter fragments over long fragments, called signal drop-off. This commonly occurs in the edge wells of a thermal cycler that is not performing well.
r Repair and/or calibrate the thermal cycler r Use the center wells of a thermal cycler r Alternatively, optimize the extension temperature;
generally by raising the extension temperature by a degree or two
IMPORTANT Signal drop-off can lead to high %CV in analyzed data and results of these wells should not be used for data analysis.
The wrong DNA Polymerase was used. Beckman Coulter has validated ThermoStart DNA Polymerase (A25395) for use with the GeXP System.
Unbalanced profile
or
Reference (housekeeping) genes are not generating the expected high peaks relative to other genes in the plex.
Multiplex is not optimized
See Figure B.4 on page 43
Attenuate the concentration of reverse primers for high signal peaks and high expressers. The purpose of attenuation is to bring down the peak height of high expressers to the level of moderate expressers in the same plex. It is an approach that balances relative signal strength in the optimal detection range. r Select a moderate expresser peak in a moderate
signal range (10,000 - 50,000 RFU) as reference upon which the optimal attenuation factor for high expressers will be decided. Then bring down the high expresser peaks to the level of the moderate expresser reference peak by reducing reverse primer concentration. It is not necessary, nor correct, to consider absolute peak height for this approach.
r Increase the concentration of reverse primers for low expressers up to 150 nM per reaction to increase signal strength relative to the moderate expresser gene(s).
Issue Cause Solution
GenomeLab GeXPPN A53995-AB
24
Reference TablesGeXP Separation and Fragment Analysis
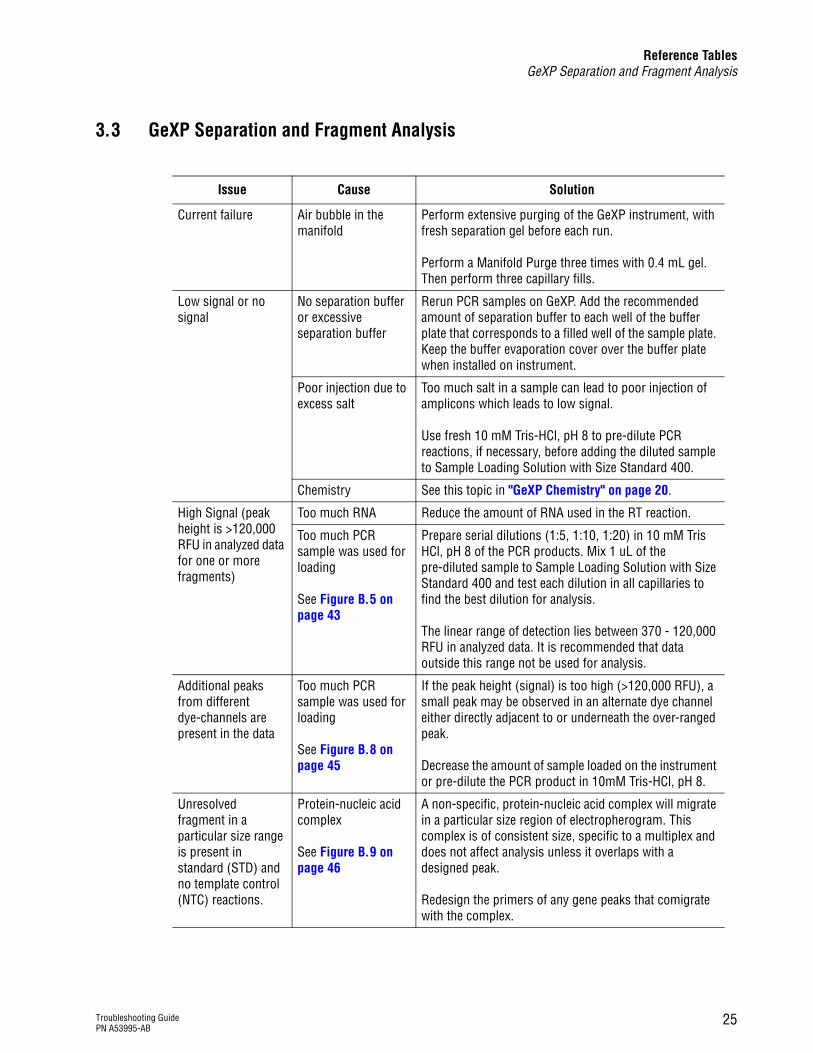
3.3 GeXP Separation and Fragment Analysis
Issue Cause Solution
Current failure Air bubble in the manifold
Perform extensive purging of the GeXP instrument, with fresh separation gel before each run.
Perform a Manifold Purge three times with 0.4 mL gel. Then perform three capillary fills.
Low signal or no signal
No separation buffer or excessive separation buffer
Rerun PCR samples on GeXP. Add the recommended amount of separation buffer to each well of the buffer plate that corresponds to a filled well of the sample plate. Keep the buffer evaporation cover over the buffer plate when installed on instrument.
Poor injection due to excess salt
Too much salt in a sample can lead to poor injection of amplicons which leads to low signal.
Use fresh 10 mM Tris-HCl, pH 8 to pre-dilute PCR reactions, if necessary, before adding the diluted sample to Sample Loading Solution with Size Standard 400.
Chemistry See this topic in "GeXP Chemistry" on page 20.
High Signal (peak height is >120,000 RFU in analyzed data for one or more fragments)
Too much RNA Reduce the amount of RNA used in the RT reaction.
Too much PCR sample was used for loading
See Figure B.5 on page 43
Prepare serial dilutions (1:5, 1:10, 1:20) in 10 mM Tris HCl, pH 8 of the PCR products. Mix 1 uL of the pre-diluted sample to Sample Loading Solution with Size Standard 400 and test each dilution in all capillaries to find the best dilution for analysis.
The linear range of detection lies between 370 - 120,000 RFU in analyzed data. It is recommended that data outside this range not be used for analysis.
Additional peaks from different dye-channels are present in the data
Too much PCR sample was used for loading
See Figure B.8 on page 45
If the peak height (signal) is too high (>120,000 RFU), a small peak may be observed in an alternate dye channel either directly adjacent to or underneath the over-ranged peak.
Decrease the amount of sample loaded on the instrument or pre-dilute the PCR product in 10mM Tris-HCl, pH 8.
Unresolved fragment in a particular size range is present in standard (STD) and no template control (NTC) reactions.
Protein-nucleic acid complex
See Figure B.9 on page 46
A non-specific, protein-nucleic acid complex will migrate in a particular size region of electropherogram. This complex is of consistent size, specific to a multiplex and does not affect analysis unless it overlaps with a designed peak.
Redesign the primers of any gene peaks that comigrate with the complex.
Troubleshooting GuidePN A53995-AB
25

Reference TablesGeXP Separation and Fragment Analysis
Valid peaks were not analyzed or called in Fragment Analysis
Analysis parameters The wrong analysis parameters can lead to poor analysis. Use the Default GeXP Analysis Parameters: Slope Threshold = 10%, Relative Peak Height Threshold = 1%, Confidence level = 95%, SizeStd 400, Cubic Model, Dye Mobility Calibration ON = PA ver.1, Calculated Dye Spectra. The Slope and Peak Height Thresholds can be reduced to pick up small peaks.
Exclusion filter
See Figure B.10 on page 47.
An exclusion filter in the Fragment List tab of Fragment Analysis module may be active.
Exclusion filters, specific to each multiplex, need to be adjusted and saved for each GeXP instrument to account for variation in separation. Adjust sizes of exclusion filter to include valid peaks with a bin width of approximately 2 nucleotides. See Figure B.11 on page 47.
Size shift in designed gene peaks and/or KANr peak
Analysis parameters Use the Default GeXP Analysis Parameters: Slope Threshold = 10%, Relative Peak Height Threshold = 1%, Confidence level = 95%, SizeStd 400, Cubic Model, Dye Mobility Calibration ON = PA ver.1, Calculated Dye Spectra.
Wrong size standard Verify which Size Standard chemistry was used. GeXP Analysis Parameters are designed to be used with Size Standard-400. If Size Standard-600 was used, the fragment sizing will be different for samples analyzed with Default GeXP Analysis Parameters.
Edit the GeXP Analysis Parameters so that Size Standard-600 and Quartic model are selected and then reanalyze the data. Save this revised Analysis Parameter with a new name (i.e. GeXPss600).
The peak for a low expresser or uninduced gene was not detected.
Analysis parameters
See Figure B.12 on page 48 and Figure B.13 on page 48
When GeXP analysis parameters are lowered to Slope Threshold = 1 and Peak Height Threshold = 0, nearly every peak, can be detected. If a very small peak (~370 RFU) with the exact same fragment size as the induced gene is detected, it can be treated as real peak in the uninduced sample. It is best if this very small, uninduced peak resides in an area with a clean baseline (no UDPs or excessive noise) of the multiplex profile so the peak call is accurate. See Figure B.13 on page 48.
Too many small, undesigned peaks called
Instrument Sensitivity
Exclude the small, insignificant peaks by establishing an exclusion filter in Fragment List of Fragment Analysis so that the peaks below a particular peak height will not be called.
Alternatively, use the exclusion filter to exclude unwanted peaks from bins of particular width. See Figure B.11 on page 47.
Issue Cause Solution
GenomeLab GeXPPN A53995-AB
26
Reference TablesGeXP Separation and Fragment Analysis
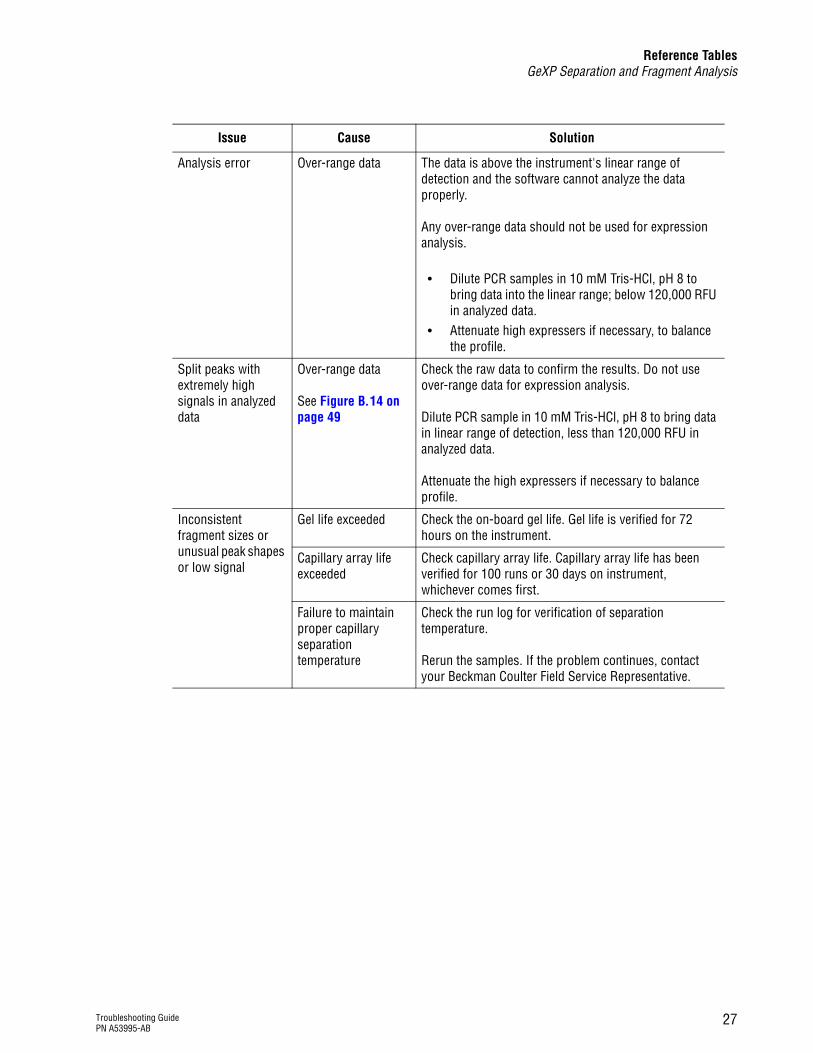
Analysis error Over-range data The data is above the instrument's linear range of detection and the software cannot analyze the data properly.
Any over-range data should not be used for expression analysis.
r Dilute PCR samples in 10 mM Tris-HCl, pH 8 to bring data into the linear range; below 120,000 RFU in analyzed data.
r Attenuate high expressers if necessary, to balance the profile.
Split peaks with extremely high signals in analyzed data
Over-range data
See Figure B.14 on page 49
Check the raw data to confirm the results. Do not use over-range data for expression analysis.
Dilute PCR sample in 10 mM Tris-HCl, pH 8 to bring data in linear range of detection, less than 120,000 RFU in analyzed data.
Attenuate the high expressers if necessary to balance profile.
Inconsistent fragment sizes or unusual peak shapes or low signal
Gel life exceeded Check the on-board gel life. Gel life is verified for 72 hours on the instrument.
Capillary array life exceeded
Check capillary array life. Capillary array life has been verified for 100 runs or 30 days on instrument, whichever comes first.
Failure to maintain proper capillary separation temperature
Check the run log for verification of separation temperature.
Rerun the samples. If the problem continues, contact your Beckman Coulter Field Service Representative.
Issue Cause Solution
Troubleshooting GuidePN A53995-AB
27
Reference TableseXpress Profiler and Analysis
3.4 eXpress Profiler and Analysis
Issue Cause Solution
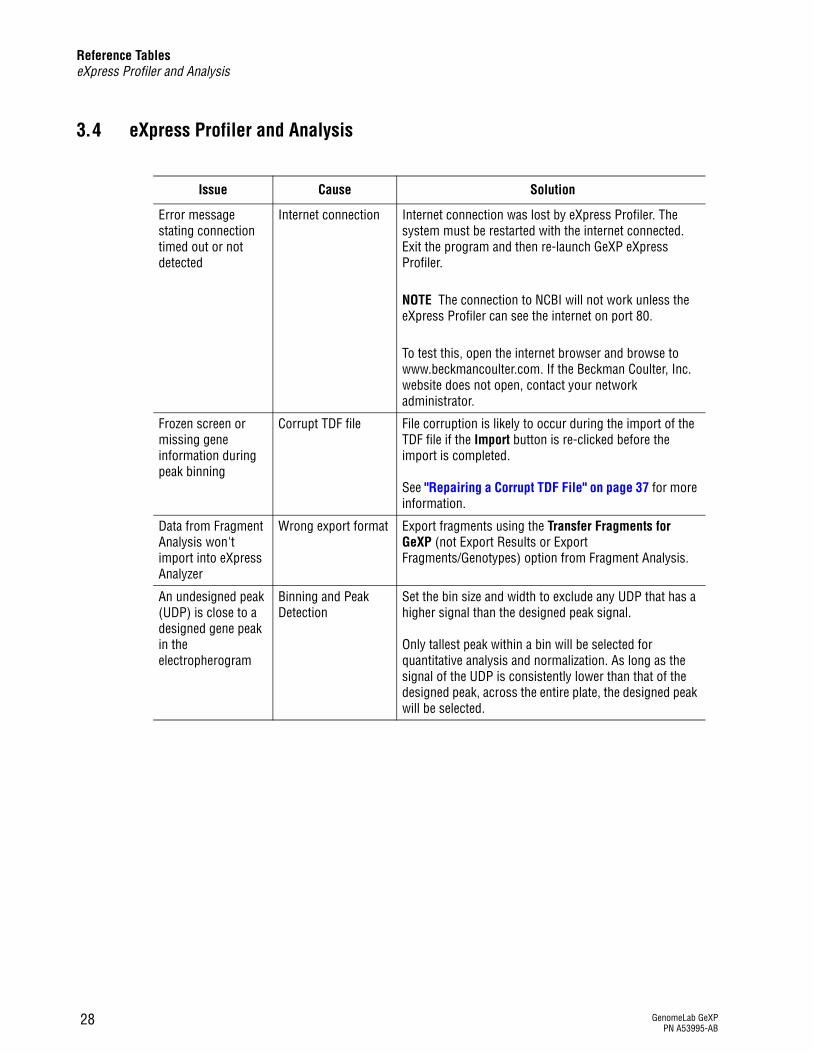
Error message stating connection timed out or not detected
Internet connection Internet connection was lost by eXpress Profiler. The system must be restarted with the internet connected. Exit the program and then re-launch GeXP eXpress Profiler.
NOTE The connection to NCBI will not work unless the eXpress Profiler can see the internet on port 80.
To test this, open the internet browser and browse to www.beckmancoulter.com. If the Beckman Coulter, Inc. website does not open, contact your network administrator.
Frozen screen or missing gene information during peak binning
Corrupt TDF file File corruption is likely to occur during the import of the TDF file if the Import button is re-clicked before the import is completed.
See "Repairing a Corrupt TDF File" on page 37 for more information.
Data from Fragment Analysis won't import into eXpress Analyzer
Wrong export format Export fragments using the Transfer Fragments for GeXP (not Export Results or Export Fragments/Genotypes) option from Fragment Analysis.
An undesigned peak (UDP) is close to a designed gene peak in the electropherogram
Binning and Peak Detection
Set the bin size and width to exclude any UDP that has a higher signal than the designed peak signal.
Only tallest peak within a bin will be selected for quantitative analysis and normalization. As long as the signal of the UDP is consistently lower than that of the designed peak, across the entire plate, the designed peak will be selected.
GenomeLab GeXPPN A53995-AB
28

Reference TableseXpress Profiler and Analysis
High %CV Sample size Perform at least three technical replicates per RNA sample.
Generally, more technical replicates of the same RNA sample or RT reaction reduces the %CV.
Sample type A small number of biological replicates can lead to a high %CV due to inherent diversity between organisms. Low expresser genes tend to have higher %CV.
Reference Gene Review the choice of reference gene to verify that relative expression of this gene is constant across all samples.
If the reference gene expression fluctuates greatly between samples, this could influence the %CV. Choose a reference gene that has constant expression under all conditions that will be examined in the study.
The GenomeLab Human ReferencePlex Kit (A54651) is a validated assay designed to determine the best references gene for human RNA samples.
NOTE Normally, the KANr peak signal is usually out of range and should therefor not be used as a reference gene for normalization of experimental genes. If it is desired to use KANr as a reference gene for normalization, the amount of KANr RNA needs to be reduced so that the peak height of KANr is similar to that of the median-expressers in the multiplex.
Signal drop-off See this topic in "GeXP Chemistry" on page 20.
SNPs in the primer(s) See this topic in "Multiplex Primer Design" on page 17.
Issue Cause Solution
Troubleshooting GuidePN A53995-AB
29

Reference TableseXpress Profiler and Analysis
Third-party software for gene expression analysis
Data analysis IMPORTANT Do not install third-party software on the eXpress Profiler controller for further analysis of gene expression data.
The following analyses can be performed on GeXP data, using Microsoft Excel: r multiple reference gene normalization r calculation of fold-change r statistical analysis
Additional software programs for use with GeXP-generated data are GeNorm, DecisionSite, PartekGS and Prism. Visit the websites below for information on these software programs.
Third-party software information: http://primerdesign.co.uk/genorm_licence.asphttp://www.spotfire.com http://www.partek.com http://www.graphpad.com/prism/Prism.htm
Disruption in internet connection, general malfunction of software
Third-party software, Microsoft Windows updates
Although they are important to the Windows software security capabilities, Microsoft Updates should not be performed on these controllers. This default setting is turned off.
Contact your Beckman Coulter Technical Support Representative for more information.
Issue Cause Solution
GenomeLab GeXPPN A53995-AB
30
Questions & AnswerseXpress Profiler
4Questions & Answers
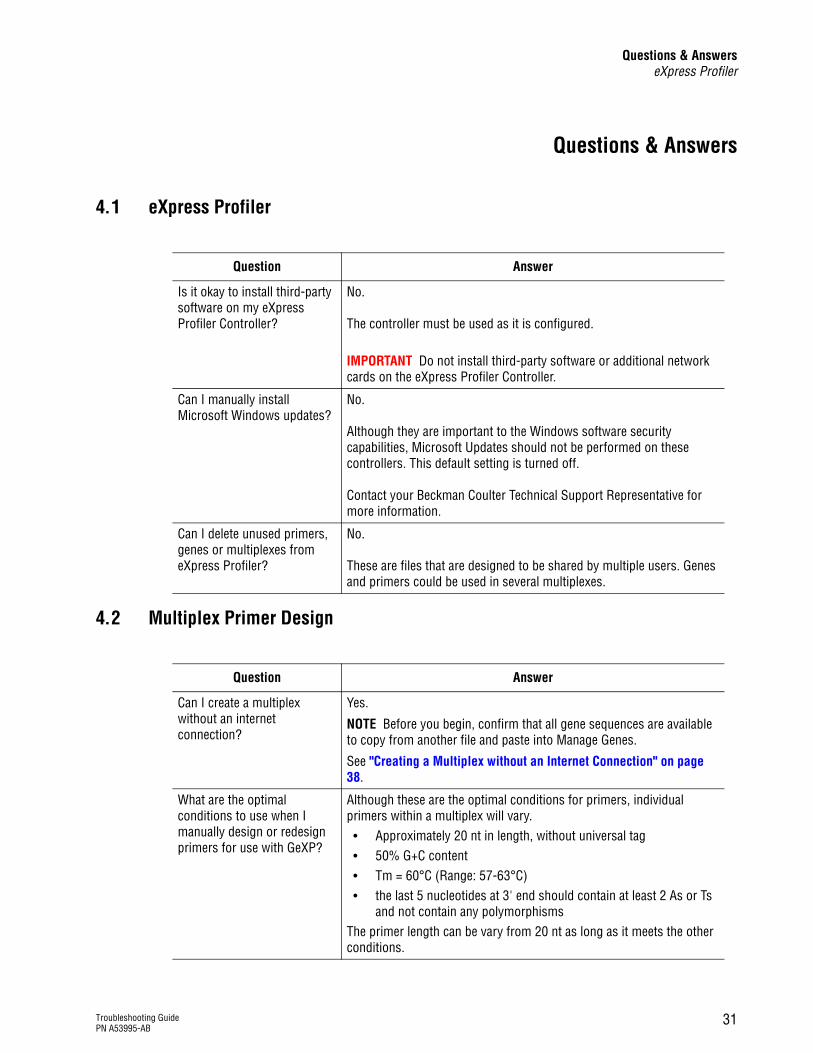
4.1 eXpress Profiler
4.2 Multiplex Primer Design
Question Answer
Is it okay to install third-party software on my eXpress Profiler Controller?
No.
The controller must be used as it is configured.
IMPORTANT Do not install third-party software or additional network cards on the eXpress Profiler Controller.
Can I manually install Microsoft Windows updates?
No.
Although they are important to the Windows software security capabilities, Microsoft Updates should not be performed on these controllers. This default setting is turned off.
Contact your Beckman Coulter Technical Support Representative for more information.
Can I delete unused primers, genes or multiplexes from eXpress Profiler?
No.
These are files that are designed to be shared by multiple users. Genes and primers could be used in several multiplexes.
Question Answer
Can I create a multiplex without an internet connection?
Yes.
NOTE Before you begin, confirm that all gene sequences are available to copy from another file and paste into Manage Genes.
See "Creating a Multiplex without an Internet Connection" on page 38.
What are the optimal conditions to use when I manually design or redesign primers for use with GeXP?
Although these are the optimal conditions for primers, individual primers within a multiplex will vary. r Approximately 20 nt in length, without universal tag r 50% G+C content r Tm = 60°C (Range: 57-63°C) r the last 5 nucleotides at 3' end should contain at least 2 As or Ts
and not contain any polymorphisms The primer length can be vary from 20 nt as long as it meets the other conditions.
Troubleshooting GuidePN A53995-AB
31

Questions & AnswersGeXP Chemistry and Fragment Analysis
4.3 GeXP Chemistry and Fragment Analysis
Can I design primers to detect alternative transcripts?
Yes.
First, define the mRNA isoform(s) of interest and design primers specifically to include or exclude exons or to bridge unique exon-exon junctions.
See "Designing Primers to Detect Alternative Transcripts" on page 38 for more information.
Can I can add or delete a primer from a previously designed multiplex?
Yes.
See "Modifying a Previously Designed Multiplex" on page 39 for instructions.
Question Answer
What is the difference between the pre- and post- PCR areas?
The pre-PCR area is used to set up both the reverse transcription (RT) and PCR reactions. The post-PCR area is where the PCR reaction goes after amplification.
The pre-PCR area is divided into two zones: r No Template Zone: Assemble and aliquot the master mixes r Template Addition Zone: Add RNA for the RT reaction or add
cDNA to the PCR reaction
IMPORTANT Amplified (PCR) product should never be brought into the pre-PCR area.
Use the thermal cycler for PCR in the post-PCR area. Any area that is exposed to amplified PCR product should be considered as an area that contains amplified template in the environment.
What can happen if amplified PCR product is brought into the pre-PCR area?
One symptom of PCR product contamination of the pre-PCR area is peaks in the RT minus and No Template Control reactions of GeXP. The contamination of GeXP RT-PCR sample wells with exogenous template will compromise the relative quantitation of GeXP.
To clean up a pre-PCR area contaminated with amplified product or other nucleic acid template, use a 5% bleach solution or commercially available decontaminant such as DNA Zap (Ambion) or DNA AWAY (Molecular BioProducts), to wipe down all surfaces and equipment.
What RNA should I use to evaluate and optimize my custom multiplex?
Initially test the multiplex on a Control RNA that consists of a mixture of the RNA samples that will eventually be tested individually with the multiplex (e.g. untreated + treated or normal + disease). All the gene transcripts must be present in the Control RNA for initial evaluation and validation of multiplex primers. For optimization of the multiplex, ratios of each RNA sample in the Control RNA should reflect a moderate level of expression for most individual genes.
NOTE Levels of expression are relative for each gene.
GenomeLab GeXPPN A53995-AB
32

Questions & AnswersGeXP Chemistry and Fragment Analysis
Are undesigned peaks (UDPs) in singlet reactions cause for concern?
If UDPs: r migrates at the same size as a designed peak in the multiplex r affect the quantitation of a designed gene peakthen redesign primers that cause this UDP.
It is best to assess the significance of a UDP in a singlet reaction when the peak height of the designed peak is below 120,000 RFU.
What do I do if an undesigned peak (UDP) co-migrates with a designed peak in a multiplex?
If it is possible to determine which primer is causing the UDP from singlet reactions, then redesign this primer by targeting a different sequence. Alternatively, the designed peak can be moved to a different location in the plex by redesigning the primers. This may simply involve moving the primer position a few nucleotides in one direction or the other to shift the designed peak away from the UDP.
What is attenuation and how will it affect my results?
Attenuation is the process by which the reverse primer concentration of high expressers is reduced. This brings the high expresser gene signals into range of the moderate expressers.
Attenuation is used to balance the signal of the gene expression profile within the linear range of detection. The GeXP instrument has a lower and upper limit in its range of detection (370 - 120,000 RFU in the analyzed data). During multiplex optimization, it is important to ensure that all peaks fall within that limit, ideally within a range between 2,000 - 50,000 RFU.
Attenuation performed during the optimization of a particular multiplex has no effect on results, because this optimization is carried out on Control RNA. The goal is to establish the baseline levels of expression and gene specific reverse primer concentration with Control RNA before testing other RNAs. Attenuation affects only the detection of mRNA of the particular transcript. This is usually a high expresser, such as a housekeeping gene that needs to be brought into the linear range of detection. The concentration of reverse gene-specific primers are changed only during the plex optimization stage. Once concentrations for all primers in a reverse multiplex have been optimized, the primer concentrations remain fixed for all subsequent experiments. Thus, the relative quantitation of gene expression for any particular gene will remain constant in a particular sample. Further the fold change in expression for this gene between treatments is always calculated using the relative quantitation.
For more information on Attenuation, visit our website: www.beckmancoulter.com/genomelab and obtain a copy of the Applications Information Bulletin A- 2049A Multiplexed, Quantitative Gene Expression Analysis for Lettuce Seed Germination on GenomeLab GeXP Genetic Analysis System.
Troubleshooting GuidePN A53995-AB
33

Questions & AnswerseXpress Analysis
4.4 eXpress Analysis
What is the best way to detect the peak area of an uninduced or low expresser gene after primer optimization?
To detect the peak area of an uninduced/low expresser gene:
Change the GeXP Analysis parameters in Fragment Analysis to Slope Threshold = 1 and Peak Height Threshold = 0, and reanalyze. With these settings, nearly every peak, can be detected. If a very small peak (~370 rfu) with the exact same fragment size as the induced gene is detected, it can be treated as real peak in the uninduced sample.
For the most accurate peak call, it is best if this very small, uninduced peak resides in an area with a clean baseline (no UDPs or excessive noise) of the multiplex profile.
What is the best way to detect a large fold induction with GeXP?
Induced genes will usually have a relatively low signal (small peak) in the uninduced or basal state and high signal (tall peaks) in the induced state. Attenuate the reverse primer concentration and pre-dilute the PCR products such that uninduced samples generate a very small, yet detectable peak and induced samples generate a peak within linear range of detection (370 - 120,000 RFU in analyzed data).
Separate PCR reactions from uninduced RNA samples in middle CEQ capillaries (C, D, E, F) and reactions from induced samples in the outer capillaries (A,B, G, H). Detection of approximately 1000-fold change in expression can be achieved with this method.
What is the minimum and maximum relative limit in fluorescence units (RFU) for a designed peak to remain in the linear range of detection?
370 - 120,000 RFU in the analyzed data. This is the recommended signal range for quantitation with GeXP.
In order to detect variations in gene expression from sample to sample, design gene peaks within the range of approximately 2000 - 50,000 RFU, during multiplex optimization.
Can I use the KANr peak as a reference gene for normalization?
Yes, under certain conditions.
KANr RNA is an independent template that is designed to serve as a positive, internal control for the RT and PCR reactions.
Normally, the KANr peak signal is out of range and should not be used as a reference gene for normalization of experimental genes. If it is desired to use KANr as a reference gene for normalization, the amount of KANr RNA needs to be reduced so that the peak height of KANr is similar to that of the median-expressers in the multiplex.
Question Answer
Can I import data from two or more plates into eXpress Analyzer?
Yes.
See "Importing Two or More Plates into eXpress Analyzer" on page 39 for instructions.
GenomeLab GeXPPN A53995-AB
34

Questions & AnswerseXpress Analysis
Can I print or save the Heat Map or other visual formats generated from my data in eXpress Map?
No.
Though it is not possible to save, export or print graphs generated in eXpress Map, use the Print Screen keystroke to capture the screen image. Paste the screen capture into Microsoft Word, Excel or Paint, then save and print this new file.
Are there any third-party software programs that I can use with GeXP-generated data for gene expression analysis?
Yes.
IMPORTANT Do not install third-party software on the eXpress Profiler controller for further analysis of gene expression data.
The following analysis can be performed on GeXP data, using Microsoft Excel: r multiple reference gene normalization r calculation of fold-change r statistical analysis
Additional software programs for use with GeXP-generated data are GeNorm, DecisionSite, PartekGS and Prism. Visit the websites below for information on these software programs.
Third-party software information: http://primerdesign.co.uk/genorm_licence.asphttp://www.spotfire.com http://www.partek.com http://www.graphpad.com/prism/Prism.htm
Troubleshooting GuidePN A53995-AB
35

Questions & AnswerseXpress Analysis
GenomeLab GeXPPN A53995-AB
36
Appendix ATroubleshooting How Tos
AAppendix A
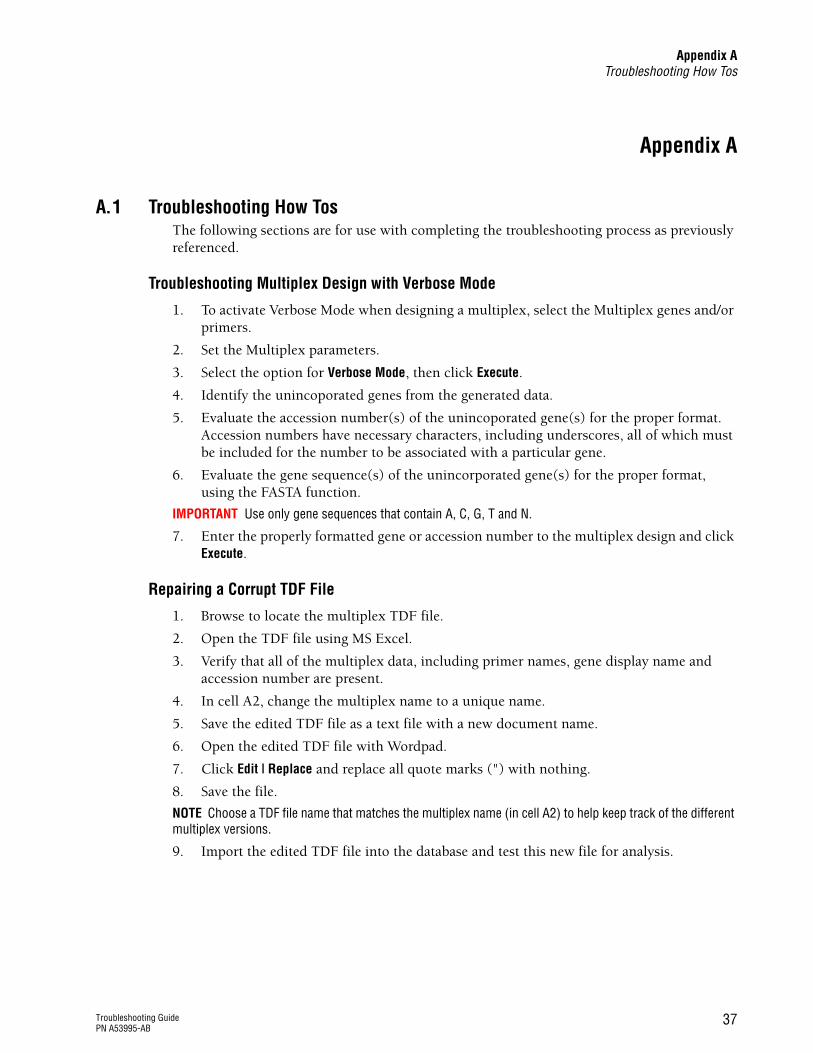
A.1 Troubleshooting How TosThe following sections are for use with completing the troubleshooting process as previously referenced.
Troubleshooting Multiplex Design with Verbose Mode
1. To activate Verbose Mode when designing a multiplex, select the Multiplex genes and/or primers.
2. Set the Multiplex parameters.
3. Select the option for Verbose Mode, then click Execute.
4. Identify the unincoporated genes from the generated data.
5. Evaluate the accession number(s) of the unincoporated gene(s) for the proper format. Accession numbers have necessary characters, including underscores, all of which must be included for the number to be associated with a particular gene.
6. Evaluate the gene sequence(s) of the unincorporated gene(s) for the proper format, using the FASTA function.
IMPORTANT Use only gene sequences that contain A, C, G, T and N.
7. Enter the properly formatted gene or accession number to the multiplex design and click Execute.
Repairing a Corrupt TDF File
1. Browse to locate the multiplex TDF file.
2. Open the TDF file using MS Excel.
3. Verify that all of the multiplex data, including primer names, gene display name and accession number are present.
4. In cell A2, change the multiplex name to a unique name.
5. Save the edited TDF file as a text file with a new document name.
6. Open the edited TDF file with Wordpad.
7. Click Edit | Replace and replace all quote marks (") with nothing.
8. Save the file.
NOTE Choose a TDF file name that matches the multiplex name (in cell A2) to help keep track of the different multiplex versions.
9. Import the edited TDF file into the database and test this new file for analysis.
Troubleshooting GuidePN A53995-AB
37

Appendix ATroubleshooting How Tos
Creating a Multiplex without an Internet Connection
1. Log in as Administrator.
2. Need steps to get to Manage Genes.
3. Go to the Manage Genes option and perform the following:
a. Copy and paste gene name onto the Display Name field.
b. Copy and paste the gene name onto the Accession field.
NOTE The Display Name and Accession field must be the same.
IMPORTANT Do not use spaces in either the Display Name or the Accession field.
c. Copy and paste the FASTA description onto the FASTA field.
d. Copy and paste the gene sequence onto the Sequence field.
4. Click Save.
5. Repeat steps a to d for all the genes (up to 30 genes) of interest.
6. Logout as an Administrator.
7. Login as a User.
8. Open the eXpress Designer.
9. Copy and paste all the accession numbers of the genes of interest (up to 30 genes) into the Accession Numbers field.
10. Name the new multiplex.
11. Adjust the settings or keep the settings default.
12. Highlight Kanr in Reference Primers field.
13. Click Execute. A page displaying the designed multiplex will be returned.
r If the design is successful, click Save to save the multiplex to the database.
r If the design is not successful, run Verbose Mode. See "Troubleshooting Multiplex Design with Verbose Mode" on page 37.
This multiplex TDF file can be exported. The primer sequences can be viewed by opening the TDF file with Microsoft Excel.
Designing Primers to Detect Alternative TranscriptsNOTE Even if alternate transcripts have different accession numbers, the use of these different accession numbers will not necessarily generate unique amplicons in eXpress Designer.
There are two methods that can be used to generate unique amplicons:
Spanning an ExonTo detect the alternative splicing of exon2, design the forward primer on exon1 and reverse primer on exon3.
r If exon2 is not too big (< 200 nt), the same pair of primers will detect both variants (exon2-included and -excluded), which results in two distinct fragment sizes on GeXP with the same primer set.
NOTE This method will not work for the exon2-included fragment if the exon2 is too large.
r If exon2 is too big, a reverse primer on exon2 can be designed to detect exon2-included variant using the same forward primer.
GenomeLab GeXPPN A53995-AB
38

Appendix ATroubleshooting How Tos
Bridging an exon-exon JunctionTo detect an alternative 5' splice site (exon4 or exon5 spliced to exon6), design unique forward exon junction bridging primers.
To detect the exon4-exon6 transcript, design a forward primer bridging the exon4-exon6 junction. Make the same type of unique forward bridging primer for exon5-exon6 junction.
The bridging primer should have 6 to 10 bases paired with the 5' end of distal exon (exon6). The reverse primer for both variants can be the same primer directed to the distal exon (exon6). The bridge primer is preferably the forward primer because in GeXP chemistry, PCR has higher stringency conditions than RT. Thus, chances for mispriming with the forward primers containing similar sequence are reduced.
NOTE If two more amplicons share a forward or reverse primer, order the quantity of that primer as if it were unique to each amplicon.
Modifying a Previously Designed MultiplexBefore adding a new set of primers to a previously designed multiplex, first design the primer set with the Primer Design function of eXpress Designer or enter it as a Reference Primer through the Administrator module, using the Manage Primers function.
1. Log into eXpress Profiler and click eXpress Designer.
2. Click on the Load Multiplex drop-down list, then select the desired multiplex name. The primers contained in the loaded multiplex become highlighted in the Primers list field.
3. Use the Ctrl+Click function to select the new primer name to be included with the existing multiplex.
NOTE To remove a primer from the multiplex, Ctrl+Click on the primer name to clear it from the list. Multiple primers can be added or excluded.
4. Make any other changes to the multiplex as needed.
5. Enter a unique multiplex name in the Multiplex Name field.
6. Name the new settings in the Save Setting field and click Save Setting icon to save the changes in parameters.
7. Click the Execute to create the new multiplex.
To save the new multiplex to the database, click on the Save to Database. To export the new multiplex TDF file, click Export and then browse and save the file to the desired location.
Importing Two or More Plates into eXpress AnalyzerThere are two methods of importing multiple plates: combining the data or Importing multiple CSV files. In either case, each of the plates has to be set up (wells identified), peaks binned and saved separately before proceeding with Normalization.
Combining the DataBefore importing the data to eXpress Analyzer, combine all of the data, from multiple plates, into one study in Fragment Analysis and then use the Transfer Fragments for GeXP option which creates a combined CSV file. When this is imported into a New Analysis, eXpress Analyzer recognizes the separate plates.
Troubleshooting GuidePN A53995-AB
39

Appendix ATroubleshooting How Tos
1. Create a new study in Fragment Analysis and combine all of the analyzed data in that study.
2. Transfer the fragments for GeXP. This creates a combined CSV file.
3. Create a New Analysis in eXpress Analyzer.
4. Browse to select the combined CSV file.
5. Import all of the plates at one time.
6. Continue with Step 1 of Plate Setup.
Importing Multiple CSV Files
1. Create a New Analysis in eXpress Analyzer.
2. Browse to select the CSV file for each plate.
3. Import all of the plates at one time.
Plate Setup
1. Click on the Plate Setup tab and open the first plate.
2. Proceed with Plate Setup and Binning, then save the data for that plate.
3. Open the next plate and repeat steps 1 and 2.
IMPORTANT There is no visual indicator in the Plate Setup tab to show that another plate is waiting to be set up or how many plates are part of the analysis. Make sure to keep track of this information to get the desired analysis by importing multiple plates.
When steps 1 and 2 have been completed for all plates, you can proceed with normalization.
GenomeLab GeXPPN A53995-AB
40
Appendix BReference Figures
BAppendix B
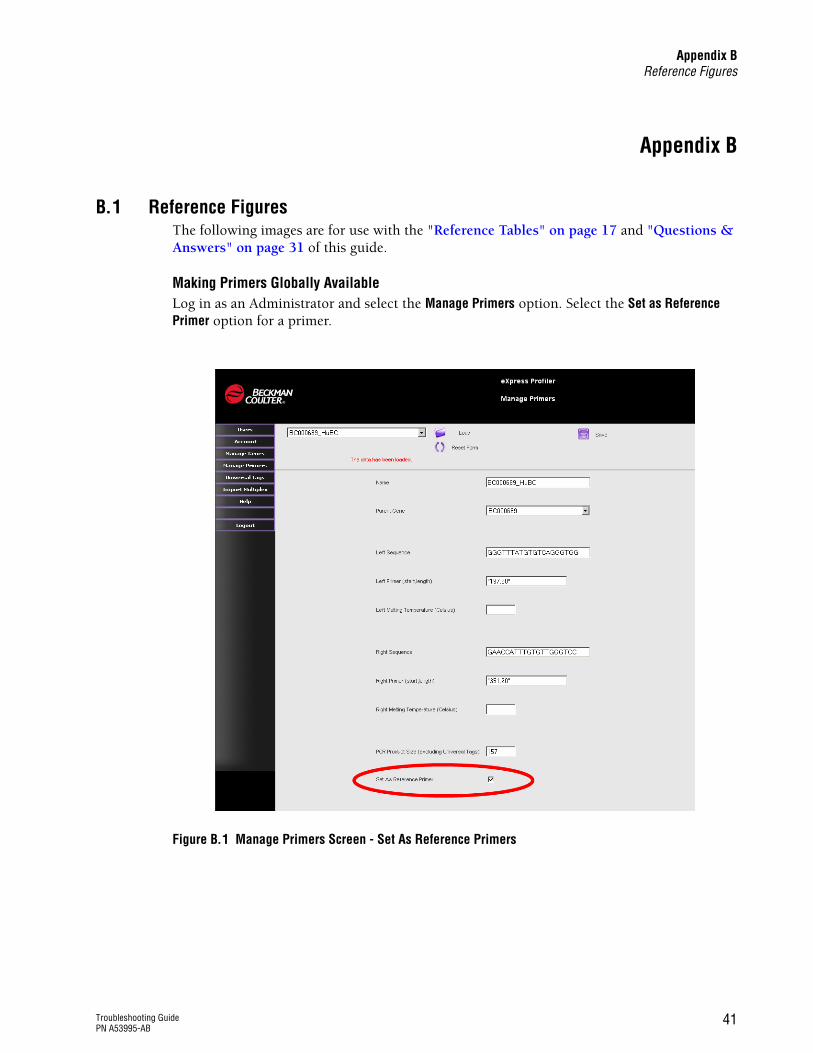
B.1 Reference FiguresThe following images are for use with the "Reference Tables" on page 17 and "Questions & Answers" on page 31 of this guide.
Making Primers Globally AvailableLog in as an Administrator and select the Manage Primers option. Select the Set as Reference Primer option for a primer.
Figure B.1 Manage Primers Screen - Set As Reference Primers
Troubleshooting GuidePN A53995-AB
41
Appendix BReference Figures
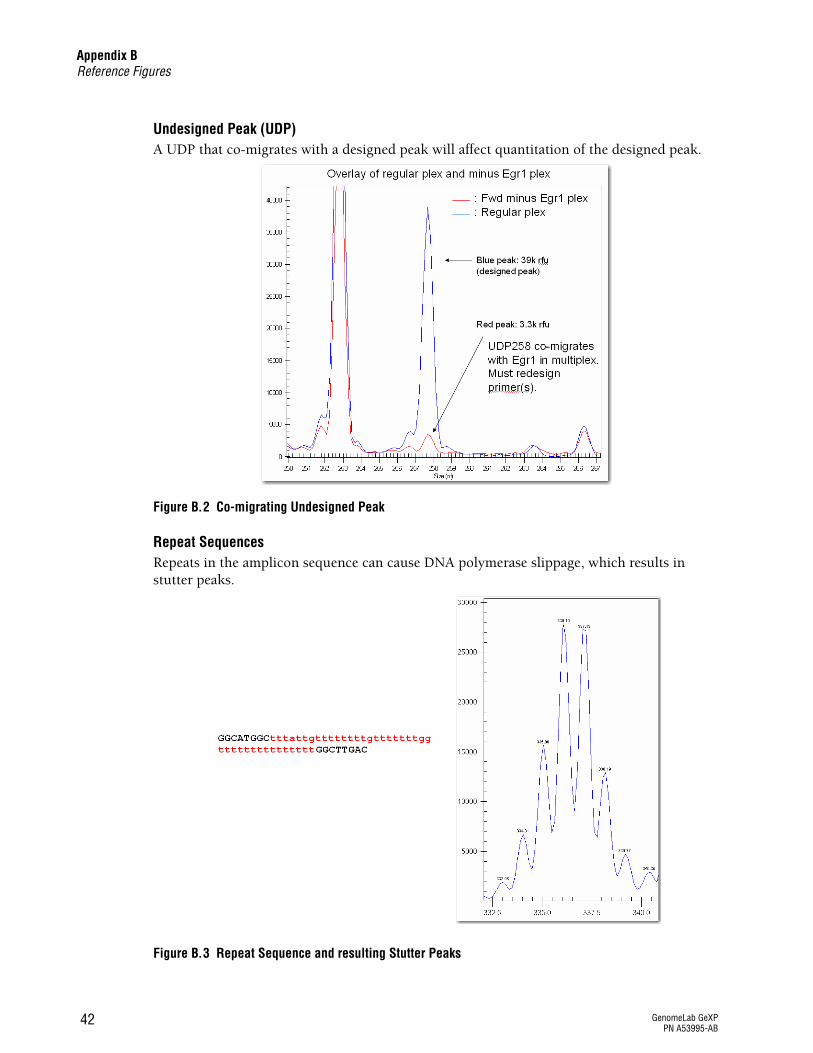
Undesigned Peak (UDP)A UDP that co-migrates with a designed peak will affect quantitation of the designed peak.
Figure B.2 Co-migrating Undesigned Peak
Repeat SequencesRepeats in the amplicon sequence can cause DNA polymerase slippage, which results in stutter peaks.
Figure B.3 Repeat Sequence and resulting Stutter Peaks
GenomeLab GeXPPN A53995-AB
42
Appendix BReference Figures
Over-range Signal in an Unbalanced ProfileA balanced multiplex profile is achieved by attenuating the reverse primer concentration of the high expressers. See Figure B.8 on page 45 for a Balanced GeXP Profile.
Figure B.4 Unbalanced GeXP Profile - Over-range
Over-range Signal in Balanced ProfileAny signal >120,000 RFU in analyzed data lies outside the linear range of detection, with standard GeXP data analysis. Pre-dilute the PCR product to bring all fragments within the linear range.
Figure B.5 Balanced GeXP Profile - Over-range
Troubleshooting GuidePN A53995-AB
43

Appendix BReference Figures
Genomic DNA ContaminationGenomic DNA contamination of RNA samples leads to the production of gene peaks in the RT minus reaction.
Figure B.6 Gene Peaks in RT minus reaction
Signal Drop-OffSmaller fragments have a much higher signal than larger fragments, due to thermal cycling temperature fluctuation.
Figure B.7 Electropherogram with Signal Drop-off
GenomeLab GeXPPN A53995-AB
44
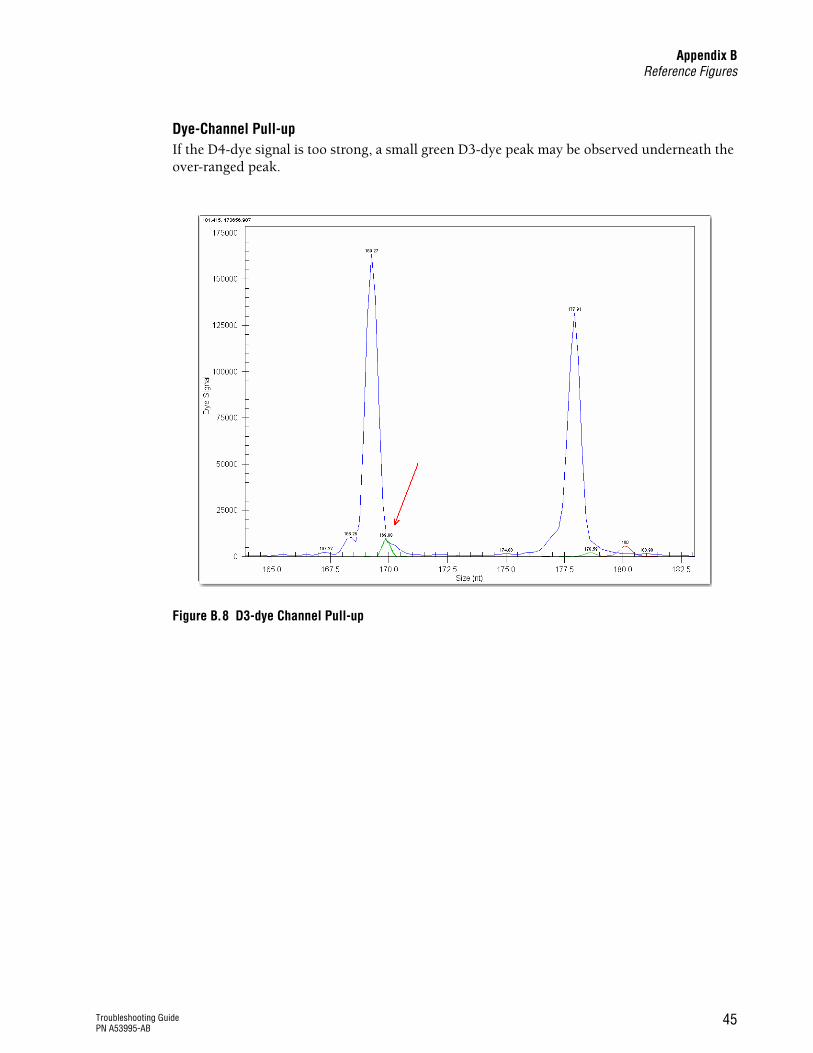
Appendix BReference Figures
Dye-Channel Pull-upIf the D4-dye signal is too strong, a small green D3-dye peak may be observed underneath the over-ranged peak.
Figure B.8 D3-dye Channel Pull-up
Troubleshooting GuidePN A53995-AB
45

Appendix BReference Figures
Unresolved Protein-Nucleic Acid ComplexA non-specific protein-nucleic acid complex will consistently migrate in a particular size region, specific to the multiplex.
Figure B.9 Unresolved Fragment
GenomeLab GeXPPN A53995-AB
46

Appendix BReference Figures
Exclusion FilterThe purpose of an exclusion filter is to exclude any data that does not meet the criteria of the study, and to include the results that do meet the criteria. The figure below demonstrates that valid peaks are not called when the wrong exclusion filter is applied.
For more information, see Chapter 7, Applying Exclusion Filters to the Fragments List in the GenomeLab Genetic Analysis System User’s Guide (A29142).
Figure B.10 Improper Exclusion Filter Applied
Figure B.11 Sample GeXP Exclusion Filters - Basic & Extensive
Troubleshooting GuidePN A53995-AB
47
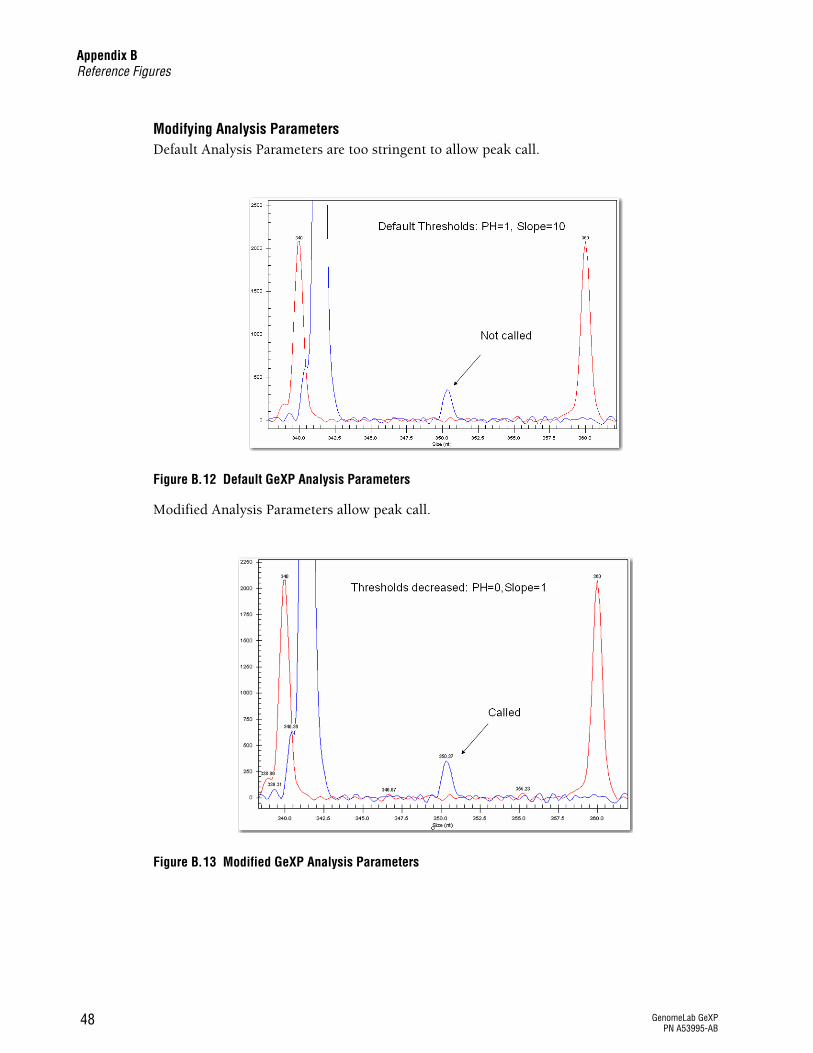
Appendix BReference Figures
Modifying Analysis ParametersDefault Analysis Parameters are too stringent to allow peak call.
Figure B.12 Default GeXP Analysis Parameters
Modified Analysis Parameters allow peak call.
Figure B.13 Modified GeXP Analysis Parameters
GenomeLab GeXPPN A53995-AB
48

Appendix BReference Figures
Split PeaksPeaks that are significantly over-range tend to “split” and be called as two peaks in the analyzed data.
Figure B.14 Split Peak
Troubleshooting GuidePN A53995-AB
49

Appendix BReference Figures
GenomeLab GeXPPN A53995-AB
50


Beckm
®
an Coulter, Inc. 4300 N. Harbor Boulevard, Box 3100 Fullerton, California 92834-3100