Loggerhead Sea Turtles Loggerhead Sea Turtles By Allison Leprell.

ORIGINAL PAPER
Genetic structure of the southeastern United States loggerheadturtle nesting aggregation: evidence of additional structurewithin the peninsular Florida recovery unit
Brian M. Shamblin • Mark G. Dodd • Dean A. Bagley • Llewellyn M. Ehrhart • Anton D. Tucker •
Chris Johnson • Raymond R. Carthy • Russell A. Scarpino • Erin McMichael • David S. Addison •
Kristina L. Williams • Michael G. Frick • Stefanie Ouellette • Anne B. Meylan • Matthew H. Godfrey •
Sally R. Murphy • Campbell J. Nairn
Received: 7 December 2009 / Accepted: 8 November 2010
� Springer-Verlag 2010
Abstract The southeastern United States supports one of
two large loggerhead turtle (Caretta caretta) nesting
aggregations worldwide and is therefore critical to global
conservation and recovery efforts for the species. Previous
studies have established the presence of four demographi-
cally distinct nesting populations (management units)
corresponding to beaches from (1) North Carolina through
northeastern Florida, (2) peninsular Florida, (3) the Dry
Tortugas, and (4) northwest Florida. Temporal and geo-
graphic genetic structure of the nesting aggregation was
examined utilizing partial mitochondrial control region
haplotype frequencies from 834 samples collected over the
2002 through 2008 nesting seasons from 19 beaches as well
as previously published haplotype data. Most rookeries did
not exhibit interannual genetic variation. However, the
interannual variation detected did significantly impact the
interpretation of spatial genetic structure in northeastern
Florida. Based on pairwise FST comparisons, exact tests of
Communicated by M. I. Taylor.
Electronic supplementary material The online version of thisarticle (doi:10.1007/s00227-010-1582-6) contains supplementarymaterial, which is available to authorized users.
B. M. Shamblin � C. J. Nairn (&)
Daniel B. Warnell School of Forestry and Natural Resources,
University of Georgia, Athens, GA 30602, USA
e-mail: [email protected]
M. G. Dodd
Georgia Department of Natural Resources,
1 Conservation Way, Brunswick, GA 31520, USA
D. A. Bagley � L. M. Ehrhart
Department of Biology, University of Central Florida,
4000 Central Florida Boulevard, Orlando, FL 32816, USA
A. D. Tucker
Mote Marine Laboratory, 1600 Ken Thompson Parkway,
Sarasota, FL 34236, USA
C. Johnson
Loggerhead Marinelife Center,
14220 US Highway 1, Juno Beach, FL 33408, USA
R. R. Carthy � R. A. Scarpino � E. McMichael
Florida Fish and Wildlife Cooperative Research Unit,
University of Florida, P.O. Box 110485, Gainesville, FL, USA
D. S. Addison
Conservancy of Southwest Florida, 1450 Merrihue Drive,
Naples, FL 34102, USA
K. L. Williams � M. G. Frick
Caretta Research Project, P.O. Box 9841, Savannah,
GA 31412, USA
S. Ouellette
Broward County Sea Turtle Conservation Program,
Nova Southeastern University Oceanographic Center,
8000 North Ocean Drive, Dania, FL 33004, USA
A. B. Meylan
Florida Fish and Wildlife Conservation Commission,
Fish and Wildlife Research Institute, 100 8th Avenue Southeast,
St. Petersburg, FL 33701, USA
M. H. Godfrey
North Carolina Wildlife Resources Commission,
1507 Ann Street, Beaufort, NC 28516, USA
S. R. Murphy
South Carolina Department of Natural Resources (retired),
PO Box 136, Sheldon, SC 29941, USA
123
Mar Biol
DOI 10.1007/s00227-010-1582-6

population differentiation, and analysis of molecular vari-
ance, the present study upholds the distinctiveness of the
four currently recognized management units and further
supports recognition of discrete central eastern, southern
(southeastern and southwestern), and central western
Florida management units. Further subdivision may be
warranted, but more intensive genetic sampling is required.
In addition, tools such as telemetry and mark-recapture are
needed to complement genetic data and overcome limita-
tions of genetic markers in resolving loggerhead turtle
rookery connectivity in the southeastern USA.
Introduction
Defining population boundaries for highly vagile marine
species often presents challenges given the lack of apparent
barriers to movement across sometimes vast spatial scales.
For some such species, natal homing behavior to specific
reproductive sites dictates population boundaries. Natal
homing to breeding sites often occurs as part of a complex
life history involving ontogenetic or seasonal migrations by
individuals that may encompass entire ocean basins, where
individuals from distinct breeding populations mix (anad-
romous salmonids, reviewed in Allendorf and Waples 1995;
many cetacean species, reviewed in Hoelzel 1998; marine
turtles, reviewed in Bowen and Karl 2007). Lohmann et al.
(2008b) proposed that both breeding salmon and marine
turtles locate natal regions via a biphasic navigation process
first involving magnetic cues to direct long distance ocean
migration to the general vicinity of the natal area. Salmon
then use local olfactory cues in choosing their target
spawning rivers (Wisby and Hasler 1954); however, the
local cues driving fine-scale nesting beach selection by
marine turtles are less well understood (Lohmann et al.
2008b). As such, the precise scale of natal philopatry
remains unresolved for many marine turtle species and may
vary across nesting populations within species depending
on local biotic and abiotic conditions. The presence of long
stretches of suitable nesting habitat along continental
coastlines further complicates assessments of population
structure for marine turtles. Nonetheless, given that
migratory reproductive behavior contributes significantly to
patterns of population structure for these species, properly
defining the scale of natal homing behavior is critical to
ensuring that demographically discrete populations receive
adequate recognition and protection.
Loggerhead sea turtles occur globally in warm temper-
ate and tropical waters, though nesting effort is typically
focused on warm temperate beaches (Bolten 2003). Log-
gerhead turtles nesting in the western North Atlantic have a
complex life history marked by extensive developmental
migrations and seasonal migrations. Genetic analyses and
size frequency data have provided strong evidence that
loggerhead turtles originating from western North Atlantic
beaches spend their early years as pelagic foragers in the
eastern Atlantic (Bolten et al. 1998). Broad-scale natal
homing by neritic juveniles is supported by mixed stock
analysis of several aggregations foraging along the conti-
nental shelf of the eastern United States (Bowen et al.
2004). Upon reaching sexual maturity, females migrate to
their natal regions to nest (Bowen et al. 1993; Bowen et al.
1994; Bowen et al. 2005). Defining the spatial scale of this
natal neighborhood is an important consideration for
delimiting population boundaries, particularly across con-
tinuous nesting habitats.
The southeastern United States of America (USA) log-
gerhead turtle nesting aggregation is one of two globally
significant nesting populations, the other being Masirah
and other islands along the coast of Oman in the Arabian
Sea (Dodd 1988; Baldwin et al. 2003). Loggerhead turtle
nesting densities vary considerably over the southeastern
USA coastline; approximately 69% of the loggerhead turtle
nesting in Florida takes place on 411 km of the 1,300 km
of surveyed beaches (Witherington et al. 2009). Annual
mean nest numbers on Florida’s index nesting beaches
declined by approximately 44% from 1998 through 2006
(Witherington et al. 2009), prompting concern that the
largest nesting population in the Atlantic may be in decline.
In the USA, management and protection of loggerhead
turtles is jointly the responsibility of National Oceano-
graphic and Atmospheric Administration’s National Mar-
ine Fisheries Service (NMFS) and the United States Fish
and Wildlife Service (USFWS). Defining the boundaries of
nesting populations for management and conservation
purposes is a critical element of the recently updated
Recovery Plan for the Northwest Atlantic Population of the
Loggerhead Sea Turtle (Caretta caretta) (hereafter
Recovery Plan, NMFS and USFWS 2008).
Numerous concepts have been proposed to identify and
classify intra-specific units for conservation or management
purposes, and many of these incorporate genetic data
(reviewed in Fraser and Bernatchez 2001). Management
units, as defined by Moritz (1994), have formed the basis of
characterizing loggerhead turtle population structure in the
Atlantic basin (Encalada et al. 1998; Bowen et al. 2005).
Management units ‘‘represent populations connected by
such low gene flow that they are functionally independent’’
and are ‘‘recognized as populations with significant diver-
gence of allele frequencies at nuclear or mitochondrial loci’’
(Moritz 1994). In the case of marine turtle populations,
rookeries are demographically distinct entities based on
female natal philopatry, irrespective of the level of nuclear
gene flow (Avise 1995; Bowen et al. 2005). Thus, significant
divergence of mitochondrial haplotype frequencies between
rookeries suggests demographic partitioning, which
Mar Biol
123

qualifies each rookery as a distinct management unit. For the
purposes of the Recovery Plan, the Atlantic Loggerhead Sea
Turtle Recovery Team chose to designate intra-specific
conservation units known as recovery units. ‘‘Recovery
units are subunits of the listed species that are geographi-
cally or otherwise identifiable and essential to the recovery
of the species. Recovery units are individually necessary to
conserve genetic robustness, demographic robustness,
important life history stages, or some other feature necessary
for long-term sustainability of the species’’ (NMFS and
USFWS 2008). Genetic data have been used as the basis for
recovery unit designations where such data are available
(NMFS and USFWS 2008). We will use ‘‘management unit’’
to describe demographically and genetically distinct nesting
populations in the spirit of Moritz (1994) and ‘‘recovery
unit’’ only in the context of agency designations outlined
above.
Genetic structure among rookeries comprising the
southeastern USA loggerhead turtle nesting aggregation
has received considerable attention. Restriction fragment
length polymorphism analyses of mitochondrial DNA
provided strong support for regional natal homing by log-
gerhead turtles and established the presence of at least two
distinct populations nesting in the USA (Bowen et al. 1993;
Bowen et al. 1994). Based on significant differences in
frequencies of sequence-defined haplotypes and geographic
considerations, Encalada et al. (1998) proposed a minimum
of three demographically independent nesting populations
in the southeastern USA corresponding to beaches from (1)
North Carolina through northeast Florida, (2) central and
southern peninsular Florida, and (3) northwest Florida.
Pearce (2001) analyzed mitochondrial haplotype frequen-
cies and allele frequencies at five microsatellite loci of the
original and additional southeastern USA samples. Mito-
chondrial control region analysis supported previous
management unit groupings and added the Dry Tortugas
rookery as a distinct management unit (Pearce 2001).
Structure inferred from nuclear markers was much weaker
than structure inferred from mitochondrial markers, pre-
sumably due to weaker natal philopatry in some males or
male-mediated gene flow facilitated by turtles from
different rookeries mixing along migration routes or on
foraging grounds (Pearce 2001; Bowen et al. 2005). Male-
mediated gene flow does not detract from the classification
of rookeries as independent populations given the fact that
female natal site fidelity defines reproductive population
boundaries, irrespective of male behavior (Bowen et al.
2005).
Whereas geographic structure among rookeries has been
clearly demonstrated in several marine turtle species using
mitochondrial DNA tools (reviewed in Bowen and Karl
2007), it is uncertain whether temporal variation in mito-
chondrial haplotype frequencies at rookeries may also
occur. Undetected temporal variation in haplotype fre-
quencies at rookeries could affect the interpretation of
spatial structuring among rookeries as well as the integrity
of estimates of rookery contributions to juvenile foraging
aggregations. Explicit tests of interannual variation in
haplotype frequencies have been conducted at a few marine
turtle rookeries, and none have detected any statistically
significant temporal structuring. Hatase et al. (2002) did
not detect significant haplotype frequency variation
between two sampling years at four Japanese loggerhead
turtle rookeries. The pooled sample was dominated by a
single haplotype (Haplotype B = 89%, Hatase et al. 2002),
potentially limiting the power to detect any temporal dif-
ferences. Tests for intraseasonal and interannual variation
in haplotype frequencies among green turtles nesting at
Tortuguero, Costa Rica also failed to detect any significant
temporal structuring (Bjorndal et al. 2005). However, the
authors cautioned that the results should be tempered by
the recognition that the tests likely had low statistical
power given the high frequency of the common haplotype
(CM-A3 [ 90%, Bjorndal et al. 2005). Similarly, no sig-
nificant interannual variation was found at the Mona Island
hawksbill turtle rookery sampled in 1993, 2003, 2004, and
2005 (Velez-Zuazo et al. 2008). Whether haplotype fre-
quencies are stable at relatively low-density rookeries is
unclear, and temporal variation may have important
implications for spatial structuring and management unit
designations for the southeastern United States loggerhead
turtle nesting aggregation given the wide range of nesting
densities at different rookeries.
Despite increased resolution with each previous investi-
gation, questions of management interest remain regarding
genetic structure among rookeries along the southeastern
USA coast. The Recovery Plan currently recognizes four
recovery units nesting in the southeastern United States
roughly concordant with previous genetic analyses: (1) the
northern recovery unit corresponding to beaches from Vir-
ginia through the Georgia/Florida border, (2) the peninsular
Florida recovery unit, corresponding to all eastern Florida
beaches and those in central and southwestern Florida, (3)
the Dry Tortugas in the Gulf of Mexico off the southwest
coast of Florida, and (4) the northern Gulf of Mexico
recovery unit, corresponding to beaches in northwestern
Florida through the Texas/Mexico border (NMFS and
USFWS 2008). It is uncertain whether these recovery units
adequately reflect the level of genetic differentiation present
among rookeries within the southeastern USA nesting
aggregation given low power to detect frequency differences
based on small sample sizes for some rookeries. Given that
local threats to females concentrated in the vicinity of their
nesting beaches will have pinpoint impact on the corre-
sponding nesting population (Bowen et al. 2005), it is critical
to recognize genetic structuring and define management
Mar Biol
123

units at appropriate spatial scales. An important unresolved
question is determining whether a precise boundary exists
between the northern management unit and the remaining
Florida rookeries. Encalada et al. (1998) anticipated the
boundary would occur between Cape Canaveral and Jack-
sonville based on an established biogeographic discontinuity
and the sharp decline in loggerhead turtle nesting density
north of Canaveral. Initial analysis of samples obtained from
Volusia County suggested that this nesting population rep-
resented a distinct management unit (Francisco et al. 1999).
However, pairwise Volusia County and Melbourne popula-
tion comparisons based on a larger Melbourne sample size
were not significantly different, prompting Pearce (2001) to
include Volusia County within the South Florida manage-
ment unit.
We re-assessed population genetic structure among
rookeries in the southeastern USA loggerhead turtle nesting
aggregation by sequencing of a portion of the mitochon-
drial control region of 834 samples collected during the
2002–2008 nesting and hatching seasons to: (1) test for
interannual variation in haplotype frequencies at individual
rookeries, (2) determine the number of management units
comprising the southeastern US nesting aggregation and
identify potential boundaries, and (3) compare the recovery
unit groupings designated in the Recovery Plan with the
structure suggested by haplotype frequency and demo-
graphic data.
Methods
Field methods
Samples from 834 individual loggerhead turtles or nests
were collected from 19 different southeastern USA beach
locations over the 2002–2008 nesting seasons (Table 1).
Sample sites were chosen to represent the extent of log-
gerhead turtle nesting in the USA where nesting densities
were sufficient to provide adequate sample sizes (Figs. 1
and 2). Sites typically included the highest density nesting
beaches within each respective region. Each rookery is
represented by either samples obtained directly from
nesting females or by nest contents obtained during post-
emergence nest evaluations. Samples from nesting females
were collected from the shoulder region using 6-mm
biopsy punches following oviposition and during the nest
covering and camouflaging process. Precautions were
taken to ensure that each nesting female was represented in
each annual dataset only once, either via tagging to prevent
duplicate sampling, or by using microsatellite genotyping
that would allow recognition of individual turtles (Sham-
blin et al. 2007, 15 loci, microsatellite data not shown).
Nest samples were comprised of tissue from dead hatch-
lings or hatched eggshells collected during post-emergence
nest evaluations, and each nest was represented by a single
sample. Sampled clutches were laid June 15 through June
Table 1 Sample site and collection data for samples collected as part of the present study
Site code Sample site Sample size Year Sample type
BHI Bald Head Island, Brunswick County, North Carolina 15 2006 Femalea
CAP Cape Island, Charleston County, South Carolina 53 2006 Female
WAS Wassaw Island, Chatham County, Georgia 42 2005, 2006 Female
AML Amelia Island, Nassau County, Florida 20 2006, 2008 Nestb
SJC St. Johns County, Florida 37 2007, 2008 Nest
FLG Flagler County, Florida 55 2007, 2008 Nest
VOL Northern Volusia County, Florida 90 2006–2008 Nest
NSB New Smyrna Beach, Volusia County, Florida 46 2006, 2008 Nest
CAN Canaveral National Seashore, Volusia County, Florida 58 2006 Female
MEL Melbourne Beach, Brevard County, Florida 106 2006 Female
JUN Juno Beach, Palm Beach County, Florida 49 2006 Female
FTL Ft. Lauderdale, Broward County, Florida 48 2006 Nest
SBR Hollywood and John U. Lloyd State Park, Broward County, Florida 21 2006 Nest
MID Virginia Key and Cape Florida State Park, Miami-Dade County, Florida 22 2006 Nest
KEY Keewaydin Island, Collier County, Florida 40 2006 Female
CSK Casey Key, Sarasota County, Florida 57 2006 Female
SGI St. George Island, Franklin County, Florida 13 2006 Nest
CSB Cape San Blas, Gulf County, Florida 47 2002–2005 Female
STJ St. Joseph Peninsula State Park, Gulf County, Florida 15 2006 Nest
a Female samples were collected as biopsy punchesb Nest samples were dead hatchling tissue or hatched egg shells
Mar Biol
123

24, 2006; June 15 through June 24, 2007; and June 17
through June 26, 2008. A 10-day sampling window was
chosen to maximize sample sizes while minimizing the
probability of re-sampling females. The average inter-
nesting interval for southeastern USA loggerhead turtles is
approximately 14 days, with females rarely re-nesting at
fewer than 11 days (reviewed in Dodd 1988). Samples
were stored in 95% ethanol prior to DNA extraction.
Laboratory methods
Genomic DNA was extracted using the DNeasy blood and
tissue kit (QIAGEN) following standard protocols. Poly-
merase chain reaction (PCR) amplifications of a 380 bp
portion of the mitochondrial control region were carried
out using primers TCR5 and TCR6 (Norman et al. 1994).
Universal M13 primer sequences were added to the 50 end
of each PCR primer to facilitate sequencing. PCR reactions
were carried out in 10 ll volumes containing 10 mM Tris,
pH 8.4; 50 mM KCl, 1.0 lM of each primer, 1.5 mM
MgCl2, 0.5 mM dNTPs, 0.5 unit of Taq DNA Polymerase,
and approximately 25–75 ng of genomic DNA. PCR
cycling parameters were as follows: 95�C for 3 min;
30 cycles of 95�C for 30 s, 50�C for 30 s, 72�C for 30 s;
and a final extension of 72�C for 10 min. PCR products
were purified by adding 2 ll of ExoSAP-IT� (USB Cor-
poration) to 7 ll of PCR amplicon and incubated according
to manufacturer’s instructions. The mtDNA amplicons
were sequenced in both directions using ABI BigDye v3.1
(PE Applied Biosystems) and an ABI 3730xl DNA Ana-
lyzer. Negative controls were included in each batch of
PCR amplifications and sequencing reactions to detect
contamination.
Data analysis
Sequences were aligned, edited, and compared to previously
described haplotypes using the program Sequencher 4.2
(Gene Codes Corporation). Sequences were assigned hap-
lotype designations after nomenclature published on the
Archie Carr Center for Sea Turtle Research (ACCSTR)
website (http://accstr.ufl.edu/ccmtdna.html). Samples pro-
ducing novel or ambiguous sequences were subjected to a
second round of DNA extraction, PCR amplification, and
sequencing for verification. Novel haplotypes were depos-
ited with Genbank and ACCSTR. Haplotype frequency data
from Encalada et al. (1998); Francisco et al. (1999); Pearce
(2001), and Bowen et al. (2005) were included in analyses to
test for temporal variation and to fill in the geographic gap at
Dry Tortugas for the present study (Supplemental Table 1).
Haplotype diversity (h), nucleotide diversity (p), pair-
wise FST comparisons, pairwise exact tests of population
differentiation, and analysis of molecular variance
(AMOVA) were conducted using the software Arlequin
version 3.1 (Excoffier et al. 2005). Haplotype diversity was
estimated based on Nei (1987). Nucleotide diversity was
calculated assuming the model of Tamura and Nei (1993).
Significance values for AMOVA were obtained from
10,000 permutations. Exact tests of population differentia-
tion were conducted with 100,000 permutations and 10,000
dememorization steps after the method of Raymond and
Rousset (1995). These statistics were used to test for tem-
poral as well as spatial structure. For the purposes of tem-
poral tests, BHI samples were compared with previously
collected samples from Bald Head Island, Cape Lookout,
Topsail Beach, Camp Lejeune, and Caswell Beach (NC,
Encalada et al. 1998); WAS samples were compared with
previously collected samples from Little Cumberland and
Cumberland islands, Georgia (SGA, Encalada et al. 1998);
CSK was compared with samples previously collected more
broadly in Sarasota County (SAR, Encalada et al. 1998;
Pearce 2001); and SBR was compared with samples pre-
viously collected near the Port Everglades inlet (PEV,
Pearce 2001). All interannual samples for each site that
were not significantly different were pooled for spatial
analyses. Because nest samples represent unknown turtles,
combining sample sets across more then two consecutive
years may have resulted in individual nesting females being
represented in the dataset more than once.
Following pairwise FST comparisons and exact tests of
population differentiation, all proximal sample sites that
were not significantly different were pooled for further
North Carolina
SouthCarolina
Georgia
BHI
CAP
WAS
Florida
SGA
southeastern FL
?
?
central eastern FLnorthwestern FL
central western FL
southwestern FL
Dry Tortugas
?
?
northern managementunit
150 km
Fig. 1 Sample locations and haplotype distributions for northern
sampled rookeries of southeastern USA loggerhead turtles. Regional
rookery groupings discussed in the text are outlined in dashed lines.
The currently recognized peninsular Florida recovery unit is outlined
by a dotted line. See Fig 2 for Florida sample sites and haplotype
frequency pie charts
Mar Biol
123

analyses. In the case of ambiguous pairwise comparisons,
several a priori sample-clustering iterations were per-
formed and examined using pairwise tests and AMOVA.
Optimal rookery clusters were chosen by maximizing FCT
(genetic variation occurring among management units) and
minimizing FSC (genetic variation occurring among sam-
pled rookeries within defined management units) in an
AMOVA framework. Significance of the final round of
pairwise FST comparisons and exact tests of population
differentiation were adjusted using sequential Bonferroni
correction with a table-wide a of 0.05 (Rice 1989).
Results
Haplotype and nucleotide diversity
Sequence analysis of newly collected samples identified
thirty polymorphic positions, corresponding to 22 transitions
and eight indels (Table 2). Position 358 contained both an
indel and a transition. The variable positions resolved nine
haplotypes, eight of which have previously been described
from loggerhead turtles nesting in Florida (Bowen et al.
2005). The new haplotype contained an A to G transition at
position 119 and has been designated CC-A43 (Genbank
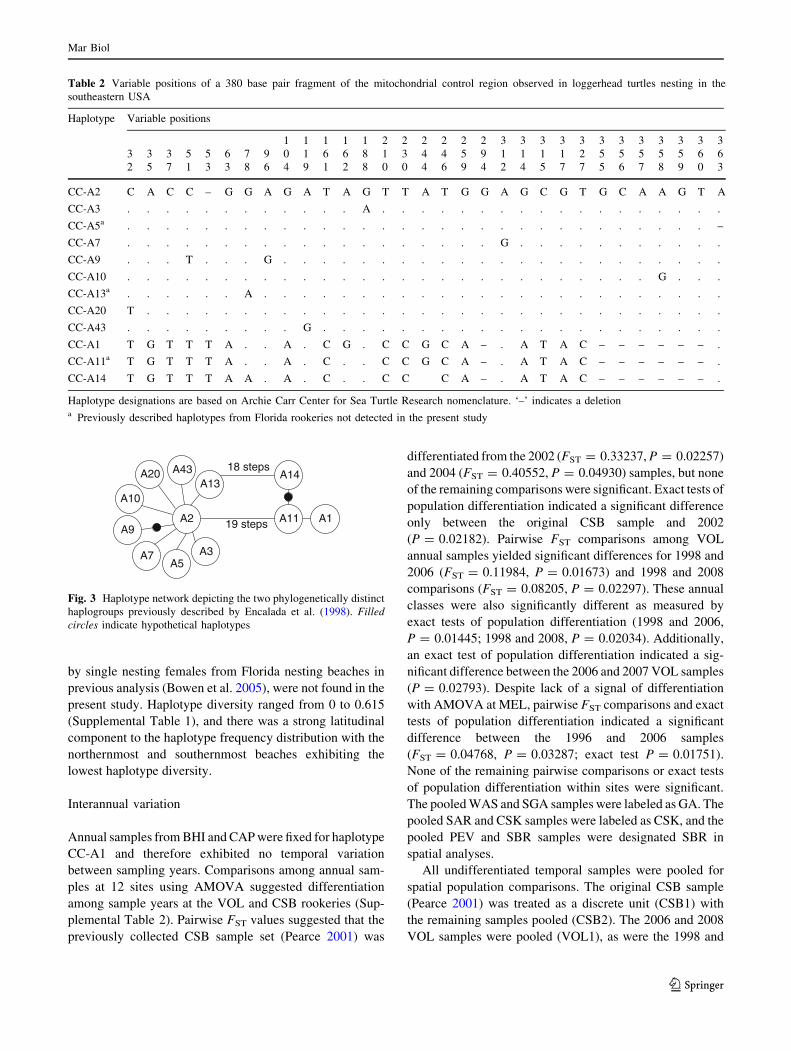
accession number EF396287). All 12 haplotypes in the
pooled dataset belonged to two phylogenetically distinct
haplogroups (Fig. 3) as previously described by Encalada
et al. (1998).
Haplotypes CC-A1 and CC-A2 accounted for approxi-
mately 94% of all individuals sampled, but these haplotypes
were not randomly distributed (Supplemental Table 1).
Haplotype CC-A9, previously described from Quintana
Roo, Mexico, and the Dry Tortugas, was detected for the first
time on mainland Florida Gulf coast nesting areas. Haplo-
type CC-A14, previously described from peninsular Florida
beaches, was detected among northwest Florida samples.
Haplotypes CC-A5, CC-A11, and CC-A13, each represented
DRT
CSK
KEY
AML
SJC
FLG
MEL1
JUN
FTL
SBR
MID
SGI
CSB2
STJ
Gulf Coast
Atlantic Coast
Florida
50 km
MEL2
VOL2VOL1
NSB
CAN
CSB1
20 km
Fig. 2 Sample locations and partial mitochondrial control region
haplotype frequencies for Florida loggerhead turtle rookeries based on
combined haplotype frequency data from the present study and
previous studies. Site abbreviations are explained in Table 1.
Northeastern Florida data are highlighted in the inset map
Mar Biol
123
by single nesting females from Florida nesting beaches in
previous analysis (Bowen et al. 2005), were not found in the
present study. Haplotype diversity ranged from 0 to 0.615
(Supplemental Table 1), and there was a strong latitudinal
component to the haplotype frequency distribution with the
northernmost and southernmost beaches exhibiting the
lowest haplotype diversity.
Interannual variation
Annual samples from BHI and CAP were fixed for haplotype
CC-A1 and therefore exhibited no temporal variation
between sampling years. Comparisons among annual sam-
ples at 12 sites using AMOVA suggested differentiation
among sample years at the VOL and CSB rookeries (Sup-
plemental Table 2). Pairwise FST values suggested that the
previously collected CSB sample set (Pearce 2001) was
differentiated from the 2002 (FST = 0.33237, P = 0.02257)
and 2004 (FST = 0.40552, P = 0.04930) samples, but none
of the remaining comparisons were significant. Exact tests of
population differentiation indicated a significant difference
only between the original CSB sample and 2002
(P = 0.02182). Pairwise FST comparisons among VOL
annual samples yielded significant differences for 1998 and
2006 (FST = 0.11984, P = 0.01673) and 1998 and 2008
comparisons (FST = 0.08205, P = 0.02297). These annual
classes were also significantly different as measured by
exact tests of population differentiation (1998 and 2006,
P = 0.01445; 1998 and 2008, P = 0.02034). Additionally,
an exact test of population differentiation indicated a sig-
nificant difference between the 2006 and 2007 VOL samples
(P = 0.02793). Despite lack of a signal of differentiation
with AMOVA at MEL, pairwise FST comparisons and exact
tests of population differentiation indicated a significant
difference between the 1996 and 2006 samples
(FST = 0.04768, P = 0.03287; exact test P = 0.01751).
None of the remaining pairwise comparisons or exact tests
of population differentiation within sites were significant.
The pooled WAS and SGA samples were labeled as GA. The
pooled SAR and CSK samples were labeled as CSK, and the
pooled PEV and SBR samples were designated SBR in
spatial analyses.
All undifferentiated temporal samples were pooled for
spatial population comparisons. The original CSB sample
(Pearce 2001) was treated as a discrete unit (CSB1) with
the remaining samples pooled (CSB2). The 2006 and 2008
VOL samples were pooled (VOL1), as were the 1998 and
Table 2 Variable positions of a 380 base pair fragment of the mitochondrial control region observed in loggerhead turtles nesting in the
southeastern USA
Haplotype Variable positions
1 1 1 1 1 2 2 2 2 2 2 3 3 3 3 3 3 3 3 3 3 3 3
3 3 3 5 5 6 7 9 0 1 6 6 8 1 3 4 4 5 9 1 1 1 1 2 5 5 5 5 5 6 6
2 5 7 1 3 3 8 6 4 9 1 2 8 0 0 4 6 9 4 2 4 5 7 7 5 6 7 8 9 0 3
CC-A2 C A C C – G G A G A T A G T T A T G G A G C G T G C A A G T A
CC-A3 . . . . . . . . . . . . A . . . . . . . . . . . . . . . . . .
CC-A5a . . . . . . . . . . . . . . . . . . . . . . . . . . . . . . –
CC-A7 . . . . . . . . . . . . . . . . . . . G . . . . . . . . . . .
CC-A9 . . . T . . . G . . . . . . . . . . . . . . . . . . . . . . .
CC-A10 . . . . . . . . . . . . . . . . . . . . . . . . . . . G . . .
CC-A13a . . . . . . A . . . . . . . . . . . . . . . . . . . . . . . .
CC-A20 T . . . . . . . . . . . . . . . . . . . . . . . . . . . . . .
CC-A43 . . . . . . . . . G . . . . . . . . . . . . . . . . . . . . .
CC-A1 T G T T T A . . A . C G . C C G C A – . A T A C – – – – – – .
CC-A11a T G T T T A . . A . C . . C C G C A – . A T A C – – – – – – .
CC-A14 T G T T T A A . A . C . . C C C A – . A T A C – – – – – – .
Haplotype designations are based on Archie Carr Center for Sea Turtle Research nomenclature. ‘–’ indicates a deletiona Previously described haplotypes from Florida rookeries not detected in the present study
A1A11A2
A5A3A7
A9
A10
A20 A43A13
19 steps
A1418 steps
Fig. 3 Haplotype network depicting the two phylogenetically distinct
haplogroups previously described by Encalada et al. (1998). Filledcircles indicate hypothetical haplotypes
Mar Biol
123

2007 samples (VOL2). Pooling of MEL annual samples
was ambiguous as haplotype frequencies of the oldest
sample (Encalada et al. 1998) were not different from those
of 1996 or 2006. Because this sample was so small (n = 6)
relative to nesting effort ([450 nests/km; NMFS and
USFWS 2008) and compared with the other year samples,
it was excluded from spatial analysis. The 1996 and 2006
MEL samples were treated as discrete sample units for
spatial analysis (MEL1 and MEL2, respectively).
Population structure
With all sample sites treated discretely, including two
temporal samples each from VOL, MEL, and CSB, there
were 23 sample units. Among the 253 pairwise compari-
sons, 170 of the pairwise FST comparisons and 166 of the
exact tests of population differentiation were significant
without correction for multiple tests (Table 3). Most non-
significant comparisons were between adjacent sample
sites within regions, between sites at similar latitude across
the axis of the Florida peninsula, or involved a site with
small sample size (n \ 20). Haplotype frequencies pro-
duced a slightly skewed mirror image across the axis of the
Florida peninsula with rookeries paired across northwest
and northeast Florida, central western and central eastern
Florida, and southwestern and southeastern Florida having
similar and not significantly different haplotype frequen-
cies, in these respective pairings (Table 3, Fig. 2). Results
from pairwise FST comparisons and exact tests of popula-
tion differentiation were generally consistent with seven
regional groupings: (1) North Carolina through Georgia,
(2) northeastern Florida, (3) central eastern Florida, (4)
southeastern and southwestern Florida, (5) Dry Tortugas,
(6) central western Florida, and (7) northwestern Florida.
Some proximal inter-regional comparisons produced
ambiguous results with all sample sites treated discretely.
Haplotype frequencies of CSB1 and SGI from northwest
Florida were not significantly different from those of CSK in
central western Florida in pairwise FST comparisons. None
of the haplotype frequencies of the small sample units from
northwest Florida (SGI, CSB1, and STJ) were significantly
different from those of CSK in central western Florida with
respect to exact tests of population differentiation. Addi-
tionally, frequencies at MID in southeastern Florida were not
significantly different from frequencies at DRT in the Gulf of
Mexico with an exact test. To address whether these ambi-
guities were related to small sample sizes, iterations of
pairwise comparisons were performed with alternative
a priori sample site clustering to determine the most appro-
priate regional groupings for final comparisons. Compari-
sons for combined SGI/CSB2 versus CSK and combined
SGI/CSK versus CSB2 were both significant, but the former
comparison yielded the stronger signal of differentiation
(pairwise FST = 0.12756, P \ 0.00001; exact test
P = 0.00063, compared with pairwise FST = 0.10946,
P = 0.00098; exact test P = 0.00664). Combined STJ/
CSB2 versus CSK yielded a stronger signal of differentiation
(exact test P = 0.00017) than did combined STJ/CSK ver-
sus CSB2 (exact test P = 0.02103). Combined CSB1/CSK
versus CSB2 yielded a stronger signal of differentiation than
did combined CSB1/CSB2 versus CSK (FST = 0.13670,
P = 0.00098; exact test P \ 0.00001, compared with
FST = 0.09814, P \ 0.00001; exact test P = 0.00735).
However, as CSB1 was clearly an outlier relative to more
recent sample sets from CSB and other rookeries in the
region, CSB1 was pooled with all other northwest Florida
samples. The SBR versus combined MID/DRT test was not
significantly different (exact test P = 0.15578), whereas
combined SBR/MID haplotype frequencies were signifi-
cantly different from frequencies at DRT (exact test
P = 0.00442).
Regional affiliation of the northeast Florida sample units
was not clear (Table 3). Haplotype frequencies at AML were
not different from those of any sample units north of VOL.
Haplotype frequencies of SJC, FLG, and VOL1 were sig-
nificantly different from those of the northern rookeries and
CAN, MEL1, and MEL2 to the south. Haplotype frequencies
of VOL2 and NSB were significantly different from those of
AML and rookeries north, but not from those of SJC or FLG
to the north or CAN and MEL2 to the south. Therefore, there
were no clear boundaries as haplotype frequencies transi-
tioned clinally. To resolve the most appropriate rookery
clustering, several iterations of AMOVA were performed for
two cases: (1) recognition of a distinct northeastern Florida
management unit and (2) absorption of this region into
northern and central eastern Florida management units.
Clustering of remaining rookeries was consistent with
results from pairwise tests and held constant across all
AMOVA iterations: northern sites (NC, CAP, GA); central
eastern Florida (CAN, MEL); southern Florida (JUN, FTL,
SBR, MID, and KEY); the Dry Tortugas (DRT); central
western Florida (CSK); and northwestern Florida (SGI,
CSB, and STJ). A total of 16 rookery-clustering scenarios
were considered (Supplemental Table 3).
With no northeastern Florida management unit recog-
nized, the optimal clustering was achieved by placing
AML, SJC, FLG, and VOL1 within the northern manage-
ment unit and placing VOL2 and NSB within the central
eastern Florida group (scenario NEFL 5, Supplemental
Table 4). With recognition of a northeastern Florida man-
agement unit, the optimal clustering was produced by
grouping SJC, FLG, and VOL1 samples into a northeastern
Florida management unit while AML was grouped with the
northern management unit and VOL2 and NSB were
grouped with CAN and MEL (scenario NEFL 15, Sup-
plemental Table 4). In both these cases, VOL is split into
Mar Biol
123

Table 3 Pairwise FST values for discrete rookery sample comparisons (above the diagonal) and P values of exact tests of population differ-
entiation (below the diagonal)
NC CAP GA AML SJC FLG VOL1 VOL2 NSB CAN MEL1 MEL2 JUN
NC 0.000 -0.009 0.009 0.081 0.098 0.046 0.201 0.136 0.255 0.407 0.185 0.608
CAP 0.9990 -0.002 0.029 0.120 0.134 0.069 0.250 0.177 0.314 0.488 0.220 0.675
GA 0.9990 1.0000 -0.010 0.089 0.109 0.052 0.238 0.159 0.302 0.481 0.210 0.675
AML 0.4473 0.3048 0.4745 0.016 0.035 0.006 0.136 0.073 0.182 0.317 0.131 0.537
SJC 0.0147 0.0031 0.0124 0.6174 -0.017 -0.016 0.048 0.002 0.083 0.199 0.052 0.437
FLG 0.0117 0.0012 0.0022 0.2533 0.6427 0.006 0.035 -0.006 0.067 0.187 0.038 0.437
VOL1 0.0420 0.0022 0.0167 0.8286 0.9261 0.1386 0.089 0.031 0.130 0.262 0.090 0.497
VOL2 \0.0001 \0.0001 \0.0001 0.0162 0.1203 0.2470 0.0008 0.001 -0.010 0.044 -0.011 0.263
NSB 0.0010 \0.0001 0.0002 0.1512 0.5205 0.8228 0.0332 0.7695 0.021 0.114 0.006 0.359
CAN \0.0001 \0.0001 \0.0001 0.0031 0.0357 0.0403 0.0006 0.7812 0.3852 0.013 -0.009 0.215
MEL1 \0.0001 \0.0001 \0.0001 0.0004 0.0007 0.0006 \0.0001 0.0484 0.0035 0.4102 0.045 0.091
MEL2 \0.0001 \0.0001 \0.0001 0.0089 0.0893 0.1446 0.0001 0.5723 0.2587 0.7459 0.0257 0.270
JUN \0.0001 \0.0001 \0.0001 \0.0001 \0.0001 \0.0001 \0.0001 \0.0001 \0.0001 \0.0001 0.0065 \0.0001
FTL \0.0001 \0.0001 \0.0001 \0.0001 \0.0001 \0.0001 \0.0001 \0.0001 \0.0001 0.0002 0.0160 0.0006 0.2410
SBR \0.0001 \0.0001 \0.0001 \0.0001 \0.0001 \0.0001 \0.0001 \0.0001 \0.0001 0.0000 0.0276 \0.0001 0.3013
MID \0.0001 \0.0001 \0.0001 \0.0001 \0.0001 \0.0001 \0.0001 0.0002 \0.0001 0.0033 0.1536 0.0005 0.6941
DRT \0.0001 \0.0001 \0.0001 \0.0001 \0.0001 \0.0001 \0.0001 \0.0001 \0.0001 \0.0001 \0.0001 \0.0001 0.0012
KEY \0.0001 \0.0001 \0.0001 \0.0001 0.0002 \0.0001 \0.0001 0.0008 \0.0001 0.0058 0.2299 0.0005 0.0303
CSK \0.0001 \0.0001 \0.0001 0.0015 0.0615 0.0152 0.0004 0.1951 0.0432 0.2506 0.0423 0.0971 \0.0001
SGI 0.0557 0.0213 0.0486 0.1979 0.8246 0.5718 0.6252 0.4508 0.5709 0.2486 0.0762 0.3370 0.0003
CSB1 0.0020 0.0004 0.0008 0.0148 0.1098 0.1850 0.0348 0.5760 0.3819 0.7650 1.0000 0.5584 0.5431
CSB2 0.1289 0.0193 0.0622 1.0000 0.8193 0.3461 0.7359 0.0098 0.1104 0.0014 \0.0001 0.0038 \0.0001
STJ 0.0049 0.0012 0.0020 0.2673 0.8146 0.1339 0.4607 0.0857 0.3673 0.0747 0.0074 0.0253 \0.0001
FTL SBR MID DRT KEY CSK SGI CSB1 CSB2 STJ
NC 0.649 0.739 0.791 0.846 0.527 0.225 0.181 0.713 0.038 0.130
CAP 0.713 0.801 0.849 0.878 0.596 0.269 0.273 0.804 0.062 0.191
GA 0.709 0.791 0.833 0.870 0.592 0.263 0.180 0.738 0.036 0.156
AML 0.575 0.656 0.699 0.800 0.450 0.170 0.035 0.500 -0.009 0.048
SJC 0.463 0.524 0.545 0.710 0.340 0.085 -0.047 0.210 -0.013 -0.021
FLG 0.452 0.512 0.529 0.692 0.327 0.079 -0.037 0.177 0.004 -0.012
VOL1 0.522 0.583 0.604 0.738 0.403 0.123 -0.035 0.294 -0.012 -0.008
VOL2 0.259 0.301 0.302 0.514 0.151 0.003 0.014 -0.025 0.096 0.024
NSB 0.365 0.415 0.423 0.614 0.246 0.037 -0.024 0.065 0.037 -0.012
CAN 0.207 0.246 0.245 0.468 0.106 -0.002 0.046 -0.057 0.140 0.050
MEL1 0.081 0.107 0.103 0.329 0.013 0.017 0.144 -0.083 0.273 0.144
MEL2 0.259 0.300 0.300 0.498 0.152 0.006 0.021 -0.025 0.097 0.030
JUN 0.002 0.005 0.003 0.092 0.030 0.182 0.373 0.070 0.505 0.378
FTL -0.021 -0.028 0.099 0.003 0.186 0.410 0.055 0.535 0.406
SBR 0.5061 -0.038 0.068 0.018 0.220 0.470 0.095 0.604 0.459
MID 1.0000 1.0000 0.068 0.012 0.218 0.489 0.094 0.632 0.473
DRT 0.0015 0.0218 0.1045 0.195 0.416 0.697 0.411 0.759 0.670
KEY 0.4796 0.2452 0.6398 \0.0001 0.101 0.287 -0.037 0.411 0.287
CSK 0.0000 0.0000 0.0028 \0.0001 0.0012 0.042 -0.042 0.133 0.055
SGI 0.0001 0.0004 0.0006 \0.0001 0.0028 0.6460 0.134 -0.028 -0.042
CSB1 0.3962 0.3234 0.1926 0.0089 0.5655 0.8236 0.1651 0.342 0.125
CSB2 \0.0001 \0.0001 \0.0001 \0.0001 \0.0001 0.0019 0.4767 0.0526 0.006
STJ \0.0001 \0.0001 \0.0001 \0.0001 0.0001 0.0544 0.9155 0.2483 0.2773
Significant pairwise FST comparisons (alpha = 0.05, no correction for multiple tests) are indicated in bold
Mar Biol
123

two groups, further complicating boundary placement.
Optimal clustering (based on minimizing FSC) when both
temporal VOL samples are considered jointly included a
boundary at the Flagler-Volusia County line in the case that
northeastern Florida was not recognized as a discrete
management unit (scenario NEFL 4), and inclusion of VOL
and NSB as part of a recognized northeastern Florida
management unit (scenario NEFL 13, Supplemental
Table 4).
Given the optimized boundaries for northeastern Florida
considering separate treatment of the temporal VOL sam-
ples, a final round of AMOVA iterations was performed to
test for optimal rookery clustering for the southeastern
USA nesting aggregation. A total of five scenarios were
considered given genetic evidence and inferences of
rookery connectivity based on available demographic data
and loggerhead turtle life history traits.
Scenario 1: Recognition of four management units:
northern (Virginia through the Georgia-Florida border),
peninsular Florida, Dry Tortugas, and northern Gulf
(northwest Florida and westward). These are the cur-
rently recognized recovery units designated in the
Recovery Plan (NMFS and USFWS 2008), and this
scenario was considered a control.
Scenario 2: Recognition of six management units:
northern, central eastern Florida, southern Florida
(southeastern and southwestern), Dry Tortugas, central
western Florida, and northwestern Florida.
Scenario 3: Recognition of seven management units:
northern, northeastern Florida, central eastern Florida,
southern Florida (southeastern and southwestern), Dry
Tortugas, central western Florida, and northwestern
Florida.
Scenario 4: Recognition of seven management units:
northern, central eastern Florida, southeastern Florida,
southwestern Florida, Dry Tortugas, central western
Florida, and northwestern Florida.
Scenario 5: Recognition of eight management units:
northern, northeastern Florida, central eastern Florida,
southeastern Florida, southwestern Florida, Dry Tortu-
gas, central western Florida, and northwestern Florida.
There was strong genetic structure among the discrete
sample locations (FST = 0.30325, P \ 0.00001) as well as
among the management units tested in the five potential
management scenarios (Table 4). AMOVA results indi-
cated that a significant proportion (14.29%, FSC = 0.18863,
P \ 0.00001; Table 4) of the overall genetic diversity of
the southeastern USA nesting aggregation was partitioned
among sampled rookeries within recovery units as they are
currently recognized in the Recovery Plan. Although FSC
was reduced and FCT was increased for all four remaining
management schemes relative to the current Recovery Plan
groupings, there was no clear best management scheme
given the goal of maximizing FCT and minimizing FSC.
Maximal FCT was achieved with management scenario 2,
recognition of central eastern, southern, and central western
Florida management units from the current peninsular
Florida recovery unit (Table 4). Minimal FSC was achieved
with management scenario 5, recognition of northeastern,
central eastern, southeastern, southwestern, and central
western Florida management units from the current penin-
sular Florida recovery unit (Table 4). A final round of
pairwise FST comparisons and exact tests of population
differentiation provided further support for recognition of
the discrete management units outlined in scenario 2, with
the only non-significant comparison being that of central
western and central eastern Florida across the axis of the
Florida peninsula (Supplemental Table 5). Southwestern
Florida was not significantly different from the combined
southeastern Florida rookeries in pairwise FST comparisons
or exact tests of population differentiation (Supplemental
Tables 7 and 8). Northeastern Florida was significantly
different from proximal rookery clusters (Supplemental
Tables 6 and 8).
Discussion
Population structure
The present study identified a pattern of haplotype fre-
quency transitions that is generally consistent with earlier
Table 4 AMOVA results for rookery-clustering scenarios for the southeastern USA loggerhead turtle nesting aggregation
FCT FCT P AMU (%) FSC FSC P AR/WMU (%)
Scenario 1 0.24224 0.00248 24.22 0.18863 \0.00001 14.29
Scenario 2 0.33606 \0.00001 33.61 0.01647 0.01089 1.09
Scenario 3 0.32512 \0.00001 32.51 0.01137 0.05604 0.77
Scenario 4 0.33467 \0.00001 33.47 0.01363 0.01465 0.91
Scenario 5 0.32444 \0.00001 32.44 0.00787 0.09386 0.53
AMU is the proportion of genetic variation partitioned among management units. AR/WMU is the total proportion of genetic variance
partitioned among rookeries within management units
Mar Biol
123

analyses that detected decreasing frequencies of haplotype
CC-A1 and increasing frequencies of CC-A2 from north to
south (Encalada et al. 1998; Bowen et al. 2005). However,
the haplotype frequency patterns observed in the present
study suggest an alternative interpretation to that of con-
tinuous, clinal variation in CC-A1 and CC-A2 along the
Atlantic coast of Florida. Although there is an apparent
cline across northeastern Florida rookeries, CAN and
MEL2, separated by approximately 90 beach kilometers
along the central coast of eastern Florida, had nearly
identical and not significantly different haplotype fre-
quencies. Similarly, the southeastern Florida sites, span-
ning roughly 125 km (JUN through MID), had quite
similar and not significantly different haplotype frequen-
cies. Yet, the frequencies of CC-A1 and CC-A2 are
essentially inverted between MEL and JUN, which are
separated by approximately 135 km, a distance comparable
to that spanning the southeastern Florida sites. The lack of
a standard yardstick of geographic isolation that might
predict genetic differentiation is echoed in the structure
among loggerhead turtle rookeries in the Mediterranean
basin. For instance, the sampled Greek rookeries of Zak-
ynthos, Kyparissia, and Lakoninkos, each separated from
the others by 100 km or more, all shared nearly identical
frequencies of haplotypes CC-A2 and CC-A6 (Encalada
et al. 1998; Carreras et al. 2007). Yet the eastern Turkey
and northern Cyprus rookeries, separated by approximately
100 km, had significantly different haplotype frequencies
owing to the presence of CC-A3 at high frequency at the
former and the absence of CC-A3 at the latter (Laurent
et al. 1998; Carreras et al. 2007). Another similarity
between southeastern USA and Mediterraean loggerhead
turtle nesting aggregations is the inference of a cline in the
frequencies of CC-A2 and CC-A3 along the Turkish coast
(Schroth et al. 1996; Carreras et al. 2007) that may mirror
the observed cline in northeastern Florida. The broad nat-
ure of the apparent cline across northeastern Florida may
have arisen out of the disparity in nesting densities between
the northern management unit and the central eastern
Florida rookeries (NMFS and USFWS 2008). Even a small
proportion of females straying northward from central
eastern Florida beaches would have a significant impact on
haplotype frequencies given the nearly complete lack of
CC-A2 individuals among northern rookeries.
The haplotype frequency transition patterns observed
along the Atlantic coast of Florida suggests that rather than
displaying broad clinal variation over the entire region,
haplotype frequencies may be reasonably stable over
100 km. Such a pattern may result from female natal
homing at sufficiently fine scales to maintain the frequency
divergence between central and southern regions of Flor-
ida. The probability that a female strays to a non-natal site
may not simply be a function of distance. Nesting females
may be honing in on specific bathymetric (Mortimer 1982;
Provancha and Ehrhart 1987), or other physical or chemical
cues (Lohmann et al. 2008a) that could give rise to
observed nesting density distribution patterns. Spatial
analysis of 17 years of nesting density distribution data
from the Florida Index Nesting Beach Survey program has
revealed remarkable conservation of fine-scale nesting
density patterns across nesting seasons (Witherington et al.
2009).
The strong divergence between central and southern
Florida rookeries may reflect independent colonization of
these areas. Encalada et al. (1998) hypothesized that an
equatorial lineage (precursor to CC-A1, formerly haplo-
type A) may have colonized more northerly latitudes (into
the Caribbean) prior to ultimately colonizing both the
western and eastern coasts of Florida. Bowen et al. (1994)
hypothesized that the CC-A2 lineage may have invaded the
western Atlantic via southern Africa. Haplotype CC-A2 is
the dominant haplotype in the Quintana Roo, Mexico
loggerhead turtle rookery (55% Encalada et al. 1998), as
well as the most frequent haplotype among analyzed Cuban
rookeries (Ruiz-Urquiola et al. 2010), so colonization may
have proceeded from either of these rookeries to southern
Florida. One possible scenario is that the current nesting
density peaks in Brevard (represented by MEL) and
northern Palm Beach (represented by JUN) counties
(NMFS and USFWS 2008) represent sites that were
initially colonized independently (perhaps originally by
CC-A1 and CC-A2 lineages, respectively) and that the
intervening beaches were colonized via diffusive natal
dispersal from these core areas. Another possibility is that
the region was initially colonized by the CC-A1 lineage
and that the CC-A2 lineage represents a more recent col-
onization event. Given thermal constraints on incubation,
the rookeries of northwestern and northeastern Florida and
northward along the eastern coast of the USA most likely
arose via recent colonization events since the Wisconsin
glaciation (Encalada et al. 1998). Encalada et al. (1998)
predicted that more recently colonized (more northerly)
nesting areas would harbor decreasing haplotype diversity
as haplotypes were sorted through a series of colonization
bottlenecks. Whereas this is consistent with observations
for the rookeries in northwestern Florida and northeastern
Florida through North Carolina, the pattern did not hold for
the southern sampled rookeries in the present study. The
highest haplotype diversity was generally recorded at
rookeries of intermediate latitude (CSK, JUN, and MEL)
rather than those in southernmost Florida, suggesting the
possibility that the more southern sites may have been
colonized recently. Another possibility is that these high-
density nesting beaches (relative to each respective region)
have higher haplotype diversity by virtue of specific
physical attributes that might attract nesting females
Mar Biol
123

carrying rare haplotypes that have strayed from other
rookeries in the western Atlantic. While it is clear that at
least two independent colonizations of the southeastern
USA from external refugia occurred, it is uncertain whether
the Gulf and Atlantic coasts of Florida were independently
colonized from refugia or whether founders for novel
rookeries on one coast may have originated from the other.
Poor resolution of the mitochondrial marker does not per-
mit unequivocal determination of the colonization path-
ways for the various rookeries comprising the nesting effort
in the southeastern USA and requires more extensive
screening of the mitochondrial genome for informative
variation.
A striking feature of the haplotype frequency distribu-
tion is the slightly skewed mirror image pattern produced
by comparable haplotype frequencies occurring at roughly
similar latitudes across the Florida peninsula. One possible
explanation for the overall pattern is error in natal homing
that would compel females to nest on beaches with mag-
netic signatures similar to their natal beaches but on
opposing coastlines across the Florida peninsula. Neonate
marine turtles may imprint on the geomagnetic signature of
their natal site and use this positional information to home
to natal regions for nesting (Lohmann et al. 2008b). Marine
turtles are sensitive to both magnetic inclination and
intensity (Lohmann et al. 2007); however, navigation uti-
lizing a bicoordinate map may not be required to locate
beaches along continental coastlines. The coastline itself
may serve as a fixed coordinate; therefore, turtles in search
of natal regions would only need to follow the coastline to
an appropriate inclination or intensity angle (Lohmann
et al. 2008b). Tag returns demonstrate that some proportion
of central eastern Florida nesting loggerhead turtles enter
the Gulf of Mexico to forage (Meylan et al. 1983). Simi-
larly, satellite telemetry indicated that six of twenty-eight
females nesting in Sarasota County on the Gulf coast left
the Gulf of Mexico following nesting to forage in the
Bahamas (Girard et al. 2009). It is conceivable that a small
proportion of females hatched on one coast of Florida but
foraging off the other might inadvertently travel along the
closest coastline and nest at a site with a similar one-
dimensional magnetic signature as their natal area, but on
the opposing coast across the axis of the Florida peninsula.
Nesting dispersal by individual females among rooker-
ies as measured through flipper-tagging studies may pro-
vide an alternative means of characterizing the magnitude
and spatial scale of female gene flow among rookeries. For
instance, extensive supplemental tagging of nesting Aus-
tralian green turtles during the 1998–1999 nesting season
revealed 8.3% interseasonal dispersal among southern
Great Barrier Reef rookeries and 6% interseasonal dis-
persal among northern Great Barrier Reef rookeries,
whereas no dispersal between southern and northern Great
Barrier Reef rookeries was detected (Dethmers et al. 2006).
The tagging observations were concordant with mtDNA
analysis, suggesting that rookeries within each region were
not genetically differentiated, but that the two regions
represented distinct management units (Dethmers et al.
2006). Unfortunately, MEL currently hosts the only log-
gerhead turtle tagging project along the eastern coast of
Florida; therefore, contemporary data documenting west
coast and east coast Florida nesting dispersal are scarce. Of
thousands of loggerhead turtles tagged at CSK and at MEL
since the mid-1980s, only seven have been recorded nest-
ing at both of these sites (Mote Marine Laboratory and
University of Central Florida Marine Turtle Research
Group, unpubl. data). If effective, this level of migration is
theoretically sufficient to prevent genetic differentiation of
these rookeries (e.g. Slatkin 1987).
A limitation of nesting beach flipper-tagging studies for
rookery connectivity inference is that such studies measure
nest site fidelity, the relative placement of nests by an
individual female after she has been tagged while nesting,
also known as site fixity or site tenacity (Carr and Carr
1972), rather than explicitly measuring natal philopatry
(where the female nests relative to where she herself hat-
ched). Nesting dispersal between distant rookeries repre-
sents natal dispersal by default, as it is illogical that a turtle
could have hatched in two different regions. However, it is
also conceivable that females exhibiting high site tenacity
at a particular rookery could be nesting at a non-natal site
(high nest site fidelity but low natal site fidelity). This type
of natal dispersal would not be detectable with the tagging
methodologies currently employed in the southeastern
USA. Therefore, testing the hypothesis of inter-coastal
natal dispersal within Florida in the absence of nesting
dispersal will require a means of directly linking nesting
females to their natal beaches.
Sample sizes and sampling error
Small sample sizes and resulting sampling error likely
contributed to underestimation, and in a few cases over-
estimation, of population differentiation. Despite complete
sharing of haplotype CC-A1 between CAP (n = 73) and
NC (n = 43), pairwise exact tests of population differen-
tiation between these sites and all others yielded 19 and 17
significant comparisons, respectively. Sampling error by
virtue of overestimation of the frequency of rare haplotypes
in a particular rookery based on a sample may also lead to
differing conclusions regarding genetic divergence. For
instance, the 10-day nest sample at STJ yielded individuals
carrying three rare haplotypes absent among the much
larger sample of nesting females from CSB (on the same
peninsula, \20 km away) obtained through saturation
sampling over a period of 4 years. Larger sample sizes,
Mar Biol
123

particularly from sites with low nesting densities, will be
required from many areas to make robust inferences
regarding the possibility of additional management units
within the southeastern United States nesting aggregation.
Temporal variation in haplotype frequencies
It is unclear whether the apparent differentiation detected
among year classes at CSB and MEL truly represents
temporal variation or could have arisen through sampling
error. The sample size of CSB1 was small (n = 7), and
sampling methodology was unclear. Haplotype frequencies
of CSB1 were significantly different from 2002 and 2004,
while none of the remaining annual samples differed from
one another, suggesting that CSB1 was an outlier that may
have arisen through sampling error. MEL1 represents only
a portion of turtles sampled (40 samples sequenced of 150
samples collected for a multiple paternity study, [Moore
and Ball 2002]), so the difference between MEL1 and
MEL2 may also be attributable to sampling error. Because
of the high nesting densities at MEL ([450 nests/km;
NMFS and USFWS 2008), neither the 1996 nor the 2006
sample set represent strong sampling effort relative to
nesting effort. The differentiation among annual VOL
samples, however, does appear to truly reflect temporal
variation given that sampling effort was high relative to
nesting effort ([70% of clutches laid during each sampling
period) and sampling methodologies were consistent
among years.
Lack of temporal variation at most sample sites is not
surprising given the short duration between sampling
periods and the estimated loggerhead turtle generation
length of approximately 50 years (NMFS and USFWS
2008). Tag recoveries suggest that individual females are
capable of nesting over a period of at least 25 years (NMFS
and USFWS 2008). Thus, any divergence in haplotype
frequency via genetic drift would be expected to occur
gradually as neophyte females are absorbed into the nesting
population, slowly replacing senescent females. Bjorndal
and Bolten (2008) argued that aggregates of females
nesting at a rookery each year are probably well mixed due
to individual females switching between remigration
intervals of two, three, or more years (e.g. Carr et al. 1978),
likely maintaining genetic homogeneity among years.
If the apparent temporal variation observed at VOL is
real, there are several alternative hypotheses worth con-
sidering. One possibility is that this variation is interannual
and could be driven by differential aggregate mixing based
on divergent foraging habitat use and differing mean
remigration intervals for each foraging aggregation. Given
the energetic costs of undertaking reproductive migrations
and producing several clutches of eggs over the course of a
nesting season, ecological conditions on the foraging
grounds have been postulated to affect variability in
remigration intervals (Carr and Carr 1970); Troeng and
Chaloupka (2007) hypothesized that the shorter observed
population average remigration interval for Tortuguero
green turtles relative to that of many other green turtle
rookeries could be attributable, at least in part, to greater
forage availability, better forage quality, and shorter dis-
tance between the nesting beach and the main foraging
ground. Satellite telemetry and tag return data suggest that
northern management unit loggerhead turtle females forage
primarily along the continental shelf of the eastern United
States, with a relatively small proportion of females mov-
ing south of the Cape Canaveral area to forage in the
northern Caribbean or Gulf of Mexico (Bell and Richard-
son 1978; Plotkin and Spotila 2002; Williams and Frick
2008). Loggerhead turtles nesting in central eastern and
western Florida typically forage in the Gulf of Mexico or in
the northern Caribbean region (Meylan et al. 1983; Dodd
and Byles 2003; Foley et al. 2008; Girard et al. 2009;
Turtle Expert Working Group 2009), and only one satellite-
tagged female has been recorded foraging north of the
Cape Canaveral area (Dodd and Byles 2003).
Another possibility is that temporal variation exists
within a nesting season. The initiation of nesting by central
Florida and northern management unit females could be
sufficiently staggered to produce cyclical changes in hap-
lotype frequencies depending on the precise placement of
the sampling window within the nesting season. Beyond
different usage patterns of spatially discrete neritic habitats
suggested by tag return and satellite telemetry data, anal-
yses of stable isotopes and epibiota suggested that log-
gerhead turtles nesting along the eastern coast of Florida
may be utilizing both oceanic and neritic foraging habitats
(Reich et al. 2010). Although observed latitudinal trends in
mtDNA haplotypes and stable isotope patterns were inde-
pendent (Reich et al. 2010), the possibility remains that
divergent foraging strategies or use of different foraging
habitats could be driving sufficiently staggered nesting
phenology for representatives of each group so as to cause
temporal variation of haplotype frequencies on the nesting
beach. Further research is warranted to determine whether
haplotype frequency variations occur across individual
nesting seasons at the northeastern Florida rookeries.
We concur with Bjorndal and Bolten (2008) that temporal
variation should be considered in population structure
analyses of rookeries as well as mixed stock analyses of
foraging aggregations. Apparent temporal variation in the
VOL rookery clearly had a significant impact on the inter-
pretation of spatial genetic structure. The 1998 and 2007
samples would have lead to grouping of this rookery with
those in central eastern Florida, whereas the 2006 and 2008
samples indicated a much closer affiliation with the northern
management unit. Overall, these data suggest that a
Mar Biol
123

geographic transition zone occurs across northeastern Flor-
ida between the population nesting north of Florida and the
population nesting in central eastern Florida. The apparent
temporally transitional nature of haplotype frequencies at
this rookery would have gone undetected without sampling
over multiple years. Temporal variation of genetic diversity
over short frames (e.g. within a nesting season or less than a
generation) may not occur as a rule at most rookeries, but
should be considered particularly when rookeries may be
suspected of being geographically transitional.
Defining management units
Defining management unit boundaries is inherently diffi-
cult when habitat is relatively homogenous and obvious
barriers to movement are absent, such as the case of several
100 km of essentially continuous coastline that provides
suitable nesting habitat for loggerhead turtles. In cases
where nesting habitats are discrete (e.g., Dry Tortugas) or
are separated from other nesting areas by over 100 km of
unsuitable nesting habitat (e.g., northwest Florida beaches
relative to central western Florida), management unit
assessments may be straightforward if proximal rookeries
have significantly different haplotype frequencies. How-
ever, boundaries along continuous nesting habitat must be
artificially imposed in the sense that some proportion of
females will distribute nesting effort on both sides of
designated boundaries. Despite this complication, ignoring
the genetic structure among peninsular Florida nesting
areas could lead to inadequate protection of demographi-
cally distinct rookeries as well as misinterpretation of
nesting trends at finer spatial scales.
Although genetic studies have provided a reasonable
first approximation for management unit assignments
(Bowen et al. 1993; Encalada et al. 1998; Pearce 2001;
Bowen et al. 2005, present study), some inherent limita-
tions of haplotype frequency data bear consideration.
Provided sampling has been conducted in such a way as to
maximize sample sizes and minimize sampling error, a
significant difference in haplotype frequencies implies
some level of demographic independence (Avise 1995).
However, lack of significant genetic differences does not
necessarily confer contemporary demographic connectivity
(Taylor and Dizon 1996). Demographic partitioning
despite non-significance of haplotype frequency compari-
sons is possible due to lack of resolution of the genetic
markers, shared evolutionary history, and potentially
insufficient time for genetic drift to occur. Comparative
evidence suggests that marine turtle mitochondrial DNA
evolves more slowly than that of most other vertebrates,
possibly attributable to long generation time and low
metabolic rate (Avise et al. 1992). Therefore, nesting
populations may be demographically isolated despite a lack
of any detectable genetic differentiation. Distinguishing
between recent shared evolutionary heritage in the absence
of genetic drift, low levels of contemporary genetic con-
nectivity sufficient to prevent genetic divergence, and
contemporary demographic connectivity among rookeries
is critical for management on ecological time scales.
Ultimately, marine turtle rookeries flourish or perish
based on recruitment of nesting females to a particular
rookery (Bowen et al. 2005). Female nesting at non-natal
sites is critical for colonization of novel nesting areas over
evolutionary time scales, but natal dispersal of small
numbers of females among distant established rookeries
may be demographically irrelevant over ecological time
scales. The level of exchange required to prevent genetic
differentiation is many orders of magnitude lower than that
required to sustain a population ecologically and demo-
graphically (Avise 1992). Whereas a few migrants per
generation may be sufficient to maintain genetic homoge-
neity (Slatkin 1993), demographic independence of two
populations may be maintained if less than 10% of indi-
viduals disperse between the populations (Hastings 1993).
Thus, management unit inferences should be drawn in the
context of life history characteristics and available demo-
graphic data rather than relying strictly on the statistical
significance of population differentiation tests.
Recovery unit recommendations
The present study upholds the distinctiveness of the four
currently recognized recovery units: northern, peninsular
Florida, Dry Tortugas, and northern Gulf of Mexico. We
concur with the argument that the northern Gulf coast nest-
ing population should be treated as a separate recovery unit
on the basis of geographic isolation and apparent genetic
distinction from the proximal Gulf coast rookeries in central
western and southwestern Florida (Encalada et al. 1998).
Sampling effort has not been spatially or temporally
adequate to fully resolve the number or boundaries of
recovery units within the southeastern USA loggerhead
turtle nesting aggregation. However, the present study does
suggest more structure among peninsular Florida rookeries
than is reflected in the current Recovery Plan designations.
Although the lack of data from the rookeries between MEL
and JUN in the present analysis limits inferences about the
nature of haplotype frequency transitions along the entire
length of the Atlantic coast of Florida, similarity of hap-
lotype frequencies within each sampled region and strong
divergence of haplotype frequencies between them suggest
some level of demographic partitioning. Brevard County in
the central portion of the eastern coast of Florida and Palm
Beach County in southeastern Florida host the two signifi-
cant peaks in nesting density of the southeastern USA
nesting aggregation with a relative trough of nesting
Mar Biol
123

densities between them (NMFS and USFWS 2008;
Witherington et al. 2009). Given the nesting density dis-
tribution data and the significant genetic differentiation
between the central and southern portions of the eastern
coast, we recommend recognition of the central eastern
Florida rookery as a distinct recovery unit. Similar genetic
divergence occurs along the Gulf coast between KEY in
southwestern Florida and CSK in central western Florida
and suggests that recognition of a separate central western
Florida recovery unit is also warranted.
It is unclear whether the lack of genetic divergence
between turtles nesting on the southernmost eastern and
western coasts of the Florida peninsula reflects contem-
porary demographic connectivity, contemporary genetic
connectivity, or may result from historical colonization
signature. The discontinuity of suitable nesting habitat
around the tip of the Florida peninsula (e.g. Davis and
Whiting 1977), the scale of distinct management units
inferred from the present study in other regions of Florida,
and limited observed nesting dispersal between coasts
suggest that each coast likely hosts demographically dis-
tinct rookeries. Though there is little genetic support for
recognition of discrete southwestern and southeastern
recovery units given the lack of significant differences of
haplotype frequencies at KEY and the southeastern Florida
rookeries, the conservative approach may be designation of
finer scale recovery units unless or until evidence of suf-
ficient effective movement between them is established.
Further studies should address the demographic rookery
connectivity between these regions.
The northeastern Florida rookeries present a challenge
for recovery planning given the lack of a clear boundary
between the northern and proposed central eastern Florida
recovery units because of intermediate haplotype frequen-
cies. Pairwise FST comparisons, exact tests, and AMOVA
results support the recognition of a discrete northeastern
Florida recovery unit. However, the transitional nature of
the haplotype frequencies of northeastern Florida rookeries
both spatially and temporally in the case of VOL suggests
that rather than representing a discrete nesting population,
these rookeries represent a transition zone comprised of
nesting females from both the northern and proposed
central eastern Florida recovery units. Given the large
disparity between nesting densities at Georgia rookeries
and rookeries in central eastern Florida (10–20 nests/km
versus 300 ? nests/km, respectively; (NMFS and USFWS
2008), even a small proportion of central eastern Florida
straying northward into northeastern Florida would pro-
duce intermediate frequencies of CC-A2 relative to the
rookeries to the north and south. Optimal boundaries for a
discrete northeastern Florida recovery unit were between
AML and SJC to the north and between VOL and NSB to
the south when VOL temporal samples were treated
discretely. Therefore, the Ponce Inlet may serve as an
appropriate northern boundary for the central Florida
recovery unit given either recognition of a northeastern
Florida recovery unit or absorption of these northeastern
Florida rookeries into the northern recovery unit. Under
either scenario, AML should be treated as part of the
northern recovery unit based on AMOVA results. Further
research should focus on the demographic independence of
the northeastern Florida rookeries relative to those in
Georgia and central eastern Florida.
The genetic data support recognition of a minimum of
six distinct recovery units: northern, central eastern Flor-
ida, southern Florida (southeastern and southwestern), Dry
Tortugas, central western Florida, and northern Gulf of
Mexico. The demographic discreteness of northeastern and
southwestern Florida rookeries is unclear and warrants
further research. More extensive genetic sampling is
required to fill geographic gaps in the present study and to
better describe the nature of haplotype frequency transi-
tions along continuous coastlines. Further demographic
partitioning likely occurs, and additional tools, such as
satellite or GPS telemetry and mark-recapture, are required
to overcome the limitations of the mitochondrial sequence
data used in the present study in generating more robust
data on the scale of female natal philopatry, female nest
site fidelity, and connectivity among rookeries.
Acknowledgments In additional to the many students, interns,
technicians, and volunteers associated with authors’ institutions, we
thank individuals representing the following organizations for provid-
ing samples: Bald Head Island Conservancy, Amelia Island Sea Turtle
Watch, Ponte Vedra Turtle Patrol, Vilano Marine Turtle Patrol, Guana
Tolomato Matanzas National Estuarine Research Reserve, Flagler-
Volusia Turtle Patrol, Ecological Associates, Inc., John U. Lloyd State
Park, National Marine Fisheries Service Southeast Fisheries Science
Center, Bill Baggs Cape Florida State Park, St. George Island Volunteer
Turtlers, and T. H. Stone Memorial St. Joseph Peninsula State Park. We
thank D. Browning and S. Dawsey of Cape Romain National Wildlife
Refuge, J. Stiner and C. Carter of Canaveral National Seashore, and
P. Tritaik of Archie Carr National Wildlife Refuge for permitting beach
access and logistical assistance. D. Griffin from South Carolina
Department of Natural Resources and A. McKee of the University of
Georgia assisted with sample collection on Cape Island. Thanks to
M. Koperski and R. Trindell for assistance with Florida permitting, and
G. Clark of the University of Florida sequencing core facility for
haplotype assignments of the CSB samples. The Florida Fish and
Wildlife Conservation Commission’s nest survey program is supported
by the US Fish and Wildlife Service and the Florida Sea Turtle License
Plate. We gratefully acknowledge funding provided by the National
Oceanic and Atmospheric Administration’s Protected Species Coop-
erative Conservation Grant Program, the Georgia Department of
Natural Resources, The Environmental Resource Network, and the
University of Georgia Warnell School of Forestry and Natural
Resources. This research was funded in part by a grant awarded from
the Sea Turtle Grants Program. The Sea Turtle Grants Program is
funded from proceeds from the sale of the Florida Sea Turtle License
Plate. Learn more at www.helpingseaturtles.org. We would also like to
thank two anonymous reviewers for substantially increasing the quality
of the manuscript.
Mar Biol
123

References
Allendorf FW, Waples RS (1995) Conservation and genetics of
salmonid fishes. In: Avise JC, Hamrick JL (eds) Conservation
genetics. Chapman and Hall, New York, pp 238–280
Avise JC (1992) Molecular population structure and the biogeo-
graphic history of a regional fauna: a case history with lessons
for conservation biology. Oikos 63:62–76
Avise JC (1995) Mitochondrial DNA polymorphism and a connection
between genetics and demography of relevance to conservation.
Conserv Biol 9:686–690
Avise JC, Bowen BW, Lamb T, Meylan AB, Bermingham E (1992)
Mitochondrial DNA evolution at a turtle’s pace: evidence for
low genetic variability and reduced microevolutionary rate in the
testudines. Mol Biol Evol 9:457–473
Baldwin R, Hughes GR, Price RIT (2003) Loggerhead turtles in the
Indian Ocean. In: Bolten AB, Witherington BE (eds) Loggerhead
sea turtles. Smithsonian Institution Press, Washington, DC,
pp 218–232
Bell R, Richardson JI (1978) An analysis of tag recoveries from
loggerhead sea turtles (Caretta caretta) nesting on Little
Cumberland Island, Georgia. Fla Mar Res Publ 33:1–66
Bjorndal K, Bolten A (2008) Annual variation in source contributions
to a mixed stock: implications for quantifying connectivity. Mol
Ecol 17:2185–2193
Bjorndal K, Bolten A, Troeng S (2005) Population structure and
genetic diversity in green turtles nesting at Tortuguero, Costa
Rica, based on mitochondrial DNA control region sequences.
Mar Biol 147:1449–1457
Bolten AB (2003) The loggerhead sea turtle- so excellent a fishe. In:
Bolten AB, Witherington BE (eds) Loggerhead sea turtles.
Smithsonian Institution Press, Washington, pp 1–3
Bolten AB, Bjorndal KA, Martins HR, Dellinger T, Biscoito MJ,
Encalada SE, Bowen BW (1998) Transatlantic developmental
migrations of loggerhead sea turtles demonstrated by mtDNA
sequence analysis. Ecol Appl 8:1–7
Bowen BW, Karl SA (2007) Population genetics and phylogeography
of sea turtles. Mol Ecol 16:4886–4907
Bowen B, Avise JC, Richardson JI, Meylan AB, Margaritoulis D,
Hopkins-Murphy SR (1993) Population structure of loggerhead
turtles (Caretta caretta) in the northwestern Atlantic Ocean and
Mediterranean Sea. Conserv Biol 7:834–844
Bowen BW, Kamezaki N, Limpus CJ, Hughes GR, Meylan AB,
Avise JC (1994) Global phylogeography of the loggerhead turte
(Caretta caretta) as indicated by mitochondrial DNA haplo-
types. Evolution 48:1820–1828
Bowen BW, Bass AL, Chow S-M, Bostrom M, Bjorndal KA, Bolten
AB, Okuyama T, Bolker BM, Epperly S, La Casella E, Shaver
D, Dodd M, Hopkins-Murphy SR, Musick JA, Swingle M,
Rankin-Baransky K, Teas W, Witzell WN, Dutton PH (2004)
Natal homing in juvenile loggerhead turtles (Caretta caretta).
Mol Ecol 13:3797–3808
Bowen BW, Bass AL, Soares L, Toonen RJ (2005) Conservation
implications of complex population structure: lessons from the
loggerhead turtle (Caretta caretta). Mol Ecol 14:2389–2402
Carr A, Carr MH (1970) Modulated reproductive periodicity in
Chelonia. Ecology 51:335–337
Carr A, Carr M (1972) Site fixity in the Caribbean green turtle.
Ecology 53:425–429
Carr A, Carr M, Meylan A (1978) The ecology and migrations of sea
turtles. No. 7. The West Caribbean green turtle colony. Bull Am
Mus Nat Hist 162:1–46
Carreras C, Pascual M, Cardona L, Aguilar A, Margaritoulis D, Rees
AF, Turkozan O, Levy Y, Gasith A, Aureggi M, Khalil M (2007)
The genetic structure of the loggerhead sea turtle (Caretta
caretta) in the Mediterranean as revealed by nuclear and
mitochondrial DNA and its conservation implications. Conserv
Genet 8:1572–9737
Davis GE, Whiting MC (1977) Loggerhead sea turtle nesting in
Everglades National Park, Florida, USA. Herpetologica 33:18–
28
Dethmers KEM, Broderick D, Moritz C, FitzSimmons N, Limpus C,
Lavery S, Whiting S, Guinea M, Prince RIT, Kennet R (2006)
The genetic structure of Australasian green turtles (Cheloniamydas): exploring the geographical scale of genetic exchange.
Mol Ecol 15:3931–3946
Dodd C, Byles R (2003) Post-nesting movements and behavior of
loggerhead sea turtles (Caretta caretta) departing from east-
central Florida nesting beaches. Chelonian Conserv Biol
4:530–536
Dodd CK Jr (1988) Synopsis of the biological data on the loggerhead
sea turtle Caretta caretta (Linnaeus 1758), 88(14)
Encalada SE, Bjorndal KA, Bolten AB, Zurita JC, Schroeder B,
Possardt E, Sears CJ, Bowen BW (1998) Population structure of
loggerhead turtle (Caretta caretta) nesting colonies in the
Atlantic and Mediterranean as inferred from mitochondrial
DNA control region sequences. Mar Biol 130:567–575
Excoffier L, Laval G, Schneider S (2005) Arlequin ver. 3.0: an
integrated software package for population genetics data anal-
ysis. Evol Bioinform Online 1:47–50
Foley A, Schroeder BA, MacPherson S (2008) Post-nesting migra-
tions and resident areas of Florida loggerheads. In: Kalb H,Rohde A, Gayheart K, Shanker K (eds) Proceedings of the
Twenty-fifth annual symposium on sea turtle biology and
conservation. NOAA Technical Memorandum NMFS-SEFSC-
582
Francisco AM, Bass AL, Bowen BW (1999) Genetic characterization
of loggerhead turtles (Caretta caretta) nesting in Volusia County
Fraser D, Bernatchez L (2001) Adaptive evolutionary conservation:
towards a unified concept for defining conservation units. Mol
Ecol 10:2741–2752
Girard C, Tucker AD, Calmettes B (2009) Post-nesting migrations of
loggerhead sea turtles in the Gulf of Mexico: dispersal in highly
dynamic conditions. Mar Biol 156:1827–1839
Hastings A (1993) Complex interactions between dispersal and
dynamics: lessons from coupled logistic equations. Ecology
74:1362–1372
Hatase H, Kinoshita M, Bando T, Kamezaki N, Sato K, Matsuzawa Y,
Goto K, Omuta K, Nakashima Y, Takeshita H, Sakamoto W
(2002) Population structure of loggerhead turtles, Carettacaretta, nesting in Japan: bottlenescks on the Pacific population.
Mar Biol 141:299–305
Hoelzel AR (1998) Genetic structure of cetacean populations in
sympatry, parapatry, and mixed assemblages: implications for
conservation policy. J Hered 89:451–458
Laurent L, Casale P, Bradai MN, Godley BJ, Gerosa G, Broderick
AC, Schroth W, Schierwater B, Levy AM, Freggi D, El-Mawla
EMA, Hadoud DA, Gomati HE, Domingo M, Hadjichristopho-
rou M, Kornaraky L, Demirayak F, Gautier CH (1998)
Molecular resolution of marine turtle stock composition in
fishery bycatch: a case study in the Mediterranean. Mol Ecol
7:1529–1542
Lohmann K, Lohmann C, Putman N (2007) Magnetic maps in
animals: nature’s GPS. J Exp Biol 211:3697–3705
Lohmann K, Luschi P, Hays G (2008a) Goal navigation and island-
finding in sea turtles. J Exp Mar Biol Ecol 356:83–95
Lohmann K, Putman N, Lohmann C (2008b) Geomagnetic imprint-
ing: a unifying hypothesis for long-distance natal homing in
salmon and sea turtles. Proc Natl Acad Sci USA 105:19096–
19101
Mar Biol
123

Meylan AB, Bjorndal KA, Turner BJ (1983) Sea turtles nesting at
Melbourne Beach, Florida, II. Post-nesting movements of
Caretta caretta. Biol Conserv 26:79–90
Moore MK, Ball RM Jr (2002) Multiple paternity in loggerhead sea
turtles (Caretta caretta) nests on Melbourne Beach, Florida: a
microsatellite analysis. Mol Ecol 11:281–288
Moritz C (1994) Defining evolutionary significant units for conser-
vation. Trends Ecol Evol 9:373–374
Mortimer JA (1982) Factors influencing beach selection by nesting
sea turtles. In: Bjorndal KA (ed) Biology and conservation of sea
turtles. Smithsonian Institution Press, Washington, pp 45–52
National Marine Fisheries Service and US Fish and Wildlife Service
(2008) Recovery plan for the Northwest atlantic population of
the loggerhead sea turtle (Caretta caretta), Second Revision.
National Marine Fisheries Service, Silver Spring, MD
Nei M (1987) Molecular evolutionary genetics. Columbia University
Press, New York
Norman JA, Moritz C, Limpus CJ (1994) Mitochondrial DNA control
region polymorphisms: genetic markers for ecological studies of
marine turtles. Mol Ecol 3:363–373
Pearce AF (2001) Contrasting population structure of the loggerhead
turtle (Caretta caretta) using mitochondrial and nuclear DNA
markers. Masters Thesis. University of Florida. Gainesville, FL
Plotkin PT, Spotila JR (2002) Post-nesting migrations of loggerhead
turtles Caretta caretta from Georgia, USA: conservation impli-
cations for a genetically distinct subpopulation. Oryx
36:396–399
Provancha JA, Ehrhart LM (1987) Sea turtle nesting trends at
Kennedy space center and Cape Canaveral air force stattion,
Florida, and relationships with factors influencing nest site
selection. In: Witzell WN (ed) Ecology of East Florida sea
turtles. NOAA Technical Report NMFS 53, Miami, FL
Raymond M, Rousset F (1995) An exact test for population
differentiation. Evolution 49:1280–1283
Reich K, Bjorndal K, Frick M, Witherington B, Johnson C, Bolten A
(2010) Polymodal foraging in adult female loggerheads (Carettacaretta) Marine Biology 157:113–121
Rice WR (1989) Analyzing tables of statistical tests. Evolution
43:223–225
Ruiz-Urquiola A, Vega-Polanco M, Riveron-Gıro F, Abreu-Grobois
FA, Solano-Abadıa J, Perez-Bermudez E, Frıas-Soler R, Azanza-
Ricardo J, Dıaz-Fernandez R, Ibarra-Martın M, Espinosa-Lopez G
(2010) Genetic structure of loggerhead populations in the greater
Caribbean and Atlantic western shore based on mitochondrial
DNA sequences, with an emphasis on the rookeries from
southwestern Cuba. In: Dean K, Lopez-Castro M (compilers)
Proceedings of the Twenty-eighth Annual Symposium on Sea
Turtle Biology and Conservation. NOAA Technical Memoran-
dum NOAA NMFS-SEFSC-602
Schroth W, Streit B, Schierwater B (1996) Evolutionary handcap for
turtles. Nature 384:521–522
Shamblin BM, Faircloth BC, Dodd M, Wood-Jones A, Castleberry
SB, Carroll JP, Nairn CJ (2007) Tetranucleotide microsatellites
from the loggerhead sea turtle (Caretta caretta). Mol Ecol Notes
7:784–787
Slatkin M (1987) Gene flow and the geographic structure of natural
populations. Science 236:787–792
Slatkin M (1993) Isolation by distance in equilibrium and nonequi-
librium populations. Evolution 47:264–279
Tamura K, Nei M (1993) Estimation of the number of nucleotide
substitutions in the control region of mitochondrial DNA in
humans and chimpanzees. Mol Biol Evol 10:512–526
Taylor B, Dizon AE (1996) The need to estimate power to link
genetics and demography for conservation. Conserv Biol
10:661–664
Troeng S, Chaloupka M (2007) Variation in adult annual survival
probability and remigration intervals of sea turtles. Mar Biol
151:1721–1730
Turtle Expert Working Group (2009) An assessment of the logger-
head turtle population in the western North Atlantic Ocean.
NOAA Technical Memorandum NMFS-SEFSC-575
Velez-Zuazo X, Ramos WD, van Dam RP, Diez CE, Abreu-Grobois
A, McMillan O (2008) Diespersal, recruiment and migratory
behaviour in a hawksbill sea turtle aggregation. Mol Ecol
17:839–853
Williams KL, Frick MG (2008) Tag returns from loggerhead turtles
from Wassaw Island, Georgia. Southeast Nat 7:165–172
Wisby WJ, Hasler AD (1954) Effect of olfactory occlusion on
migrating silver salmon (O. kisutch). J Fish Res Board Canada
11:472–478
Witherington B, Kubilis P, Brost B, Meylan A (2009) Decreasing
annual nest counts in a globally important loggerhead sea turtle
population. Ecol Appl 19:30–54
Mar Biol
123