Loggerhead Nest Trends
25
Ecological Applications, 19(1), 2009, pp. 30–54 Ó 2009 by the Ecological Society of America Decreasing annual nest counts in a globally important loggerhead sea turtle population BLAIR WITHERINGTON, 1,4 PAUL KUBILIS, 2 BETH BROST, 3 AND ANNE MEYLAN 3 1 Florida Fish and Wildlife Conservation Commission, Fish and Wildlife Research Institute, 9700 South A1A, Melbourne Beach, Florida 32951 USA 2 Florida Program for Environmental Statistics, IFAS Statistics Department, University of Florida, 419 McCarty Hall C, P.O. Box 110339, Gainesville, Florida 32611 USA 3 Florida Fish and Wildlife Conservation Commission, Fish and Wildlife Research Institute, 100 8th Avenue Southeast, St. Petersburg, Florida 33701 USA Abstract. The loggerhead sea turtle (Caretta caretta) nests on sand beaches, has both oceanic and neritic life stages, and migrates internationally. We analyzed an 18-year time series of Index Nesting Beach Survey (Index) nest-count data to describe spatial and temporal trends in loggerhead nesting on Florida (USA) beaches. The Index data were highly resolved: 368 fixed zones (mean length 0.88 km) were surveyed daily during annual 109-day survey seasons. Spatial and seasonal coverage averaged 69% of estimated total nesting by loggerheads in the state. We carried out trend analyses on both annual survey-region nest-count totals (N ¼ 18) and annual zone-level nest densities (N ¼ 18 3 368 ¼ 6624). In both analyses, negative binomial regression models were used to fit restricted cubic spline curves to aggregated nest counts. Between 1989 and 2006, loggerhead nest counts on Florida Index beaches increased and then declined, with a net decrease over the 18-year period. This pattern was evident in both a trend model of annual survey-region nest-count totals and a mixed-effect, ‘‘single-region’’ trend model of annual zone-level nest densities that took into account both spatial and temporal correlation between counts. We also saw this pattern in a zone-level model that allowed trend line shapes to vary between six coastal subregions. Annual mean zone-level nest density declined significantly ( 28%; 95% CI: 34% to 21%) between 1989 and 2006 and declined steeply ( 43%; 95% CI: 48% to 39%) during 1998–2006. Rates of change in annual mean nest density varied more between coastal subregions during the ‘‘mostly increasing’’ period prior to 1998 than during the ‘‘steeply declining’’ period after 1998. The excellent fits (observed vs. expected count R 2 . 0.91) of the mixed-effect zone-level models confirmed the presence of strong, positive, within-zone autocorrelation (R . 0.93) between annual counts, indicating a remarkable year-to-year consistency in the longshore spatial distribution of nests over the survey region. We argue that the decline in annual loggerhead nest counts in peninsular Florida can best be explained by a decline in the number of adult female loggerheads in the population. Causes of this decline are explored. Key words: Caretta caretta; endangered species; Florida, USA; loggerhead sea turtle; nesting; population decline; spatiotemporal trends. INTRODUCTION The loggerhead sea turtle (Caretta caretta) nests on sand beaches (see Plate 1), has both oceanic and neritic life stages, and migrates internationally (species reviews in Dodd [1988], Bolten and Witherington [2003], and Witherington et al. [2006b]). Worldwide, loggerhead sea turtle populations are generally recognized as being depleted, especially in the Pacific (NMFS and USFWS 2007). The species is listed as Endangered on the IUCN Red List and as Threatened under the U.S. Endangered Species Act. The Convention on International Trade in Endangered Species of Wild Fauna and Flora (CITES) lists loggerhead sea turtles in CITES Appendix I. Loggerhead foraging areas are mostly in subtropical and temperate oceans, and the majority of their nesting beaches are located between 198 and 368 latitude in each hemisphere (Dodd 1988). Only two loggerhead nesting assemblages have more than 10 000 females nesting per year: southern Florida, USA) and Masirah, Oman (Baldwin et al. 2003, Ehrhart et al. 2003). Assessments at major nesting beaches worldwide indicate that nesting beaches in Florida and Oman host ;80–90% of the world’s loggerhead nesting activity (Baldwin et al. 2003, Ehrhart et al. 2003, Kamezaki et al. 2003, Limpus and Limpus 2003, Margaritoulis et al. 2003). Mitochondrial DNA (mtDNA) sequence analyses have revealed that there are significant genetic differ- ences between loggerheads nesting in different geo- graphic regions (Bowen et al. 1994, Pearce 2001, Bowen 2003). In the western Atlantic, populations of females Manuscript received 4 March 2008; revised 13 May 2008; accepted 14 May 2008. Corresponding Editor: P. K. Dayton. 4 E-mail: witherington@cfl.rr.com 30
Transcript of Loggerhead Nest Trends

Ecological Applications, 19(1), 2009, pp. 30–54� 2009 by the Ecological Society of America
Decreasing annual nest counts in a globally importantloggerhead sea turtle population
BLAIR WITHERINGTON,1,4 PAUL KUBILIS,2 BETH BROST,3 AND ANNE MEYLAN3
1Florida Fish and Wildlife Conservation Commission, Fish and Wildlife Research Institute, 9700 South A1A,Melbourne Beach, Florida 32951 USA
2Florida Program for Environmental Statistics, IFAS Statistics Department, University of Florida, 419 McCarty Hall C,P.O. Box 110339, Gainesville, Florida 32611 USA
3Florida Fish and Wildlife Conservation Commission, Fish and Wildlife Research Institute, 100 8th Avenue Southeast,St. Petersburg, Florida 33701 USA
Abstract. The loggerhead sea turtle (Caretta caretta) nests on sand beaches, has bothoceanic and neritic life stages, and migrates internationally. We analyzed an 18-year time seriesof Index Nesting Beach Survey (Index) nest-count data to describe spatial and temporal trendsin loggerhead nesting on Florida (USA) beaches. The Index data were highly resolved: 368fixed zones (mean length 0.88 km) were surveyed daily during annual 109-day survey seasons.Spatial and seasonal coverage averaged 69% of estimated total nesting by loggerheads in thestate. We carried out trend analyses on both annual survey-region nest-count totals (N¼ 18)and annual zone-level nest densities (N¼183368¼6624). In both analyses, negative binomialregression models were used to fit restricted cubic spline curves to aggregated nest counts.Between 1989 and 2006, loggerhead nest counts on Florida Index beaches increased and thendeclined, with a net decrease over the 18-year period. This pattern was evident in both a trendmodel of annual survey-region nest-count totals and a mixed-effect, ‘‘single-region’’ trendmodel of annual zone-level nest densities that took into account both spatial and temporalcorrelation between counts. We also saw this pattern in a zone-level model that allowed trendline shapes to vary between six coastal subregions. Annual mean zone-level nest densitydeclined significantly (�28%; 95% CI: �34% to �21%) between 1989 and 2006 and declinedsteeply (�43%; 95% CI: �48% to �39%) during 1998–2006. Rates of change in annual meannest density varied more between coastal subregions during the ‘‘mostly increasing’’ periodprior to 1998 than during the ‘‘steeply declining’’ period after 1998. The excellent fits (observedvs. expected count R2 . 0.91) of the mixed-effect zone-level models confirmed the presence ofstrong, positive, within-zone autocorrelation (R . 0.93) between annual counts, indicating aremarkable year-to-year consistency in the longshore spatial distribution of nests over thesurvey region. We argue that the decline in annual loggerhead nest counts in peninsularFlorida can best be explained by a decline in the number of adult female loggerheads in thepopulation. Causes of this decline are explored.
Key words: Caretta caretta; endangered species; Florida, USA; loggerhead sea turtle; nesting;population decline; spatiotemporal trends.
INTRODUCTION
The loggerhead sea turtle (Caretta caretta) nests on
sand beaches (see Plate 1), has both oceanic and neritic
life stages, and migrates internationally (species reviews
in Dodd [1988], Bolten and Witherington [2003], and
Witherington et al. [2006b]). Worldwide, loggerhead sea
turtle populations are generally recognized as being
depleted, especially in the Pacific (NMFS and USFWS
2007). The species is listed as Endangered on the IUCN
Red List and as Threatened under the U.S. Endangered
Species Act. The Convention on International Trade in
Endangered Species of Wild Fauna and Flora (CITES)
lists loggerhead sea turtles in CITES Appendix I.
Loggerhead foraging areas are mostly in subtropical
and temperate oceans, and the majority of their nesting
beaches are located between 198 and 368 latitude in each
hemisphere (Dodd 1988). Only two loggerhead nesting
assemblages have more than 10 000 females nesting per
year: southern Florida, USA) and Masirah, Oman
(Baldwin et al. 2003, Ehrhart et al. 2003). Assessments
at major nesting beaches worldwide indicate that nesting
beaches in Florida and Oman host ;80–90% of the
world’s loggerhead nesting activity (Baldwin et al. 2003,
Ehrhart et al. 2003, Kamezaki et al. 2003, Limpus and
Limpus 2003, Margaritoulis et al. 2003).
Mitochondrial DNA (mtDNA) sequence analyses
have revealed that there are significant genetic differ-
ences between loggerheads nesting in different geo-
graphic regions (Bowen et al. 1994, Pearce 2001, Bowen
2003). In the western Atlantic, populations of females
Manuscript received 4 March 2008; revised 13 May 2008;accepted 14 May 2008. Corresponding Editor: P. K. Dayton.
4 E-mail: [email protected]
30
Phyllis
Typewritten Text
Tab B, No. 4(a)
nesting on beaches of the southeastern United States
(including Florida), Mexico (Yucatan), and Brazil
(Bahia) are genetically distinct (Encalada et al. 1998).
Based on maternally inherited alleles (from mtDNA),
Florida has four distinct subpopulations, including one
shared with Atlantic U.S. beaches north of Florida
(Encalada et al. 1998, Pearce 2001). These subpopula-
tions are probably maintained by the return of nesting
females to their natal beach (Encalada et al. 1998), with
genetic separations seen at nesting beaches geographi-
cally separated by more than 100 km (Pearce 2001).
However, microsatellite assays by Pearce showed no
significant population structure in terms of nuclear
DNA genotypes. Her conclusions were that male
loggerheads had provided significant gene flow between
nesting beach locations.
Sea turtles in the water are broadly distributed,
genetically mixed, and difficult to count. For these
reasons, the most trusted population-size assessments
have been made at nesting beaches (Meylan 1982,
Schroeder and Murphy 1999). Nesting beaches are
easily surveyed, and the females that emerge to nest on
a stretch of beach are believed to be of a single genetic
stock (Bowen 2003).
On nesting beaches, females crawl above the intertidal
zone, deposit a clutch of eggs in the sand, scatter sand
over the clutch, and return to the water. This activity
leaves conspicuous marks in the sand that can be
identified by trained surveyors, who can determine the
species of sea turtle responsible for the marks and
whether the turtle’s activity resulted in eggs being
deposited (i.e., whether the mark is a nest). Loggerheads
are iteroparous, with a reproductive output that is
distributed between periodic nesting forays within each
migration to the nesting beach. An individual reproduc-
tive loggerhead is likely to make these reproductive
migrations once every few years. Loggerheads show
nest-site fidelity, with most seasonal nest locations of
individual turtles being located within a 5-km range
(reviewed by Schroeder et al. 2003). The number of
clutches (nests) per loggerhead nesting female per season
(clutch frequency) has been estimated to be 3.2–4.2
(reviewed by Schroeder et al. 2003); however, research-
ers recognize that this number is likely to be an
underestimate. A widely accepted estimate for logger-
head clutch frequency is approximately four clutches per
female per season (Murphy and Hopkins 1984).
Population-size assessments estimated from seasonal
nest counts are conducted annually on Florida beaches
for three sea turtle species: loggerheads, green turtles
(Chelonia mydas), and leatherbacks (Dermochelys cori-
acea). The nest counts are made by hundreds of
surveyors in an effort coordinated by the Fish and
Wildlife Research Institute of the Florida Fish and
Wildlife Conservation Commission (FWC). These nest
counts provide the most reliable data from which one
might estimate the number of females nesting in any
year (assuming annually consistent clutch frequencies
per female). A coordinated program to obtain sea turtle
nest counts in Florida began in 1979 and has expandedto include most of Florida’s sandy beaches (1300 km).
Gaps in nesting surveys occur in the Everglades area andin some of the more remote keys in southernmost
Florida. Recognizing the inherent variability in nest-count effort occurring on a broad geographic scale, aconsortium of conservation groups in 1989 established a
subset of surveyed beaches in Florida to represent astandardized index of sea turtle nesting. An FWC-led
program designed to generate nesting indices (theFlorida Index Nesting Beach Survey program) has
resulted in 18 years of highly resolved spatial andtemporal nest counts that are representative of logger-
head nesting in Florida and are suitable for trendassessments. The purpose of this study was to use
analyses of these Index data to describe spatial andtemporal trends in loggerhead nesting on Florida
beaches. In particular, we attempt to characterize adecline in nest counts that appears to have started in the
late 1990s and to determine whether this decline hasvaried geographically or has been consistent over the
Index survey region. In a larger context, we present thisassessment of nesting trends as a way to assess theefficacy of recovery efforts for loggerhead populations
and to measure population effects from threats.
MATERIALS AND METHODS
Nest-count surveys
Since 1989, nest-count surveys in Florida have taken
place under two complementary programs: ‘‘Statewide’’and ‘‘Index.’’ Index beaches (n ¼ 32) are a subset of
Statewide beaches (n ¼ 190) (Fig. 1), and the Indexsurvey season is a subset of the complete nesting season.
Both Index and Statewide survey programs use trainedsurveyors who report nest counts and metadata to acentralized database. The two programs differ in their
goals. The Statewide program has aimed to be ascomplete as possible in seasonal and geographic
coverage, but has not been highly consistent (stretchesof beach have been added, boundaries have fluctuated,
and survey dates have varied). The Index program hasaimed to be consistent in effort, but has not been
complete in seasonal and geographic coverage. The levelof data resolution has also differed between the two
programs. In comparison to the Statewide program, theIndex program collects more highly resolved nest-count
data assigned to individual days and discrete beachzones.
Both Statewide and Index loggerhead nest-count dataused in this study came from daily surveys that took
place during early mornings following the nocturnalnesting activity of loggerheads. Surveyors used visible
characteristics of tracks and nest sites to distinguishloggerhead nests from nests of other sea turtle species(green turtles and leatherbacks) and to distinguish nests
from abandoned nesting attempts (techniques aredescribed by Schroeder and Murphy 1999).
January 2009 31DECREASING LOGGERHEAD NEST COUNTS
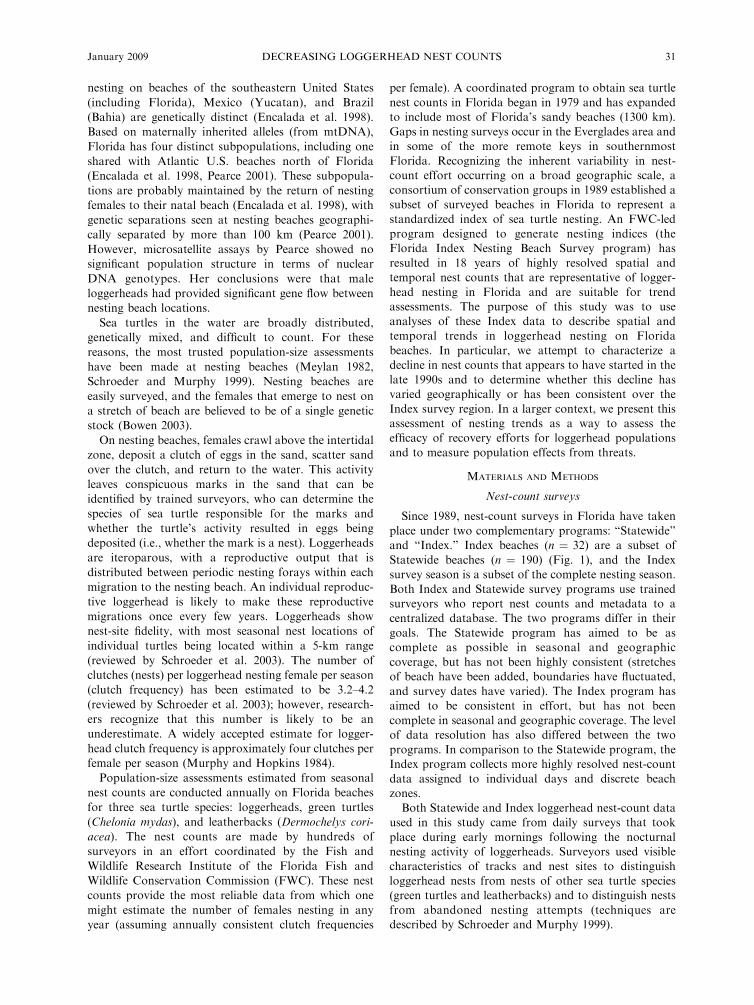
Florida Index beaches are spread throughout the
principal nesting range of the loggerhead in Florida(Fig. 1). These beaches were surveyed daily from 15 May
through 31 August during 1989–2006. On Index beaches
(Appendix: Table A1) where surveyors have madecomplete seasonal nest counts (approximately April–
September), we found that ;90% of each year’sloggerhead nesting on those beaches took place during
the Index survey season (FWC, unpublished data).
During 1989–2006, annual nesting recorded by theIndex program on these beaches averaged 69% 6 5%
(mean 6 SD; range 61–79%) of the estimated total
nesting by loggerheads in the state. Five additionalbeaches on the Gulf of Mexico that are currently
surveyed according to Index protocols were not used in
the analyses because they were added to the program ata later date and have not been monitored for as
extensive a time as the other Index beaches. During
the years that these five beaches have been monitored
(1999–2006), they have accounted for only a small
percentage (0.70% 6 0.05%, mean 6 SD) of total annualnesting on Index beaches. Nesting on all Gulf-coast
beaches of the state represents less than 10% ofStatewide nest-count totals.
Quality assurance and quality control of nest-count
data.—Index-beach surveyors received annual training
in survey methods and followed a standardized protocolfor conducting nest-count surveys. Elements of the
protocol included establishment of consistent beach-
zone locations (recorded by differentially correctedGPS), fixed seasonal start and end dates, and nest-
counting methods. To assure the reliability of daily nestcounts, counting effort was restricted to early-morning
survey periods, and recorded nests were marked to
prevent counting nests more than once. Surveyors alsolimited daily count bias from changing tidal cycles by
counting only nests that were made above the recent
tidemark (the beach area that includes the vast majority
FIG. 1. Sea turtle nesting beaches in Florida, USA, where seasonal nest counts have been made. Gray shoreline shadingrepresents all Statewide beaches surveyed during the period 2001–2006. Dark shading represents Index beaches used in this study;these were surveyed daily from 1989 to 2006 for the Index sampling season (15 May–31 August). The average percentage of totalrecorded Statewide nesting by loggerheads from 2001 to 2006 is presented for each region.
BLAIR WITHERINGTON ET AL.32 Ecological ApplicationsVol. 19, No. 1
of nests). To correctly assign nest counts to the day nests
were made, surveys that were conducted after a missed
survey day were resumed only after nests from the
previous days were marked as not-to-be counted.
We evaluated the diagnostic performance of eight
Index-beach survey projects among the 27 that contrib-
uted nest counts used in our analysis. This evaluation
focused on surveyors’ identification of loggerhead sea
turtle crawls (tracks from nesting attempts, including
completed and abandoned attempts). In our evaluation,
we assumed that loggerhead crawls were conspicuous
and unlikely to be missed if a beach were completely
surveyed. However, we expected that the identification
of crawls as either nests or abandoned nesting attempts
would have error. With this in mind, we measured Index
surveyors’ accuracy in identifying crawls during seven
separate nesting seasons between 1993 and 1999.
Surveyors from one to five randomly selected Index
beaches were evaluated each year. During evaluations
we encountered a total of 451 loggerheads emerging at
night and observed them either nesting (depositing eggs,
n ¼ 344 females) or abandoning their attempt (n ¼ 107
females). A separate group of Index beach surveyors
appraised these pre-identified crawls during their regular
surveys the following morning. These surveyors record-
ed 318 loggerhead nests and 133 abandoned attempts by
loggerheads. Index surveyors correctly identified true
nests as observed nests 91.3% of the time (314/344, 95%
CI: 88.1–94.0%), a rate that represented the sensitivity
(or true positive rate) for identifying nests in the test
population of loggerhead crawls. The false negative rate
(100% � sensitivity) was 8.7% (95% CI: 6.0–11.9%).
Index surveyors correctly recorded true abandoned
nesting attempts 96.3% of the time (103/107, 95% CI:
92.0–99.0%), a rate that represented the specificity (or
true negative rate) for identifying nests in the test
population of crawls. The false positive rate (100% �specificity) was 3.7% (95% CI: 1.0–8.0%). Given the
sensitivity and specificity of Index surveyors for
identifying nests in the test population of loggerhead
crawls and assuming the prevalence of nests among daily
loggerhead crawls in Florida to be ;50% (Florida Fish
and Wildlife Conservation Commission [FWC], unpub-
lished data), the probability that a nest counted by an
Index surveyor was actually a nest was 0.96 (95% CI:
0.92–0.99).
Index nest-count data
Because the goals of our study were to characterize
the spatiotemporal pattern of change in annual logger-
head nest counts over the 18 years of Index nesting
beach surveys, our trend analyses had to take into
account both the key features of the survey design and
the inherent properties of the response variable. In its
most elemental form, the response variable was a daily
count of nests along the shoreline of a survey zone with
fixed boundaries and shoreline length. The daily counts
were carried out in each zone during an annual survey
season lasting 109 days. Nest counts collected from a
total of 368 permanent zones surveyed annually from
1989 to 2006 were used in the analysis. Median shoreline
length of these zones was 0.88 km, with an interquartile
range of 0.76 to 1.02 km and a complete range of 0.12 to
2.00 km. The great majority of these zones (n ¼ 345)
covered 300 km of shoreline and were distributed over
600 km of Florida’s Atlantic coast. These Atlantic zones
were organized into 24 Index beaches (administrative
groups of contiguous zones; Fig. 1). An additional 23
zones organized into three Index beaches covered 24 km
of shoreline distributed over a 65-km stretch of the
southwestern (Gulf of Mexico) coast of Florida (Fig. 1).
For the purposes of our analysis, we considered the
southernmost survey zones on the Atlantic and those on
the southwestern coasts to be separated by a 300-km
shoreline distance. Although the Index survey protocol
specified that nest counts were to be collected daily in
each survey zone during the 109-day survey season,
some daily zone-level counts in any year could be
missing because of weather, beach closures, or other
interruptions in survey effort.
Because a principal purpose of the trend analysis was
to characterize annual change in nest counts and
because the temporal and spatial features of the Index
survey design necessitated the use of computationally
intensive statistical models that could account for both
temporal and spatial correlation between nest counts, we
considered it impractical to model nest counts at the
daily level within annual survey seasons: more than
700 000 daily nest counts were collected across all survey
zones over the 18-year survey period. We therefore
developed a method to appropriately aggregate the large
number of daily zone-level nest counts into total annual
zone-level counts. Because daily nest counts at the zone
level typically increased over the first six to eight weeks
of the survey season and then decreased over the last six
to eight weeks of the season, daily nest counts could not
be simply averaged over the entire 109-day survey
season. This seasonal trend in daily counts would have
caused the season-long average daily count in a survey
zone to be highly dependent upon the temporal pattern
of missing daily counts in that zone. To address this
problem we averaged daily nest counts within biweekly
(once every two weeks) subintervals of the 109-day
survey season and then multiplied them by a standard
level of biweekly survey effort. These standardized
subinterval counts were then summed into an overall
standardized annual count for each zone. This ensured
fair comparisons between zones and between years, even
where some zone-level daily nest counts were missing.
We settled on the appropriateness of two-week
subintervals by comparing the average within-interval
variance of nest counts for various interval lengths to the
variance of daily counts over the entire survey season by
zone and year, respectively. The variance of zone-level
daily nest counts within three-week, two-week, and one-
week subintervals of the 109-day survey season was
January 2009 33DECREASING LOGGERHEAD NEST COUNTS
lower, on average, across all zones in all years by 13%,
18%, and 19%, respectively, when compared to the
variance of zone-level daily nest counts across the entire
survey season. Because the variance of daily nest counts
improved only slightly for one-week subintervals com-
pared to two-week subintervals, while the proportion of
subintervals with completely missing daily counts
increased, we considered it reasonable to divide the
survey season into two-week intervals (except for a final
11-day interval to fill out the 109-day season). These
biweekly intervals aggregate count data within periods
encompassing both spring and neap tides in Florida, and
they also approximate the loggerhead’s inter-nesting
interval (the period between successive nests within a
season; Schroeder et al. 2003). Each of these factors
made biweekly periods a sensible temporal unit for
aggregating nest counts.
Considered across all 368 zones and across 18 annual
survey seasons, there were 52 992 biweekly zone-level
observation intervals in the survey. Complete survey
effort (14 daily nest counts or 11 daily counts in the last
biweekly interval) was achieved for 90.5% (n¼47 968) of
these observation intervals. At least 10 daily counts were
collected for 97.2% (n¼ 51 488) of all biweekly intervals,
and at least seven daily nest counts were collected for
99.1% (n¼ 52 616) of all biweekly intervals.
Only 0.7% of zone-level biweekly observation inter-
vals (n¼ 376) were completely unsurveyed across the 18-
year survey period. Almost all of these intervals
occurred in either 1989 (n ¼ 222) or 1990 (n ¼ 142),
and were due to limited availability of trained observers
in the first two years of the survey. In 1989, 10 zones
were not surveyed at all, and the first and last biweekly
observation intervals of the 109-day annual survey
season were excluded from the survey for 71 zones in
1989 and 1990. The remaining 11 zone-level biweekly
intervals with missing nest counts were not surveyed
because of bad weather or beach closures and occurred
in 1997 (n ¼ 1), 1998 (n ¼ 5), and 2004 (n ¼ 6).
Most of these missing nest counts were within zones
with low nesting densities or were at the beginning or
end of the annual survey season when nest counts are
lowest. Of the 376 biweekly intervals with missing
counts, 85.6% (n ¼ 322) had mean nest counts of fewer
than one per year in corresponding zones and biweekly
periods in years with nest counts. Similarly, 94.6% (n ¼356) had corresponding mean counts of less than three
per year in non-missing years, and 5.3% (n ¼ 20) had
corresponding mean counts ranging from 3 to 158 per
year in non-missing years.
For the relatively small number of biweekly, zone-
level intervals with completely missing daily counts,
daily nest-count rates were imputed using non-missing
nest counts in neighboring zones and biweekly intervals.
A mixed-effect negative binomial count regression
model (McCullagh and Nelder 1989, Wolfinger and
O’Connell 1993), as implemented in SAS PROC
GLIMMIX (Version 9.1; Littell et al. 2006), was used
to fit separately for each year a two-dimensional radial
smoothing spline (Ruppert et al. 2003) to the non-
missing nest counts over a two-dimensional response
surface. The response surface was defined by zone
position along a shoreline axis and the sequence number
of biweekly observation intervals along a time axis. The
number of knots used for smoothing (n¼ 129) and their
location on the radial smoothing-spline surface were
based on the recommendations of Ruppert et al. (2003)
and were selected using the k-d tree option in PROC
GLIMMIX. Daily nest-count rates for the 376 zone-
level biweekly intervals with missing counts were
estimated using the predicted rates at appropriate
locations on the response surface estimated for each of
the five years with completely missing daily counts in
any biweekly interval.
After daily nest-count rates were imputed for the
biweekly intervals with missing counts, daily nest-count
rates (averages) were calculated for all other zone-level
biweekly intervals in all years, and then all daily rates
were multiplied by 14 days (or 11 days for the last
interval of the 109-day season). These standardized
biweekly counts for each zone in each year were then
summed to obtain annual zone-level nest counts
standardized to 109 days of survey effort. The 368
standardized zone-level counts for each year were
summed to obtain standardized total annual nest counts
for the survey region. Because the number of missing
nest counts was small, we considered the error intro-
duced by our imputation and standardization proce-
dures to be relatively small, and no attempt was made to
adjust for this additional error in our trend analyses of
annual nest counts.
Trend analysis of annual nest counts
We conducted trend analyses on both annual survey-
region (SR) nest-count totals (n¼ 18) and annual zone-
level (ZL) nest counts (n ¼ 18 3 368 ¼ 6624). In both
analyses, negative binomial count regression models
(McCullagh and Nelder 1989, Wolfinger and O’Connell
1993), as implemented in SAS PROC GLIMMIX
(Version 9.1; Littell et al. 2006), were used to fit
restricted cubic spline (RCS) curves (Harrell 2001) to
annual nest counts. The number of knots, which
determines the degree of smoothness of the RCS curves,
and the location of the knots along the time scale were
chosen based on recommendations by Harrell (2001).
Analogous Poisson count-regression models were also
considered, but in all cases the residual variability from
these Poisson model fits was highly overdispersed as
indicated by overdispersion parameters (generalized
Pearson v2 statistics divided by residual degrees of
freedom; Littell et al. 2006) greater than 100. Over-
dispersion parameters estimated for most of the negative
binomial regression model fits were typically ideal,
falling between 0.95 and 1.23. Tests based on the t
statistic were used to determine if the estimated
percentage change in predicted mean annual SR or ZL
BLAIR WITHERINGTON ET AL.34 Ecological ApplicationsVol. 19, No. 1
nest counts between selected years differed significantly
from zero. The method of Kenward and Roger (1997)
was used for all ZL nest-count mixed-effect models to
calculate standard errors and degrees of freedom for all
tests based on t statistics and 95% confidence intervals.
Trend analysis of annual survey-region (SR) nest-count
totals.—In the trend analysis of annual SR nest-count
totals, four separate negative binomial regression
models were fitted using one of two different levels of
smoothing for the RCS curves (three-knot or four-knot)
and one of two different correlation structures for
residual errors (independent errors or autocorrelated
errors). An autoregressive (AR(1)) covariance structure
(Littell et al. 2006) was used to model autocorrelated
errors. The AR(1) structure assumed that the correlation
between annual nest counts fell off exponentially as a
function of the number of years separating any two
annual counts. Because of the pseudo-likelihood method
used in PROC GLIMMIX to estimate parameters in
negative binomial and Poisson regression models with
correlated errors (Littell et al. 2006), likelihood-ratio
tests or information criteria such as AIC (Akaike
information criterion; Burnham and Anderson 2002)
could not be used to determine if an autocorrelated error
structure adequately improved model fit compared to an
independent error structure. Instead, the AR(1) covari-
ance parameter estimates were simply compared to their
standard errors. In both the three-knot and four-knot
RCS autocorrelated error models, AR(1) covariance
parameters were greatly exceeded by their standard
errors, indicating no evidence of significant AR(1)
autocorrelation among errors in either the three-knot
or four-knot RCS models.
To determine which level of smoothing yielded the
best model fit for annual SR nest counts in a model with
independent errors, we compared model Akaike weights
based on the small-sample form of the information
criterion, AICc (Burnham and Anderson 2002). These
weights can be interpreted as the relative likelihoods of
the three-knot and four-knot RCS independent-error
models, given the data and this set of two regression
models. The Akaike weights for the three-knot (three-
parameter) and four-knot (four-parameter) models were
0.86 and 0.14, yielding an evidence ratio of 6.1 to 1 in
favor of the three-knot model. Consistent with the
Akaike weights, there was no improvement in the
generalized Pearson v2 statistic in the more flexible (less
smooth) four-knot RCS model (v2 ¼ 17.2) when
compared to the less flexible (more smooth) three-knot
RCS model (v2¼ 17.2). For the 18 observed annual SR
nest-count totals vs. their predicted expected values, R2
¼0.691 (P , 0.0001) for the four-knot RCS independent
errors model, only slightly larger than the three-knot
model value of 0.675 (P , 0.0001). Having established
the three-knot model as the most reasonable and
parsimonious among the four considered, we used it to
estimate percentage change in the predicted expected
value of annual SR nest-count totals between selected
years.
Trend analysis of annual zone-level (ZL) nest
counts.—In the trend analysis of annual zone-level
(ZL) nest counts, we first examined the characteristics
of temporal and spatial correlation between counts so
that appropriate covariance structures could be specified
for regression modeling. We assessed temporal correla-
tion by comparing zone-matched counts (standardized
by zone shoreline length) between all pairwise combi-
nations of the 18 survey years. We calculated Pearson
correlation coefficients (Snedecor and Cochran 1989) for
each pairing of annual ZL counts, grouped the
correlation coefficients by the lag difference between
member years of these pairings, and averaged them by
group. Considered in this way, the annual ZL nest
counts demonstrated remarkably strong autocorrelation
with only very slight decay as the lag difference
increased from 1 to 17 years. The ZL counts that were
separated by 1, 6, 12, and 17 years had average within-
zone correlations of 0.97, 0.96, 0.95, and 0.93. Given
such strong autocorrelation, we also expected to see a
high degree of consistency from year to year in the
pattern of within-year, along-shore spatial variation
among ZL counts.
We conceptualized spatial variation in annual ZL nest
counts (standardized by zone shoreline length) as
occurring in one dimension along a 965-km shoreline
axis. This shoreline axis extended south from the
northernmost survey zone on Florida’s Atlantic coast
to its peninsular tip and then back north to the
northernmost survey zone on Florida’s southwestern
(Gulf of Mexico) coast. We used the midpoints of zone-
shoreline extents as the spatially explicit locations for
ZL counts along this axis. Spatial correlation between
ZL counts could then be characterized by using
variography (Schabenberger and Gotway 2006) to
estimate the correlation between counts as a function
of their distance from each other along the shoreline
axis.
Empirical semivariograms (Schabenberger and Got-
way 2006) estimated separately for the ZL nest counts
from each survey year, using between-zone lag-distance
increments of 0.5 km, appeared remarkably similar
between years, as would be expected given the strong
autocorrelation of ZL counts between years already
noted. The variance of ZL nest-count pair differences
appeared to increase smoothly and exponentially with
increasing lag distance between pair members up to
;17–25 km. Count-difference variances beyond 25 km
still tended to increase slightly, but much less smoothly.
There appeared to be very little evidence of a nugget
effect (a nonzero limit for the variance of count-
difference pairs as the lag distance approaches zero,
possibly due to measurement error or microscale spatial
variation; Schabenberger and Gotway 2006). The
empirical semivariogram for the ZL nest-count 18-year
totals, not surprisingly, appeared to be very similar in
January 2009 35DECREASING LOGGERHEAD NEST COUNTS

shape and smoothness when compared to the annual
semivariograms for ZL nest counts.
To determine the most appropriate spatial covariance
structure to use in the trend analysis of ZL nest counts,
we considered both 18-year total counts and counts
from each year. In each case we compared model-fit
statistics from three negative binomial regression model
fits. For each fit, ZL counts were modeled on the log-
link function scale as a single mean parameter assumed
to be constant over the entire range of the shoreline axis,
plus spatially correlated errors specified by one of three
different spatial covariance structures (exponential,
Gaussian, or spherical; Schabenberger and Gotway
2006). Zone shoreline length was included in each of
the three models as an offset term (McCullagh and
Nelder 1989) to appropriately standardize ZL counts for
fair comparison between different-sized zones. In all
years, and also for the ZL 18-year totals, spatial
covariance parameter estimates greatly exceeded their
standard errors, which further confirmed the presence of
significant spatial correlation among ZL counts. Pearson
v2 statistics were smallest for the spherical covariance
structure, next smallest for the exponential structure,
and largest for the Gaussian structure. However,
corresponding overdispersion parameters for the spher-
ical covariance structure ranged from 0.02 to 0.14,
indicating severe underdispersion in the residual vari-
ability from these model fits. Overdispersion parameters
for the exponential covariance structure ranged from
1.02 to 1.37 and from 1.13 to 1.47 for the Gaussian
structure. These results confirmed our impressions from
the empirical semivariograms and indicated that an
exponential spatial covariance structure would be the
most reasonable structure to use in the trend analysis of
ZL nest counts. In this structure, correlation between
ZL counts was assumed to fall off exponentially as a
function of the shoreline distance between any two
counts.
Although the simultaneous modeling of spatial and
temporal correlation between observations can be
difficult to implement in practice (Schabenberger and
Gotway 2006), the apparent separability and orthogo-
nality of spatial and temporal correlation (Schabenberg-
er and Gotway 2006) among the annual ZL nest counts
allowed us to model them in our trend analysis in a
relatively straightforward manner using covariance
structures available in PROC GLIMMIX. Because the
within-zone correlation between ZL nest counts decayed
so slowly as the number of years between counts
increased from 1 to 17 years (R ¼ 0.97 to 0.93), we
assumed that within-zone correlation between any two
years was effectively constant. The compound symmetry
covariance structure (Littell et al. 2006) implied by this
assumption is frequently used to analyze responses from
repeated-measures study designs in which responses
under each of several treatments are collected from each
subject in the study (Littell et al. 2006). However, unlike
a repeated-measures study in which between-subject
responses under a particular treatment condition are
reasonably assumed to be independent of one another,
the ZL nest counts in any year are not independent of
one another because of their fixed locations along the
shoreline axis of the survey region. We therefore
reparameterized the compound symmetry covariance
structure so that it could be specified in PROC
GLIMMIX as a zone (‘‘subject’’) random effect, and
we then imposed a between-zone exponential spatial
covariance structure on the levels of the zone random
effect. This is equivalent to assuming exponential spatial
correlation between the 18-year averages of ZL nest
counts. This seemed reasonable, given our earlier
assessment of spatial correlation between ZL nest-count
18-year totals. We also imposed a within-year, between-
zone exponential spatial covariance structure on the
residual error matrix (R-side matrix; Littell et al. 2006),
allowing each year to have its own between-zone
variance and spatial-correlation parameters.
Having specified a reasonable spatiotemporal covari-
ance structure for our mixed-effect, negative-binomial
regression modeling framework, we developed a se-
quence of trend models that incorporated this structure.
Zone shoreline length was again included as an offset
term in each model to appropriately standardize ZL nest
counts to densities (nest count per shoreline kilometer).
We first fit three-knot and four-knot RCS time-curves to
the annual ZL nest counts. In these models, we assumed
that each ZL count could be modeled on the log-link
function scale as a single annual mean value predicted
by either of the RCS time curves plus a year-
independent between-zone spatially correlated error
plus a year-specific between-zone spatially correlated
error. We found at least one RCS regression coefficient
to be significantly different from zero (t statistic P ,
0.0001) in both the three-knot and four-knot models,
indicating that both trend lines were nonlinear in shape.
However, the residual variation from the fitted three-
knot model was underdispersed (lower than expected for
a negative binomial count model), as indicated by an
overdispersion parameter value of 0.82, compared to the
more desirable value of 1.02 for the four-knot model.
Because the three-knot and four-knot models were not
nested, and because the pseudolikelihood method we
used to fit all of the mixed-effect, negative-binomial
regression models precluded us from using information
criteria to compare models, we considered the four-knot
model to be a better-fitting model on the basis of the
good agreement between observed and expected levels of
residual variation for this model. For the 6624 observed
ZL nest counts vs. their best least unbiased (BLUP;
Littell et al. 2006) predicted expected values from the
four-knot model, R2 ¼ 0.916 (P , 0.0001).
Trend analysis of annual zone-level (ZL) nest counts
by subregion.—To determine whether the shape of the
four-knot RCS trend line for annual ZL nest counts
depended on location within the survey region, we
defined a categorical subregion variable that represented
BLAIR WITHERINGTON ET AL.36 Ecological ApplicationsVol. 19, No. 1
six Florida subregions (Fig. 1). We then fit two
additional regression models in which the subregions
were allowed to have either parallel or nonparallel trend
lines. In the ‘‘parallel’’ model, the six subregions shared
a common four-knot trend line shape but had different
trend-line intercepts. In the ‘‘nonparallel’’ model, each
subregion was allowed to have its own uniquely shaped
four-knot RCS trend line.
We first compared the parallel subregion trend-lines
model fit to the previously fit ‘‘single-region’’ trend-line
model. Because the single-region (single-intercept) mod-
el could be viewed as nested within the parallel
subregion (multi-intercept) model, we used a Pearson-
like v2 test (Agresti 2002) to determine if the fixed effects
in the parallel subregions model explained more of the
variability in nest counts. Not surprisingly, significantly
more variability was explained by the fixed effects in the
larger, parallel-trend-lines model (v2¼ 31.1, df¼ 5, P ,
0.0001), because of the great variation in mean annual
ZL nest counts among subregions.
Next we compared the parallel-subregion trend-lines
model fit to the nonparallel-subregion trend-lines model
fit. Because the parallel trend-line (multi-intercept,
single-shape) model could be viewed as nested within
the nonparallel trend lines (multi-intercept, multishape)
model, we again used the Pearson-like v2 test to compare
them. The test statistic (v2¼ 170.8, df¼ 15, P , 0.0001)
indicated that significantly more variability was ex-
plained by model fixed effects when each subregion was
allowed to have its own uniquely shaped four-knot RCS
trend line for annual ZL nest counts. For observed ZL
nest counts vs. their BLUP predicted values from the
nonparallel trend-lines model, R2¼ 0.920 (P , 0.0001).
Because the R2 indicator of overall model fit hardly
changed in going from a single-region, trend-line model
to a subregion model with six uniquely shaped trend
lines (0.916 vs. 0.920), we conclude that the additional
variability in ZL nest counts accounted for by fixed
effects in the subregion model was being accounted for
by random-effects covariance structure in the single-
region model.
We used both the single-region and nonparallel
subregion trend-line models to estimate percentage
change in predicted mean annual ZL nest counts
between selected survey years. The 95% confidence
intervals and P values for testing whether the percentage
change differed significantly from zero were adjusted to
compensate for multiple testing of subregions by using a
Bonferroni stepdown procedure (Littell et al. 2006). We
used a global F test to determine if the percentage
change in mean ZL nest densities over a particular
survey time interval differed significantly between
subregions.
RESULTS
Spatiotemporal variation in nest counts
An important result of this trend assessment can be
seen in the detailed spatiotemporal picture of Florida
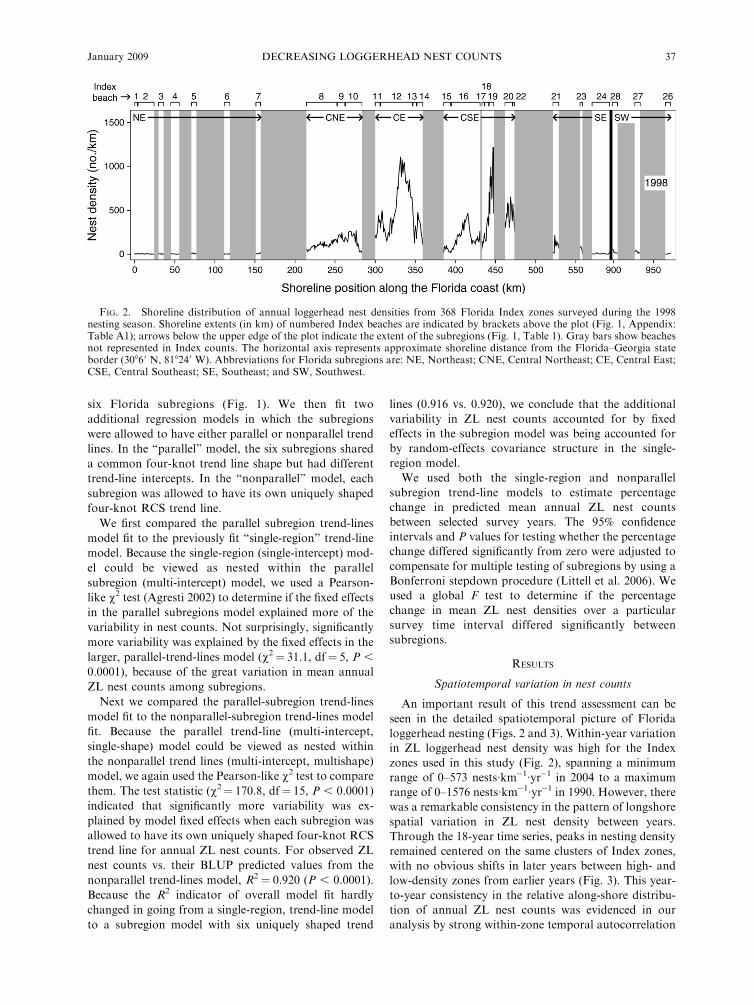
loggerhead nesting (Figs. 2 and 3). Within-year variation
in ZL loggerhead nest density was high for the Index
zones used in this study (Fig. 2), spanning a minimum
range of 0–573 nests�km�1�yr�1 in 2004 to a maximum
range of 0–1576 nests�km�1�yr�1 in 1990. However, there
was a remarkable consistency in the pattern of longshore
spatial variation in ZL nest density between years.
Through the 18-year time series, peaks in nesting density
remained centered on the same clusters of Index zones,
with no obvious shifts in later years between high- and
low-density zones from earlier years (Fig. 3). This year-
to-year consistency in the relative along-shore distribu-
tion of annual ZL nest counts was evidenced in our
analysis by strong within-zone temporal autocorrelation
FIG. 2. Shoreline distribution of annual loggerhead nest densities from 368 Florida Index zones surveyed during the 1998nesting season. Shoreline extents (in km) of numbered Index beaches are indicated by brackets above the plot (Fig. 1, Appendix:Table A1); arrows below the upper edge of the plot indicate the extent of the subregions (Fig. 1, Table 1). Gray bars show beachesnot represented in Index counts. The horizontal axis represents approximate shoreline distance from the Florida–Georgia stateborder (30860 N, 818240 W). Abbreviations for Florida subregions are: NE, Northeast; CNE, Central Northeast; CE, Central East;CSE, Central Southeast; SE, Southeast; and SW, Southwest.
January 2009 37DECREASING LOGGERHEAD NEST COUNTS
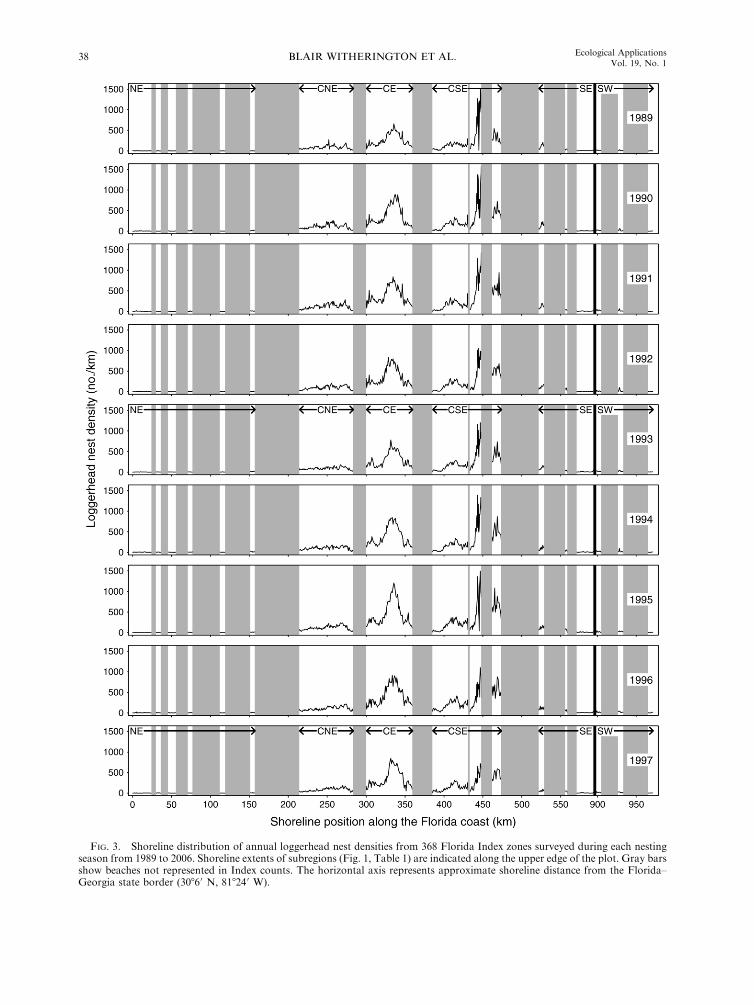
FIG. 3. Shoreline distribution of annual loggerhead nest densities from 368 Florida Index zones surveyed during each nestingseason from 1989 to 2006. Shoreline extents of subregions (Fig. 1, Table 1) are indicated along the upper edge of the plot. Gray barsshow beaches not represented in Index counts. The horizontal axis represents approximate shoreline distance from the Florida–Georgia state border (30860 N, 818240 W).
BLAIR WITHERINGTON ET AL.38 Ecological ApplicationsVol. 19, No. 1
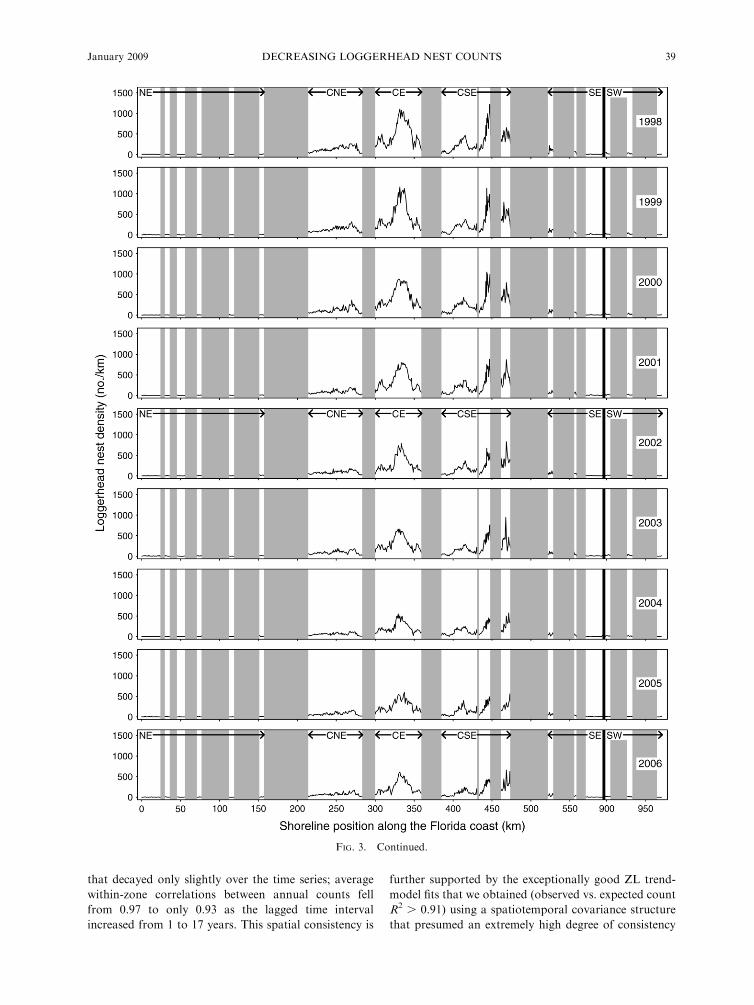
that decayed only slightly over the time series; average
within-zone correlations between annual counts fell
from 0.97 to only 0.93 as the lagged time interval
increased from 1 to 17 years. This spatial consistency is
further supported by the exceptionally good ZL trend-
model fits that we obtained (observed vs. expected count
R2 . 0.91) using a spatiotemporal covariance structure
that presumed an extremely high degree of consistency
FIG. 3. Continued.
January 2009 39DECREASING LOGGERHEAD NEST COUNTS
in within-year spatial covariance among nest counts
from year to year.
Trend analysis of annual nest counts
Each of the negative binomial count regression
models that we used described a similar large-scale
trend in annual loggerhead nest counts. During the 18-
year period between 1989 and 2006, loggerhead nest
counts on Florida Index beaches initially increased but
then declined, with an overall net decrease for the
period. This pattern was evident in the most reasonable
and parsimonious among four trend models of annual
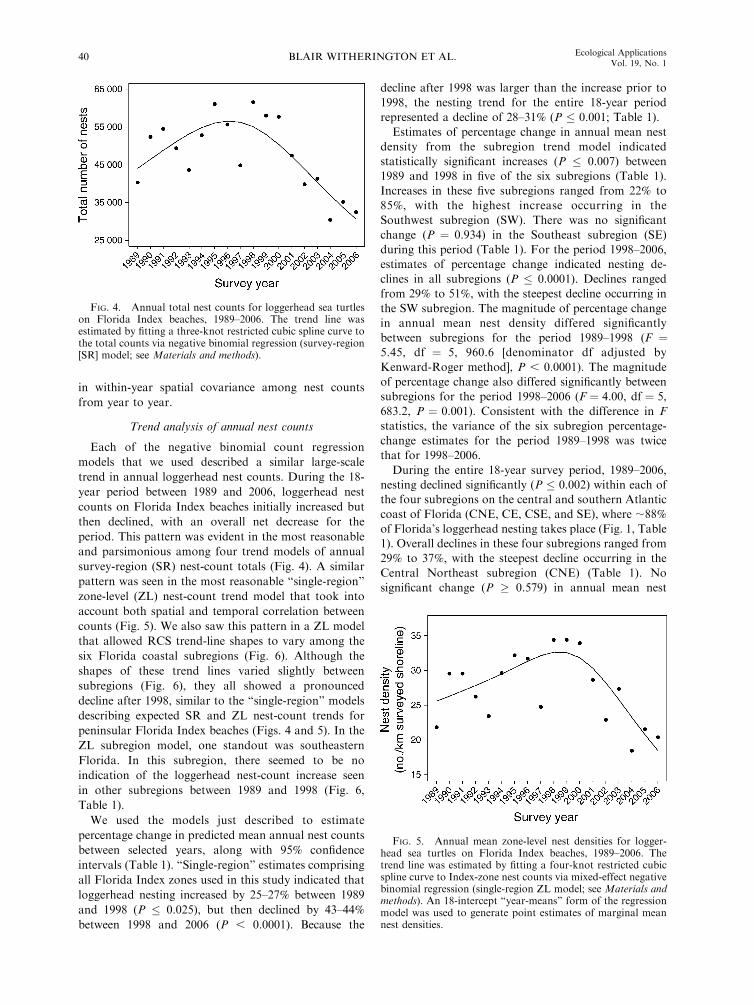
survey-region (SR) nest-count totals (Fig. 4). A similar
pattern was seen in the most reasonable ‘‘single-region’’
zone-level (ZL) nest-count trend model that took into
account both spatial and temporal correlation between
counts (Fig. 5). We also saw this pattern in a ZL model
that allowed RCS trend-line shapes to vary among the
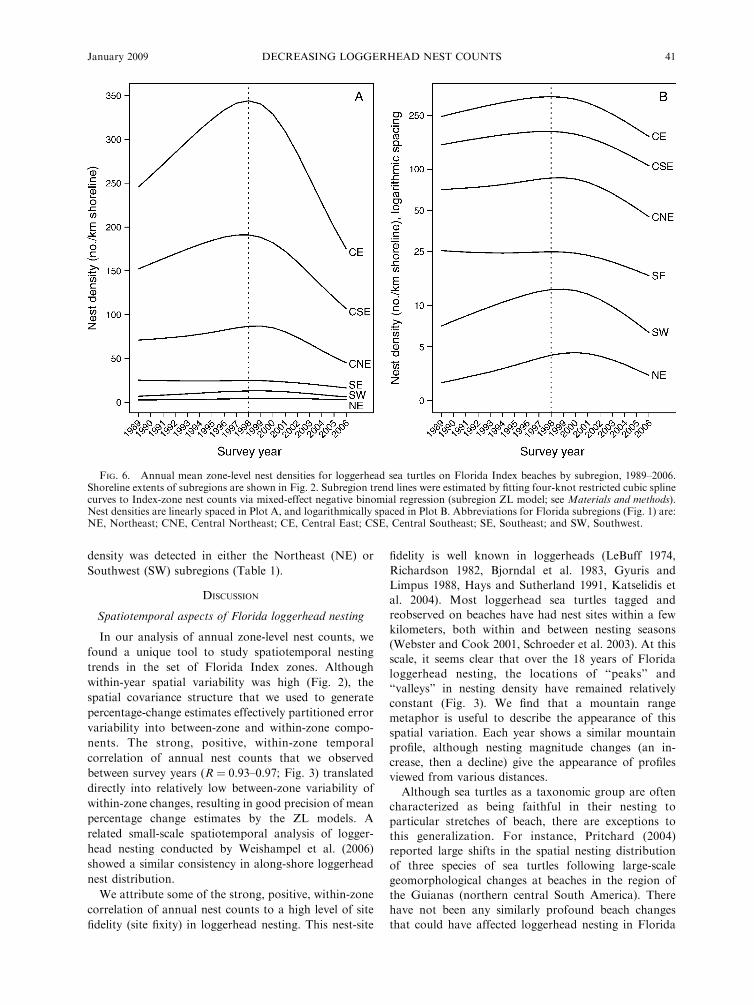
six Florida coastal subregions (Fig. 6). Although the
shapes of these trend lines varied slightly between
subregions (Fig. 6), they all showed a pronounced
decline after 1998, similar to the ‘‘single-region’’ models
describing expected SR and ZL nest-count trends for
peninsular Florida Index beaches (Figs. 4 and 5). In the
ZL subregion model, one standout was southeastern
Florida. In this subregion, there seemed to be no
indication of the loggerhead nest-count increase seen
in other subregions between 1989 and 1998 (Fig. 6,
Table 1).
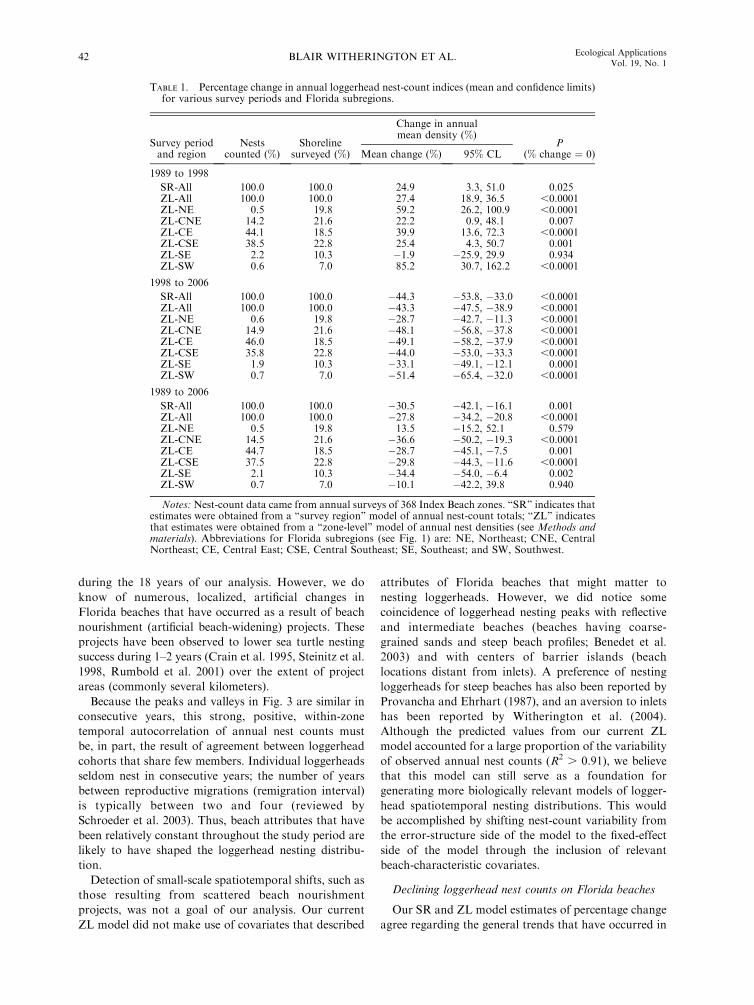
We used the models just described to estimate
percentage change in predicted mean annual nest counts
between selected years, along with 95% confidence
intervals (Table 1). ‘‘Single-region’’ estimates comprising
all Florida Index zones used in this study indicated that
loggerhead nesting increased by 25–27% between 1989
and 1998 (P � 0.025), but then declined by 43–44%
between 1998 and 2006 (P , 0.0001). Because the
decline after 1998 was larger than the increase prior to
1998, the nesting trend for the entire 18-year period
represented a decline of 28–31% (P � 0.001; Table 1).
Estimates of percentage change in annual mean nest
density from the subregion trend model indicated
statistically significant increases (P � 0.007) between
1989 and 1998 in five of the six subregions (Table 1).
Increases in these five subregions ranged from 22% to
85%, with the highest increase occurring in the
Southwest subregion (SW). There was no significant
change (P ¼ 0.934) in the Southeast subregion (SE)
during this period (Table 1). For the period 1998–2006,
estimates of percentage change indicated nesting de-
clines in all subregions (P � 0.0001). Declines ranged
from 29% to 51%, with the steepest decline occurring in
the SW subregion. The magnitude of percentage change
in annual mean nest density differed significantly
between subregions for the period 1989–1998 (F ¼5.45, df ¼ 5, 960.6 [denominator df adjusted by
Kenward-Roger method], P , 0.0001). The magnitude
of percentage change also differed significantly between
subregions for the period 1998–2006 (F ¼ 4.00, df ¼ 5,
683.2, P ¼ 0.001). Consistent with the difference in F
statistics, the variance of the six subregion percentage-
change estimates for the period 1989–1998 was twice
that for 1998–2006.
During the entire 18-year survey period, 1989–2006,
nesting declined significantly (P � 0.002) within each of
the four subregions on the central and southern Atlantic
coast of Florida (CNE, CE, CSE, and SE), where ;88%
of Florida’s loggerhead nesting takes place (Fig. 1, Table
1). Overall declines in these four subregions ranged from
29% to 37%, with the steepest decline occurring in the
Central Northeast subregion (CNE) (Table 1). No
significant change (P � 0.579) in annual mean nest
FIG. 5. Annual mean zone-level nest densities for logger-head sea turtles on Florida Index beaches, 1989–2006. Thetrend line was estimated by fitting a four-knot restricted cubicspline curve to Index-zone nest counts via mixed-effect negativebinomial regression (single-region ZL model; see Materials andmethods). An 18-intercept ‘‘year-means’’ form of the regressionmodel was used to generate point estimates of marginal meannest densities.
FIG. 4. Annual total nest counts for loggerhead sea turtleson Florida Index beaches, 1989–2006. The trend line wasestimated by fitting a three-knot restricted cubic spline curve tothe total counts via negative binomial regression (survey-region[SR] model; see Materials and methods).
BLAIR WITHERINGTON ET AL.40 Ecological ApplicationsVol. 19, No. 1
density was detected in either the Northeast (NE) or
Southwest (SW) subregions (Table 1).
DISCUSSION
Spatiotemporal aspects of Florida loggerhead nesting
In our analysis of annual zone-level nest counts, we
found a unique tool to study spatiotemporal nesting
trends in the set of Florida Index zones. Although
within-year spatial variability was high (Fig. 2), the
spatial covariance structure that we used to generate
percentage-change estimates effectively partitioned error
variability into between-zone and within-zone compo-
nents. The strong, positive, within-zone temporal
correlation of annual nest counts that we observed
between survey years (R ¼ 0.93–0.97; Fig. 3) translated
directly into relatively low between-zone variability of
within-zone changes, resulting in good precision of mean
percentage change estimates by the ZL models. A
related small-scale spatiotemporal analysis of logger-
head nesting conducted by Weishampel et al. (2006)
showed a similar consistency in along-shore loggerhead
nest distribution.
We attribute some of the strong, positive, within-zone
correlation of annual nest counts to a high level of site
fidelity (site fixity) in loggerhead nesting. This nest-site
fidelity is well known in loggerheads (LeBuff 1974,
Richardson 1982, Bjorndal et al. 1983, Gyuris and
Limpus 1988, Hays and Sutherland 1991, Katselidis et
al. 2004). Most loggerhead sea turtles tagged and
reobserved on beaches have had nest sites within a few
kilometers, both within and between nesting seasons
(Webster and Cook 2001, Schroeder et al. 2003). At this
scale, it seems clear that over the 18 years of Florida
loggerhead nesting, the locations of ‘‘peaks’’ and
‘‘valleys’’ in nesting density have remained relatively
constant (Fig. 3). We find that a mountain range
metaphor is useful to describe the appearance of this
spatial variation. Each year shows a similar mountain
profile, although nesting magnitude changes (an in-
crease, then a decline) give the appearance of profiles
viewed from various distances.
Although sea turtles as a taxonomic group are often
characterized as being faithful in their nesting to
particular stretches of beach, there are exceptions to
this generalization. For instance, Pritchard (2004)
reported large shifts in the spatial nesting distribution
of three species of sea turtles following large-scale
geomorphological changes at beaches in the region of
the Guianas (northern central South America). There
have not been any similarly profound beach changes
that could have affected loggerhead nesting in Florida
FIG. 6. Annual mean zone-level nest densities for loggerhead sea turtles on Florida Index beaches by subregion, 1989–2006.Shoreline extents of subregions are shown in Fig. 2. Subregion trend lines were estimated by fitting four-knot restricted cubic splinecurves to Index-zone nest counts via mixed-effect negative binomial regression (subregion ZL model; see Materials and methods).Nest densities are linearly spaced in Plot A, and logarithmically spaced in Plot B. Abbreviations for Florida subregions (Fig. 1) are:NE, Northeast; CNE, Central Northeast; CE, Central East; CSE, Central Southeast; SE, Southeast; and SW, Southwest.
January 2009 41DECREASING LOGGERHEAD NEST COUNTS
during the 18 years of our analysis. However, we do
know of numerous, localized, artificial changes in
Florida beaches that have occurred as a result of beach
nourishment (artificial beach-widening) projects. These
projects have been observed to lower sea turtle nesting
success during 1–2 years (Crain et al. 1995, Steinitz et al.
1998, Rumbold et al. 2001) over the extent of project
areas (commonly several kilometers).
Because the peaks and valleys in Fig. 3 are similar in
consecutive years, this strong, positive, within-zone
temporal autocorrelation of annual nest counts must
be, in part, the result of agreement between loggerhead
cohorts that share few members. Individual loggerheads
seldom nest in consecutive years; the number of years
between reproductive migrations (remigration interval)
is typically between two and four (reviewed by
Schroeder et al. 2003). Thus, beach attributes that have
been relatively constant throughout the study period are
likely to have shaped the loggerhead nesting distribu-
tion.
Detection of small-scale spatiotemporal shifts, such as
those resulting from scattered beach nourishment
projects, was not a goal of our analysis. Our current
ZL model did not make use of covariates that described
attributes of Florida beaches that might matter to
nesting loggerheads. However, we did notice some
coincidence of loggerhead nesting peaks with reflective
and intermediate beaches (beaches having coarse-
grained sands and steep beach profiles; Benedet et al.
2003) and with centers of barrier islands (beach
locations distant from inlets). A preference of nesting
loggerheads for steep beaches has also been reported by
Provancha and Ehrhart (1987), and an aversion to inlets
has been reported by Witherington et al. (2004).
Although the predicted values from our current ZL
model accounted for a large proportion of the variability
of observed annual nest counts (R2 . 0.91), we believe
that this model can still serve as a foundation for
generating more biologically relevant models of logger-
head spatiotemporal nesting distributions. This would
be accomplished by shifting nest-count variability from
the error-structure side of the model to the fixed-effect
side of the model through the inclusion of relevant
beach-characteristic covariates.
Declining loggerhead nest counts on Florida beaches
Our SR and ZL model estimates of percentage change
agree regarding the general trends that have occurred in
TABLE 1. Percentage change in annual loggerhead nest-count indices (mean and confidence limits)for various survey periods and Florida subregions.
Survey periodand region
Nestscounted (%)
Shorelinesurveyed (%)
Change in annualmean density (%)
P(% change ¼ 0)Mean change (%) 95% CL
1989 to 1998
SR-All 100.0 100.0 24.9 3.3, 51.0 0.025ZL-All 100.0 100.0 27.4 18.9, 36.5 ,0.0001ZL-NE 0.5 19.8 59.2 26.2, 100.9 ,0.0001ZL-CNE 14.2 21.6 22.2 0.9, 48.1 0.007ZL-CE 44.1 18.5 39.9 13.6, 72.3 ,0.0001ZL-CSE 38.5 22.8 25.4 4.3, 50.7 0.001ZL-SE 2.2 10.3 �1.9 �25.9, 29.9 0.934ZL-SW 0.6 7.0 85.2 30.7, 162.2 ,0.0001
1998 to 2006
SR-All 100.0 100.0 �44.3 �53.8, �33.0 ,0.0001ZL-All 100.0 100.0 �43.3 �47.5, �38.9 ,0.0001ZL-NE 0.6 19.8 �28.7 �42.7, �11.3 ,0.0001ZL-CNE 14.9 21.6 �48.1 �56.8, �37.8 ,0.0001ZL-CE 46.0 18.5 �49.1 �58.2, �37.9 ,0.0001ZL-CSE 35.8 22.8 �44.0 �53.0, �33.3 ,0.0001ZL-SE 1.9 10.3 �33.1 �49.1, �12.1 0.0001ZL-SW 0.7 7.0 �51.4 �65.4, �32.0 ,0.0001
1989 to 2006
SR-All 100.0 100.0 �30.5 �42.1, �16.1 0.001ZL-All 100.0 100.0 �27.8 �34.2, �20.8 ,0.0001ZL-NE 0.5 19.8 13.5 �15.2, 52.1 0.579ZL-CNE 14.5 21.6 �36.6 �50.2, �19.3 ,0.0001ZL-CE 44.7 18.5 �28.7 �45.1, �7.5 0.001ZL-CSE 37.5 22.8 �29.8 �44.3, �11.6 ,0.0001ZL-SE 2.1 10.3 �34.4 �54.0, �6.4 0.002ZL-SW 0.7 7.0 �10.1 �42.2, 39.8 0.940
Notes:Nest-count data came from annual surveys of 368 Index Beach zones. ‘‘SR’’ indicates thatestimates were obtained from a ‘‘survey region’’ model of annual nest-count totals; ‘‘ZL’’ indicatesthat estimates were obtained from a ‘‘zone-level’’ model of annual nest densities (see Methods andmaterials). Abbreviations for Florida subregions (see Fig. 1) are: NE, Northeast; CNE, CentralNortheast; CE, Central East; CSE, Central Southeast; SE, Southeast; and SW, Southwest.
BLAIR WITHERINGTON ET AL.42 Ecological ApplicationsVol. 19, No. 1
loggerhead nesting within Florida’s Index beach zones.
These trends indicate that Florida’s loggerhead nest
counts have declined significantly between 1989 and
2006 and have shown a steep decline within the mostrecent period, 1998–2006 (Table 1). With the shape of
the estimated RCS trend lines as a guide, we believe that
Florida loggerhead nesting increased before 1998, but
then declined steeply (Figs. 4 and 5).
Possible effects from local spatial shifts.—Adverse
beach and nearshore conditions, present in Florida andthought to locally affect nesting activity include: chronic
erosion; acute erosion from tropical storms and hurri-
canes; coastal armoring; artificial lighting; human beach
activity; and periodic, coastal upwelling of cold water
(Lutcavage et al. 1997, Witherington 2003; B. E.Witherington, personal observation). Each of these
phenomena is relatively localized or brief and would
be expected to show effects within the spatiotemporal
scale of Fig. 3. Although some combination of these
effects may be influencing subtle subregional differencesin nesting trends (Fig. 6), we do not believe that region-
wide effects near beaches have produced the observed
nesting decline. If adverse beach conditions have caused
loggerhead nesting declines in Florida, then these same
conditions would be expected to have similar effects onother species of sea turtles nesting on Florida beaches.
In Florida, green turtles have similar nesting habitat
requirements, a similar nesting season (late-May–Sep-
tember), and have peaks in their spatial distribution that
match peaks in loggerhead nesting (Witherington et al.2006a, b; Florida Fish and Wildlife Conservation
Commission [FWC], unpublished data). Unlike logger-
head nesting, green turtle nesting in Florida has been
increasing significantly (Witherington et al. 2006a; data
available online).5
An important indicator of adverse beach conditions issea turtle nesting success (the proportion of nesting
attempts that result in a nest). Many beach conditions
that discourage or prevent nesting (e.g., effects from
beach nourishment; Rumbold et al. 2001) result in low
nesting success and a high number of abandoned nestingattempts. Nesting success of loggerheads on the 27 Index
beaches used in our analyses averaged 0.51 nests per
attempt (95% CI: 0.50–0.53), with no significant linear
pattern in temporal variation (R2¼0.17, P¼0.084). One
low outlier in the annual time series, with a nestingsuccess ratio of 0.41, occurred in 2005, a year in which
many anthropogenic changes to Florida’s beaches
(artificial sand placement) occurred following erosion
from hurricanes in 2004. Nesting success rose to 0.49
nests per attempt in 2006. We find no indication fromvariation in nesting success that would signal increasing
effects from adverse beach conditions large enough to
have resulted in the decline in nest counts that we
present here.
Given the between-year spatial consistency in logger-
head nest counts at Index zones, we consider it unlikely
that spatial shifts occurred that would have changed the
representative nature of Florida Index zones over the 18
years of our analysis. Evidence to support this conten-
tion comes from our ZL modeling exercise, in which
within-zone autocorrelation diminished only slightly
even after a 17-year lag. We also see no evidence of
spatial shifts in the within-year spatial nest-count
distributions, which are recognizable as the same
along-shore ‘‘mountain range’’ in each survey year
(Fig. 3).
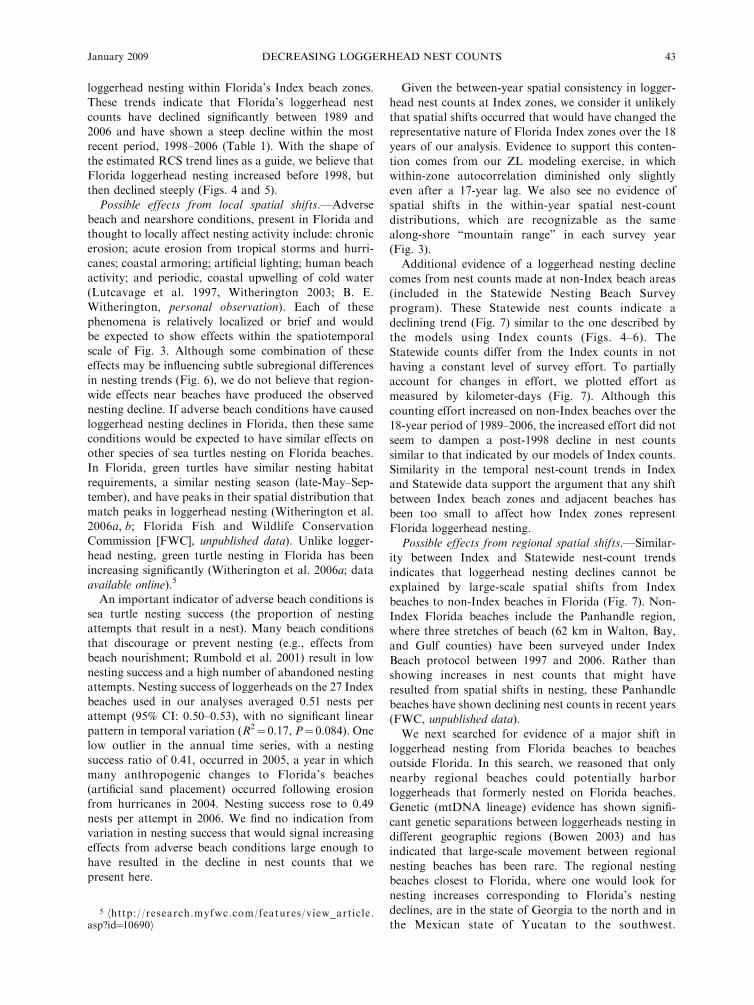
Additional evidence of a loggerhead nesting decline
comes from nest counts made at non-Index beach areas
(included in the Statewide Nesting Beach Survey
program). These Statewide nest counts indicate a
declining trend (Fig. 7) similar to the one described by
the models using Index counts (Figs. 4–6). The
Statewide counts differ from the Index counts in not
having a constant level of survey effort. To partially
account for changes in effort, we plotted effort as
measured by kilometer-days (Fig. 7). Although this
counting effort increased on non-Index beaches over the
18-year period of 1989–2006, the increased effort did not
seem to dampen a post-1998 decline in nest counts
similar to that indicated by our models of Index counts.
Similarity in the temporal nest-count trends in Index
and Statewide data support the argument that any shift
between Index beach zones and adjacent beaches has
been too small to affect how Index zones represent
Florida loggerhead nesting.
Possible effects from regional spatial shifts.—Similar-
ity between Index and Statewide nest-count trends
indicates that loggerhead nesting declines cannot be
explained by large-scale spatial shifts from Index
beaches to non-Index beaches in Florida (Fig. 7). Non-
Index Florida beaches include the Panhandle region,
where three stretches of beach (62 km in Walton, Bay,
and Gulf counties) have been surveyed under Index
Beach protocol between 1997 and 2006. Rather than
showing increases in nest counts that might have
resulted from spatial shifts in nesting, these Panhandle
beaches have shown declining nest counts in recent years
(FWC, unpublished data).
We next searched for evidence of a major shift in
loggerhead nesting from Florida beaches to beaches
outside Florida. In this search, we reasoned that only
nearby regional beaches could potentially harbor
loggerheads that formerly nested on Florida beaches.
Genetic (mtDNA lineage) evidence has shown signifi-
cant genetic separations between loggerheads nesting in
different geographic regions (Bowen 2003) and has
indicated that large-scale movement between regional
nesting beaches has been rare. The regional nesting
beaches closest to Florida, where one would look for
nesting increases corresponding to Florida’s nesting
declines, are in the state of Georgia to the north and in
the Mexican state of Yucatan to the southwest.
5 hhttp://research.myfwc.com/features/view_article.asp?id¼10690i
January 2009 43DECREASING LOGGERHEAD NEST COUNTS
Standardized surveys at 11 beaches in North Carolina,
South Carolina, and Georgia indicate a 1.9% annual
decline from 1983 to 2005 (NMFS and USFWS 2007),
and in Yucatan, loggerhead nesting between 1987 and
2006 increased and then declined in a pattern similar to
that seen in our analysis of Florida Index nest counts
(Zurita et al. 2003, Arenas-Martinez 2005; J. Zurita,
personal communication). We note that increases in
loggerhead nesting outside Florida would have had to be
profoundly steep in order to explain Florida nesting
declines; Florida hosts ;90% of regional loggerhead
nesting (including Mexico, the wider Caribbean, and the
eastern United States; Ehrhart et al. 2003).
Possible effects from temporal shifts in nesting
activity.—Because Florida’s Index nest-count period
(survey season) is constant from year to year (15 May–
31 August), it is possible that temporal shifts in
loggerhead nesting could have influenced the Index
counts made over the 18-year time series. Weishampel et
al. (2004) suggested such a temporal shift following
observations that the median nesting date of logger-
heads nesting on a Florida beach advanced 10 days over
a 15-year period. Working at a nearby loggerhead
nesting beach, Pike et al. (2006) found changes in season
length that may explain the shift in median date. These
changes in season length occurred because fewer nests
were made in September, following the end of the Index
season surveyed in our analysis. Such a shift would be
expected to dampen apparent nesting declines in Index
nest counts.
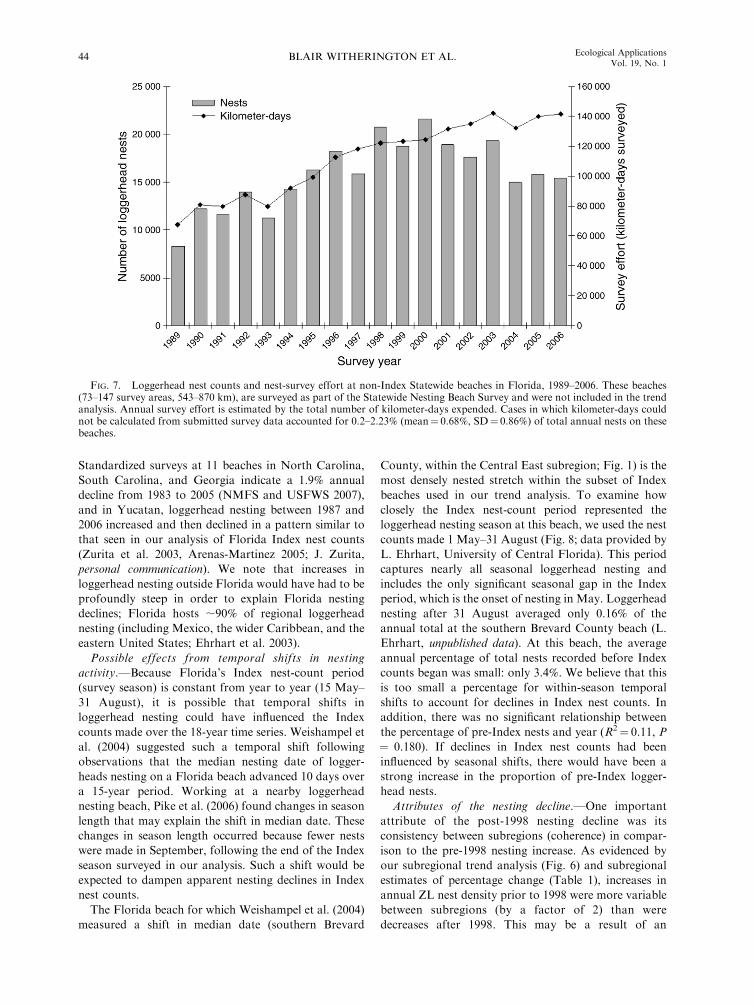
The Florida beach for which Weishampel et al. (2004)
measured a shift in median date (southern Brevard
County, within the Central East subregion; Fig. 1) is the
most densely nested stretch within the subset of Index
beaches used in our trend analysis. To examine how
closely the Index nest-count period represented the
loggerhead nesting season at this beach, we used the nest
counts made 1 May–31 August (Fig. 8; data provided by
L. Ehrhart, University of Central Florida). This period
captures nearly all seasonal loggerhead nesting and
includes the only significant seasonal gap in the Index
period, which is the onset of nesting in May. Loggerhead
nesting after 31 August averaged only 0.16% of the
annual total at the southern Brevard County beach (L.
Ehrhart, unpublished data). At this beach, the average
annual percentage of total nests recorded before Index
counts began was small: only 3.4%. We believe that this
is too small a percentage for within-season temporal
shifts to account for declines in Index nest counts. In
addition, there was no significant relationship between
the percentage of pre-Index nests and year (R2¼ 0.11, P
¼ 0.180). If declines in Index nest counts had been
influenced by seasonal shifts, there would have been a
strong increase in the proportion of pre-Index logger-
head nests.
Attributes of the nesting decline.—One important
attribute of the post-1998 nesting decline was its
consistency between subregions (coherence) in compar-
ison to the pre-1998 nesting increase. As evidenced by
our subregional trend analysis (Fig. 6) and subregional
estimates of percentage change (Table 1), increases in
annual ZL nest density prior to 1998 were more variable
between subregions (by a factor of 2) than were
decreases after 1998. This may be a result of an
FIG. 7. Loggerhead nest counts and nest-survey effort at non-Index Statewide beaches in Florida, 1989–2006. These beaches(73–147 survey areas, 543–870 km), are surveyed as part of the Statewide Nesting Beach Survey and were not included in the trendanalysis. Annual survey effort is estimated by the total number of kilometer-days expended. Cases in which kilometer-days couldnot be calculated from submitted survey data accounted for 0.2–2.23% (mean¼ 0.68%, SD¼ 0.86%) of total annual nests on thesebeaches.
BLAIR WITHERINGTON ET AL.44 Ecological ApplicationsVol. 19, No. 1
abundance of recruits during the (mostly) increasing
period and fewer recruits during the declining period.
Loggerhead recruits (neophytes) have been shown to
have a higher variability in nest-site choice (greater
distances between successive nests) in comparison to
remigrant turtles (those identified during previous
nesting seasons) (Hays and Sutherland 1991, Katselidis
et al. 2004). It is possible that the high degree of
consistency in the rate of decline among beaches and
subregions after 1998 was related to a lowered recruit-
ment rate (fewer immature loggerheads surviving to
adulthood) over the entire survey region.
Does a Florida nesting decline indicate population decline?
Although nest counts are widely used as a proxy for
adult sea turtle population size (Meylan 1982, Schroeder
and Murphy 1999), variation in reproductive rates
among individuals has the potential to change nest
numbers even when the population of adult females is
stable (Hays 2000). The two most important reproduc-
tive rates influencing nest numbers are clutch frequency
(nests per female per seasonal migration) and remigra-
tion interval (years between seasonal migrations).
Clutch frequency has been measured by repeatedly
observing nesting turtles identified by flipper tags.
Considerable errors in these measures come from turtles
that nest unobserved. Because of this, extensive research
projects that tag nearly every nesting turtle (e.g., Hughes
1974, Frazer and Richardson 1985) provide the most
reliable estimates. Frazer and Richardson (1985) esti-
mated mean annual clutch frequencies for loggerheads
nesting on Little Cumberland Island, Georgia, USA,
and found this rate to range between 2.81 and 4.18 nests
per female per season over a 10-year period during the
1970s and 1980s. Within this range, years with high
nesting levels tended to have the highest mean clutch
frequencies. However, Frazer and Richardson did not
find any temporal pattern in clutch frequency, such as a
steady decline, which could explain a multiyear decline
in nest counts. These clutch frequencies for Georgia
loggerheads varied ;20% around a median rate over 10
years. Annual variation in mean clutch frequency for
loggerheads nesting in Natal, South Africa, ranged
between 3.65 and 4.21 nests per female per season over a
four-year period (Hughes 1974), which is ;7% around a
central rate. This variation has been far lower than the
change that we measured in Florida loggerhead nest
counts (43–44% in eight years). Additional long-term
studies are needed to fully describe the role of
loggerhead clutch frequency in annual nesting variation.
Remigration intervals for loggerheads have been
reported from many locations and time periods.
Research projects in which extensive tagging of logger-
heads allows the most reliable remigration interval
estimates include projects at Little Cumberland Island,
Georgia (mean ¼ 2.54 years, n ¼ 242; Richardson et al.
1978); Brevard County, Florida (mean¼ 2.71 years, n¼161; Bjorndal et al. 1983); Natal, South Africa (mean¼2.58 years, n ¼ 740; Hughes 1982); and Queensland,
Australia (mean ¼ 2.98 years, n ¼ 1112; Limpus 1985).
These rates vary ;7% around a central value. Green
turtles nesting in Australia have shown some nesting
peaks that lag two years behind recurrence of the El
Nino Southern Oscillation (Limpus and Nicholls 2000).
However, this cycle was superimposed over a shorter (2–
3 year) and more pronounced cycle that is probably
driven by a similar period in remigration interval. In an
examination of remigration intervals of Atlantic green
turtles, Solow et al. (2002) showed that cycles correlated
with winter (non-nesting season) sea-surface tempera-
ture, but there was no indication that interruption in the
turtle’s typical two-year reproductive cycle was more
than temporary (one or two years). Saba et al. (2007)
demonstrated a similar correlation between leatherback
turtle remigration interval and the Pacific El Nino
Southern Oscillation. This correlation suggested cycles
set over approximately five years, but gave no indication
of longer trends in changing remigration intervals. There
is no evidence for periodicity in loggerhead remigration
intervals approaching the length of the decline that we
describe here.
Because variation in loggerhead clutch frequency and
remigration interval are known to exist, it is clear that
these rates affect nest counts on beaches and add
FIG. 8. Annual percentage of loggerheadnests recorded before the start date of surveyson 21 (21 km) Index beach zones in southBrevard County, Florida. In this analysis, thepre-Index period was 1–14 May, and the Indexnesting season was 15 May–31 August. Annualloggerhead nests recorded after 31 August onthese beaches averaged only 0.16% between 1989and 2006. Data are from L. Ehrhart, Universityof Central Florida.
January 2009 45DECREASING LOGGERHEAD NEST COUNTS
uncertainty to estimations of adult females from nest
counts. If changes in loggerhead reproductive parame-
ters are occurring because of environmental factors
affecting Florida sea turtles, these factors do not seem to
have affected nesting by green turtles and leatherbacks,
which have had their respective Florida nest counts
increase by a factor of 6 and 10 during the period 1989–
2007 (Chaloupka et al. 2008; FWC, unpublished data).
One could postulate that the declines in Florida
loggerhead nesting that we have shown are largely the
result of declining clutch frequencies and lengthening
remigration intervals. However, given that there are no
studies to support declines in reproductive rates of
loggerheads anywhere in the world, it is also possible
that these rates have increased and that decline in adult
female loggerheads has been more severe than nest
counts indicate. In our assessment of coherence in the
nesting decline (Fig. 6, Table 1), we suggested that loss
of adult recruitment might explain the post-1998 decline.
One important effect of reduced recruitment could have
been an increase in clutch frequency among turtles in the
nesting population. Neophyte loggerheads are observed
to have lower clutch frequencies than remigrants (Frazer
and Richardson 1985, Hawkes et al. 2005). Thus, we
expect that, for a given level of population decline,
decreased recruitment would reduce nest counts less
than an increase in adult mortality. If, as we suspect,
Florida’s nesting decline has predominantly involved
lower recruitment, the rates of decline that we report
here would underestimate the corresponding decline in
nesting females.
Another scenario in which nest counts could decline
without a simultaneous decline in population numbers
would be if some surviving females failed to reproduce,
as might occur if mates were not available. Because
primary sex ratios of sea turtles are determined by nest
incubation temperature (Mrosovsky 1980), it is possible
that global climate changes that took place ;50 years
ago (one generation prior to the nesting decline)
significantly skewed operational sex ratios. However,
there are no data suggesting that there are insufficient
loggerhead males to fertilize females in the population.
Such a decrease in mate availability might affect clutch
viability rates far more than it might affect clutch
frequency or remigration interval. We are not aware of
evidence for any change in the proportion of infertile
eggs, or in the degree of multiple paternity in loggerhead
clutches.
Although nest counts are likely to be a reliable index
of the number of adult females in the population, and
are also an index of hatchling recruitment, they do not
immediately reflect the number of loggerheads in
intermediate, juvenile, life stages. This is an important
consideration regarding the forecasting of population
trends. No regionally indexed count of immature
loggerheads exists, largely because of the difficulty in
observing these turtles in the marine environment.
Potential causes of the Florida loggerhead decline
For the reasons just outlined, we believe that theobserved decline in the annual counts of loggerhead
nests on Index and Statewide beaches in peninsularFlorida can best be explained by a decline in the number
of adult female loggerheads in the population. Identify-ing the potential causes of a decline in nesting females is
not a straightforward task because individuals from thispopulation may traverse the Atlantic Ocean basin and
even enter the Mediterranean Sea in their lifetimes,which may span a half-century or more. Each life stage
(egg, hatchling, juvenile, and adult) has its own array ofthreats (reviewed by Lutcavage et al. 1997, NMFS and
USFWS 2007). A further complication in understandingpopulation declines is the late age of sexual maturation
of most sea turtles, estimated to be 20–35 yrs in Atlanticloggerheads (Parham and Zug 1997, Bjorndal et al.
2001, Snover 2002). A consequence of this life historycharacteristic is that the effects from threats acting onthe earliest life stages may not manifest themselves at the
nesting beach for 30 years or more, making it difficult tolink cause and effect and to assess the efficacy of
management efforts.The decline in the number of loggerheads nesting on
Florida beaches might be attributed to reduced femalehatchling production at Florida nesting beaches (begin-
ning ;30–45 years ago), to increased mortality ofimmature females (occurring ;10–30 years ago), or to
increased mortality of mature females (occurringthrough the last decade or more). Under the scenarios
of reduced hatchling production and increased mortalityof immature turtles, nesting females that die would not
be replaced because the supply in the ‘‘pipeline’’ woulddwindle. This loss might not be apparent until there was
a drop in nesting activity, as is the case now.In comparing effects from mortality during various
loggerhead life stages, one should consider stagereproductive values (age-specific expectation of future
offspring; Pianka 1994) in addition to death rates.Mortality among older-juvenile and young-adult log-
gerheads, which have high reproductive values, has amuch greater effect on population growth than doesmortality in eggs and hatchlings, stages that have
relatively low reproductive values (Crouse et al. 1987).Reduced female hatchling production at nesting beach-
es.—Given the influence of temperature on loggerheadhatchling sex ratios (Yntema and Mrosovsky 1982), it is
possible that low incubation temperatures a generationago brought about a male-biased primary sex ratio on
Florida beaches that has resulted in male-biasedoperational sex ratios over the past decade. However,
there are no empirical data to suggest that changes inhatchling sex ratios have resulted in fewer nesting
females today. Given current patterns of global warm-ing, and given sex ratios skewed toward female for
hatchlings on Florida beaches (Mrosovsky and Provan-cha 1992, Blair et al. 2006), the Florida population may
be in a long-term cycle favoring production of females.
BLAIR WITHERINGTON ET AL.46 Ecological ApplicationsVol. 19, No. 1
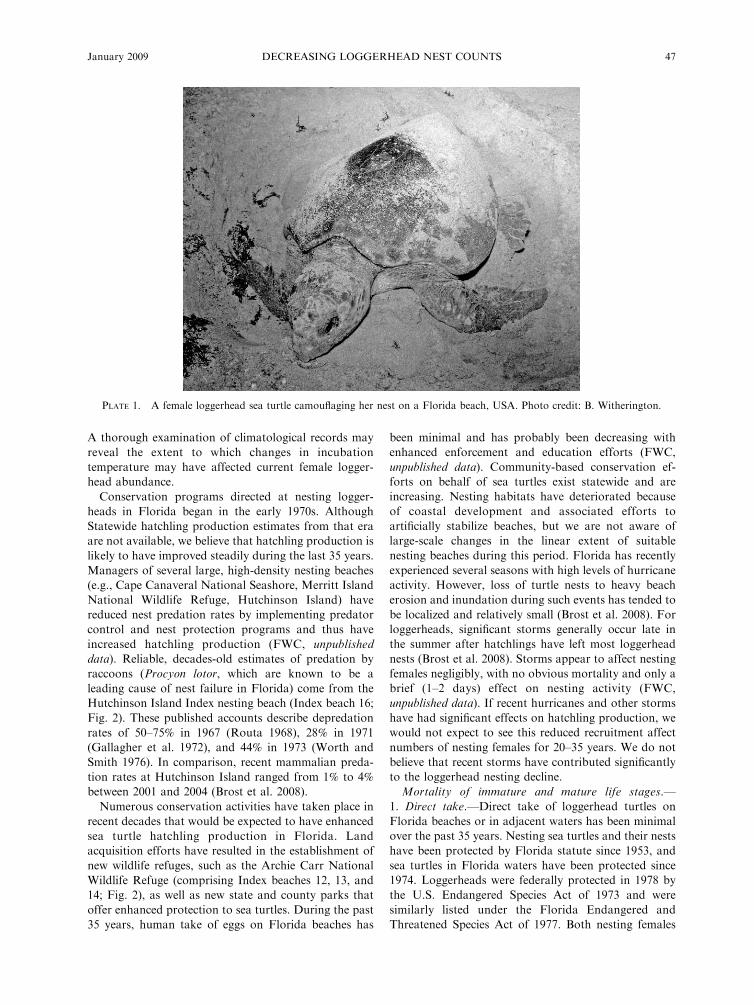
A thorough examination of climatological records may
reveal the extent to which changes in incubation
temperature may have affected current female logger-
head abundance.
Conservation programs directed at nesting logger-
heads in Florida began in the early 1970s. Although
Statewide hatchling production estimates from that era
are not available, we believe that hatchling production is
likely to have improved steadily during the last 35 years.
Managers of several large, high-density nesting beaches
(e.g., Cape Canaveral National Seashore, Merritt Island
National Wildlife Refuge, Hutchinson Island) have
reduced nest predation rates by implementing predator
control and nest protection programs and thus have
increased hatchling production (FWC, unpublished
data). Reliable, decades-old estimates of predation by
raccoons (Procyon lotor, which are known to be a
leading cause of nest failure in Florida) come from the
Hutchinson Island Index nesting beach (Index beach 16;
Fig. 2). These published accounts describe depredation
rates of 50–75% in 1967 (Routa 1968), 28% in 1971
(Gallagher et al. 1972), and 44% in 1973 (Worth and
Smith 1976). In comparison, recent mammalian preda-
tion rates at Hutchinson Island ranged from 1% to 4%
between 2001 and 2004 (Brost et al. 2008).
Numerous conservation activities have taken place in
recent decades that would be expected to have enhanced
sea turtle hatchling production in Florida. Land
acquisition efforts have resulted in the establishment of
new wildlife refuges, such as the Archie Carr National
Wildlife Refuge (comprising Index beaches 12, 13, and
14; Fig. 2), as well as new state and county parks that
offer enhanced protection to sea turtles. During the past
35 years, human take of eggs on Florida beaches has
been minimal and has probably been decreasing with
enhanced enforcement and education efforts (FWC,
unpublished data). Community-based conservation ef-
forts on behalf of sea turtles exist statewide and are
increasing. Nesting habitats have deteriorated because
of coastal development and associated efforts to
artificially stabilize beaches, but we are not aware of
large-scale changes in the linear extent of suitable
nesting beaches during this period. Florida has recently
experienced several seasons with high levels of hurricane
activity. However, loss of turtle nests to heavy beach
erosion and inundation during such events has tended to
be localized and relatively small (Brost et al. 2008). For
loggerheads, significant storms generally occur late in
the summer after hatchlings have left most loggerhead
nests (Brost et al. 2008). Storms appear to affect nesting
females negligibly, with no obvious mortality and only a
brief (1–2 days) effect on nesting activity (FWC,
unpublished data). If recent hurricanes and other storms
have had significant effects on hatchling production, we
would not expect to see this reduced recruitment affect
numbers of nesting females for 20–35 years. We do not
believe that recent storms have contributed significantly
to the loggerhead nesting decline.
Mortality of immature and mature life stages.—
1. Direct take.—Direct take of loggerhead turtles on
Florida beaches or in adjacent waters has been minimal
over the past 35 years. Nesting sea turtles and their nests
have been protected by Florida statute since 1953, and
sea turtles in Florida waters have been protected since
1974. Loggerheads were federally protected in 1978 by
the U.S. Endangered Species Act of 1973 and were
similarly listed under the Florida Endangered and
Threatened Species Act of 1977. Both nesting females
PLATE 1. A female loggerhead sea turtle camouflaging her nest on a Florida beach, USA. Photo credit: B. Witherington.
January 2009 47DECREASING LOGGERHEAD NEST COUNTS
and large subadult loggerheads observed in Florida
waters are known to forage along the Atlantic states of
the United States and Canada (Ehrhart et al. 2003), and
they also travel south to the waters of the Bahamas,
Cuba, and Mexico (Meylan et al. 1983, Schroeder et al.
2003). Hunting of loggerheads is legally permissible in
the Bahamas and Cuba, but the majority (68%) of
countries in the northwestern Atlantic have laws that
give complete protection to loggerheads in their waters
(NMFS and USFWS 2007). Some direct take is likely to
be occurring even in countries with protective legisla-
tion. We are not aware of any estimates of total direct
take in the northwestern Atlantic basin. However, we
predict that this number is likely to have decreased over
the past 35 years, with an increasing number of countries
adopting protective legislation or joining international
conventions for the protection of living marine resources
(see review in NMFS and USFWS 2007).
2. Fisheries bycatch.—The incidental capture of sea
turtles in commercial and artisanal fisheries is consid-
ered to be the most significant factor affecting the
conservation and recovery of the loggerhead turtle
(NMFS and USFWS 2007). It has been implicated in
the huge decline of loggerhead nesting populations in
the Pacific: 50–90% declines in Japan (Kamezaki et al.
2003) and 86% declines in eastern Australia (Limpus and
Limpus 2003). Loggerheads are captured in a variety of
gear types in the Atlantic and Mediterranean basins, the
most important of which (in terms of mortality) are
gillnets, trawls, and longlines.
Shrimp trawling increased dramatically in the south-
eastern United States between the 1940s and the 1960s.
By the late 1970s, there were sufficient data to show that
thousands of loggerheads were being killed annually in
this region (Henwood and Stuntz 1987). A subsequent
analysis that broadened these estimates and corrected
for post-catch mortality gave approximations of 5000 to
50 000 loggerheads per year killed in U.S. waters (NRC
[National Research Council] 1990). NRC (1990) con-
cluded that shrimp trawling was the most significant
anthropogenic source of sea turtle mortality in U.S.
waters, in part due to the high reproductive value of
turtles taken in the fishery. This level of annual
loggerhead mortality is believed to have occurred up
to 1992–1994, when U.S. law required all shrimp
trawlers in the Atlantic and Gulf of Mexico to use
Turtle Excluder Devices (TEDs, which allowed some
captured turtles to escape nets before drowning) (NMFS
[National Marine Fisheries Service] 2002). Analyses of
sea turtle strandings concluded that TEDs reduced sea
turtle mortality by ;20–40% (Crowder et al. 1995,
Lewison et al. 2003). Although poor regulatory compli-
ance was cited as limiting TED effectiveness in reducing
mortality (Lewison et al. 2003), it was also clear that
;40% of stranded loggerheads (large immatures and
adults) were too large to fit through TED openings and
escape from TED-equipped trawl nets (Epperly and
Teas 2002). Larger TED openings were required on
most shrimp trawls in 2004; the current Biological
Opinion from NMFS (2002) forecasts ;4000 loggerhead
deaths annually in U.S. waters from trawling under
these new regulations.
Trawling for species other than shrimp has caused
additional mortality to loggerheads with high reproduc-
tive value. Murray (2006) estimated that loggerhead
mortality in fisheries using bottom otter trawl gear in the
U.S. Mid-Atlantic between 1996 and 2004 was ;400–
900 turtles per year. Scallop trawls and dredges
operating in the same region are believed to kill ;100–
200 loggerheads annually (Murray 2007).
Pelagic longline fisheries in the Atlantic Ocean and
Mediterranean Sea hooked approximately 210 000 to
280 000 loggerheads in the year 2000, with mortality
rates for captured loggerheads estimated to be 17–42%
(Lewison et al. 2004). Florida has by far the largest
loggerhead nesting aggregation contributing to popula-
tions in these basins, and the feeding grounds of
juveniles and subadults of this population are known
to overlap with longline fishing areas. Thus it is likely
that a large percentage of Atlantic longline captures are
turtles that were hatched on Florida nesting beaches. On
the basis of mtDNA sequence analysis of loggerheads
caught in longline fisheries in the Azores and Madeira,
Bolten et al. (1998) demonstrated that pelagic juveniles
found in eastern Atlantic waters were derived from
rookeries in the southeastern United States and the
Yucatan Peninsula of Mexico. Similarly, Laurent et al.
(1993, 1998) provided genetic evidence that a portion of
the loggerheads in the western Mediterranean originated
from beaches in the United States, and they suggested
that American loggerheads were subject to capture in
the Spanish swordfish longline fishery. The average size
of loggerheads captured in longlines ranged from 37 to
74 cm curved carapace length in the Atlantic and
Mediterranean (Lewison and Crowder 2007, Lopez-
Mendilaharsu et al. 2007).
Loggerhead mortality from each of these fisheries is
believed to be underestimated because of difficulties with
observer coverage and reduced compliance in unob-
served fishing vessels (Lewison et al. 2003, Cox et al.
2007). Total fisheries mortality estimates are also limited
principally to federally regulated fisheries, which do not
include many trawl, trap, gillnet, and hook-and-line
fisheries operating within state waters of the United
States. Additional loggerhead mortality is likely to occur
in U.S. state-regulated fisheries and to go unrecorded
due to the presence of few observers.
Although loggerhead mortality is high in trawl and
longline fisheries, green turtle mortality from these
fisheries is much lower, probably due to the limited
exposure of green turtles to these fisheries. Young
juvenile green turtles spend a shorter time in oceanic
habitats than do juvenile loggerheads, and older juvenile
green turtles prefer shallow seagrass pastures where
trawling is rare (Witherington et al. 2006a).
BLAIR WITHERINGTON ET AL.48 Ecological ApplicationsVol. 19, No. 1
3. Disease.—Florida’s Sea Turtle Stranding and
Salvage Network’s (STSSN) documentation of more
frequent epizootic events in recent years suggests that
the incidence of disease in sea turtles may be rising. The
Florida network documented an average of 25 emaciat-
ed loggerheads per year from 1986 to 1990 (2.4% of total
annual loggerhead strandings) and 193 emaciated
loggerheads per year from 2002 to 2006 (15% of total
annual loggerhead strandings; A. Foley, personal
communication). In the absence of practical means to
screen for disease in all stranded turtles, an emaciated
body condition is used as an indicator of potential
disease; relatively few dead turtles are professionally
necropsied because of limited resources. The actual
extent of disease in the population is not well known
because health information on live turtles is collected in
few studies. Baseline data on turtle health are also
scarce, making it difficult to detect and diagnose diseases
or to assign causes of death. Brevetoxicosis, a disease
caused by exposure to harmful algal blooms (especially
‘‘red tide,’’ associated with the dinoflagellate Karenia
brevis), is suspected to be a mortality factor for
loggerheads (Redlow et al. 2003). In several recent
years, toxic algal blooms have been chronic in some
areas, such as southwestern Florida, that are known to
be important foraging areas for loggerheads. Large-scale
loggerhead die-offs associated with red-tide exposure
have occurred in Florida in almost every year since 1995
(Florida STSSN database; A. Foley, personal communi-
cation). However, as with loggerhead mortality from
other diseases, rates of mortality caused by red tide and
other harmful algal blooms have not been measured for
the population at large.
4. Boat-related mortality.—Loggerheads in Florida
face an increasing threat from strikes by boat propellers.
The occurrence of propeller wounds in loggerheads
recovered by the stranding network in Florida has
increased from an annual average of 9.7% (N ¼ 92
turtles) between 1986 and 1990 to 20.3% (N ¼ 305)
between 2002 and 2006 (Florida STSSN database; A.
Foley, personal communication). Total loggerhead
strandings have also increased over the same period.
Although approximately one-third of all examined boat-
strike injuries have had characteristics definitively
indicating that they occurred antemortem, some of the
remaining fraction of injuries may have occurred post
mortem (A. Foley, personal communication). This
uncertainty makes it difficult to accurately assign
mortality figures to this cause.
5. Pollution.—This factor includes entanglement in,
or ingestion of, marine debris (including abandoned
fishing gear), fouling with petroleum products, exposure
to heavy metals and other anthropogenic toxins, and
eutrophication. In samples of neonate (weeks-old)
loggerheads from Atlantic waters off Florida, percent-
ages of turtles that have ingested plastics or tar range
between 20% (from esophageal lavage of 66 extant
turtles; Witherington 2002) and 90% (from necropsy of
134 storm-stranded turtles; Witherington and Hirama
2006; B. Witherington and S. Hirama, unpublished data).
Mortality from this debris ingestion is probably high,
but has yet to be quantified. Although we are not able to
find trends in mortality from these sources, we reason
that multiple effects of pollution have increased during
the period of loggerhead nesting decline. Long-term
studies are needed to fully describe the role of this threat
in the decline of Florida’s loggerhead population.
6. Global warming.—Although not a direct mortality
factor, global warming could be expected to have
indirect effects on the Florida loggerhead population
by changing sex ratios, reproductive periodicity, marine
habitats, or prey resources. It is likely that decades will
pass before we understand the consequences of global
climate change on loggerhead populations.
7. Decline of food resources.—Food resources in the
Chesapeake Bay and coastal waters of Virginia, an area
known to be important to Florida loggerheads (Musick
and Limpus 1997), have changed significantly in recent
decades. A substantial reduction in the spawning stock,
recruitment, larval abundance, and female size of the
blue crab (Callinectes sapidus), an important loggerhead
prey item, was documented in studies spanning the
period 1979–2000 (Lipcius and Stockhausen 2002). Gut
content analyses of loggerheads in Virginia waters by
Seney and Musick (2007) documented a shift in
loggerhead prey items from predominantly horseshoe
crabs (Limulus polyphemus) during the early to mid-
1980s, to predominantly blue crabs during the 1980s, to
finfish discarded by fisheries in the mid-1990s and in
2000–2002.
Comparison of threats and concordance with nesting
data.—Multiple factors are likely to be involved in the
decline in loggerhead nesting in Florida, but the
temporal and spatial patterns of the decline suggest that
one or more factors are new or are having significantly
greater effects on the loggerhead nesting population
following a time lag (consequences just now apparent
due to reduced recruitment to the nesting beach).
The following temporal and spatial characteristics of
the decline in loggerhead nesting may hold clues to the
causes of this trend: (1) the decline in nesting in Florida
began in approximately 1998; (2) the magnitude of the
decline has been large, ;44% in eight years; (3) prior to
1998, the number of loggerhead nests in Florida was
increasing significantly in five of six subregions (Table 1,
Fig. 6); (4) since 1998, all six subregions have decreased
significantly (Table 1, Fig. 6); (5) the decline began at
approximately the same time in all subregions (Fig. 6);
(6) green turtle and leatherback nesting has increased on
the same Florida beaches where loggerhead nesting has
declined (1989–2006; data available online; see footnote
5).
Table 2 summarizes the concordance of possible
mortality factors with these temporal and spatial
characteristics of the nesting data. Although better data
are needed on all of the mortality factors (particularly
January 2009 49DECREASING LOGGERHEAD NEST COUNTS

pollution, disease, and the decline of food resources), it
is clear that several factors are inconsistent in many
respects with the patterns observed in the nesting data.
Decreased hatchling production is the least concordant.
One would expect large subregional differences in
nesting if factors such as habitat deterioration or
increased predation were a principal cause. Instead,
the data show all six subregions behaving similarly
(declining significantly; Table 1, Fig. 7). Another line of
evidence that decreased hatchling production is not the
primary reason for the nesting decline is that other
species of sea turtles nesting on the same beaches at the
same time have experienced an increase in nest numbers
over the same time period.
The causal factor that best fits the nesting decline is
fisheries bycatch (Table 2). The North Atlantic longline
fishery began to expand in the early 1980s with the
growing use of monofilament nylon gear and the
expansion of the Spanish fishing fleet (FAO 2005). Since
this time, longline mortality to oceanic-stage logger-
heads has increased to tens of thousands of turtles
annually (Lewison and Crowder 2007). Loggerheads
from this period that survived their oceanic stage
recruited to U.S. coastal waters at a time when mortality
from trawling was estimated to be as high as 50 000
loggerhead deaths per year (NRC 1990). Shrimp-
trawling mortality of maturing and adult loggerheads
was extensive for decades up to 2004. Following
additional federal TED regulations enacted in 2004,
loggerhead mortality has continued at levels (thousands
per year) that may have impeded population recovery.
The estimated magnitude, timing, and ongoing nature of
these fisheries threats are consistent with the steep
decline in nesting following 1998. We believe that the
only other factors that approach this level of concor-
dance with the loggerhead decline are disease and the
decline of food resources. Regarding both of these
factors, our knowledge is too incomplete to rule out
their importance.
The differential susceptibility of loggerheads and
green turtles to coastal trawl and oceanic longline
fisheries may explain the dramatic differences in Florida
nesting trends for these species. However, an increasing
nesting trend in Florida by leatherbacks appears to be
inconsistent with strong effects from oceanic longline
fisheries because these turtles are oceanic for most of
their lives (data available online; see footnote 5). One
would expect that leatherback nesting would also be in
decline in Florida because this species is also subject to
incidental capture in fisheries. One possible explanation
is that loggerheads and leatherbacks are differentially
affected by various fisheries (trawls, gillnets, longlines).
In the case of the longline fishery, far fewer (only a
quarter) leatherbacks are captured than loggerheads
(although the capture rates proportional to population
sizes are unknown), and there is lower mortality (8–27%
of leatherbacks vs. 17–42% of loggerheads) (Lewison
and Crowder 2007). In the case of trawl fisheries,
loggerhead mortality was estimated to be eight times
that of green turtles and 50 times that of leatherbacks
(NMFS 2002), probably because of the diet differences
(and thus habitat use) between the three species (NRC
1990).
One further pattern in the nesting data is worthy of
mention. The rate of decline in the subregions (Fig. 6)
was less variable after 1998 than the rate of increase
prior to that time (Table 1). One interpretation is that
multiple factors were operating during the nesting-
increase period, including some with subregional effects,
and that these accounted for the observed variability.
After 1998, these factors continued to affect the
population, but a new factor emerged that affected all
subregions and was of sufficient magnitude that it
dampened the variability of existing effects. The only
factors in Table 2 that we think could be considered new
(within 35 years) are fisheries bycatch (principally
commercial longlines), pollution (plastics), boat-related
mortality, and the decline of food resources.
TABLE 2. Concordance of loggerhead threat factors with attributes of the loggerhead nesting decline.
ConcordanceHatchlingdecline
Directtake
Fisheriesbycatch Disease
Boat-relatedmortality Pollution
Globalwarming
Food resourcedecline
Consistent with time frame ofnesting decline?
no no yes possibly yes yes possibly yes
Consistent with magnitude ofnesting decline?
no no yes possibly no possibly no possibly
Consistent with temporal patternof nesting decline?
no no yes possibly no possibly unknown unknown
Similar effects on nesting betweensubregions?
no yes yes yes no yes yes yes
Different expected effects on greenturtle and leatherback nesting?
no no yes� no no no no yes
Score 0 1 5 2.5 1 3 1.5 3.5
Notes: Decreased production of hatchlings may result from predation, hurricane effects, or habitat deterioration. Disease mayinclude harmful algal blooms. Pollutants include oil, plastics, and discarded fishing nets. Score is the sum of categories in which theeffect of the factor is concordant with the patterns observed in the nesting data; possible concordance was scored as 0.5.
� Longlines principally affect loggerheads and leatherbacks; trawling principally affects loggerheads.
BLAIR WITHERINGTON ET AL.50 Ecological ApplicationsVol. 19, No. 1

Predictions for the 2007 loggerhead nesting season.—
We predicted a loggerhead nest count for Florida Index
beaches using the trend line estimated by a three-knot
restricted cubic spline curve to the annual survey-region
nest-count totals via negative binomial regression (SR
model; Fig. 4). This prediction was 27 432 nests in 2007,
which was close to the actual nest-count total of 28 880
nests. This nest count for 2007 represents the lowest
loggerhead nest count in 19 years. Although we did not
have a spatially detailed data set available for our zone-
level (ZL) models at the time of manuscript submission,
we were able use the survey-region (SR) RCS model
(previously described) to estimate percentage change in
predicted mean annual nest counts between selected
years, along with 95% confidence intervals (R2 ¼ 0.85).
Estimates comprising all Florida Index zones used in
this study indicated that Florida loggerhead nesting
declined by 37% (25–47% CI) between 1989 and 2007
and declined by 49% (39–57% CI) between 1998 and
2007.
Management recommendations
We believe that the decline in loggerhead nesting on
Florida beaches warrants heightened attention from
resource managers. An extrapolation of declining
loggerhead nest counts reveals that numbers of nests in
2017 will have declined 80% from the number counted in
1998 if conditions do not change. This 19-year period
would be less than half of the loggerhead’s ;45-year
generation time. An 80% decline over an even more
prolonged period (three generations) is sufficient to
warrant the IUCN status of Critically Endangered
(IUCN 2001). Our extrapolation of nesting data does
not result in an unreasonable forecast, given loggerhead
nesting declines of 50–90% observed in the Pacific
(Kamezaki et al. 2003, Limpus and Limpus 2003). We
feel that these nesting declines reveal adult population
declines, which are particularly alarming considering
that loggerheads have been listed for three decades
under the U.S. Endangered Species Act. These circum-
stances suggest that loggerheads would benefit from
broader protection and more comprehensive manage-
ment across state, federal, and international waters than
has been achieved in recent decades. We recommend
that such broadening include elevated monitoring and
regulation of the wide variety of coastal and oceanic
fisheries that intersect with loggerhead distribution.
These actions will need to include international collab-
orative fisheries management efforts throughout the
Atlantic range of the loggerhead sea turtle.
Research should continue to further our understand-
ing of the effects of fisheries capture (including mortality
from repeated trawl captures and longline hooking),
disease, harmful algal blooms, toxins, entanglement,
debris ingestion, decline in food resources, and global
climate change on loggerhead populations. Even threats
without immediate tenable solutions need to be suffi-
ciently understood so that managers might predict the
level of success needed in solving other conservation
problems.
Although we find no evidence that nesting-beach
conditions are principally responsible for the loggerhead
nesting decline, nesting beaches in Florida remain the
most accessible places where conservation activity and
habitat protection efforts can benefit loggerheads. We
point to the consistent portrait of loggerhead spatial
nesting patterns as a guide for directing protection, such
as refuge-land acquisition, to the most critical nesting
areas.
ACKNOWLEDGMENTS
Nesting data were collected through a coordinated networkof Florida Sea Turtle Permit Holders comprising individualsfrom Fort Clinch State Park, Amelia Island Sea Turtle Watch,Little Talbot Island State Park, Beaches Sea Turtle Patrol,Guana Tolomato Matanzas NERR, Canaveral NationalSeashore, Merritt Island NWR, Canaveral Air Force Station,UCF Marine Turtle Research Group, Sebastian Inlet StatePark, Archie Carr NWR, Fort Pierce Inlet State Park, InwaterResearch Group, Ecological Associates, Town of JupiterIsland, Marinelife Center of Juno Beach, Gumbo LimboNature Center, J. D. MacArthur Beach State Park, John U.Lloyd State Park, Miami-Dade Parks and Recreation, Sanibel-Captiva Conservation Foundation, Delnor-Wiggins Pass StatePark, and the Conservancy of Southwest Florida. Thefoundation of this network can be credited to Alan Huff,Charles Futch, and Ross Witham. Data have been managed byWalt Conley, Barbara Schroeder, Allen Foley, Blair With-erington, Anne Meylan, and Beth Brost. Guidance andpermitting oversight for this network were provided by DavidArnold, Colleen Coogan, Allen Foley, Kipp Frolich, AlanHuff, Meghan Koperski, Ron Mezich, Cheryl Ryder, BarbaraSchroeder, and Robbin Trindell. The Index Nesting BeachSurvey program was established with guidance from Alan Huff,Erik Martin, Anne Meylan, Blair Witherington, Earl Possardt,and Barbara Schroeder. Barbara Schroeder played a key initialrole in the successful coordination of this complex effort. GerryBruger, Justin Hooper, and Frank Bucci assisted with ITsupport; and Carrie Crady, Layne Bolen, Madeline Broadstone,Chris Koeppel, Lori Lucas, Rosanna Rivero, and RobertHardy helped with data editing and GIS. We thank LlewEhrhart and his students for access to nesting data, and we aregrateful to Barbara Schroeder, Marydele Donnelly, AllenFoley, Tim O’Meara, Judy Leiby, Jim Quinn, and Jeff Seminofffor their comments on the manuscript. Funding for Florida seaturtle nest counts has come from the U.S. Fish and WildlifeService and from the Florida Sea Turtle Protection Trust Fund.
LITERATURE CITED
Agresti, A. 2002. Categorical data analysis. Second edition.John Wiley, Hoboken, New Jersey, USA.
Arenas-Martınez, A. 2005. Evaluacion regional de la TortugaCaguama tendencias poblacionales, avances en el conoci-miento y observacion. In E. Cuevas, A. Echeverrıa, E. Torres,and S. Garcia, compilers. Memorias del XIII Taller Regionalsobre Programas de Conservacion de Tortugas Marinas en laPenınsula de Yucatan. [In Spanish.] SECOL/CONANP/PPY, Diciember, 2005. Edicion Digital.
Baldwin, R., G. R. Hughes, and R. I. T. Prince. 2003.Loggerhead turtles in the Indian Ocean. Pages 218–232 inA. B. Bolten and B. E. Witherington, editors. Loggerhead seaturtles. Smithsonian Books, Washington, D.C., USA.
Benedet, L., C. W. Finkl, and A. H. F. Klein. 2003.Classification of Florida Atlantic beaches: sediment varia-tion, morphodynamics and coastal hazards. Journal ofCoastal Research, Special Issue 39.
January 2009 51DECREASING LOGGERHEAD NEST COUNTS
Bjorndal, K. A., A. B. Bolten, B. Koike, B. A. Schroeder, D. J.Shaver, W. G. Teas, and W. N. Witzell. 2001. Somaticgrowth function for immature loggerhead sea turtles insoutheastern U.S. waters. Fishery Bulletin 99:240–246.
Bjorndal, K. A., A. B. Meylan, and B. J. Turner. 1983. Seaturtle nesting at Melbourne Beach, Florida, I. Size, growth,and reproductive biology. Biological Conservation 26:65–77.
Blair, K., L. Stokes, J. Marsh, C. Baird, J. Wyneken, T.Wibbels, and L. Crowder. 2006. Determination of the sexratios of loggerhead sea turtle (Caretta caretta, L.) hatchlingsproduced along the southeastern Atlantic coast. Page 169 inN. J. Pilcher, compiler. Proceedings of the 23rd AnnualSymposium on Sea Turtle Biology and Conservation. NOAATechnical Memorandum NMFS-SEFSC-536.
Bolten, A. B., K. A. Bjorndal, H. R. Martins, T. Dellinger,M. J. Biscoito, S. E. Enclada, and B. W. Bowen. 1998.Transatlantic developmental migrations of loggerhead seaturtles demonstrated by mtDNA sequence analysis. Ecolog-ical Applications 8:1–7.
Bolten, A. B., and B. E. Witherington, editors. 2003.Loggerhead sea turtles. Smithsonian Institution Press,Washington, D.C., USA.
Bowen, B. W. 2003. What is a loggerhead turtle? The geneticperspective. Pages 7–27 in A. B. Bolten and B. E. With-erington, editors. Loggerhead sea turtles. SmithsonianInstitution Press, Washington, D.C., USA.
Bowen, B. W., N. Kamezaki, C. J. Limpus, G. R. Hughes, A. B.Meylan, and J. C. Avise. 1994. Global phylogeography of theloggerhead turtle (Caretta caretta) as indicated by mitochon-drial DNA haplotypes. Evolution 48:1820–1828.
Brost, B., B. Witherington, and A. Meylan. 2008. Sea turtlehatchling production from Florida’s beaches 2001–2005:annual production and sources of mortality. 27th AnnualSymposium on Sea Turtle Biology and Conservation. NOAATechnical Memorandum NMFS-SEFSC-569.
Burnham, K. P., and D. R. Anderson. 2002. Model selectionand multimodel inference. Second edition. Springer-Verlag,New York, New York, USA.
Chaloupka, M., K. A. Bjorndal, G. H. Balazs, A. B. Bolten,L. M. Ehrhart, C. J. Limpus, H. Suganuma, S. Troeng, andM. Yamaguchi. 2008. Encouraging outlook for recovery of aonce severely exploited marine megaherbivore. GlobalEcology and Biogeography 17:297–304.
Cox, T. M., R. L. Lewison, R. Zydelis, L. B. Crowder, C.Safina, and A. J. Read. 2007. Comparing effectiveness ofexperimental and implemented bycatch reduction measures:the ideal and the real. Conservation Biology 21:1155–1164.
Crain, D. A., A. B. Bolten, and K. A. Bjorndal. 1995. Effects ofbeach nourishment on sea turtles: review and researchinitiatives. Restoration Ecology 3:95–104.
Crouse, D. T., L. B. Crowder, and H. Caswell. 1987. A stage-based population model for loggerhead sea turtles andimplications for conservation. Ecology 68:1412–1423.
Crowder, L. B., S. R. Hopkins-Murphy, and A. Royle. 1995.Estimated effect of turtle-excluder devices (TEDs) onloggerhead sea turtle strandings with implications forconservation. Copeia 1995:773–779.
Dodd, C. K., Jr. 1988. Synopsis of the biological data on theloggerhead sea turtle Caretta caretta (Linnaeus 1758). U.S.Fish and Wildlife Service Biological Report 88.
Ehrhart, L. M., D. A. Bagley, and W. E. Redfoot. 2003.Loggerhead turtles in the Atlantic Ocean: Geographicdistribution, abundance, and population status. Pages 157–174 in A. B. Bolten and B. E. Witherington, editors.Loggerhead sea turtles. Smithsonian Institution Press,Washington, D.C., USA.
Encalada, S. E., K. A. Bjorndal, A. B. Bolten, J. C. Zurita, B.Schroeder, E. Possardt, C. J. Sears, and B. W. Bowen. 1998.Population structure of loggerhead turtle (Caretta caretta)nesting colonies in the Atlantic and Mediterranean regions as
inferred from mtDNA control region sequences. MarineBiology 130:567–575.
Epperly, S. P., and W. G. Teas. 2002. Turtle excluder devices—are the escape openings large enough? Fishery Bulletin 100:466–474.
FAO (Food and Agriculture Organization). 2005. Review ofthe state of world marine fishery resources. United NationsFAO Fisheries Department, Rome, Italy.
Frazer, N. B., and J. I. Richardson. 1985. Annual variation inclutch size and frequency for loggerhead turtles, Carettacaretta, nesting at Little Cumberland Island, Georgia, USA.Herpetologica 41:246–251.
Gallagher, R. M., M. L. Hollinger, R. M. Ingle, and C. R.Futch. 1972. Marine turtle nesting on Hutchinson Island,Florida, in 1971. Florida Department of Natural ResourcesMarine Research Laboratory Special Science Report 37:1–11.
Gyuris, E., and C. J. Limpus. 1988. The loggerhead turtleCaretta caretta in Queensland: population breeding struc-ture. Australian Journal of Wildlife Research 15:197–209.
Harrell, F. E. 2001. Regression modeling strategies. Springer-Verlag, New York, New York, USA.
Hawkes, L. A., A. C. Broderick, M. H. Godfrey, and B. J.Godley. 2005. Status of nesting loggerhead turtles Carettacaretta at Bald Head Island (North Carolina, USA) after 24years of intensive monitoring and conservation. Oryx 39:65–72.
Hays, G. C. 2000. The implications of variable remigrationintervals for the assessment of population size in marineturtles. Journal of Theoretical Biology 206:221–227.
Hays, G. C., and J. M. Sutherland. 1991. Remigration andbeach fidelity of loggerhead turtles nesting on the island ofCephalonia, Greece. Journal of Herpetology 25:232–233.
Henwood, T. A., and W. Stuntz. 1987. Analysis of sea turtlecaptures and mortalities during commercial shrimp trawling.Fishery Bulletin 85:813–817.
Hughes, G. R. 1974. The sea turtles of South-east Africa, II.Investigational Report Number 36 of the OceanographicResearch Institute, Durban, South Africa.
Hughes, G. R. 1982. Nesting cycles in sea turtles: typical oratypical? Pages 81–89 in K. A. Bjorndal, editor. Biology andconservation of sea turtles. Smithsonian Institution Press,Washington, D.C., USA.
IUCN (International Union for the Conservation of Nature).2001. IUCN Red List categories and criteria. Version 3.1.IUCN Species Survival Commission. IUCN, Gland, Swit-zerland. hhttp://www.iucnredlist.org/info/categories_criteria2001i
Kamezaki, N., et al. 2003. Loggerhead turtles nesting in Japan.Pages 210–217 in A. B. Bolten and B. E. Witherington,editors. Loggerhead sea turtles. Smithsonian InstitutionPress, Washington, D.C., USA.
Katselidis, K., G. Schofield, and D. Margaritoulis. 2004.Loggerhead nest site fixity in the rookery of Laganas Bay,Zakynthos, Greece. Pages 78–80 in M. S. Coyne and R. D.Clark, compilers. Proceedings of the 21st Annual Symposiumon Sea Turtle Biology and Conservation. NOAA TechnicalMemorandum NMFS-SEFSC-528.
Kenward, M. G., and J. H. Roger. 1997. Small sample inferencefor fixed effects from restricted maximum likelihood.Biometrics 53:983–997.
Laurent, L., et al. 1998. Molecular resolution of marine turtlestock composition in fishery bycatch: a case study in theMediterranean. Molecular Ecology 7:1529–1542.
Laurent, L., J. Lescure, L. Excoffier, B. Bowen, M. Domingo,M. Hadjichristophorou, L. Kornaraki, and G. Trabuchet.1993. Etude genetique des relations entre les populationsmediterraneet atlantique d’une tortue marine (Caretta caret-ta) a l’aide d’un marquer mitochondrial. 1993 ComptesRendus de l’Academie des Sciences (Paris), Sciences de la Vie316:1233–1239.
BLAIR WITHERINGTON ET AL.52 Ecological ApplicationsVol. 19, No. 1
LeBuff, C. R., Jr. 1974. Unusual nesting relocation in theloggerhead turtle, Caretta caretta. Herpetologica 30:29–31.
Lewison, R., and L. Crowder. 2007. Putting longline bycatch ofsea turtles into perspective. Conservation Biology 21:79–86.
Lewison, R., L. B. Crowder, and D. J. Shaver. 2003. Theimpact of turtle excluder devices and fisheries closures onloggerhead and Kemp’s Ridley strandings in the western Gulfof Mexico. Conservation Biology 17:1089–1097.
Lewison, R. L., S. A. Freeman, and L. Crowder. 2004.Quantifying the effects of fisheries on threatened species:the impact of pelagic longlines on loggerhead and leather-back sea turtles. Ecology Letters 7:221–231.
Limpus, C. J. 1985. A study of the loggerhead sea turtle,Caretta caretta, in eastern Australia. Dissertation. Universityof Queensland, St Lucia, Queensland, Australia.
Limpus, C. J., and D. J. Limpus. 2003. Loggerhead turtles inthe Equatorial and southern Pacific Ocean: a species indecline. Pages 199–209 in A. B. Bolten and B. E. With-erington, editors. Loggerhead sea turtles. SmithsonianInstitution Press, Washington, D.C., USA.
Limpus, C. J., and N. Nicholls. 2000. ENSO regulation of Indo-Pacific green turtle populations. Pages 399–408 in G. L.Hammer, N. Nicholls, and C. Mitchell, editors. Applicationsof seasonal climate forecasting in agricultural and naturalecosystems. The Australian experience. Kluwer Academic,Dordrecht, The Netherlands.
Lipcius, R. N., and W. T. Stockhausen. 2002. Concurrentdecline of the spawning stock, recruitment, larval abundance,and size of the blue crab Callinectes sapidus in ChesapeakeBay. Marine Ecology Progress Series 226:45–61.
Littell, R. C., G. A. Milliken, W. W. Stroup, R. D. Wolfinger,and O. Schabenberger. 2006. SAS for mixed models. Secondedition. SAS Institute, Cary, North Carolina, USA.
Lopez-Mendilaharsu, M., G. Sales, B. Giffoni, P. Miller, F.Niemeyer Fiedler, and A. Domingo. 2007. Distribucion ycomposicion de tallas de las tortugas marinas (Carettacaretta y Dermochelys coriacea) que interactuan con elpalangre pelagico en el Atlantico Sur. Collective Volume ofScientific Papers of the International Commission for theConservation of Atlantic Tunas (ICAAT) 60:2094–2109.
Lutcavage, M. E., P. Plotkin, B. E. Witherington, and P. L.Lutz. 1997. Human impacts on sea turtle survival. Pages 387–409 in P. L. Lutz and J. Musick, editors. The biology of seaturtles. CRC Press, Boca Raton, Florida, USA.
Margaritoulis, D., et al. 2003. Loggerhead turtles in theMediterranean: present knowledge and conservation per-spectives. Pages 175–198 in A. B. Bolten and B. E.Witherington, editors. Loggerhead sea turtles. SmithsonianInstitution Press, Washington, D.C., USA.
McCullagh, P., and J. A. Nelder. 1989. Generalized linearmodels. Chapman and Hall/CRC, New York, New York,USA.
Meylan, A. 1982. Estimation of population size in sea turtles.Pages 135–138 in K. A. Bjorndal, editor. Biology andconservation of sea turtles. Smithsonian Institution Press,Washington, D.C., USA.
Meylan, A., K. A. Bjorndal, and B. J. Turner. 1983. Sea turtlesnesting at Melbourne Beach, Florida, II. Post-nestingmovements of Caretta caretta. Biological Conservation 26:79–90.
Mrosovsky, N. 1980. Thermal biology of sea turtles. AmericanZoologist 20:531.
Mrosovsky, N., and J. Provancha. 1992. Sex ratio of hatchlingloggerhead sea turtles: data and estimates from a 5-yearstudy. Canadian Journal of Zoology 70:530–538.
Murphy, T. M., and S. Hopkins. 1984. Aerial and groundsurveys of marine turtle nesting beaches in the SoutheastRegion, U.S. Final report to NOAA NMFS (NationalOceanic and Atmospheric Administration, National MarineFisheries Service). Contract NA83-GA-C-00021.
Murray, K. T. 2006. Estimated average annual bycatch ofloggerhead sea turtles (Caretta caretta) in U.S. Mid-Atlanticbottom otter trawl gear, 1996–2004. U.S. Department ofCommerce, Northeast Fisheries Science Center ReferenceDocument 06–19.
Murray, K. T. 2007. Estimated bycatch of loggerhead seaturtles (Caretta caretta) in U.S. Mid-Atlantic scallop trawlgear, 2004–2005, and in sea scallop dredge gear, 2005. U.S.Department of Commerce, Northeast Fisheries ScienceCenter Reference Document 07–04.
Musick, J. A., and C. J. Limpus. 1997. Habitat utilization andmigration in juvenile sea turtles. Pages 137–163 in P. L. Lutzand J. Musick, editors. The biology of sea turtles. CRC Press,Boca Raton, Florida, USA.
NMFS (National Marine Fisheries Service). 2002. ESAbiological opinion on shrimp trawling in the southeasternUnited States under the Sea Turtle Conservation Regula-tions. 2 December 2002. NOAA NMFS, Washington, D.C.,USA.
NMFS (National Marine Fisheries Service) and USFWS. 2007.Loggerhead sea turtle (Caretta caretta) 5-year review:Summary and evaluation. National Marine Fisheries Serviceand U.S. Fish and Wildlife Service, Washington, D.C., USA.
NRC (National Research Council). 1990. The decline of seaturtles. National Academy Press, Washington, D.C., USA.
Parham, J. F., and G. R. Zug. 1997. Age and growth ofloggerhead sea turtles (Caretta caretta) of coastal Georgia: anassessment of skeletochronological age estimates. Bulletin ofMarine Science 61:287–304.
Pearce, A. F. 2001. Contrasting population structure of theloggerhead turtle (Caretta caretta) using mitochondrial andnuclear DNA markers. Thesis. University of Florida,Gainesville, Florida, USA.
Pianka, E. R. 1994. Evolutionary ecology. Fifth edition.HarperCollins, New York, New York, USA.
Pike, D. A., R. L. Antworth, and J. C. Stiner. 2006. Earliernesting contributes to shorter nesting seasons for theloggerhead sea turtle, Caretta caretta. Journal of Herpetol-ogy 40:91–94.
Pritchard, P. C. H. 2004. Long-term sea turtle nesting cycles inthe Guianas. Pages 66–68 in M. S. Coyne and R. D. Clark,compilers. Proceedings of the 21st Annual Symposium onSea Turtle Biology and Conservation. NOAA TechnicalMemorandum NMFS-SEFSC-528.
Provancha, J. A., and L. M. Ehrhart. 1987. Sea turtle nestingtrends at Kennedy Space Center and Cape Canaveral AirForce Station, Florida, and relationships with factorsinfluencing nest site selection. Pages 33–44 in W. N. Witzell,editor. Ecology of East Florida sea turtles. Proceedings ofThe Cape Canaveral, Florida, Sea Turtle Workshop. NMFSTechnical Report Number 53.
Redlow, T., A. Foley, and K. Singel. 2003. Sea turtle mortalityassociated with red tide events in Florida. Page 272 in J. A.Seminoff, compiler. Proceedings of the 22nd AnnualSymposium on Sea Turtle Biology and Conservation. NOAATechnical Memorandum NMFS-SEFSC-503.
Richardson, J. I. 1982. A population model for adult femaleloggerhead sea turtles (Caretta caretta) nesting in Georgia.Dissertation. University of Georgia, Athens, Georgia, USA.
Richardson, J. I., T. H. Richardson, and M. W. Dix. 1978.Remigration patterns of loggerhead sea turtles (Carettacaretta) nesting on Little Cumberland and CumberlandIslands, Georgia. Florida Marine Research Publications 33:39–44.
Routa, R. A. 1968. Sea turtle nest survey of Hutchinson Island,Florida. Quarterly Journal of the Florida Academy ofSciences 30:287–294.
Rumbold, D. G., P. W. Davis, and C. Perretta. 2001.Estimating the effect of beach nourishment on Carettacaretta (loggerhead sea turtle) nesting. Restoration Ecology9:304–310.
January 2009 53DECREASING LOGGERHEAD NEST COUNTS
Ruppert, D., M. P. Wand, and R. J. Carroll. 2003. Semi-parametric regression. Cambridge University Press, Cam-bridge, UK.
Saba, V. S., P. Santidrian-Tomillo, R. D. Reina, J. R. Spotila,J. A. Musick, D. A. Evans, and F. V. Paladino. 2007. Theeffect of the El Nino Southern Oscillation on the reproduc-tive frequency of eastern Pacific leatherback turtles. Journalof Applied Ecology 44:395–404.
Schabenberger, O., and C. A. Gotway. 2006. Statisticalmethods for spatial data analysis. Chapman and Hall/CRC,New York, New York, USA.
Schroeder, B. A., A. M. Foley, and D. A. Bagley. 2003. Nestingpatterns, reproductive migrations, and adult foraging areasof loggerhead turtles. Pages 114–124 in A. B. Bolten andB. E. Witherington, editors. Loggerhead sea turtles. Smith-sonian Institution Press, Washington, D.C., USA.
Schroeder, B., and S. Murphy. 1999. Population surveys(ground and aerial) on nesting beaches. Pages 45–55 inK. L. Eckert, K. A. Bjorndal, F. A. Abreu-Grobois, and M.Donnelly, editors. Research and management techniques forthe conservation of sea turtles. IUCN/SSC Marine TurtleSpecialist Group Publication Number 4.
Seney, E. E., and J. A. Musick. 2007. Historical diet analysis ofloggerhead sea turtles (Caretta caretta) in Virginia. Copeia2007:478–489.
Snedecor, G. W., and W. G. Cochran. 1989. Statisticalmethods. Eighth edition. Iowa State University Press, Ames,Iowa, USA.
Snover, M. L. 2002. Growth and ontogeny of sea turtles usingskeletochronology: methods, validation and application toconservation. Dissertation. Duke University, Durham, NorthCarolina, USA.
Solow, A. R., K. A. Bjorndal, and A. B. Bolten. 2002. Annualvariation in nesting numbers of marine turtles: the effect ofsea surface temperature on re-migration intervals. EcologyLetters 5:742–746.
Steinitz, M. J., M. Salmon, and J. Wyneken. 1998. Beachrenourishment and loggerhead turtle reproduction: a sevenyear study at Jupiter Island, Florida. Journal of CoastalResearch 14:1000–1013.
Webster, W. D., and K. A. Cook. 2001. Intraseasonal nestingactivity of loggerhead sea turtles (Caretta caretta) insoutheastern North Carolina. American Midland Naturalist145:66–73.
Weishampel, J. F., D. A. Bagley, and L. M. Ehrhart. 2004.Earlier nesting by loggerhead sea turtles following sea surfacewarming. Global Change Biology 10:1424–1427.
Weishampel, J. F., D. A. Bagley, and L. M. Ehrhart. 2006.Intra-annual loggerhead and green turtle spatial nestingpatterns. Southeastern Naturalist 5:453–462.
Witherington, B. E. 2002. Ecology of neonate loggerheadturtles inhabiting lines of downwelling near a Gulf Streamfront. Marine Biology 140:843–853.
Witherington, B. E. 2003. Biological conservation of logger-heads: challenges and opportunities. Pages 295–311 in A. B.Bolten and B. E. Witherington, editors. Loggerhead seaturtles. Smithsonian Institution Press, Washington, D.C.,USA.
Witherington, B., M. Bresette, and R. Herren. 2006a. Cheloniamydas: green turtle. Pages 90–104 in P. A. Meylan, editor.Biology and conservation of Florida turtles. ChelonianResearch Monographs Number 3.
Witherington, B., R. Herren, and M. Bresette. 2006b. Carettacaretta: loggerhead sea turtle. Pages 74–89 in P. A. Meylan,editor. Biology and conservation of Florida turtles. Chelo-nian Research Monographs Number 3.
Witherington, B., and S. Hirama. 2006. Little loggerheadspacked with pelagic plastic. Page 137 in N. J. Pilcher,compiler. Proceedings of the 23rd Annual Symposium on SeaTurtle Biology and Conservation. NOAA Technical Memo-randum NMFS-SEFSC-536.
Witherington, B., L. Lucas, and C. Koeppel. 2004. Nesting seaturtles respond to the effects of ocean inlets. Pages 355–356 inM. S. Coyne and R. D. Clark, compilers. Proceedings of the21st Annual Symposium on Sea Turtle Biology andConservation. NOAA Technical Memorandum NMFS-SEFSC-528.
Wolfinger, R., and M. O’Connell. 1993. Generalized linearmixed models: a pseudo-likelihood approach. Journal ofStatistical Computation and Simulation 4:233–243.
Worth, D. F., and J. B. Smith. 1976. Marine turtle nesting onHutchinson Island, Florida, in 1973. Florida MarineResearch Publication 18:1–17.
Yntema, C. L., and N. Mrosovsky. 1982. Critical periods andpivotal temperatures for sexual differentiation in loggerheadsea turtles. Canadian Journal of Zoology 60:1012–1016.
Zurita, J. C., R. Herrera, A. Arenas, M. E. Torres, C. Calderon,K. Gomez, J. C. Alvarado, and R. Villavicencio. 2003.Nesting loggerhead and green sea turtles in Quintana Roo,Mexico. Pages 125–127 in J. A. Seminoff, compiler.Proceedings of the 22nd Annual Symposium on Sea TurtleBiology and Conservation. NOAA Technical MemorandumNMFS-SEFSC-503.
APPENDIX
A table showing attributes of Index beaches used in the analysis of trends in Florida loggerhead nesting (Ecological ArchivesA019-003-A1).
BLAIR WITHERINGTON ET AL.54 Ecological ApplicationsVol. 19, No. 1