Genetic Diversity Analysis and DNA Fingerprinting of...
12
Journal of Plant Sciences 2016; 4(6): 153-164 http://www.sciencepublishinggroup.com/j/jps doi: 10.11648/j.jps.20160406.14 ISSN: 2331-0723 (Print); ISSN: 2331-0731 (Online) Genetic Diversity Analysis and DNA Fingerprinting of Mungbean (Vigna radiata L.) Genotypes Using SSR Markers Md. Rezwan Molla 1 , Iftekhar Ahmed 1 , Md. Motiar Rohman 2 , Md. Amjad Hossain 1 , Md. Aziz Zilani Chowdhury 3 1 Molecular Biology Laboratory, Plant Genetic Resources Centre, Bangladesh Agricultural Research Institute (BARI), Gazipur, Bangladesh 2 Molecular Breeding Laboratory, Plant Breeding Division, BARI, Gazipur, Bangladesh 3 Crops Division, Bangladesh Agricultural Research Council (BARC), Farmgate, Dhaka, Bangladesh Email address: [email protected] (M. R. Molla), [email protected] (I. Ahmed), [email protected] (M. M. Rohman), [email protected] (M. A. Hossain), [email protected] (M. A. Z. Chowdhury) To cite this article: Md. Rezwan Molla, Iftekhar Ahmed, Md. Motiar Rohman, Md. Amjad Hossain, Md. Aziz Zilani Chowdhury. Genetic Diversity Analysis and DNA Fingerprinting of Mungbean (Vigna radiata L.) Genotypes Using SSR Markers. Journal of Plant Sciences. Vol. 4, No. 6, 2016, pp. 153-164. doi: 10.11648/j.jps.20160406.14 Received: October 13, 2016; Accepted: October 31, 2016; Published: November 23, 2016 Abstract: Microsatellite combines several features of an ultimate molecular marker and they are used increasingly in various plant genetic studies and applications. Characterization of mungbean genotypes on the basis of DNA fingerprinting has become an efficient tool to link genotypic variation. This work is reporting the utilization of a small set of five previously developed mungbean microsatellite (SSR) markers for the identification and discrimination of six HYVs and 36 landraces. All five microsatellite markers were found to be polymorphic. Variation was found in number of alleles, allele frequency, observed and expected heterozygosity. Using five primers across 42 genotypes a total of 20 alleles with an average number of 4 alleles per locus were found of which GBssr-MB91 showed highest number of alleles (6) (size ranging from 135 to 152 bp) followed by 4 alleles (from 160 to 176 bp and 175 to 195 bp) and 3 alleles (from 264 to 282 bp and 283 to 304 bp) were detected at the loci LR7322B, LR7323A, LR7323B and GBssr-MB77, respectively. The narrow genetic base could be one of the reasons for the low yield of polymorphic markers in the study. The primer GBssr-MB91 also yielded highest number of PIC value (0.803). Genetic differentiation (Fst) values were found in the ranges 0.443 to 0.747 with an average of 0.686 and gene flow (Nm) values ranged from 0.085 to 0.314 with an average of 0.237. Over all Nei’s genetic distance value (D) obdervedfrom nil to 2.706 among 861accessions pair resulting as a means of permutation combination of 42 mungbean genotypes. The UPGMA dendogram based on Nei’s genetic distance separated the genotypes, BARI mung-1 and BD6906 from other 40 genotype. Out of 42 genotypes, 36 genotypes were identified with at least one and/or combination of 4 primers. Keywords: DNA Fingerprinting, Genetic Diversity, Microsatellite (SSR) Marker, Mungbean, Polymorphism 1. Introduction Mungbean (Vignaradiata L. Wilczek) also known as green-gram belongs to subgenus Ceratotropis is an important legume food crop in south and Southeast Asia where 80% of the world’s mungbean. It is an important crop among the palatable pulses in Bangladesh. This crop provides protein- rich food, restores and maintains the soil fertility by fixing atmospheric nitrogen, and also fits well in different cropping systems. However, the average yield of mungbean has to be as low as 670 kg/ha [1]. There are many reasons for such low yield [2]. The low productivity of this crop can be attributed to narrow genetic base (resulting in low yield potential land susceptibility to biotic and abiotic stresses) and lack of suitable plant types for different cropping situations [2, 3]. Variability is the touch stone to a breeder to evolve high yielding varieties through selection. The assessment of genetic variation is a major concern of plant breeders and population genetics. Availability of sufficient variation required for the production of new varieties that are aimed
Transcript of Genetic Diversity Analysis and DNA Fingerprinting of...

Journal of Plant Sciences 2016; 4(6): 153-164
http://www.sciencepublishinggroup.com/j/jps
doi: 10.11648/j.jps.20160406.14
ISSN: 2331-0723 (Print); ISSN: 2331-0731 (Online)
Genetic Diversity Analysis and DNA Fingerprinting of Mungbean (Vigna radiata L.) Genotypes Using SSR Markers
Md. Rezwan Molla1, Iftekhar Ahmed
1, Md. Motiar Rohman
2, Md. Amjad Hossain
1,
Md. Aziz Zilani Chowdhury3
1Molecular Biology Laboratory, Plant Genetic Resources Centre, Bangladesh Agricultural Research Institute (BARI), Gazipur, Bangladesh 2Molecular Breeding Laboratory, Plant Breeding Division, BARI, Gazipur, Bangladesh 3Crops Division, Bangladesh Agricultural Research Council (BARC), Farmgate, Dhaka, Bangladesh
Email address: [email protected] (M. R. Molla), [email protected] (I. Ahmed), [email protected] (M. M. Rohman),
[email protected] (M. A. Hossain), [email protected] (M. A. Z. Chowdhury)
To cite this article: Md. Rezwan Molla, Iftekhar Ahmed, Md. Motiar Rohman, Md. Amjad Hossain, Md. Aziz Zilani Chowdhury. Genetic Diversity Analysis and
DNA Fingerprinting of Mungbean (Vigna radiata L.) Genotypes Using SSR Markers. Journal of Plant Sciences.
Vol. 4, No. 6, 2016, pp. 153-164. doi: 10.11648/j.jps.20160406.14
Received: October 13, 2016; Accepted: October 31, 2016; Published: November 23, 2016
Abstract: Microsatellite combines several features of an ultimate molecular marker and they are used increasingly in various
plant genetic studies and applications. Characterization of mungbean genotypes on the basis of DNA fingerprinting has become
an efficient tool to link genotypic variation. This work is reporting the utilization of a small set of five previously developed
mungbean microsatellite (SSR) markers for the identification and discrimination of six HYVs and 36 landraces. All five
microsatellite markers were found to be polymorphic. Variation was found in number of alleles, allele frequency, observed and
expected heterozygosity. Using five primers across 42 genotypes a total of 20 alleles with an average number of 4 alleles per
locus were found of which GBssr-MB91 showed highest number of alleles (6) (size ranging from 135 to 152 bp) followed by 4
alleles (from 160 to 176 bp and 175 to 195 bp) and 3 alleles (from 264 to 282 bp and 283 to 304 bp) were detected at the loci
LR7322B, LR7323A, LR7323B and GBssr-MB77, respectively. The narrow genetic base could be one of the reasons for the
low yield of polymorphic markers in the study. The primer GBssr-MB91 also yielded highest number of PIC value (0.803).
Genetic differentiation (Fst) values were found in the ranges 0.443 to 0.747 with an average of 0.686 and gene flow (Nm)
values ranged from 0.085 to 0.314 with an average of 0.237. Over all Nei’s genetic distance value (D) obdervedfrom nil to
2.706 among 861accessions pair resulting as a means of permutation combination of 42 mungbean genotypes. The UPGMA
dendogram based on Nei’s genetic distance separated the genotypes, BARI mung-1 and BD6906 from other 40 genotype. Out
of 42 genotypes, 36 genotypes were identified with at least one and/or combination of 4 primers.
Keywords: DNA Fingerprinting, Genetic Diversity, Microsatellite (SSR) Marker, Mungbean, Polymorphism
1. Introduction
Mungbean (Vignaradiata L. Wilczek) also known as
green-gram belongs to subgenus Ceratotropis is an important
legume food crop in south and Southeast Asia where 80% of
the world’s mungbean. It is an important crop among the
palatable pulses in Bangladesh. This crop provides protein-
rich food, restores and maintains the soil fertility by fixing
atmospheric nitrogen, and also fits well in different cropping
systems. However, the average yield of mungbean has to be
as low as 670 kg/ha [1]. There are many reasons for such low
yield [2]. The low productivity of this crop can be attributed
to narrow genetic base (resulting in low yield potential land
susceptibility to biotic and abiotic stresses) and lack of
suitable plant types for different cropping situations [2, 3].
Variability is the touch stone to a breeder to evolve high
yielding varieties through selection. The assessment of
genetic variation is a major concern of plant breeders and
population genetics. Availability of sufficient variation
required for the production of new varieties that are aimed
Journal of Plant Sciences 2016; 4(6): 153-164 154
towards the improvement of crop productivity and able to
withstand amaze from biotic and abiotic factors. Not quite
enough to expose the genetic diversity and do not reflect real
genetic relationships. Therefore, molecular markers have
several advantages over the traditional phenotypic markers.
They are unaffected by environment and detectable in all
stages of development. The molecular genetic techniques
have been adopted for the management and manipulation of
plant genomes DNA markers are the most powerful and
widely used because they can portray genome sequence
composition [4].
In recent years it has been proved beyond doubt that only
identification of crop varieties by quantitative terms is not
adequate. Therefore, there is need for documentation with
appropriate colour photography and preservation of original
seeds. These genotypes/varieties have some identical
characters with morphological traits given by the breeders
during its release or registration. But those are not adequate
and well characterized and documented in the form that can
support effective implementation of Plant Variety and
Farmers Right Protection Act (PVFRPA) [5]. All these
materials have chances of changing its quantitative and
qualitative traits due to G x E and outcrossing/mutation
renamed as well as re-registered as new.
To overcome these problems, several DNA marker systems
are now common use in diversity studies of plants, the most
commonly used marker systems are restriction fragment
length polymorphism (RFLP) [6], random amplified
polymorphic DNA (RAPD) [7], amplified fragment length
polymorphism (AFLP) [7], inter simple sequence repeats
(ISSRs) [8] and microsatellites or simple sequence repeats
(SSRs) [9]. Among them to characterize DNA variation
patterns within species and among closely related texa in
Vigna species have been RAPD [10], AFLP [11], RFLP [12],
ISSR [13], SSRs [10].
Molecular markershave been successfully applied in
registration activities likecultivar identification [14], or
controls ofseed purity of hybrid varieties [15] and also for the
variety identification as a part of seed and grain trade [16].
Of all classes of DNA based marker, the microsatellite SSR
(Simple Sequence Repeat) is Polymerase Chain Reaction
(PCR) based, highly polymorphic, multi-allelic, frequently
codominant, highly reproducible, randomly and widely
distributed in the genome [17]. Mutations in the motifs and
flanking sequences as well as distribution of microsatellites
in the genome of a species are exploited to reveal genetic
variation and varietal identity. In plants, it has been
demonstrated that SSRs are highly informative, locus specific
markers in many species [6, 18, 19] identified and distributed
throughout the genome. For characterization and
documentation, this technique has been recently used in 20
crop species including rice, wheat, maize, barley, rapeseed,
soybean, potato and other crops by [5]. In Bangladesh, nine
soybean cultivars were identified by microsatellite markers,
which have provided identity and might work as protection
[20]. Thirteen maize cultivars were also characterized using
microsatellite fingerprinting in combination with DUS test
[21] and 94 rice cultivars [22]. Genetic diversity analysis
among 13 mungbean cultivars [3] and 10 germplasm (7
exotic and 3 advance line) [23] was performed through
polymerase chain reaction (PCR) based random amplification
of polymorphic DNA (RAPD).
Based on that experience, the present study has been
designed with 42 varieties/land races types of mungbean
using the molecular traits i) to analyze genetic diversity and
relationship among the genotypes, and ii) to identify unique
DNA banding pattern. In this set of study there are materials
that are being cultivated, under conservation, being under
threat to erode due to ecological imbalance in their habitats
and considered to be non-economic in the present context of
commercial agriculture with high input-high output
production system.
2. Materials and Methods
2.1. Raising of Seedlings and Isolation of Genomic DNA
Seeds selected genotypes were obtained from mungbean
collections maintained at Pulses Research Centre (PRC) and
Plant Genetic Resources Centre (PGRC) of BARI, Gazipur,
Bangladesh which were collected from different location. A
total of 42 genotypes including six commercial varieties, one
most popular local cultivar and 35 landraces of mungbean
representing a wide spectrum of variability were selected for
the present study (Table 1). The seedlings were grown in
small plastic pots. Bulked DNA was isolated from 2-5 fresh
leaves of 10 days old seedlings using following the protocol
described by [24] and also used by [25] with some
modifications. Excluding usage liquid nitrogen the modified
protocol included digestion with homogenization buffer (pH=
8.0): [50 mMTris-HCl, 25 mM EDTA
(Ethylenediaminetetraacetic acid), 300 mMNaCl and TEN
buffer + 5% SDS (Sodium Dodecyl Sulfate) + 10% PVP
(Poly Vinyl Pyrolideone) + 20% CTAB (CetylTrimethyl
Ammonium Bromide)] at 65ºC for 30 min, extraction with
phenol: chloroform: isoamyl alcohol (25:24:1), precipitation
with ice-cold and extra pure isopropyl alcohol. DNA was
purified using two volume of absolute alcohol in presence of
0.3M sodium acetate and pelleted by centrifugation. The
pellets were then washed with 70% ethanol, air dried and
resuspended in an appropriate volume of TE buffer (10
mMTris-HCl, 1 mM EDTA, pH=8.0) treated with 2 µl of
RNAse A for removing of RNA. The quality of extracted
DNA was examined under the UV light following agarose
gel electrophoresis (1% gel containing 10 mg/ml ethidium
bromide).
2.2. Quantification and Optimization of DNA
Concentration
The amount of genomic DNA was quantified at 260 nm
spectrophotometrically (Spectronic®
GENESYS™ 10 Bio).
Using the absorbance reading obtained for DNA sample of
each mungbean genotypes, the original DNA concentrations
were determined and adjusted to 25ng/µl.

155 Md. Rezwan Molla et al.: Genetic Diversity Analysis and DNA Fingerprinting of Mungbean (Vigna radiata L.)
Genotypes Using SSR Markers
Table 1. List of genotypes used in this study.
Sl. no. Genotypes/Gene bank accessionnumber Source Sl. no. Genotypes/Gene bank accession number Source
1 BARI mung-1 PRC, BARI 22 BD6889 PGRC, BARI
2 BARI mung-2 PRC, BARI 23 BD6890 PGRC, BARI
3 BARI mung-3 PRC, BARI 24 BD6891 PGRC, BARI
4 BARI mung-4 PRC, BARI 25 BD6892 PGRC, BARI
5 BARI mung-5 PRC, BARI 26 BD6893 PGRC, BARI
6 BARI mung-6 PRC, BARI 27 BD6894 PGRC, BARI
7 Sonamug PRC, BARI 28 BD6895 PGRC, BARI
8 BD6874 PGRC, BARI 29 BD6896 PGRC, BARI
9 BD6875 PGRC, BARI 30 BD6897 PGRC, BARI
10 BD6876 PGRC, BARI 31 BD6898 PGRC, BARI
11 BD6877 PGRC, BARI 32 BD6899 PGRC, BARI
12 BD6878 PGRC, BARI 33 BD6900 PGRC, BARI
13 BD6879 PGRC, BARI 34 BD6901 PGRC, BARI
14 BD6880 PGRC, BARI 35 BD6902 PGRC, BARI
15 BD6881 PGRC, BARI 36 BD6903 PGRC, BARI
16 BD6882 PGRC, BARI 37 BD6904 PGRC, BARI
17 BD6884 PGRC, BARI 38 BD6905 PGRC, BARI
18 BD6885 PGRC, BARI 39 BD6906 PGRC, BARI
19 BD6886 PGRC, BARI 40 BD6907 PGRC, BARI
20 BD6887 PGRC, BARI 41 BD6908 PGRC, BARI
21 BD6888 PGRC, BARI 42 BD6909 PGRC, BARI
2.3. Identification and Selection of Microsatellite (SSR)
Primers
A set of 14 microsatellite primer pairs (LR7322B,
LR7323A, LR7323B, LR7315A, GBssr-MB7, GBssr-MB87,
GBssr-MB91, GBssr-MB13, GBssr-MB14, GBssr-MB17,
GBssr-MB77, LR733B, LR738A, LR7319B) were identified
and characterized for mungbean SSR markers. Preliminarily,
the primer pairs were tested for their better responsiveness in
amplifying the target genomic region of template DNA and
to check the expected PCR product sizes in base pairs.
Finally, five primer pairs viz. LR7322 B, LR 7323 A,
LR7323 B, GBssr-MB91 and GBssr-MB77 with clear and
expected amplified product sizes were selected and used for
microsatellite analysis in the present study.
2.4. Polymerase Chain Reaction (PCR)
The Polymerase chain reactions was set up 10 µl
volumes containing 1µl 10 x PCR Buffer, 0.25 mM each
of the dNTPs, 10 µM of each of primer, 1 unit ampliTaq
DNA polymerase (Invitrogen, USA), 75 ng template DNA
and a suitable amount of sterile deionized water. The
reaction was performed in a oil free Techne, TC 312
thermal cycler. SSRs were amplified under the following
“touchdown” PCR conditions: 94°C /5 min denaturation,
45 cycles of 94°C /30 sec, 48-50°C /1 min, decreasing by
0.5°C per cycle, and 72°C /45 sec; 8 cycles of 94°C /30
sec, 45-48-°C/45 sec and 72°C /45 sec; a final extension
for 10 min at 72°C. For checking amplification, the PCR
products were electrophoretically resolved on 2% agarose
gel in 1X TBE. If the primer was shown good band
resolution intensity, less srearing, amplifying the target
genomic region of template DNA, the PCR protocol
considered to be correct.
2.5. Electrophoretic Separation and Visualization of PCR
Products
PCR-products were electrophoresed on a 6% denaturing
polyacrylamide gel containing 19:1 acrylamide: bis-
acrylamide and 8M urea. Electrophoresis was done using the
SequiGen GT Sequencing Cell (BIO-RAD Laboratories,
Hercules, CA, USA) electrophoresis system. A pre-run of the
gel for 30 mins at 120 W was followed by a final run at 60W
and 50ºC upon loading of denatured PCR products for a
specified period of time depending on the size of amplified
DNA fragment (usually 1 hour for 100 bp). A molecular
weight marker DNA (100 bp DNA ladder, Biobasic, Canada)
was loaded on either side of the gel. After completion of
electrophoresis, the DNA fragments were visualized
following the Promega (Madison, WI) silver-staining
protocol.
2.6. Scoring and Analysis of Microsatellite Data
The bands representing particular alleles at the
microsatellite loci were scored manually and designated the
bands as A, B, C, etc. from the top to the bottom of the gel by
three experienced scientists individually. The genotypes of
different individuals were hypothetically scored as AA, BB,
CC, etc. for homozygous or as AB, AC, BC etc. for
heterozygous. A single genotypic data matrix was constructed
for all loci. Polymorphism Information Content (PIC) was
computed by deducting sum of square values for all the
frequencies of different alleles produced by a single marker
locus from one using the formula: PIC=1- ΣXi2, Where, Xi is
the frequency of the i-th allele of a particular locus.
PIC provides an estimate of the discriminatory power of a
marker by taking into account, not only the number of alleles
that are expressed, but also the relative frequencies of those

Journal of Plant Sciences 2016; 4(6): 153-164 156
alleles. PIC values range from 0 (monomorphic) to 1 (very
high discriminative, with many alleles in equal frequencies).
The software DNA FRAG version 3.03 was used to estimate
allelic length [26]. Expected (He) and observed heterozygosity
(Ho) were also calculated as per [27, 18] formula and with the
help of POPGENE (version 1.32) [28] computer package
program. Estimation of Nei’s genetic distance values (D) [27]
and construction of UPGMA (Unweighted Pair Group Method
of Arithmetic Means) dendrogram was constructed using the
software POPGENE (version 1.32) [28].
3. Results and Discussion
All forty two mungbean genotypes were successfully
amplified with the five microsatellite primer pairs (LR7322B,
LR7323A, LR7323B, GBssr-MB91 and GBssr-MB77).
Based on previous results of Kumar et al. [29] and Gwag et
al. [30], primer pairs referred to as loci and DNA bands as
alleles. All five microsatellite markers were found to be
polymorphic, revealing a total of 20 alleles with an average
number of 4 alleles per locus were found in the present study.
The narrow genetic base could be one of the reasons for the
low yield of polymorphic markers in the study. At the GBssr-
MB91 locus showed highest number of observed alleles (6)
among the 42 mungbean genotypes ranging in size from 135
to 152 bp. Likewise, 4 alleles (size ranging from 160 to 176
bp and 175 to 195 bp) and 3 alleles (from 264 to 282 bp and
283 to 304 bp) were detected at the loci LR7322B,
LR7323A, LR7323B and GBssr-MB77 respectively in
descending order (Table 2) and the effective number of allele
was also highest (5.079) for GBssr-MB91 (Table 2). Narrow
genetic base has been among the mungbean accessionsin this
study. Three to five alleles size ranging from 171 to 285 bp
were obtained by Kumar et al. [29] while conducting
isolation of microsatellite markers in mungbean, Vigna,
although some variation occurred might be due to mutation
of dinucleotide repeat units which could also be indicative of
varietal differences. Allele frequency ranged from 0.063 to
0.563 observed in the present study. DNA banding patterns
were generated by the primer pairs in 42 mungbean
genotypes are shown in Figure 1.
Figure 1. Microsatellite profiles of 42 mungbean genotypes at locus GBssr-MB91 and LR7323A; M: molecular wt. marker (100 bp DNA ladder); Lane 01:
BARI mung-1; ; Lane 02: BARI mung-2; Lane 03: BARI mung-3; Lane 04: BARI mung-4; Lane 05: BARI mung-50; Lane 6: BARI mung-6; Lane 07:
Sonamug, Lane 08: BD6874; Lane 09: BD6875; Lane 10: BD6876; Lane 11: BD6877; Lane 12: BD6878; Lane 13: BD6879; Lane 14: BD6880; Lane 15:
BD6881; Lane 16: BD6882; Lane 17: BD6884; Lane 18: BD6885; Lane 19: BD6886; Lane 20: BD6887; Lane 21: BD6888; Lane 22: BD6889; Lane 23:
BD6890; Lane 24: BD6891; Lane 25: BD6892; Lane 26: BD6893; Lane 27: BD6894; Lane 28: BD6895; Lane 29: BD6896; Lane 30: BD6897; Lane 31:
BD6898; Lane 32: BD6899; Lane 33: BD6900; Lane 34: BD6901; Lane 35: BD6902; Lane 36: BD6903; Lane 37: BD6904; Lane 38: BD6905; Lane 39:
BD6906; Lane 40: BD6907; Lane 41: BD6908; Lane 42: BD6909.
157 Md. Rezwan Molla et al.: Genetic Diversity Analysis and DNA Fingerprinting of Mungbean (Vigna radiata L.)
Genotypes Using SSR Markers
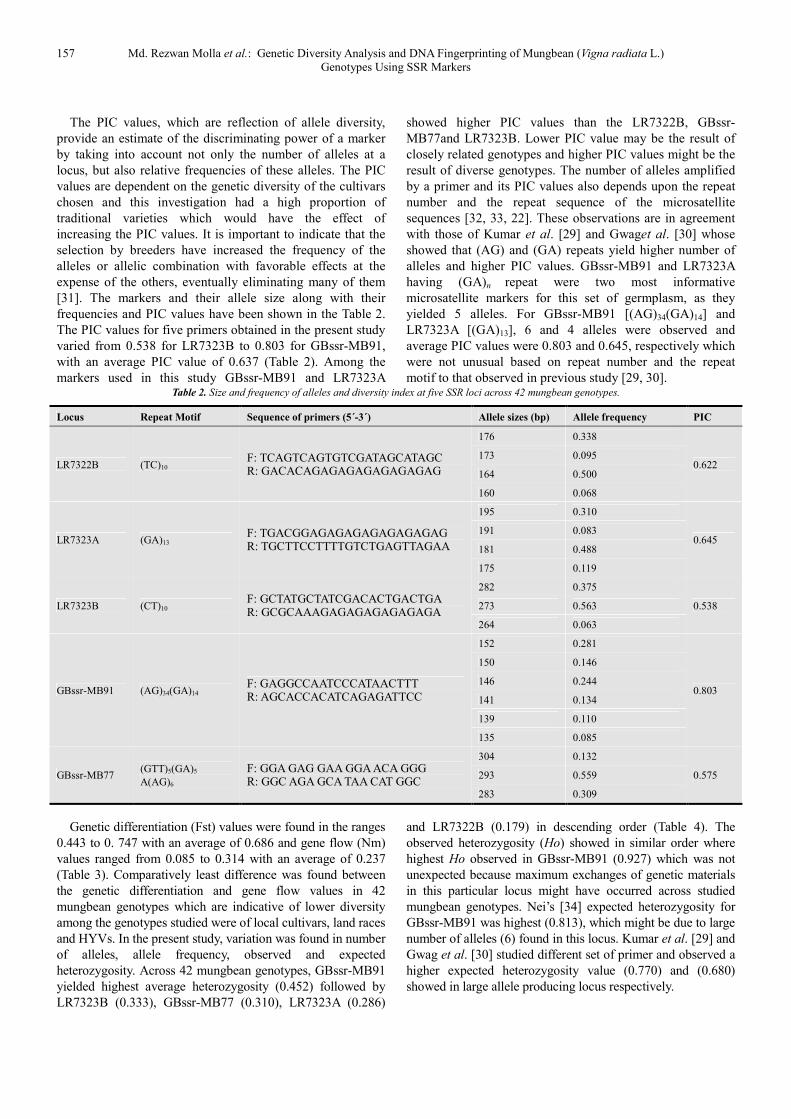
The PIC values, which are reflection of allele diversity,
provide an estimate of the discriminating power of a marker
by taking into account not only the number of alleles at a
locus, but also relative frequencies of these alleles. The PIC
values are dependent on the genetic diversity of the cultivars
chosen and this investigation had a high proportion of
traditional varieties which would have the effect of
increasing the PIC values. It is important to indicate that the
selection by breeders have increased the frequency of the
alleles or allelic combination with favorable effects at the
expense of the others, eventually eliminating many of them
[31]. The markers and their allele size along with their
frequencies and PIC values have been shown in the Table 2.
The PIC values for five primers obtained in the present study
varied from 0.538 for LR7323B to 0.803 for GBssr-MB91,
with an average PIC value of 0.637 (Table 2). Among the
markers used in this study GBssr-MB91 and LR7323A
showed higher PIC values than the LR7322B, GBssr-
MB77and LR7323B. Lower PIC value may be the result of
closely related genotypes and higher PIC values might be the
result of diverse genotypes. The number of alleles amplified
by a primer and its PIC values also depends upon the repeat
number and the repeat sequence of the microsatellite
sequences [32, 33, 22]. These observations are in agreement
with those of Kumar et al. [29] and Gwaget al. [30] whose
showed that (AG) and (GA) repeats yield higher number of
alleles and higher PIC values. GBssr-MB91 and LR7323A
having (GA)n repeat were two most informative
microsatellite markers for this set of germplasm, as they
yielded 5 alleles. For GBssr-MB91 [(AG)34(GA)14] and
LR7323A [(GA)13], 6 and 4 alleles were observed and
average PIC values were 0.803 and 0.645, respectively which
were not unusual based on repeat number and the repeat
motif to that observed in previous study [29, 30]. Table 2. Size and frequency of alleles and diversity index at five SSR loci across 42 mungbean genotypes.
Locus Repeat Motif Sequence of primers (5´-3´) Allele sizes (bp) Allele frequency PIC
LR7322B (TC)10 F: TCAGTCAGTGTCGATAGCATAGC R: GACACAGAGAGAGAGAGAGAG
176 0.338
0.622 173 0.095
164 0.500
160 0.068
LR7323A (GA)13 F: TGACGGAGAGAGAGAGAGAGAG R: TGCTTCCTTTTGTCTGAGTTAGAA
195 0.310
0.645 191 0.083
181 0.488
175 0.119
LR7323B (CT)10 F: GCTATGCTATCGACACTGACTGA R: GCGCAAAGAGAGAGAGAGAGA
282 0.375
0.538 273 0.563
264 0.063
GBssr-MB91 (AG)34(GA)14 F: GAGGCCAATCCCATAACTTT R: AGCACCACATCAGAGATTCC
152 0.281
0.803
150 0.146
146 0.244
141 0.134
139 0.110
135 0.085
GBssr-MB77 (GTT)5(GA)5
A(AG)6
F: GGA GAG GAA GGA ACA GGG R: GGC AGA GCA TAA CAT GGC
304 0.132
0.575 293 0.559
283 0.309
Genetic differentiation (Fst) values were found in the ranges
0.443 to 0. 747 with an average of 0.686 and gene flow (Nm)
values ranged from 0.085 to 0.314 with an average of 0.237
(Table 3). Comparatively least difference was found between
the genetic differentiation and gene flow values in 42
mungbean genotypes which are indicative of lower diversity
among the genotypes studied were of local cultivars, land races
and HYVs. In the present study, variation was found in number
of alleles, allele frequency, observed and expected
heterozygosity. Across 42 mungbean genotypes, GBssr-MB91
yielded highest average heterozygosity (0.452) followed by
LR7323B (0.333), GBssr-MB77 (0.310), LR7323A (0.286)
and LR7322B (0.179) in descending order (Table 4). The
observed heterozygosity (Ho) showed in similar order where
highest Ho observed in GBssr-MB91 (0.927) which was not
unexpected because maximum exchanges of genetic materials
in this particular locus might have occurred across studied
mungbean genotypes. Nei’s [34] expected heterozygosity for
GBssr-MB91 was highest (0.813), which might be due to large
number of alleles (6) found in this locus. Kumar et al. [29] and
Gwag et al. [30] studied different set of primer and observed a
higher expected heterozygosity value (0.770) and (0.680)
showed in large allele producing locus respectively.

Journal of Plant Sciences 2016; 4(6): 153-164 158
Table 3. Summary of genetic variation statistics for all loci.
Locus *na *ne *I *Fst *Nm
LR7322B 4 2.648 1.118 0.747 0.085
LR7323A 4 2.816 1.174 0.557 0.199
LR7323B 3 2.170 0.865 0.545 0.209
GBssr-MB91 6 5.079 1.704 0.443 0.314
GBssr-MB77 3 2.352 0.956 0.571 0.188
Mean 4 3.013 1.163 0.566 0.192
*na = Observed number of alleles, ne = Effective number of alleles, I =
Shannon's Information Index and Nm = Gene flow estimated from Fst =
0.25(1 - Fst)/Fst.
Table 4. Summary of heterozygosity(Het.) statistics for all loci.
Locus Obs.
Hom.
Obs.
Het.
Exp.
Hom.*
Exp.
Het.* Nei**
Ave.
Het.
LR7322B 0.595 0.405 0.369 0.631 0.622 0.179
LR7323A 0.429 0.571 0.347 0.653 0.645 0.286
LR7323B 0.125 0.875 0.452 0.548 0.539 0.333
GBssr-MB91
0.073 0.927 0.187 0.813 0.803 0.452
GBssr-MB77
0.235 0.765 0.417 0.583 0.575 0.310
Mean 0.291 0.355 0.355 0.646 0.637 0.312
St. Dev. 0.218 0.102 0.102 0.102 0.102 0.098
*Expected homozygosity and heterozygosity were computed using Levene
[35] ** Nei's [34] expected heterozygosity
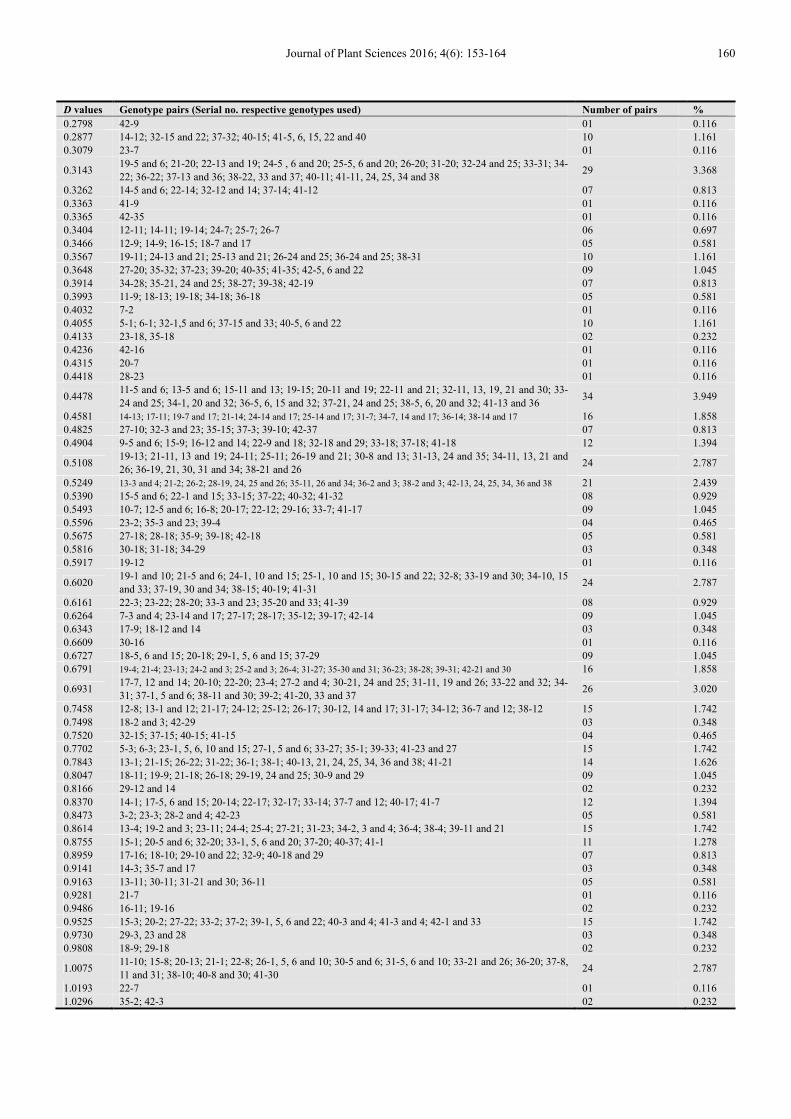
Over all Nei’s genetic distance value (D) ranged from nil
to 2.7058 among 861 pairs resulting as a means of
permutation combination of 42 mungbean genotypes (Figure
2). Out of 861 pairs 3.25% showed no genetic distance
whereas only one pair BARI mung-2 vs BD6878 showed the
highest genetic distance (2.7058) (Table 5). This closeness
may be possible in the genetic make up of the locus for
which the primers were responsible to distinguish along with
low variation also in the morphological traits and
geographical sources. The highest genetic distance can be
explained by the fact that in one side the local cultivars or
land races and on the other side the HYVs have been
involved. The distance has been generated during the process
of the development of HYVs. The generated distance can
further be used for inclusion of gene source from the
traditional varieties to more HYVs, which indicates the
impact of the genetic fingerprinting and correlating the
values with that of the morpho-physiological traits to find out
the best performing varieties through appropriate breeding
programmes.
UPGMA dendrogram based on Nei’s genetic distance
separated the 42 genotypes of mungbean initially into two
clusters, “a” and “b” in which 31 genotypes grouped in
cluster “a” and other 11 genotypes grouped in Cluster “b”.
Cluster “a” formed two sub-clusters “c” and “d”. Sub-cluster
“b” subsequently separated into another two sub-clusters “e”,
“f” respectively in which “e” contained genotypes BARI
mung-2, BD6878, Sonamug and BD6882 and “h” contained
genotype BARI mung-4, BD6874, BD6876, BD6894,
BD6897 and BD6806.
Sub-cluster subsequently formed other sub-clusters
namely, “i”, “j”, “k”, “l” and so on (Figure 2). The genotypes
have a distinct status in the dendrogram, because there might
have effect of morphological traits and geographical sources.
The varieties, as for example, BARI mung-5 and BARI
mung-6 were grouped together in same sub-cluster which
also probably due to similar type of morphological traits and
original geographical sources. On the other hand, the variety
BARI mung-1, BARI mung-2, BARI mung-3 and BARI
mung-4 were scattered in different sub-cluster that might due
to distinct breeder’s traits like as pigment present at the
lowest part of the seedling in the variety BARI mung-2 and it
is introduced from same country of origin (AVRDC, Taiwan).
Similarly, BARI mung-1 introduced from India (M-7706).
On the contrary, BARI mung-2, BARI mung-4 and local
cultivar Sonamug were grouped in together in cluster “b”
which could be explained BARI mung4 developed from
same cross (Sonamug x BARI mung-2).
Allele sizing technologies are well established and can be
readily used to size microsatellite alleles from any organism
[36]. Utilization of two microsatellite markers in the analysis
of mungbeangenotypess revealed a high level of genetic
polymorphism which allowed unique genotyping of 44.44%
of the studied cultivars and only these three markers were
sufficient for unambiguous identification of 15 mungbean
genotypes which includes three high yielding, and one most
popular local cultivar. In the set of 42 genotypes, 22 alleles
were detected which multiplied into a number of observed
genotypes at each locus, giving high discrimination value for
genotype identification.
These results represent one of the first attempts to find out
a small set of microsatellite makers to discriminate
mungbean genotypes of Bangladesh providing meaningful
data that can be enlarged by additional mungbean genotypes
and new microsatellite markers. Among 22 alleles detected,
three were specific to three mungbean genotypes. One
specific allele was detected in the cultivar BARI mung-2
(GBssrMB-91/152, 141), BD6899 (LR7322B/164,160) and
BD6900 (LR7322B/173) (Table 6).

159 Md. Rezwan Molla et al.: Genetic Diversity Analysis and DNA Fingerprinting of Mungbean (Vigna radiata L.)
Genotypes Using SSR Markers
Figure 2. UPGMA dendrogram based on Nei’s [27] genetic distance, summarizing the data on differentiation between 42 mungbean genotypes according to
microsatellite analysis.
Table 5. Nei’s Genetic Distance Values (D) among 42 Mungbean genotypes across 5 SSR markers.
D values Genotype pairs (Serial no. respective genotypes used) Number of pairs %
0.0000 6-5; 8-4; 9-2 and 7; 10-8 and 9; 16-2, 7 and 10; 20-16; 25-24; 26-12 and 16; 27-8, 9 and 16; 28-8, 9 and
16; 30-4, 10, 27 and 28; 31-16 and 29; 36-13; 39-8 and 30 28 3.252
0.0668 42-12 and 14 02 0.232
0.0741 39-27 01 0.116
0.0771 42-15 01 0.116
0.0870 22-5 and 6 02 0.232
0.1054 24-19; 25-19; 34-19, 24 and 25; 38-24 and 25 07 0.813
0.1116 38-18 01 0.116
0.1438 15-12 and 14; 41-14 03 0.348
0.1542 4-2; 28-27 02 0.232
0.1641 35-22; 42-40 and 41 03 0.348
0.1682 24-23; 25-23; 34-27; 39-19 04 0.465
0.1965 24-22; 25-22; 33-13; 34-5 and 6; 36-33; 41-19 07 0.813
0.2027 40-8 01 0.116
0.2209 27-7; 28-7; 35-14; 39-7 04 0.465
0.2231 38-13, 19, 34 and 36 04 0.465
0.2309 40-12 and 14 02 0.232
0.2350 38-7 01 0.116
0.2412 27-23; 39-23 and 28 03 0.348
0.2451 24-18; 25-18 02 0.232
0.2594 3-1; 23-20; 28-10; 35-5 and 6; 37-35; 42-32 07 0.813
0.2736 23-19 and 21; 26-23; 27-19, 24, 25 and 26; 34-23; 35-13; 36-35; 38-23 and 35; 39-24, 25, 26 and 34; 42-11 17 1.974
Journal of Plant Sciences 2016; 4(6): 153-164 160
D values Genotype pairs (Serial no. respective genotypes used) Number of pairs %
0.2798 42-9 01 0.116
0.2877 14-12; 32-15 and 22; 37-32; 40-15; 41-5, 6, 15, 22 and 40 10 1.161
0.3079 23-7 01 0.116
0.3143 19-5 and 6; 21-20; 22-13 and 19; 24-5 , 6 and 20; 25-5, 6 and 20; 26-20; 31-20; 32-24 and 25; 33-31; 34-
22; 36-22; 37-13 and 36; 38-22, 33 and 37; 40-11; 41-11, 24, 25, 34 and 38 29 3.368
0.3262 14-5 and 6; 22-14; 32-12 and 14; 37-14; 41-12 07 0.813
0.3363 41-9 01 0.116
0.3365 42-35 01 0.116
0.3404 12-11; 14-11; 19-14; 24-7; 25-7; 26-7 06 0.697
0.3466 12-9; 14-9; 16-15; 18-7 and 17 05 0.581
0.3567 19-11; 24-13 and 21; 25-13 and 21; 26-24 and 25; 36-24 and 25; 38-31 10 1.161
0.3648 27-20; 35-32; 37-23; 39-20; 40-35; 41-35; 42-5, 6 and 22 09 1.045
0.3914 34-28; 35-21, 24 and 25; 38-27; 39-38; 42-19 07 0.813
0.3993 11-9; 18-13; 19-18; 34-18; 36-18 05 0.581
0.4032 7-2 01 0.116
0.4055 5-1; 6-1; 32-1,5 and 6; 37-15 and 33; 40-5, 6 and 22 10 1.161
0.4133 23-18, 35-18 02 0.232
0.4236 42-16 01 0.116
0.4315 20-7 01 0.116
0.4418 28-23 01 0.116
0.4478 11-5 and 6; 13-5 and 6; 15-11 and 13; 19-15; 20-11 and 19; 22-11 and 21; 32-11, 13, 19, 21 and 30; 33-
24 and 25; 34-1, 20 and 32; 36-5, 6, 15 and 32; 37-21, 24 and 25; 38-5, 6, 20 and 32; 41-13 and 36 34 3.949
0.4581 14-13; 17-11; 19-7 and 17; 21-14; 24-14 and 17; 25-14 and 17; 31-7; 34-7, 14 and 17; 36-14; 38-14 and 17 16 1.858
0.4825 27-10; 32-3 and 23; 35-15; 37-3; 39-10; 42-37 07 0.813
0.4904 9-5 and 6; 15-9; 16-12 and 14; 22-9 and 18; 32-18 and 29; 33-18; 37-18; 41-18 12 1.394
0.5108 19-13; 21-11, 13 and 19; 24-11; 25-11; 26-19 and 21; 30-8 and 13; 31-13, 24 and 35; 34-11, 13, 21 and
26; 36-19, 21, 30, 31 and 34; 38-21 and 26 24 2.787
0.5249 13-3 and 4; 21-2; 26-2; 28-19, 24, 25 and 26; 35-11, 26 and 34; 36-2 and 3; 38-2 and 3; 42-13, 24, 25, 34, 36 and 38 21 2.439
0.5390 15-5 and 6; 22-1 and 15; 33-15; 37-22; 40-32; 41-32 08 0.929
0.5493 10-7; 12-5 and 6; 16-8; 20-17; 22-12; 29-16; 33-7; 41-17 09 1.045
0.5596 23-2; 35-3 and 23; 39-4 04 0.465
0.5675 27-18; 28-18; 35-9; 39-18; 42-18 05 0.581
0.5816 30-18; 31-18; 34-29 03 0.348
0.5917 19-12 01 0.116
0.6020 19-1 and 10; 21-5 and 6; 24-1, 10 and 15; 25-1, 10 and 15; 30-15 and 22; 32-8; 33-19 and 30; 34-10, 15
and 33; 37-19, 30 and 34; 38-15; 40-19; 41-31 24 2.787
0.6161 22-3; 23-22; 28-20; 33-3 and 23; 35-20 and 33; 41-39 08 0.929
0.6264 7-3 and 4; 23-14 and 17; 27-17; 28-17; 35-12; 39-17; 42-14 09 1.045
0.6343 17-9; 18-12 and 14 03 0.348
0.6609 30-16 01 0.116
0.6727 18-5, 6 and 15; 20-18; 29-1, 5, 6 and 15; 37-29 09 1.045
0.6791 19-4; 21-4; 23-13; 24-2 and 3; 25-2 and 3; 26-4; 31-27; 35-30 and 31; 36-23; 38-28; 39-31; 42-21 and 30 16 1.858
0.6931 17-7, 12 and 14; 20-10; 22-20; 23-4; 27-2 and 4; 30-21, 24 and 25; 31-11, 19 and 26; 33-22 and 32; 34-
31; 37-1, 5 and 6; 38-11 and 30; 39-2; 41-20, 33 and 37 26 3.020
0.7458 12-8; 13-1 and 12; 21-17; 24-12; 25-12; 26-17; 30-12, 14 and 17; 31-17; 34-12; 36-7 and 12; 38-12 15 1.742
0.7498 18-2 and 3; 42-29 03 0.348
0.7520 32-15; 37-15; 40-15; 41-15 04 0.465
0.7702 5-3; 6-3; 23-1, 5, 6, 10 and 15; 27-1, 5 and 6; 33-27; 35-1; 39-33; 41-23 and 27 15 1.742
0.7843 13-1; 21-15; 26-22; 31-22; 36-1; 38-1; 40-13, 21, 24, 25, 34, 36 and 38; 41-21 14 1.626
0.8047 18-11; 19-9; 21-18; 26-18; 29-19, 24 and 25; 30-9 and 29 09 1.045
0.8166 29-12 and 14 02 0.232
0.8370 14-1; 17-5, 6 and 15; 20-14; 22-17; 32-17; 33-14; 37-7 and 12; 40-17; 41-7 12 1.394
0.8473 3-2; 23-3; 28-2 and 4; 42-23 05 0.581
0.8614 13-4; 19-2 and 3; 23-11; 24-4; 25-4; 27-21; 31-23; 34-2, 3 and 4; 36-4; 38-4; 39-11 and 21 15 1.742
0.8755 15-1; 20-5 and 6; 32-20; 33-1, 5, 6 and 20; 37-20; 40-37; 41-1 11 1.278
0.8959 17-16; 18-10; 29-10 and 22; 32-9; 40-18 and 29 07 0.813
0.9141 14-3; 35-7 and 17 03 0.348
0.9163 13-11; 30-11; 31-21 and 30; 36-11 05 0.581
0.9281 21-7 01 0.116
0.9486 16-11; 19-16 02 0.232
0.9525 15-3; 20-2; 27-22; 33-2; 37-2; 39-1, 5, 6 and 22; 40-3 and 4; 41-3 and 4; 42-1 and 33 15 1.742
0.9730 29-3, 23 and 28 03 0.348
0.9808 18-9; 29-18 02 0.232
1.0075 11-10; 15-8; 20-13; 21-1; 22-8; 26-1, 5, 6 and 10; 30-5 and 6; 31-5, 6 and 10; 33-21 and 26; 36-20; 37-8,
11 and 31; 38-10; 40-8 and 30; 41-30 24 2.787
1.0193 22-7 01 0.116
1.0296 35-2; 42-3 02 0.232
161 Md. Rezwan Molla et al.: Genetic Diversity Analysis and DNA Fingerprinting of Mungbean (Vigna radiata L.)
Genotypes Using SSR Markers
D values Genotype pairs (Serial no. respective genotypes used) Number of pairs %
1.0397 29-17 01 0.116
1.0845 8-3; 21-3; 26-3; 27-11 and 13; 30-3 and 23; 31-2, 3 and 28; 35-8 and 26; 36-27; 39-13 and 36; 42-8 16 1.858
1.0924 13-9; 18-8; 21-9; 24-9; 25-9; 29-11, 13 and 21; 34-9; 36-9 and 29; 39-9 and 29 13 1.510
1.0964 14-4; 39-14 02 0.232
1.0986 10-1, 5 and 6; 22-10; 32-10; 33-10; 40-1 and 20; 41-10 09 1.045
1.1513 17-13; 21-12; 31-14; 36-17 04 0.465
1.1757 10-3; 15-4; 20-4; 22-2; 28-1, 5 and 6; 32-27; 33-28; 37-27; 39-15, 32 and 37; 40-23; 41-28; 42-20 16 1.858
1.1836 18-1; 33-29; 41-29 03 0.348
1.2040 11-8; 13-8; 21-8; 24-8; 25-8; 26-8, 11 and 13; 30-19; 34-30; 36-8 and 26; 38-8 13 1.510
1.2425 7-1, 5 and 6; 12-1; 17-10; 18-16; 32-7; 33-12 and 17; 37-17 10 1.161
1.2528 4-3; 27-3; 28-3; 35-27; 39-3 and 35; 42-4 and 39 08 0.929
1.2606 18-4; 29-27; 35-29 03 0.348
1.2951 11-1; 30-20; 31-15; 32-26 and 31; 33-8 and 11; 37-26; 40-31; 41-26 10 1.161
1.3195 12-3; 17-2 and 4; 23-12; 27-14 05 0.581
1.3540 16-7 and 13; 21-16; 24-16; 25-16; 34-16; 36-16; 38-16 08 0.929
1.3722 23-8; 28-11 and 21; 42-31 04 0.465
1.3863 14-7; 20-1 and 15; 29-3; 40-33 05 0.581
1.4390 11-7 01 0.116
1.4452 16-1, 5 and 6; 22-16; 33-16 05 0.581
1-4634 2-1; 4-1; 5-2 and 3; 6-2 and 4; 20-3; 22-4; 27-15; 28-22, 32-2 and 28; 33-4; 37-4; 40-2 and 39; 41-2 17 1.974
1.4979 9-8; 29-8; 31-9 03 0.348
1.5223 16-3 and 4; 23-16; 35-16 04 0.465
1.5301 15-7; 40-7 02 0.232
1.5404 35-4; 42-27 02 0.232
1.5890 9-1; 20-9; 37-9 03 0.348
1.6072 12-4; 14-2; 39-12; 42-7 04 0.465
1.6094 30-26; 31-8 02 0.232
1.6661 9-3 and 4; 29-2 and 4; 39-29 05 0.581
1.7006 8-1, 5 and 6; 13-10; 20-8; 21-10; 30-1; 31-1; 36-10; 40-26 10 1.161
1.7329 29-7 01 0.116
1.7777 8-2; 11-3 and 4; 28-13; 30-2; 31-4; 36-28 07 0.813
1.7918 15-10; 37-10; 40-10 03 0.348
1.8444 8-7; 14-8; 17-8; 26-14; 30-7; 31-12 06 0.697
1.8688 10-2 and 4; 15-2; 28-15; 32-4; 35-10; 37-28; 40-27 and 38; 42-10 10 1.161
1.9356 12-10; 14-10; 17-1; 20-12 04 0.465
1.9459 35-28; 42-2 and 8 03 0.348
2.0127 17-3; 27-12; 28-12 and 14 04 0.465
2.0794 12-7 01 0.116
2.1910 26-17; 29-26 02 0.232
2.2154 39-16 01 0.116
2.2822 29-20; 33-9 02 0.232
2.3026 19-8; 34-8 02 0.232
2.3592 23-9; 39-9 02 0.232
2.3937 26-15; 41-8 02 0.232
2.4708 11-2; 42-26 02 0.232
2.7058 12-2 01 0.116
Total 861 100.00
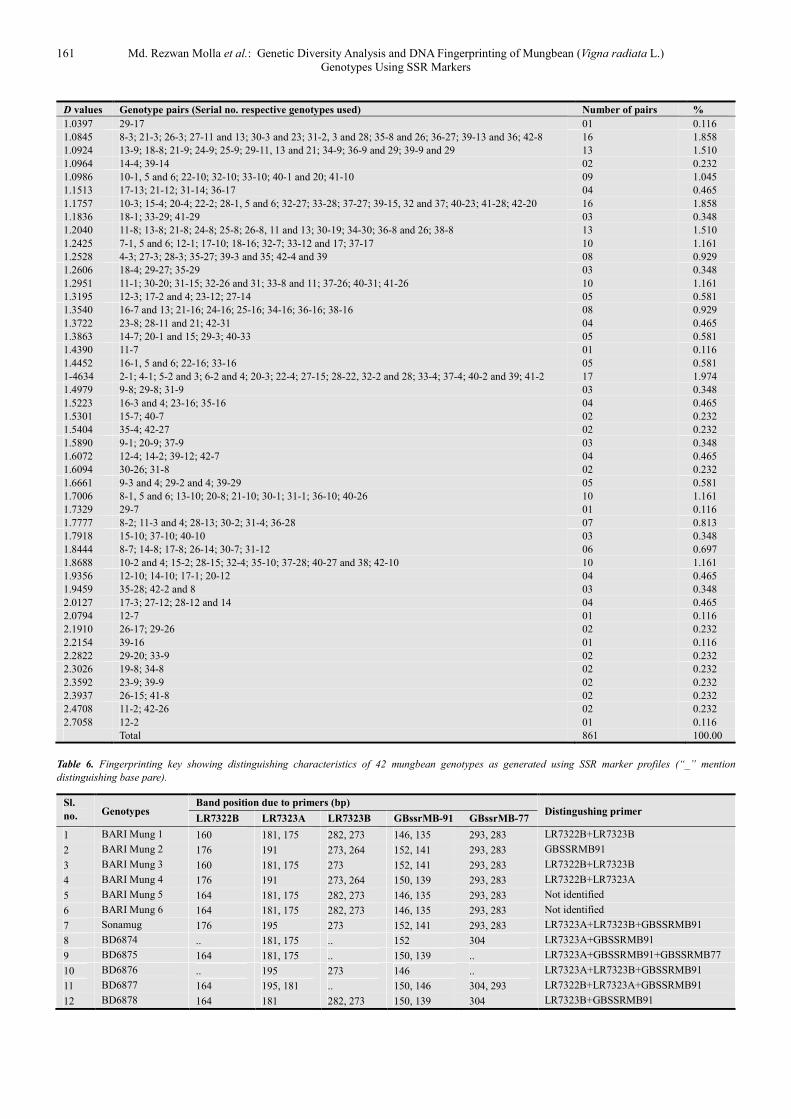
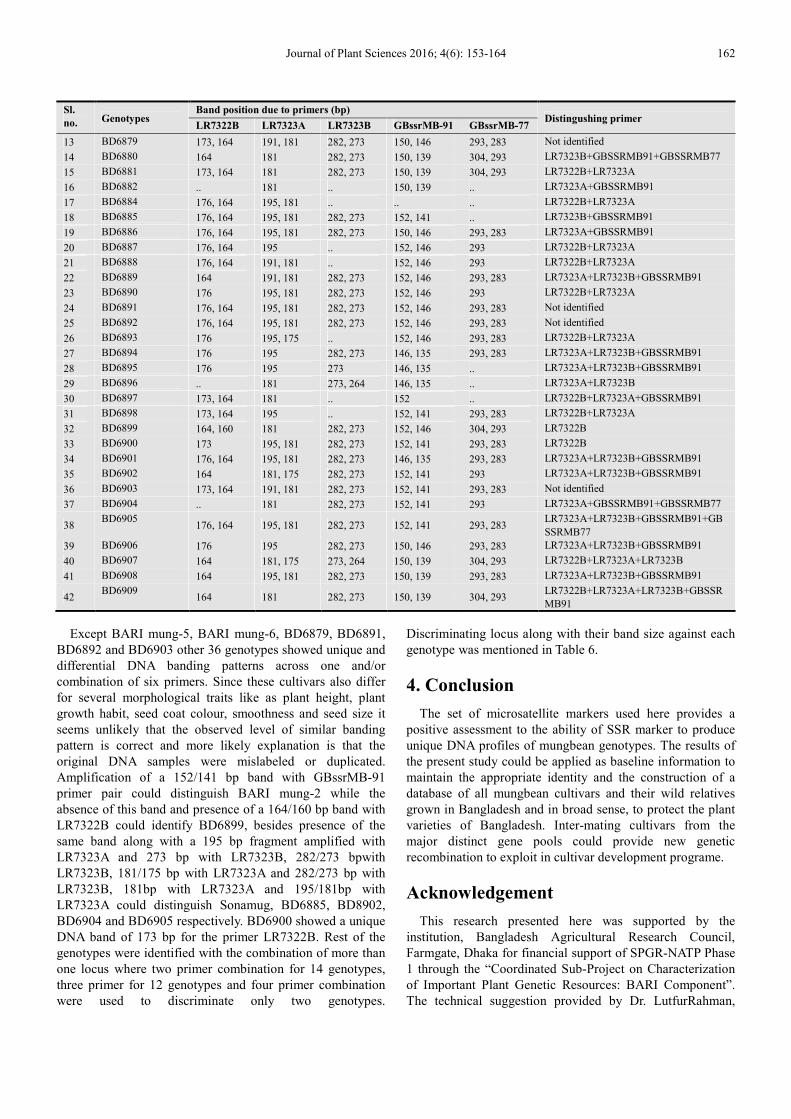
Table 6. Fingerprinting key showing distinguishing characteristics of 42 mungbean genotypes as generated using SSR marker profiles (“_” mention
distinguishing base pare).
Sl.
no. Genotypes Band position due to primers (bp)
Distingushing primer LR7322B LR7323A LR7323B GBssrMB-91 GBssrMB-77
1 BARI Mung 1 160 181, 175 282, 273 146, 135 293, 283 LR7322B+LR7323B
2 BARI Mung 2 176 191 273, 264 152, 141 293, 283 GBSSRMB91
3 BARI Mung 3 160 181, 175 273 152, 141 293, 283 LR7322B+LR7323B
4 BARI Mung 4 176 191 273, 264 150, 139 293, 283 LR7322B+LR7323A
5 BARI Mung 5 164 181, 175 282, 273 146, 135 293, 283 Not identified
6 BARI Mung 6 164 181, 175 282, 273 146, 135 293, 283 Not identified
7 Sonamug 176 195 273 152, 141 293, 283 LR7323A+LR7323B+GBSSRMB91
8 BD6874 .. 181, 175 .. 152 304 LR7323A+GBSSRMB91
9 BD6875 164 181, 175 .. 150, 139 .. LR7323A+GBSSRMB91+GBSSRMB77
10 BD6876 .. 195 273 146 .. LR7323A+LR7323B+GBSSRMB91
11 BD6877 164 195, 181 .. 150, 146 304, 293 LR7322B+LR7323A+GBSSRMB91
12 BD6878 164 181 282, 273 150, 139 304 LR7323B+GBSSRMB91
Journal of Plant Sciences 2016; 4(6): 153-164 162
Sl.
no. Genotypes Band position due to primers (bp)
Distingushing primer LR7322B LR7323A LR7323B GBssrMB-91 GBssrMB-77
13 BD6879 173, 164 191, 181 282, 273 150, 146 293, 283 Not identified
14 BD6880 164 181 282, 273 150, 139 304, 293 LR7323B+GBSSRMB91+GBSSRMB77
15 BD6881 173, 164 181 282, 273 150, 139 304, 293 LR7322B+LR7323A
16 BD6882 .. 181 .. 150, 139 .. LR7323A+GBSSRMB91
17 BD6884 176, 164 195, 181 .. .. .. LR7322B+LR7323A
18 BD6885 176, 164 195, 181 282, 273 152, 141 .. LR7323B+GBSSRMB91
19 BD6886 176, 164 195, 181 282, 273 150, 146 293, 283 LR7323A+GBSSRMB91
20 BD6887 176, 164 195 .. 152, 146 293 LR7322B+LR7323A
21 BD6888 176, 164 191, 181 .. 152, 146 293 LR7322B+LR7323A
22 BD6889 164 191, 181 282, 273 152, 146 293, 283 LR7323A+LR7323B+GBSSRMB91
23 BD6890 176 195, 181 282, 273 152, 146 293 LR7322B+LR7323A
24 BD6891 176, 164 195, 181 282, 273 152, 146 293, 283 Not identified
25 BD6892 176, 164 195, 181 282, 273 152, 146 293, 283 Not identified
26 BD6893 176 195, 175 .. 152, 146 293, 283 LR7322B+LR7323A
27 BD6894 176 195 282, 273 146, 135 293, 283 LR7323A+LR7323B+GBSSRMB91
28 BD6895 176 195 273 146, 135 .. LR7323A+LR7323B+GBSSRMB91
29 BD6896 .. 181 273, 264 146, 135 .. LR7323A+LR7323B
30 BD6897 173, 164 181 .. 152 .. LR7322B+LR7323A+GBSSRMB91
31 BD6898 173, 164 195 .. 152, 141 293, 283 LR7322B+LR7323A
32 BD6899 164, 160 181 282, 273 152, 146 304, 293 LR7322B
33 BD6900 173 195, 181 282, 273 152, 141 293, 283 LR7322B
34 BD6901 176, 164 195, 181 282, 273 146, 135 293, 283 LR7323A+LR7323B+GBSSRMB91
35 BD6902 164 181, 175 282, 273 152, 141 293 LR7323A+LR7323B+GBSSRMB91
36 BD6903 173, 164 191, 181 282, 273 152, 141 293, 283 Not identified
37 BD6904 .. 181 282, 273 152, 141 293 LR7323A+GBSSRMB91+GBSSRMB77
38 BD6905
176, 164 195, 181 282, 273 152, 141 293, 283 LR7323A+LR7323B+GBSSRMB91+GB
SSRMB77
39 BD6906 176 195 282, 273 150, 146 293, 283 LR7323A+LR7323B+GBSSRMB91
40 BD6907 164 181, 175 273, 264 150, 139 304, 293 LR7322B+LR7323A+LR7323B
41 BD6908 164 195, 181 282, 273 150, 139 293, 283 LR7323A+LR7323B+GBSSRMB91
42 BD6909
164 181 282, 273 150, 139 304, 293 LR7322B+LR7323A+LR7323B+GBSSR
MB91
Except BARI mung-5, BARI mung-6, BD6879, BD6891,
BD6892 and BD6903 other 36 genotypes showed unique and
differential DNA banding patterns across one and/or
combination of six primers. Since these cultivars also differ
for several morphological traits like as plant height, plant
growth habit, seed coat colour, smoothness and seed size it
seems unlikely that the observed level of similar banding
pattern is correct and more likely explanation is that the
original DNA samples were mislabeled or duplicated.
Amplification of a 152/141 bp band with GBssrMB-91
primer pair could distinguish BARI mung-2 while the
absence of this band and presence of a 164/160 bp band with
LR7322B could identify BD6899, besides presence of the
same band along with a 195 bp fragment amplified with
LR7323A and 273 bp with LR7323B, 282/273 bpwith
LR7323B, 181/175 bp with LR7323A and 282/273 bp with
LR7323B, 181bp with LR7323A and 195/181bp with
LR7323A could distinguish Sonamug, BD6885, BD8902,
BD6904 and BD6905 respectively. BD6900 showed a unique
DNA band of 173 bp for the primer LR7322B. Rest of the
genotypes were identified with the combination of more than
one locus where two primer combination for 14 genotypes,
three primer for 12 genotypes and four primer combination
were used to discriminate only two genotypes.
Discriminating locus along with their band size against each
genotype was mentioned in Table 6.
4. Conclusion
The set of microsatellite markers used here provides a
positive assessment to the ability of SSR marker to produce
unique DNA profiles of mungbean genotypes. The results of
the present study could be applied as baseline information to
maintain the appropriate identity and the construction of a
database of all mungbean cultivars and their wild relatives
grown in Bangladesh and in broad sense, to protect the plant
varieties of Bangladesh. Inter-mating cultivars from the
major distinct gene pools could provide new genetic
recombination to exploit in cultivar development programe.
Acknowledgement
This research presented here was supported by the
institution, Bangladesh Agricultural Research Council,
Farmgate, Dhaka for financial support of SPGR-NATP Phase
1 through the “Coordinated Sub-Project on Characterization
of Important Plant Genetic Resources: BARI Component”.
The technical suggestion provided by Dr. LutfurRahman,
163 Md. Rezwan Molla et al.: Genetic Diversity Analysis and DNA Fingerprinting of Mungbean (Vigna radiata L.)
Genotypes Using SSR Markers
Former Professor, Department of Genetics and Plant
Breeding, Bangladesh Agricultural University, Mymensingh,
is acknowledged with appreciation.
References
[1] BBS (Bangladesh Bureau of Statistics). 2008. Handbook of agricultural statistics, Ministry of Planning. Govt. People’s Republic of Bangladesh, Dhaka, p. 14.
[2] Mondal, M. M. A. 2007. A study of source-sink relationship in mungbean. Ph. D. Dissertation, Department of Crop Botany. Bangladesh Agricultural University, Mymensingh, p. 21.
[3] Sony SK, Habib MA, Islam MN. 2012. Genetic diversity analysis of thirteen mungbean (Vignaradiata (L.) Wilczek) cultivars using rapd markers. Bangladesh J Bot 41(2): 169-175.
[4] Karp A, Kresovichi S, Bhat KV, Ayad WG Hodgkin T. 1997. Molecular tools in plant genetic resourcs conservation: a guid to the technologies: IPGR technical bull. No. 2. International Genetic Resrouces Institute, Rome, Italy.
[5] Rahman L, Molla MR, Sultana S, Islam MN, Ahmed NU, Rahman MS, Nazim-ud-Dowla M, Shah-E-Alam M, Alam MS. 2006. Plant varieties of Bangladesh-morphological and molecular characterization for plant variety protection. Bangladesh J AgricSci, 33(2): 215-225.
[6] Soller M, Beckmann JS. 1983. Genetic polymorphism in varietal identification and genetic improvement. TheorAppl Genet, 67(1): 25-33.
[7] Williams JG, Kubelik AR, Livak KJ, Rafalski JA, Tingey SV. 1990. DNA polymorphisms amplified by arbitrary primers are useful as genetic markers. Nucleic Acids Res, 18(22): 6531-6535.
[8] Zietkiewicz E, Rafalshi A Labuda D. 1994. Genome fingerprinting by simple sequence repeat (SSR)- anchored polymerase chain reaction amplification. Genom, 20(2): 176-183.
[9] Becker J, Heun M. 1995. Barley microsatellites: allele variation and mapping. Plant MolBiol, 27(4): 835-845.
[10] Dikshit HK, Jhang T, Singh NK, Koundal KR, Bansal KC, Chandra N, Tickoo JL, Sharma TR. 2007. Genetic differentiation of Vigna species by RAPD, URP and SSR markers. Biol Plant 51(3): 451-457.
[11] Yoon MS, Lee J, Kim CY Baek HJ. 2007. Genetic relationships among cultivated and wild Vignaangularis (Willd.) OhwietOhashi and relatives from Korea based on AFLP markers. Genet Resour Crop Evol, 54(4): 875-883.
[12] Kaga A, Yoon MS, Tomooka N, Vaughan DA. 2000. Collection of Vigna spp. and other legumes from the islands of southern Okinawa prefecture, Japan. In: Report to IPGRI and East Asia Plant Genetic Resources Coordinators. National Institute of Agrobiological Resources, Japan, pp. 2-25.
[13] Ajibade SR, Weeden NF, Chite SM. 2000. Inter simple sequence repeat analysis of genetic relationships in the genus Vigna. Euphytica, 111 (1): 47-55.
[14] Mailer RJ, Scarth R, Fristensky B. 1994. Discrimination among cultivars of rapeseed (Brassica napusL.) using DNA polymorphism amplified from arbitrary primers.
TheorApplGenet, 87(6): 697-704.
[15] Marshall P, Marchand MC, Lisieczko Z, Landry BS. 1994. A simple method to estimate the percentage of hybridity in canola (Brassica napus) F1 hybrids. TheorAppl Genet, 89(7-8): 853-858.
[16] Bligh HFJ, Blackhall NW Edwards KJ, McClung AM. 1999. Using amplified fragment length polymorphisms and simple sequence length polymorphisms to identify cultivars of brown and white milled rice. Crop Sci, 39(6): 1715-1721.
[17] Powell W, Machray GC, Provan J. 1996. Polymorphism revealed by simplesequence repeats. Trends Plant Sci, 1(7): 215-222.
[18] Lagercrantz U, Ellegren H, Andersson L. 1993. The abundance of various polymorphic microsatellite motifs differs between plants and vertebrates. Nucleic Acids Res,21(5): 1111-1115.
[19] Wu KS, Tanksley SD. 1993. Abundance, polymorphism and genetic mapping of microsatellites in rice. Mol Gen Genet MGG, 241(1-2): 225-235.
[20] Islam MN, Molla MR, Rahman L. 2007. Microsatellite allele size profiling to identify and distinguish soybean cultivars in Bangladesh. ProgAgric, 18(1): 9-17.
[21] Molla MR, Islam MN, Rahman L. 2007. DNA fingerprinting of maize (Zea mays linn.) cultivars of Bangladesh using SSR markers. Bangladesh J Crop Sci, 18(1): 63-72.
[22] Rahman L, Islam MN, Rahman MS, Islam MS. 2008. Plant varieties of Bangladesh: morphological and molecular characterization. Published by Seed Wing, Ministry of Agriculture, Government of the People’s Republic of Bangladesh, Vol. 2, p. 300.
[23] Bhuyan SI, Hossain MS, Islam MM, Begum SN, Urbi Z, Hossain MS. 2014. Molecular assessment of genetic diversity and relationship in selected mungbeangermplasm. Biotec, 13(3): 126-134.
[24] Saghai-Maroof MA, Soliman KM, Jonsensan RA, Allard RW. 1984. Ribosomal spacer length polymorphism in barley: mendelian inheritance, chromosomal location and population dynamics. ProcNatlAcadSci, USA, 81: 8014-8018.
[25] Rahman, L, Molla MR, Sultana S, Islam MN, Ahmed NU, Rahman MS, Nazim-ud-Dowla M. 2007. Plant varieties of Bangladesh: morphological and molecular characterization. Published by Seed Wing, Ministry of Agriculture, Government of the People’s Republic of Bangladesh, Vol. 1, p. 486.
[26] Nash JHE. 1991. DNA frag, Version 3.03. Institute for biological sciences, National Research Council of Canada, Ottawa, Ontario, Canada.
[27] Nei M. 1972. Genetic distance between populations. Am Nat, 106(949):283-292.
[28] Yeh FC, Yang RC, Boyle T. 1999. POPGENE version 1.32, Microsoft window-base software for population genetic analysis, a quick user’s guide. University of Alberta. Center for International Forestry Research, Alberta, Canada.
[29] Kumar SV, Tan SG, Quah SC, Yusoff K. 2002. Isolation of microsatellite markers in mungbean, Vignaradiata. MolEcol Notes, 2(2): 96-98.

Journal of Plant Sciences 2016; 4(6): 153-164 164
[30] Gwag, JG, Chung JW, Chung HK, Lee JH, Ma KH, Dixit A, Park YJ, Cho EG, Kim TS, Lee SH. 2006. Characterization of new microsatellite markers in mungbean, Vignaradiata (L.). MolEcol Notes, 6(4): 1132-1134.
[31] Cao T, Duprez E, Borden KL, Freemont PS, Etkin LD. 1998. Ret finger protein is a normal component of PML nuclear bodies and interacts directly with PML. J Cell Sci, 111(10): 1319-1329.
[32] Vos P, Hogers R, Bleeker M, Reijans M, Van de Lee T, Hornes M, Friters A, Pot J, Paleman J, Kuiper M, Zabeau M. 1995. AFLP: a new technique for DNA fingerprinting. Nucleic Acids Res, 23(21): 4407- 4414.
[33] Yu SB, Xu WJ, Vijayakumar CHM, Ali J, Fu BY, Xu JL, Jiang YZ, Marghirang R, Domingo J, Aquino C, Virmani SS. 2003.
Molecular diversity and multilocus organization of the parental lines used in the International Rice Molecular Breeding Program. TheorAppl Genet, 108 (1): 131-140.
[34] Nei M. 1973. Analysis of gene diversity in subdivided populations. ProcNatlAcadSci, USA 70(12): 3321-3323.
[35] Levene H. 1949. On a matching problem arising in genetics. Ann Math Stat, 20(1): 91-94.
[36] Song QJ, Quiley CV, Nelson RL, Carter TE, Boema HR, Strachan JL, Cregan PB. 1999. A selected set of trinucleotide simple sequence repeat markers for soybean cultivar identification. Pl vari seeds, 12:207-220.