Improving understanding of microclimate heterogeneity...
12
Journal of Plant Sciences 2014; 2(5): 167-178 Published online September 30, 2014 (http://www.sciencepublishinggroup.com/j/jps) doi: 10.11648/j.jps.20140205.14 ISSN: 2331-0723 (Print); ISSN: 2331-0731 (Online) Improving understanding of microclimate heterogeneity within a contemporary plant growth facility to advance climate control and plant productivity Evan Kutta 1 , Jason Hubbart 2, * 1 Department of Forestry, School of Natural Resources, University of Missouri, Columbia, USA 2 Department of Forestry, Water Resources Program, School of Natural Resources, University of Missouri, Columbia, USA Email address: [email protected] (E. Kutta), [email protected] (J. Hubbart) To cite this article: Evan Kutta, Jason Hubbart. Improving Understanding of Microclimate Heterogeneity within a Contemporary Plant Growth Facility to Advance Climate Control and Plant Productivity. Journal of Plant Sciences. Vol. 2, No. 5, 2014, pp. 167-178. doi: 10.11648/j.jps.20140205.14 Abstract: Greenhouse crop production is maximized by maintaining optimal growing conditions. Accurate management of climate conditioning equipment based on measurements of the internal greenhouse microclimate is necessary to optimize crop production. Traditionally, greenhouse microclimate is monitored by a single suite of sensors located at a fixed (often central) location that is considered representative of the entire greenhouse climate. To advance greenhouse crop production additional sensors may better represent greenhouse microclimate heterogeneity and improve performance of climate conditioning equipment. However, elucidating the proper number and distribution of additional sensors requires investigation. Distributed high resolution air temperature (n = 63), relative humidity (n=63), and incoming solar radiation data were collected between May 9 th , 2012 and September 5 th , 2012 to test the efficacy of conventional centrally located sensors to characterize the spatial and temporal climate variability inside three contemporary greenhouse facilities. Results indicate substantial microclimate heterogeneity with mean horizontal temperature gradients of as much as 5.0°C/m, and mean horizontal VPD gradients of 1.5 kPa/m. Most substantially, the maximum vertical temperature gradient was 11.65°C/m. Results indicate that as few as five properly deployed sensor assemblages (e.g. temperature, humidity, solar radiation) may be necessary to more accurately monitor horizontal and vertical microclimate heterogeneity in a typical greenhouse room. This would improve climate conditioning accuracy and improve the homogeneity of the internal greenhouse climate, which may result in increased productivity and profits for greenhouse managers. Keywords: Horticulture, Plant Productivity, Greenhouse Climate Control, Microclimate Heterogeneity 1. Introduction Controlled environment agriculture serves an important role in the global production of fresh produce [1]. This is because controlled environment production methods often create longer cropping periods and resource homogeneity (i.e. water, temperature, light, etc), and increased yield relative to field-grown produce. Many contemporary greenhouse facilities use adaptive climate control technologies to optimize environmental conditions for plant growth [2]. Greenhouse-grown produce are also theoretically protected from harsh environmental conditions, thereby potentially maintaining higher nutritional quality and aesthetic appeal and increased market value relative to field-grown products [1]. The combination of increased yield, quality, and a longer production season often justifies operational costs associated with greenhouse production [3]. However, unlike heating, for which technology is relatively well established, greenhouse cooling frequently presents considerable technological challenges [4]. For example, while too little sunlight can require artificial greenhouse lighting and heating, too much sunlight can result in too much heat for optimal greenhouse production, especially during hot external conditions [5]. Sethi et al. (2007) [4] showed that evaporative cooling is the most effective means of greenhouse cooling in regions where ambient temperatures approach 40°C annually. However, evaporative cooling can lead to heterogeneous distribution of temperature with horizontal gradients up to 0.13°C/m [6] and vertical temperature gradients up to 6.7°C/m [7]. Temperature and relative humidity are two of the most
Transcript of Improving understanding of microclimate heterogeneity...

Journal of Plant Sciences 2014; 2(5): 167-178
Published online September 30, 2014 (http://www.sciencepublishinggroup.com/j/jps)
doi: 10.11648/j.jps.20140205.14
ISSN: 2331-0723 (Print); ISSN: 2331-0731 (Online)
Improving understanding of microclimate heterogeneity within a contemporary plant growth facility to advance climate control and plant productivity
Evan Kutta1, Jason Hubbart
2, *
1Department of Forestry, School of Natural Resources, University of Missouri, Columbia, USA 2Department of Forestry, Water Resources Program, School of Natural Resources, University of Missouri, Columbia, USA
Email address: [email protected] (E. Kutta), [email protected] (J. Hubbart)
To cite this article: Evan Kutta, Jason Hubbart. Improving Understanding of Microclimate Heterogeneity within a Contemporary Plant Growth Facility to
Advance Climate Control and Plant Productivity. Journal of Plant Sciences. Vol. 2, No. 5, 2014, pp. 167-178.
doi: 10.11648/j.jps.20140205.14
Abstract: Greenhouse crop production is maximized by maintaining optimal growing conditions. Accurate management of
climate conditioning equipment based on measurements of the internal greenhouse microclimate is necessary to optimize crop
production. Traditionally, greenhouse microclimate is monitored by a single suite of sensors located at a fixed (often central)
location that is considered representative of the entire greenhouse climate. To advance greenhouse crop production additional
sensors may better represent greenhouse microclimate heterogeneity and improve performance of climate conditioning
equipment. However, elucidating the proper number and distribution of additional sensors requires investigation. Distributed
high resolution air temperature (n = 63), relative humidity (n=63), and incoming solar radiation data were collected between May
9th
, 2012 and September 5th
, 2012 to test the efficacy of conventional centrally located sensors to characterize the spatial and
temporal climate variability inside three contemporary greenhouse facilities. Results indicate substantial microclimate
heterogeneity with mean horizontal temperature gradients of as much as 5.0°C/m, and mean horizontal VPD gradients of 1.5
kPa/m. Most substantially, the maximum vertical temperature gradient was 11.65°C/m. Results indicate that as few as five
properly deployed sensor assemblages (e.g. temperature, humidity, solar radiation) may be necessary to more accurately monitor
horizontal and vertical microclimate heterogeneity in a typical greenhouse room. This would improve climate conditioning
accuracy and improve the homogeneity of the internal greenhouse climate, which may result in increased productivity and profits
for greenhouse managers.
Keywords: Horticulture, Plant Productivity, Greenhouse Climate Control, Microclimate Heterogeneity
1. Introduction
Controlled environment agriculture serves an important
role in the global production of fresh produce [1]. This is
because controlled environment production methods often
create longer cropping periods and resource homogeneity (i.e.
water, temperature, light, etc), and increased yield relative to
field-grown produce. Many contemporary greenhouse
facilities use adaptive climate control technologies to optimize
environmental conditions for plant growth [2].
Greenhouse-grown produce are also theoretically protected
from harsh environmental conditions, thereby potentially
maintaining higher nutritional quality and aesthetic appeal and
increased market value relative to field-grown products [1].
The combination of increased yield, quality, and a longer
production season often justifies operational costs associated
with greenhouse production [3]. However, unlike heating, for
which technology is relatively well established, greenhouse
cooling frequently presents considerable technological
challenges [4]. For example, while too little sunlight can
require artificial greenhouse lighting and heating, too much
sunlight can result in too much heat for optimal greenhouse
production, especially during hot external conditions [5].
Sethi et al. (2007) [4] showed that evaporative cooling is the
most effective means of greenhouse cooling in regions where
ambient temperatures approach 40°C annually. However,
evaporative cooling can lead to heterogeneous distribution of
temperature with horizontal gradients up to 0.13°C/m [6] and
vertical temperature gradients up to 6.7°C/m [7].
Temperature and relative humidity are two of the most
168 Evan Kutta and Jason Hubbart: Improving Understanding of Microclimate Heterogeneity within a Contemporary Plant
Growth Facility to Advance Climate Control and Plant Productivity
important climate variables in a greenhouse. Temperature
directly affects the rate of chemical reactions in plants [1] and
temperature and relative humidity directly affects the
concentration gradient driving leaf water vapor diffusion [8].
Sethi et al. (2007) [4] showed that a pad-fan evaporative
cooling system lowered greenhouse air temperature between
4-6°C and up to 12°C if used with shading. Van Pec and
Berckmans (1999) [9] showed that greenhouse air temperature
gradients variably influenced leaf temperature resulting in
heterogeneous rates of photosynthesis and transpiration.
Spatial variation of relative humidity within a greenhouse was
noted in multiple previous studies but not assessed ([6]; [10]).
Maintaining vapor pressure deficit (VPD) values between 0.2
and 1.0 kPa was shown to have little effect on the growth and
development of crops [11]. However, maximum transpiration
rates for well-watered rose [12], maize [13], sorghum ([14];
[15]), and soybean [16] crops have been identified at VPD
values between 1.6 and 2.7 kPa. VPD values above ~2.0 kPa
was shown to limit production for a variety of crops due to the
shared path between carbon and water exchange between the
leaf and the atmosphere [13].
Despite the potential for uneven distribution of temperature
and relative humidity throughout a greenhouse it is common
practice to install a single sensor assemblage (i.e. temperature
and humidity) at a fixed point assumed representative of an
entire greenhouse room [2]. This is the popular approach since
additional sensors require additional power and infrastructure,
which increases the complexity and expense associated with
the climate controller’s software, equipment, and maintenance
[2]. Given the aforementioned issues and meteorological
complexities, studies using an array of distributed sensors to
quantitatively characterize environmental heterogeneity in
contemporary greenhouse environments could provide
critically needed information to greenhouse managers wishing
to improve current climate management practices to increase
crop profitability.
The overall objective of the following study was to
quantitatively characterize temporal and spatial variability of
greenhouse temperature, relative humidity and incoming solar
radiation during the summer of 2012 (5/9 – 9/5) in a
contemporary plant growth facility. Sub-objectives included, a)
compare a standard centralized climate monitoring sensor to
the corresponding instantaneous average of an array of sensors
distributed evenly throughout a greenhouse room, b) quantify
spatial variability in vapor pressure deficit as a proxy for plant
transpiration, and c) provide recommendations to greenhouse
managers about how to improve climate sensing accuracy to
improve contemporary greenhouse climate control systems.
2. Materials and Methods
2.1. Greenhouse Facility
The greenhouse facility used in the current work was
located in Columbia, Missouri on the University of Missouri
(MU) campus (38°95’ latitude and 92°32’ longitude at an
altitude of 237m above sea level). The Sears Plant Growth
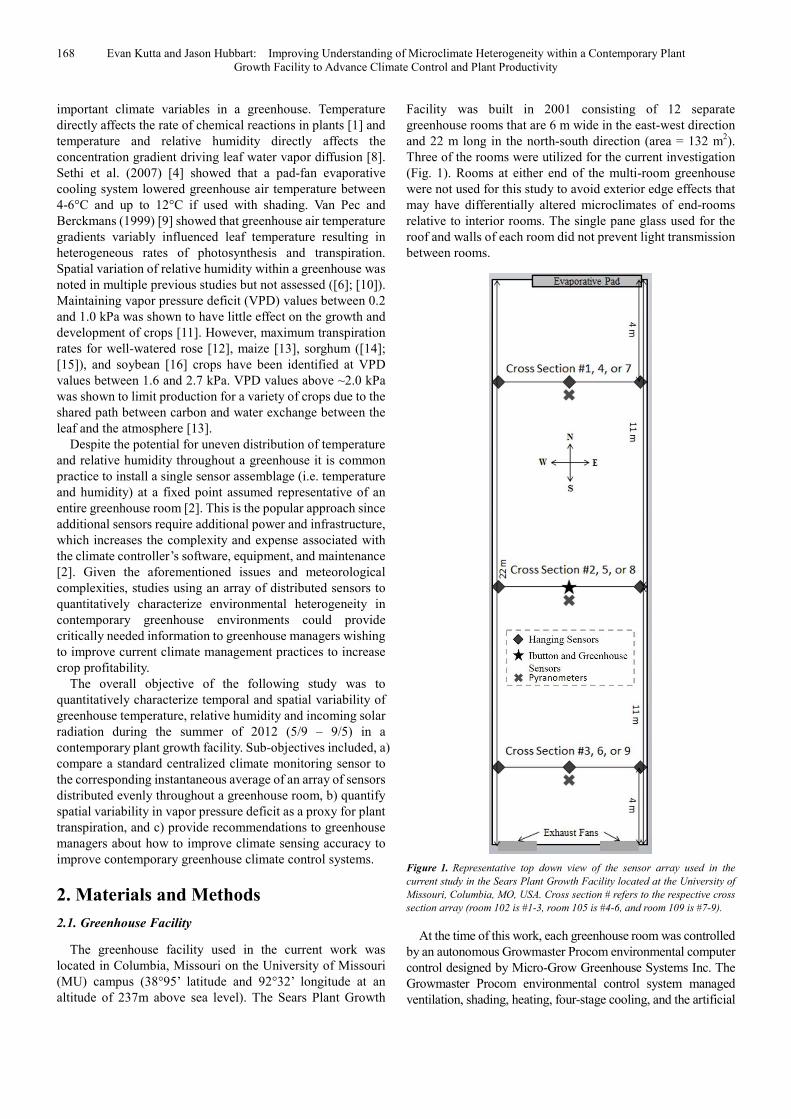
Facility was built in 2001 consisting of 12 separate
greenhouse rooms that are 6 m wide in the east-west direction
and 22 m long in the north-south direction (area = 132 m2).
Three of the rooms were utilized for the current investigation
(Fig. 1). Rooms at either end of the multi-room greenhouse
were not used for this study to avoid exterior edge effects that
may have differentially altered microclimates of end-rooms
relative to interior rooms. The single pane glass used for the
roof and walls of each room did not prevent light transmission
between rooms.
Figure 1. Representative top down view of the sensor array used in the
current study in the Sears Plant Growth Facility located at the University of
Missouri, Columbia, MO, USA. Cross section # refers to the respective cross
section array (room 102 is #1-3, room 105 is #4-6, and room 109 is #7-9).
At the time of this work, each greenhouse room was controlled
by an autonomous Growmaster Procom environmental computer
control designed by Micro-Grow Greenhouse Systems Inc. The
Growmaster Procom environmental control system managed
ventilation, shading, heating, four-stage cooling, and the artificial

Journal of Plant Sciences 2014; 2(5): 167-178 169
lighting system of each room.
The active cooling system had four stages of cooling; where
each stage was separated by 1.11°C with the final stage
utilizing evaporative cooling. Each room’s climate control
system had different optimal day and night temperatures based
on the crop being grown in that room (Table 1). Optimal
conditions were maintained through the ON/OFF
manipulation of climate conditioning equipment based on
climate control action temperatures (Table 1). Rooms 102, 105,
and 109 were chosen for this study to determine whether or
not maize (109) or soybean (105) presence and morphology
(i.e. plant height) influenced microclimate heterogeneity
relative to an empty (102) greenhouse room. It was not the
intent to directly quantify plant physiological response to
altered greenhouse microclimate in the current work. The
climate control was shut off in rooms 102, 109, and 105 for
sterilization on 6/29/12, 8/7/12, and 8/29/12 respectively to
allow each greenhouse room to warm to temperatures hot
enough to exterminate pests or pathogens.
Table 1. Climate Control objectives and action temperature for each greenhouse room studied at the Sears Plant Growth Facility located at the University of
Missouri, Columbia, MO, USA. (*) indicates night time action temperature).
Room Crop Objective Climate Control Action Temperature
ODT ONT Heating RV AC DSC
102 Empty 22.00 22.00 17.78 20.00 21.67 25.56
105 Soybean 29.00 24.00 23.89 26.67 29.44 32.22
109 Corn 25.00 20.00 21.67, 20.00* 23.89, 22.22* 26.11, 24.44* 43.33
ODT = Optimal Daytime Temperature, ONT = Optimal Nighttime Temperature, RV = Ridge Vent, AC = Active Cooling, DSC = Draw Shade Curtain.
2.2. Equipment and Instrumentation
Standard greenhouse equipment included one centrally
located aspirated temperature and relative humidity sensor
hereafter referred to as internal system sensors. Incoming
solar radiation data were collected using an externally
mounted pyranometer recording data in lux, hereafter referred
to as an external system sensor. For the current research, each
room was equipped with 21 iButton hygrochrons (Dallas
Maxim Inc.; [17]) with radiation shields [18] (total sample
size = 63) and three Apogee pyranometers (total sample size =
9) (Decagon Devices Inc.). Pyranometers sensed incoming
shortwave radiation at hourly intervals, on the hour. Apogee
pyranometers have a 180° field of view and an accuracy of +/-
5% between 0 and 1750 W/m2. IButton temperature (Ta)
relative humidity (Rh) sensors were programmed to record
data at hourly intervals, on the hour. IButton sensors have
temperature accuracy of +/- 0.5°C and are inexpensive and
durable sensors that are well suited for obtaining accurate
spatially distributed climate data ([17]. Hygrochron iButton
sensors were used to observe the distribution of temperature
and relative humidity and were deployed in a manner to obtain
three cross section arrays throughout each room at distances of
4, 11, and 18 meters from the evaporative pads (Fig. 1).
Each cross section array consisted of three sensor hangers
with one hanger approximately 25 cm from each wall and the
third hanging in the center of the room. Hangers near either
wall had hygrochron iButtons placed at 1 and 3 m above the
floor, while the central hanger was equipped with iButtons
installed 1, 2, and 3 m above the floor. Internal pyranometers
were attached to each of the central hangers at 1 m above the
floor or approximately bench height. Hygrochron iButton and
pyranometer sensors recorded hourly data between 5/9/12 and
9/5/12. The Growmaster Procom controller relies solely on
one centrally located, bench-height fan-aspirated temperature
and relative humidity sensor to monitor environmental
conditions and trigger heating or cooling when set points were
reached (Table 1). External climate variables including
temperature, relative humidity, incoming solar radiation, and
wind speed and direction were recorded on the roof of the
greenhouse and at Sanborn Field, a climate monitoring station
maintained by University of Missouri Extension located 0.36
km southeast of the Sears Plant Growth Facility.
The external climate during the study was analyzed to
assess the impacts of external conditions on climate control
accuracy and internal greenhouse climate. The average
internal climate for each room was compared to the average
ambient external climate. Room averages were compared to
assess whether different climate control action temperatures
and crops influenced microclimate heterogeneity. Horizontal
distribution of temperature and relative humidity were
estimated to characterize the magnitude of horizontal climate
heterogeneity. Finally, the vertical distribution of temperature
and relative humidity were estimated to assess the magnitude
of vertical climate heterogeneity.
Ambient temperature (Ta), relative humidity (Rh), and
shortwave radiation data were statistically compared within
and between rooms using one-way repeated measures analysis
of variance (ANOVA) at hourly, daily, weekly, and monthly
time steps (p ≤ 0.05) ([7], [19], [20], [21], [22]). One-way
ANOVA was followed with Tukey’s post hoc
multiple-comparison test (where appropriate) to compare the
different locations in each room and temperature, relative
humidity, and incoming solar radiation in all possible
combinations [22]. Vapor pressure deficit (VPD) was
calculated as a proxy to assess potential transpiration demand
of crops at various locations in each room. The empirical
Teten’s formula [23] was used to calculate saturation vapor
pressure (es) in kPa where T is the observed ambient
temperature in degrees Celsius (ºC):
(17.502 )
( 240.97)( ) 0.611T
T
se T e×
+= (1)
To estimate actual vapor pressure (ea) the saturation vapor
pressure must be multiplied by relative humidity (hr).

170 Evan Kutta and Jason Hubbart: Improving Understanding of Microclimate Heterogeneity within a Contemporary Plant
Growth Facility to Advance Climate Control and Plant Productivity
ea = hr x es(Ta) (2)
To estimate the VPD (kPa) the actual vapor pressure is
subtracted from the saturation vapor pressure [24].
VPD = es(Ta) - ea (3)
The ambient lapse rate was calculated by the change (d) of
temperature (dT) with respect to change in height (dz). Where
dT is the upper temperature (Tu) minus the lower temperature
(Tl) and dz is the upper height (zu) minus the lower height (zl).
1
1
u
u
T TdTLR
dz z z
−= =−
(4)
Erroneous or missing data were replaced with
mathematically modeled values. Data gaps less than three
hours in length were filled by interpolation (i.e. 3-point spline)
[25]. Large data gaps exceeding three hours in length were
caused by sensor failure and were filled by calculating values
based on linear regression models created from data from one
of the nearby sensors located in the same room at the same
height for the ten days preceding and the ten days following
the data gap (R2 values < 0.97).
3. Results
3.1. Climate during Study
Climate during the study (5/9/12 to 9/5/12) was
characterized by extreme (D3) to exceptional (D4) drought
(USDM Drought Severity Classification; [26] accompanied
by above average temperatures. Using the local Columbia
Regional Airport’s 123 year climate record the June-August
period in 2012 ranked as the 9th
driest on record with only
5.84” of precipitation. This period was the 6th
hottest on
record with average temperature of 26.83°C. During this
period a high temperature of at least 32.2°C was reported for
66 of the 92 days. This was the 3rd
greatest number of
occurrences of such high temperatures in the time-period on
record. There is therefore great value in the current work in
that climate conditions provided a worst case scenario for
drought conditions and greenhouse management.
3.2. External versus Internal Climate
At the Sanborn Field climate station the average
temperature, relative humidity, and incoming solar radiation
was 25.9°C, 53.5%, and 259.3 W/m2 respectively from 5/9/12
to 9/5/12 (Table 2). Averaging data collected by the centrally
located greenhouse sensors located at bench height in all 3
rooms (Fig. 1) yielded a study average temperature and
relative humidity of 28.8°C and 51.3% respectively.
Averaging all data collected by iButton sensors that were
evenly distributed throughout each greenhouse room (Fig. 1, n
= 21/room) yielded a study average temperature and relative
humidity of 32.5°C and 45.7% respectively. Standard
deviation of study averaged temperature data was 6.25°C,
4.58°C, and 5.96°C for iButton sensors, centrally located
greenhouse, and Sanborn Field data, respectively. Therefore
the spatially distributed iButton sensors detected greater
internal temperature variability relative to external conditions
over the period of study, which was not detected by the
centrally located greenhouse sensors. Standard deviation of
study averaged relative humidity data were 14.84%, 13.06%,
and 19.01% for spatially distributed iButton, centrally located
greenhouse, and Sanborn Field data respectively. Internal
relative humidity was less variable than external conditions,
but averages of both spatially distributed iButton and centrally
located greenhouse sensors indicated lower internal RH
values than external conditions. Therefore, plants in
greenhouse rooms were consistently exposed to warmer and
drier conditions than plants located at Sanborn Field.
Comparing incoming solar radiation data between the
externally mounted greenhouse sensor and either Sanborn
Field or internal study pyranometers was not possible due to
incompatible units of measurement (English lux to metric
W/m2). Average incoming solar radiation values were 82.5
W/m2, 30.5 lux, and 259.3 W/m
2 for spatially distributed
internal pyranometers, the externally-mounted greenhouse
sensor, and the nearby Sanborn Field sensor respectively.
Standard deviation was 97.5 W/m2, 36.6 lux, and 320.2 W/m
2
for spatially distributed pyranometers, externally mounted
greenhouse, and Sanborn Field sensors respectively.
Statistical analyses of spatially distributed iButton, centrally
located greenhouse, and Sanborn Field data sets indicated
significant differences (P < 0.001, CI = 0.05) between
spatially distributed iButtons, centrally located greenhouse,
and external Sanborn Field sensors for temperature, relative
humidity, and incoming solar radiation data.
Table 2. Descriptive statistics of air temperature (°C), relative humidity (%),
and incoming solar radiation (lux or W/m2) data comparing centrally
located greenhouse, iButton, and Sanborn Field sensors deployed at the
Sears Plant Growth Facility located at the University of Missouri, Columbia,
MO, USA.
Variable Statistic iButton Greenhouse Sanborn Field
Ta (°C)
Mean 32.53 28.77 25.94
Min 21.81 20.49 9.00
Max 51.91 47.41 39.50
Std Dev 6.25 4.58 5.96
RH (%)
Mean 45.67 51.30 53.52
Min 9.72 13.56 16.00
Max 86.63 87.56 96.00
Std Dev 14.84 13.06 19.01
Solar Radiation
Lux (*) or
W/m2
Mean 82.54 30.45* 259.33
Min 0.00 0.00* 0.00
Max 510.25 119.64* 1001.00
Std Dev 97.57 36.63* 320.21
Ta = ambient temperature (°C), RH = relative humidity (%), ISR = incoming
solar radiation (lux [*] or W/m2)
3.3. Climate Comparison between Rooms
Each greenhouse room had different climate control
objectives between 5/9/12 and 9/5/12 (Table 1) and different
climate control shut-off dates. The average of desired day and

Journal of Plant Sciences 2014; 2(5): 167-178 171
night temperature objectives were 22.0, 26.5, and 22.5°C for
rooms 102, 105, and 109 respectively. Room average
temperatures (Table 3) recorded by centrally located
greenhouse sensors between 5/9/12 and 9/5/12 were 29.6, 28.6,
and 28.1°C for rooms 102, 105, and 109 respectively. Room
average temperatures recorded by spatially distributed iButton
sensors between 5/9/12 and 9/5/12 were 32.0, 33.0, and 32.4°C
for rooms 102, 105, and 109 respectively. The permanent
centrally located greenhouse sensors provided study average
relative humidity values of 50.8, 47.9, and 55.1% for rooms 102,
105, and 109 respectively. Spatially distributed iButton sensors
provided study average relative humidity values of 45.8, 44.0,
and 47.2% for rooms 102, 105, and 109 respectively.
Statistically significant differences (P values < 0.028) were
calculated between centrally located greenhouse and spatially
distributed temperature data sets except between iButton data
collected in rooms 102 and room 109 (P value = 0.938).
Statistically significant differences (P < 0.001) were detected
between all centrally located greenhouse and spatially
distributed iButton sensor relative humidity data sets except
between centrally located greenhouse and centrally located
iButton relative humidity data collected in room 102 (P = 0.268)
and room 105 (P = 0.115). However, relative humidity data sets
were significantly different (P < 0.05) between greenhouse
rooms (i.e. room 102 compared to room 109).
Table 3. Descriptive statistics of air temperature (°C), relative humidity (%), and incoming solar radiation (W/m2) data collected by centrally located (left) and
spatially distributed sensors (right) deployed at the Sears Plant Growth Facility located at the University of Missouri, Columbia, MO, USA.
Variable Statistic Centrally Located Greenhouse Sensors Spatially Disributed iButton Sensors
Room 102 Room 105 Room 109 Room 102 Room 105 Room 109
Ta (°C)
Mean 29.57 28.56 28.07 32.00 32.96 32.35
Min 18.33 21.94 20.65 18.84 22.15 20.74
Max 48.89 46.11 48.89 56.97 48.46 58.07
Std Dev 7.79 2.85 4.42 8.18 4.96 6.65
RH (%)
Mean 50.79 47.87 55.05 45.83 44.02 47.16
Min 12.00 14.00 12.00 5.73 12.75 6.55
Max 95.83 85.00 91.67 90.71 86.50 90.66
Std Dev 19.25 11.12 15.42 19.08 13.51 16.39
Centrally Located Pyranometer Spatially Distributed Pyranometers
ISR (lux [*] or
W/m2)
Mean 30.35* 30.38* 30.30* 52.86 71.51 122.73
Min 0.00* 0.00* 0.00* 0.00 0.00 0.00
Max 120.00* 119.67* 119.60* 220.95 690.92 711.06
Std Dev 36.56* 36.59* 36.51* 64.62 90.43 149.61
Ta = ambient temperature, RH = relative humidity, ISR = incoming solar radiation (lux [*] or W/m2)
3.4. Climate within Rooms
Average temperatures recorded by centrally located
greenhouse sensors were 23.5, 28.4 and 27.1°C for rooms 102,
105, and 109 respectively (Table 4). Average temperatures
recorded by spatially distributed iButton sensors were 23.4,
31.6, and 29.1°C for rooms 102, 105, and 109 respectively.
The greatest difference between average temperatures and
desired optimal temperatures while the climate control system
was ON was in room 105, where on average, the centrally
located greenhouse sensor was 1.9°C (7.1%) warmer and the
centrally located iButton sensor was 5.1°C (19.2%) warmer
than the desired optimal temperature of 26.5°C (Table 1).
Average VPD values were estimated to be 2.0 and 2.6 kPa at
centrally located greenhouse and iButton sensors. Those
values were at or above the 2.0 kPa threshold for stomatal
closure identified for soybeans by [16].
Table 4. Descriptive statistics of temperature (°C), relative humidity (%), and calculated vapor pressure deficit (kPa) using centrally located iButton
temperature and relative humidity and greenhouse sensors while the climate control system was ON at the Sears Plant Growth Facility located at the
University of Missouri, Columbia, MO, USA.
Statistic Central Greenhouse Sensors Central iButton Sensors
102 105 109 #2a #5a #8a
Ta (°C)
Mean 23.51 28.40 27.14 23.41 31.62 29.08
Min 18.33 21.94 20.65 19.04 22.15 20.85
Max 31.11 40.65 33.98 40.39 45.53 40.45
Std Dev 2.68 2.43 2.71 2.38 3.69 3.90
RH (%)
Mean 64.14 47.60 58.48 66.95 46.44 56.56
Min 33.33 20.67 25.83 19.15 15.82 18.22
Max 95.83 82.00 86.00 92.32 83.76 86.82
Std Dev 12.37 10.27 11.52 13.15 11.64 12.88
VPD (kPa)
Mean 1.03 2.04 1.32 0.95 2.61 1.59
Min 0.11 0.57 0.46 0.23 0.56 0.45
Max 1.87 6.00 2.71 6.04 8.05 5.27
Std Dev 0.37 0.58 0.57 0.45 1.02 0.88
Ta = Ambient Temperature, RH = Relative Humidity, VPD = Vapor Pressure Deficit

172 Evan Kutta and Jason Hubbart: Improving Understanding of Microclimate Heterogeneity within a Contemporary Plant
Growth Facility to Advance Climate Control and Plant Productivity
Absolute maximum VPD values were 6.0 and 8.1 kPa for
centrally located greenhouse and iButton sensors respectively,
which were 4.0 (200%) or 6.1 kPa (305%) greater than the 2.0
kPa threshold identified by [16]. Statistically significant
differences (P < 0.001, CI = 0.05) were shown between
temperature data collected by each set of centrally located
iButton and greenhouse sensors. Statistically significant
differences (P < 0.001, CI = 0.05) were detected between
relative humidity data collected by each set of centrally
located iButton (naturally-aspirated) and greenhouse sensors
(fan-aspirated). Therefore, despite being located less than 1m
apart the difference in aspiration can still be significant. This
observation is consistent with the results of [18]. Statistically
significant differences (P < 0.001, CI = 0.05) were shown
between VPD calculations made from data collected by the
centrally located iButton and greenhouse sensors except in
room 102 (P = 0.093).
Table 5 presents descriptive statistics for cross section
averages of temperature, relative humidity, and incoming solar
radiation data collected by spatially distributed iButton
sensors and pyranometers while the climate control system
was ON in each room. Each room contained three cross
sections (102 = CS 1 to 3, 105 = CS 4 to 6, and 109 = CS 7 to 9;
Fig. 1). Cross section averages in room 102 of temperature
data were 27.05, 27.46, and 27.6°C with average relative
humidity values of 58.06, 54.97, and 54.67 % for cross
sections 1, 2, and 3 respectively. The cross section averages in
room 105 of temperature data were 31.63, 33.67, and 33.65°C
with average relative humidity values of 46.8, 42.01, and
41.35 % for cross sections 4, 5, and 6 respectively. Cross
section averages in room 109 of temperature data were 31.06,
32.94, and 32.58°C with average relative humidity values of
51.83, 47.4, and 47.28 % for cross sections 7, 8, and 9
respectively (Table 1).
Table 5. Descriptive statistics of air temperature (°C), relative humidity (%), and incoming solar radiation (W/m2) collected by iButton and pyranometer
sensors while the climate control was ON located at the Sears Plant Growth Facility located at the University of Missouri, Columbia, MO, USA.
Statistic Room 102 Room 105 Room 109
CS #1 CS #2 CS #3 CS #4 CS #5 CS #6 CS #7 CS #8 CS #9
Ta (°C)
Mean 27.05 27.46 27.60 31.63 33.67 33.65 31.06 32.94 32.58
Min 18.82 18.86 18.70 22.17 22.08 22.13 20.65 20.94 20.64
Max 44.50 44.31 44.11 42.09 46.66 50.18 43.86 47.68 47.20
Std Dev 5.23 5.55 5.68 3.71 5.51 5.50 5.68 6.70 6.26
RH (%)
Mean 58.06 54.97 54.67 46.80 42.01 41.35 51.83 47.40 47.28
Min 17.32 16.69 17.37 15.66 11.61 9.67 19.75 15.47 15.44
Max 91.47 90.41 89.91 84.84 83.60 83.35 88.42 83.81 83.47
Std Dev 13.25 14.46 14.72 11.87 13.36 13.40 13.06 14.63 14.13
ISR (W/m2)
Mean 59.81 64.40 59.18 55.89 68.04 96.37 158.19 120.10 124.88
Min 0.00 0.00 0.00 0.00 0.00 0.00 0.00 0.00 0.00
Max 221.56 261.84 223.39 825.81 520.02 952.15 758.06 532.84 884.40
Std Dev 64.81 73.24 62.78 85.86 89.43 122.39 183.05 134.85 152.88
Ta = Ambient Temperature, RH = Relative Humidity, ISR = Incoming Solar Radiation, CS = Cross Section
The cross section averages of incoming solar radiation data
were (59.81, 64.40, 59.18), (55.89, 68.04, 96.37), (158.19,
120.10, and 124.88) W/m2 for rooms 102, 105, and 109
respectively. Statistically significant differences (P < 0.011, CI
= 0.05) were shown between all cross section average
temperature data collected by cross sections 4 through 9
except between central and south cross sections in rooms 105
(CS #5 and 6, P = 1.000 ) and 109 (CS #8 and 9, P = 0.454).
Statistically significant differences (P < 0.001, CI = 0.05) were
shown between all cross section average relative humidity
data except data collected by CS 2 and 3 (P = 1.000), CS 5 and
6 (P = 0.698), CS 8 and 9 (P = 1.00), CS 4 and 8 (P = 0.837),
and CS 4 and 9 (P = 0.952). Statistically significant differences
(P < 0.001, CI = 0.05) were identified for all incoming solar
radiation data collected by pyranometers 6 through 9 except
between CS 8 and 9 (P = 0.929). The only other statistically
significant difference (P = 0.006, CI = 0.05) was between
cross sections 4 and 5. The hourly averages of 1m temperature
data were 24.38, 31.05, and 28.12°C for rooms 102, 105, and
109 respectively.
Table 6 shows descriptive statistics for temperature data
collected at 1m and 3m by spatially distributed iButton
sensors and subsequent VPD calculations at 1m and 3m
while the climate control system was ON in each room.
Spatially distributed iButtons located at 1m recorded
temperatures 10.8, 17.2, and 25.0% warmer than the average
of optimal day and night temperatures in rooms 102, 105, and
109 respectively. The hourly average 3m temperature data
were 30.9, 35.3, and 36.4°C for rooms 102, 105, and 109
respectively. The hourly average lapse rate calculations were
3.20, 2.14, and 4.15°C/m for rooms 102, 105, and 109
respectively. Hourly averages of 1m VPD data were 1.08,
2.45, and 1.56 kPa for rooms 102, 105, and 109 respectively.
Hourly averages of 3m VPD data were 3.18, 4.14, 4.85 kPa
for rooms 102, 105, and 109 respectively, and hourly average
lapse rate calculations were 1.05, 0.85, and 1.64 kPa/m.
Therefore, on average, taller soybean and maize plants were
subjected to VPD values of 3.30 kPa and 3.20 kPa in rooms
105 and 109 respectively. Statistically significant differences
(P < 0.001, CI = 0.05) were shown between all room
averaged 1m and 3m temperature data collected by spatially
distributed iButtons except 3m temperature data collected in
rooms 105 and 109 (P = 0.124). Statistically significant
differences (P < 0.001, CI = 0.05) were calculated between
all room averaged 1m and 3m VPD calculations using
iButton sensor data.

Journal of Plant Sciences 2014; 2(5): 167-178 173
Table 6. Descriptive statistics of air temperature (°C) at bench height (1m) and 3m, and lapse rate calculations (°C/m or kPa/m) using iButton sensors while
the climate control system was ON at the Sears Plant Growth Facility located at the University of Missouri, Columbia, MO, USA.
Statistic Room 102 Room 105 Room 109
1m 3m LR 1m 3m LR 1m 3m LR
Ta (°C)
Mean 24.38 30.78 3.20 31.05 35.33 2.14 28.12 36.42 4.15
Min 19.04 18.64 -1.22 22.03 22.18 -1.26 20.95 20.55 -0.52
Max 33.34 54.29 11.64 42.44 53.23 9.71 36.71 56.99 11.65
Std Dev 2.65 9.18 3.59 2.95 7.54 2.62 3.05 9.73 3.54
VPD
(kPa)
Mean 1.08 3.18 1.05 2.45 4.14 0.85 1.56 4.85 1.64
Min 0.23 0.29 -0.21 0.58 0.52 -0.30 0.39 0.52 -0.11
Max 2.21 12.31 5.30 6.78 12.63 4.74 3.86 15.52 6.39
Std Dev 0.37 2.85 1.34 0.84 2.65 1.08 0.55 3.65 1.63
Ta = Ambient Temperature, VPD = Vapor Pressure Deficit, LR = Lapse Rate
4. Discussion
4.1. Internal Versus External Climate
Fig. 2 shows hourly climate time series collected by
spatially distributed iButton, centrally located greenhouse,
and external Sanborn Field sensors between 5/9/2012 and
9/5/2012 (Table 2). The climate control system was shut off on
June 29th
, August 29th
, and August 7th
for rooms 102, 105, and
109 respectively. On average, spatially distributed iButton
sensor and centrally located greenhouse sensors recorded
temperatures 6.59°C (25.4%) and 2.93°C (10.9%) warmer
than external conditions respectively. Spatially distributed
iButton sensors and centrally located greenhouse sensors
recorded average relative humidity values 7.85 (14.7%) and
2.22% (4.1%) lower than external conditions recorded at
Sanborn Field respectively. Average incoming solar radiation
values were 82.54 and 259.33 W/m2 for internal and external
pyranometers respectively (Table 2).
Figure 2. Daily time series of average air temperature (°C), relative
humidity (%), and incoming solar radiation (W/m2) data collected between
5/9/12 and 9/5/12 at the Sears Plant Growth Facility and Sanborn Field
located at the University of Missouri, Columbia, MO, USA. Greenhouse =
Central greenhouse sensor.
The large difference in incoming solar radiation values
between internal and external (Sanborn) pyranometers was
presumably due to the transmittance of solar radiation through
the greenhouse roof glazing material in addition to shadows
caused by the greenhouse framing, shade curtains, and nearby
plants or buildings. Statistical analysis of temperature, relative
humidity, and incoming solar radiation data indicated
significant differences (P < 0.001, CI = 0.05) between each
distributed iButton sensor or pyranometer, centrally located or
externally mounted greenhouse sensors, and Sanborn Field
data. Therefore, internal and external climate conditions were
significantly different and each room’s inter- and
intra-average temperature, relative humidity, and incoming
solar radiation were significantly different.
4.2. Climate Comparison between Greenhouse Rooms
Figure 3 shows daily averages of the hourly climate data
time series collected by spatially distributed iButtons between
5/9/12 and 9/5/12. There was a substantial increase in
variability for both temperature and relative humidity data
when the climate control system was shut off (e.g. the 29th
of
June, 28th
of August, and the 7th
of August for rooms 102, 105,
and 109 respectively). The room average air temperatures
recorded by distributed iButtons were 32.0, 33.0, and 32.3°C
(Table 3) for rooms 102, 105, and 109, respectively. Baudoin
et al. (1990) [27] considered maximum temperatures greater
than 32°C to be excessive for greenhouse crops. The average
temperature of each room in the current study was at or above
32°C. The average of distributed iButtons from each room
indicated temperatures of 10°C (45.5%), 6.5°C (24.5%), and
9.8°C (43.6%) warmer than average optimal day and night
conditions (Table 1) for rooms 102, 105, and 109, respectively.
The maximum difference between absolute minimum
temperatures recorded by spatially distributed iButtons and
the centrally located greenhouse sensor was only 0.51°C
(2.7%) recorded in room 102. However, the absolute
maximum temperatures recorded by spatially distributed
iButtons were 8.08°C (16.5%), 2.35°C (5.1%), and 9.18°C
(18.8%) warmer than centrally located greenhouse sensors for
rooms 102, 105, and 109 respectively. The differences
between absolute minimum and maximum temperatures
indicate that microclimate heterogeneity decreased at night
and increased during the day. A greater magnitude of
microclimate heterogeneity during the day when plants are
photosynthesizing may promote variable crop growth rates

174 Evan Kutta and Jason Hubbart: Improving Understanding of Microclimate Heterogeneity within a Contemporary Plant
Growth Facility to Advance Climate Control and Plant Productivity
within each greenhouse. As expected the opposite trend was
apparent in absolute minimum and maximum relative
humidity data. The centrally located greenhouse sensors
recorded average relative humidity values 4.96, 3.85, and
7.89% higher than spatially distributed sensors in rooms 102,
105, and 109 respectively, thereby reporting cooler and
moister conditions than those recorded by spatially distributed
sensors.
Figure 3. Daily time series of average air temperature (°C), relative
humidity (%), and incoming solar radiation (W/m2) data collected between
5/9/12 and 9/5/12 in the Sears Plant Growth Facility located at the
University of Missouri, Columbia, MO, USA.
Results showed that plants grown at increasing distance
from the evaporative pads were subjected to warmer and drier
conditions. Quantifying this observation in the current work
substantiates the usefulness of at least one additional climate
monitoring sensor positioned further from the evaporative
pads to sense variable internal greenhouse microclimates. If
the desire is to strike a balance between microclimate
monitoring, climate control efficiency and infrastructure
investment, four additional spatially distributed climate
monitoring sensors is advised. For example, for the current
study, one sensor to each side of the centrally located sensor
approximately the same distance apart and near outside walls
would improve horizontal microclimate monitoring and
climate regulation. Two sensors should also be added at equal
spacing above the centrally located sensor to detect vertical
microclimate variation. Therefore, it is recommended that at
least five internal Ta/RH sensors be used to sufficiently detect
horizontal and vertical microclimate heterogeneity within
each greenhouse room. Notably, positioning of sensors should
be tested and customized to balance data acquisition and
climate control programming needs in any greenhouse room,
and optimal positions may require changes with presence (or
absence) of vegetation or other structures (i.e. tables) in the
room or time of year. Ultimately, with additional sensors with
proper placement, the climate controller may better actively
mix the internal climate to reduce variability and promote
homogenous crop growth and productivity.
Average incoming solar radiation recorded by study
pyranometers in rooms 102, 105, and 109 was 52.8, 71.8, and
122.6 W/m2, respectively (Table 3). Differences were
attributed primarily to differences in the number and size of
plants and the action temperatures for the automated shade
screens in each room. The number and size of plants being
grown affects the leaf area index (LAI, the area of leaves per
unit ground surface area) in a greenhouse room [24].
Abdel-Ghany and Al-Helal (2011) [28] showed that the
fraction of incoming solar radiation absorbed by plants
increased with greater LAI values, which reduced the fraction
of incoming solar radiation absorbed by the greenhouse floor.
Room 102 contained no plants and had the shade curtains
drawn for the duration of this study, which prevented average
incoming solar radiation values greater than 221 W/m2. The
cooling system in room 105 was programmed to draw the
shade curtains at 32.2°C, which occurred regularly in July and
August and prevented incoming solar radiation values larger
than 425 W/m2. Room 109 was programmed to draw the shade
curtain at 43.3°C, which didn’t occur for the duration of the
study and resulted in incoming solar radiation values
frequently exceeding 500 W/m2. Mӧller (2002) [29], Monteith
and Unsworth (1990) [30], and Campbell and Norman (1998)
[24] showed that light saturation for sweet pepper and barley
crops occurs near 500 W/m2. Therefore, the light levels in
room 109 could have added detrimental levels of heat, which
is not beneficial for plant growth and should be prevented
through the use of shade curtains.
4.3. Climate within Rooms
Figure 4 shows box and whisker plots of air temperature
and vapor pressure deficit using hourly data collected by
centrally located greenhouse and iButton sensors while the
climate control system was ON in each room (Table 4).
Average temperatures sensed by centrally located iButton
sensors were 3.22°C (9.3%) and 1.94°C (7.1%) warmer than
centrally located greenhouse sensors for rooms 105 and 109
respectively. Hubbart (2011) [18] compared aspirated shielded
iButton sensors with shielded iButton sensors and showed that
on average (n = 61) non-aspirated sensors sensed temperatures
2.84°C (13.5%) warmer than the aspirated sensor (a
statistically significant difference, P < 0.05). IButton sensors
may have had a warm bias based on their lack of aspiration,
but differences between centrally located greenhouse and
iButton sensors frequently exceeded the differences between
sensors found by Hubbart (2011) [18]. This bias could explain
the warmer average temperatures recorded by centrally
located iButtons, but differences were especially apparent
between absolute minimum and maximum values recorded by
each sensor. Absolute minimum temperatures recorded by
centrally located iButtons were 0.71°C (3.9%), 0.21°C (1.0%),
and 0.20°C (1.0%) warmer than the centrally located
greenhouse sensors in rooms 102, 105, and 109 respectively.
However, absolute maximum temperatures recorded by
centrally located iButtons were 9.28°C (29.8%), 4.88°C
(12.0%), and 6.47°C (19.0%) warmer than centrally located
greenhouse sensors in rooms 102, 105, and 109 respectively.

Journal of Plant Sciences 2014; 2(5): 167-178 175
Average estimated vapor pressure deficit values sensed by
centrally located iButton sensors were 0.57 kPa (27.9%) and
0.20 kPa (20.5%) greater than centrally located greenhouse
sensors for rooms 105 and 109 respectively. These were
statistically significant (P < 0.001, CI = 0.05) differences.
Differences may be attributable to the much earlier climate
control shut off date in room 102 (June 29th
) relative to the
other two rooms in addition to substantially lower action
temperatures for active cooling in room 102, which
simultaneously reduced temperature and increased relative
humidity. Reducing the action temperatures for evaporative
cooling systems may lead to improved crop growth conditions,
especially during extremely hot external conditions.
Figure 4. Box and whisker plots of hourly air temperature (°C) and vapor
pressure deficit (kPa) data collected while the climate control system was ON
in each room by centrally located iButton and greenhouse sensors in the Sears
Plant Growth Facility located at the University of Missouri, Columbia, MO,
USA. Rooms separated by vertical line. GH = Greenhouse sensor, iB =
iButton temperature/relative humidity sensor.
Figure 5. Spatial distribution (i.e. looking down) maps of average
temperature (°C) data while the climate control system was “ON” in (from
left to right) rooms 102, 105, and 109 at the Sears Plant Growth Facility
located at the University of Missouri, Columbia, MO, US
Clear north to south temperature gradients (22 m room
length) were shown in each room, but the least variable
conditions were found in room 102 (Fig. 5). The temperature
distribution in rooms 105 and 109 showed that the greatest
temperature gradient occurred in the northern half of each
room closest to the evaporative pads (Table 5). On average the
central cross section was warmer than the south cross section,
which was furthest from the cooling pads, thus indicating a
reversal of the general north to south temperature gradient.
Horizontal temperature gradients were affected by turbulence,
which was maximized in the middle of each room farthest
from the source (cooling pads), sink (exhaust fans), and
further increased by obstructions to flow such as plants and
benches.
The non-uniform plant distribution in each of the rooms
may have also increased the temperature gradients across the
northern half of each room due to cooling through
evapotranspiration and restricting air flow. Lopez et al. (2010)
[31] showed that bench height temperatures were about 4°C
warmer in an empty greenhouse room relative to a greenhouse
room with a mature tomato crop thereby highlighting the
cooling potential of a mature crop canopy and potential
warming in non-vegetated portions of the greenhouse. On this
basis, greenhouse crops should be planted across as much
bench space as possible to homogenize air flow through each
room and increase evapotranspiration, thereby minimizing
microclimate heterogeneity.
Figure 6. Spatial distribution (i.e. looking down) of average vapor pressure
deficit (kPa) while the climate control system was “ON” in (from left to right)
rooms 102, 105, and 109 at the Sears Plant Growth Facility located at the
University of Missouri, Columbia, MO, USA.
The maximum VPD values recorded by Lui et al. (2006)
[21] and Guichard et al. (2005) [20] were between 2.5 and 3.0
kPa, thus implying that plants in the greenhouse rooms of the
current study were likely subjected to detrimentally high VPD
values (Fig. 6). However, the investigations of Lui et al. 2006
and Guichard et al. 2005 were performed in greenhouses with
uniform plant densities of 7.5 rose plants/m2 and 2.1 tomato
plants/m2 respectively. Therefore, evapotranspiration
associated with a homogenous crop distribution is important
to consider in terms of minimizing greenhouse microclimate
heterogeneity. Al-Helal and Abdel-Ghany (2011) showed that
on a sunny day 34.4% of the net radiation present above the
canopy was converted into latent heat by evapotranspiration in

176 Evan Kutta and Jason Hubbart: Improving Understanding of Microclimate Heterogeneity within a Contemporary Plant
Growth Facility to Advance Climate Control and Plant Productivity
a greenhouse where the crop’s leaf area index (LAI) was 3.
Clearly, evapotranspiration is an important process when
considering greenhouse climate control and greater LAI will
reduce microclimate heterogeneity and simultaneously reduce
diurnal greenhouse microclimate variability.
Daily averages of bench height (1m) temperature data
showed how the climate control system stabilized the internal
climate while it was operating in each room (Fig. 7). However,
air temperatures at 3m were consistently above the 32°C
threshold established by Baudoin et al. (1990) [27] for stomata
closure, except for room 102 while the climate control system
was ON. Plants during this study had heights of approximately
2m. Corn plants were in pots on the floor and soybean plants
were in pots on 1m benches. Results of the current study
indicate that with increasing height, plants were subjected to
increasingly unfavorable climate conditions characterized by
an average lapse rate for all rooms of 2.9°C/m while the
climate control system was ON. Room 109 consistently
showed the strongest vertical temperature gradients (Fig. 7),
possibly a results of the desire to maximize light levels. As a
result however, the active cooling system was run more
frequently to maintain the desired average optimal
temperature of 22.5°C. The evaporative pads and exhaust fans
were located at approximately bench height (1m) resulting in
enhanced airflow at that height. Temperature at 3 m was
strongly dependent on the magnitude of turbulent mixing,
which could be artificially increased by using horizontal
circulation fans.
Figure 7. Daily time series of air temperature (°C) at bench height (1m) and
3m, lapse rate calculations (°C/m-1) collected between 5/9/12 and 9/5/12
using iButton sensors deployed at the Sears Plant Growth Facility located at
the University of Missouri, Columbia, MO, USA.
On average, spatially distributed iButton sensors detected
significantly (P < 0.05, CI = 0.05) warmer and drier conditions
than centrally located greenhouse sensors. Results indicate that
observed warmer and drier conditions could in-part be
attributed to differences in greenhouse sensors versus sensors
used in the current work. However, a goal of this study was to
show whether a single centrally located climate monitoring
sensor sufficiently represented the overall internal greenhouse
microclimate. Results indicate that substantial microclimate
heterogeneity exists with mean horizontal temperature
gradients of as much as 5.0°C/m (Fig. 5), and mean horizontal
VPD gradients of 1.5 kPa/m (Fig. 6). Most substantially, the
maximum vertical temperature gradient was 11.65°C/m.
Microclimate heterogeneity of this magnitude undoubtedly
creates challenging and often uneven crop growing conditions.
5. Conclusions
Maximum greenhouse crop growth and production is
achieved in part by providing optimal crop growth conditions
homogenously throughout a greenhouse. However, many
contemporary greenhouses have evaporative pad cooling
systems that can inherently create horizontal and vertical
temperature gradients. Microclimate gradients variably
influence crop growth and impact overall production, but
cannot be sensed by a single centrally located climate
monitoring sensor. This study included spatially distributed
instruments (n = 21/room) that provided necessary
information to quantitatively characterize greenhouse
microclimate heterogeneity and provide recommendations for
contemporary greenhouse managers who may wish to better
control greenhouse climate.
Exceptional external climate conditions during this study
improved the value of the current work in that climate
conditions provided a worst case scenario for drought
conditions and greenhouse management. Uniformly
distributed sensors detected average internal greenhouse
conditions 3.7°C (12.9%) warmer and 4.6% lower relative
humidity values than the centrally located climate monitoring
greenhouse sensors between May 9th
and September 5th
, 2012.
Additionally, spatially distributed sensors detected room
average temperatures that were 5.3°C (24.2%), 6.5°C (24.5%),
9.7°C (43.1%) warmer than average optimal day and night
temperatures (i.e. programmed conditions) in rooms 102, 105,
and 109, respectively. Statistical analysis showed that all
comparisons of room average temperature and relative
humidity data collected by greenhouse and spatially
distributed iButton sensors were significantly different (P <
0.028, CI = 0.05). The climate variability identified in the
current work showed that the driving gradient for vapor flux
(VPD) varied substantially based on plant height and location
within the greenhouse. One way to counteract this problem
may be to maximize plant density and leaf area index within
each greenhouse room to increase the magnitude of spatially
distributed evapotranspirational cooling.
The maximum room averaged vertical temperature
gradient was 11.65°C/m, indicating that with increasing plant
height, plants grew into increasingly harsh microclimate
conditions. Strong vertical temperature gradients such as
these could be ameliorated through the use of ceiling
mounted circulation fans. Greenhouse managers may wish to
draft two separate sets of action temperatures based on the
primary climate control objective (heating or cooling).
Furthermore, if particularly hot and sunny conditions are

Journal of Plant Sciences 2014; 2(5): 167-178 177
forecast further adjustments to action temperatures should be
made such as reducing the activation temperature or intervals
between stages of the cooling system. Regular cleaning or
replacement of evaporative pads and proper calibration of
climate monitoring sensors are also simple ways to reduce
greenhouse climate control system error. Installing an
internally mounted incoming solar radiation sensor may also
reduce the climate controller’s error relative to an externally
mounted incoming solar radiation sensor. It is recommended
that multiple properly located and installed internal Ta/RH
sensors be used to sufficiently detect horizontal and vertical
microclimate heterogeneity within each greenhouse room.
Additional climate monitoring sensors would allow the
climate control system to identify and respond to
heterogeneous internal climates, thereby improving internal
greenhouse climate homogeneity and accompanying plant
productivity.
Acknowledgements
Gratitude is extended to the Sears Plant Growth Facility
Committee, particularly Michelle Brooks and Rich Wilman.
Special thanks are extended to scientists of the
Interdisciplinary Hydrology Laboratory, the CAFNR Center
for Watershed Management and Water Quality, the School of
Natural Resources Water Resources Program, and multiple
reviewers whose comments improved the quality of the
article.
References
[1] Gruda, N. 2005. Impact of Environmental Factors on Product Quality of Greenhouse Vegetables for Fresh Consumption. Critical Reviews in Plant Sciences 24.3: 227-247.
[2] Pawlowski, A., J.L. Guzman, F. Rodríguez, M. Berenguel, J. Sánchez, and S. Dormido. 2009. Simulation of Greenhouse Climate Monitoring and Control with Wireless Sensor Network and Event-Based Control. Sensors 9.1: 232-252.
[3] Bot, G.P.A. 2003. The Solar Greenhouse; Technology for Low Energy Consumption. Acta Horticulturae (ISHS) 611: 61-71.
[4] Sethi, V.P., and S.K. Sharma. 2007. Survey of Cooling Technologies for Worldwide Agricultural Greenhouse Applications. Solar Energy 81.12: 1447-1459.
[5] Kittas C., N. Katsoulas, and T. Bartzanas. 2012. Greenhouse Climate Control in Mediterranean Greenhouses. Journal of Agrifood Studies (CEA) 3: 89-114.
[6] Kittas C., T. Bartzanas, A. Jaffrin. 2003. Temperature Gradients in a Partially Shaded Large Greenhouse Equipped with Evaporative Cooling Pads. Biosystems Engineering 85.1: 87-94.
[7] Lopez, A., D. Valera, F. Molina-Aiz, and A. Pena. 2012. Sonic Anemometry to Evaluate Airflow Characteristics and Temperature Distribution in Empty Mediterranean Greenhouses Equipped with Pad-fan and Fog Systems. Biosystems Engineering 113: 334-350.
[8] Kramer P.J., Boyer J.S. 1995. Transpiration and the Ascent of
Sap. Water Relations of Plants and Soils. San Diego: Academic, 209.
[9] Van Pee, M. and D. Berckmans, 1999. Quality of Modeling Plant Responses for Environment Control Purposes. Computers and Electronics in Agricuture. 22.2-3: 209-216.
[10] Boulard, T. 2012. Recent Trends in Greenhouse Microclimate Studies and Contribution of CFDs. Acta Horticulturae (ISHS) 952: 739-748.
[11] Grange, R.L., D.W. Hand. 1987. A Review of the Effects of Atmospheric Humidity on the Growth of Horticultural Crops. Journal of Horticultural Science 62: 125-134.
[12] Baille, M., A. Baille, and D. Delmon. 1994. Microclimate and Transpiration of Greenhouse Rose Crops. Agricultural and Forest meteorology 71: 83-97.
[13] Gholipoor M., S. Choudhary, T.R. Sinclair, C.D. Messina, M. Cooper, 2012. Transpiration Response of Maize Hybrids to Atmospheric Vapour Pressure Deficit. Journal of Agronomy and Crop Science 199.3: 155-160.
[14] Gholipoor M., P.V.V. Prasad, R.N. Mutava, and T.R. Sinclair, 2010. Genetic variability of transpiration response to vapor pressure deficit among sorghum genotypes. Field Crops Research 119: 85–90.
[15] Bunce, J.A. 2003. Effects of Water Vapor Pressure Difference on Leaf Gas Exchange in Potato and Sorghum at Ambient and Elevated Carbon Dioxide Under Field Conditions Field Crops Research 82.1: 37-47.
[16] Fletcher A.L., T.R. Sinclair, and L.H. Allen. Jr, 2007. Transpiration Responses to Vapor Pressure Deficit in Well Watered ‘Slow Wilting’ and Commercial Soybean. Environmental and Experimental Botany 61: 145–151.
[17] Hubbart, J., T. Link, C. Campbell, and D. Cobos. 2005. Evaluation of a Low-cost Temperature Measurement System for Environmental Applications. Hydrological Processes 19.7: 1517-1523.
[18] Hubbart, J.A. 2011. An Inexpensive Alternative Solar Radiation Shield for Ambient Temperature and Relative Humidity Micro-sensors. Journal of Natural and Environmental Sciences 2.2: 9-14.
[19] Blandford T.R., K.S. Humes, B.J. Harshburger, B.C. Moore, V.P. Walden. 2008. Seasonal and Synoptic Variations in Near-Surface Air Temperature Lapse Rates in a Mountainous Basin. Journal of Applied Meteorology and Climatology 47: 249-261.
[20] Guichard, S., C. Gary, C. Leonardi, N. Bertin. 2005. Analysis of Growth and Water Relations of Tomato Fruits in Relation to Air Vapor Pressure Deficit and Plant Fruit Load. Journal of Plant Growth Regulation 24: 201-213.
[21] Liu, F., Y. Cohen, M. Fuchs, Z. Plaut, and A. Grava. 2006. The effect of vapor pressure deficit on leaf area and water transport in flower stems of soil-less culture rose. Agricultural Water Management 81: 216-224.
[22] Zar, J.H. 1999. Biostatistical analysis. 4th ed. Upper Saddle River, NJ: Prentice Hall.
[23] Buck, A.L. 1981. New Equations for Computing Vapor Pressure and Enhancement Factor. Journal of Applied Meteorology 20.12: 1527-1532.

178 Evan Kutta and Jason Hubbart: Improving Understanding of Microclimate Heterogeneity within a Contemporary Plant
Growth Facility to Advance Climate Control and Plant Productivity
[24] Campbell, G.S., and Norman, J.M. 1998. Water Vapor and Other Gases. Introduction to Environmental Biophysics. New York: Springer. 37-50.
[25] Akima,H. 1978. A method of bivariate interpolation and smooth surface fitting for irregularly distributed data point. ACM Transactions on Mathematical Software, 4(2): 148-159.
[26] Svoboda, M., D. LeComte, M. Hayes, R. Heim. 2002. The Drought Monitor. Bulletin of the American Meteorological Society 83.8: 1181-1190.
[27] Baudoin, W.O., I.C. Denis, M. Grafiadellis, R. Jimenez, G. La Malfa, P.F. Martinez-Garcia. 1990. Protected cultivation in the Mediterranean climate. Food and Agriculture Organization of the United Nations, paper 90.
[28] Abdel-Ghany, A.M., I.M. Al-Helal. 2011. Energy Partition and
Conversion of Solar and Thermal Radiation into Sensible and Latent Heat in a Greenhouse under Arid Conditions. Energy and Buildings 43: 1740-1747.
[29] Möller, M. 2002. The Effect of Insect-proof Nets on Exchange of Mass and Momentum in a Screenhouse for pepper Cultivation in Central Israel. Diploma Thesis, Department of Meteorology, TU Dresden.
[30] Monteith, J., and M. Unsworth. 1990. Principles of Environmental Biophysics, 2nd edition. Butterworth-Heinemann, Oxford, 255.
[31] Lopez, A., D. Valera, F. Molina-Aiz, and A Pena. 2010. Experimental Evaluation by Sonic Anemometry of Airflow in a Mediterranean Greenhouse Equipped with a pad-fan Cooling System. Transactions of the ASABE, 53(3), 945-957.


!['Real-time Urban Microclimate Analysis Using … Urban Microclimate Analysis Using Internet of Things ... In many IoT applications, ... urban microclimate monitoring [20]. To study](https://static.fdocuments.net/doc/165x107/5ac834157f8b9aa3298bdae6/real-time-urban-microclimate-analysis-using-urban-microclimate-analysis-using.jpg)