GENETIC CRITERION FOR SELECTION OF HIGHLY...
9
Genetic criterion for selection of rice lines J. Agric. Res., 2014, 52(2) 167 GENETIC CRITERION FOR SELECTION OF HIGHLY PRODUCTIVE MEDIUM GRAIN RICE (ORYZA SATIVA) LINES Misbah Riaz, M. Akhter and Rana Ahsan Raza Khan* ABSTRACT A study was conducted at Rice Research Institute, Kala Shah Kaku, Pakistan during the year 2010 to find out correlation and level of significance for different rice (Oryza sativa) lines for yield and yield components. Six genotypes of medium grain rice (PK 8245-4, PK 8328-4-1-1, PK 3445-3-2, Aerobic 1, RSP-3 and RSP-4) were collected from PARC, Islamabad while KSK-133 and IR-5 were used as check. All the genotypes were planted in RCBD at Rice Research Institute, Kala Shah Kaku, during 2010. At maturity data were recorded for days to 50% flowering, maturity days, plant height, productive tillers per plant and panicle length. Highly significant positive correlation was observed between plant height and grains per panicle. At the same time significant but negative correlation was observed among plant height and productive tillers per plant, days to 50% flowering and 1000 grain weight, plant height and 1000 grain weight, panicle length and paddy yield. These results help us to devise the effective selection criterion for high yielding medium grain rice lines. Among the lines under study, PK 3445-3-2 proved to be having all three characters and thus will be selection of choice for future experiments. KEYWORDS: Oryza sativa; medium grain rice; genotypes; agronomic characters; correlation; Pakistan. INTRODUCTION Rice (Oryza sativa L.) ranks as second amongst the staple food cereal crops in Pakistan and it has been a main source of foreign exchange earnings in current years. The area sown under rice is 2571 thousand hectares. The production is assessed 6160 thousand tons. Pakistan is the biggest producer of Basmati rice which is recognized in the world for its quality and aroma produced mainly in Kallar Tract of Punjab, Pakistan (3, 4). Paddy Yield is a complex quantitative character which is controlled by genes interacting with each other as well as the environment and is the product of *Rice Research Institute, Kala Shah Kaku, Pakistan.
Transcript of GENETIC CRITERION FOR SELECTION OF HIGHLY...

Genetic criterion for selection of rice lines
J. Agric. Res., 2014, 52(2)
167
GENETIC CRITERION FOR SELECTION OF HIGHLY PRODUCTIVE MEDIUM GRAIN RICE (ORYZA SATIVA) LINES
Misbah Riaz, M. Akhter and Rana Ahsan Raza Khan*
ABSTRACT
A study was conducted at Rice Research Institute, Kala Shah Kaku, Pakistan during the year 2010 to find out correlation and level of significance for different rice (Oryza sativa) lines for yield and yield components. Six genotypes of medium grain rice (PK 8245-4, PK 8328-4-1-1, PK 3445-3-2, Aerobic 1, RSP-3 and RSP-4) were collected from PARC, Islamabad while KSK-133 and IR-5 were used as check. All the genotypes were planted in RCBD at Rice Research Institute, Kala Shah Kaku, during 2010. At maturity data were recorded for days to 50% flowering, maturity days, plant height, productive tillers per plant and panicle length. Highly significant positive correlation was observed between plant height and grains per panicle. At the same time significant but negative correlation was observed among plant height and productive tillers per plant, days to 50% flowering and 1000 grain weight, plant height and 1000 grain weight, panicle length and paddy yield. These results help us to devise the effective selection criterion for high yielding medium grain rice lines. Among the lines under study, PK 3445-3-2 proved to be having all three characters and thus will be selection of choice for future experiments.
KEYWORDS: Oryza sativa; medium grain rice; genotypes; agronomic characters; correlation; Pakistan.
INTRODUCTION
Rice (Oryza sativa L.) ranks as second amongst the staple food cereal crops in Pakistan and it has been a main source of foreign exchange earnings in current years. The area sown under rice is 2571 thousand hectares. The production is assessed 6160 thousand tons. Pakistan is the biggest producer of Basmati rice which is recognized in the world for its quality and aroma produced mainly in Kallar Tract of Punjab, Pakistan (3, 4). Paddy Yield is a complex quantitative character which is controlled by genes interacting with each other as well as the environment and is the product of
*Rice Research Institute, Kala Shah Kaku, Pakistan.

M. Riaz et al.
J. Agric. Res., 2014, 52(2)
168
many factors called yield components. In order to evolve a high yielding variety it is necessary for plant breeders to have knowledge of relationship between yield and its contributing characters for an efficient selection strategy (2).
Present study was conducted to find out correlation between different yield contributiong traits of different medium grain rice genotypes.
MATERIALS AND METHODS
Medium grain rice (Oryza sativa) genotypes (PK 8245-4, PK 8328-4-1-1, PK 3445-3-2, Aerobic 1, RSP-3 and RSP-4) were collected from PARC, Islamabad while KSK-133 and IR-5 were used as check. All these genotypes were planted in RCBD with three replications during kharif 2010 at Rice Research Institute, Kala Shah Kaku, Pakistan. Recommended cultural practices were practiced. At maturity, data were recorded for days to 50% flowering, days to maturity, plant height (cm), productive tillers per plant, panicle length (cm), number of grains per panicle, 1000 grain weight (g) and paddy yield (kg/ha). The data were subjected to standard statistical techniques for analysis of variance (12) which is helpful in division of variance into its corresponding constituents. Correlation analysis was performed among the paddy yield and yield contributing traits. Statistical significance of phenotypic correlation was estimated by using Student’s t-test as described by Steel et al., (12). The estimated correlation was taken as significant if t-calculated was greater than t-tabulated.
RESULTS AND DISCUSSION
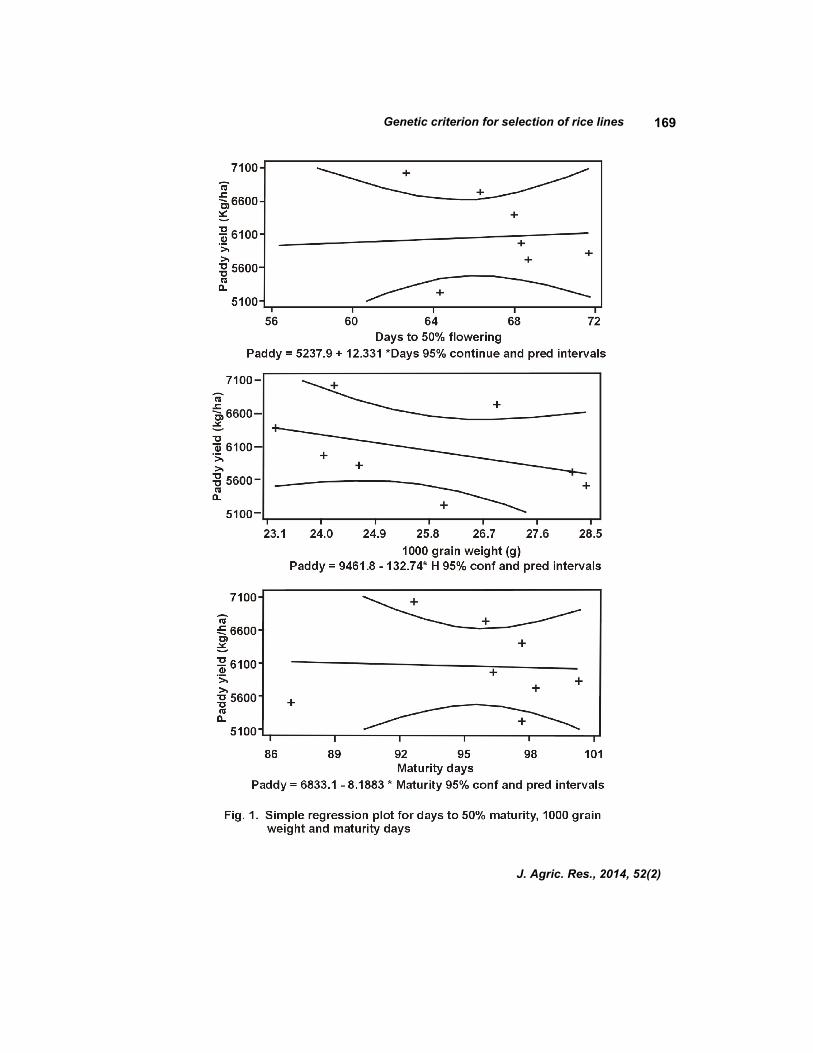
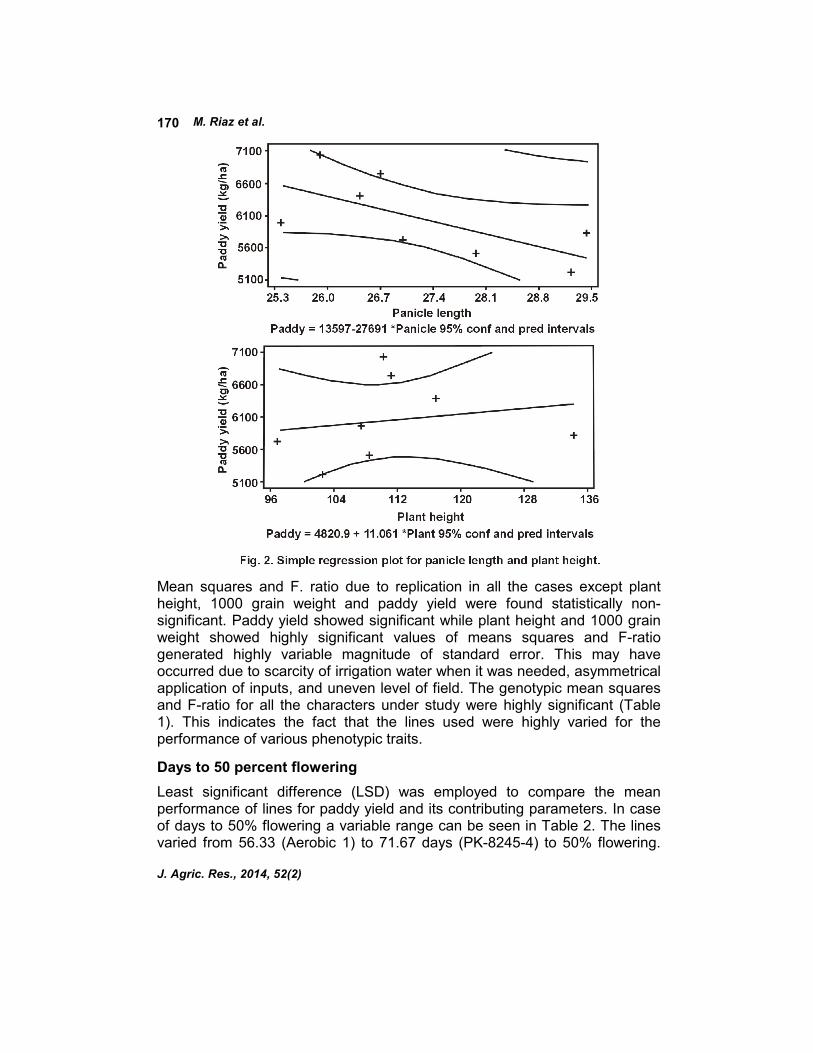
In the case of amount of variability present in the lines of medium grain rice under study, it was observed that highest estimates of variability were exhibited by the paddy yield along with productive tillers per plant. Quantitative parameters and their correlation were also estimated by Oad et al. (8). These were followed by panicle length and number of grains per panicle. Plant height, days to 50% flowering, maturity days followed closely, while least amount of genetic variability was exhibited by 1000 grain weight. As the standard error of the estimate is a measure of variability of predictions in a regression (7), almost all the contributing yield components i.e. number of grains per panicle, plant height, maturity days, days to 50% flowering, productive tillers per plant and panicle length showed low amount of scatter on the both sides of regression line. The extreme values were observed in case of 1000 grain weight that exhibited almost straight line of observed values while highest amount of unusual (extreme) values were shown by paddy yield (Fig. 1, 2).
Genetic criterion for selection of rice lines
J. Agric. Res., 2014, 52(2)
169
M. Riaz et al.
J. Agric. Res., 2014, 52(2)
170
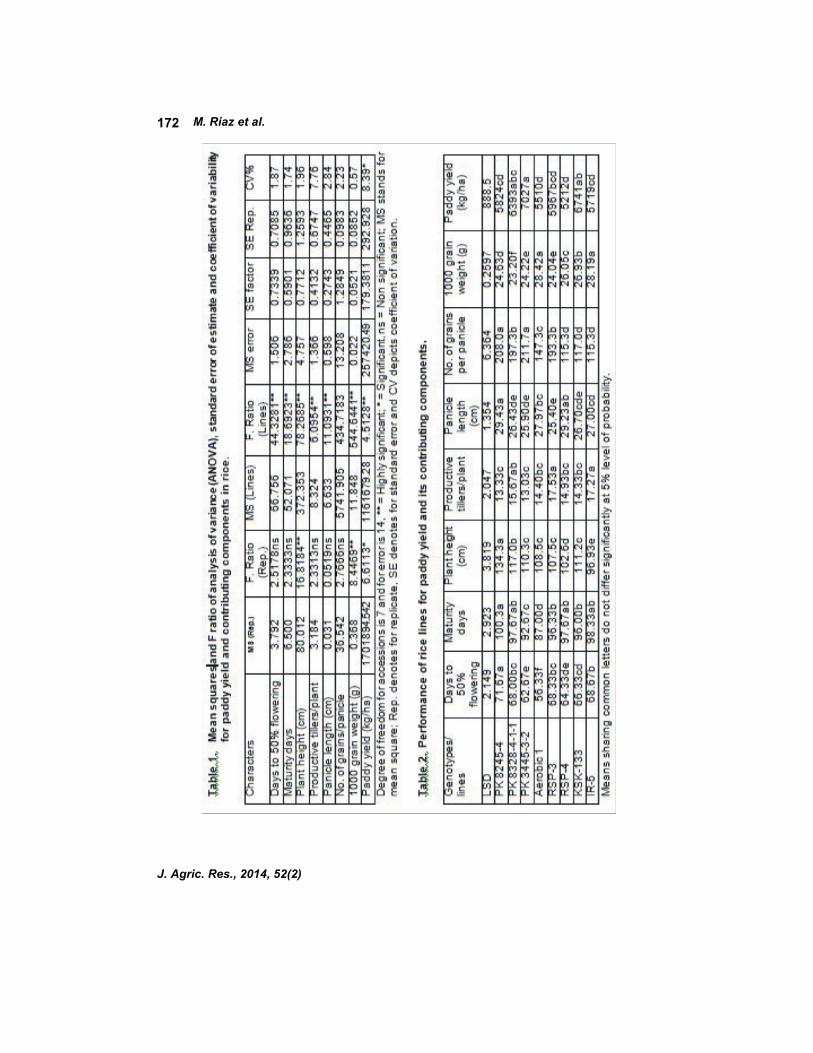
Mean squares and F. ratio due to replication in all the cases except plant height, 1000 grain weight and paddy yield were found statistically non-significant. Paddy yield showed significant while plant height and 1000 grain weight showed highly significant values of means squares and F-ratio generated highly variable magnitude of standard error. This may have occurred due to scarcity of irrigation water when it was needed, asymmetrical application of inputs, and uneven level of field. The genotypic mean squares and F-ratio for all the characters under study were highly significant (Table 1). This indicates the fact that the lines used were highly varied for the performance of various phenotypic traits.
Days to 50 percent flowering
Least significant difference (LSD) was employed to compare the mean performance of lines for paddy yield and its contributing parameters. In case of days to 50% flowering a variable range can be seen in Table 2. The lines varied from 56.33 (Aerobic 1) to 71.67 days (PK-8245-4) to 50% flowering.

Genetic criterion for selection of rice lines
J. Agric. Res., 2014, 52(2)
171
Early flowering plants are normally considered good for the grain yield. Aerobic 1 showed the desirable characteristics of early flowering (56.33 days).
Maturity days
In case of maturity days the available range of variability encourages the plant breeders to select plants with lower maturity days to enable other crops to be sown after rice. Here Aerobic 1 exhibited the same character carried from days to 50% flowering with lowest possible maturity days (87). While maturity days in all accessions varied from 87 to 100.3 days (PK-8245-4). Similar results for maturity day’s impact on yield were also observed by previous scientists (6).
Plant height
The short statured rice crop is the ideal for weather conditions in Pakistan and plant height is also the main focal point of breeding programs while among the six lines, RSP-4 showed the least plant height (102.6 cm). The findings were also supported by previous scientists (5, 11).
Productive tillers per plant
In general more the productive tillers per plant, the more will be paddy yield. The character of productive tillers per plant varied in between 13.03 and 17.53. Among the lines RSP-3 gave the more productive tillers per plant and PK 3445-3-2 gave the less number of productive tillers despite having the higher paddy yield. At the same time RSP-3 produced the shortest panicle (25.40 cm) among all, while PK 8245-4 displayed longest panicle (29.43 cm).
Grains per panicle
Perhaps the most important character having impact on paddy yield is the grains per panicle. The above assumption is made on the basis of linear behavior of PK 3445-3-2 having 211.7 grains per panicle and highest yield (7027 kg/ha). On the contrary RSP-4 shared the last place with IR-5 for the least grains per panicle (115.3)
Thousand grain weight
PK 3445-3-2 having higher paddy yield also have higher 1000 grain weight (24.22g) followed by RSP-3 (24.04g grains). Hence we can safely conclude that the lines with higher grains per panicle showed the less 1000 grain weight.
M. Riaz et al.
J. Agric. Res., 2014, 52(2)
172

Genetic criterion for selection of rice lines
J. Agric. Res., 2014, 52(2)
173
Paddy yield Our ultimate goal in crop improvement experiments is the paddy yield. PK 3445-3-2 gave higher average paddy yield (7027 kg/ha) while RSP-4 gave lowest paddy yield (5212 kg/ha). These results will be concluded concretely after correlation analysis.
Correlation
Association among various characteristics are the results of complex genetic interaction resulting from pleiotropic effects of genes, chromosomal segmental linkage, and existence of two genes on the same chromosome or because of environmental impacts. Conversely, correlation analysis is applied to find the intensity of relationship between the two traits (Table 3). Table 3. Phenotypic correlation coefficients of paddy yield and its contributing
components in rice.
Characters Days to
50% flowering
Maturity days
Plant height
Productive tillers/ plant
Panicle length
Grains per
panicle
1000 grain
weight
Maturity days 0.884 ***
Plant height 0.385 0.266
Productive tiller/plant 0.267 0.197 -0.411*
Panicle length -0.032 0.130 0.277 -0.242
Grains per panicle 0.214 0.042 0.628** -0.211 -0.248
1000 grain weight -0.443* -0.376 -0.472* 0.088 0.274 -0.800***
Paddy yield 0.062 0.051 0.088 -0.137 -0.464* 0.305 -0.335
*Stands for significant, **for highly significant and ***for extremely statistically significant (Two-tailed P value is less than 0.0001).
Table 3 showed that extremely significant positive correlation was present in between days to 50% flowering and maturity days. The similar extremely significant behavior was observed in case of 1000 grain weight and grains per panicle with negative correlation. Highly significant positive correlation was observed between plant height and grains per panicle. At the same time significant but negative correlation was observed among plant height and productive tillers per plant, days to 50% flowering and 1000 grain weight, plant height and 1000 grain weight, panicle length and paddy yield. The results are in conformity with the earlier findings (13).The experimental positive correlation of grain yield with various traits was supported in earlier studies (9, 10). These results help us to devise the effective selection criterion for high yielding medium grain rice genotypes. We can conclude with certainty that lines with shorter panicles, having higher

M. Riaz et al.
J. Agric. Res., 2014, 52(2)
174
grains per panicle and less grain weight are ideal for selection as future varieties. Among the lines under study, PK 3445-3-2 has all three characters and thus will be selection of choice for future experiments Akhtar et al., also reported that number of grains per panicle, 1000 grain weight and days to maturity are important plant traits which should be considered when any breeding programme for higher paddy yield is to be planned (1).
REFERENCES
1. Akhtar, N; M. F. Nazir; A. Rabnawaz; T. Mahmood; M. E. Safdar; M. Asif and A. Rehman.2011.Estimation of heritability, correlation and path coefficient analysis in fine grain rice (Oryza sativa L.). J. Anim. & Plant Sci. 21(4):660-64.
2. Amin, E. A.1979. Correlation and path coefficient analysis in some short stature rice cultivars and strains. Inter Comission Newsletter, 28; 19-21.
3. Anon. 2012. Economic Survey of Pakistan, Finance Division, Economic Advisor’s Wing, Islamabad, Govt. of Pakistan.
4. Anon. 2012. Pakistan Bureau of Statistics, Economic Affairs Division, Central Statistical Office, Islamabad, Govt. of Pakistan.
5. Girish,T. N; T.M. Gireesha; M.G. Vaishali; B. G. Hanamaredday and S. Hitalmani. 2006. Response of a new IR50/Morobrekan recombinant inbred population of rice (Oryza sativa L.) from an indica and japonica cross for growth and yield traits under aerobic conditions. J. Euphytica, 152(2):149-61.
6. Habib, S. H, M. K. Bashar, M. Khalequzzaman; M. S. Ahmed and E.S.M.H. Rashid.2005. Genetic analysis and morphological selection criteria for traditional Broin Bangaladesh rice germplasms. J. Biol. Sci., 5(3):315-18.
7. McHugh, M. L. (2008). Standard error: meaning and interpretation. Biochemia Medica. 18(1):7-13.
8. Oad, F.C; M.A. Samo, Zia-UL-Hassan, P. Cruz and N.L. Oad.2002. Correlation and path analysis of quantitative characters of rice ratoon cultivars and advance lines. International J. Agri. & Biol., 4(2):204-7.
9. Rao, S. S. and M.A. Shrivastava.1999. Association among yield attributes in upland rice. Oryza 36:13-15.
10. Rajeshwari, S. and N. Nadarajan. 2004. Correlation between yield and yield components in rice (Oryza sativa L.) Agri. Sci. Dig., 24:280-82.

Genetic criterion for selection of rice lines
J. Agric. Res., 2014, 52(2)
175
11. Rasheed, M. S; H.A. Sadaqat and M. Babar. 2002. Correlation and path coefficient analysis for yield and its components in rice. Asian J. Pl. Sci.,1(3):241-44.
12. Steel, R. G. D; J. H. Torrie and D. A. Dickey. 1997. Principles and Procedures for Statistics. McGraw Hill Book Co., New York, USA. 4(3):341-43.
13. Zahid, M. A., M. Akhtar, M. Sabir, Z. Manzoor and T. Awan. 2006. Correlation and path analysis studies of yield and economic traits in Basmati rice. Asian J. Pl. Sci., 5(4):643-45.
14. Zulqarnain, H; A.S. Khan and S. Zia. Correlation and path coefficient analysis of yield components in rice (Oryza sativa L.) under simulated drought stress condition. J. Agric. & Environ. Sci., 12 (1):100-104.