General Project Finance Rating Methodology
57
Contacts Carlos Terré Managing Director +49-30-27891-242 [email protected] Aaron Konrad Director +49-30-27891-307 [email protected] Torsten Schellscheidt Executive Director +49-40-524724-100 [email protected] General Project Finance Rating Methodology Project Finance 16 November 2020
Transcript of General Project Finance Rating Methodology
Contacts
Carlos Terré
Managing Director
+49-30-27891-242
Aaron Konrad
Director
+49-30-27891-307
Torsten Schellscheidt
Executive Director
+49-40-524724-100
General Project Finance Rating Methodology Project Finance
16 November 2020
General Project Finance Rating Methodology Project Finance
16 November 2020
2/57
Table of Contents 1 Areas of application .................................................................................................................................................... 3 2 Rating definitions ....................................................................................................................................................... 3 3 Methodology highlights .............................................................................................................................................. 3 4 Overview of analytical framework .............................................................................................................................. 4 5 Expected information and its adequacy .................................................................................................................... 4 5.1 Historical information .................................................................................................................................................................................... 5 5.2 Information checks ....................................................................................................................................................................................... 5
6 Understanding the project and its economic fundamentals ..................................................................................... 6 7 Determination of the expected loss for the investor ................................................................................................. 6 7.1 Project-default definition ............................................................................................................................................................................... 7 7.2 Project credit-impairment events .................................................................................................................................................................. 7 7.3 Likelihood of credit-impairment events......................................................................................................................................................... 8 7.4 Severity of credit-impairment events .......................................................................................................................................................... 15 7.5 Expected loss calculation and quantitative rating indication ...................................................................................................................... 25 7.6 Probability of hard default and hard recovery rate ..................................................................................................................................... 25
8 Counterparty risk ...................................................................................................................................................... 25 9 Legal analysis ........................................................................................................................................................... 25 10 Sovereign risk ........................................................................................................................................................... 26 11 Rating sensitivity ...................................................................................................................................................... 26 12 Consideration of environmental, social and governance factors ........................................................................... 26 13 Monitoring ................................................................................................................................................................. 26 14 Rating model ............................................................................................................................................................. 27 Appendix I PD and EL strengths ........................................................................................................................................... 28 Appendix II Technical note on the expected loss framework .............................................................................................. 29 Appendix III Technical note on timely payment ................................................................................................................... 32 Appendix IV Analytical guidelines for scoring risk factors ................................................................................................. 33 Sponsors’ experience, track record and importance of the project........................................................................................................................... 33 Construction risk ........................................................................................................................................................................................................ 33 Operational risk ......................................................................................................................................................................................................... 36 Revenue risk .............................................................................................................................................................................................................. 38 Financial strength ...................................................................................................................................................................................................... 40 Project structure and other risks ............................................................................................................................................................................... 42
Appendix V Quantitative processing of risk factor scores .................................................................................................. 43 Appendix VI Analytical guidelines for scoring recovery risk factors .................................................................................. 44 Project security .......................................................................................................................................................................................................... 44 Collateral enforceability ............................................................................................................................................................................................. 44 Recovery enhancements, termination provisions ..................................................................................................................................................... 44 Fundamental economic value of the project ............................................................................................................................................................. 44
Appendix VII Standard project-level recovery assumptions ............................................................................................... 45 Recovery distributions for lower asset-value resilience under stress ....................................................................................................................... 45 Recovery distributions for higher asset-value resilience under stress ...................................................................................................................... 47
Appendix VIII Example case study ....................................................................................................................................... 49 Appendix IX Probability of hard default and hard recovery rate ......................................................................................... 55 Appendix X ESG risk assessment ........................................................................................................................................ 56 Project ESG Grid ....................................................................................................................................................................................................... 56
Scope Ratings GmbH ............................................................................................................................................................ 57
General Project Finance Rating Methodology Project Finance
16 November 2020
3/57
1 Areas of application
This document describes our methodology for the rating of all types of infrastructure and project finance vehicles and instruments,
referred to generally throughout this document as project finance credit exposures. Project finance instruments are typically issued
by a special-purpose vehicle (SPV) or dedicated corporate to finance the construction, purchase, or exploitation of a specific real
asset. The reader can learn about project finance and relevant considerations regarding project finance credit analysis in our
special report, General Project Finance: Analytical Considerations, freely available at www.scoperatings.com.
This methodology is not applicable to asset-based financing transactions where credit losses primarily depend on the value of the
underlying asset in a relatively liquid market, a condition generally not applicable to project finance. For example, this methodology
does not cover aviation finance or real estate asset finance (i.e. real estate development and real estate investment activit ies).
We focus primarily on European project finance, but this methodology can also be applied to other non-European or global
transactions.
This methodology will be applied in conjunction with our General Structured Finance Rating Methodology when portfolios of credit
exposures to project finance are securitised in a SPV.
2 Rating definitions
Our project finance credit ratings constitute a forward-looking opinion on relative credit risk. The ratings are expressed using a
scale from AAA to C, with additional ‘+’ and ‘-’ subcategories from AA to B, resulting in a total of 20 levels. We also signal a failure
to pay with a ‘D’ flag to indicate the defaulted status of the rating. A rating reflects the expected loss associated with payments
contractually promised under a credit exposure to project finance, by its legal maturity, accounting for the time value of money at
the rate promised to the investor.
For our quantitative analysis, we calculate an instrument’s expected loss over an expected risk horizon, with the result
benchmarked against our idealised expected loss table. The table is available on www.scoperatings.com1.
The expected loss reflects, in turn: i) the likelihood of a credit-impairment event reducing payments promised to the investor; and
ii) the loss severity expected upon a credit-impairment event. We assess the likelihood of default and will limit the rating if an
instrument has a very low expected loss and a very high default likelihood. We apply the timely payment standards highlighted in
Appendix III when assigning expected loss ratings under this methodology. For more details, refer to the technical notes on the
expected loss framework and timely payment under Appendix II and Appendix III.
3 Methodology highlights
Expected loss. Our project finance ratings reflect the expected loss on a debt instrument issued by a project finance vehicle. This
rating methodology pays special attention to the analysis of the severity to the investor by estimating recovery rates under diverse
credit-impairment events.
Any level of seniority. We can analyse exposures to project finance of any level of seniority which can be attached to a contractual
promise to investors (i.e. full borrower exposures, or senior, mezzanine, and even first-loss tranches – provided a contractual
promise is available).
Transparent and comprehensive framework. We systematically analyse the five risk areas of project finance. These areas
comprise 23 risk factors and four recovery risk factors that contribute to credit losses in addition to the characteristics of the promise
to the investor.
Credit differentiation. Our analysis relies on input assumptions which are instrument- and/or project-specific. We use a
fundamental bottom-up approach to capture the credit and market risks of the specific project credit exposure being rated, all of
which are considered in the context of the sponsor and the relevant jurisdiction. We assess the elements of credit risk in its analysis
of legal and counterparty considerations. This approach allows for larger rating and project differentiation, even when considering
projects in the same sector and country.
1 Our website provides Scope’s idealised EL and PD tables in Excel format, and also the document Idealised expected loss and default probability tables explained. The
idealised EL tables represent a common benchmark for all secured asset classes at Scope.
General Project Finance Rating Methodology Project Finance
16 November 2020
4/57
No mechanistic link to sovereign credit quality. We do not mechanistically limit the maximum rating a credit exposure to project
finance can achieve as a function of the credit quality of the country of the project. Instead, we assess convertibility risk and the
risk of institutional meltdown in the context of the tenor of each rated tranche, as well as factor macroeconomics into the ratings.
Economic fundamentals. We analyse the project’s economic fundamentals and the competitiveness of its output because they
represent key drivers of credit performance together with the strength of the financial structure, and influence the framework of
incentives of the project’s different stakeholders.
Alignment of interests. We analyse the relationships and incentives of the different stakeholders of a project to build a view on
the ‘soft’ components of the contractual framework. We also analyse how and to what extent the interests of the sponsor and other
stakeholders of the project are aligned with those of the investor. The sponsor’s interest in the project is an important driver of the
sponsor’s expected performance.
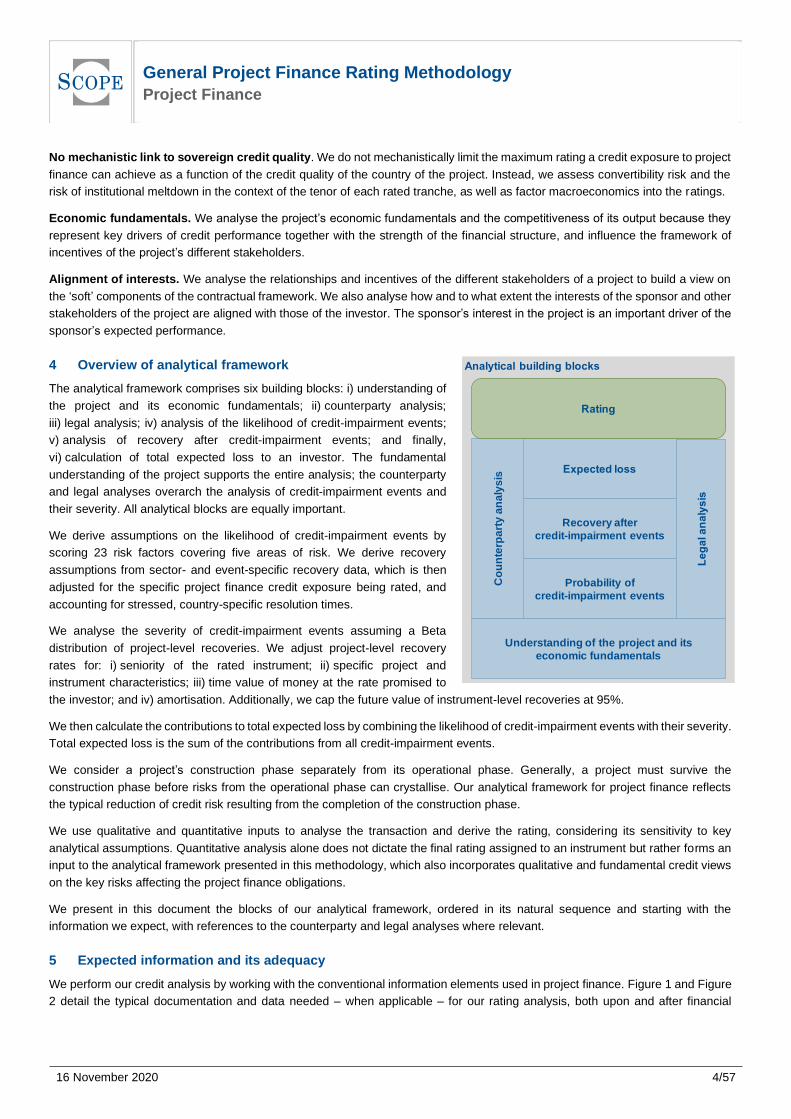
4 Overview of analytical framework
The analytical framework comprises six building blocks: i) understanding of
the project and its economic fundamentals; ii) counterparty analysis;
iii) legal analysis; iv) analysis of the likelihood of credit-impairment events;
v) analysis of recovery after credit-impairment events; and finally,
vi) calculation of total expected loss to an investor. The fundamental
understanding of the project supports the entire analysis; the counterparty
and legal analyses overarch the analysis of credit-impairment events and
their severity. All analytical blocks are equally important.
We derive assumptions on the likelihood of credit-impairment events by
scoring 23 risk factors covering five areas of risk. We derive recovery
assumptions from sector- and event-specific recovery data, which is then
adjusted for the specific project finance credit exposure being rated, and
accounting for stressed, country-specific resolution times.
We analyse the severity of credit-impairment events assuming a Beta
distribution of project-level recoveries. We adjust project-level recovery
rates for: i) seniority of the rated instrument; ii) specific project and
instrument characteristics; iii) time value of money at the rate promised to
the investor; and iv) amortisation. Additionally, we cap the future value of instrument-level recoveries at 95%.
We then calculate the contributions to total expected loss by combining the likelihood of credit-impairment events with their severity.
Total expected loss is the sum of the contributions from all credit-impairment events.
We consider a project’s construction phase separately from its operational phase. Generally, a project must survive the
construction phase before risks from the operational phase can crystallise. Our analytical framework for project finance reflects
the typical reduction of credit risk resulting from the completion of the construction phase.
We use qualitative and quantitative inputs to analyse the transaction and derive the rating, considering its sensitivity to key
analytical assumptions. Quantitative analysis alone does not dictate the final rating assigned to an instrument but rather forms an
input to the analytical framework presented in this methodology, which also incorporates qualitative and fundamental credit views
on the key risks affecting the project finance obligations.
We present in this document the blocks of our analytical framework, ordered in its natural sequence and starting with the
information we expect, with references to the counterparty and legal analyses where relevant.
5 Expected information and its adequacy
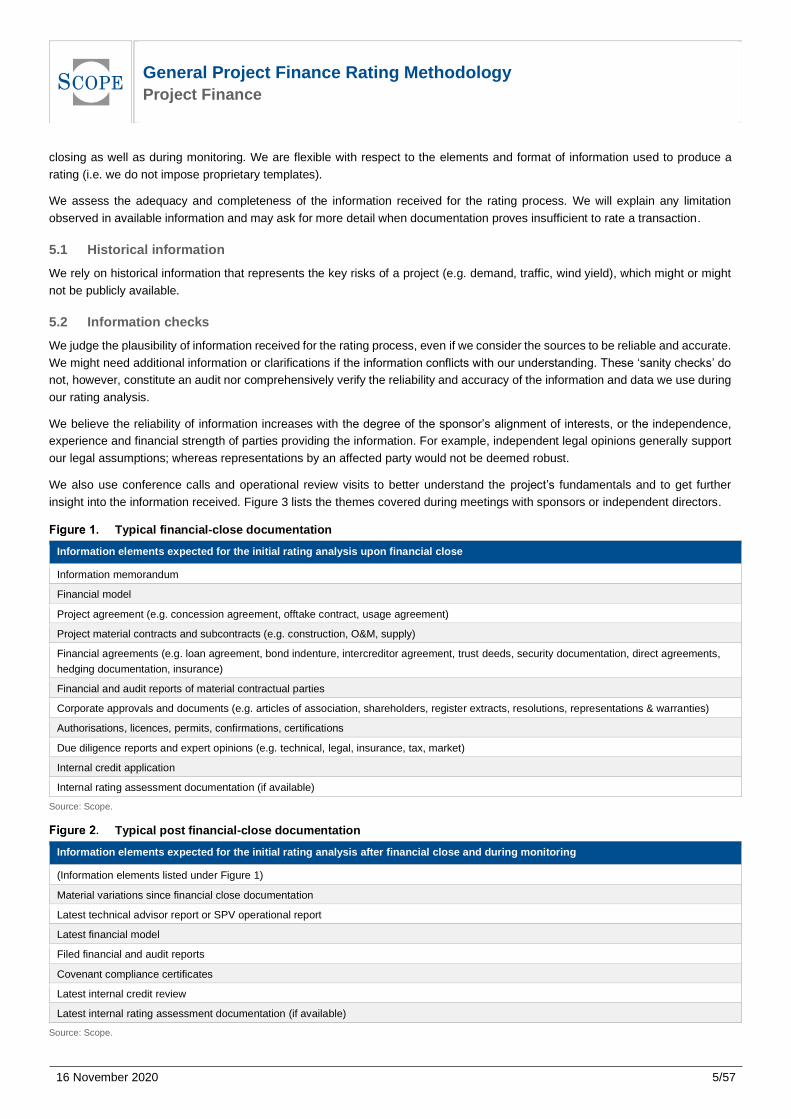
We perform our credit analysis by working with the conventional information elements used in project finance. Figure 1 and Figure
2 detail the typical documentation and data needed – when applicable – for our rating analysis, both upon and after financial
Probability of
credit-impairment events
Understanding of the project and its
economic fundamentals
Recovery after
credit-impairment events
Co
un
terp
art
y a
na
lys
is
General Project Finance Rating Methodology Project Finance
16 November 2020
5/57
closing as well as during monitoring. We are flexible with respect to the elements and format of information used to produce a
rating (i.e. we do not impose proprietary templates).
We assess the adequacy and completeness of the information received for the rating process. We will explain any limitation
observed in available information and may ask for more detail when documentation proves insufficient to rate a transaction.
5.1 Historical information
We rely on historical information that represents the key risks of a project (e.g. demand, traffic, wind yield), which might or might
not be publicly available.
5.2 Information checks
We judge the plausibility of information received for the rating process, even if we consider the sources to be reliable and accurate.
We might need additional information or clarifications if the information conflicts with our understanding. These ‘sanity checks’ do
not, however, constitute an audit nor comprehensively verify the reliability and accuracy of the information and data we use during
our rating analysis.
We believe the reliability of information increases with the degree of the sponsor’s alignment of interests, or the independence,
experience and financial strength of parties providing the information. For example, independent legal opinions generally support
our legal assumptions; whereas representations by an affected party would not be deemed robust.
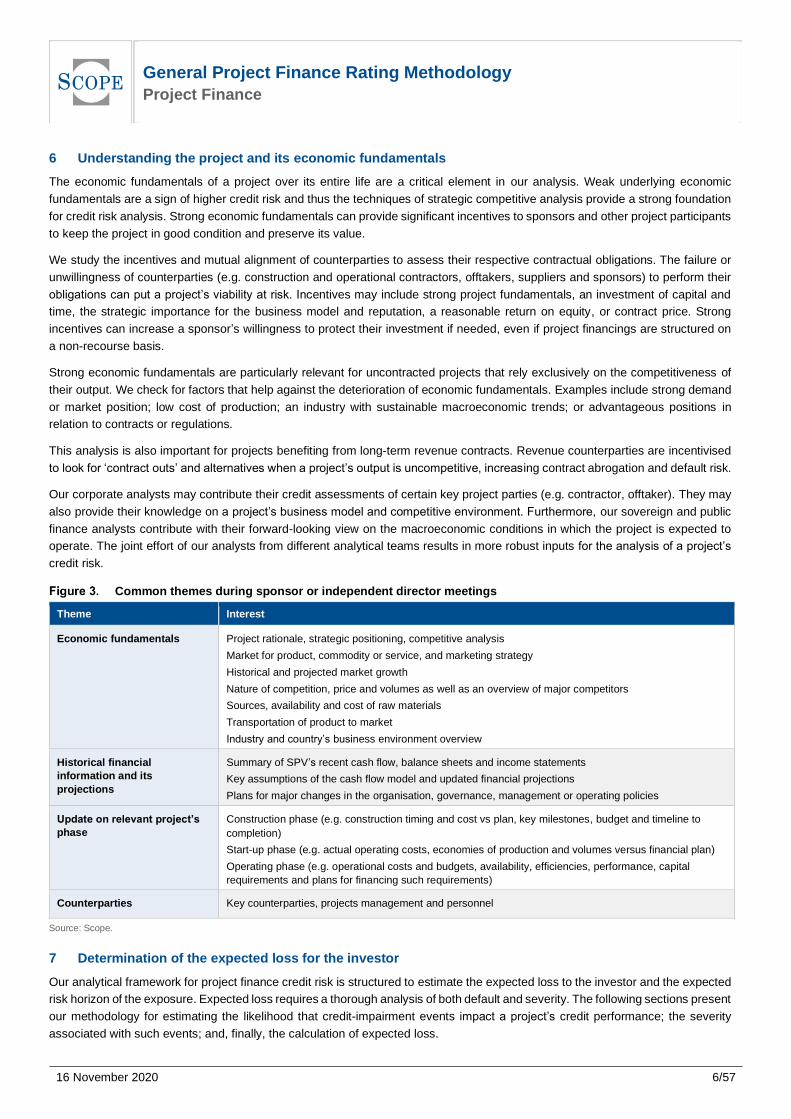
We also use conference calls and operational review visits to better understand the project’s fundamentals and to get further
insight into the information received. Figure 3 lists the themes covered during meetings with sponsors or independent directors.
Typical financial-close documentation
Information elements expected for the initial rating analysis upon financial close
Information memorandum
Financial model
Project agreement (e.g. concession agreement, offtake contract, usage agreement)
Project material contracts and subcontracts (e.g. construction, O&M, supply)
Financial agreements (e.g. loan agreement, bond indenture, intercreditor agreement, trust deeds, security documentation, direct agreements,
hedging documentation, insurance)
Financial and audit reports of material contractual parties
Corporate approvals and documents (e.g. articles of association, shareholders, register extracts, resolutions, representations & warranties)
Authorisations, licences, permits, confirmations, certifications
Due diligence reports and expert opinions (e.g. technical, legal, insurance, tax, market)
Internal credit application
Internal rating assessment documentation (if available)
Source: Scope.
Typical post financial-close documentation
Information elements expected for the initial rating analysis after financial close and during monitoring
(Information elements listed under Figure 1)
Material variations since financial close documentation
Latest technical advisor report or SPV operational report
Latest financial model
Filed financial and audit reports
Covenant compliance certificates
Latest internal credit review
Latest internal rating assessment documentation (if available)
Source: Scope.
General Project Finance Rating Methodology Project Finance
16 November 2020
6/57
6 Understanding the project and its economic fundamentals
The economic fundamentals of a project over its entire life are a critical element in our analysis. Weak underlying economic
fundamentals are a sign of higher credit risk and thus the techniques of strategic competitive analysis provide a strong foundation
for credit risk analysis. Strong economic fundamentals can provide significant incentives to sponsors and other project participants
to keep the project in good condition and preserve its value.
We study the incentives and mutual alignment of counterparties to assess their respective contractual obligations. The failure or
unwillingness of counterparties (e.g. construction and operational contractors, offtakers, suppliers and sponsors) to perform their
obligations can put a project’s viability at risk. Incentives may include strong project fundamentals, an investment of capital and
time, the strategic importance for the business model and reputation, a reasonable return on equity, or contract price. Strong
incentives can increase a sponsor’s willingness to protect their investment if needed, even if project financings are structured on
a non-recourse basis.
Strong economic fundamentals are particularly relevant for uncontracted projects that rely exclusively on the competitiveness of
their output. We check for factors that help against the deterioration of economic fundamentals. Examples include strong demand
or market position; low cost of production; an industry with sustainable macroeconomic trends; or advantageous positions in
relation to contracts or regulations.
This analysis is also important for projects benefiting from long-term revenue contracts. Revenue counterparties are incentivised
to look for ‘contract outs’ and alternatives when a project’s output is uncompetitive, increasing contract abrogation and default risk.
Our corporate analysts may contribute their credit assessments of certain key project parties (e.g. contractor, offtaker). They may
also provide their knowledge on a project’s business model and competitive environment. Furthermore, our sovereign and public
finance analysts contribute with their forward-looking view on the macroeconomic conditions in which the project is expected to
operate. The joint effort of our analysts from different analytical teams results in more robust inputs for the analysis of a project’s
credit risk.
Common themes during sponsor or independent director meetings
Theme Interest
Economic fundamentals Project rationale, strategic positioning, competitive analysis
Market for product, commodity or service, and marketing strategy
Historical and projected market growth
Nature of competition, price and volumes as well as an overview of major competitors
Sources, availability and cost of raw materials
Transportation of product to market
Industry and country’s business environment overview
Historical financial
information and its
projections
Summary of SPV’s recent cash flow, balance sheets and income statements
Key assumptions of the cash flow model and updated financial projections
Plans for major changes in the organisation, governance, management or operating policies
U r v r j ’
phase
Construction phase (e.g. construction timing and cost vs plan, key milestones, budget and timeline to
completion)
Start-up phase (e.g. actual operating costs, economies of production and volumes versus financial plan)
Operating phase (e.g. operational costs and budgets, availability, efficiencies, performance, capital
requirements and plans for financing such requirements)
Counterparties Key counterparties, projects management and personnel
Source: Scope.
7 Determination of the expected loss for the investor
Our analytical framework for project finance credit risk is structured to estimate the expected loss to the investor and the expected
risk horizon of the exposure. Expected loss requires a thorough analysis of both default and severity. The following sections present
our methodology for estimating the likelihood that credit-impairment events impact a project’s credit performance; the severity
associated with such events; and, finally, the calculation of expected loss.
General Project Finance Rating Methodology Project Finance
16 November 2020
7/57
7.1 Project-default definition
This methodology uses a broad definition of default. We estimate the likelihood of credit-impairment events with the potential to
disrupt the credit performance of any liability in a project. This is because our central expectation upon credit disruption is that the
project would be restructured and continue as a going concern. This soft probability-of-default framework is consequently
consistent with our recovery framework for project finance, which reflects the bar-belled (i.e. bimodal) nature of recoveries and the
possibility of the full performance of senior exposures throughout a resolution process.
The default of a project finance instrument may include one of the following: i) failure to pay in accordance with the instrument’s
terms and conditions; ii) the instrument’s restructuring or repurchase to avoid a payment failure, which ultimately leads to an
economic loss for the debt investor; and iii) an event of default under the instrument's terms that leads to an enforcement of the
security.
7.2 Project credit-impairment events
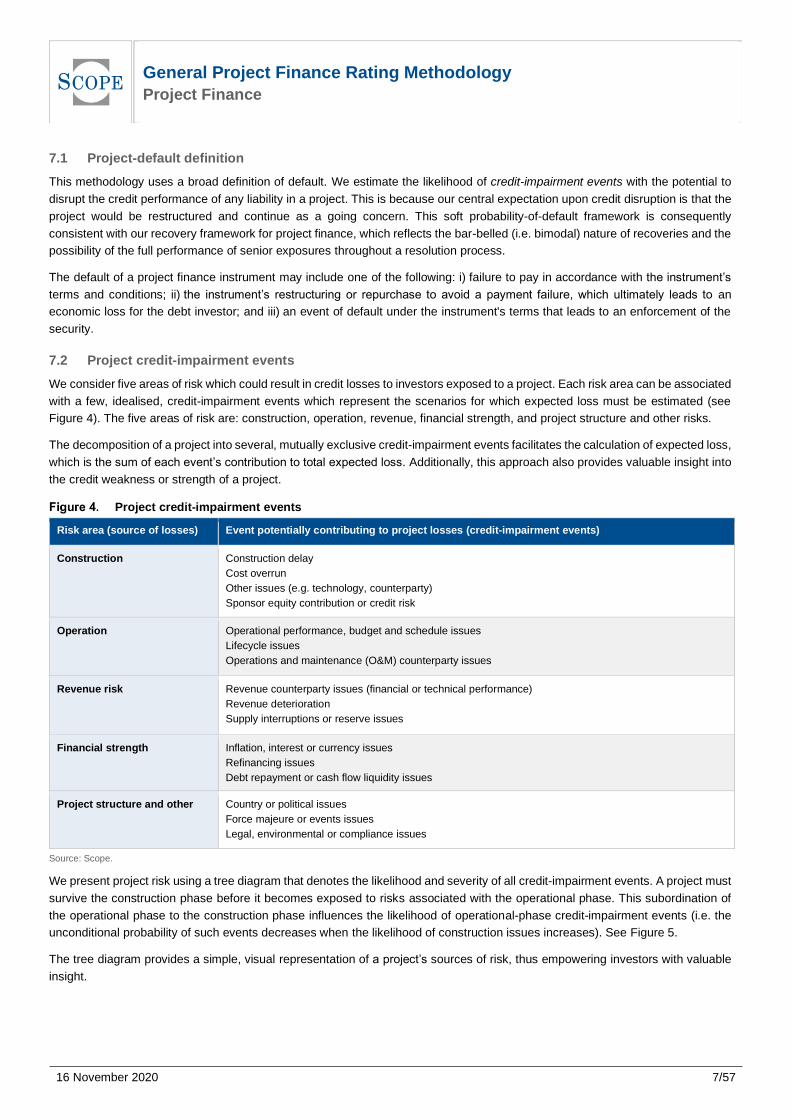
We consider five areas of risk which could result in credit losses to investors exposed to a project. Each risk area can be associated
with a few, idealised, credit-impairment events which represent the scenarios for which expected loss must be estimated (see
Figure 4). The five areas of risk are: construction, operation, revenue, financial strength, and project structure and other risks.
The decomposition of a project into several, mutually exclusive credit-impairment events facilitates the calculation of expected loss,
which is the sum of each event’s contribution to total expected loss. Additionally, this approach also provides valuable insight into
the credit weakness or strength of a project.
Project credit-impairment events
Risk area (source of losses) Event potentially contributing to project losses (credit-impairment events)
Construction Construction delay
Cost overrun
Other issues (e.g. technology, counterparty)
Sponsor equity contribution or credit risk
Operation Operational performance, budget and schedule issues
Lifecycle issues
Operations and maintenance (O&M) counterparty issues
Revenue risk Revenue counterparty issues (financial or technical performance)
Revenue deterioration
Supply interruptions or reserve issues
Financial strength Inflation, interest or currency issues
Refinancing issues
Debt repayment or cash flow liquidity issues
Project structure and other Country or political issues
Force majeure or events issues
Legal, environmental or compliance issues
Source: Scope.
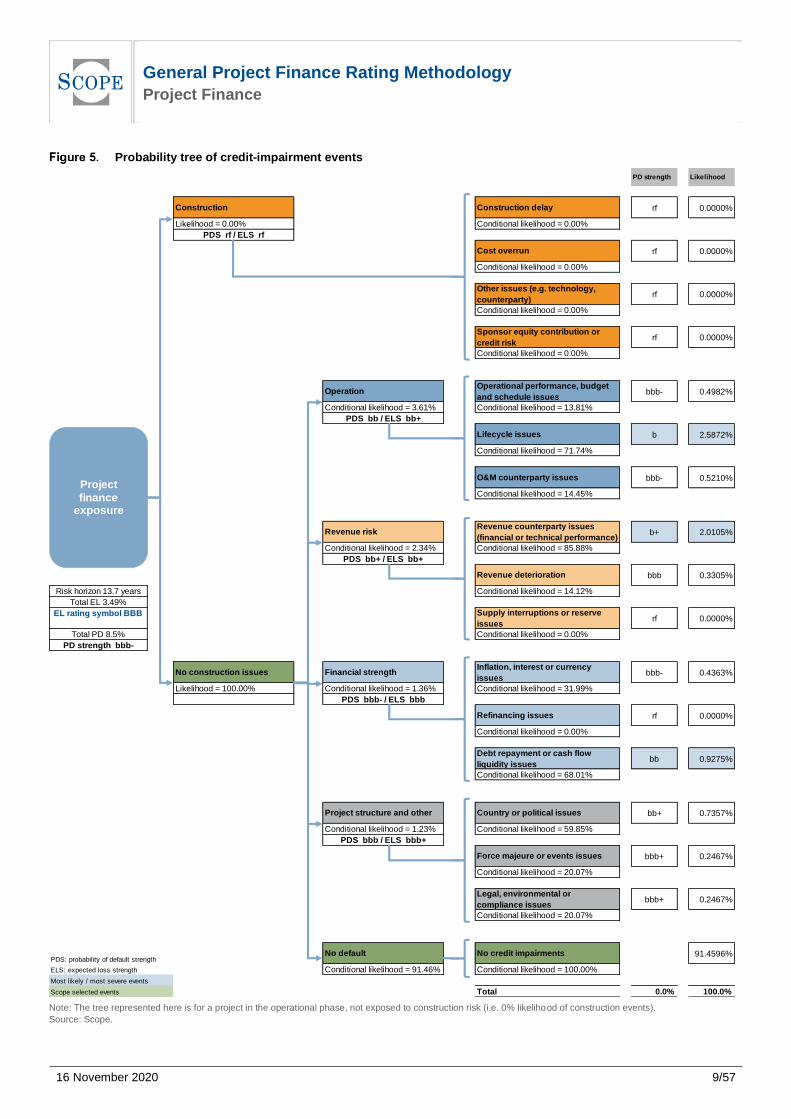
We present project risk using a tree diagram that denotes the likelihood and severity of all credit-impairment events. A project must
survive the construction phase before it becomes exposed to risks associated with the operational phase. This subordination of
the operational phase to the construction phase influences the likelihood of operational-phase credit-impairment events (i.e. the
unconditional probability of such events decreases when the likelihood of construction issues increases). See Figure 5.
The tree diagram provides a simple, visual representation of a project’s sources of risk, thus empowering investors with valuable
insight.

General Project Finance Rating Methodology Project Finance
16 November 2020
8/57
7.3 Likelihood of credit-impairment events
This methodology analyses the likelihood of 16 possible events associated with the five areas of risk. These events represent
default-like situations which could impair the project’s credit performance in relation to the rated credit exposure.
7.3.1 Risk factors contributing to project risk
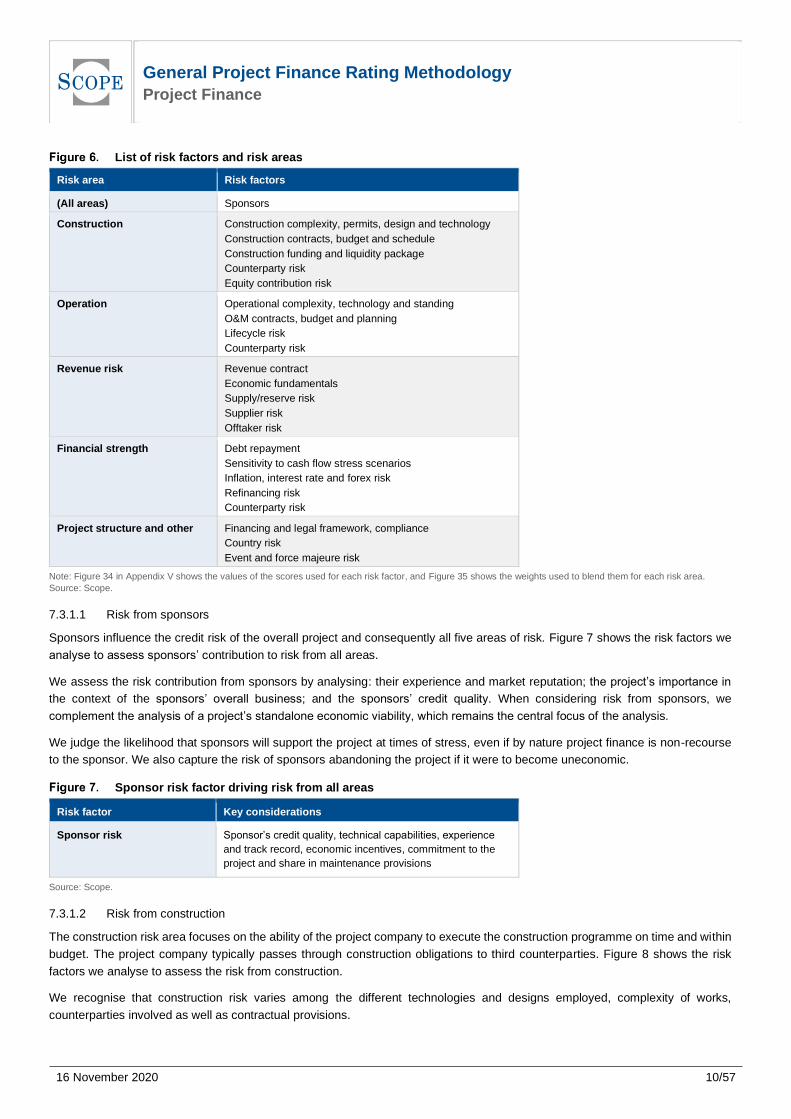
We consider 23 risk factors that contribute to a project’s total credit risk and derive the likelihood of credit-impairment events.
These risk factors are categorised in the same five risk areas that group credit-impairment events, with the risk contribution from
sponsors impacting all five areas of risk. Figure 6 summarises the list of factors and areas of risk, which are described in more
detail in the following subsections.
We assess the risk contribution of each risk factor using a scoring model, in the context of the credit exposure being considered
(i.e. instrument or project). The scores range from ‘very low (contribution to credit risk)’ to ‘very high (contribution to credit risk)’.
This enables us to differentiate between projects. Appendix IV contains analytical guidelines designed to ensure consistency when
assessing the contribution of the different risk factors to total risk.
The likelihood of a given risk area triggering a credit-impairment event is derived from the blending of the scores of the different
risk factors, using the values and weights shown in Appendix V. In this way, the probability calculated for each risk area takes into
account the risk horizon of the exposure. The total likelihood of a credit impairment in any risk area is split among the corresponding
credit-impairment events also on the basis of the score values of the risk factors.
In addition to the 23 risk factors, we also consider various forms of timely and full credit enhancement (such as government support,
sponsored liquidity lines, monoline wraps) to adjust the likelihood of project events and their severity.
General Project Finance Rating Methodology Project Finance
16 November 2020
9/57
Probability tree of credit-impairment events
Note: The tree represented here is for a project in the operational phase, not exposed to construction risk (i.e. 0% likelihood of construction events).
Source: Scope.
PD strength Likelihood
Construction Construction delay rf 0.0000%
Likelihood = 0.00% Conditional likelihood = 0.00%
PDS rf / ELS rf
Cost overrun rf 0.0000%
Conditional likelihood = 0.00%
Other issues (e.g. technology,
counterparty)rf 0.0000%
Conditional likelihood = 0.00%
Sponsor equity contribution or
credit riskrf 0.0000%
Conditional likelihood = 0.00%
OperationOperational performance, budget
and schedule issuesbbb- 0.4982%
Conditional likelihood = 3.61% Conditional likelihood = 13.81%
PDS bb / ELS bb+
Lifecycle issues b 2.5872%
Conditional likelihood = 71.74%
O&M counterparty issues bbb- 0.5210%
Conditional likelihood = 14.45%
Revenue riskRevenue counterparty issues
(financial or technical performance)b+ 2.0105%
Conditional likelihood = 2.34% Conditional likelihood = 85.88%
PDS bb+ / ELS bb+
Revenue deterioration bbb 0.3305%
Risk horizon 13.7 years Conditional likelihood = 14.12%
Total EL 3.49%
EL rating symbol BBB Supply interruptions or reserve
issuesrf 0.0000%
Total PD 8.5% Conditional likelihood = 0.00%
PD strength bbb-
No construction issues Financial strengthInflation, interest or currency
issuesbbb- 0.4363%
Likelihood = 100.00% Conditional likelihood = 1.36% Conditional likelihood = 31.99%
PDS bbb- / ELS bbb
Refinancing issues rf 0.0000%
Conditional likelihood = 0.00%
Debt repayment or cash flow
liquidity issuesbb 0.9275%
Conditional likelihood = 68.01%
Project structure and other Country or political issues bb+ 0.7357%
Conditional likelihood = 1.23% Conditional likelihood = 59.85%
PDS bbb / ELS bbb+
Force majeure or events issues bbb+ 0.2467%
Conditional likelihood = 20.07%
Legal, environmental or
compliance issuesbbb+ 0.2467%
Conditional likelihood = 20.07%
PDS: probability of default strengthNo default No credit impairments 91.4596%
ELS: expected loss strength Conditional likelihood = 91.46% Conditional likelihood = 100.00%
Most likely / most severe events
Scope selected events Total 0.0% 100.0%
Project
finance exposure
General Project Finance Rating Methodology Project Finance
16 November 2020
10/57
List of risk factors and risk areas
Risk area Risk factors
(All areas) Sponsors
Construction Construction complexity, permits, design and technology
Construction contracts, budget and schedule
Construction funding and liquidity package
Counterparty risk
Equity contribution risk
Operation Operational complexity, technology and standing
O&M contracts, budget and planning
Lifecycle risk
Counterparty risk
Revenue risk Revenue contract
Economic fundamentals
Supply/reserve risk
Supplier risk
Offtaker risk
Financial strength Debt repayment
Sensitivity to cash flow stress scenarios
Inflation, interest rate and forex risk
Refinancing risk
Counterparty risk
Project structure and other Financing and legal framework, compliance
Country risk
Event and force majeure risk
Note: Figure 34 in Appendix V shows the values of the scores used for each risk factor, and Figure 35 shows the weights used to blend them for each risk area.
Source: Scope.
7.3.1.1 Risk from sponsors
Sponsors influence the credit risk of the overall project and consequently all five areas of risk. Figure 7 shows the risk factors we
analyse to assess sponsors’ contribution to risk from all areas.
We assess the risk contribution from sponsors by analysing: their experience and market reputation; the project’s importance in
the context of the sponsors’ overall business; and the sponsors’ credit quality. When considering risk from sponsors, we
complement the analysis of a project’s standalone economic viability, which remains the central focus of the analysis.
We judge the likelihood that sponsors will support the project at times of stress, even if by nature project finance is non-recourse
to the sponsor. We also capture the risk of sponsors abandoning the project if it were to become uneconomic.
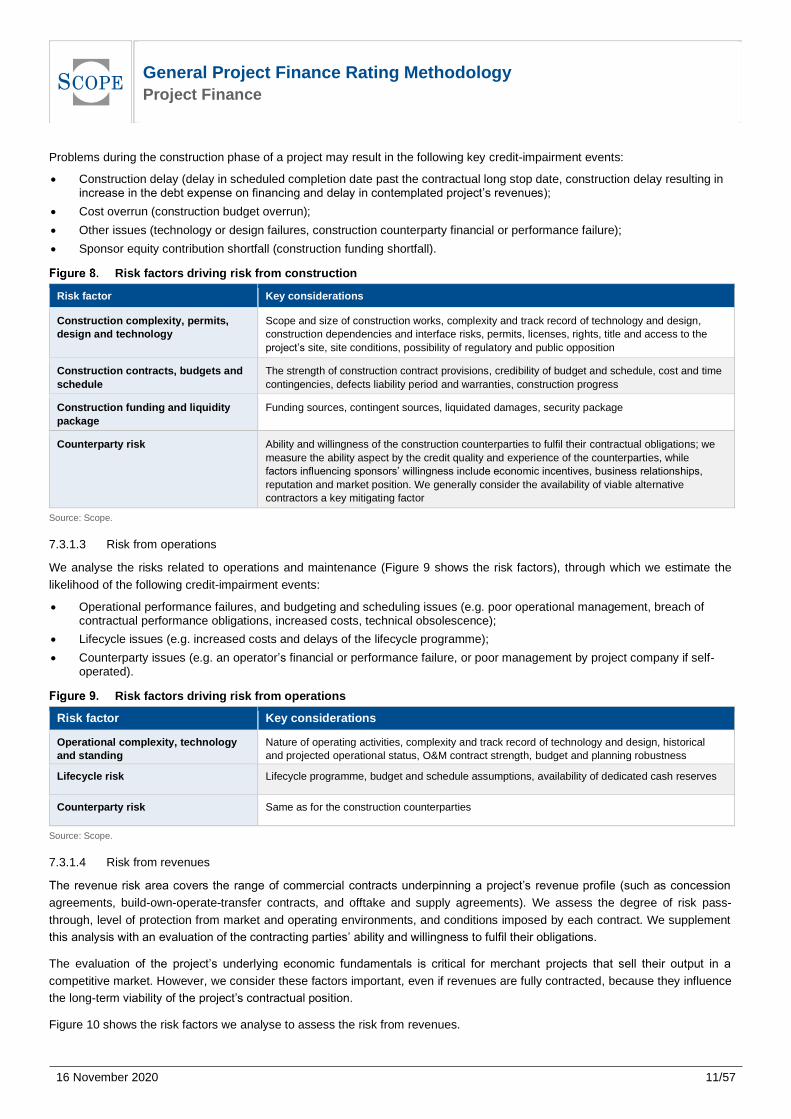
Sponsor risk factor driving risk from all areas
Risk factor Key considerations
Sponsor risk Sponsor’s credit quality, technical capabilities, experience
and track record, economic incentives, commitment to the
project and share in maintenance provisions
Source: Scope.
7.3.1.2 Risk from construction
The construction risk area focuses on the ability of the project company to execute the construction programme on time and within
budget. The project company typically passes through construction obligations to third counterparties. Figure 8 shows the risk
factors we analyse to assess the risk from construction.
We recognise that construction risk varies among the different technologies and designs employed, complexity of works,
counterparties involved as well as contractual provisions.
General Project Finance Rating Methodology Project Finance
16 November 2020
11/57
Problems during the construction phase of a project may result in the following key credit-impairment events:
• Construction delay (delay in scheduled completion date past the contractual long stop date, construction delay resulting in increase in the debt expense on financing and delay in contemplated project’s revenues);
• Cost overrun (construction budget overrun);
• Other issues (technology or design failures, construction counterparty financial or performance failure);
• Sponsor equity contribution shortfall (construction funding shortfall).
Risk factors driving risk from construction
Risk factor Key considerations
Construction complexity, permits,
design and technology
Scope and size of construction works, complexity and track record of technology and design,
construction dependencies and interface risks, permits, licenses, rights, title and access to the
project’s site, site conditions, possibility of regulatory and public opposition
Construction contracts, budgets and
schedule
The strength of construction contract provisions, credibility of budget and schedule, cost and time
contingencies, defects liability period and warranties, construction progress
Construction funding and liquidity
package
Funding sources, contingent sources, liquidated damages, security package
Counterparty risk Ability and willingness of the construction counterparties to fulfil their contractual obligations; we
measure the ability aspect by the credit quality and experience of the counterparties, while
factors influencing sponsors’ willingness include economic incentives, business relationships,
reputation and market position. We generally consider the availability of viable alternative
contractors a key mitigating factor
Source: Scope.
7.3.1.3 Risk from operations
We analyse the risks related to operations and maintenance (Figure 9 shows the risk factors), through which we estimate the
likelihood of the following credit-impairment events:
• Operational performance failures, and budgeting and scheduling issues (e.g. poor operational management, breach of contractual performance obligations, increased costs, technical obsolescence);
• Lifecycle issues (e.g. increased costs and delays of the lifecycle programme);
• Counterparty issues (e.g. an operator’s financial or performance failure, or poor management by project company if self-operated).
Risk factors driving risk from operations
Risk factor Key considerations
Operational complexity, technology
and standing
Nature of operating activities, complexity and track record of technology and design, historical
and projected operational status, O&M contract strength, budget and planning robustness
Lifecycle risk Lifecycle programme, budget and schedule assumptions, availability of dedicated cash reserves
Counterparty risk Same as for the construction counterparties
Source: Scope.
7.3.1.4 Risk from revenues
The revenue risk area covers the range of commercial contracts underpinning a project’s revenue profile (such as concession
agreements, build-own-operate-transfer contracts, and offtake and supply agreements). We assess the degree of risk pass-
through, level of protection from market and operating environments, and conditions imposed by each contract. We supplement
this analysis with an evaluation of the contracting parties’ ability and willingness to fulfil their obligations.
The evaluation of the project’s underlying economic fundamentals is critical for merchant projects that sell their output in a
competitive market. However, we consider these factors important, even if revenues are fully contracted, because they influence
the long-term viability of the project’s contractual position.
Figure 10 shows the risk factors we analyse to assess the risk from revenues.
General Project Finance Rating Methodology Project Finance
16 November 2020
12/57
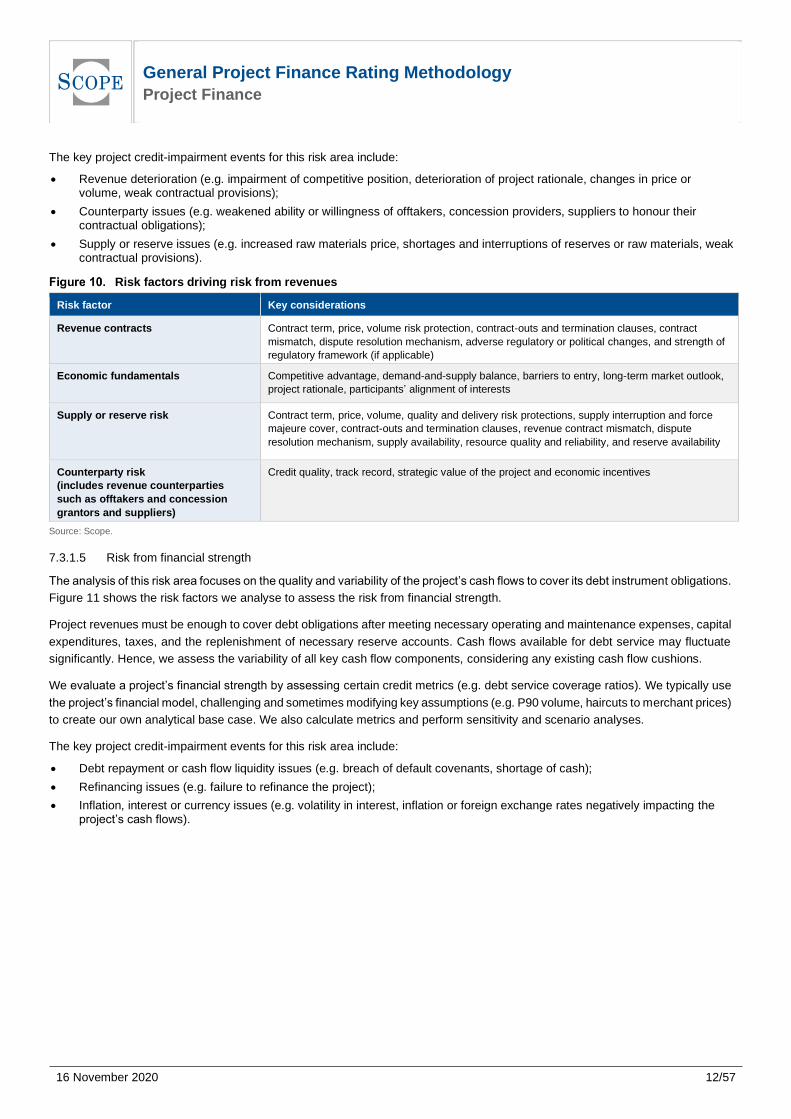
The key project credit-impairment events for this risk area include:
• Revenue deterioration (e.g. impairment of competitive position, deterioration of project rationale, changes in price or volume, weak contractual provisions);
• Counterparty issues (e.g. weakened ability or willingness of offtakers, concession providers, suppliers to honour their contractual obligations);
• Supply or reserve issues (e.g. increased raw materials price, shortages and interruptions of reserves or raw materials, weak contractual provisions).
Risk factors driving risk from revenues
Risk factor Key considerations
Revenue contracts Contract term, price, volume risk protection, contract-outs and termination clauses, contract
mismatch, dispute resolution mechanism, adverse regulatory or political changes, and strength of
regulatory framework (if applicable)
Economic fundamentals Competitive advantage, demand-and-supply balance, barriers to entry, long-term market outlook,
project rationale, participants’ alignment of interests
Supply or reserve risk Contract term, price, volume, quality and delivery risk protections, supply interruption and force
majeure cover, contract-outs and termination clauses, revenue contract mismatch, dispute
resolution mechanism, supply availability, resource quality and reliability, and reserve availability
Counterparty risk
(includes revenue counterparties
such as offtakers and concession
grantors and suppliers)
Credit quality, track record, strategic value of the project and economic incentives
Source: Scope.
7.3.1.5 Risk from financial strength
The analysis of this risk area focuses on the quality and variability of the project’s cash flows to cover its debt instrument obligations.
Figure 11 shows the risk factors we analyse to assess the risk from financial strength.
Project revenues must be enough to cover debt obligations after meeting necessary operating and maintenance expenses, capital
expenditures, taxes, and the replenishment of necessary reserve accounts. Cash flows available for debt service may fluctuate
significantly. Hence, we assess the variability of all key cash flow components, considering any existing cash flow cushions.
We evaluate a project’s financial strength by assessing certain credit metrics (e.g. debt service coverage ratios). We typically use
the project’s financial model, challenging and sometimes modifying key assumptions (e.g. P90 volume, haircuts to merchant prices)
to create our own analytical base case. We also calculate metrics and perform sensitivity and scenario analyses.
The key project credit-impairment events for this risk area include:
• Debt repayment or cash flow liquidity issues (e.g. breach of default covenants, shortage of cash);
• Refinancing issues (e.g. failure to refinance the project);
• Inflation, interest or currency issues (e.g. volatility in interest, inflation or foreign exchange rates negatively impacting the project’s cash flows).
General Project Finance Rating Methodology Project Finance
16 November 2020
13/57
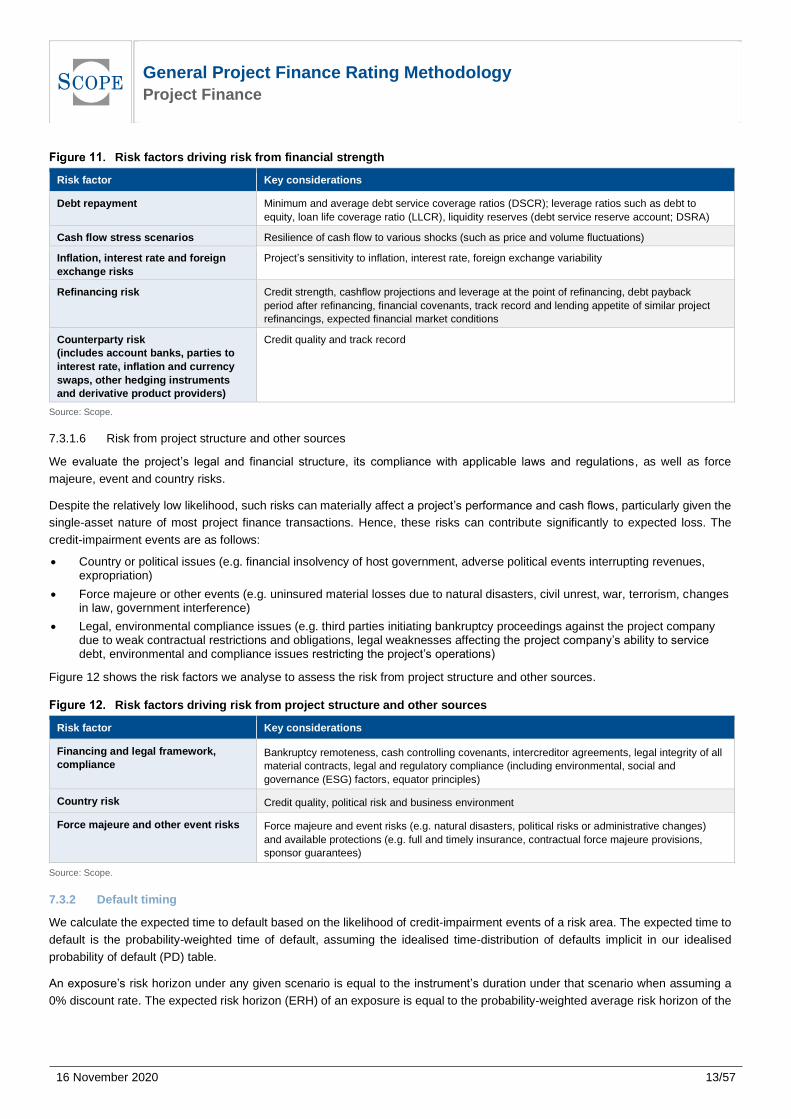
Risk factors driving risk from financial strength
Risk factor Key considerations
Debt repayment Minimum and average debt service coverage ratios (DSCR); leverage ratios such as debt to
equity, loan life coverage ratio (LLCR), liquidity reserves (debt service reserve account; DSRA)
Cash flow stress scenarios Resilience of cash flow to various shocks (such as price and volume fluctuations)
Inflation, interest rate and foreign
exchange risks
Project’s sensitivity to inflation, interest rate, foreign exchange variability
Refinancing risk Credit strength, cashflow projections and leverage at the point of refinancing, debt payback
period after refinancing, financial covenants, track record and lending appetite of similar project
refinancings, expected financial market conditions
Counterparty risk
(includes account banks, parties to
interest rate, inflation and currency
swaps, other hedging instruments
and derivative product providers)
Credit quality and track record
Source: Scope.
7.3.1.6 Risk from project structure and other sources
We evaluate the project’s legal and financial structure, its compliance with applicable laws and regulations, as well as force
majeure, event and country risks.
Despite the relatively low likelihood, such risks can materially affect a project’s performance and cash flows, particularly given the
single-asset nature of most project finance transactions. Hence, these risks can contribute significantly to expected loss. The
credit-impairment events are as follows:
• Country or political issues (e.g. financial insolvency of host government, adverse political events interrupting revenues, expropriation)
• Force majeure or other events (e.g. uninsured material losses due to natural disasters, civil unrest, war, terrorism, changes in law, government interference)
• Legal, environmental compliance issues (e.g. third parties initiating bankruptcy proceedings against the project company due to weak contractual restrictions and obligations, legal weaknesses affecting the project company’s ability to service debt, environmental and compliance issues restricting the project’s operations)
Figure 12 shows the risk factors we analyse to assess the risk from project structure and other sources.
Risk factors driving risk from project structure and other sources
Risk factor Key considerations
Financing and legal framework,
compliance Bankruptcy remoteness, cash controlling covenants, intercreditor agreements, legal integrity of all
material contracts, legal and regulatory compliance (including environmental, social and
governance (ESG) factors, equator principles)
Country risk Credit quality, political risk and business environment
Force majeure and other event risks Force majeure and event risks (e.g. natural disasters, political risks or administrative changes)
and available protections (e.g. full and timely insurance, contractual force majeure provisions,
sponsor guarantees)
Source: Scope.
7.3.2 Default timing
We calculate the expected time to default based on the likelihood of credit-impairment events of a risk area. The expected time to
default is the probability-weighted time of default, assuming the idealised time-distribution of defaults implicit in our idealised
probability of default (PD) table.
An exposure’s risk horizon under any given scenario is equal to the instrument’s duration under that scenario when assuming a
0% discount rate. The expected risk horizon (ERH) of an exposure is equal to the probability-weighted average risk horizon of the

General Project Finance Rating Methodology Project Finance
16 November 2020
14/57
instrument under all scenarios. Appendix II ‘Technical note on the expected loss framework’ shows how the risk horizon is
calculated.
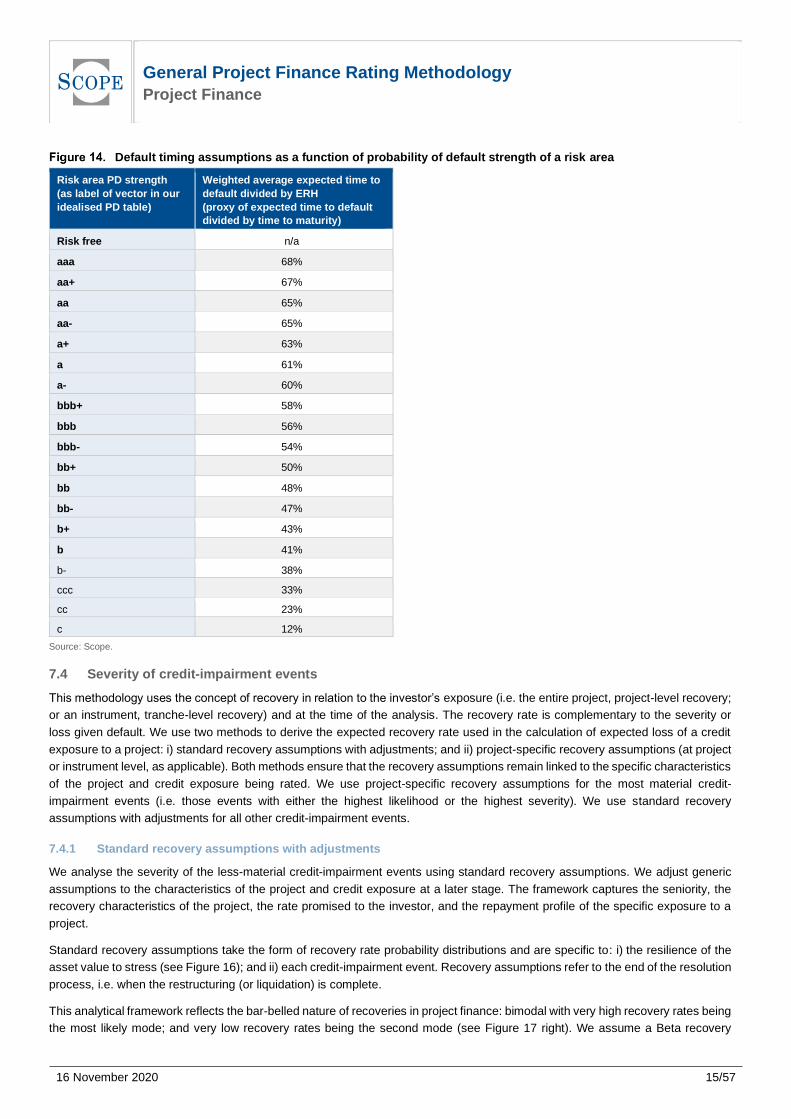
The expected weighted average time to default is to the expected time to default what the expected risk horizon is to the time to
maturity (see Figure 13). We use the ratios in Figure 14 to estimate the expected time to default and the expected weighted
average time to default of the credit exposure for each of the risk areas.
Derivation of the expected time to default
Source: Scope.
Expected time to default is used to determine the expected balance drop of the credit exposure and to adjust the recovery rate for
amortisation over the time the project is performing; the expected weighted average time to default concept is used to determine
the expected time to default, given the PD strength of each risk area. See section 7.4.1.6.
0%
10%
20%
30%
40%
50%
60%
70%
80%
90%
100%
0 5 10 15 20 25 30 35Time
A
AB
Outstanding balance
Bullet-equivalent balance
General Project Finance Rating Methodology Project Finance
16 November 2020
15/57
Default timing assumptions as a function of probability of default strength of a risk area
Risk area PD strength
(as label of vector in our
idealised PD table)
Weighted average expected time to
default divided by ERH
(proxy of expected time to default
divided by time to maturity)
Risk free n/a
aaa 68%
aa+ 67%
aa 65%
aa- 65%
a+ 63%
a 61%
a- 60%
bbb+ 58%
bbb 56%
bbb- 54%
bb+ 50%
bb 48%
bb- 47%
b+ 43%
b 41%
b- 38%
ccc 33%
cc 23%
c 12%
Source: Scope.
7.4 Severity of credit-impairment events
This methodology uses the concept of recovery in relation to the investor’s exposure (i.e. the entire project, project-level recovery;
or an instrument, tranche-level recovery) and at the time of the analysis. The recovery rate is complementary to the severity or
loss given default. We use two methods to derive the expected recovery rate used in the calculation of expected loss of a credit
exposure to a project: i) standard recovery assumptions with adjustments; and ii) project-specific recovery assumptions (at project
or instrument level, as applicable). Both methods ensure that the recovery assumptions remain linked to the specific characteristics
of the project and credit exposure being rated. We use project-specific recovery assumptions for the most material credit-
impairment events (i.e. those events with either the highest likelihood or the highest severity). We use standard recovery
assumptions with adjustments for all other credit-impairment events.
7.4.1 Standard recovery assumptions with adjustments
We analyse the severity of the less-material credit-impairment events using standard recovery assumptions. We adjust generic
assumptions to the characteristics of the project and credit exposure at a later stage. The framework captures the seniority, the
recovery characteristics of the project, the rate promised to the investor, and the repayment profile of the specific exposure to a
project.
Standard recovery assumptions take the form of recovery rate probability distributions and are specific to: i) the resilience of the
asset value to stress (see Figure 16); and ii) each credit-impairment event. Recovery assumptions refer to the end of the resolution
process, i.e. when the restructuring (or liquidation) is complete.
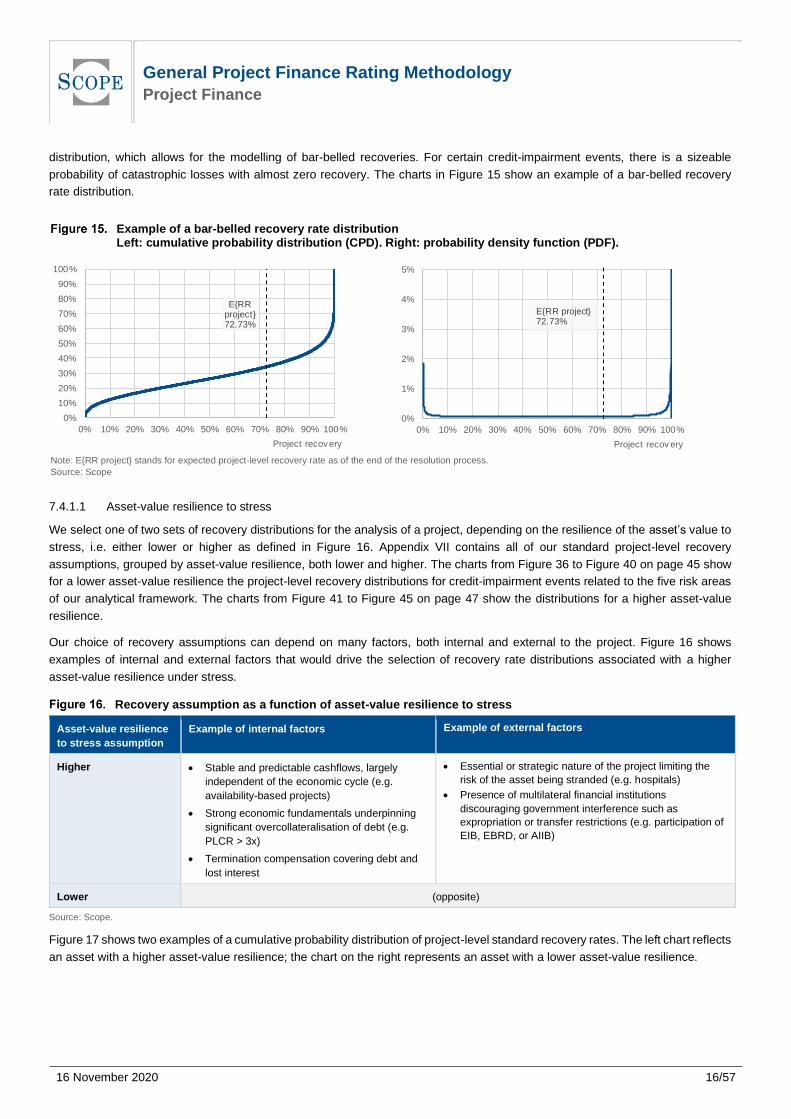
This analytical framework reflects the bar-belled nature of recoveries in project finance: bimodal with very high recovery rates being
the most likely mode; and very low recovery rates being the second mode (see Figure 17 right). We assume a Beta recovery
General Project Finance Rating Methodology Project Finance
16 November 2020
16/57
distribution, which allows for the modelling of bar-belled recoveries. For certain credit-impairment events, there is a sizeable
probability of catastrophic losses with almost zero recovery. The charts in Figure 15 show an example of a bar-belled recovery
rate distribution.
Example of a bar-belled recovery rate distribution Left: cumulative probability distribution (CPD). Right: probability density function (PDF).
Note: E{RR project} stands for expected project-level recovery rate as of the end of the resolution process.
Source: Scope
7.4.1.1 Asset-value resilience to stress
We select one of two sets of recovery distributions for the analysis of a project, depending on the resilience of the asset’s value to
stress, i.e. either lower or higher as defined in Figure 16. Appendix VII contains all of our standard project-level recovery
assumptions, grouped by asset-value resilience, both lower and higher. The charts from Figure 36 to Figure 40 on page 45 show
for a lower asset-value resilience the project-level recovery distributions for credit-impairment events related to the five risk areas
of our analytical framework. The charts from Figure 41 to Figure 45 on page 47 show the distributions for a higher asset-value
resilience.
Our choice of recovery assumptions can depend on many factors, both internal and external to the project. Figure 16 shows
examples of internal and external factors that would drive the selection of recovery rate distributions associated with a higher
asset-value resilience under stress.
Recovery assumption as a function of asset-value resilience to stress
Asset-value resilience
to stress assumption
Example of internal factors Example of external factors
Higher • Stable and predictable cashflows, largely
independent of the economic cycle (e.g.
availability-based projects)
• Strong economic fundamentals underpinning
significant overcollateralisation of debt (e.g.
PLCR > 3x)
• Termination compensation covering debt and
lost interest
• Essential or strategic nature of the project limiting the
risk of the asset being stranded (e.g. hospitals)
• Presence of multilateral financial institutions
discouraging government interference such as
expropriation or transfer restrictions (e.g. participation of
EIB, EBRD, or AIIB)
Lower (opposite)
Source: Scope.
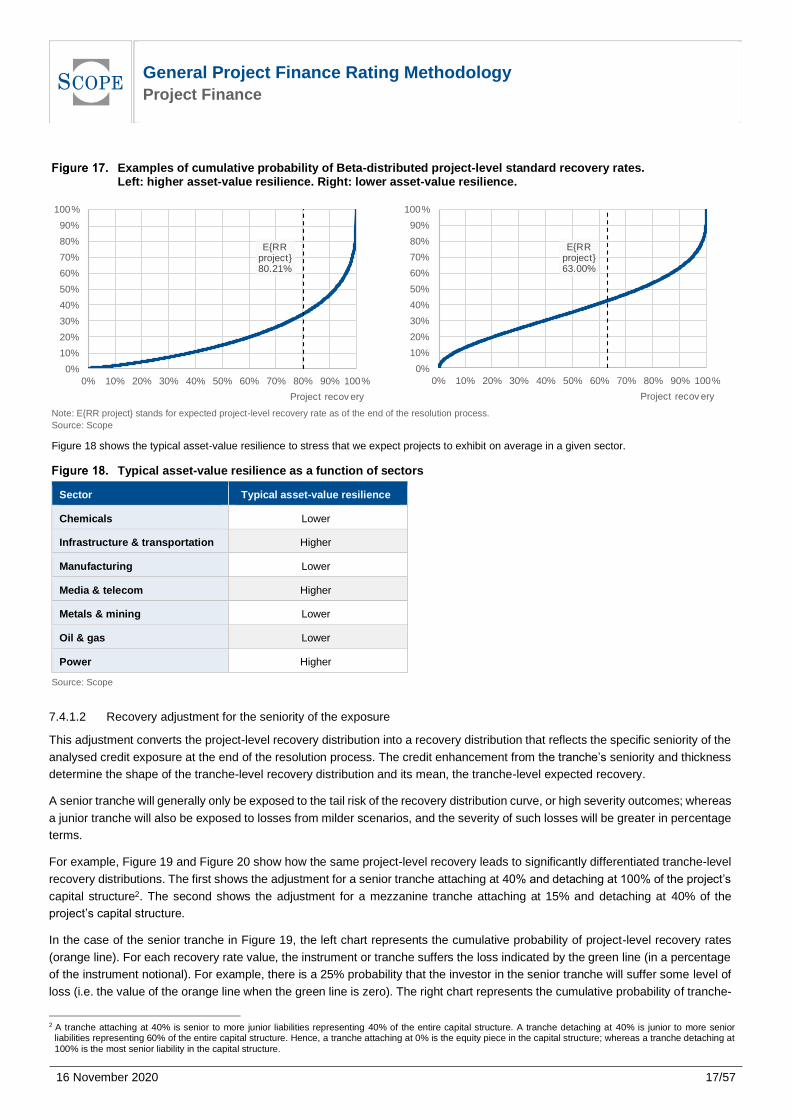
Figure 17 shows two examples of a cumulative probability distribution of project-level standard recovery rates. The left chart reflects
an asset with a higher asset-value resilience; the chart on the right represents an asset with a lower asset-value resilience.
E{RR project}72.73%
0%
10%
20%
30%
40%
50%
60%
70%
80%
90%
100%
0% 10% 20% 30% 40% 50% 60% 70% 80% 90% 100%
Project recov ery
0%
1%
2%
3%
4%
5%
0% 10% 20% 30% 40% 50% 60% 70% 80% 90% 100%
Project recov ery
E{RR project}72.73%
General Project Finance Rating Methodology Project Finance
16 November 2020
17/57
Examples of cumulative probability of Beta-distributed project-level standard recovery rates. Left: higher asset-value resilience. Right: lower asset-value resilience.
Note: E{RR project} stands for expected project-level recovery rate as of the end of the resolution process.
Source: Scope
Figure 18 shows the typical asset-value resilience to stress that we expect projects to exhibit on average in a given sector.
Typical asset-value resilience as a function of sectors
Sector Typical asset-value resilience
Chemicals Lower
Infrastructure & transportation Higher
Manufacturing Lower
Media & telecom Higher
Metals & mining Lower
Oil & gas Lower
Power Higher
Source: Scope
7.4.1.2 Recovery adjustment for the seniority of the exposure
This adjustment converts the project-level recovery distribution into a recovery distribution that reflects the specific seniority of the
analysed credit exposure at the end of the resolution process. The credit enhancement from the tranche’s seniority and thickness
determine the shape of the tranche-level recovery distribution and its mean, the tranche-level expected recovery.
A senior tranche will generally only be exposed to the tail risk of the recovery distribution curve, or high severity outcomes; whereas
a junior tranche will also be exposed to losses from milder scenarios, and the severity of such losses will be greater in percentage
terms.
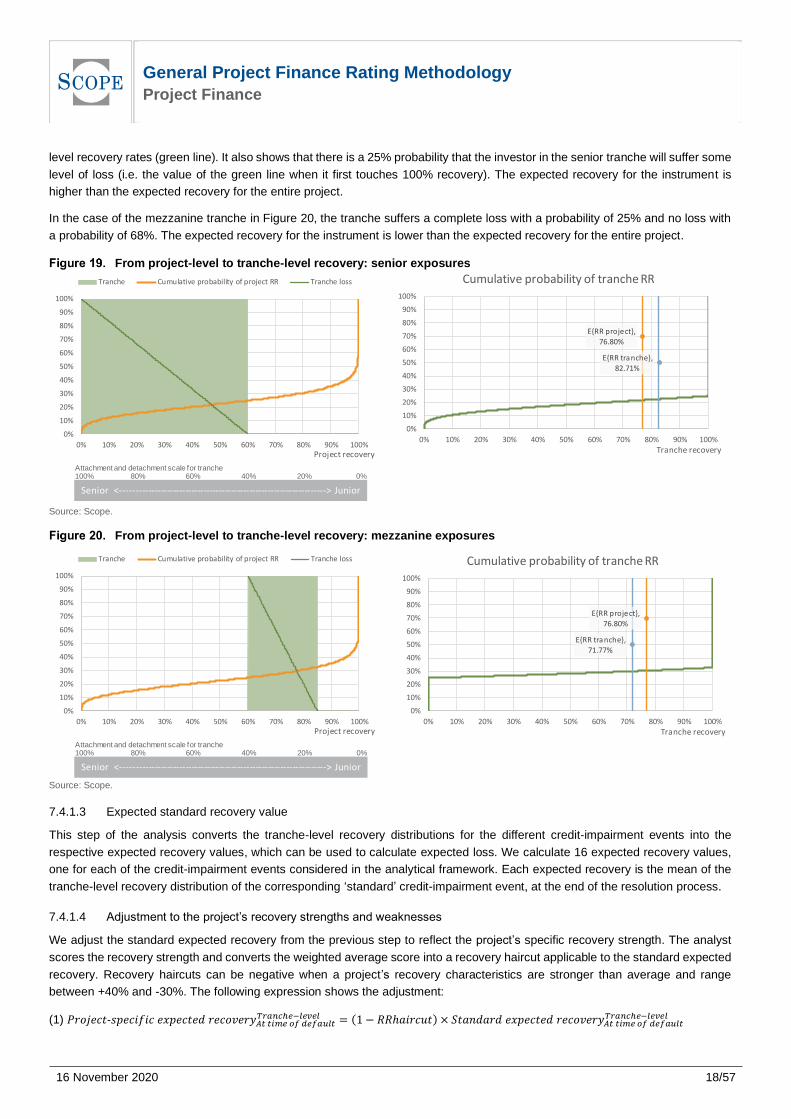
For example, Figure 19 and Figure 20 show how the same project-level recovery leads to significantly differentiated tranche-level
recovery distributions. The first shows the adjustment for a senior tranche attaching at 40% and detaching at 100% of the project’s
capital structure2. The second shows the adjustment for a mezzanine tranche attaching at 15% and detaching at 40% of the
project’s capital structure.
In the case of the senior tranche in Figure 19, the left chart represents the cumulative probability of project-level recovery rates
(orange line). For each recovery rate value, the instrument or tranche suffers the loss indicated by the green line (in a percentage
of the instrument notional). For example, there is a 25% probability that the investor in the senior tranche will suffer some level of
loss (i.e. the value of the orange line when the green line is zero). The right chart represents the cumulative probability of tranche-
2 A tranche attaching at 40% is senior to more junior liabilities representing 40% of the entire capital structure. A tranche detaching at 40% is junior to more senior
liabilities representing 60% of the entire capital structure. Hence, a tranche attaching at 0% is the equity piece in the capital structure; whereas a tranche detaching at 100% is the most senior liability in the capital structure.
E{RR project}80.21%
0%
10%
20%
30%
40%
50%
60%
70%
80%
90%
100%
0% 10% 20% 30% 40% 50% 60% 70% 80% 90% 100%
Project recov ery
E{RR project}63.00%
0%
10%
20%
30%
40%
50%
60%
70%
80%
90%
100%
0% 10% 20% 30% 40% 50% 60% 70% 80% 90% 100%
Project recov ery
General Project Finance Rating Methodology Project Finance
16 November 2020
18/57
level recovery rates (green line). It also shows that there is a 25% probability that the investor in the senior tranche will suffer some
level of loss (i.e. the value of the green line when it first touches 100% recovery). The expected recovery for the instrument is
higher than the expected recovery for the entire project.
In the case of the mezzanine tranche in Figure 20, the tranche suffers a complete loss with a probability of 25% and no loss with
a probability of 68%. The expected recovery for the instrument is lower than the expected recovery for the entire project.
From project-level to tranche-level recovery: senior exposures
Source: Scope.
From project-level to tranche-level recovery: mezzanine exposures
Source: Scope.
7.4.1.3 Expected standard recovery value
This step of the analysis converts the tranche-level recovery distributions for the different credit-impairment events into the
respective expected recovery values, which can be used to calculate expected loss. We calculate 16 expected recovery values,
one for each of the credit-impairment events considered in the analytical framework. Each expected recovery is the mean of the
tranche-level recovery distribution of the corresponding ‘standard’ credit-impairment event, at the end of the resolution process.
7.4.1.4 Adjustment to the project’s recovery strengths and weaknesses
We adjust the standard expected recovery from the previous step to reflect the project’s specific recovery strength. The analyst
scores the recovery strength and converts the weighted average score into a recovery haircut applicable to the standard expected
recovery. Recovery haircuts can be negative when a project’s recovery characteristics are stronger than average and range
between +40% and -30%. The following expression shows the adjustment:
(1) 𝑃𝑟𝑜𝑗𝑒𝑐𝑡-𝑠𝑝𝑒𝑐𝑖𝑓𝑖𝑐 𝑒𝑥𝑝𝑒𝑐𝑡𝑒𝑑 𝑟𝑒𝑐𝑜𝑣𝑒𝑟𝑦𝐴𝑡 𝑡𝑖𝑚𝑒 𝑜𝑓 𝑑𝑒𝑓𝑎𝑢𝑙𝑡𝑇𝑟𝑎𝑛𝑐ℎ𝑒−𝑙𝑒𝑣𝑒𝑙 = (1 − 𝑅𝑅ℎ𝑎𝑖𝑟𝑐𝑢𝑡) 𝑆𝑡𝑎𝑛𝑑𝑎𝑟𝑑 𝑒𝑥𝑝𝑒𝑐𝑡𝑒𝑑 𝑟𝑒𝑐𝑜𝑣𝑒𝑟𝑦𝐴𝑡 𝑡𝑖𝑚𝑒 𝑜𝑓 𝑑𝑒𝑓𝑎𝑢𝑙𝑡
𝑇𝑟𝑎𝑛𝑐ℎ𝑒−𝑙𝑒𝑣𝑒𝑙
0%
10%
20%
30%
40%
50%
60%
70%
80%
90%
100%
0% 10% 20% 30% 40% 50% 60% 70% 80% 90% 100%Project recovery
Tranche Cumulative probability of project RR Tranche loss
Senior <-------------------------------------------------------------------> Junior
Attachment and detachment scale for tranche100% 80% 60% 40% 20% 0%
E{RR tranche}, 82.71%
E{RR project},
76.80%
0%
10%
20%
30%
40%
50%
60%
70%
80%
90%
100%
0% 10% 20% 30% 40% 50% 60% 70% 80% 90% 100%
Tranche recovery
Cumulative probability of tranche RR
0%
10%
20%
30%
40%
50%
60%
70%
80%
90%
100%
0% 10% 20% 30% 40% 50% 60% 70% 80% 90% 100%Project recovery
Tranche Cumulative probability of project RR Tranche loss
Senior <-------------------------------------------------------------------> Junior
Attachment and detachment scale for tranche100% 80% 60% 40% 20% 0%
E{RR tranche}, 71.77%
E{RR project},
76.80%
0%
10%
20%
30%
40%
50%
60%
70%
80%
90%
100%
0% 10% 20% 30% 40% 50% 60% 70% 80% 90% 100%
Tranche recovery
Cumulative probability of tranche RR
General Project Finance Rating Methodology Project Finance
16 November 2020
19/57
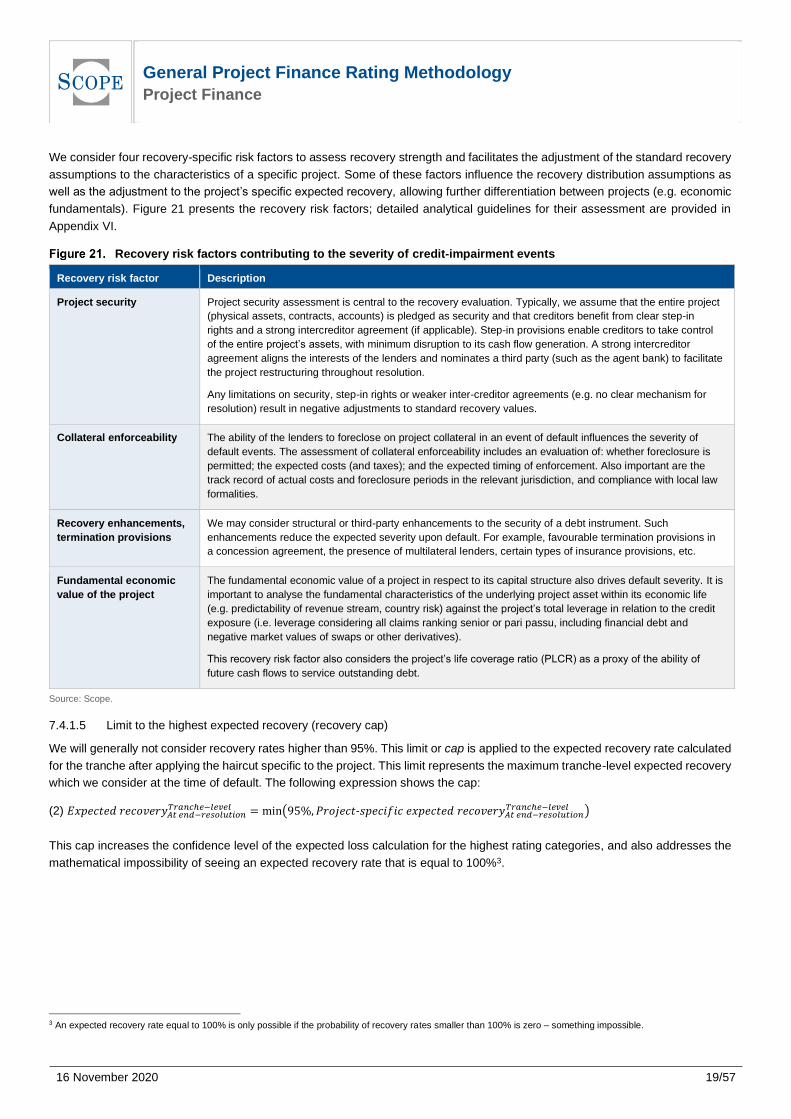
We consider four recovery-specific risk factors to assess recovery strength and facilitates the adjustment of the standard recovery
assumptions to the characteristics of a specific project. Some of these factors influence the recovery distribution assumptions as
well as the adjustment to the project’s specific expected recovery, allowing further differentiation between projects (e.g. economic
fundamentals). Figure 21 presents the recovery risk factors; detailed analytical guidelines for their assessment are provided in
Appendix VI.
Recovery risk factors contributing to the severity of credit-impairment events
Recovery risk factor Description
Project security Project security assessment is central to the recovery evaluation. Typically, we assume that the entire project
(physical assets, contracts, accounts) is pledged as security and that creditors benefit from clear step-in
rights and a strong intercreditor agreement (if applicable). Step-in provisions enable creditors to take control
of the entire project’s assets, with minimum disruption to its cash flow generation. A strong intercreditor
agreement aligns the interests of the lenders and nominates a third party (such as the agent bank) to facilitate
the project restructuring throughout resolution.
Any limitations on security, step-in rights or weaker inter-creditor agreements (e.g. no clear mechanism for
resolution) result in negative adjustments to standard recovery values.
Collateral enforceability The ability of the lenders to foreclose on project collateral in an event of default influences the severity of
default events. The assessment of collateral enforceability includes an evaluation of: whether foreclosure is
permitted; the expected costs (and taxes); and the expected timing of enforcement. Also important are the
track record of actual costs and foreclosure periods in the relevant jurisdiction, and compliance with local law
formalities.
Recovery enhancements,
termination provisions
We may consider structural or third-party enhancements to the security of a debt instrument. Such
enhancements reduce the expected severity upon default. For example, favourable termination provisions in
a concession agreement, the presence of multilateral lenders, certain types of insurance provisions, etc.
Fundamental economic
value of the project
The fundamental economic value of a project in respect to its capital structure also drives default severity. It is
important to analyse the fundamental characteristics of the underlying project asset within its economic life
(e.g. predictability of revenue stream, country risk) against the project’s total leverage in relation to the credit
exposure (i.e. leverage considering all claims ranking senior or pari passu, including financial debt and
negative market values of swaps or other derivatives).
This recovery risk factor also considers the project’s life coverage ratio (PLCR) as a proxy of the ability of
future cash flows to service outstanding debt.
Source: Scope.
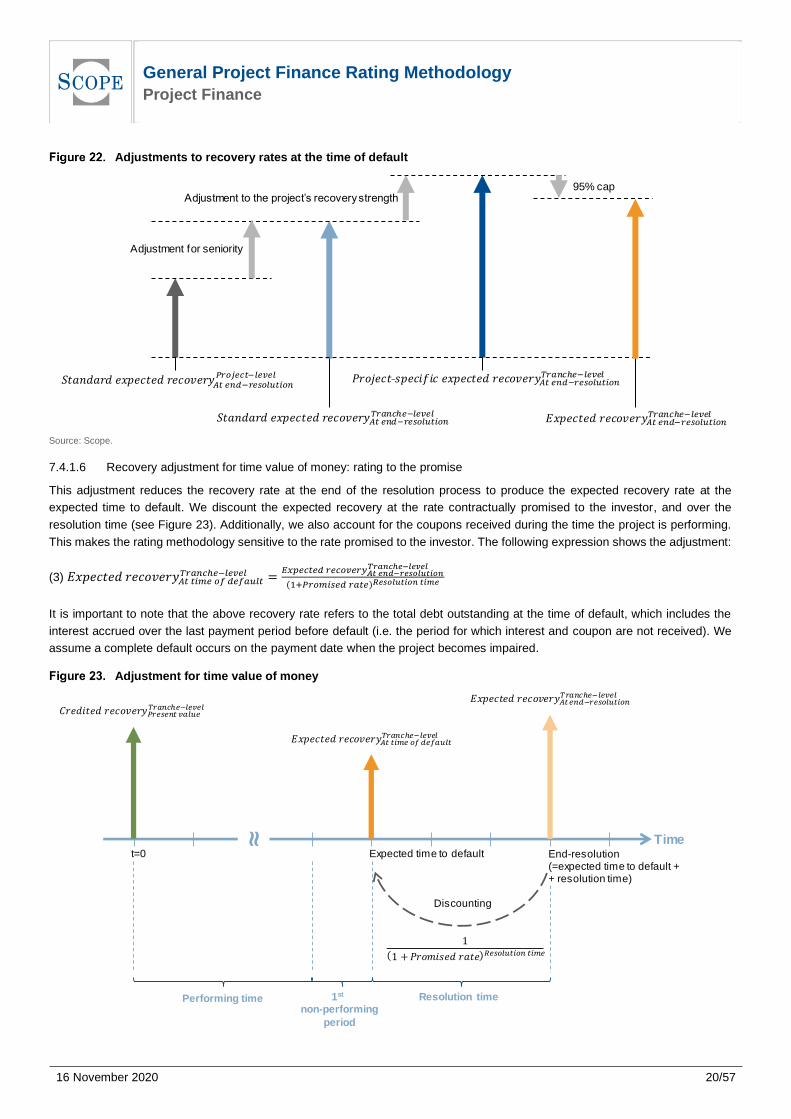
7.4.1.5 Limit to the highest expected recovery (recovery cap)
We will generally not consider recovery rates higher than 95%. This limit or cap is applied to the expected recovery rate calculated
for the tranche after applying the haircut specific to the project. This limit represents the maximum tranche-level expected recovery
which we consider at the time of default. The following expression shows the cap:
(2) 𝐸𝑥𝑝𝑒𝑐𝑡𝑒𝑑 𝑟𝑒𝑐𝑜𝑣𝑒𝑟𝑦𝐴𝑡 𝑒𝑛𝑑−𝑟𝑒𝑠𝑜𝑙𝑢𝑡𝑖𝑜𝑛𝑇𝑟𝑎𝑛𝑐ℎ𝑒−𝑙𝑒𝑣𝑒𝑙 = min(95%, 𝑃𝑟𝑜𝑗𝑒𝑐𝑡-𝑠𝑝𝑒𝑐𝑖𝑓𝑖𝑐 𝑒𝑥𝑝𝑒𝑐𝑡𝑒𝑑 𝑟𝑒𝑐𝑜𝑣𝑒𝑟𝑦𝐴𝑡 𝑒𝑛𝑑−𝑟𝑒𝑠𝑜𝑙𝑢𝑡𝑖𝑜𝑛
𝑇𝑟𝑎𝑛𝑐ℎ𝑒−𝑙𝑒𝑣𝑒𝑙 )
This cap increases the confidence level of the expected loss calculation for the highest rating categories, and also addresses the
mathematical impossibility of seeing an expected recovery rate that is equal to 100%3.
3 An expected recovery rate equal to 100% is only possible if the probability of recovery rates smaller than 100% is zero – something impossible.
General Project Finance Rating Methodology Project Finance
16 November 2020
20/57
Adjustments to recovery rates at the time of default
Source: Scope.
7.4.1.6 Recovery adjustment for time value of money: rating to the promise
This adjustment reduces the recovery rate at the end of the resolution process to produce the expected recovery rate at the
expected time to default. We discount the expected recovery at the rate contractually promised to the investor, and over the
resolution time (see Figure 23). Additionally, we also account for the coupons received during the time the project is performing.
This makes the rating methodology sensitive to the rate promised to the investor. The following expression shows the adjustment:
(3) 𝐸𝑥𝑝𝑒𝑐𝑡𝑒𝑑 𝑟𝑒𝑐𝑜𝑣𝑒𝑟𝑦𝐴𝑡 𝑡𝑖𝑚𝑒 𝑜𝑓 𝑑𝑒𝑓𝑎𝑢𝑙𝑡𝑇𝑟𝑎𝑛𝑐ℎ𝑒−𝑙𝑒𝑣𝑒𝑙 =
𝐸𝑥𝑝𝑒𝑐𝑡𝑒𝑑 𝑟𝑒𝑐𝑜𝑣𝑒𝑟𝑦𝐴𝑡 𝑒𝑛𝑑−𝑟𝑒𝑠𝑜𝑙𝑢𝑡𝑖𝑜𝑛𝑇𝑟𝑎𝑛𝑐ℎ𝑒−𝑙𝑒𝑣𝑒𝑙
(1+𝑃𝑟𝑜𝑚𝑖𝑠𝑒𝑑 𝑟𝑎𝑡𝑒)𝑅𝑒𝑠𝑜𝑙𝑢𝑡𝑖𝑜𝑛 𝑡𝑖𝑚𝑒
It is important to note that the above recovery rate refers to the total debt outstanding at the time of default, which includes the
interest accrued over the last payment period before default (i.e. the period for which interest and coupon are not received). We
assume a complete default occurs on the payment date when the project becomes impaired.
Adjustment for time value of money
𝑆𝑡𝑎𝑛𝑑𝑎𝑟𝑑 𝑒𝑥𝑝𝑒𝑐𝑡𝑒𝑑 𝑟𝑒𝑐𝑜𝑣𝑒𝑟𝑦𝐴𝑡 𝑒𝑛𝑑−𝑟𝑒𝑠𝑜𝑙𝑢𝑡𝑖𝑜𝑛𝑇𝑟𝑎𝑛𝑐ℎ𝑒−𝑙𝑒𝑣𝑒𝑙
𝑃𝑟𝑜𝑗𝑒𝑐𝑡 𝑠𝑝𝑒𝑐𝑖𝑓𝑖𝑐 𝑒𝑥𝑝𝑒𝑐𝑡𝑒𝑑 𝑟𝑒𝑐𝑜𝑣𝑒𝑟𝑦𝐴𝑡 𝑒𝑛𝑑−𝑟𝑒𝑠𝑜𝑙𝑢𝑡𝑖𝑜𝑛𝑇𝑟𝑎𝑛𝑐ℎ𝑒−𝑙𝑒𝑣𝑒𝑙
𝑆𝑡𝑎𝑛𝑑𝑎𝑟𝑑 𝑒𝑥𝑝𝑒𝑐𝑡𝑒𝑑 𝑟𝑒𝑐𝑜𝑣𝑒𝑟𝑦𝐴𝑡 𝑒𝑛𝑑−𝑟𝑒𝑠𝑜𝑙𝑢𝑡𝑖𝑜𝑛𝑃𝑟𝑜 𝑒𝑐𝑡−𝑙𝑒𝑣𝑒𝑙
Adjustment for seniority
Adjustment to the project’s recovery strength
𝐸𝑥𝑝𝑒𝑐𝑡𝑒𝑑 𝑟𝑒𝑐𝑜𝑣𝑒𝑟𝑦𝐴𝑡 𝑒𝑛𝑑−𝑟𝑒𝑠𝑜𝑙𝑢𝑡𝑖𝑜𝑛𝑇𝑟𝑎𝑛𝑐ℎ𝑒−𝑙𝑒𝑣𝑒𝑙
95% cap
End-resolution(=expected time to default ++ resolution time)
t=0
Time
𝑟𝑒𝑑𝑖𝑡𝑒𝑑 𝑟𝑒𝑐𝑜𝑣𝑒𝑟𝑦𝑃𝑟𝑒𝑠𝑒𝑛𝑡 𝑣𝑎𝑙𝑢𝑒𝑇𝑟𝑎𝑛𝑐ℎ𝑒−𝑙𝑒𝑣𝑒𝑙
Expected time to default
𝐸𝑥𝑝𝑒𝑐𝑡𝑒𝑑 𝑟𝑒𝑐𝑜𝑣𝑒𝑟𝑦𝐴𝑡 𝑡𝑖𝑚𝑒 𝑜𝑓 𝑑𝑒𝑓𝑎𝑢𝑙𝑡𝑇𝑟𝑎𝑛𝑐ℎ𝑒−𝑙𝑒𝑣𝑒𝑙
Discounting
1
1 𝑃𝑟𝑜 𝑖𝑠𝑒𝑑 𝑟𝑎𝑡𝑒 𝑒𝑠𝑜𝑙𝑢𝑡𝑖𝑜𝑛 𝑡𝑖𝑚𝑒
≈
𝐸𝑥𝑝𝑒𝑐𝑡𝑒𝑑 𝑟𝑒𝑐𝑜𝑣𝑒𝑟𝑦𝐴𝑡 𝑒𝑛𝑑−𝑟𝑒𝑠𝑜𝑙𝑢𝑡𝑖𝑜𝑛𝑇𝑟𝑎𝑛𝑐ℎ𝑒−𝑙𝑒𝑣𝑒𝑙
Performing time 1st
non-performing
period
Resolution time
General Project Finance Rating Methodology Project Finance
16 November 2020
21/57
Source: Scope.
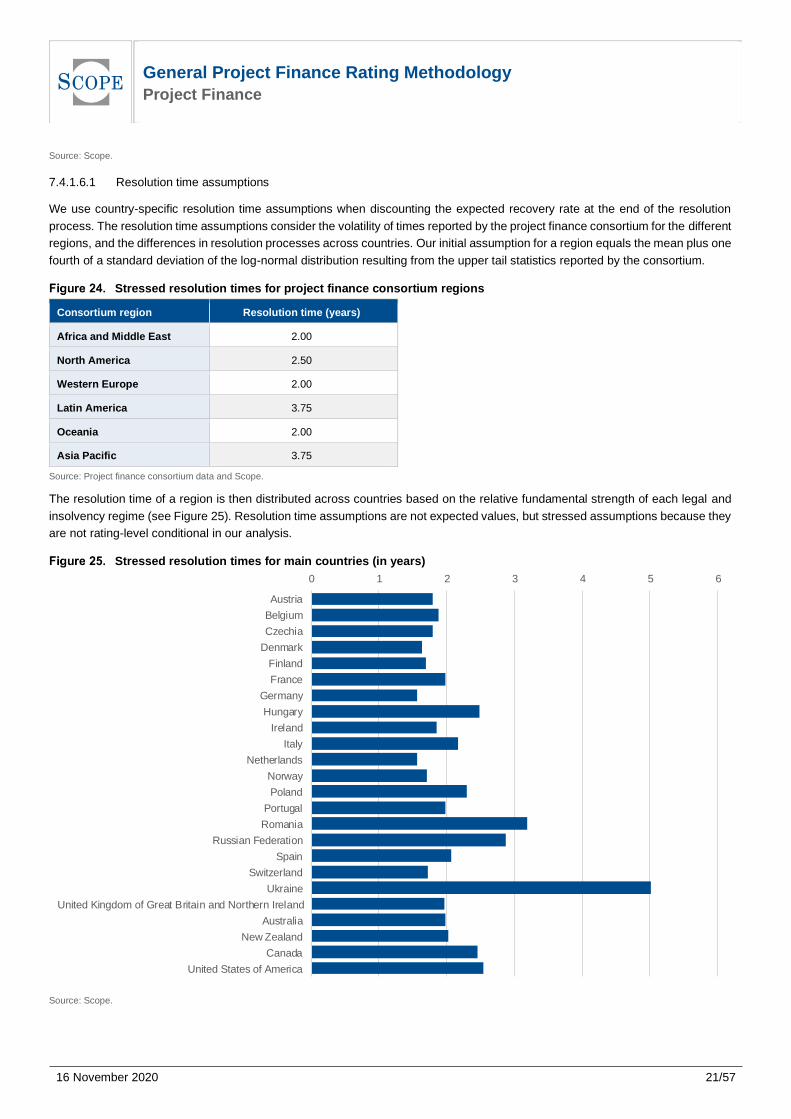
7.4.1.6.1 Resolution time assumptions
We use country-specific resolution time assumptions when discounting the expected recovery rate at the end of the resolution
process. The resolution time assumptions consider the volatility of times reported by the project finance consortium for the different
regions, and the differences in resolution processes across countries. Our initial assumption for a region equals the mean plus one
fourth of a standard deviation of the log-normal distribution resulting from the upper tail statistics reported by the consortium.
Stressed resolution times for project finance consortium regions
Consortium region Resolution time (years)
Africa and Middle East 2.00
North America 2.50
Western Europe 2.00
Latin America 3.75
Oceania 2.00
Asia Pacific 3.75
Source: Project finance consortium data and Scope.
The resolution time of a region is then distributed across countries based on the relative fundamental strength of each legal and
insolvency regime (see Figure 25). Resolution time assumptions are not expected values, but stressed assumptions because they
are not rating-level conditional in our analysis.
Stressed resolution times for main countries (in years)
Source: Scope.
0 1 2 3 4 5 6
Austria
Belgium
Czechia
Denmark
Finland
France
Germany
Hungary
Ireland
Italy
Netherlands
Norway
Poland
Portugal
Romania
Russian Federation
Spain
Switzerland
Ukraine
United Kingdom of Great Britain and Northern Ireland
Australia
New Zealand
Canada
United States of America
Resolution time assumption for country (years)
General Project Finance Rating Methodology Project Finance
16 November 2020
22/57
We increase the country resolution assumption by 50% for projects that present enforceability risk (i.e. ‘collateral enforceability’
recovery risk factor scored ‘high’). Expression (4) shows the calculation of the project’s resolution time assumption.
(4) 𝑃𝑟𝑜𝑗𝑒𝑐𝑡 𝑟𝑒𝑠𝑜𝑙𝑢𝑡𝑖𝑜𝑛 𝑡𝑖 𝑒 = 𝑜𝑢𝑛𝑡𝑟𝑦 𝑟𝑒𝑠𝑜𝑙𝑢𝑡𝑖𝑜𝑛 𝑡𝑖 𝑒 (1 50% 𝑖𝑓 𝑒𝑛𝑓𝑜𝑟𝑐𝑒𝑎𝑏𝑖𝑙𝑖𝑡𝑦 𝑟𝑖𝑠𝑘
𝑜𝑟0% 𝑜𝑡ℎ𝑒𝑟𝑤𝑖𝑠𝑒
)
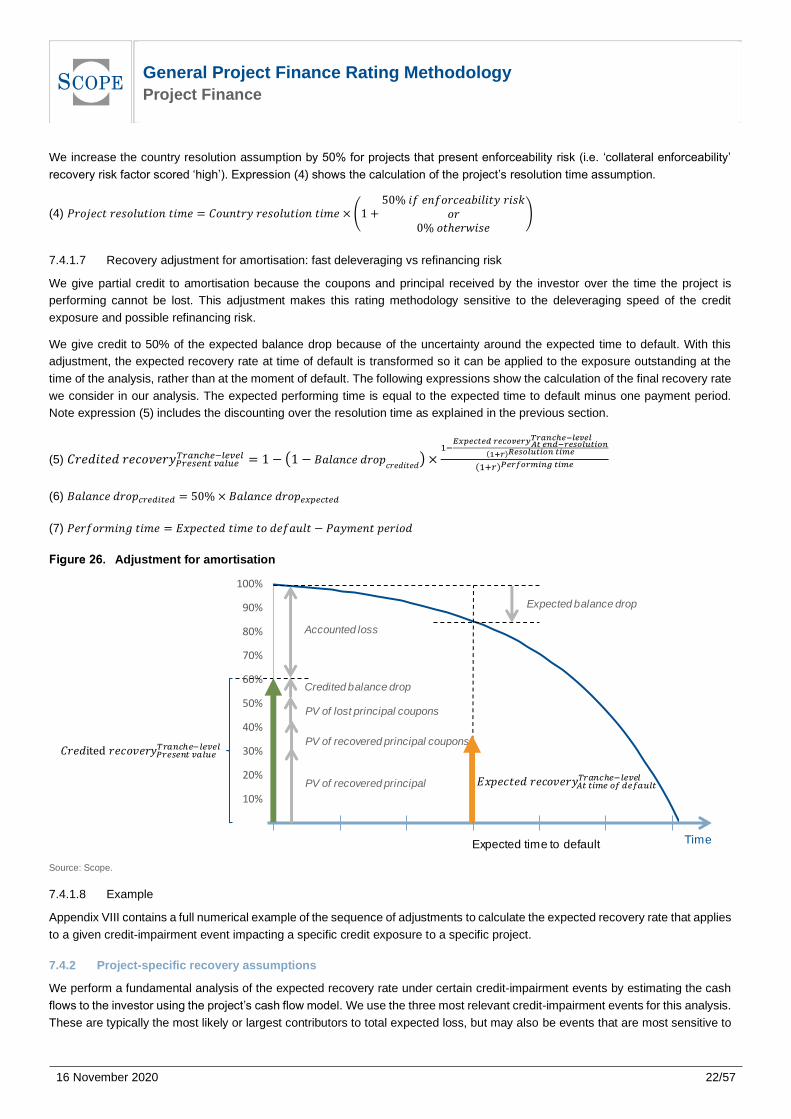
7.4.1.7 Recovery adjustment for amortisation: fast deleveraging vs refinancing risk
We give partial credit to amortisation because the coupons and principal received by the investor over the time the project is
performing cannot be lost. This adjustment makes this rating methodology sensitive to the deleveraging speed of the credit
exposure and possible refinancing risk.
We give credit to 50% of the expected balance drop because of the uncertainty around the expected time to default. With this
adjustment, the expected recovery rate at time of default is transformed so it can be applied to the exposure outstanding at the
time of the analysis, rather than at the moment of default. The following expressions show the calculation of the final recovery rate
we consider in our analysis. The expected performing time is equal to the expected time to default minus one payment period.
Note expression (5) includes the discounting over the resolution time as explained in the previous section.
(5) 𝑟𝑒𝑑𝑖𝑡𝑒𝑑 𝑟𝑒𝑐𝑜𝑣𝑒𝑟𝑦𝑃𝑟𝑒𝑠𝑒𝑛𝑡 𝑣𝑎𝑙𝑢𝑒𝑇𝑟𝑎𝑛𝑐ℎ𝑒−𝑙𝑒𝑣𝑒𝑙 = 1 − (1 − 𝐵𝑎𝑙𝑎𝑛𝑐𝑒 𝑑𝑟𝑜𝑝
𝑐𝑟𝑒𝑑𝑖𝑡𝑒𝑑)
1−𝐸𝑥𝑝𝑒𝑐𝑡𝑒𝑑 𝑟𝑒𝑐𝑜𝑣𝑒𝑟𝑦𝐴𝑡 𝑒𝑛𝑑−𝑟𝑒𝑠𝑜𝑙𝑢𝑡𝑖𝑜𝑛
𝑇𝑟𝑎𝑛𝑐ℎ𝑒−𝑙𝑒𝑣𝑒𝑙
(1+𝑟)𝑅𝑒𝑠𝑜𝑙𝑢𝑡𝑖𝑜𝑛 𝑡𝑖𝑚𝑒
(1+𝑟)𝑃𝑒𝑟𝑓𝑜𝑟𝑚𝑖𝑛𝑔 𝑡𝑖𝑚𝑒
(6) 𝐵𝑎𝑙𝑎𝑛𝑐𝑒 𝑑𝑟𝑜𝑝𝑐𝑟𝑒𝑑𝑖𝑡𝑒𝑑 = 50% 𝐵𝑎𝑙𝑎𝑛𝑐𝑒 𝑑𝑟𝑜𝑝𝑒𝑥𝑝𝑒𝑐𝑡𝑒𝑑
(7) 𝑃𝑒𝑟𝑓𝑜𝑟 𝑖𝑛𝑔 𝑡𝑖 𝑒 = 𝐸𝑥𝑝𝑒𝑐𝑡𝑒𝑑 𝑡𝑖 𝑒 𝑡𝑜 𝑑𝑒𝑓𝑎𝑢𝑙𝑡 − 𝑃𝑎𝑦 𝑒𝑛𝑡 𝑝𝑒𝑟𝑖𝑜𝑑
Adjustment for amortisation
Source: Scope.
7.4.1.8 Example
Appendix VIII contains a full numerical example of the sequence of adjustments to calculate the expected recovery rate that applies
to a given credit-impairment event impacting a specific credit exposure to a specific project.
7.4.2 Project-specific recovery assumptions
We perform a fundamental analysis of the expected recovery rate under certain credit-impairment events by estimating the cash
flows to the investor using the project’s cash flow model. We use the three most relevant credit-impairment events for this analysis.
These are typically the most likely or largest contributors to total expected loss, but may also be events that are most sensitive to
0%
10%
20%
30%
40%
50%
60%
70%
80%
90%
100%
0 5 10 15 20 25 30 35Expected time to default Time
Accounted loss
𝑟𝑒𝑑i 𝑟𝑒𝑐𝑜𝑣𝑒𝑟𝑦𝑃𝑟𝑒𝑠𝑒𝑛𝑡 𝑣𝑎𝑙𝑢𝑒𝑇𝑟𝑎𝑛𝑐ℎ𝑒−𝑙𝑒𝑣𝑒𝑙
PV of lost principal coupons
PV of recovered principal coupons
PV of recovered principal
Credited balance drop
Expected balance drop
𝐸𝑥𝑝𝑒𝑐𝑡𝑒𝑑 𝑟𝑒𝑐𝑜𝑣𝑒𝑟𝑦𝐴𝑡 𝑡𝑖𝑚𝑒 𝑜𝑓 𝑑𝑒𝑓𝑎𝑢𝑙𝑡𝑇𝑟𝑎𝑛𝑐ℎ𝑒−𝑙𝑒𝑣𝑒𝑙
General Project Finance Rating Methodology Project Finance
16 November 2020
23/57
certain risk factors in a particular project. These events generally represent between 40% and 60% of the total probability or
expected loss of all credit-impairment events affecting the project.
Project finance cash flow models typically capture the most important elements of project complexity. Our analysts will modify the
project’s cash flow model, when available, and use it to derive the expected recovery rate under each of the relevant credit-
impairment events.
We stress the inputs to the project’s cash flow model to reflect the conditions conducing to each of the relevant credit impairments.
The recovery rate we calculate is as of the time of impairment, as applicable to the exposure outstanding at that time in the life of
the instrument. The recovery rate represents a calculation of the impaired project life coverage ratio (PLCR) at the time of
impairment and requires adjustments in order to transform it into a recovery rate applicable to the claim outstanding at the time of
analysis. These adjustments are the same applicable to the standard recovery rates discussed in section 7.4.1 (i.e. limit to
maximum recovery, adjustment for time value of money, adjustment for amortisation until the moment of impairment).
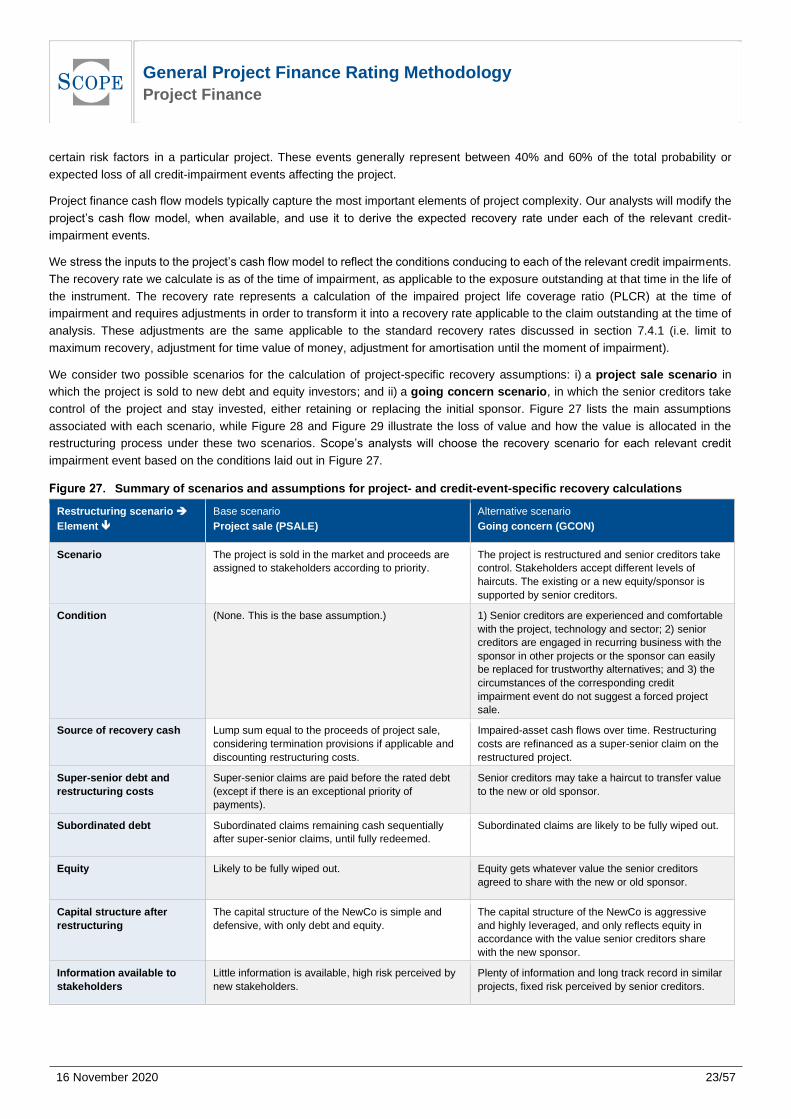
We consider two possible scenarios for the calculation of project-specific recovery assumptions: i) a project sale scenario in
which the project is sold to new debt and equity investors; and ii) a going concern scenario, in which the senior creditors take
control of the project and stay invested, either retaining or replacing the initial sponsor. Figure 27 lists the main assumptions
associated with each scenario, while Figure 28 and Figure 29 illustrate the loss of value and how the value is allocated in the
restructuring process under these two scenarios. Scope’s analysts will choose the recovery scenario for each relevant credit
impairment event based on the conditions laid out in Figure 27.
Summary of scenarios and assumptions for project- and credit-event-specific recovery calculations
Restructuring scenario ➔
Element
Base scenario
Project sale (PSALE)
Alternative scenario
Going concern (GCON)
Scenario The project is sold in the market and proceeds are
assigned to stakeholders according to priority.
The project is restructured and senior creditors take
control. Stakeholders accept different levels of
haircuts. The existing or a new equity/sponsor is
supported by senior creditors.
Condition (None. This is the base assumption.) 1) Senior creditors are experienced and comfortable
with the project, technology and sector; 2) senior
creditors are engaged in recurring business with the
sponsor in other projects or the sponsor can easily
be replaced for trustworthy alternatives; and 3) the
circumstances of the corresponding credit
impairment event do not suggest a forced project
sale.
Source of recovery cash Lump sum equal to the proceeds of project sale,
considering termination provisions if applicable and
discounting restructuring costs.
Impaired-asset cash flows over time. Restructuring
costs are refinanced as a super-senior claim on the
restructured project.
Super-senior debt and
restructuring costs
Super-senior claims are paid before the rated debt
(except if there is an exceptional priority of
payments).
Senior creditors may take a haircut to transfer value
to the new or old sponsor.
Subordinated debt Subordinated claims remaining cash sequentially
after super-senior claims, until fully redeemed.
Subordinated claims are likely to be fully wiped out.
Equity Likely to be fully wiped out. Equity gets whatever value the senior creditors
agreed to share with the new or old sponsor.
Capital structure after
restructuring
The capital structure of the NewCo is simple and
defensive, with only debt and equity.
The capital structure of the NewCo is aggressive
and highly leveraged, and only reflects equity in
accordance with the value senior creditors share
with the new sponsor.
Information available to
stakeholders
Little information is available, high risk perceived by
new stakeholders.
Plenty of information and long track record in similar
projects, fixed risk perceived by senior creditors.

General Project Finance Rating Methodology Project Finance
16 November 2020
24/57
Cost of debt (Kd) Cost of debt will carry a premium to reflect
asymmetry of information: +50% stress.
No stress.
Cost of equity (Ke) Cost of equity will carry a premium to reflect
asymmetry of information: +50% stress.
Cost of equity is heavily reduced and made equal to
the cost of debt. We assume the equity holder is not
investing anything because its participation in the
project has been granted for free by the senior
creditors during the restructuring in order to
incentivise its participation in the success of the
restructured project.
Leverage Conservative leverage because both new creditors
and new sponsors would be very prudent when
entering the project due to asymmetry of
information and opportunistic bidding.
Share of debt in restructured project is -16.67%
lower than in the pre-restructured project
(e.g. D=60% E=40% becomes DR=50% ER=50%).
Aggressive leverage because the value of equity
will be the minimum amount that the senior
creditors need to pass on to the sponsor in order to
involve and incentivise the sponsor in the project.
We assume a 95% share of debt.
Excess cash, reserves and
non-operating assets
We assume a value of zero in all scenarios because excess cash, reserves and non-operating assets will
have been consumed by the time the project fails to pay. When modelling from the cash flow model, the
value considered will be that resulting from the stresses of the relevant credit impairment event.
External RR
enhancements
Recovery enhancements at the instrument level are
applied to complement whatever recovery is
achieved from the liquidation proceeds.
In the case of a going concern, the application of
enhancements is decided on a case by case basis.
Terminal swap payments Terminal payment is refinanced under the same conditions as the senior debt as a new paripassu claim on
the project’s value. The terminal payment is the marked-to-market value of the swap contract in the adverse
scenario represented by the credit impairment event in question.
Source: Scope.
Project sale scenario
Source: Scope.
Going concern scenario
Source: Scope.
The main difference between the calculations under these scenarios is that the equity holder receives the equity as a ‘gift’ from
the creditor under the going concern scenario – after the old equity holder has been totally wiped out. Thus, the value of the equity
results from cash flows that the creditor agrees to pass on to the equity investor to incentivise his/her performance.
The recovery rate that is calculated at the time of impairment equals the stressed PLCR calculated for the rated debt.
The calculation process involves the following steps: i) the calculation of the stressed value of the project when the capital structure
and cost of liabilities correspond to the assumptions provided in Figure 27 upon restructuring on the date of impairment considered
for the calculation; ii) the valuation of cash flows allocated to the rated debt when discounted at the promised rate of return and on
the date of impairment; iii) the assessment of the recovery rate on the date of impairment; and iv) the same adjustments described
in sections 7.4.1.5 and 7.4.1.7 for the standard recovery rates, namely the limit to the maximum recovery and the adjustment for
amortisation. Notice that the adjustment described in section 7.4.1.6 for the standard recovery rates is not necessary in this case
because the recovery rate calculated from the stressed valuation already considers the time value of money.
DSrOld
DJrOld
Eold
PV
{str
esse
d C
Fs}
Dnew
Enew
Theoretical value and OldCo structure
Impaired value Conservative NewCo structure
Va
lue
re
co
vere
d
Cla
im a
t im
pa
irm
ent
𝑅𝑅 𝑟 𝑙𝑑 = 𝑎𝑙𝑢𝑒
𝑙𝑎𝑖 = 𝑖𝑛 𝑟 𝑙𝑑 , 𝑛𝑒 𝐸𝑛𝑒
𝑟 𝑙𝑑
𝑅𝑅 𝑟 𝑙𝑑 = 𝑎𝑙𝑢𝑒
𝑙𝑎𝑖 = 𝑖𝑛 𝑟 𝑙𝑑 , 𝑎𝑥 0, 𝑛𝑒 𝐸𝑛𝑒 − 𝑟 𝑙𝑑
𝑟 𝑙𝑑
DSrOld
DJrOld
Eold
PV
{str
esse
d C
Fs}
Dnew
Enew
Theoretical value and OldCo structure
Impaired value Aggressive new OldCo structure
Va
lue
re
co
vere
d
Cla
im a
t im
pa
irm
ent
𝑅𝑅 𝑟 𝑙𝑑 = 𝑎𝑙𝑢𝑒
𝑙𝑎𝑖 = 𝑖𝑛 𝑟 𝑙𝑑 , 𝑛𝑒
𝑟 𝑙𝑑
𝑅𝑅 𝑟 𝑙𝑑 = 𝑎𝑙𝑢𝑒
𝑙𝑎𝑖 = 𝑖𝑛 𝑟 𝑙𝑑 , 𝑎𝑥 0, 𝑛𝑒 − 𝑟 𝑙𝑑
𝑟 𝑙𝑑

General Project Finance Rating Methodology Project Finance
16 November 2020
25/57
7.4.2.1 Restructuring expenses
We assume that the restructuring expenses are refinanced at the same cost and terms as any existing super-senior claims on the
project. We assume a cost of 5% of the stressed project value subject to a floor of EUR 0.5m to account for all restructuring costs
(e.g. arranger, structurer, placing agents, legal and technical advisers, etc).
7.4.2.2 Taxes
We perform value calculations using the capital cash flow of the stressed project. This allows us to ignore tax considerations if
discounting is performed with the weighted average cost of capital before tax (WACCBT).
7.5 Expected loss calculation and quantitative rating indication
We calculate the contribution to total expected loss of each credit-impairment event by multiplying its likelihood with its expected
severity (i.e. equal to one minus the expected recovery of the event). The total expected loss for the investor in the rated exposure
is the sum of the contributions of all credit-impairment events. We compare the total expected loss to the maximum losses defined
for each rating category at the project’s risk horizon (i.e. the expected risk horizon) and determine the rating level that corresponds
to the credit exposure under analysis. Appendix II provides additional details about the application of the expected loss framework
and one simple numerical example.
7.6 Probability of hard default and hard recovery rate
Although we do not use them to derive the rating, our analytical approach provides two credit metrics which are useful for risk
management: i) the probability that the investor will lose one euro or more from having invested in a given instrument (i.e. the
probability of hard default); and ii) the expected recovery rate upon hard defaults (i.e. the hard recovery rate). The probability of
hard defaults is different to the likelihood of credit impairment events because it is less conservative. This is because impairment
events do not always result in a failure to pay or in a haircut on the outstanding claim of senior creditors. These metrics are related
to the metrics banks and institutional investors use internally when they produce regulatory PD and LGD calculations and can be
considered estimates of the regulatory PD and recovery rate. Appendix IX explains how we derive these credit metrics.
8 Counterparty risk
We analyse counterparty risk alongside the project’s fundamental characteristics. Our scores reflect the credit implications of
financial and operational exposures to the different counterparties. The different risk factors’ contributions to total loss embed our
expectations of how counterparty risk affects the project’s credit performance in each risk area considered.
We assess the materiality of an exposure to an external counterparty as excessive, material or immaterial. We distinguish financial
risk from operational risk and assess how well available remedies mitigate or reduce risk exposures to counterparties in the context
of the project. For more detail, refer to our Rating Methodology for Counterparty Risk in Structured Finance Transactions,
particularly in relation to financial counterparties (e.g. account banks, insurers or financial guarantors).
Using this methodology, we assess the risk factors that refer to the credit quality of non-financial counterparties using our ratings
or credit estimates, or public ratings issued by other regulated rating agencies. We may also leverage on internal ratings by financial
institutions approved for the internal ratings-based (IRB) approach, but before doing so will analyse the bank’s rating system and
map the internal categories to our rating scale.
9 Legal analysis
Similar to the treatment of counterparty risk, we analyse the credit implications of a project’s legal aspects along with its
fundamental characteristics. We then score the contributions to total loss of the different risk factors. Our analysis generally
considers three sources of possible legal risks: i) the security; ii) the issuer of the rated debt; and ii) the transactional parties and
documents. We review legal opinions to gain comfort on its analytical assumptions in relation to relevant legal issues.
Some legal aspects relevant to project finance credit analysis are the same as those found in structured finance (e.g. related to
the security, issuer or SPV, or documentation). The reader can learn about the relevant legal analytical considerations in our
special report, Legal Risks in Infrastructure and Project Finance – Analytical Considerations, available at www.scoperatings.com.
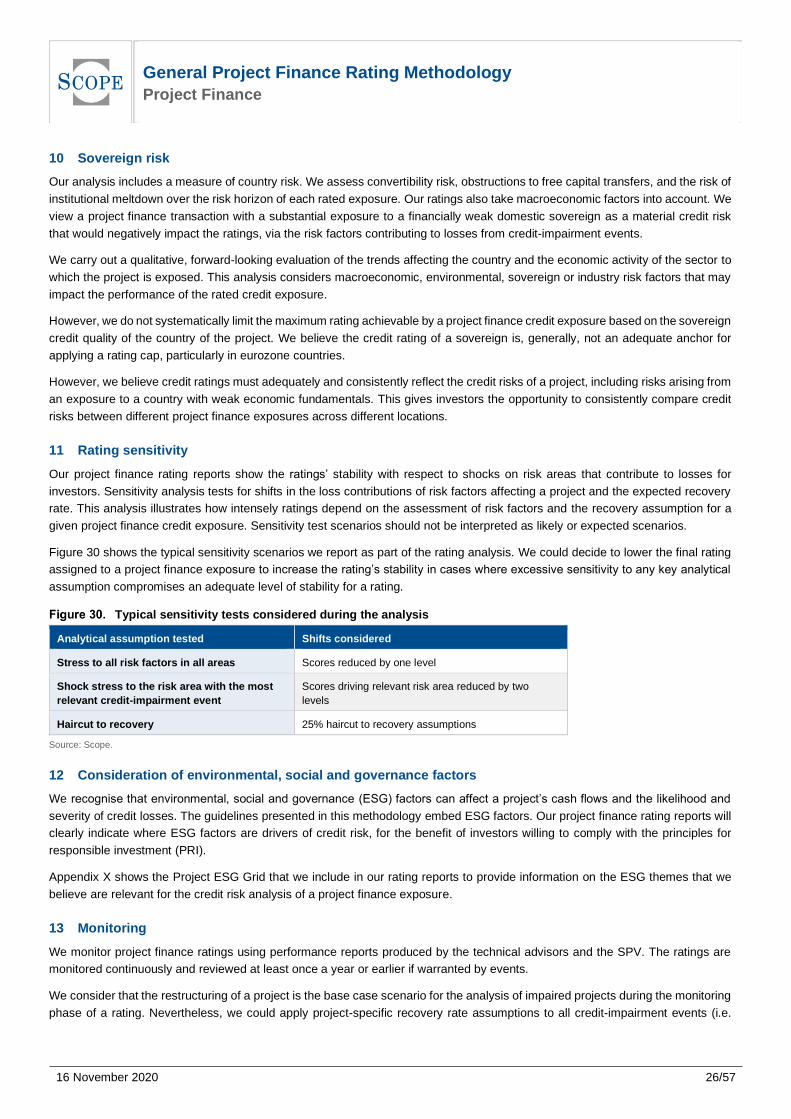
General Project Finance Rating Methodology Project Finance
16 November 2020
26/57
10 Sovereign risk
Our analysis includes a measure of country risk. We assess convertibility risk, obstructions to free capital transfers, and the risk of
institutional meltdown over the risk horizon of each rated exposure. Our ratings also take macroeconomic factors into account. We
view a project finance transaction with a substantial exposure to a financially weak domestic sovereign as a material credit risk
that would negatively impact the ratings, via the risk factors contributing to losses from credit-impairment events.
We carry out a qualitative, forward-looking evaluation of the trends affecting the country and the economic activity of the sector to
which the project is exposed. This analysis considers macroeconomic, environmental, sovereign or industry risk factors that may
impact the performance of the rated credit exposure.
However, we do not systematically limit the maximum rating achievable by a project finance credit exposure based on the sovereign
credit quality of the country of the project. We believe the credit rating of a sovereign is, generally, not an adequate anchor for
applying a rating cap, particularly in eurozone countries.
However, we believe credit ratings must adequately and consistently reflect the credit risks of a project, including risks arising from
an exposure to a country with weak economic fundamentals. This gives investors the opportunity to consistently compare credit
risks between different project finance exposures across different locations.
11 Rating sensitivity
Our project finance rating reports show the ratings’ stability with respect to shocks on risk areas that contribute to losses for
investors. Sensitivity analysis tests for shifts in the loss contributions of risk factors affecting a project and the expected recovery
rate. This analysis illustrates how intensely ratings depend on the assessment of risk factors and the recovery assumption for a
given project finance credit exposure. Sensitivity test scenarios should not be interpreted as likely or expected scenarios.
Figure 30 shows the typical sensitivity scenarios we report as part of the rating analysis. We could decide to lower the final rating
assigned to a project finance exposure to increase the rating’s stability in cases where excessive sensitivity to any key analytical
assumption compromises an adequate level of stability for a rating.
Typical sensitivity tests considered during the analysis
Analytical assumption tested Shifts considered
Stress to all risk factors in all areas Scores reduced by one level
Shock stress to the risk area with the most
relevant credit-impairment event
Scores driving relevant risk area reduced by two
levels
Haircut to recovery 25% haircut to recovery assumptions
Source: Scope.
12 Consideration of environmental, social and governance factors
We recognise that environmental, social and governance (ESG) factors can affect a project’s cash flows and the likelihood and
severity of credit losses. The guidelines presented in this methodology embed ESG factors. Our project finance rating reports will
clearly indicate where ESG factors are drivers of credit risk, for the benefit of investors willing to comply with the principles for
responsible investment (PRI).
Appendix X shows the Project ESG Grid that we include in our rating reports to provide information on the ESG themes that we
believe are relevant for the credit risk analysis of a project finance exposure.
13 Monitoring
We monitor project finance ratings using performance reports produced by the technical advisors and the SPV. The ratings are
monitored continuously and reviewed at least once a year or earlier if warranted by events.
We consider that the restructuring of a project is the base case scenario for the analysis of impaired projects during the monitoring
phase of a rating. Nevertheless, we could apply project-specific recovery rate assumptions to all credit-impairment events (i.e.

General Project Finance Rating Methodology Project Finance
16 November 2020
27/57
recovery rates derived from cash flows of the specific project) during the monitoring analysis when a project is impaired and a
liquidation scenario appears as a materially possible option.
14 Rating model
The analytical framework described in this methodology is implemented in our proprietary rating model named PF EL Model (the
name stands for ‘project finance expected loss model’) version 1.2.
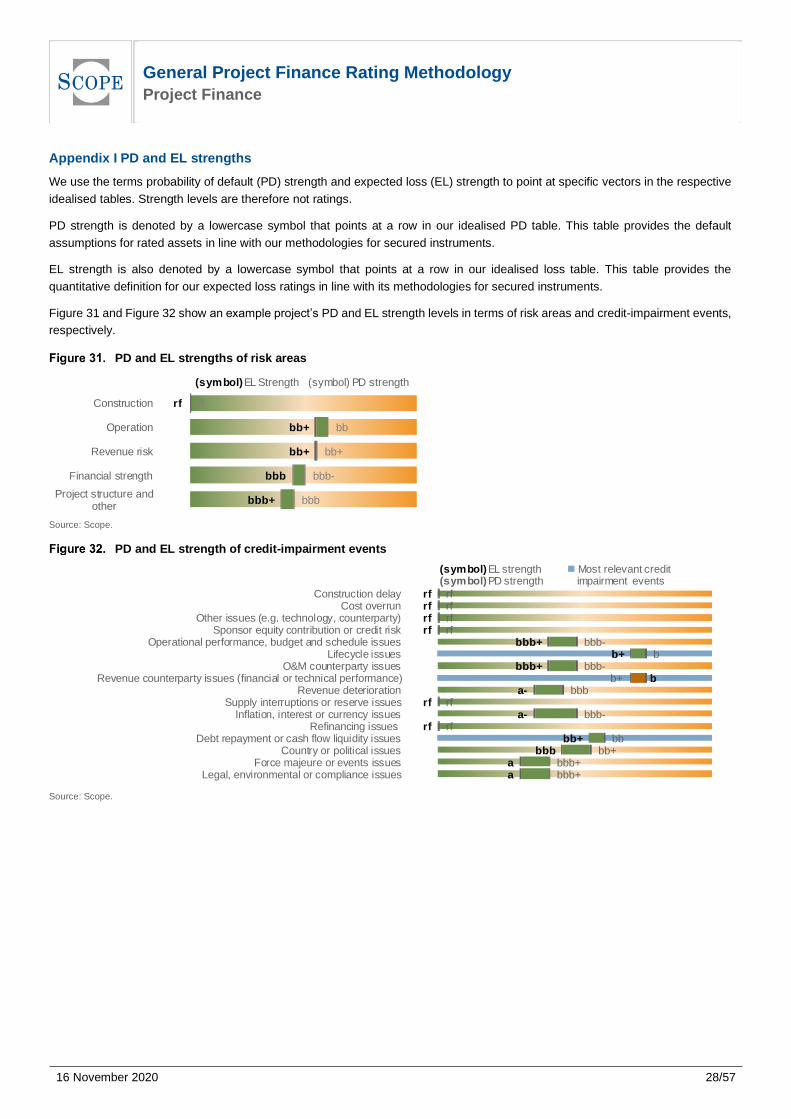
General Project Finance Rating Methodology Project Finance
16 November 2020
28/57
Appendix I PD and EL strengths
We use the terms probability of default (PD) strength and expected loss (EL) strength to point at specific vectors in the respective
idealised tables. Strength levels are therefore not ratings.
PD strength is denoted by a lowercase symbol that points at a row in our idealised PD table. This table provides the default
assumptions for rated assets in line with our methodologies for secured instruments.
EL strength is also denoted by a lowercase symbol that points at a row in our idealised loss table. This table provides the
quantitative definition for our expected loss ratings in line with its methodologies for secured instruments.
Figure 31 and Figure 32 show an example project’s PD and EL strength levels in terms of risk areas and credit-impairment events,
respectively.
PD and EL strengths of risk areas
Source: Scope.
PD and EL strength of credit-impairment events
Source: Scope.
rf
bb+
bb+
bbb
bbb+
rf
bb
bb+
bbb-
bbb
Construction
Operation
Revenue risk
Financial strength
Project structure andother
(symbol) EL Strength (symbol) PD strength
b+
rfrfrfrf
bbb+b+
bbb+
a-rf
a-rf
bb+bbb
aa
rfrfrfrf
bbb-b
bbb-
bbbrf
bbb-rf
bbbb+
bbb+bbb+
b
Construction delayCost overrun
Other issues (e.g. technology, counterparty)Sponsor equity contribution or credit risk
Operational performance, budget and schedule issuesLifecycle issues
O&M counterparty issuesRevenue counterparty issues (financial or technical performance)
Revenue deteriorationSupply interruptions or reserve issues
Inflation, interest or currency issuesRefinancing issues
Debt repayment or cash flow liquidity issuesCountry or political issues
Force majeure or events issuesLegal, environmental or compliance issues
(symbol) EL strength ◼ Most relevant credit (symbol) PD strength impairment events
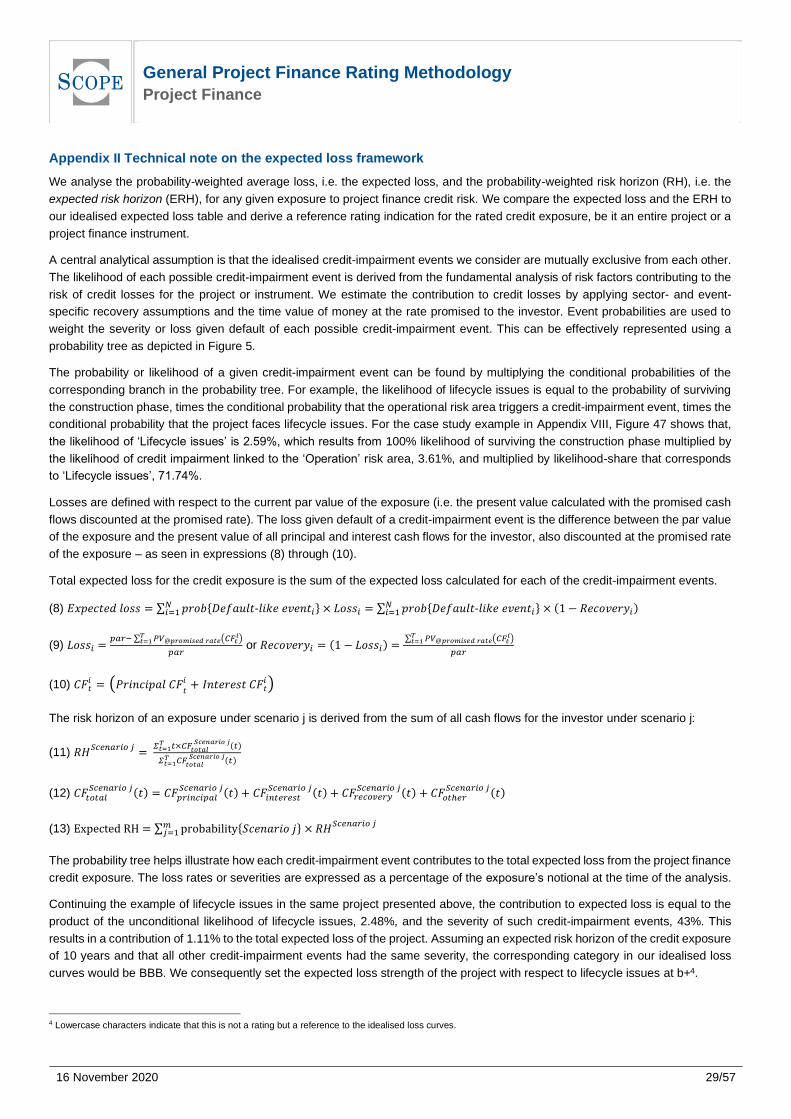
General Project Finance Rating Methodology Project Finance
16 November 2020
29/57
Appendix II Technical note on the expected loss framework
We analyse the probability-weighted average loss, i.e. the expected loss, and the probability-weighted risk horizon (RH), i.e. the
expected risk horizon (ERH), for any given exposure to project finance credit risk. We compare the expected loss and the ERH to
our idealised expected loss table and derive a reference rating indication for the rated credit exposure, be it an entire project or a
project finance instrument.
A central analytical assumption is that the idealised credit-impairment events we consider are mutually exclusive from each other.
The likelihood of each possible credit-impairment event is derived from the fundamental analysis of risk factors contributing to the
risk of credit losses for the project or instrument. We estimate the contribution to credit losses by applying sector- and event-
specific recovery assumptions and the time value of money at the rate promised to the investor. Event probabilities are used to
weight the severity or loss given default of each possible credit-impairment event. This can be effectively represented using a
probability tree as depicted in Figure 5.
The probability or likelihood of a given credit-impairment event can be found by multiplying the conditional probabilities of the
corresponding branch in the probability tree. For example, the likelihood of lifecycle issues is equal to the probability of surviving
the construction phase, times the conditional probability that the operational risk area triggers a credit-impairment event, times the
conditional probability that the project faces lifecycle issues. For the case study example in Appendix VIII, Figure 47 shows that,
the likelihood of ‘Lifecycle issues’ is 2.59%, which results from 100% likelihood of surviving the construction phase multiplied by
the likelihood of credit impairment linked to the ‘Operation’ risk area, 3.61%, and multiplied by likelihood-share that corresponds
to ‘Lifecycle issues’, 71.74%.
Losses are defined with respect to the current par value of the exposure (i.e. the present value calculated with the promised cash
flows discounted at the promised rate). The loss given default of a credit-impairment event is the difference between the par value
of the exposure and the present value of all principal and interest cash flows for the investor, also discounted at the promised rate
of the exposure – as seen in expressions (8) through (10).
Total expected loss for the credit exposure is the sum of the expected loss calculated for each of the credit-impairment events.
(8) 𝐸𝑥𝑝𝑒𝑐𝑡𝑒𝑑 𝑙𝑜𝑠𝑠 = ∑ 𝑝𝑟𝑜𝑏{ 𝑒𝑓𝑎𝑢𝑙𝑡-𝑙𝑖𝑘𝑒 𝑒𝑣𝑒𝑛𝑡𝑖}𝑁𝑖=1 𝐿𝑜𝑠𝑠𝑖 = ∑ 𝑝𝑟𝑜𝑏{ 𝑒𝑓𝑎𝑢𝑙𝑡-𝑙𝑖𝑘𝑒 𝑒𝑣𝑒𝑛𝑡𝑖}
𝑁𝑖=1 (1 − 𝑅𝑒𝑐𝑜𝑣𝑒𝑟𝑦𝑖)
(9) 𝐿𝑜𝑠𝑠𝑖 =𝑝𝑎𝑟− ∑ 𝑃𝑉@𝑝𝑟𝑜𝑚𝑖𝑠𝑒𝑑 𝑟𝑎𝑡𝑒(𝐶𝐹𝑡
𝑖)𝑇𝑡=1
𝑝𝑎𝑟 or 𝑅𝑒𝑐𝑜𝑣𝑒𝑟𝑦𝑖 = (1 − 𝐿𝑜𝑠𝑠𝑖) =
∑ 𝑃𝑉@𝑝𝑟𝑜𝑚𝑖𝑠𝑒𝑑 𝑟𝑎𝑡𝑒(𝐶𝐹𝑡𝑖)𝑇
𝑡=1
𝑝𝑎𝑟
(10) 𝐹𝑡𝑖 = (𝑃𝑟𝑖𝑛𝑐𝑖𝑝𝑎𝑙 𝐹
𝑡𝑖 𝐼𝑛𝑡𝑒𝑟𝑒𝑠𝑡 𝐹𝑡
𝑖)
The risk horizon of an exposure under scenario j is derived from the sum of all cash flows for the investor under scenario j:
(11) 𝑅𝐻 𝑐𝑒𝑛𝑎𝑟𝑖𝑜
= 𝛴𝑡=1𝑇 𝑡 𝐶𝐹𝑡𝑜𝑡𝑎𝑙
𝑆𝑐𝑒𝑛𝑎𝑟𝑖𝑜 𝑗(𝑡)
𝛴𝑡=1𝑇 𝐶𝐹
𝑡𝑜𝑡𝑎𝑙 𝑆𝑐𝑒𝑛𝑎𝑟𝑖𝑜 𝑗(𝑡)
(12) 𝐹𝑡𝑜𝑡𝑎𝑙 𝑐𝑒𝑛𝑎𝑟𝑖𝑜 (𝑡) = 𝐹𝑝𝑟𝑖𝑛𝑐𝑖𝑝𝑎𝑙
𝑐𝑒𝑛𝑎𝑟𝑖𝑜 (𝑡) 𝐹𝑖𝑛𝑡𝑒𝑟𝑒𝑠𝑡 𝑐𝑒𝑛𝑎𝑟𝑖𝑜 (𝑡) 𝐹𝑟𝑒𝑐𝑜𝑣𝑒𝑟𝑦
𝑐𝑒𝑛𝑎𝑟𝑖𝑜 (𝑡) 𝐹𝑜𝑡ℎ𝑒𝑟 𝑐𝑒𝑛𝑎𝑟𝑖𝑜 (𝑡)
(13) Exp c RH = ∑ probabili y{𝑆𝑐𝑒𝑛𝑎𝑟𝑖𝑜 𝑗} 𝑅𝐻 𝑐𝑒𝑛𝑎𝑟𝑖𝑜 𝑚
=1
The probability tree helps illustrate how each credit-impairment event contributes to the total expected loss from the project finance
credit exposure. The loss rates or severities are expressed as a percentage of the exposure’s notional at the time of the analysis.
Continuing the example of lifecycle issues in the same project presented above, the contribution to expected loss is equal to the
product of the unconditional likelihood of lifecycle issues, 2.48%, and the severity of such credit-impairment events, 43%. This
results in a contribution of 1.11% to the total expected loss of the project. Assuming an expected risk horizon of the credit exposure
of 10 years and that all other credit-impairment events had the same severity, the corresponding category in our idealised loss
curves would be BBB. We consequently set the expected loss strength of the project with respect to lifecycle issues at b+4.
4 Lowercase characters indicate that this is not a rating but a reference to the idealised loss curves.
General Project Finance Rating Methodology Project Finance
16 November 2020
30/57
Finally, total expected loss in this example is the sum of all contributions as shown in Figure 33, for a total of 3.49%. This total
expected loss over an expected risk horizon of 13.7 years is commensurate with a BBB expected loss rating because it is greater
than 2.66%, the maximum expected loss on a BBB+ exposure over 10 years, and smaller than (or equal to) 3.75%, the maximum
expected loss on a BBB exposure over 13.7 years.
Notably, the expected loss rating of the project in this example is one notch higher than the implicit PD strength of the project, bbb-
(i.e. 8.5% over 13.7 years, as per the our idealised PD curves).
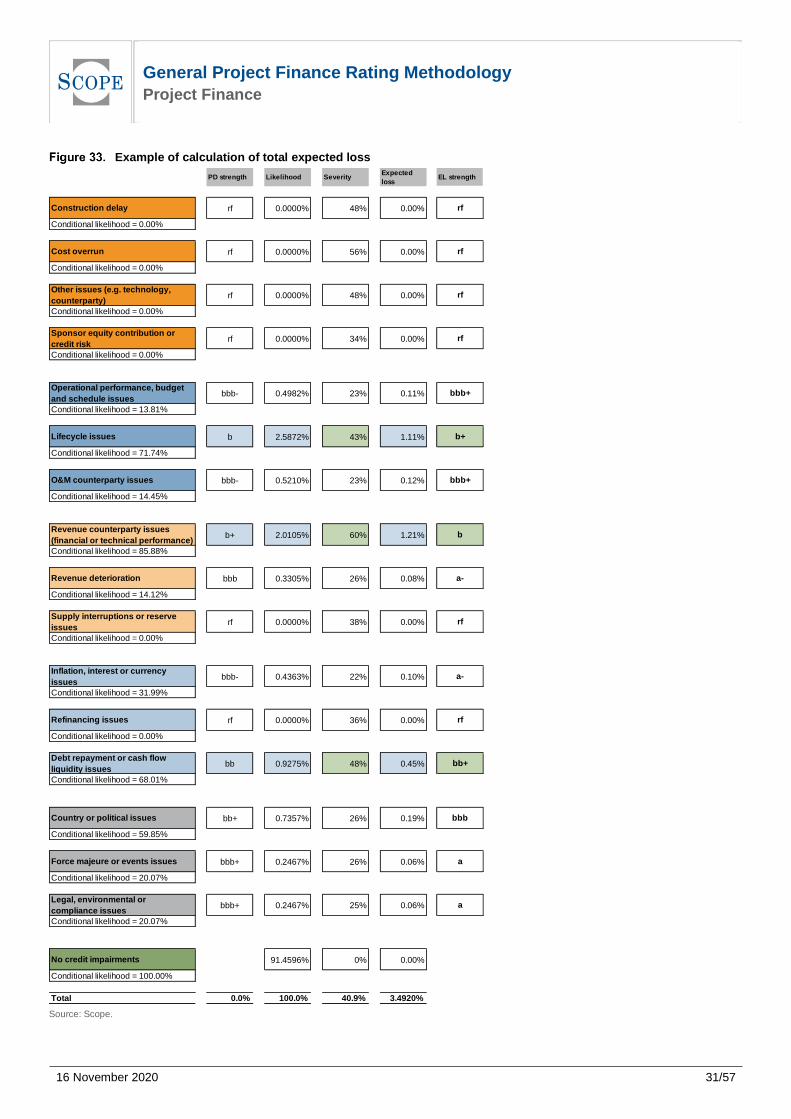
General Project Finance Rating Methodology Project Finance
16 November 2020
31/57
Example of calculation of total expected loss
Source: Scope.
PD strength Likelihood SeverityExpected
lossEL strength
Construction delay rf 0.0000% 48% 0.00% rf
Conditional likelihood = 0.00%
Cost overrun rf 0.0000% 56% 0.00% rf
Conditional likelihood = 0.00%
Other issues (e.g. technology,
counterparty)rf 0.0000% 48% 0.00% rf
Conditional likelihood = 0.00%
Sponsor equity contribution or
credit riskrf 0.0000% 34% 0.00% rf
Conditional likelihood = 0.00%
Operational performance, budget
and schedule issuesbbb- 0.4982% 23% 0.11% bbb+
Conditional likelihood = 13.81%
Lifecycle issues b 2.5872% 43% 1.11% b+
Conditional likelihood = 71.74%
O&M counterparty issues bbb- 0.5210% 23% 0.12% bbb+
Conditional likelihood = 14.45%
Revenue counterparty issues
(financial or technical performance)b+ 2.0105% 60% 1.21% b
Conditional likelihood = 85.88%
Revenue deterioration bbb 0.3305% 26% 0.08% a-
Conditional likelihood = 14.12%
Supply interruptions or reserve
issuesrf 0.0000% 38% 0.00% rf
Conditional likelihood = 0.00%
Inflation, interest or currency
issuesbbb- 0.4363% 22% 0.10% a-
Conditional likelihood = 31.99%
Refinancing issues rf 0.0000% 36% 0.00% rf
Conditional likelihood = 0.00%
Debt repayment or cash flow
liquidity issuesbb 0.9275% 48% 0.45% bb+
Conditional likelihood = 68.01%
Country or political issues bb+ 0.7357% 26% 0.19% bbb
Conditional likelihood = 59.85%
Force majeure or events issues bbb+ 0.2467% 26% 0.06% a
Conditional likelihood = 20.07%
Legal, environmental or
compliance issuesbbb+ 0.2467% 25% 0.06% a
Conditional likelihood = 20.07%
No credit impairments 91.4596% 0% 0.00%
Conditional likelihood = 100.00%
Total 0.0% 100.0% 40.9% 3.4920%

General Project Finance Rating Methodology Project Finance
16 November 2020
32/57
Appendix III Technical note on timely payment
We may assign a lower rating than the rating obtained from the expected loss and expected risk horizon if the likelihood of
impairment (i.e. the probability of project restructuring) is high relative to the expected loss. We expect this to be an uncommon
scenario because expected recovery rates in project finance do not tend to be extremely high, due to the bar-belling of recovery
distributions.
We assess the probability of restructuring in the context of the exposure’s risk horizon to determine the implicit PD strength of the
instrument, based solely on the likelihood of impairment as defined in this methodology. We then determine the distance between
the PD strength that corresponds to the instrument’s impairment likelihood and the rating obtained from the expected loss.
We limit the expected loss rating when it is much higher than the PD strength of the instrument. The maximum distance between
the expected loss rating and the PD strength is defined by considering the relationship between the long- and short-term rating
scales published in our methodologies for fundamental credit ratings and available at www.scoperatings.com.
Most project finance ratings will reflect a two-notch uplift from the corresponding PD strength because the security package
available to project finance investors typically allows for recovery levels of above 50%; only rarely does this uplift exceed four
notches. We will limit the expected loss rating if the PD strength aligns with a short-term category in the fundamental credit rating
scale which is at most one step – in the short-term scale – lower than the short-term category corresponding to the expected loss
rating. In such case, we will assign an expected loss rating equal to the highest long-term rating possible for the matching short-
term rating that is one step – in the short-term scale – higher than the short-term category that corresponds to the PD strength of
the instrument.
For example, we will typically assign a rating of A when the expected loss rating is A+ and the PD strength is bb+. This is because
the corporate short-term rating which corresponds to an A+ is S-1+/S-1, and the short-term rating that corresponds to a PD strength
of bb+ is S-3, which is more than one short-term category away from S-1. Consequently, the expected loss rating is limited at the
highest rating that corresponds to a short-term S-2 category (i.e. one level above S-3): A.
The above does not apply in transactions where there is external credit support, like those protected by export credit agency (ECA)
guarantees, because in such cases the expected loss is delinked from the project itself.
Defaulted credit exposures will be flagged with a D and we will also maintain an expected loss rating to show the severity expected.
For example, if we expect losses for the investor to be between 19.5% and 30.8% over a resolution period of two years, the rating
will be expressed in the following way: D (expected loss CC).
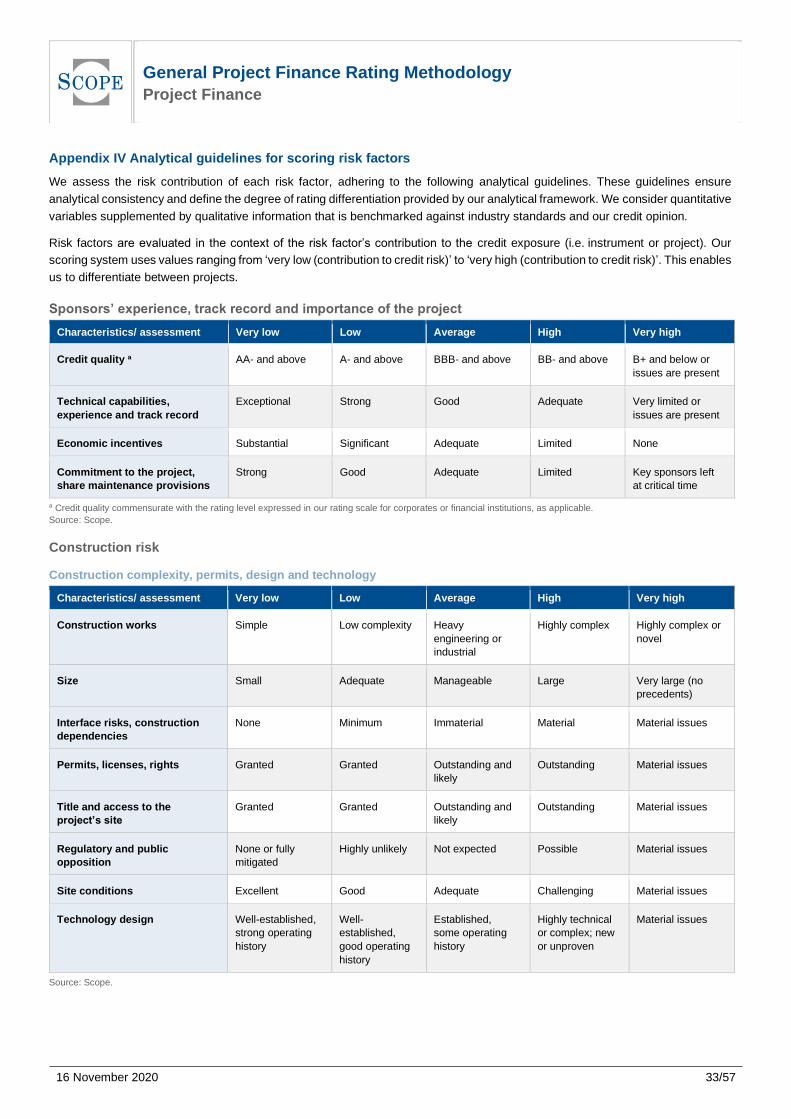
General Project Finance Rating Methodology Project Finance
16 November 2020
33/57
Appendix IV Analytical guidelines for scoring risk factors
We assess the risk contribution of each risk factor, adhering to the following analytical guidelines. These guidelines ensure
analytical consistency and define the degree of rating differentiation provided by our analytical framework. We consider quantitative
variables supplemented by qualitative information that is benchmarked against industry standards and our credit opinion.
Risk factors are evaluated in the context of the risk factor’s contribution to the credit exposure (i.e. instrument or project). Our
scoring system uses values ranging from ‘very low (contribution to credit risk)’ to ‘very high (contribution to credit risk)’. This enables
us to differentiate between projects.
S r ’ r , r r r m r f h r j
Characteristics/ assessment Very low Low Average High Very high
Credit quality a AA- and above A- and above BBB- and above BB- and above B+ and below or
issues are present
Technical capabilities,
experience and track record
Exceptional Strong Good Adequate Very limited or
issues are present
Economic incentives Substantial Significant Adequate Limited None
Commitment to the project,
share maintenance provisions
Strong Good Adequate Limited Key sponsors left
at critical time
a Credit quality commensurate with the rating level expressed in our rating scale for corporates or financial institutions, as applicable.
Source: Scope.
Construction risk
Construction complexity, permits, design and technology
Characteristics/ assessment Very low Low Average High Very high
Construction works Simple Low complexity Heavy
engineering or
industrial
Highly complex Highly complex or
novel
Size Small Adequate Manageable Large Very large (no
precedents)
Interface risks, construction
dependencies
None Minimum Immaterial Material Material issues
Permits, licenses, rights Granted Granted Outstanding and
likely
Outstanding Material issues
Title and access to the
r j ’
Granted Granted Outstanding and
likely
Outstanding Material issues
Regulatory and public
opposition
None or fully
mitigated
Highly unlikely Not expected Possible Material issues
Site conditions Excellent Good Adequate Challenging Material issues
Technology design Well-established,
strong operating
history
Well-
established,
good operating
history
Established,
some operating
history
Highly technical
or complex; new
or unproven
Material issues
Source: Scope.
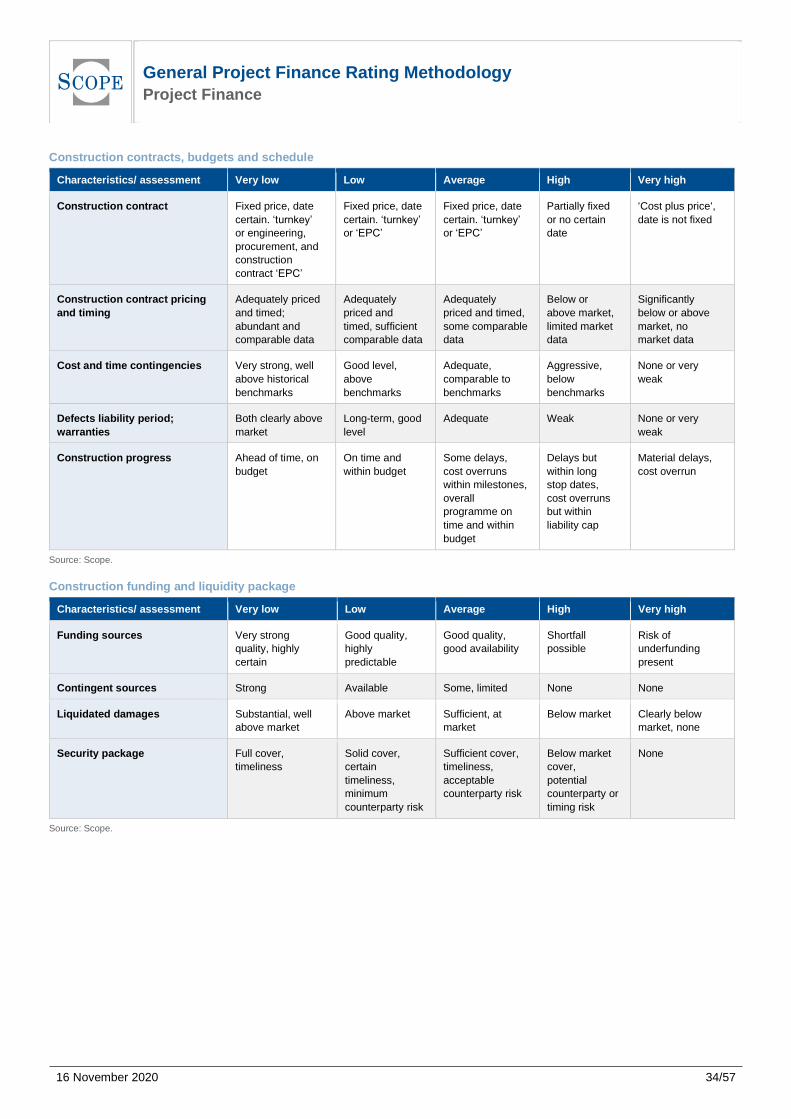
General Project Finance Rating Methodology Project Finance
16 November 2020
34/57
Construction contracts, budgets and schedule
Characteristics/ assessment Very low Low Average High Very high
Construction contract Fixed price, date
certain. ‘turnkey’
or engineering,
procurement, and
construction
contract ‘EPC’
Fixed price, date
certain. ‘turnkey’
or ‘EPC’
Fixed price, date
certain. ‘turnkey’
or ‘EPC’
Partially fixed
or no certain
date
‘Cost plus price‘,
date is not fixed
Construction contract pricing
and timing
Adequately priced
and timed;
abundant and
comparable data
Adequately
priced and
timed, sufficient
comparable data
Adequately
priced and timed,
some comparable
data
Below or
above market,
limited market
data
Significantly
below or above
market, no
market data
Cost and time contingencies Very strong, well
above historical
benchmarks
Good level,
above
benchmarks
Adequate,
comparable to
benchmarks
Aggressive,
below
benchmarks
None or very
weak
Defects liability period;
warranties
Both clearly above
market
Long-term, good
level
Adequate Weak None or very
weak
Construction progress Ahead of time, on
budget
On time and
within budget
Some delays,
cost overruns
within milestones,
overall
programme on
time and within
budget
Delays but
within long
stop dates,
cost overruns
but within
liability cap
Material delays,
cost overrun
Source: Scope.
Construction funding and liquidity package
Characteristics/ assessment Very low Low Average High Very high
Funding sources Very strong
quality, highly
certain
Good quality,
highly
predictable
Good quality,
good availability
Shortfall
possible
Risk of
underfunding
present
Contingent sources Strong Available Some, limited None None
Liquidated damages Substantial, well
above market
Above market Sufficient, at
market
Below market Clearly below
market, none
Security package Full cover,
timeliness
Solid cover,
certain
timeliness,
minimum
counterparty risk
Sufficient cover,
timeliness,
acceptable
counterparty risk
Below market
cover,
potential
counterparty or
timing risk
None
Source: Scope.

General Project Finance Rating Methodology Project Finance
16 November 2020
35/57
Counterparty risk
The guidelines are applicable for at least one contractor if ‘joint and severally’ liable, each one if ‘severally’ liable.
Characteristics/ assessment Very low Low Average High Very high
Credit quality a AA- and above A- and above BBB- and above,
or BB- and above
with other
characteristics at
‘very low’ level
BB- and above,
or B+ and
above with
other
characteristics
at ‘low’ level
B+ and below or
credit related
issues are
present
Technical capabilities,
experience and track record
Exceptional Strong Good Adequate Very limited or
performance
issues are
present
Fit to contractor business
model
Prestige project Highly strategic Strategic Minor
importance
None
Economic incentives Substantial Significant Adequate Limited None
Pr j ’ z f r r’
revenue base
Good Good Adequate Excessive None
Viable alternative contractors Many available Sufficient
availability
Some available Limited
availability
None
a Credit quality commensurate with the rating level expressed in our rating scale for corporates or financial institutions, as applicable.
Source: Scope.
Equity contribution risk
Sponsors contribute to construction counterparty risk if they have not provided full equity commitment up-front. In this situation,
there is a credit exposure from the risk that the sponsor does not provide pro-rata committed equity during the construction or
start-up phases.
Characteristics/ assessment Very low Low Average High Very high
Exposure No risk Fully mitigated
by parent
company
guarantee or
letter of credit
Fully mitigated
by parent
company
guarantee or
letter of credit
Mitigated by
parent
company
guarantee or
letter of credit
Not mitigated or
issues are
present
Guarantor credit quality a N/A A- and above BBB- and above BB+ and above N/A
a Credit quality commensurate with the rating level expressed in our rating scale for corporates or financial institutions, as applicable.
Source: Scope.
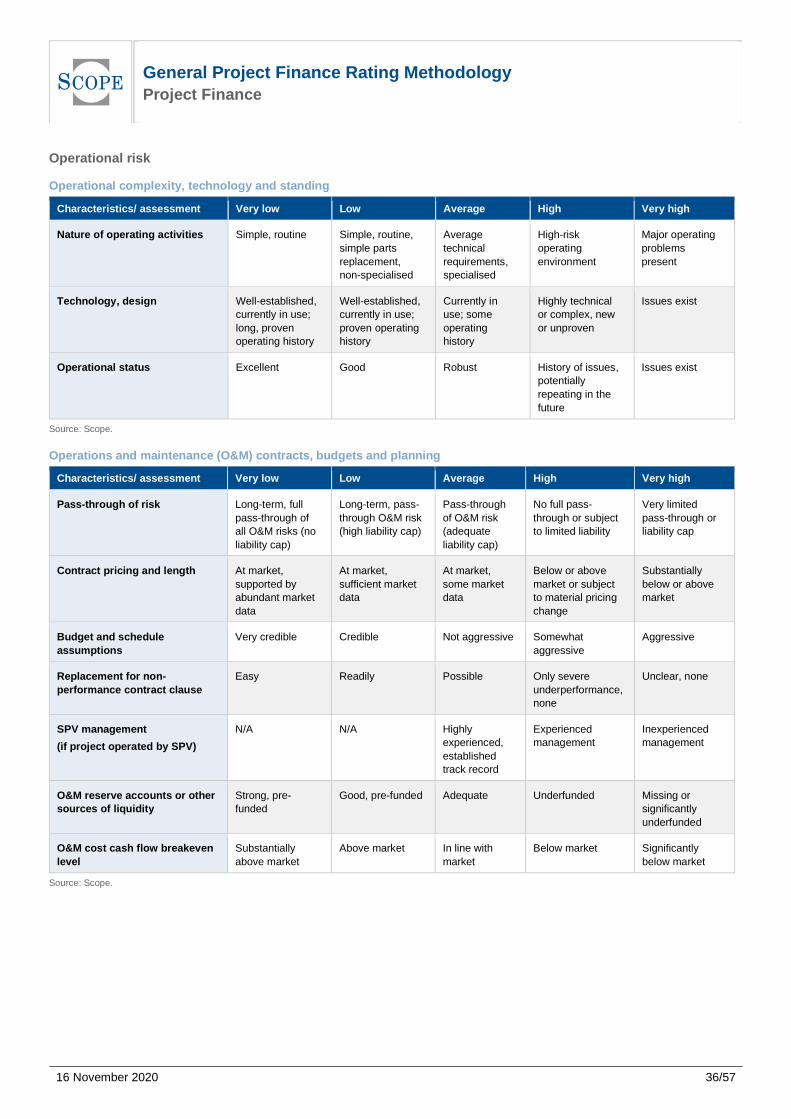
General Project Finance Rating Methodology Project Finance
16 November 2020
36/57
Operational risk
Operational complexity, technology and standing
Characteristics/ assessment Very low Low Average High Very high
Nature of operating activities Simple, routine Simple, routine,
simple parts
replacement,
non-specialised
Average
technical
requirements,
specialised
High-risk
operating
environment
Major operating
problems
present
Technology, design Well-established,
currently in use;
long, proven
operating history
Well-established,
currently in use;
proven operating
history
Currently in
use; some
operating
history
Highly technical
or complex, new
or unproven
Issues exist
Operational status Excellent Good Robust History of issues,
potentially
repeating in the
future
Issues exist
Source: Scope.
Operations and maintenance (O&M) contracts, budgets and planning
Characteristics/ assessment Very low Low Average High Very high
Pass-through of risk Long-term, full
pass-through of
all O&M risks (no
liability cap)
Long-term, pass-
through O&M risk
(high liability cap)
Pass-through
of O&M risk
(adequate
liability cap)
No full pass-
through or subject
to limited liability
Very limited
pass-through or
liability cap
Contract pricing and length At market,
supported by
abundant market
data
At market,
sufficient market
data
At market,
some market
data
Below or above
market or subject
to material pricing
change
Substantially
below or above
market
Budget and schedule
assumptions
Very credible Credible Not aggressive Somewhat
aggressive
Aggressive
Replacement for non-
performance contract clause
Easy Readily Possible Only severe
underperformance,
none
Unclear, none
SPV management
(if project operated by SPV)
N/A N/A Highly
experienced,
established
track record
Experienced
management
Inexperienced
management
O&M reserve accounts or other
sources of liquidity
Strong, pre-
funded
Good, pre-funded Adequate Underfunded Missing or
significantly
underfunded
O&M cost cash flow breakeven
level
Substantially
above market
Above market In line with
market
Below market Significantly
below market
Source: Scope.
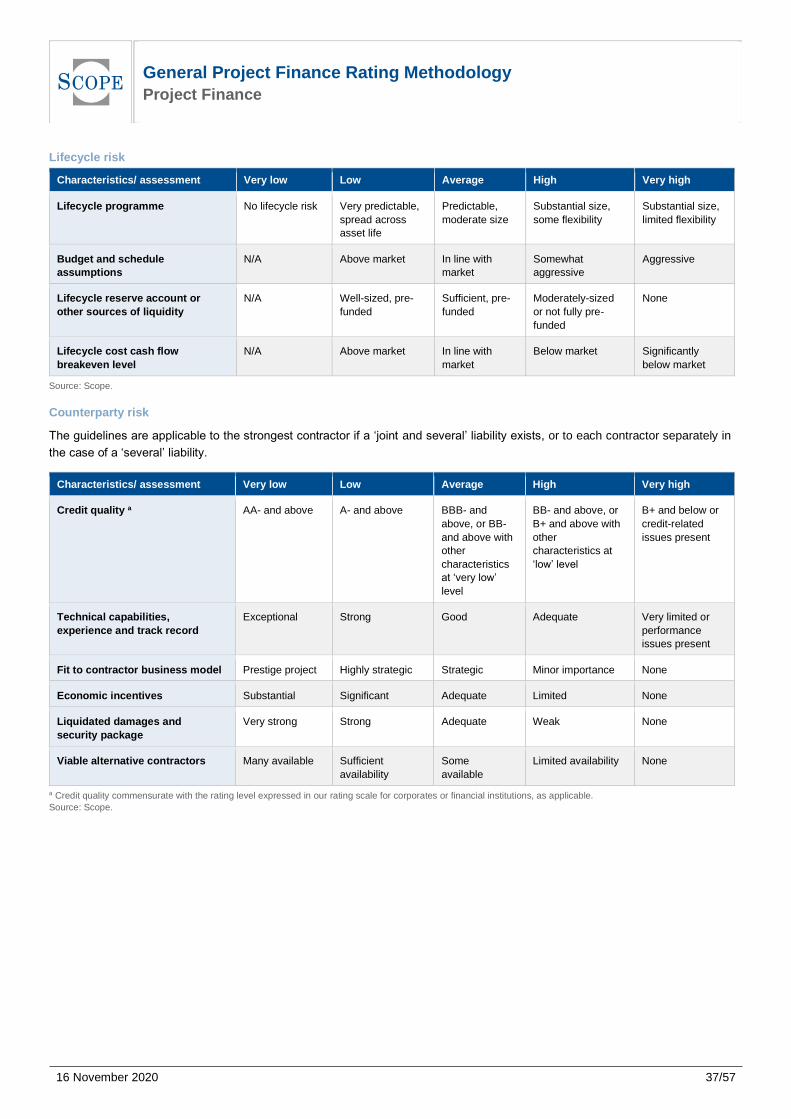
General Project Finance Rating Methodology Project Finance
16 November 2020
37/57
Lifecycle risk
Characteristics/ assessment Very low Low Average High Very high
Lifecycle programme No lifecycle risk Very predictable,
spread across
asset life
Predictable,
moderate size
Substantial size,
some flexibility
Substantial size,
limited flexibility
Budget and schedule
assumptions
N/A Above market In line with
market
Somewhat
aggressive
Aggressive
Lifecycle reserve account or
other sources of liquidity
N/A Well-sized, pre-
funded
Sufficient, pre-
funded
Moderately-sized
or not fully pre-
funded
None
Lifecycle cost cash flow
breakeven level
N/A Above market In line with
market
Below market Significantly
below market
Source: Scope.
Counterparty risk
The guidelines are applicable to the strongest contractor if a ‘joint and several’ liability exists, or to each contractor separately in
the case of a ‘several’ liability.
Characteristics/ assessment Very low Low Average High Very high
Credit quality a AA- and above A- and above BBB- and
above, or BB-
and above with
other
characteristics
at ‘very low’
level
BB- and above, or
B+ and above with
other
characteristics at
‘low’ level
B+ and below or
credit-related
issues present
Technical capabilities,
experience and track record
Exceptional Strong Good Adequate Very limited or
performance
issues present
Fit to contractor business model Prestige project Highly strategic Strategic Minor importance None
Economic incentives Substantial Significant Adequate Limited None
Liquidated damages and
security package
Very strong Strong Adequate Weak None
Viable alternative contractors Many available Sufficient
availability
Some
available
Limited availability None
a Credit quality commensurate with the rating level expressed in our rating scale for corporates or financial institutions, as applicable.
Source: Scope.
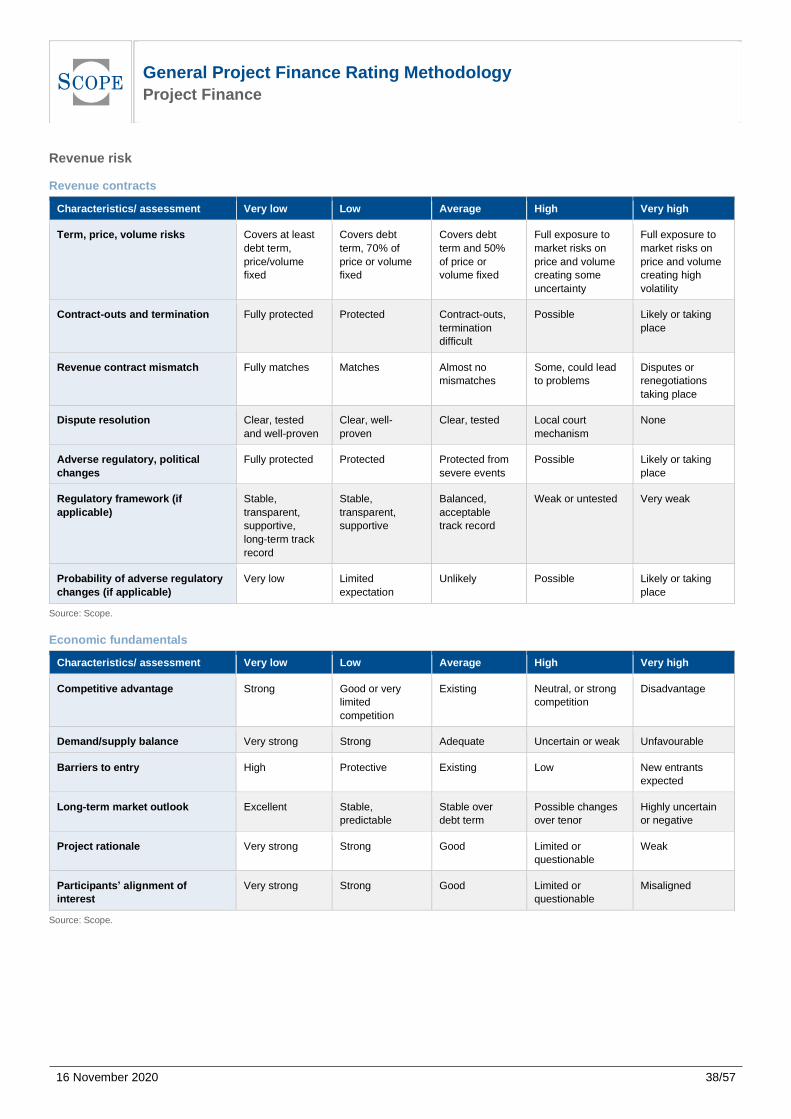
General Project Finance Rating Methodology Project Finance
16 November 2020
38/57
Revenue risk
Revenue contracts
Characteristics/ assessment Very low Low Average High Very high
Term, price, volume risks Covers at least
debt term,
price/volume
fixed
Covers debt
term, 70% of
price or volume
fixed
Covers debt
term and 50%
of price or
volume fixed
Full exposure to
market risks on
price and volume
creating some
uncertainty
Full exposure to
market risks on
price and volume
creating high
volatility
Contract-outs and termination Fully protected Protected Contract-outs,
termination
difficult
Possible Likely or taking
place
Revenue contract mismatch Fully matches Matches Almost no
mismatches
Some, could lead
to problems
Disputes or
renegotiations
taking place
Dispute resolution Clear, tested
and well-proven
Clear, well-
proven
Clear, tested Local court
mechanism
None
Adverse regulatory, political
changes
Fully protected Protected Protected from
severe events
Possible Likely or taking
place
Regulatory framework (if
applicable)
Stable,
transparent,
supportive,
long-term track
record
Stable,
transparent,
supportive
Balanced,
acceptable
track record
Weak or untested Very weak
Probability of adverse regulatory
changes (if applicable)
Very low Limited
expectation
Unlikely Possible Likely or taking
place
Source: Scope.
Economic fundamentals
Characteristics/ assessment Very low Low Average High Very high
Competitive advantage Strong Good or very
limited
competition
Existing Neutral, or strong
competition
Disadvantage
Demand/supply balance Very strong Strong Adequate Uncertain or weak Unfavourable
Barriers to entry High Protective Existing Low New entrants
expected
Long-term market outlook Excellent Stable,
predictable
Stable over
debt term
Possible changes
over tenor
Highly uncertain
or negative
Project rationale Very strong Strong Good Limited or
questionable
Weak
Participants’ alignment of
interest
Very strong Strong Good Limited or
questionable
Misaligned
Source: Scope.
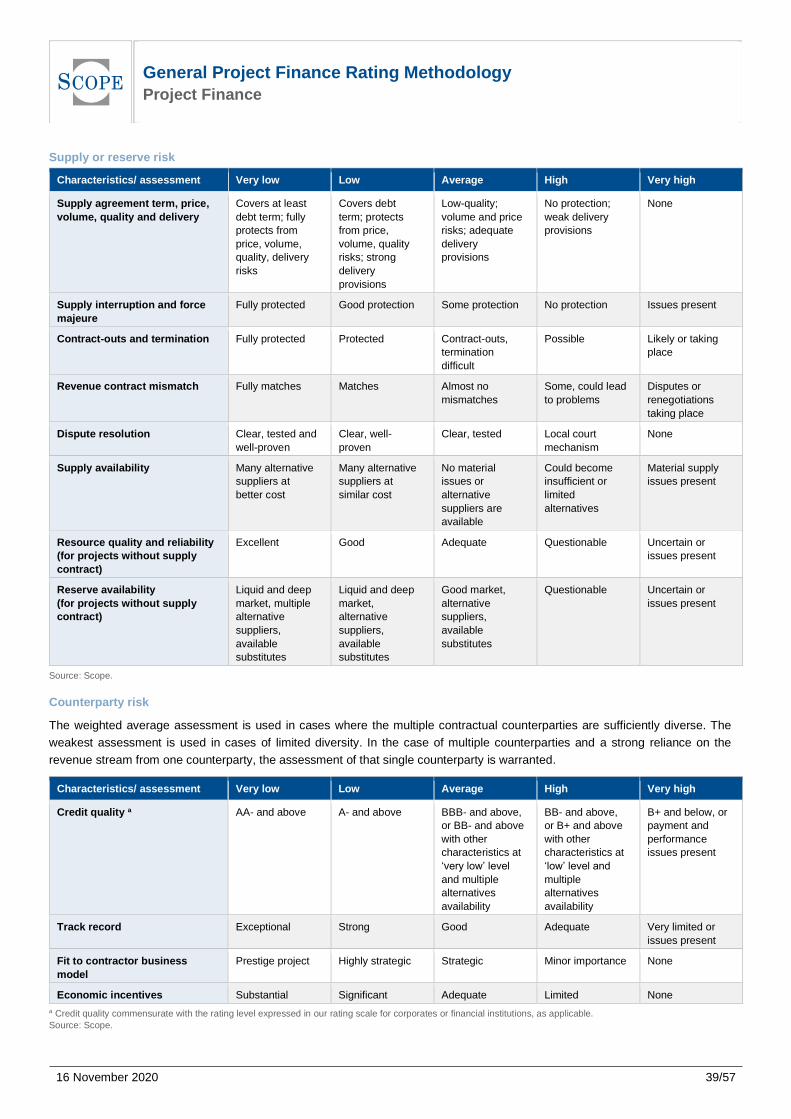
General Project Finance Rating Methodology Project Finance
16 November 2020
39/57
Supply or reserve risk
Characteristics/ assessment Very low Low Average High Very high
Supply agreement term, price,
volume, quality and delivery
Covers at least
debt term; fully
protects from
price, volume,
quality, delivery
risks
Covers debt
term; protects
from price,
volume, quality
risks; strong
delivery
provisions
Low-quality;
volume and price
risks; adequate
delivery
provisions
No protection;
weak delivery
provisions
None
Supply interruption and force
majeure
Fully protected Good protection Some protection No protection Issues present
Contract-outs and termination Fully protected Protected Contract-outs,
termination
difficult
Possible Likely or taking
place
Revenue contract mismatch Fully matches Matches Almost no
mismatches
Some, could lead
to problems
Disputes or
renegotiations
taking place
Dispute resolution Clear, tested and
well-proven
Clear, well-
proven
Clear, tested Local court
mechanism
None
Supply availability Many alternative
suppliers at
better cost
Many alternative
suppliers at
similar cost
No material
issues or
alternative
suppliers are
available
Could become
insufficient or
limited
alternatives
Material supply
issues present
Resource quality and reliability
(for projects without supply
contract)
Excellent Good Adequate Questionable Uncertain or
issues present
Reserve availability
(for projects without supply
contract)
Liquid and deep
market, multiple
alternative
suppliers,
available
substitutes
Liquid and deep
market,
alternative
suppliers,
available
substitutes
Good market,
alternative
suppliers,
available
substitutes
Questionable Uncertain or
issues present
Source: Scope.
Counterparty risk
The weighted average assessment is used in cases where the multiple contractual counterparties are sufficiently diverse. The
weakest assessment is used in cases of limited diversity. In the case of multiple counterparties and a strong reliance on the
revenue stream from one counterparty, the assessment of that single counterparty is warranted.
Characteristics/ assessment Very low Low Average High Very high
Credit quality a AA- and above A- and above BBB- and above,
or BB- and above
with other
characteristics at
‘very low’ level
and multiple
alternatives
availability
BB- and above,
or B+ and above
with other
characteristics at
‘low’ level and
multiple
alternatives
availability
B+ and below, or
payment and
performance
issues present
Track record Exceptional Strong Good Adequate Very limited or
issues present
Fit to contractor business
model
Prestige project Highly strategic Strategic Minor importance None
Economic incentives Substantial Significant Adequate Limited None
a Credit quality commensurate with the rating level expressed in our rating scale for corporates or financial institutions, as applicable.
Source: Scope.
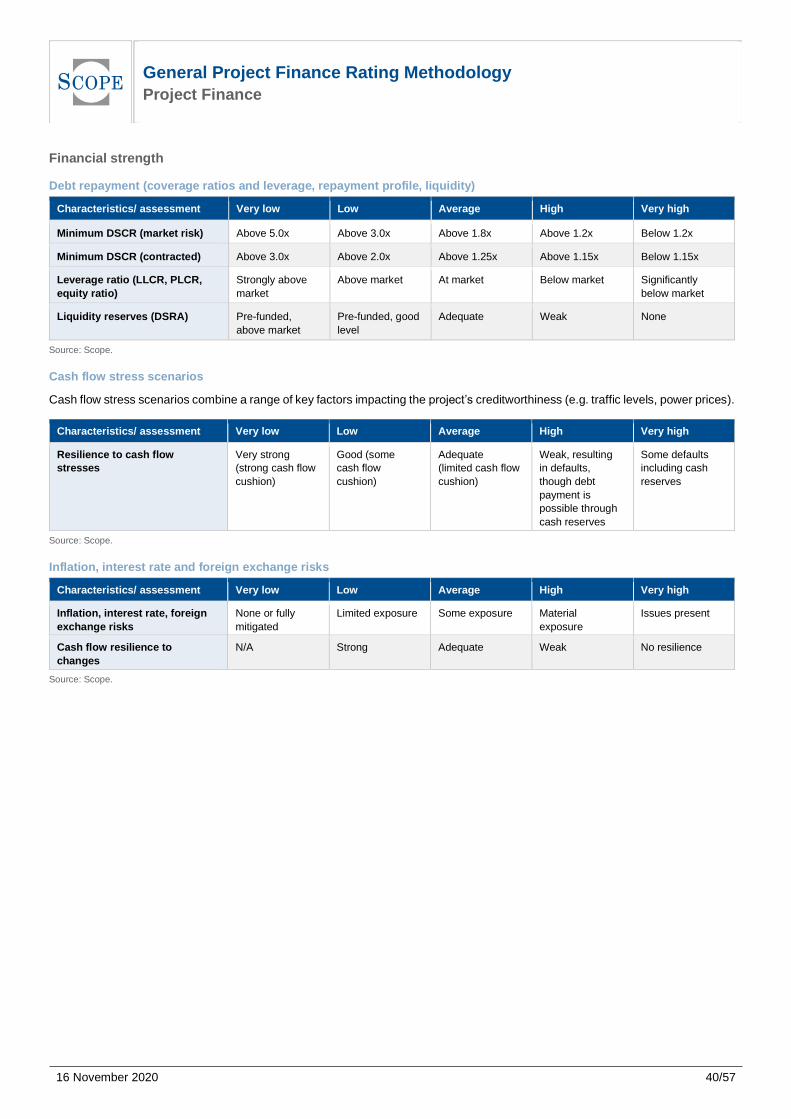
General Project Finance Rating Methodology Project Finance
16 November 2020
40/57
Financial strength
Debt repayment (coverage ratios and leverage, repayment profile, liquidity)
Characteristics/ assessment Very low Low Average High Very high
Minimum DSCR (market risk) Above 5.0x Above 3.0x Above 1.8x Above 1.2x Below 1.2x
Minimum DSCR (contracted) Above 3.0x Above 2.0x Above 1.25x Above 1.15x Below 1.15x
Leverage ratio (LLCR, PLCR,
equity ratio)
Strongly above
market
Above market At market Below market Significantly
below market
Liquidity reserves (DSRA) Pre-funded,
above market
Pre-funded, good
level
Adequate Weak None
Source: Scope.
Cash flow stress scenarios
Cash flow stress scenarios combine a range of key factors impacting the project’s creditworthiness (e.g. traffic levels, power prices).
Characteristics/ assessment Very low Low Average High Very high
Resilience to cash flow
stresses
Very strong
(strong cash flow
cushion)
Good (some
cash flow
cushion)
Adequate
(limited cash flow
cushion)
Weak, resulting
in defaults,
though debt
payment is
possible through
cash reserves
Some defaults
including cash
reserves
Source: Scope.
Inflation, interest rate and foreign exchange risks
Characteristics/ assessment Very low Low Average High Very high
Inflation, interest rate, foreign
exchange risks
None or fully
mitigated
Limited exposure Some exposure Material
exposure
Issues present
Cash flow resilience to
changes
N/A Strong Adequate Weak No resilience
Source: Scope.
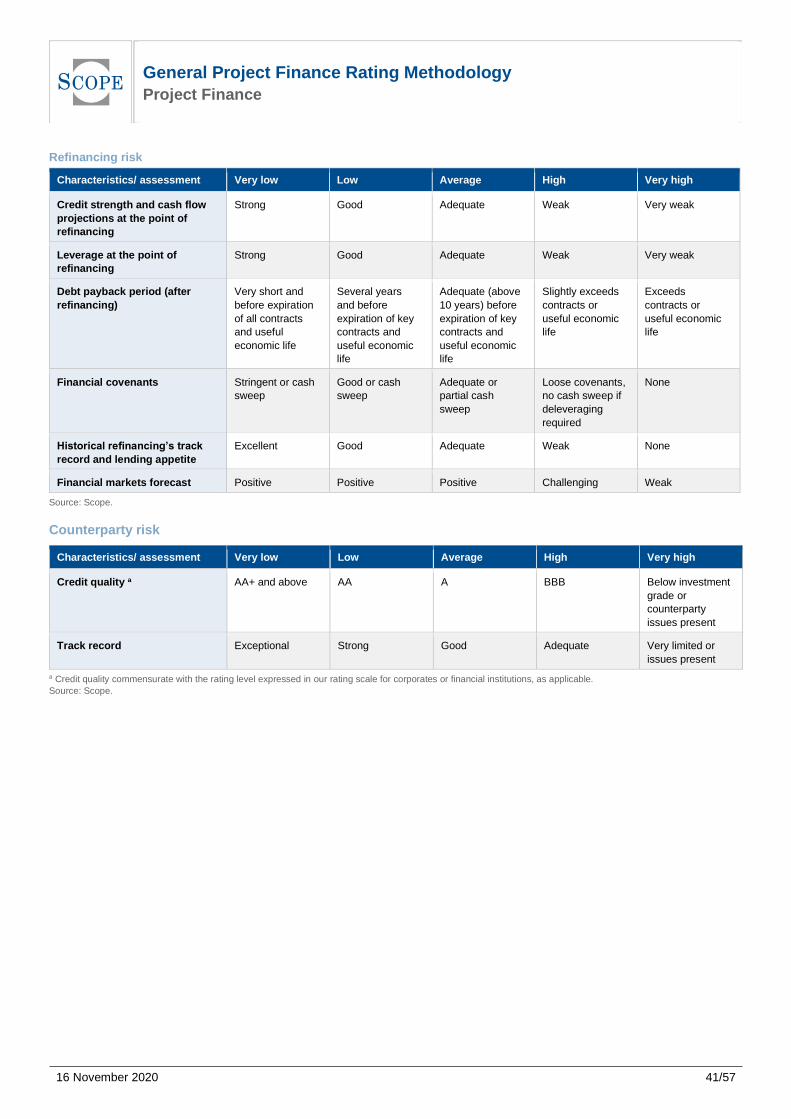
General Project Finance Rating Methodology Project Finance
16 November 2020
41/57
Refinancing risk
Characteristics/ assessment Very low Low Average High Very high
Credit strength and cash flow
projections at the point of
refinancing
Strong Good Adequate Weak Very weak
Leverage at the point of
refinancing
Strong Good Adequate Weak Very weak
Debt payback period (after
refinancing)
Very short and
before expiration
of all contracts
and useful
economic life
Several years
and before
expiration of key
contracts and
useful economic
life
Adequate (above
10 years) before
expiration of key
contracts and
useful economic
life
Slightly exceeds
contracts or
useful economic
life
Exceeds
contracts or
useful economic
life
Financial covenants Stringent or cash
sweep
Good or cash
sweep
Adequate or
partial cash
sweep
Loose covenants,
no cash sweep if
deleveraging
required
None
H r r f ’ r
record and lending appetite
Excellent Good Adequate Weak None
Financial markets forecast Positive Positive Positive Challenging Weak
Source: Scope.
Counterparty risk
Characteristics/ assessment Very low Low Average High Very high
Credit quality a AA+ and above AA A BBB Below investment
grade or
counterparty
issues present
Track record Exceptional Strong Good Adequate Very limited or
issues present
a Credit quality commensurate with the rating level expressed in our rating scale for corporates or financial institutions, as applicable.
Source: Scope.
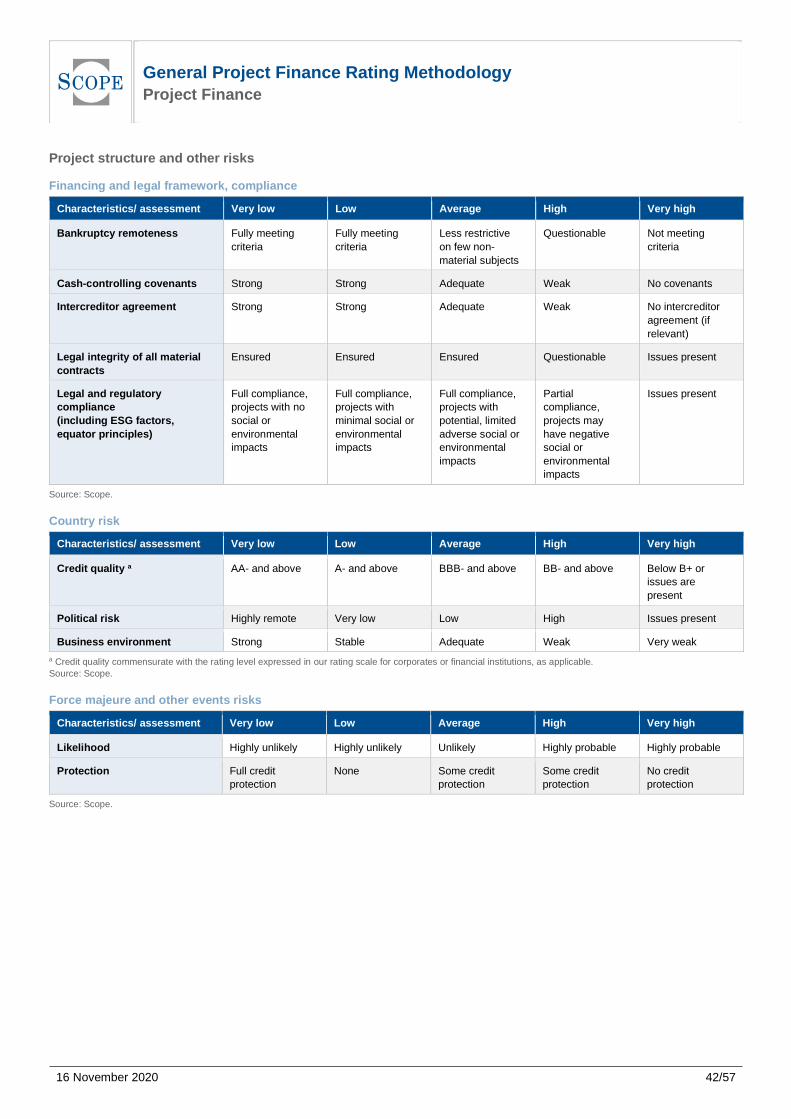
General Project Finance Rating Methodology Project Finance
16 November 2020
42/57
Project structure and other risks
Financing and legal framework, compliance
Characteristics/ assessment Very low Low Average High Very high
Bankruptcy remoteness Fully meeting
criteria
Fully meeting
criteria
Less restrictive
on few non-
material subjects
Questionable Not meeting
criteria
Cash-controlling covenants Strong Strong Adequate Weak No covenants
Intercreditor agreement Strong Strong Adequate Weak No intercreditor
agreement (if
relevant)
Legal integrity of all material
contracts
Ensured Ensured Ensured Questionable Issues present
Legal and regulatory
compliance
(including ESG factors,
equator principles)
Full compliance,
projects with no
social or
environmental
impacts
Full compliance,
projects with
minimal social or
environmental
impacts
Full compliance,
projects with
potential, limited
adverse social or
environmental
impacts
Partial
compliance,
projects may
have negative
social or
environmental
impacts
Issues present
Source: Scope.
Country risk
Characteristics/ assessment Very low Low Average High Very high
Credit quality a AA- and above A- and above BBB- and above BB- and above Below B+ or
issues are
present
Political risk Highly remote Very low Low High Issues present
Business environment Strong Stable Adequate Weak Very weak
a Credit quality commensurate with the rating level expressed in our rating scale for corporates or financial institutions, as applicable.
Source: Scope.
Force majeure and other events risks
Characteristics/ assessment Very low Low Average High Very high
Likelihood Highly unlikely Highly unlikely Unlikely Highly probable Highly probable
Protection Full credit
protection
None Some credit
protection
Some credit
protection
No credit
protection
Source: Scope.
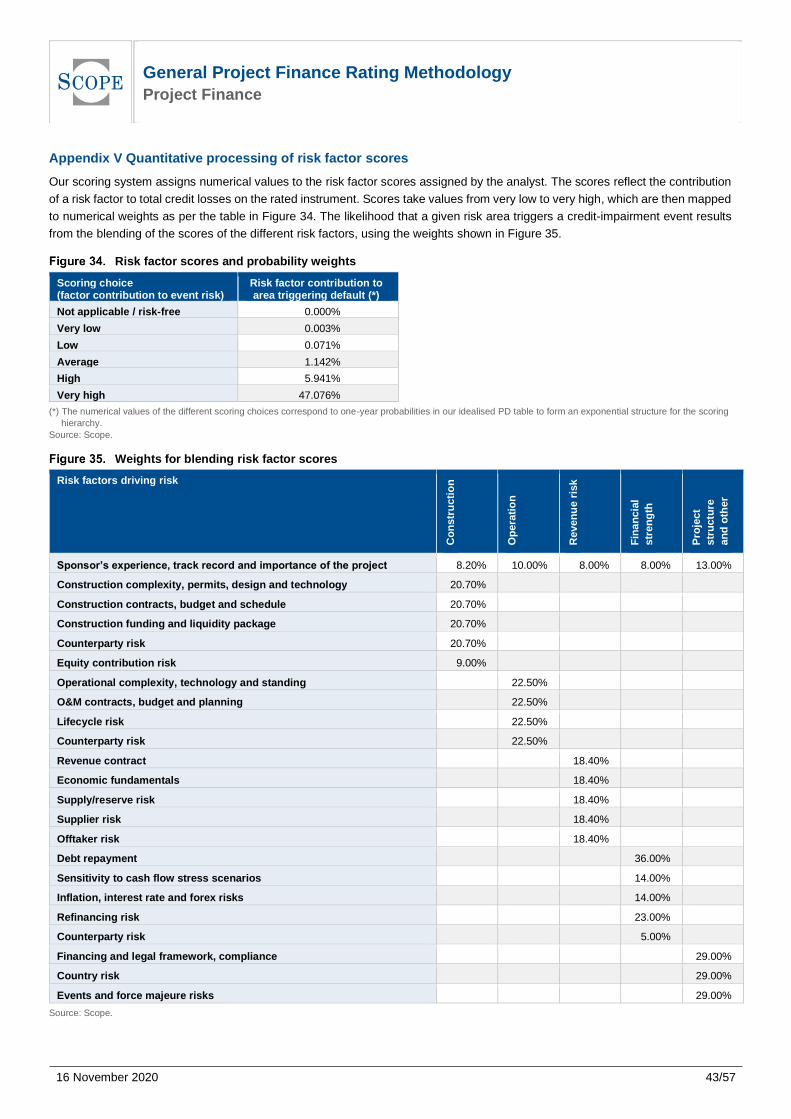
General Project Finance Rating Methodology Project Finance
16 November 2020
43/57
Appendix V Quantitative processing of risk factor scores
Our scoring system assigns numerical values to the risk factor scores assigned by the analyst. The scores reflect the contribution
of a risk factor to total credit losses on the rated instrument. Scores take values from very low to very high, which are then mapped
to numerical weights as per the table in Figure 34. The likelihood that a given risk area triggers a credit-impairment event results
from the blending of the scores of the different risk factors, using the weights shown in Figure 35.
Risk factor scores and probability weights
Scoring choice (factor contribution to event risk)
Risk factor contribution to area triggering default (*)
Not applicable / risk-free 0.000%
Very low 0.003%
Low 0.071%
Average 1.142%
High 5.941%
Very high 47.076%
(*) The numerical values of the different scoring choices correspond to one-year probabilities in our idealised PD table to form an exponential structure for the scoring
hierarchy.
Source: Scope.
Weights for blending risk factor scores
Risk factors driving risk
Co
nstr
ucti
on
Op
era
tio
n
Reven
ue r
isk
Fin
an
cia
l
str
en
gth
Pro
ject
str
uctu
re
an
d o
ther
S r’ r , r r r m r f h r j 8.20% 10.00% 8.00% 8.00% 13.00%
Construction complexity, permits, design and technology 20.70%
Construction contracts, budget and schedule 20.70%
Construction funding and liquidity package 20.70%
Counterparty risk 20.70%
Equity contribution risk 9.00%
Operational complexity, technology and standing 22.50%
O&M contracts, budget and planning 22.50%
Lifecycle risk 22.50%
Counterparty risk 22.50%
Revenue contract 18.40%
Economic fundamentals 18.40%
Supply/reserve risk 18.40%
Supplier risk 18.40%
Offtaker risk 18.40%
Debt repayment 36.00%
Sensitivity to cash flow stress scenarios 14.00%
Inflation, interest rate and forex risks 14.00%
Refinancing risk 23.00%
Counterparty risk 5.00%
Financing and legal framework, compliance 29.00%
Country risk 29.00%
Events and force majeure risks 29.00%
Source: Scope.

General Project Finance Rating Methodology Project Finance
16 November 2020
44/57
Appendix VI Analytical guidelines for scoring recovery risk factors
We assess the risk contribution of each recovery risk factor, adhering to the following analytical guidelines. These guidelines
ensure analytical consistency and define the degree of rating differentiation provided by our analytical framework. We consider
quantitative variables that are supplemented by qualitative information benchmarked against industry standards and our credit
opinion.
Recovery risk factors are evaluated in the context of the recovery risk factor’s contribution to the severity of credit-impairment
events impacting the credit exposure (i.e. instrument or project). Our recovery scoring system ranges from ‘low (contribution to
default severity)’ to ‘high (contribution to default severity)’. This enables us to differentiate between the recovery strength of projects
and adjust standard recovery assumptions accordingly.
Project security
Characteristics/assessment Average High
Project security First ranking, in full Limited
Step-in rights Clear Limited, unclear
Intercreditor agreement Strong Weak
Source: Scope.
Collateral enforceability
Characteristics/assessment Average High
Collateral foreclosure Positive prospects Negative prospects
Track record Tested, positive Untested or negative
Source: Scope.
Recovery enhancements, termination provisions
Characteristics/assessment Low Average
Recovery enhancement
(multilateral lenders, political insurance,
termination provisions)
Yes No
Source: Scope.
Fundamental economic value of the project
Characteristics/assessment Low Average High
Fundamental characteristics of underlying
project asset
Strong Adequate Weak
Capital structure Moderate Adequate Aggressive
PLCR > 3x 1.5x - 2x < 1.5x
Source: Scope.
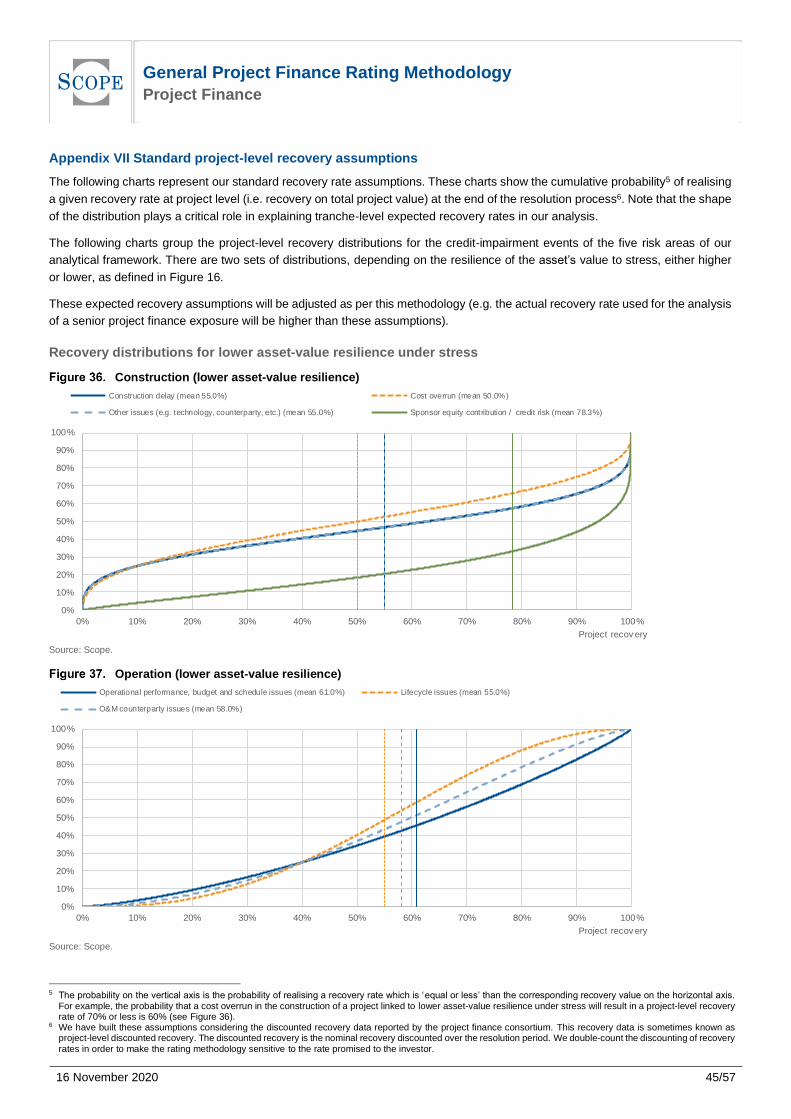
General Project Finance Rating Methodology Project Finance
16 November 2020
45/57
Appendix VII Standard project-level recovery assumptions
The following charts represent our standard recovery rate assumptions. These charts show the cumulative probability5 of realising
a given recovery rate at project level (i.e. recovery on total project value) at the end of the resolution process6. Note that the shape
of the distribution plays a critical role in explaining tranche-level expected recovery rates in our analysis.
The following charts group the project-level recovery distributions for the credit-impairment events of the five risk areas of our
analytical framework. There are two sets of distributions, depending on the resilience of the asset’s value to stress, either higher
or lower, as defined in Figure 16.
These expected recovery assumptions will be adjusted as per this methodology (e.g. the actual recovery rate used for the analysis
of a senior project finance exposure will be higher than these assumptions).
Recovery distributions for lower asset-value resilience under stress
Construction (lower asset-value resilience)
Source: Scope.
Operation (lower asset-value resilience)
Source: Scope.
5 The probability on the vertical axis is the probability of realising a recovery rate which is ‘equal or less’ than the corresponding recovery value on the horizontal axis.
For example, the probability that a cost overrun in the construction of a project linked to lower asset-value resilience under stress will result in a project-level recovery rate of 70% or less is 60% (see Figure 36).
6 We have built these assumptions considering the discounted recovery data reported by the project finance consortium. This recovery data is sometimes known as project-level discounted recovery. The discounted recovery is the nominal recovery discounted over the resolution period. We double-count the discounting of recovery rates in order to make the rating methodology sensitive to the rate promised to the investor.
0%
10%
20%
30%
40%
50%
60%
70%
80%
90%
100%
0% 10% 20% 30% 40% 50% 60% 70% 80% 90% 100%
Project recov ery
Construction delay (mean 55.0%) Cost overrun (mean 50.0%)
Other issues (e.g. technology, counterparty, etc.) (mean 55.0%) Sponsor equity contribution / credit risk (mean 78.3%)
0%
10%
20%
30%
40%
50%
60%
70%
80%
90%
100%
0% 10% 20% 30% 40% 50% 60% 70% 80% 90% 100%
Project recov ery
Operational performance, budget and schedule issues (mean 61.0%) Lifecycle issues (mean 55.0%)
O&M counterparty issues (mean 58.0%)
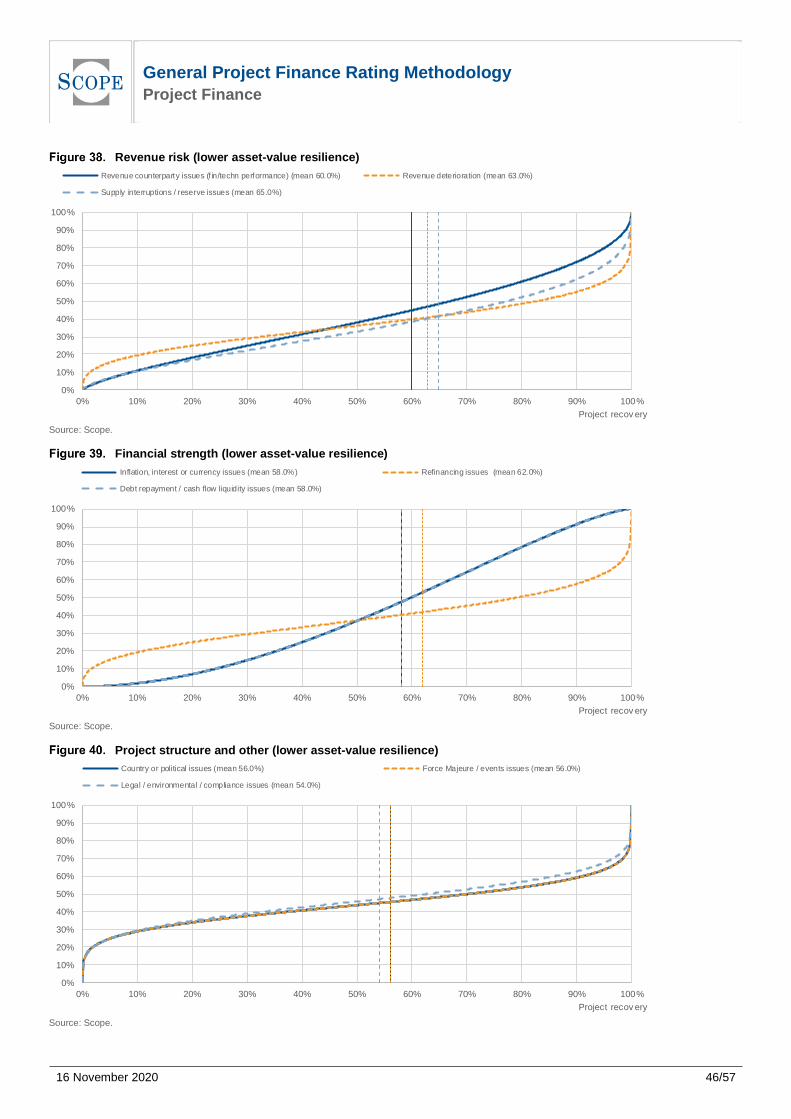
General Project Finance Rating Methodology Project Finance
16 November 2020
46/57
Revenue risk (lower asset-value resilience)
Source: Scope.
Financial strength (lower asset-value resilience)
Source: Scope.
Project structure and other (lower asset-value resilience)
Source: Scope.
0%
10%
20%
30%
40%
50%
60%
70%
80%
90%
100%
0% 10% 20% 30% 40% 50% 60% 70% 80% 90% 100%
Project recov ery
Revenue counterparty issues (f in/techn performance) (mean 60.0%) Revenue deterioration (mean 63.0%)
Supply interruptions / reserve issues (mean 65.0%)
0%
10%
20%
30%
40%
50%
60%
70%
80%
90%
100%
0% 10% 20% 30% 40% 50% 60% 70% 80% 90% 100%
Project recov ery
Inflation, interest or currency issues (mean 58.0%) Refinancing issues (mean 62.0%)
Debt repayment / cash flow liquidity issues (mean 58.0%)
0%
10%
20%
30%
40%
50%
60%
70%
80%
90%
100%
0% 10% 20% 30% 40% 50% 60% 70% 80% 90% 100%
Project recov ery
Country or political issues (mean 56.0%) Force Majeure / events issues (mean 56.0%)
Legal / environmental / compliance issues (mean 54.0%)
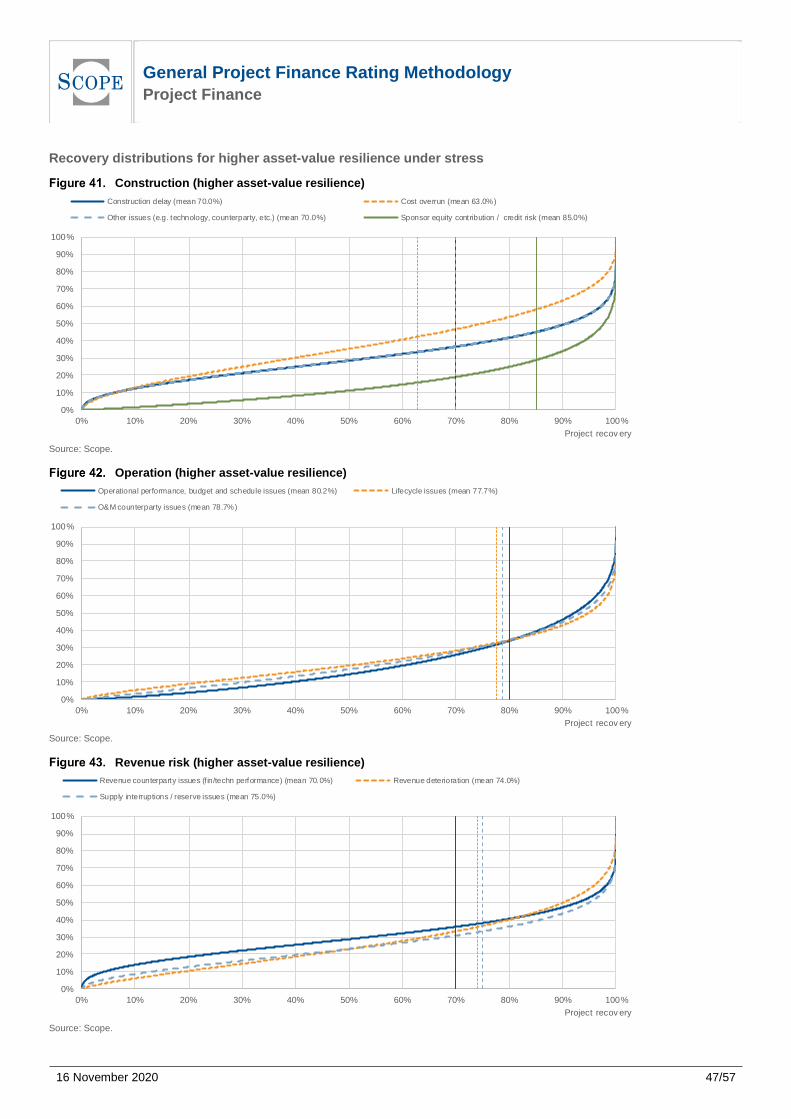
General Project Finance Rating Methodology Project Finance
16 November 2020
47/57
Recovery distributions for higher asset-value resilience under stress
Construction (higher asset-value resilience)
Source: Scope.
Operation (higher asset-value resilience)
Source: Scope.
Revenue risk (higher asset-value resilience)
Source: Scope.
0%
10%
20%
30%
40%
50%
60%
70%
80%
90%
100%
0% 10% 20% 30% 40% 50% 60% 70% 80% 90% 100%
Project recov ery
Construction delay (mean 70.0%) Cost overrun (mean 63.0%)
Other issues (e.g. technology, counterparty, etc.) (mean 70.0%) Sponsor equity contribution / credit risk (mean 85.0%)
0%
10%
20%
30%
40%
50%
60%
70%
80%
90%
100%
0% 10% 20% 30% 40% 50% 60% 70% 80% 90% 100%
Project recov ery
Operational performance, budget and schedule issues (mean 80.2%) Lifecycle issues (mean 77.7%)
O&M counterparty issues (mean 78.7%)
0%
10%
20%
30%
40%
50%
60%
70%
80%
90%
100%
0% 10% 20% 30% 40% 50% 60% 70% 80% 90% 100%
Project recov ery
Revenue counterparty issues (f in/techn performance) (mean 70.0%) Revenue deterioration (mean 74.0%)
Supply interruptions / reserve issues (mean 75.0%)
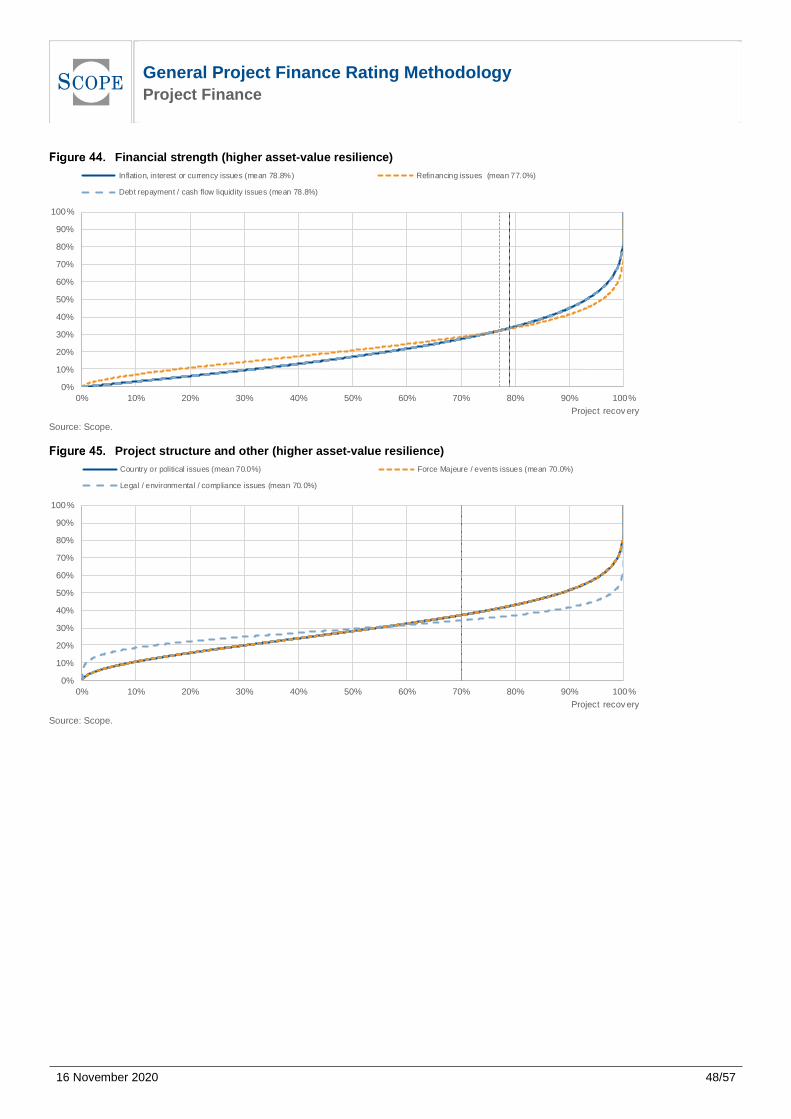
General Project Finance Rating Methodology Project Finance
16 November 2020
48/57
Financial strength (higher asset-value resilience)
Source: Scope.
Project structure and other (higher asset-value resilience)
Source: Scope.
0%
10%
20%
30%
40%
50%
60%
70%
80%
90%
100%
0% 10% 20% 30% 40% 50% 60% 70% 80% 90% 100%
Project recov ery
Inflation, interest or currency issues (mean 78.8%) Refinancing issues (mean 77.0%)
Debt repayment / cash flow liquidity issues (mean 78.8%)
0%
10%
20%
30%
40%
50%
60%
70%
80%
90%
100%
0% 10% 20% 30% 40% 50% 60% 70% 80% 90% 100%
Project recov ery
Country or political issues (mean 70.0%) Force Majeure / events issues (mean 70.0%)
Legal / environmental / compliance issues (mean 70.0%)
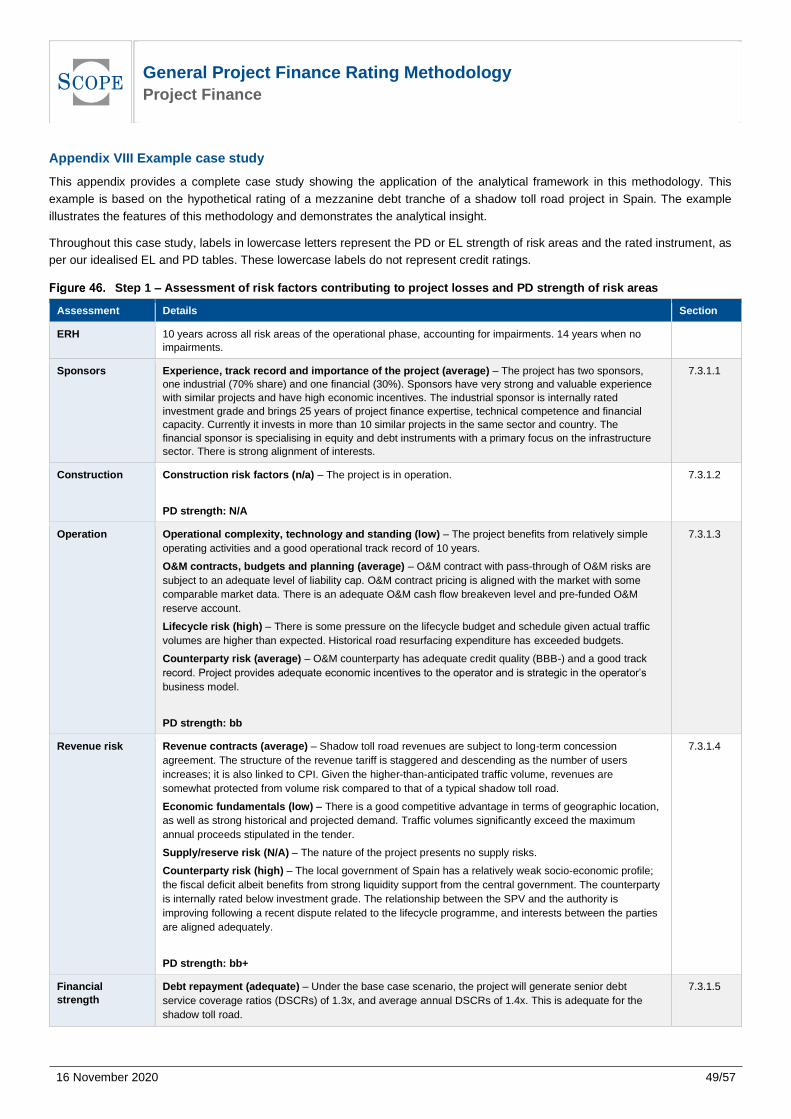
General Project Finance Rating Methodology Project Finance
16 November 2020
49/57
Appendix VIII Example case study
This appendix provides a complete case study showing the application of the analytical framework in this methodology. This
example is based on the hypothetical rating of a mezzanine debt tranche of a shadow toll road project in Spain. The example
illustrates the features of this methodology and demonstrates the analytical insight.
Throughout this case study, labels in lowercase letters represent the PD or EL strength of risk areas and the rated instrument, as
per our idealised EL and PD tables. These lowercase labels do not represent credit ratings.
Step 1 – Assessment of risk factors contributing to project losses and PD strength of risk areas
Assessment Details Section
ERH 10 years across all risk areas of the operational phase, accounting for impairments. 14 years when no
impairments.
Sponsors Experience, track record and importance of the project (average) – The project has two sponsors,
one industrial (70% share) and one financial (30%). Sponsors have very strong and valuable experience
with similar projects and have high economic incentives. The industrial sponsor is internally rated
investment grade and brings 25 years of project finance expertise, technical competence and financial
capacity. Currently it invests in more than 10 similar projects in the same sector and country. The
financial sponsor is specialising in equity and debt instruments with a primary focus on the infrastructure
sector. There is strong alignment of interests.
7.3.1.1
Construction Construction risk factors (n/a) – The project is in operation.
PD strength: N/A
7.3.1.2
Operation Operational complexity, technology and standing (low) – The project benefits from relatively simple
operating activities and a good operational track record of 10 years.
O&M contracts, budgets and planning (average) – O&M contract with pass-through of O&M risks are
subject to an adequate level of liability cap. O&M contract pricing is aligned with the market with some
comparable market data. There is an adequate O&M cash flow breakeven level and pre-funded O&M
reserve account.
Lifecycle risk (high) – There is some pressure on the lifecycle budget and schedule given actual traffic
volumes are higher than expected. Historical road resurfacing expenditure has exceeded budgets.
Counterparty risk (average) – O&M counterparty has adequate credit quality (BBB-) and a good track
record. Project provides adequate economic incentives to the operator and is strategic in the operator’s
business model.
PD strength: bb
7.3.1.3
Revenue risk Revenue contracts (average) – Shadow toll road revenues are subject to long-term concession
agreement. The structure of the revenue tariff is staggered and descending as the number of users
increases; it is also linked to CPI. Given the higher-than-anticipated traffic volume, revenues are
somewhat protected from volume risk compared to that of a typical shadow toll road.
Economic fundamentals (low) – There is a good competitive advantage in terms of geographic location,
as well as strong historical and projected demand. Traffic volumes significantly exceed the maximum
annual proceeds stipulated in the tender.
Supply/reserve risk (N/A) – The nature of the project presents no supply risks.
Counterparty risk (high) – The local government of Spain has a relatively weak socio-economic profile;
the fiscal deficit albeit benefits from strong liquidity support from the central government. The counterparty
is internally rated below investment grade. The relationship between the SPV and the authority is
improving following a recent dispute related to the lifecycle programme, and interests between the parties
are aligned adequately.
PD strength: bb+
7.3.1.4
Financial
strength
Debt repayment (adequate) – Under the base case scenario, the project will generate senior debt
service coverage ratios (DSCRs) of 1.3x, and average annual DSCRs of 1.4x. This is adequate for the
shadow toll road.
7.3.1.5
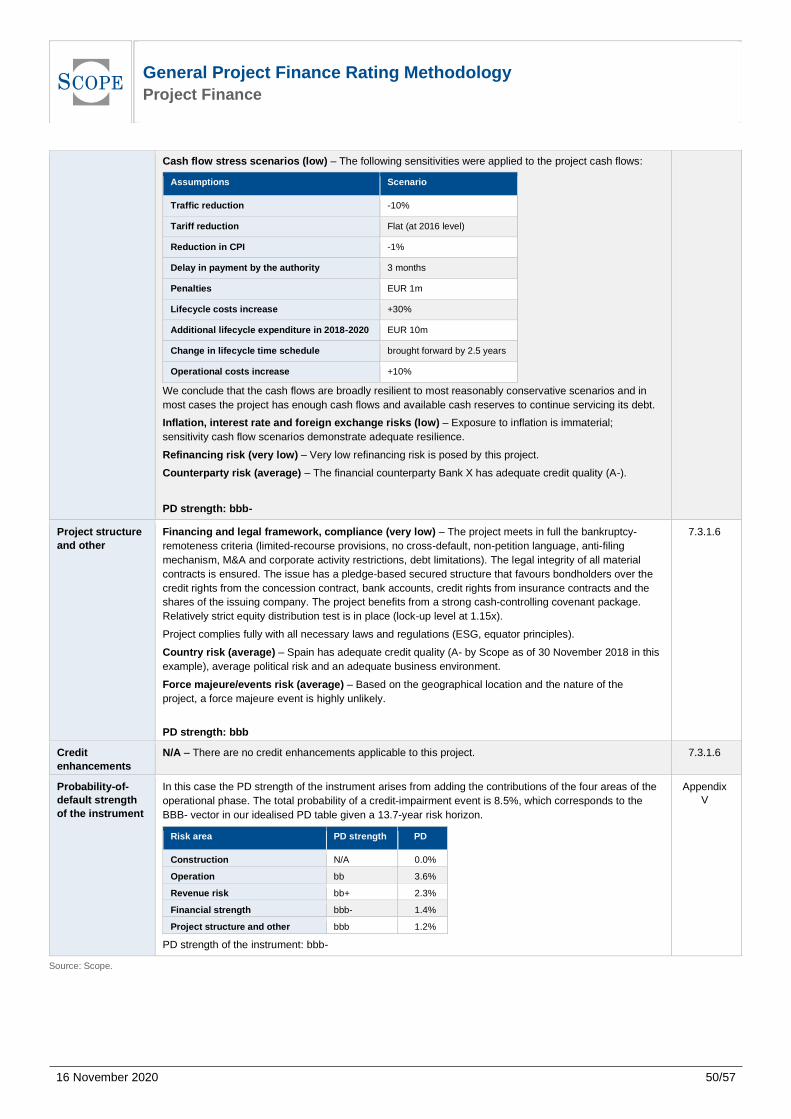
General Project Finance Rating Methodology Project Finance
16 November 2020
50/57
Cash flow stress scenarios (low) – The following sensitivities were applied to the project cash flows:
Assumptions Scenario
Traffic reduction -10%
Tariff reduction Flat (at 2016 level)
Reduction in CPI -1%
Delay in payment by the authority 3 months
Penalties EUR 1m
Lifecycle costs increase +30%
Additional lifecycle expenditure in 2018-2020 EUR 10m
Change in lifecycle time schedule brought forward by 2.5 years
Operational costs increase +10%
We conclude that the cash flows are broadly resilient to most reasonably conservative scenarios and in
most cases the project has enough cash flows and available cash reserves to continue servicing its debt.
Inflation, interest rate and foreign exchange risks (low) – Exposure to inflation is immaterial;
sensitivity cash flow scenarios demonstrate adequate resilience.
Refinancing risk (very low) – Very low refinancing risk is posed by this project.
Counterparty risk (average) – The financial counterparty Bank X has adequate credit quality (A-).
PD strength: bbb-
Project structure
and other
Financing and legal framework, compliance (very low) – The project meets in full the bankruptcy-
remoteness criteria (limited-recourse provisions, no cross-default, non-petition language, anti-filing
mechanism, M&A and corporate activity restrictions, debt limitations). The legal integrity of all material
contracts is ensured. The issue has a pledge-based secured structure that favours bondholders over the
credit rights from the concession contract, bank accounts, credit rights from insurance contracts and the
shares of the issuing company. The project benefits from a strong cash-controlling covenant package.
Relatively strict equity distribution test is in place (lock-up level at 1.15x).
Project complies fully with all necessary laws and regulations (ESG, equator principles).
Country risk (average) – Spain has adequate credit quality (A- by Scope as of 30 November 2018 in this
example), average political risk and an adequate business environment.
Force majeure/events risk (average) – Based on the geographical location and the nature of the
project, a force majeure event is highly unlikely.
PD strength: bbb
7.3.1.6
Credit
enhancements
N/A – There are no credit enhancements applicable to this project. 7.3.1.6
Probability-of-
default strength
of the instrument
In this case the PD strength of the instrument arises from adding the contributions of the four areas of the
operational phase. The total probability of a credit-impairment event is 8.5%, which corresponds to the
BBB- vector in our idealised PD table given a 13.7-year risk horizon.
Risk area PD strength PD
Construction N/A 0.0%
Operation bb 3.6%
Revenue risk bb+ 2.3%
Financial strength bbb- 1.4%
Project structure and other bbb 1.2%
PD strength of the instrument: bbb-
Appendix
V
Source: Scope.
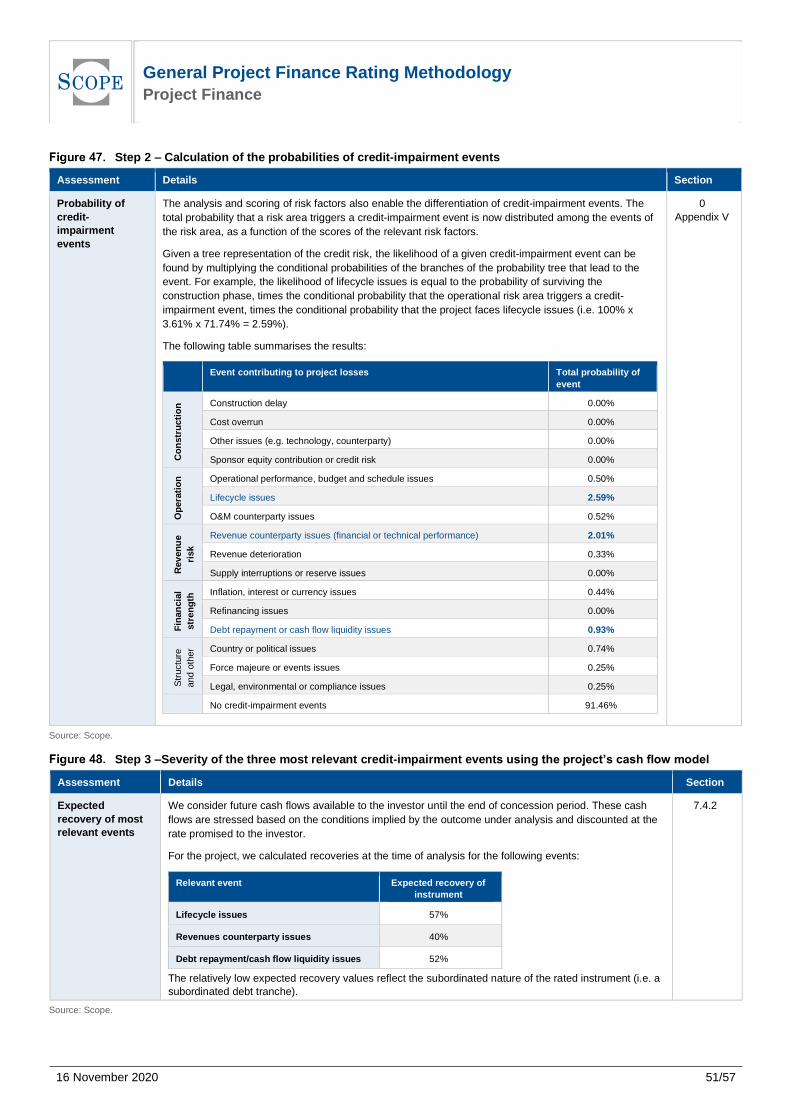
General Project Finance Rating Methodology Project Finance
16 November 2020
51/57
Step 2 – Calculation of the probabilities of credit-impairment events
Assessment Details Section
Probability of
credit-
impairment
events
The analysis and scoring of risk factors also enable the differentiation of credit-impairment events. The
total probability that a risk area triggers a credit-impairment event is now distributed among the events of
the risk area, as a function of the scores of the relevant risk factors.
Given a tree representation of the credit risk, the likelihood of a given credit-impairment event can be
found by multiplying the conditional probabilities of the branches of the probability tree that lead to the
event. For example, the likelihood of lifecycle issues is equal to the probability of surviving the
construction phase, times the conditional probability that the operational risk area triggers a credit-
impairment event, times the conditional probability that the project faces lifecycle issues (i.e. 100% x
3.61% x 71.74% = 2.59%).
The following table summarises the results:
Event contributing to project losses Total probability of
event
Co
nstr
ucti
on
Construction delay 0.00%
Cost overrun 0.00%
Other issues (e.g. technology, counterparty) 0.00%
Sponsor equity contribution or credit risk 0.00%
Op
era
tio
n
Operational performance, budget and schedule issues 0.50%
Lifecycle issues 2.59%
O&M counterparty issues 0.52%
Rev
en
ue
risk
Revenue counterparty issues (financial or technical performance) 2.01%
Revenue deterioration 0.33%
Supply interruptions or reserve issues 0.00%
Fin
an
cia
l
str
en
gth
Inflation, interest or currency issues 0.44%
Refinancing issues 0.00%
Debt repayment or cash flow liquidity issues 0.93%
Str
uctu
re
and o
ther Country or political issues 0.74%
Force majeure or events issues 0.25%
Legal, environmental or compliance issues 0.25%
No credit-impairment events 91.46%
0
Appendix V
Source: Scope.
Step 3 –Severity of the three most relevant credit-impairment event h r j ’ h f w m
Assessment Details Section
Expected
recovery of most
relevant events
We consider future cash flows available to the investor until the end of concession period. These cash
flows are stressed based on the conditions implied by the outcome under analysis and discounted at the
rate promised to the investor.
For the project, we calculated recoveries at the time of analysis for the following events:
Relevant event Expected recovery of
instrument
Lifecycle issues 57%
Revenues counterparty issues 40%
Debt repayment/cash flow liquidity issues 52%
The relatively low expected recovery values reflect the subordinated nature of the rated instrument (i.e. a
subordinated debt tranche).
7.4.2
Source: Scope.
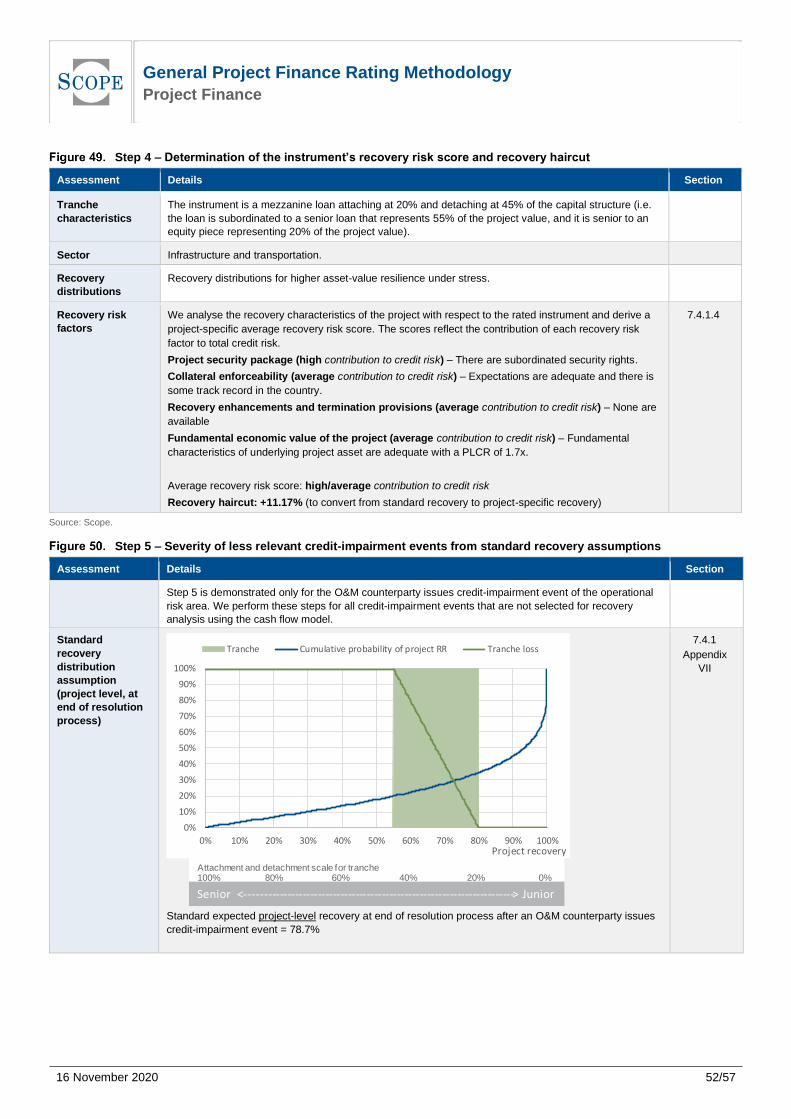
General Project Finance Rating Methodology Project Finance
16 November 2020
52/57
Step 4 – rm f h r m ’ r v r r r r v r h r
Assessment Details Section
Tranche
characteristics
The instrument is a mezzanine loan attaching at 20% and detaching at 45% of the capital structure (i.e.
the loan is subordinated to a senior loan that represents 55% of the project value, and it is senior to an
equity piece representing 20% of the project value).
Sector Infrastructure and transportation.
Recovery
distributions
Recovery distributions for higher asset-value resilience under stress.
Recovery risk
factors
We analyse the recovery characteristics of the project with respect to the rated instrument and derive a
project-specific average recovery risk score. The scores reflect the contribution of each recovery risk
factor to total credit risk.
Project security package (high contribution to credit risk) – There are subordinated security rights.
Collateral enforceability (average contribution to credit risk) – Expectations are adequate and there is
some track record in the country.
Recovery enhancements and termination provisions (average contribution to credit risk) – None are
available
Fundamental economic value of the project (average contribution to credit risk) – Fundamental
characteristics of underlying project asset are adequate with a PLCR of 1.7x.
Average recovery risk score: high/average contribution to credit risk
Recovery haircut: +11.17% (to convert from standard recovery to project-specific recovery)
7.4.1.4
Source: Scope.
Step 5 – Severity of less relevant credit-impairment events from standard recovery assumptions
Assessment Details Section
Step 5 is demonstrated only for the O&M counterparty issues credit-impairment event of the operational
risk area. We perform these steps for all credit-impairment events that are not selected for recovery
analysis using the cash flow model.
Standard
recovery
distribution
assumption
(project level, at
end of resolution
process)
Standard expected project-level recovery at end of resolution process after an O&M counterparty issues
credit-impairment event = 78.7%
7.4.1
Appendix
VII
0%
10%
20%
30%
40%
50%
60%
70%
80%
90%
100%
0% 10% 20% 30% 40% 50% 60% 70% 80% 90% 100%Project recovery
Tranche Cumulative probability of project RR Tranche loss
Attachment and detachment scale for tranche100% 80% 60% 40% 20% 0%
Senior <-----------------------------------------------------------------------> Junior
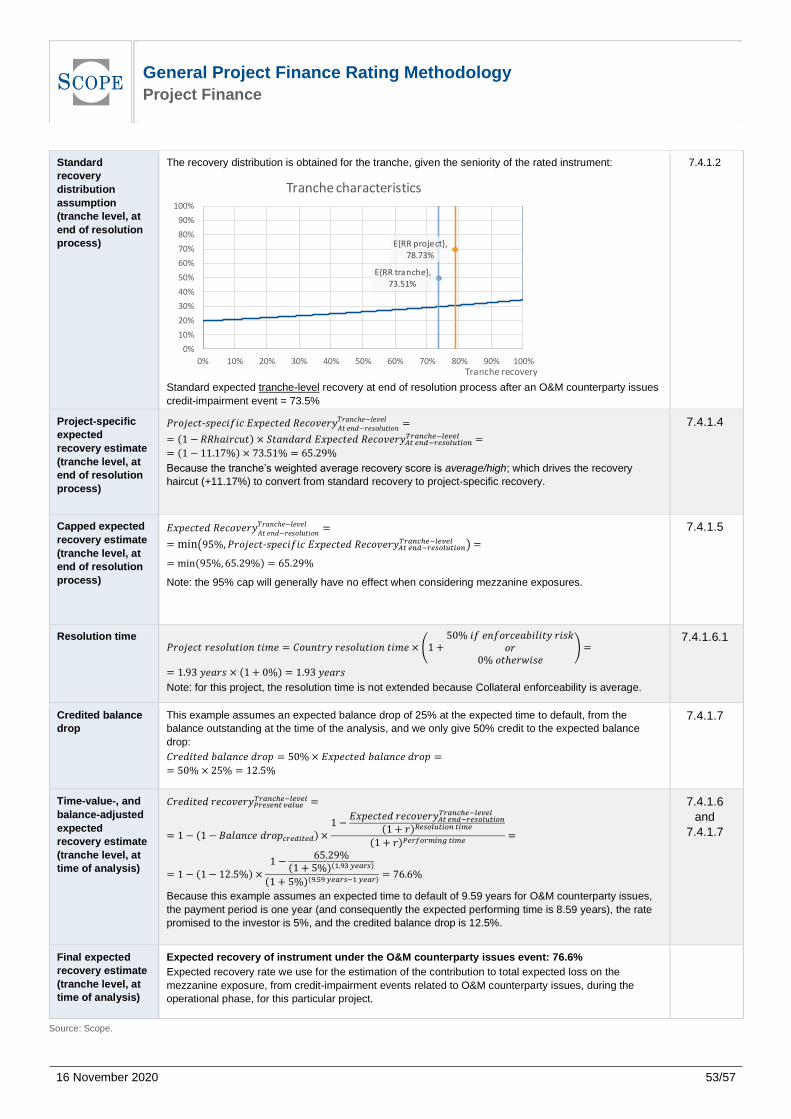
General Project Finance Rating Methodology Project Finance
16 November 2020
53/57
Standard
recovery
distribution
assumption
(tranche level, at
end of resolution
process)
The recovery distribution is obtained for the tranche, given the seniority of the rated instrument:
Standard expected tranche-level recovery at end of resolution process after an O&M counterparty issues
credit-impairment event = 73.5%
7.4.1.2
Project-specific
expected
recovery estimate
(tranche level, at
end of resolution
process)
𝑃𝑟𝑜𝑗𝑒𝑐𝑡-𝑠𝑝𝑒𝑐𝑖𝑓𝑖𝑐 𝐸𝑥𝑝𝑒𝑐𝑡𝑒𝑑 𝑅𝑒𝑐𝑜𝑣𝑒𝑟𝑦𝐴𝑡 𝑒𝑛𝑑−𝑟𝑒𝑠𝑜𝑙𝑢𝑡𝑖𝑜𝑛𝑇𝑟𝑎𝑛𝑐ℎ𝑒−𝑙𝑒𝑣𝑒𝑙 =
= (1 − 𝑅𝑅ℎ𝑎𝑖𝑟𝑐𝑢𝑡) 𝑆𝑡𝑎𝑛𝑑𝑎𝑟𝑑 𝐸𝑥𝑝𝑒𝑐𝑡𝑒𝑑 𝑅𝑒𝑐𝑜𝑣𝑒𝑟𝑦𝐴𝑡 𝑒𝑛𝑑−𝑟𝑒𝑠𝑜𝑙𝑢𝑡𝑖𝑜𝑛𝑇𝑟𝑎𝑛𝑐ℎ𝑒−𝑙𝑒𝑣𝑒𝑙 =
= (1 − 11.17%) 73.51% = 65.29%
Because the tranche’s weighted average recovery score is average/high; which drives the recovery
haircut (+11.17%) to convert from standard recovery to project-specific recovery.
7.4.1.4
Capped expected
recovery estimate
(tranche level, at
end of resolution
process)
𝐸𝑥𝑝𝑒𝑐𝑡𝑒𝑑 𝑅𝑒𝑐𝑜𝑣𝑒𝑟𝑦𝐴𝑡 𝑒𝑛𝑑−𝑟𝑒𝑠𝑜𝑙𝑢𝑡𝑖𝑜𝑛𝑇𝑟𝑎𝑛𝑐ℎ𝑒−𝑙𝑒𝑣𝑒𝑙 =
=min(95%, 𝑃𝑟𝑜𝑗𝑒𝑐𝑡-𝑠𝑝𝑒𝑐𝑖𝑓𝑖𝑐 𝐸𝑥𝑝𝑒𝑐𝑡𝑒𝑑 𝑅𝑒𝑐𝑜𝑣𝑒𝑟𝑦𝐴𝑡 𝑒𝑛𝑑−𝑟𝑒𝑠𝑜𝑙𝑢𝑡𝑖𝑜𝑛𝑇𝑟𝑎𝑛𝑐ℎ𝑒−𝑙𝑒𝑣𝑒𝑙 ) =
= min(95%,65.29%) = 65.29%
Note: the 95% cap will generally have no effect when considering mezzanine exposures.
7.4.1.5
Resolution time 𝑃𝑟𝑜𝑗𝑒𝑐𝑡 𝑟𝑒𝑠𝑜𝑙𝑢𝑡𝑖𝑜𝑛 𝑡𝑖 𝑒 = 𝑜𝑢𝑛𝑡𝑟𝑦 𝑟𝑒𝑠𝑜𝑙𝑢𝑡𝑖𝑜𝑛 𝑡𝑖 𝑒 (1
50% 𝑖𝑓 𝑒𝑛𝑓𝑜𝑟𝑐𝑒𝑎𝑏𝑖𝑙𝑖𝑡𝑦 𝑟𝑖𝑠𝑘𝑜𝑟
0% 𝑜𝑡ℎ𝑒𝑟𝑤𝑖𝑠𝑒) =
= 1.93 𝑦𝑒𝑎𝑟𝑠 (1 0%) = 1.93 𝑦𝑒𝑎𝑟𝑠
Note: for this project, the resolution time is not extended because Collateral enforceability is average.
7.4.1.6.1
Credited balance
drop
This example assumes an expected balance drop of 25% at the expected time to default, from the
balance outstanding at the time of the analysis, and we only give 50% credit to the expected balance
drop:
𝑟𝑒𝑑𝑖𝑡𝑒𝑑 𝑏𝑎𝑙𝑎𝑛𝑐𝑒 𝑑𝑟𝑜𝑝 = 50% 𝐸𝑥𝑝𝑒𝑐𝑡𝑒𝑑 𝑏𝑎𝑙𝑎𝑛𝑐𝑒 𝑑𝑟𝑜𝑝 =
= 50% 25% = 12.5%
7.4.1.7
Time-value-, and
balance-adjusted
expected
recovery estimate
(tranche level, at
time of analysis)
𝑟𝑒𝑑𝑖𝑡𝑒𝑑 𝑟𝑒𝑐𝑜𝑣𝑒𝑟𝑦𝑃𝑟𝑒𝑠𝑒𝑛𝑡 𝑣𝑎𝑙𝑢𝑒𝑇𝑟𝑎𝑛𝑐ℎ𝑒−𝑙𝑒𝑣𝑒𝑙 =
= 1 − (1 − 𝐵𝑎𝑙𝑎𝑛𝑐𝑒 𝑑𝑟𝑜𝑝𝑐𝑟𝑒𝑑𝑖𝑡𝑒𝑑) 1 −
𝐸𝑥𝑝𝑒𝑐𝑡𝑒𝑑 𝑟𝑒𝑐𝑜𝑣𝑒𝑟𝑦𝐴𝑡 𝑒𝑛𝑑−𝑟𝑒𝑠𝑜𝑙𝑢𝑡𝑖𝑜𝑛𝑇𝑟𝑎𝑛𝑐ℎ𝑒−𝑙𝑒𝑣𝑒𝑙
(1 𝑟) 𝑒𝑠𝑜𝑙𝑢𝑡𝑖𝑜𝑛 𝑡𝑖𝑚𝑒
(1 𝑟)𝑃𝑒𝑟𝑓𝑜𝑟𝑚𝑖𝑛𝑔 𝑡𝑖𝑚𝑒=
= 1 − (1 − 12.5%) 1 −
65.29%(1 5%)(1.93 𝑦𝑒𝑎𝑟𝑠)
(1 5%)(9.59 𝑦𝑒𝑎𝑟𝑠−1 𝑦𝑒𝑎𝑟)= 76.6%
Because this example assumes an expected time to default of 9.59 years for O&M counterparty issues,
the payment period is one year (and consequently the expected performing time is 8.59 years), the rate
promised to the investor is 5%, and the credited balance drop is 12.5%.
7.4.1.6
and
7.4.1.7
Final expected
recovery estimate
(tranche level, at
time of analysis)
Expected recovery of instrument under the O&M counterparty issues event: 76.6%
Expected recovery rate we use for the estimation of the contribution to total expected loss on the
mezzanine exposure, from credit-impairment events related to O&M counterparty issues, during the
operational phase, for this particular project.
Source: Scope.
E{RR tranche},
73.51%
E{RR project}, 78.73%
0%
10%
20%
30%
40%
50%
60%
70%
80%
90%
100%
0% 10% 20% 30% 40% 50% 60% 70% 80% 90% 100%Tranche recovery
Tranche characteristics
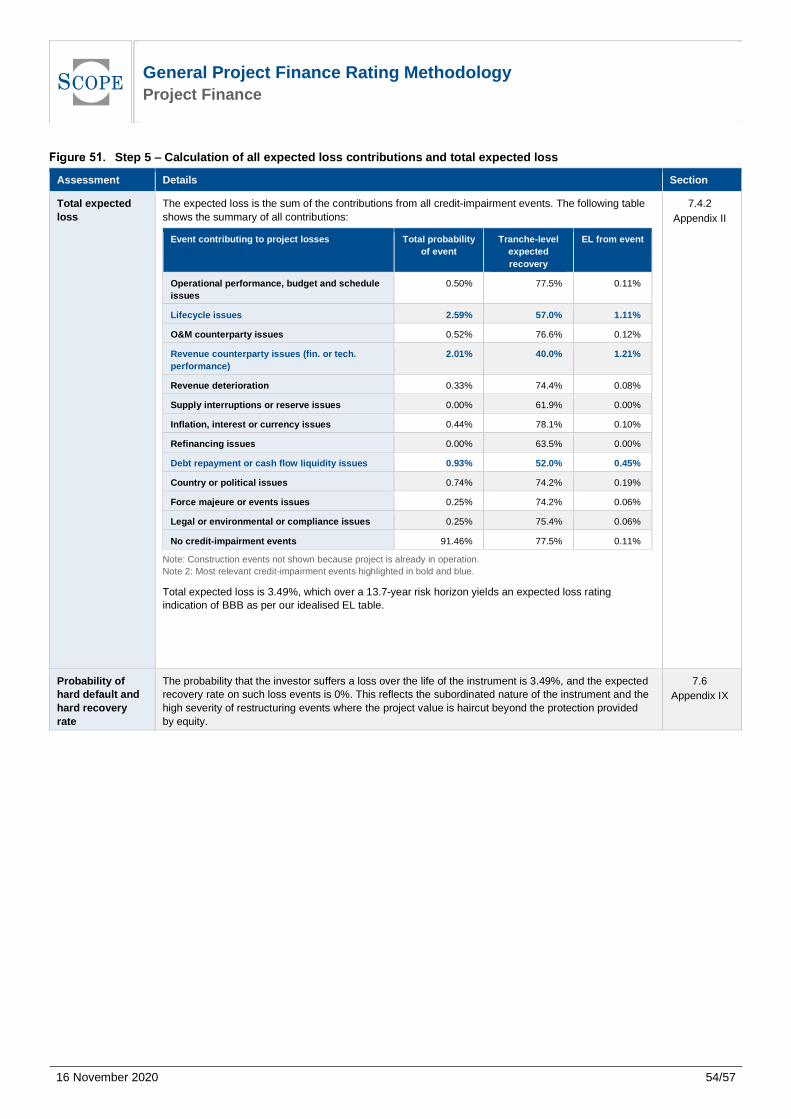
General Project Finance Rating Methodology Project Finance
16 November 2020
54/57
Step 5 – Calculation of all expected loss contributions and total expected loss
Assessment Details Section
Total expected
loss
The expected loss is the sum of the contributions from all credit-impairment events. The following table
shows the summary of all contributions:
Event contributing to project losses Total probability
of event
Tranche-level
expected
recovery
EL from event
Operational performance, budget and schedule
issues
0.50% 77.5% 0.11%
Lifecycle issues 2.59% 57.0% 1.11%
O&M counterparty issues 0.52% 76.6% 0.12%
Revenue counterparty issues (fin. or tech.
performance)
2.01% 40.0% 1.21%
Revenue deterioration 0.33% 74.4% 0.08%
Supply interruptions or reserve issues 0.00% 61.9% 0.00%
Inflation, interest or currency issues 0.44% 78.1% 0.10%
Refinancing issues 0.00% 63.5% 0.00%
Debt repayment or cash flow liquidity issues 0.93% 52.0% 0.45%
Country or political issues 0.74% 74.2% 0.19%
Force majeure or events issues 0.25% 74.2% 0.06%
Legal or environmental or compliance issues 0.25% 75.4% 0.06%
No credit-impairment events 91.46% 77.5% 0.11%
Note: Construction events not shown because project is already in operation.
Note 2: Most relevant credit-impairment events highlighted in bold and blue.
Total expected loss is 3.49%, which over a 13.7-year risk horizon yields an expected loss rating
indication of BBB as per our idealised EL table.
7.4.2
Appendix II
Probability of
hard default and
hard recovery
rate
The probability that the investor suffers a loss over the life of the instrument is 3.49%, and the expected
recovery rate on such loss events is 0%. This reflects the subordinated nature of the instrument and the
high severity of restructuring events where the project value is haircut beyond the protection provided
by equity.
7.6
Appendix IX
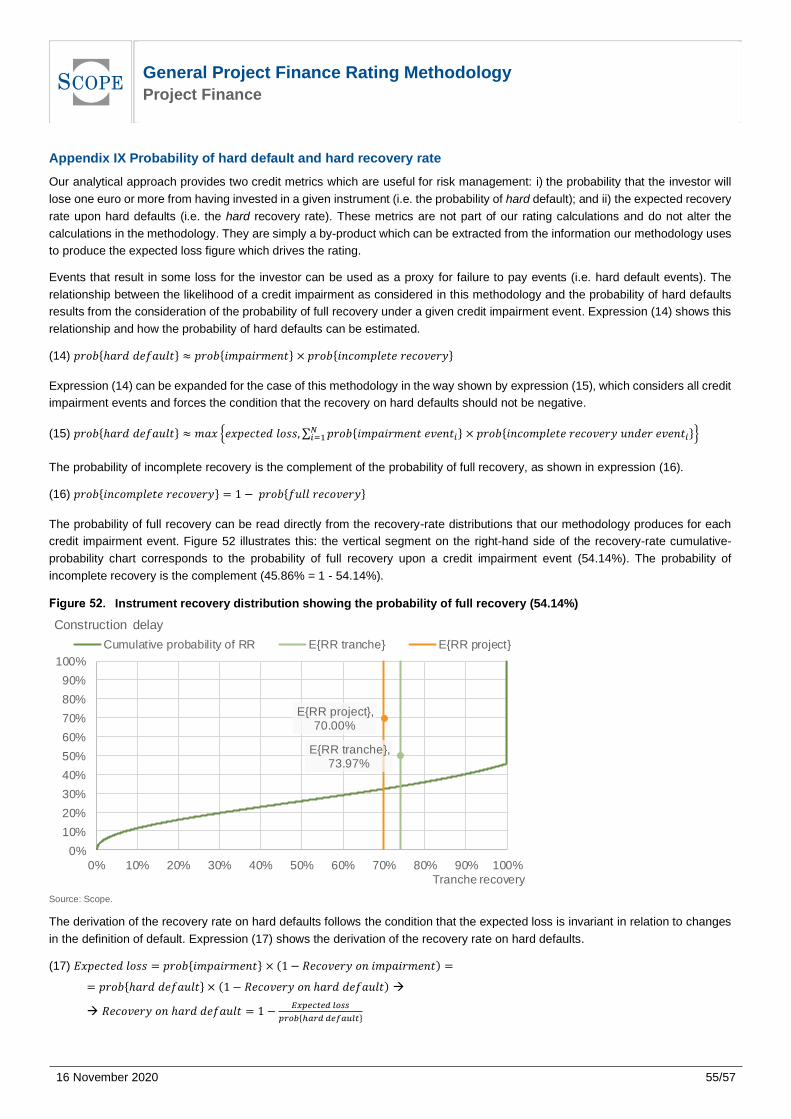
General Project Finance Rating Methodology Project Finance
16 November 2020
55/57
Appendix IX Probability of hard default and hard recovery rate
Our analytical approach provides two credit metrics which are useful for risk management: i) the probability that the investor will
lose one euro or more from having invested in a given instrument (i.e. the probability of hard default); and ii) the expected recovery
rate upon hard defaults (i.e. the hard recovery rate). These metrics are not part of our rating calculations and do not alter the
calculations in the methodology. They are simply a by-product which can be extracted from the information our methodology uses
to produce the expected loss figure which drives the rating.
Events that result in some loss for the investor can be used as a proxy for failure to pay events (i.e. hard default events). The
relationship between the likelihood of a credit impairment as considered in this methodology and the probability of hard defaults
results from the consideration of the probability of full recovery under a given credit impairment event. Expression (14) shows this
relationship and how the probability of hard defaults can be estimated.
(14) 𝑝𝑟𝑜𝑏{ℎ𝑎𝑟𝑑 𝑑𝑒𝑓𝑎𝑢𝑙𝑡} ≈ 𝑝𝑟𝑜𝑏{𝑖 𝑝𝑎𝑖𝑟 𝑒𝑛𝑡} 𝑝𝑟𝑜𝑏{𝑖𝑛𝑐𝑜 𝑝𝑙𝑒𝑡𝑒 𝑟𝑒𝑐𝑜𝑣𝑒𝑟𝑦}
Expression (14) can be expanded for the case of this methodology in the way shown by expression (15), which considers all credit
impairment events and forces the condition that the recovery on hard defaults should not be negative.
(15) 𝑝𝑟𝑜𝑏{ℎ𝑎𝑟𝑑 𝑑𝑒𝑓𝑎𝑢𝑙𝑡} ≈ 𝑎𝑥 {𝑒𝑥𝑝𝑒𝑐𝑡𝑒𝑑 𝑙𝑜𝑠𝑠, ∑ 𝑝𝑟𝑜𝑏{𝑖 𝑝𝑎𝑖𝑟 𝑒𝑛𝑡 𝑒𝑣𝑒𝑛𝑡𝑖}𝑁𝑖=1 𝑝𝑟𝑜𝑏{𝑖𝑛𝑐𝑜 𝑝𝑙𝑒𝑡𝑒 𝑟𝑒𝑐𝑜𝑣𝑒𝑟𝑦 𝑢𝑛𝑑𝑒𝑟 𝑒𝑣𝑒𝑛𝑡𝑖}}
The probability of incomplete recovery is the complement of the probability of full recovery, as shown in expression (16).
(16) 𝑝𝑟𝑜𝑏{𝑖𝑛𝑐𝑜 𝑝𝑙𝑒𝑡𝑒 𝑟𝑒𝑐𝑜𝑣𝑒𝑟𝑦} = 1 − 𝑝𝑟𝑜𝑏{𝑓𝑢𝑙𝑙 𝑟𝑒𝑐𝑜𝑣𝑒𝑟𝑦}
The probability of full recovery can be read directly from the recovery-rate distributions that our methodology produces for each
credit impairment event. Figure 52 illustrates this: the vertical segment on the right-hand side of the recovery-rate cumulative-
probability chart corresponds to the probability of full recovery upon a credit impairment event (54.14%). The probability of
incomplete recovery is the complement (45.86% = 1 - 54.14%).
Instrument recovery distribution showing the probability of full recovery (54.14%)
Source: Scope.
The derivation of the recovery rate on hard defaults follows the condition that the expected loss is invariant in relation to changes
in the definition of default. Expression (17) shows the derivation of the recovery rate on hard defaults.
(17) 𝐸𝑥𝑝𝑒𝑐𝑡𝑒𝑑 𝑙𝑜𝑠𝑠 = 𝑝𝑟𝑜𝑏{𝑖 𝑝𝑎𝑖𝑟 𝑒𝑛𝑡} (1 − 𝑅𝑒𝑐𝑜𝑣𝑒𝑟𝑦 𝑜𝑛 𝑖 𝑝𝑎𝑖𝑟 𝑒𝑛𝑡) =
= 𝑝𝑟𝑜𝑏{ℎ𝑎𝑟𝑑 𝑑𝑒𝑓𝑎𝑢𝑙𝑡} (1 − 𝑅𝑒𝑐𝑜𝑣𝑒𝑟𝑦 𝑜𝑛 ℎ𝑎𝑟𝑑 𝑑𝑒𝑓𝑎𝑢𝑙𝑡) →
→ 𝑅𝑒𝑐𝑜𝑣𝑒𝑟𝑦 𝑜𝑛 ℎ𝑎𝑟𝑑 𝑑𝑒𝑓𝑎𝑢𝑙𝑡 = 1 −𝐸𝑥𝑝𝑒𝑐𝑡𝑒𝑑 𝑙𝑜𝑠𝑠
𝑝𝑟𝑜𝑏{ℎ𝑎𝑟𝑑 𝑑𝑒𝑓𝑎𝑢𝑙𝑡}
E{RR tranche}, 73.97%
E{RR project}, 70.00%
0%
10%
20%
30%
40%
50%
60%
70%
80%
90%
100%
0% 10% 20% 30% 40% 50% 60% 70% 80% 90% 100%
Tranche recovery
Construction delay
Cumulative probability of RR E{RR tranche} E{RR project}

General Project Finance Rating Methodology Project Finance
16 November 2020
56/57
Appendix X ESG risk assessment
Our project finance methodology also incorporates an assessment of the impact of ESG factors on a project, its sustainability, its
financial performance and how this impact influences our credit view (i.e. the rating). This is different from an assessment of the
impact that the project will have on the environment, society, etc in the form of externalities. This latter impact would be covered
by an ESG rating which is not the object of this credit rating methodology.
ESG factors are not new in the credit analysis of project finance and we have always considered them when relevant. What this
methodology incorporates is an explicit identification of the elements which are today flagged as ESG factors, as well as a more
explicit and systematic presentation of these factors.
Our analysis of risk factors (as defined in section 7.3.1), recovery risk factors (as defined in section 7.4.1.4), or the consideration
of stress scenarios in the context of project-specific recovery calculations (as described in section 7.4.2) embed, among others:
Forward-looking views that consider the sustainability of the project;
Vulnerability risks through the analysis of technological and ecological transitions as well as demographic shifts;
Quality and incentives of the management related to good governance; and
Regulatory risk, also in relation to ESG considerations.
Project ESG Grid
Our Project ESG Grid summarises the impact that ESG factors have on a project. The grid covers four broad ESG themes per
pillar. We have covered ESG factors in project finance in a specific research piece7.
The grid has coloured indicators to indicate whether a particular ESG theme represents a credit-positive (green) or credit-negative
(red) driver in the analysis of the expected loss for the investor in the specific project and exposure. The colours reflect an opinion
in a relative context, but they do not correspond to quantitative scores (i.e. the indicators are ordinal rather than cardinal
assessments).
We will not always report on all elements in the grid. We provide a grey indicator if a certain ESG factor is not considered positive
or negative for the credit analysis of a project.
Example Project ESG Grid
Source: Scope.
7 See ESG Risk Considerations in Project Finance Credit Risk, also referenced in ESG in Credit Ratings, available at www.scoperatings.com.
Scarce resource management Labour managementControl, supervision and anti-
corruption
Pollution Safety Transparency and reporting
Efficiency and innovation Social value Financial structure complexity
Physical risksRegulatory and reputational
risksRespect for creditors
GovernanceEnvironmental Social

General Project Finance Rating Methodology Project Finance
16 November 2020
57/57
Scope Ratings GmbH
Headquarters Berlin
Lennéstraße 5 D-10785 Berlin
Phone +49-30-278-910
Frankfurt am Main
Neue Mainzer Straße 66-68 D-60311 Frankfurt am Main
Phone +49-69-6677-3890
Paris
23 Boulevard des Capucines F-75002 Paris
Phone +33-1-8288-5557
London
111 Buckingham Palace Road London SW1W 0SR
Madrid
Paseo de la Castellana 95 Edificio Torre Europa E-28046 Madrid
Phone +34-914-186-973
Milan
Regus Porta Venezia Via Nino Bixio, 31 20129 Milano MI
Phone +39-02-30315-814
Oslo
Haakon VII's gate 6
N-0161 Oslo
Phone +47-21-6231-42
www.scoperatings.com
Disclaimer
© 2020 Scope SE & Co. KGaA and all its subsidiaries including Scope Ratings GmbH, Scope Analysis GmbH, Scope Investor Services GmbH and Scope Risk Solutions GmbH (collectively, Scope). All rights reserved. The information and data supporting Scope’s ratings, rating reports, rating opinions and related research and credit opinions originate from sources Scope considers to be reliable and accurate. Scope does not, however, independently verify the reliability and accuracy of the information and data. Scope’s ratings, rating reports, rating opinions, or related research and credit opinions are provided ‘as is’ without any representation or warranty of any kind. In no circumstance shall Scope or its directors, officers, employees and other representatives be liable to any party for any direct, indirect, incidental or other damages, expenses of any kind, or losses arising from any use of Scope’s ratings, rating reports, rating opinions, related research or credit opinions. Ratings and other related credit opinions issued by Scope are, and have to be viewed by any party as, opinions on relative credit risk and not a statement of fact or recommendation to purchase, hold or sell securities. Past performance does not necessarily predict future results. Any report issued by Scope is not a prospectus or similar document related to a debt security or issuing entity. Scope issues credit ratings and related research and opinions with the understanding and expectation that parties using them will assess independently the suitability of each security for investment or transaction purposes. Scope’s credit ratings address relative credit risk, they do not address other risks such as market, liquidity, legal, or volatility. The information and data included herein is protected by copyright and other laws. To reproduce, transmit, transfer, disseminate, translate, resell, or store for subsequent use for any such purpose the information and data contained herein, contact Scope Ratings GmbH at Lennéstraße 5 D-10785 Berlin. Scope Ratings GmbH, Lennéstrasse 5, 10785 Berlin, District Court for Berlin (Charlottenburg) HRB 192993 B, Managing Director: Guillaume Jolivet.