Gender Diversity and Disparity in the Legal Profession: An ...
52
Scholarship Repository Scholarship Repository University of Minnesota Law School Articles Faculty Scholarship 2015 Gender Diversity and Disparity in the Legal Profession: An Gender Diversity and Disparity in the Legal Profession: An Empirical Analysis of the Gender Profile in National Law Firms Empirical Analysis of the Gender Profile in National Law Firms and Law Schools and Law Schools Edward S. Adams University of Minnesota Law School, [email protected] Samuel P. Engel Follow this and additional works at: https://scholarship.law.umn.edu/faculty_articles Part of the Law Commons Recommended Citation Recommended Citation Edward S. Adams and Samuel P. Engel, Gender Diversity and Disparity in the Legal Profession: An Empirical Analysis of the Gender Profile in National Law Firms and Law Schools, 63 BUFF . L. REV . 1211 (2015), available at https://scholarship.law.umn.edu/faculty_articles/443. This Article is brought to you for free and open access by the University of Minnesota Law School. It has been accepted for inclusion in the Faculty Scholarship collection by an authorized administrator of the Scholarship Repository. For more information, please contact [email protected].
Transcript of Gender Diversity and Disparity in the Legal Profession: An ...

Scholarship Repository Scholarship Repository University of Minnesota Law School
Articles Faculty Scholarship
2015
Gender Diversity and Disparity in the Legal Profession: An Gender Diversity and Disparity in the Legal Profession: An
Empirical Analysis of the Gender Profile in National Law Firms Empirical Analysis of the Gender Profile in National Law Firms
and Law Schools and Law Schools
Edward S. Adams University of Minnesota Law School, [email protected]
Samuel P. Engel
Follow this and additional works at: https://scholarship.law.umn.edu/faculty_articles
Part of the Law Commons
Recommended Citation Recommended Citation Edward S. Adams and Samuel P. Engel, Gender Diversity and Disparity in the Legal Profession: An Empirical Analysis of the Gender Profile in National Law Firms and Law Schools, 63 BUFF. L. REV. 1211 (2015), available at https://scholarship.law.umn.edu/faculty_articles/443.
This Article is brought to you for free and open access by the University of Minnesota Law School. It has been accepted for inclusion in the Faculty Scholarship collection by an authorized administrator of the Scholarship Repository. For more information, please contact [email protected].
1211
Gender Diversity and Disparity in the Legal
Profession: An Empirical Analysis of the
Gender Profile in National Law Firms and
Law Schools
EDWARD S. ADAMS†
SAMUEL P. ENGEL††
INTRODUCTION
Gender representation in the context of large law firms has received extensive scholarly attention and has been the subject of multiple Supreme Court cases.1 Recently, Ellen Pao lost a highly publicized gender discrimination case against Kleiner, Perkins, Caufield & Byers.2 The case unveiled disturbing gender discrimination that affects the lives of many people, especially in the legal profession. With a renewed attack on the “gender gap,” and on cultural sexism
† Howard E. Buhse Professor of Finance and Law, University of Minnesota;
Director of CLE Programs at the University of Minnesota Law School; M.B.A.
1997, Carlson School of Management at the University of Minnesota; J.D. 1988,
University of Chicago; B.A. 1985, Knox College. I am grateful to Kirsten Johanson
and Eric Weisenburger for their exemplary research assistance and challenging
and invaluable comments.
†† University of Minnesota Law School, Class of 2016; University of Michigan,
B.A. (2013).
1. One of the foundational cases regarding gender and law firm partnerships
is Hishon v. King & Spalding, in which one of the nation’s large law firms argued
that Title VII did not apply to law firm partnerships. See Paul Zarefsky, Can Law
Firm Partnerships Exclude Women as Partners?, 1983 PREVIEW U.S. SUP. CT.
CASES 91, 92-93 (summarizing the parties’ argument). And, of course, there is the
infamous Supreme Court quote against admitting women to the bar: “[t]he
natural and proper timidity and delicacy which belongs to the female sex
evidently unfits it for” a position as an attorney. Bradwell v. Illinois, 83 U.S. (16
Wall.) 130, 141 (1873) (Bradley, J., concurring).
2. See, e.g., Andrea Peterson, Ellen Pao Lost Her Trial. But the Conversation
about Sexism in Silicon Valley it Triggered has Just Begun, WASH. POST (Mar. 30,
2015), http://www.washingtonpost.com/blogs/the-switch/wp/2015/03/30/ellen-
pao-lost-her-trial-but-the-conversation-about-sexism-in-silicon-valley-it-
triggered-has-just-begun.
1212 BUFFALO LAW REVIEW [Vol. 63
in the highest areas of business and law, the question remains: where are we today? How bad is gender discrimination in these desirable fields? What disadvantages do women face and how disparate are employment standards between the two genders?
One thing everyone can agree on is that we have made significant progress in the last thirty years. We are past the days of King & Spalding arguing that Title VII was not applicable in the context of law firms.3 We are definitely past the days of Justice Bradley saying that women were simply not fit for these lucrative professions.4 Yet these realizations likely inspire more negativity about the past than positive feelings about progress. This Article offers much more tangible progress, at least in the sphere of big-law. We are past the age of 10, 15, 20, 25, even 30% of partnership positions being given to women. We are past the age of women disproportionately receiving jobs in less profitable offices and cities. We are also past the stage of disparate academic qualifications between genders. As this Article demonstrates, the progress we have made is real, even when the media parades sobering reminders that the battle is not over.
Gender diversity has attracted media attention, but it has rarely been economically or quantitatively analyzed in the context of law schools. In response to this lack of information, this Article first seeks to explore key trends related to gender diversity in law schools. This Article will also update and challenge some of the existing literature regarding female participation in large law firms.
The analysis and information provided in this Article will give prospective female (and male) law students and partners at large firms the means to make a variety of decisions. The conclusions reached in this Article are connected in part to the findings developed in a corresponding article: Does Law School Still Make Economic Sense?: An Empirical Analysis of “Big” Law Firm Partnership Prospects and the Relationship
3. See Zarefsky, supra note 1.
4. See Bradwell, 83 U.S. (16 Wall.) at 141.
2015] GENDER DIVERSITY AND DISPARITY 1213
to Law School Attended (“An Empirical Analysis”).5 While both articles aim to provide information to the legal community, this Article is focused solely on the status of gender in the legal world and how that status changes across law schools, law firms, geographic locations, and time.
Beyond how schools and firms are currently performing in terms of gender diversity, this Study looks to analyze the ways that firms and law schools are changing. For example, which schools are rising and falling in reputation as diverse institutions? How do law school factors affect the number of female partners produced (or do they)? Which law firms are getting younger and which are getting older and how do those numbers relate to gender? How does the profitability or size of a firm affect its hiring patterns?
Part I of this Article will describe the methodology used to compile the data used in the Study, as well as provide a brief description of the reasoning behind the methodology. Part II reports the results of the Study, broken down into Sections highlighting different characteristics of gender diversity/disparity. Finally, the Article offers a succinct conclusion. Additionally, an accompanying Annex provides a summary of the formulas, and a description of the tables, used in the Article.
I. METHODOLOGY
Many have an “intuitive” sense that the law school one attends influences one’s ultimate career outcome. Rather than mere conjecture, this Article seeks to use actual, real-time data to answer the questions posited above. For this Article, the sample size is approximately 33,000 law firm partners across 115 different law firms. All law firms with membership in either the NLJ 100 or The American Lawyer 100 were included in this Study. In order to be included in the Study, an individual had to be a partner in one of the 115 law firms included, and had to have an office location within
5. Edward S. Adams & Samuel P. Engel, Does Law School Still Make
Economic Sense?: An Empirical Analysis of “Big” Law Firm Partnership Prospects
and the Relationship to Law School Attended, 63 BUFF. L. REV. 609 (2015)
[hereinafter An Empirical Analysis].
1214 BUFFALO LAW REVIEW [Vol. 63
the United States. Primary data compiled included: partner’s name, law firm of partner, office location(s) of partner,6 years in the legal profession,7 law school attended,8 and gender of partner.
The characteristics of law firm partners were obtained directly from the law firms’ websites on the biography page of the partner. In some cases, in which the number of years in the legal profession or law school attended were not provided on a firm’s website, additional sources such as Martindale and LinkedIn were utilized to provide the missing data. The following significant methodological decisions were made in order to balance consistency and comprehensiveness: (1) a partner had to have a distinct phone number at an office to be considered a member in that office; (2) law school attended referred to the school in which a J.D. was obtained, unless a J.D. was obtained from a foreign school, and an LL.M. was obtained in an American school;9 and (3) years in the legal profession refers to years since graduation if the information was available, and years since first bar admission if a graduation year was unavailable.
The second step in the Study was to compile secondary data. Chosen secondary data helped characterize law firms and law schools. Examples of law firm secondary data used are: gross revenue, revenue per partner, profit per partner,
6. Unfortunately, many lawyers have biography pages which list multiple
office locations. In order to be listed at a certain location in the Study, a partner
needed to have a distinct phone number for each location, and, if the locations
were in different jurisdictions, bar membership in both locations. If the partner
satisfied those criteria, then he or she was listed at both locations. If a partner
was listed at multiple locations, then that partner was not included in the
locational analysis, in order to preserve the characteristics of partners in a
specific location.
7. For the vast majority of partners, this number is the number of years since
graduation. In those cases where this number was unavailable, years since first
bar admission was used instead.
8. Law school attended refers to the law school that a partner received a J.D.
from, unless that school was a foreign school, and the lawyer received an LL.M.
from an American law school, in which case the American school and
corresponding graduation date were listed.
9. See supra note 8.
2015] GENDER DIVERSITY AND DISPARITY 1215
number of (equity and non-equity) partners, number of associates, and a breakdown of the geographical distribution of a firm.10 Statistics regarding the financials of a law firm were obtained from The American Lawyer, while statistics regarding the size of a firm were obtained from the NLJ.11
Law school secondary data includes: United States News & World Report law school rankings,12 admission selectivity factors (LSAT/GPA),13 class size14 and gender composition, location of the school, tuition,15 and faculty rankings.16 Data regarding admission selectivity factors, class size, and gender composition were obtained through each law school’s Standard 509 required ABA disclosures. The final step in the Study was to develop a school index score, which is the number of partners from a school divided by class size.17
10. Geographical distribution refers to the number of partners at each office of
the firm if the firm has multiple offices in the United States.
11. The American Lawyer provides total revenue and profit per partner.
“Revenue per partner” was calculated using the total revenue and the number of
partners as determined by this Study. Commonly, numbers regarding revenue
and profit per partner exclude non-equity partners, but the revenue per partner
statistic used in this Study includes non-equity partners, thereby decreasing the
revenue per partner of firms that utilize the non-equity partner concept.
12. Best Law Schools: Ranked in 2015, U.S. NEWS & WORLD REP., http://grad-
schools.usnews.rankingsandreviews.com/best-graduate-schools/top-law-schools/
law-rankings (last visited Oct. 17, 2015).
13. For both the LSAT and GPA, the average of the 75th and 25th percentile
was the number which is used in this Study. This number, in the case of the
LSAT, was demonstrated to have the strongest correlation with the success of a
school in producing “big” firm partners, and in the case of GPA, had a sufficiently
strong correlation to warrant its use (the 25th percentile GPA had a minimally
stronger correlation).
14. Class size was gathered for the current year, and for every ten years from
1950 to 2010. Each school received a weighted class size. See infra note 17.
15. Tuition was gathered for the current year, and for every ten years from
1950 to 2010. Tuition refers to out of state tuition, which is more suitable for a
general audience.
16. The faculty rankings utilized are those provided by the Social Science
Research Network (“SSRN”). SSRN tracks the number of downloads each faculty
member received, and ranks the faculty by total downloads in the last year, all-
time, and downloads per faculty member.
17. The index score is ((# of total partners / weighted class size) * 100) (for
readability purposes). The weighted class size was obtained by collecting class
1216 BUFFALO LAW REVIEW [Vol. 63
II. ANALYSIS
Virtually all prospective law students who thoroughly research law schools across the nation are aware of a phenomenon referred to as the “T-14,” a list of 14 law schools that are annually ranked in the top 14 of the U.S. News & World Report Law School Rankings (“USNWR”).18 The USNWR has successfully established perceived tiers that are undoubtedly familiar to the most successful prospective law school applicants, such as Harvard, Yale, and Stanford (“HYS”); and Michigan, Virginia, and Penn (“MVP”). Yet, the “index scores” we have developed herein shed doubt on the contention that such tiers are actually representative of the prestige that a degree from various law schools carries in the legal market, particularly when analyzed in terms of a school’s gender profile.19
Most noteworthy, the index scores reveal the superior performance of the University of Chicago Law School: a female law student at Chicago has a 26% greater chance of becoming a big-law partner than at any other school. After Chicago, schools two through four (Harvard, Northwestern, and Columbia) comprise a mini-tier. In accordance with established tiers, the fifth through fourteenth ranked schools seem to operate as a “third-tier.” The index score is approximately halved between #1 Chicago and #11 Cornell, and again between #11 Cornell and #30 Miami, indicating that the percentage of female students who become big-law partners is also halved between these schools. This is a
sizes for 1950, 1960, 1970, 1980, 1990, 2000, and 2010, and then multiplying a
school’s class size for a given year by the number of partners in the Study who
graduated in that period. The period for 1970, for example, is 1965–1974.
18. For those not familiar with this term, the fourteen law schools are: Yale,
Harvard, Stanford, Chicago, Columbia, New York University (“NYU”),
Pennsylvania (“Penn”), Virginia, California-Berkeley (“Berkeley”), Michigan,
Duke, Northwestern, Georgetown, and Cornell. There are 155 law schools
considered and ranked in the U.S. News & World Report study. Best Law Schools,
U.S. NEWS & WORLD REP., http://grad-schools.usnews.rankingsandreviews.com/
best-graduate-schools/top-law-schools/law-rankings?int=a1d108 (last visited
Sept. 15, 2015).
19. It should be pointed out that the T-14 schools are the top 14 schools in this
gender index, although in a scrambled order.
2015] GENDER DIVERSITY AND DISPARITY 1217
slightly sharper drop than which occurs when all students (not just female) are analyzed: the composite index score is halved between #1 and #13; and #13 and #30.20 Yet, the ratio between #1 and #50 is 5.53 in the overall index and only 4.92 in the female only index.21 Therefore, while the establishment of tiers (and the reputation of specific schools) may differ, the reputation of the law school attended is currently of approximately equal importance for female and male students, a valuable conclusion that is explored in more depth later.
One of the most important usages of the index score is to establish which schools are over-performing (in terms of female big-law partners) in relation to their USNWR ranking, such as Chicago and Northwestern, and which schools are under-performing, such as Yale, Arizona State, and Arizona. The same analysis is done with LSAT score, GPA, and tuition, allowing prospective female students to determine what school is the strongest investment or the best given their credentials.
A. Index Score Analysis
The index score22 developed herein has a relationship with many of the measures that are typically associated with law school success: LSAT score, GPA, law school rankings, cost of tuition, etc. Ultimately, a law school’s LSAT score is a better predictor of its index score than any other measure.
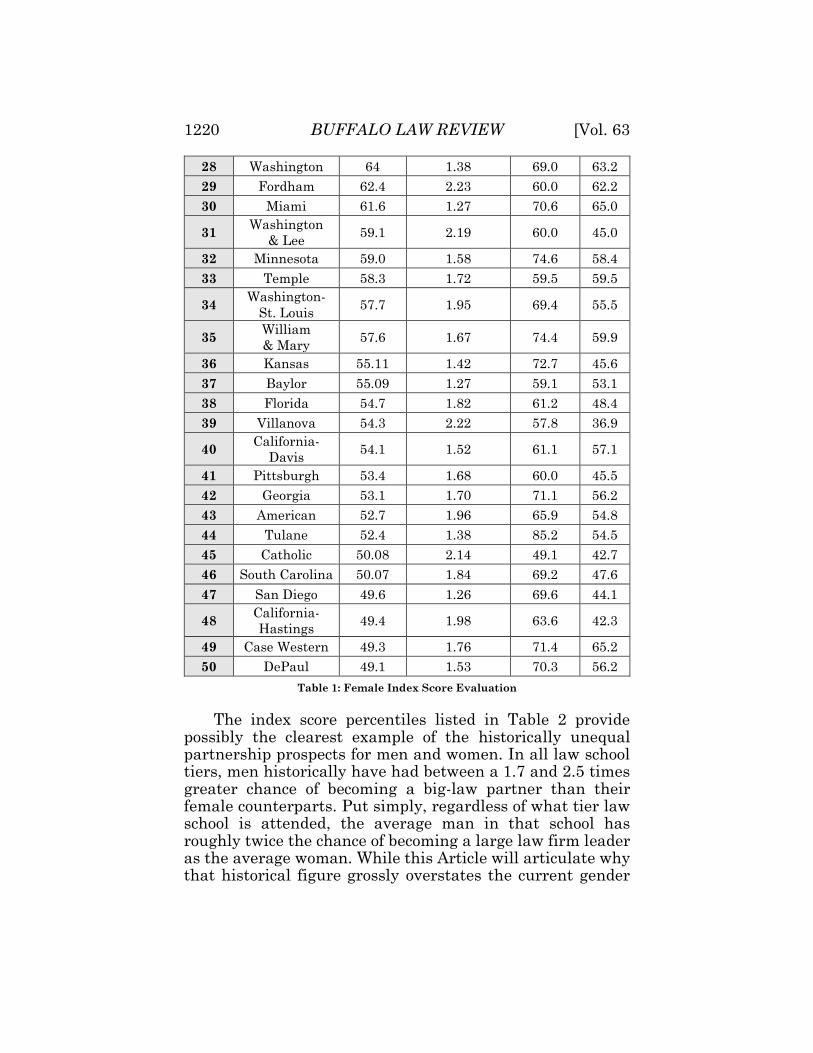
Table 1 provides a breakdown of the index scores of the top 50 law schools in this Study.23 The “Female Index/Total Index” score compares the index score from the original Empirical Analysis article (“Total Index”)24 and the index score listed in Column 3 here. A value of “2” means that the percentage of all graduates who become big-law partners is
20. See An Empirical Analysis, supra note 5, at 618-20 tbl.2.
21. See id.
22. See supra note 17.
23. An Empirical Analysis, supra note 5, used the top 100 schools but, based
on the sample size, limitations imposed by strictly studying gender patterns,
decreasing the list in the current Article was necessary to avoid distortions.
24. “Gender Neutral” refers to the total population of people sampled (i.e. male
and female partners). Id. at 618 n.36.
1218 BUFFALO LAW REVIEW [Vol. 63
double the percentage of female graduates who become big-law partners. The age distribution (“% Younger than Mean”) is provided in order to evaluate how the representation of a law school in big law firms is changing over time. The “2025 Score” provides that evaluation, but does not take into account or attempt to estimate how the school’s production rate will change in the next ten years. Table 2 adds a quick snapshot of the results broken down by percentile, providing information about how the index changes after the top 50 schools.
Even within one geographic area, there are significant disparities in the success of female law graduates. Some noteworthy examples include:
Chicago, Northwestern, Loyola-Chicago, and DePaul all have strong female index scores, compared to total index (“FITs”),25 while Illinois and nearby Wisconsin have poor female index scores, compared to total index.
Columbia significantly outperforms NYU in FIT, while Cornell significantly outperforms SUNY-Buffalo.
While Southern California schools have great FITs, Northern California schools are much less impressive.
Texas schools have a mixed performance: Baylor has a great FIT; Southern Methodist has a poor FIT; and Texas has a moderate FIT.
Boston University’s FIT significantly outperforms Boston College.
Intrastate rivalry: Temple surpasses Villanova; Wake Forest surpasses North Carolina; Miami surpasses Florida; Loyola-Chicago surpasses Illinois; Cornell surpasses NYU; Indiana-Bloomington surpasses Notre Dame; American surpasses Catholic; UC-Davis surpasses UC-Hastings; and Baylor surpasses Southern Methodist in the female index score rankings, when compared with the total index scores.
25. Female Index: Total.

2015] GENDER DIVERSITY AND DISPARITY 1219
Rank School Female
Index26
Total
Index/Female
Index27
%
Younger
than
Mean
2025
Score
1 Chicago 241 1.81 70.9 248.5
2 Harvard 192 2.15 64.7 194.1
3 Northwestern 181 1.74 64.7 160.4
4 Columbia 161 2.04 66.5 152.6
5 Virginia 142 2.18 62.2 129.8
6 Yale 141 2.42 64.0 128.2
7 Michigan 132 1.79 66.9 160.4
8 Penn 130 2.25 62.1 114.8
9 Stanford 128 2.04 58.3 114.7
10 Duke 127 1.86 74.7 152.3
11 Cornell 123 1.89 64.1 115.5
12 NYU 116 2.35 60.3 103.4
13 Berkeley 113 1.74 61.7 91.9
14 Georgetown 110 2.10 72.5 114.4
15 George
Washington 98 2.01 63.8 83.7
16 Vanderbilt 97 1.81 70.9 117.5
17 Southern
California 87 1.60 72.5 77.3
18 Boston 85.4 1.93 61.2 78.8
19 California-
Los Angeles 84.9 1.60 71.8 80.2
20 Emory 84.4 1.86 77.8 104.7
21 Texas 83.9 1.87 71.0 90.7
22 Indiana-
Bloomington 80.2 1.60 58.0 55.7
23 Loyola-Chicago 79.6 1.51 71.3 108.2
24 Notre Dame 78.9 2.03 71.7 78.3
25 Illinois 78.6 2.08 78.6 116.9
26 Boston College 75 2.15 66.7 80.2
27 Wake Forest 66 1.44 80.6 79.9
26. See supra note 17.
27. “Total Index/Female Index” represents the results from Column 3 of this
table divided by the results of Column 4 of Table 2 in the original Study. See An
Empirical Analysis, supra note 5, at 618-20 tbl.2.
1220 BUFFALO LAW REVIEW [Vol. 63
28 Washington 64 1.38 69.0 63.2
29 Fordham 62.4 2.23 60.0 62.2
30 Miami 61.6 1.27 70.6 65.0
31 Washington
& Lee 59.1 2.19 60.0 45.0
32 Minnesota 59.0 1.58 74.6 58.4
33 Temple 58.3 1.72 59.5 59.5
34 Washington-
St. Louis 57.7 1.95 69.4 55.5
35 William
& Mary 57.6 1.67 74.4 59.9
36 Kansas 55.11 1.42 72.7 45.6
37 Baylor 55.09 1.27 59.1 53.1
38 Florida 54.7 1.82 61.2 48.4
39 Villanova 54.3 2.22 57.8 36.9
40 California-
Davis 54.1 1.52 61.1 57.1
41 Pittsburgh 53.4 1.68 60.0 45.5
42 Georgia 53.1 1.70 71.1 56.2
43 American 52.7 1.96 65.9 54.8
44 Tulane 52.4 1.38 85.2 54.5
45 Catholic 50.08 2.14 49.1 42.7
46 South Carolina 50.07 1.84 69.2 47.6
47 San Diego 49.6 1.26 69.6 44.1
48 California-
Hastings 49.4 1.98 63.6 42.3
49 Case Western 49.3 1.76 71.4 65.2
50 DePaul 49.1 1.53 70.3 56.2
Table 1: Female Index Score Evaluation
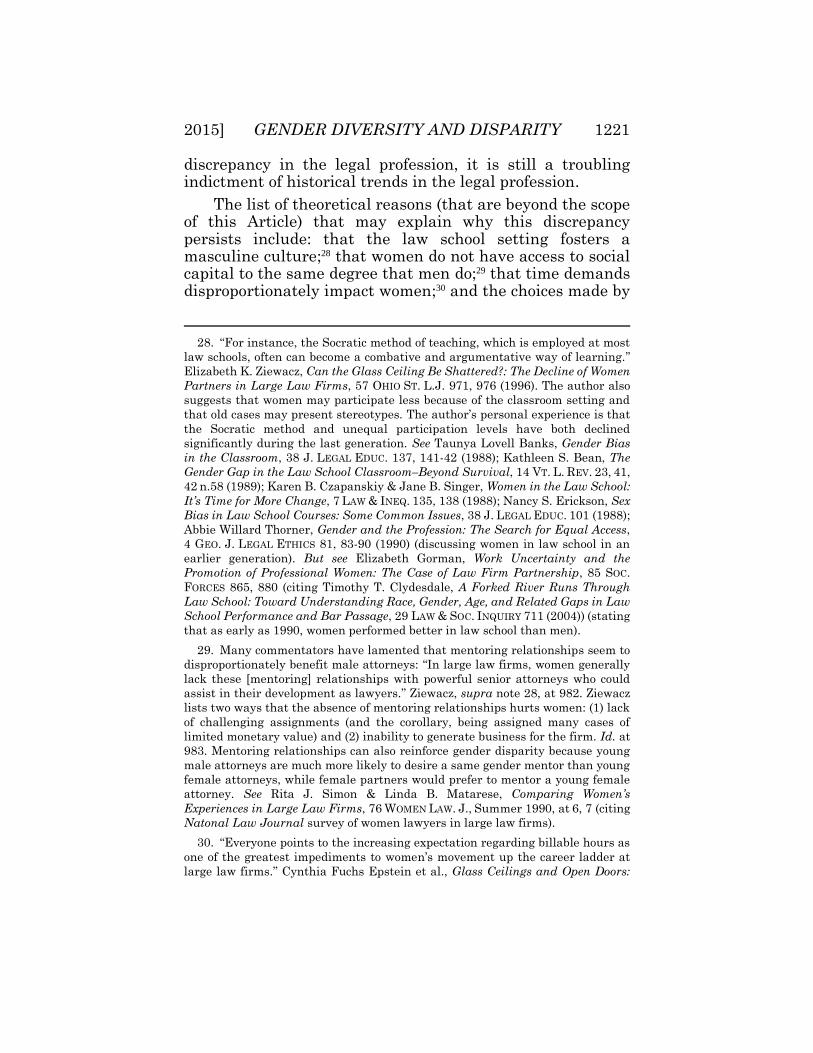
The index score percentiles listed in Table 2 provide possibly the clearest example of the historically unequal partnership prospects for men and women. In all law school tiers, men historically have had between a 1.7 and 2.5 times greater chance of becoming a big-law partner than their female counterparts. Put simply, regardless of what tier law school is attended, the average man in that school has roughly twice the chance of becoming a large law firm leader as the average woman. While this Article will articulate why that historical figure grossly overstates the current gender
2015] GENDER DIVERSITY AND DISPARITY 1221
discrepancy in the legal profession, it is still a troubling indictment of historical trends in the legal profession.
The list of theoretical reasons (that are beyond the scope of this Article) that may explain why this discrepancy persists include: that the law school setting fosters a masculine culture;28 that women do not have access to social capital to the same degree that men do;29 that time demands disproportionately impact women;30 and the choices made by
28. “For instance, the Socratic method of teaching, which is employed at most
law schools, often can become a combative and argumentative way of learning.”
Elizabeth K. Ziewacz, Can the Glass Ceiling Be Shattered?: The Decline of Women
Partners in Large Law Firms, 57 OHIO ST. L.J. 971, 976 (1996). The author also
suggests that women may participate less because of the classroom setting and
that old cases may present stereotypes. The author’s personal experience is that
the Socratic method and unequal participation levels have both declined
significantly during the last generation. See Taunya Lovell Banks, Gender Bias
in the Classroom, 38 J. LEGAL EDUC. 137, 141-42 (1988); Kathleen S. Bean, The
Gender Gap in the Law School Classroom–Beyond Survival, 14 VT. L. REV. 23, 41,
42 n.58 (1989); Karen B. Czapanskiy & Jane B. Singer, Women in the Law School:
It’s Time for More Change, 7 LAW & INEQ. 135, 138 (1988); Nancy S. Erickson, Sex
Bias in Law School Courses: Some Common Issues, 38 J. LEGAL EDUC. 101 (1988);
Abbie Willard Thorner, Gender and the Profession: The Search for Equal Access,
4 GEO. J. LEGAL ETHICS 81, 83-90 (1990) (discussing women in law school in an
earlier generation). But see Elizabeth Gorman, Work Uncertainty and the
Promotion of Professional Women: The Case of Law Firm Partnership, 85 SOC.
FORCES 865, 880 (citing Timothy T. Clydesdale, A Forked River Runs Through
Law School: Toward Understanding Race, Gender, Age, and Related Gaps in Law
School Performance and Bar Passage, 29 LAW & SOC. INQUIRY 711 (2004)) (stating
that as early as 1990, women performed better in law school than men).
29. Many commentators have lamented that mentoring relationships seem to
disproportionately benefit male attorneys: “In large law firms, women generally
lack these [mentoring] relationships with powerful senior attorneys who could
assist in their development as lawyers.” Ziewacz, supra note 28, at 982. Ziewacz
lists two ways that the absence of mentoring relationships hurts women: (1) lack
of challenging assignments (and the corollary, being assigned many cases of
limited monetary value) and (2) inability to generate business for the firm. Id. at
983. Mentoring relationships can also reinforce gender disparity because young
male attorneys are much more likely to desire a same gender mentor than young
female attorneys, while female partners would prefer to mentor a young female
attorney. See Rita J. Simon & Linda B. Matarese, Comparing Women’s
Experiences in Large Law Firms, 76 WOMEN LAW. J., Summer 1990, at 6, 7 (citing
Natonal Law Journal survey of women lawyers in large law firms).
30. “Everyone points to the increasing expectation regarding billable hours as
one of the greatest impediments to women’s movement up the career ladder at
large law firms.” Cynthia Fuchs Epstein et al., Glass Ceilings and Open Doors:
1222 BUFFALO LAW REVIEW [Vol. 63
female attorneys.31 The final two reasons will be discussed in more detail later in this Article. While the second reason is most undoubtedly an important problem deserving of attention, its nature precludes discussion here.
Percentile Total Female
10th 15 6
20th 24 14
30th 35 18
40th 44 25
50th 60 31
60th 70 42
70th 89 52
80th 117 62
90th 186 110
100th 437 241 Table 2: Female Index Score Percentiles
32
Tables 3 and 4 depict the historical rankings, listing
schools by index score for each decade. Table 3 provides the
rankings of schools in terms of female index scores and Table
4 does the same for males. Two of the more interesting points
about these tables are: (1) the high representation by the
T-14 schools; and (2) the convergence of the schools at the top
of the lists: the top 3 is the same for both genders for each of
the last two decades. In the far right column, the top 15
includes the same schools with one exception: Berkeley
makes the top 15 for women, but is replaced by Boston
College in the men’s top 15. This table is one of many in the
Article that hints at the closing of the gender divide.
Women’s Advancement in the Legal Profession, 64 FORDHAM L. REV. 291, 378
(1995).
31. See Ziewacz, supra note 28, at 988-89 (discussing why female attorneys
choose to leave large law firms and providing some additional scholarly analysis
of the issue).
32. The percentage of schools that are at or below the listed index score.

2015] GENDER DIVERSITY AND DISPARITY 1223
Rank 1970–1979 1980–1989 1990–1999 2000–
1 Stanford Northwestern Chicago Chicago
2 NYU Chicago Harvard Northwestern
3 Columbia Harvard Columbia Harvard
4 Yale Virginia Yale Columbia
5 Loyola-
Chicago Columbia Northwestern Virginia
6 Harvard Indiana Duke Penn
7 Virginia Stanford Cornell Georgetown
8 North
Carolina NYU Virginia Michigan
9 Chicago Cornell Penn Yale
10 Denver Michigan Stanford Berkeley
11 Miami George
Washington Michigan Stanford
12 Fordham Yale Berkeley Cornell
13 Florida Berkeley NYU Duke
14 Cincinnati Vanderbilt Texas George
Washington
15 Penn Boston College Georgetown NYU
Table 3: Reconstruction of Historical Rankings (Female)
Rank 1970–1979 1980–1989 1990–1999 2000–
1 Yale Yale Chicago Chicago
2 Harvard Harvard Harvard Northwestern
3 Penn Chicago Columbia Harvard
4 Columbia Columbia Northwestern NYU
5 Chicago Penn Penn Columbia
6 NYU NYU Yale Stanford
7 Northwestern Virginia Stanford Virginia
8 Virginia Northwestern NYU Yale
9 Cornell Georgetown Duke Penn
10 Georgetown Stanford Virginia Georgetown
11 George
Washington Michigan Georgetown Michigan
12 Stanford Duke Berkeley Boston College
13 Duke Cornell Cornell George
Washington
14 Berkeley George
Washington Michigan Cornell
15 Michigan Vanderbilt George
Washington Duke
Table 4: Reconstruction of Historical Rankings (Male)
1224 BUFFALO LAW REVIEW [Vol. 63
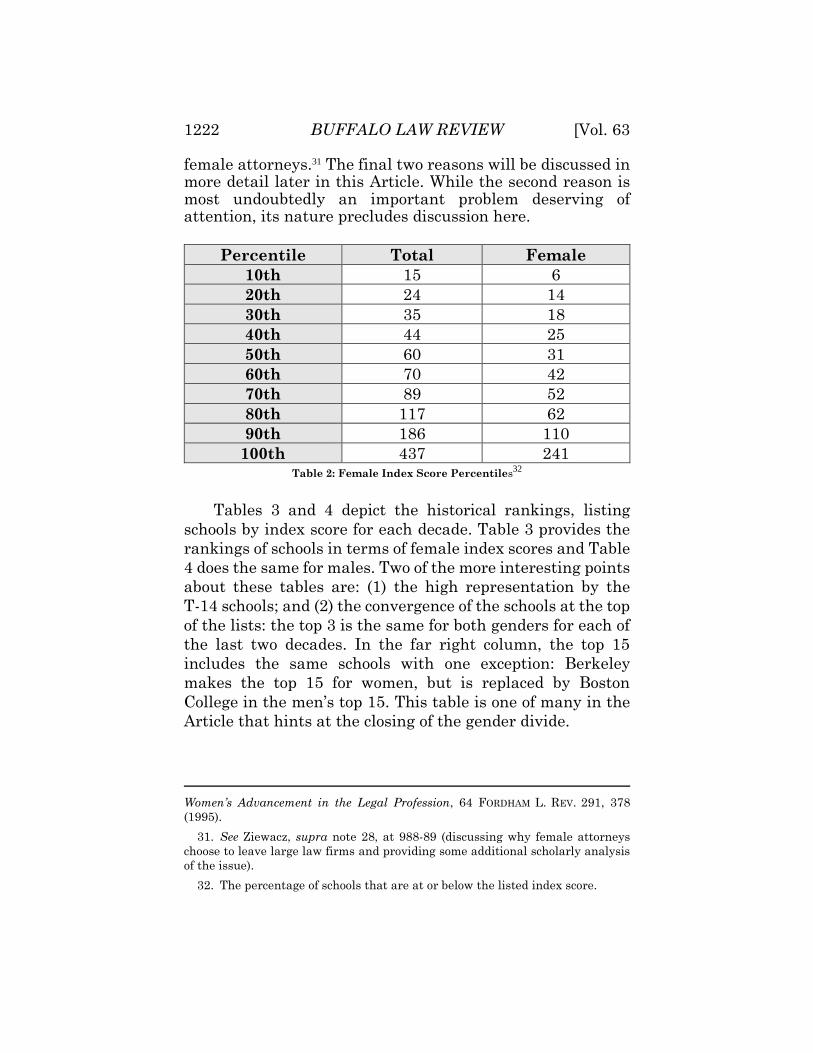
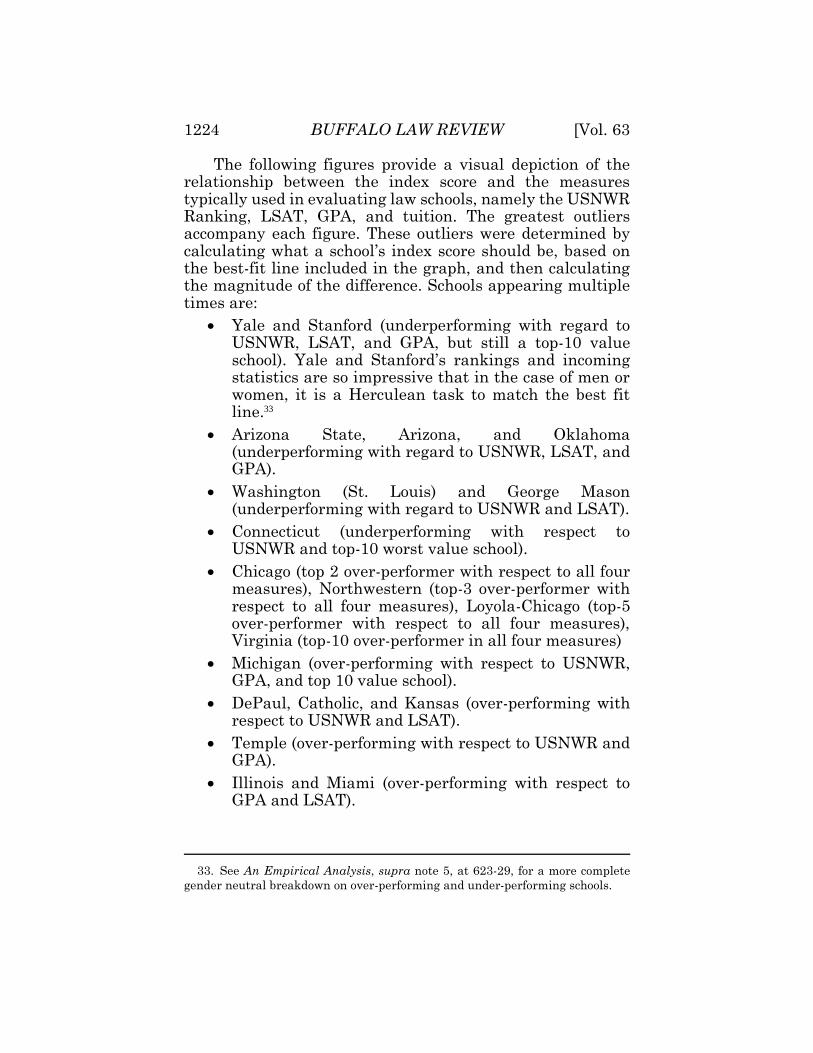
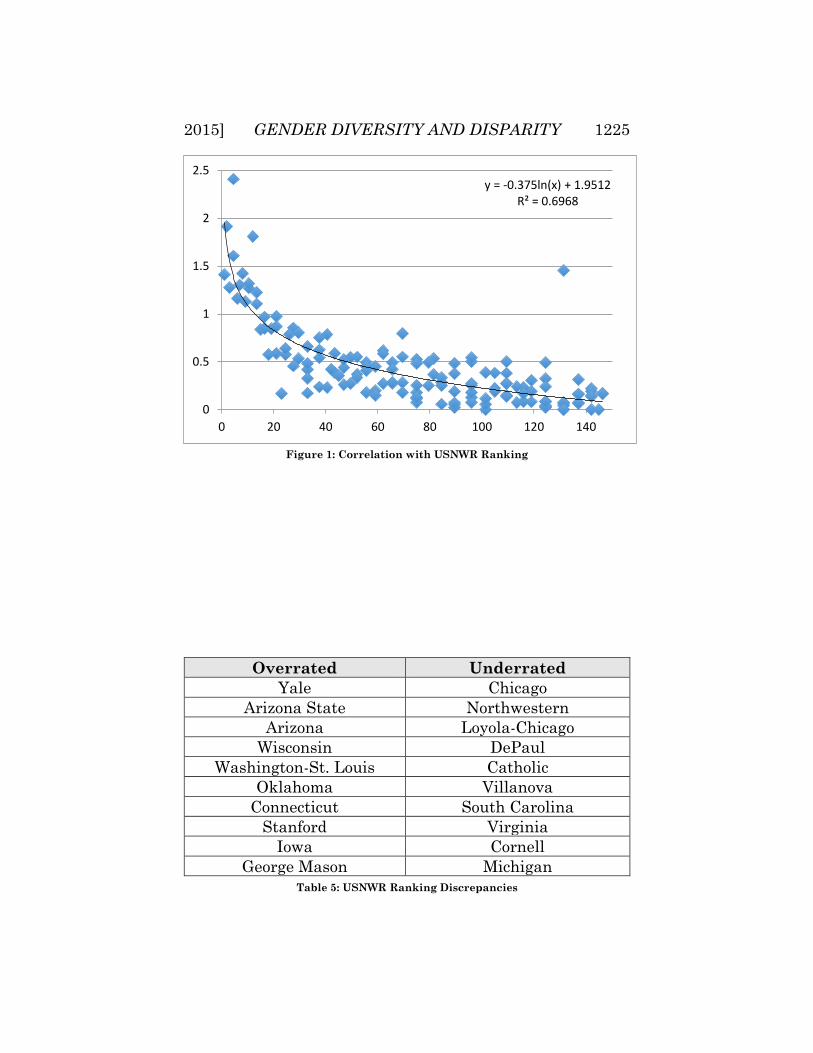
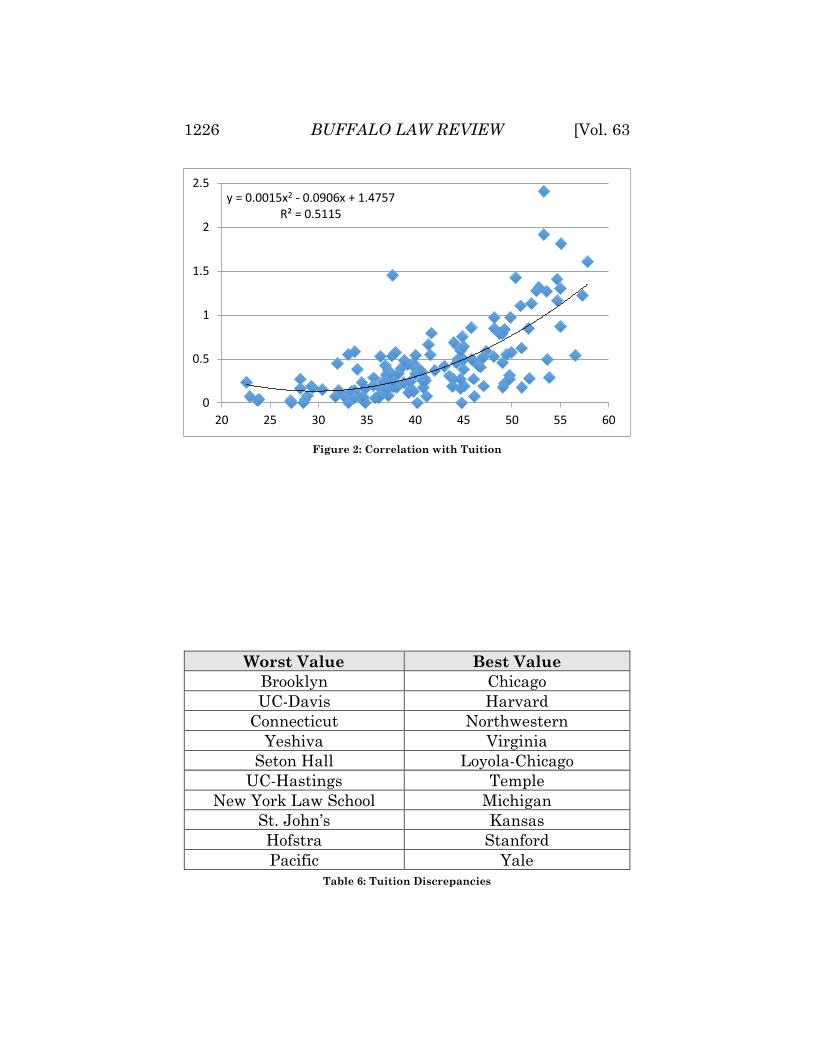
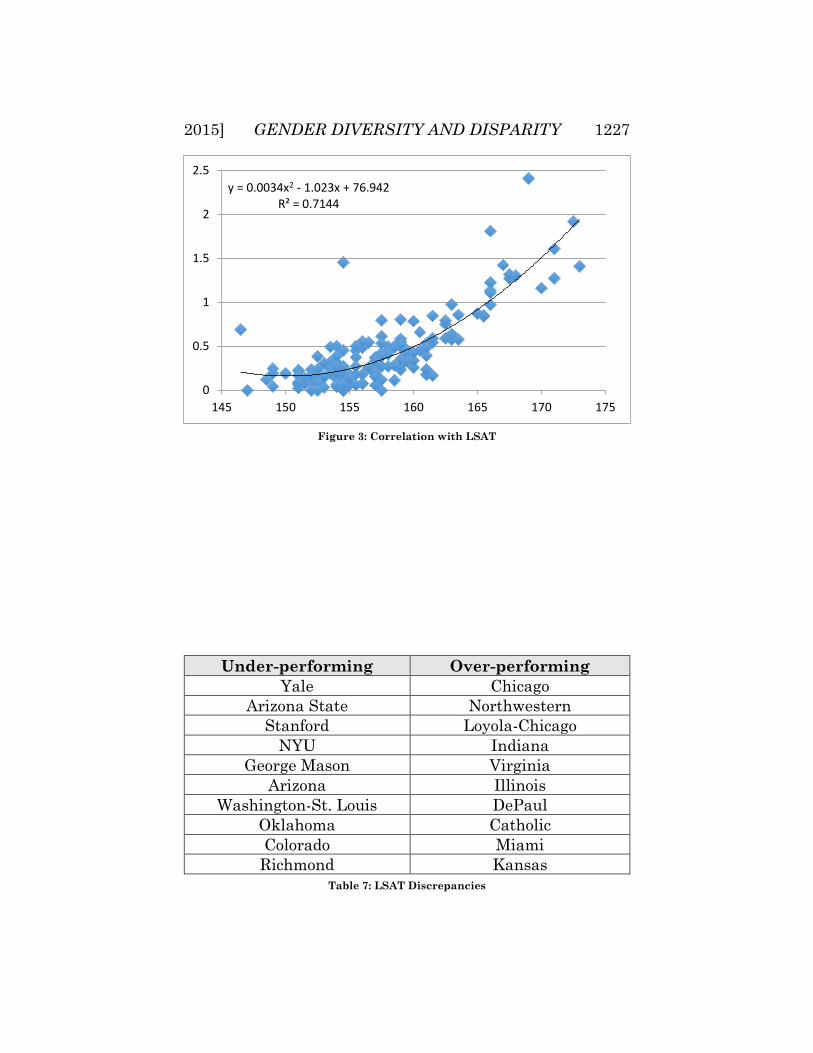
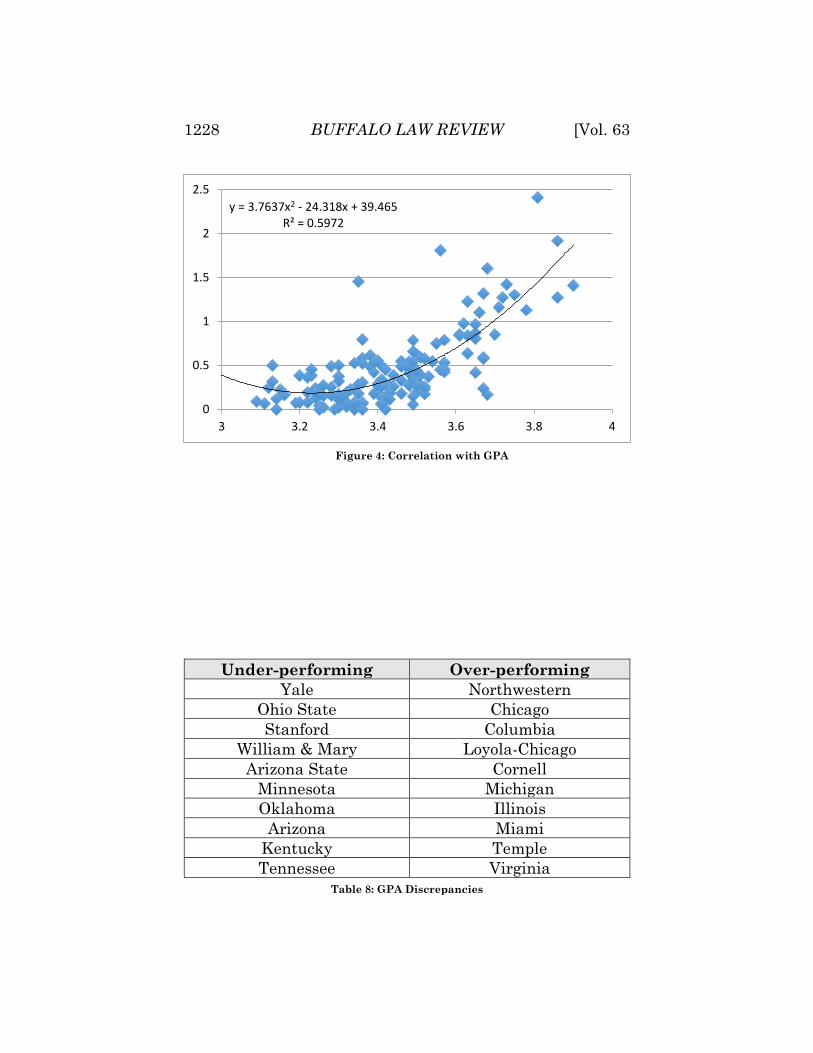
The following figures provide a visual depiction of the relationship between the index score and the measures typically used in evaluating law schools, namely the USNWR Ranking, LSAT, GPA, and tuition. The greatest outliers accompany each figure. These outliers were determined by calculating what a school’s index score should be, based on the best-fit line included in the graph, and then calculating the magnitude of the difference. Schools appearing multiple times are:
Yale and Stanford (underperforming with regard to USNWR, LSAT, and GPA, but still a top-10 value school). Yale and Stanford’s rankings and incoming statistics are so impressive that in the case of men or women, it is a Herculean task to match the best fit line.33
Arizona State, Arizona, and Oklahoma (underperforming with regard to USNWR, LSAT, and GPA).
Washington (St. Louis) and George Mason (underperforming with regard to USNWR and LSAT).
Connecticut (underperforming with respect to USNWR and top-10 worst value school).
Chicago (top 2 over-performer with respect to all four measures), Northwestern (top-3 over-performer with respect to all four measures), Loyola-Chicago (top-5 over-performer with respect to all four measures), Virginia (top-10 over-performer in all four measures)
Michigan (over-performing with respect to USNWR, GPA, and top 10 value school).
DePaul, Catholic, and Kansas (over-performing with respect to USNWR and LSAT).
Temple (over-performing with respect to USNWR and GPA).
Illinois and Miami (over-performing with respect to GPA and LSAT).
33. See An Empirical Analysis, supra note 5, at 623-29, for a more complete
gender neutral breakdown on over-performing and under-performing schools.
2015] GENDER DIVERSITY AND DISPARITY 1225
Figure 1: Correlation with USNWR Ranking
Table 5: USNWR Ranking Discrepancies
y = -0.375ln(x) + 1.9512R² = 0.6968
0
0.5
1
1.5
2
2.5
0 20 40 60 80 100 120 140
Overrated Underrated
Yale Chicago
Arizona State Northwestern
Arizona Loyola-Chicago
Wisconsin DePaul
Washington-St. Louis Catholic
Oklahoma Villanova
Connecticut South Carolina
Stanford Virginia
Iowa Cornell
George Mason Michigan
1226 BUFFALO LAW REVIEW [Vol. 63
Figure 2: Correlation with Tuition
Worst Value Best Value
Brooklyn Chicago
UC-Davis Harvard
Connecticut Northwestern
Yeshiva Virginia
Seton Hall Loyola-Chicago
UC-Hastings Temple
New York Law School Michigan
St. John’s Kansas
Hofstra Stanford
Pacific Yale
Table 6: Tuition Discrepancies
y = 0.0015x2 - 0.0906x + 1.4757R² = 0.5115
0
0.5
1
1.5
2
2.5
20 25 30 35 40 45 50 55 60
2015] GENDER DIVERSITY AND DISPARITY 1227
Figure 3: Correlation with LSAT
Under-performing Over-performing
Yale Chicago
Arizona State Northwestern
Stanford Loyola-Chicago
NYU Indiana
George Mason Virginia
Arizona Illinois
Washington-St. Louis DePaul
Oklahoma Catholic
Colorado Miami
Richmond Kansas
Table 7: LSAT Discrepancies
y = 0.0034x2 - 1.023x + 76.942R² = 0.7144
0
0.5
1
1.5
2
2.5
145 150 155 160 165 170 175
1228 BUFFALO LAW REVIEW [Vol. 63
Figure 4: Correlation with GPA
Under-performing Over-performing
Yale Northwestern
Ohio State Chicago
Stanford Columbia
William & Mary Loyola-Chicago
Arizona State Cornell
Minnesota Michigan
Oklahoma Illinois
Arizona Miami
Kentucky Temple
Tennessee Virginia
Table 8: GPA Discrepancies
y = 3.7637x2 - 24.318x + 39.465R² = 0.5972
0
0.5
1
1.5
2
2.5
3 3.2 3.4 3.6 3.8 4
2015] GENDER DIVERSITY AND DISPARITY 1229
B. Gender in Law Firms
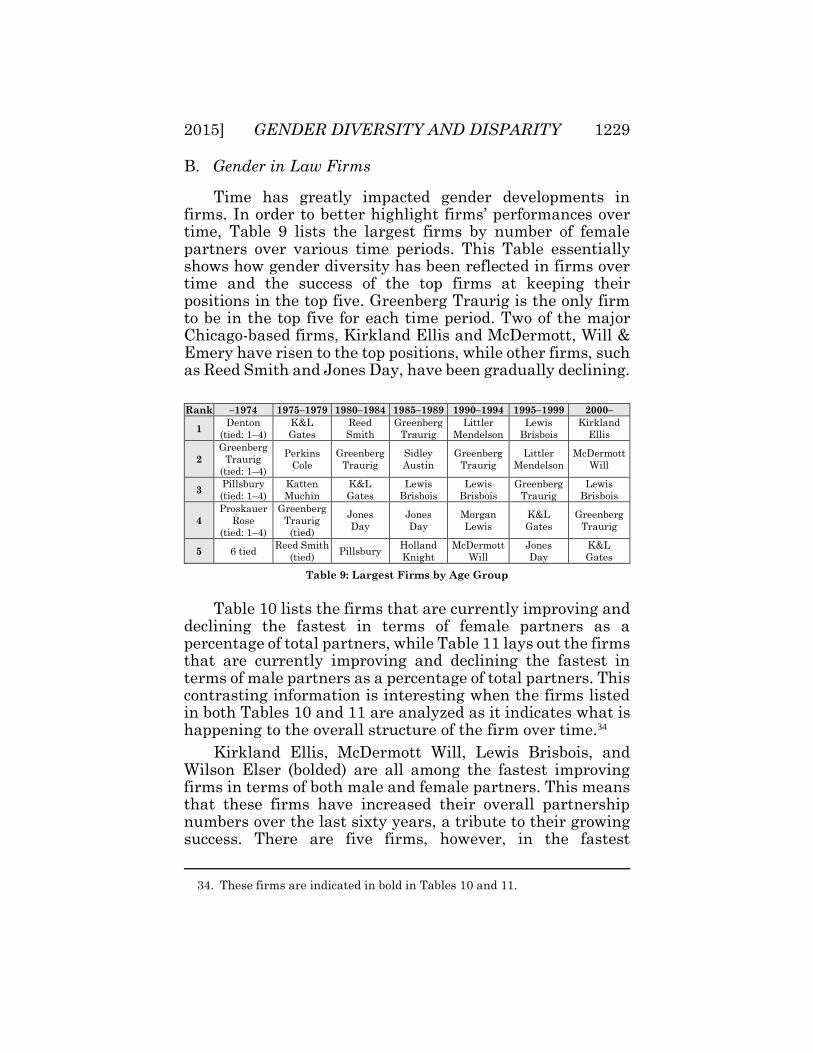
Time has greatly impacted gender developments in firms. In order to better highlight firms’ performances over time, Table 9 lists the largest firms by number of female partners over various time periods. This Table essentially shows how gender diversity has been reflected in firms over time and the success of the top firms at keeping their positions in the top five. Greenberg Traurig is the only firm to be in the top five for each time period. Two of the major Chicago-based firms, Kirkland Ellis and McDermott, Will & Emery have risen to the top positions, while other firms, such as Reed Smith and Jones Day, have been gradually declining.
Rank –1974 1975–1979 1980–1984 1985–1989 1990–1994 1995–1999 2000–
1 Denton
(tied: 1–4)
K&L
Gates
Reed
Smith
Greenberg
Traurig
Littler
Mendelson
Lewis
Brisbois
Kirkland
Ellis
2
Greenberg
Traurig
(tied: 1–4)
Perkins
Cole
Greenberg
Traurig
Sidley
Austin
Greenberg
Traurig
Littler
Mendelson
McDermott
Will
3 Pillsbury
(tied: 1–4)
Katten
Muchin
K&L
Gates
Lewis
Brisbois
Lewis
Brisbois
Greenberg
Traurig
Lewis
Brisbois
4
Proskauer
Rose
(tied: 1–4)
Greenberg
Traurig
(tied)
Jones
Day
Jones
Day
Morgan
Lewis
K&L
Gates
Greenberg
Traurig
5 6 tied Reed Smith
(tied) Pillsbury
Holland
Knight
McDermott
Will
Jones
Day
K&L
Gates
Table 9: Largest Firms by Age Group
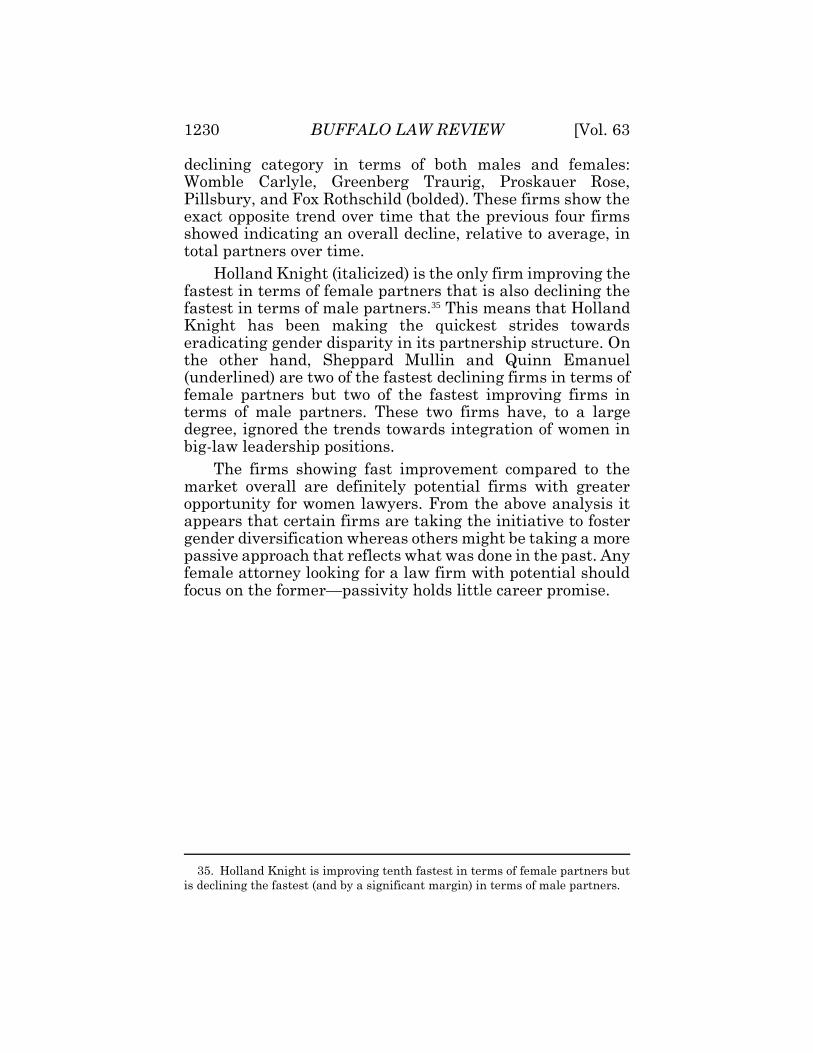
Table 10 lists the firms that are currently improving and
declining the fastest in terms of female partners as a percentage of total partners, while Table 11 lays out the firms that are currently improving and declining the fastest in terms of male partners as a percentage of total partners. This contrasting information is interesting when the firms listed in both Tables 10 and 11 are analyzed as it indicates what is happening to the overall structure of the firm over time.34
Kirkland Ellis, McDermott Will, Lewis Brisbois, and Wilson Elser (bolded) are all among the fastest improving firms in terms of both male and female partners. This means that these firms have increased their overall partnership numbers over the last sixty years, a tribute to their growing success. There are five firms, however, in the fastest
34. These firms are indicated in bold in Tables 10 and 11.
1230 BUFFALO LAW REVIEW [Vol. 63
declining category in terms of both males and females: Womble Carlyle, Greenberg Traurig, Proskauer Rose, Pillsbury, and Fox Rothschild (bolded). These firms show the exact opposite trend over time that the previous four firms showed indicating an overall decline, relative to average, in total partners over time.
Holland Knight (italicized) is the only firm improving the fastest in terms of female partners that is also declining the fastest in terms of male partners.35 This means that Holland Knight has been making the quickest strides towards eradicating gender disparity in its partnership structure. On the other hand, Sheppard Mullin and Quinn Emanuel (underlined) are two of the fastest declining firms in terms of female partners but two of the fastest improving firms in terms of male partners. These two firms have, to a large degree, ignored the trends towards integration of women in big-law leadership positions.
The firms showing fast improvement compared to the market overall are definitely potential firms with greater opportunity for women lawyers. From the above analysis it appears that certain firms are taking the initiative to foster gender diversification whereas others might be taking a more passive approach that reflects what was done in the past. Any female attorney looking for a law firm with potential should focus on the former—passivity holds little career promise.
35. Holland Knight is improving tenth fastest in terms of female partners but
is declining the fastest (and by a significant margin) in terms of male partners.
2015] GENDER DIVERSITY AND DISPARITY 1231
Fastest Improving Firms
Female Partners
Fastest Declining Firms
Female Partners
1 Kirkland Ellis (-28.82) Sheppard Mullin (27.56)
2 McDermott Will (-8.71) Womble Carlyle (23.62)
3 Lewis Brisbois (-8.62) Greenberg Traurig (16.77)
4 Wilson Elser (-8.47) Proskauer Rose (15.62)
5 Faegre Baker (-8.33) Quinn Emanuel (11.34)
6 Willkie Farr (-8.10) Pillsbury (9.46)
7 Cozen O’Connor (-6.57) Vinson Elkins (8.64)
8 Reed Smith (-5.57) Akerman (7.18)
9 King Spalding (-4.76) McGuireWoods (6.05)
10 Holland Knight (-4.49) Fox Rothschild (5.67)
Table 10: Greatest Improvements and Declines in Firms’ Female Partners
Fastest Improving Firms
Male Partners
Fastest Declining Firms
Male Partners
1 Kirkland Ellis (-20.81) Holland Knight (38.13)
2 Katten Muchin (-16.24) Weil Gotshal (19.82)
3 Hogan Lovells (-12.1) Greenberg Traurig (11.98)
4 McDermott Will (-6.22) Womble Carlyle (10.7)
5 Quinn Emanuel (-4.27) Denton (9.32)
6 Lewis Brisbois (-3.58) Proskauer Rose (8.81)
7 Wilson Elser (-3.52) Pillsbury (5.64)
8 Sheppard Mullin (-2.82) Troutman Sanders (5.63)
9 Nixon Peabody (-2.76) DLA Piper (2.63)
10 Barnes Thornburg (-2.57) Fox Rothschild (1.88)
Table 11: Greatest Improvements and Declines in Firms’ Male Partners

1232 BUFFALO LAW REVIEW [Vol. 63
C. Gender Differences Across the Country
Certain cities in the United States sometimes have perceived “reputations” (perhaps deserved and perhaps not) for being more socially “progressive” in accepting women into various professions whereas other cities are viewed as more “traditional.” This is especially true for the legal profession. Along with the factor of time, geography also has a significant effect on the amount of women attorneys in a market.
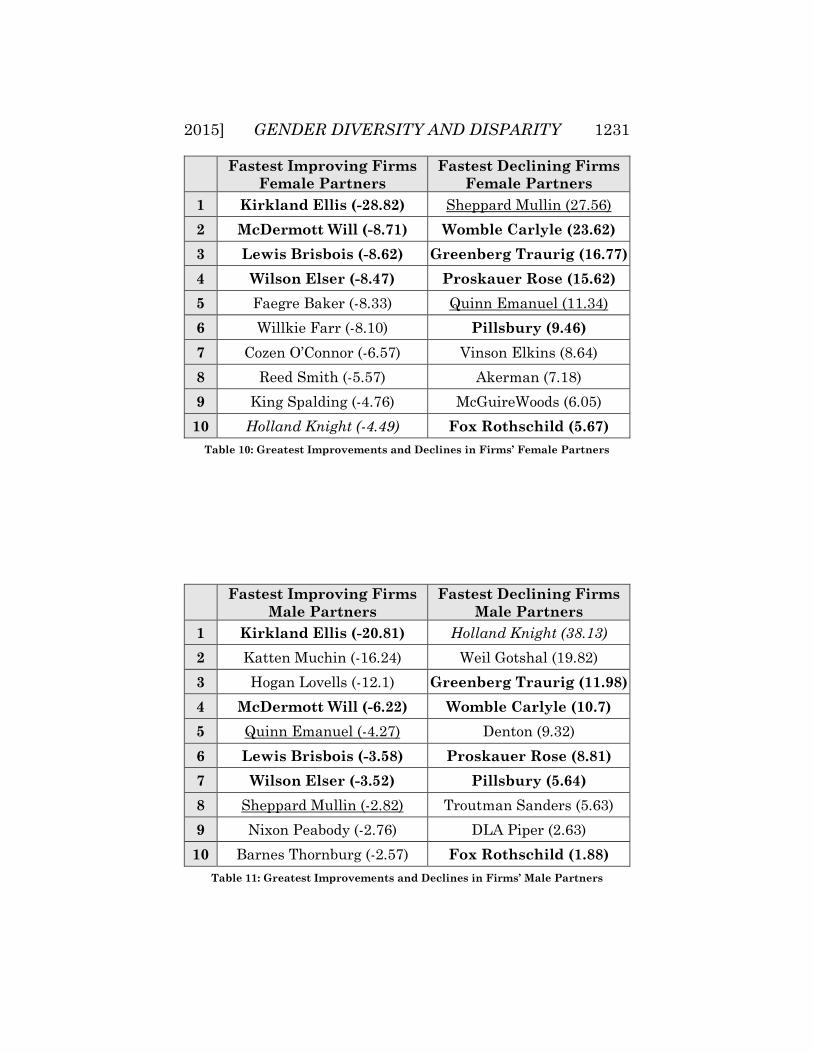
In order to study this significance, the twenty-five largest markets across the countries were studied. In order of size, these markets include: (1) New York City; (2) Washington, D.C.; (3) Chicago; (4) Los Angeles; (5) Boston; (6) San Francisco; (7) Philadelphia; (8) Atlanta; (9) Houston; (10) Dallas; (11) Palo Alto; (12) Miami; (13) Seattle; (14) Kansas City; (15) San Diego; (16) Denver; (17) Minneapolis; (18) Saint Louis; (19) Pittsburgh; (20) Charlotte; (21) Indianapolis; (22) Cleveland; (23) Richmond; (24) Phoenix; and (25) Austin.36 Table 12 ranks the most highly represented law schools nationally. Points were awarded to schools based on the school’s overall position in the city’s legal market. For example, if a school was first in the number of female partners in a certain city, it was awarded 10 points, second was awarded 9, and so on all the way down to 1 point for tenth place. This Table reiterates the dominance of certain schools’ gender diversity success in national big-law legal markets.
Rank Law School Points
1 Harvard 111
2 Georgetown 76
3 Michigan 42
4 Texas 40
5 Virginia 37
6 California-Berkeley 37
7 Northwestern 31
8 California-Los Angeles 31
36. Market size is halved from #1 to #3; #3 to #5; #5 to #11; #11 to #17; and #17
to #27. This means New York City is 4 times as big as Los Angeles, 8 times as big
as Palo Alto, and 16 times as big as Saint Louis.
2015] GENDER DIVERSITY AND DISPARITY 1233
9 George Washington 30
10 Yale 26
11 Columbia 23
12 California-Hastings 22
13 Houston 22
14 Chicago 21
15 Emory 19
16 Boston 18
17 Iowa 18
18 Vanderbilt 17
19 Stanford 16
20 Temple 16
21 Case Western 16
22 Southern California 16
23 Indiana 16
24 Washington-St. Louis 16
25 Missouri 16
Table 12: Law Schools Nationally Represented
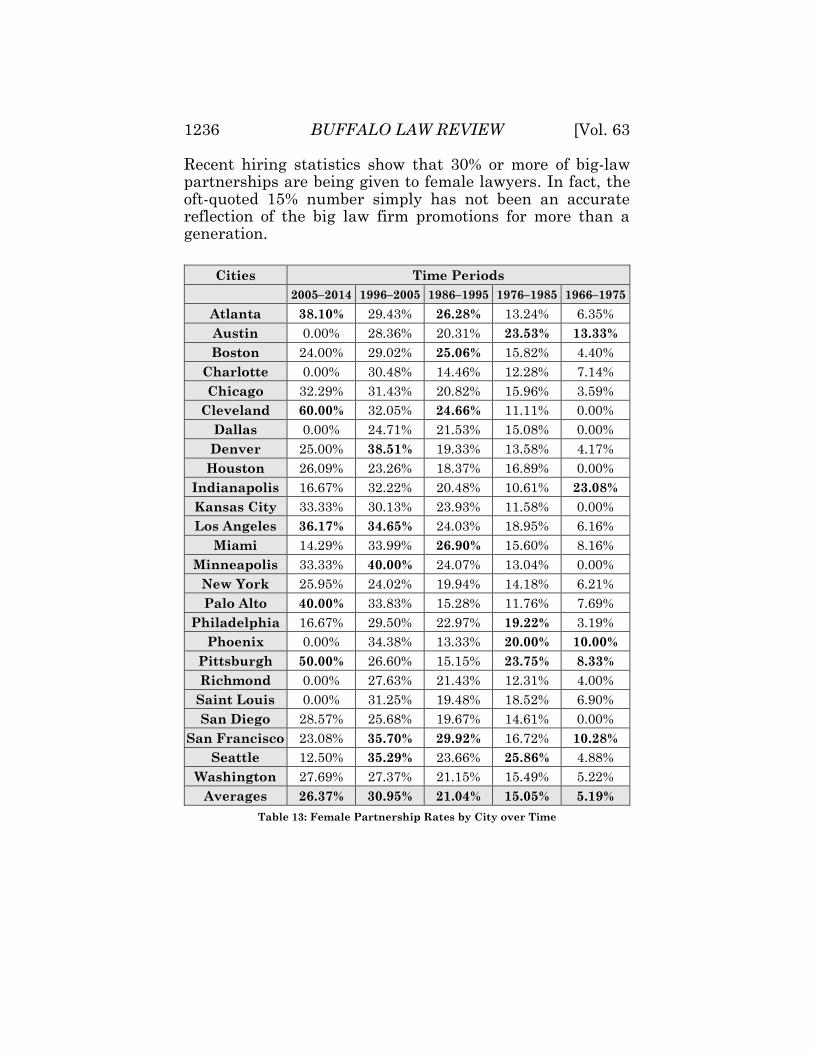
To provide a more in-depth look at various locations
across the country, the same twenty-five cities from the previous Section are analyzed here37 in ten-year periods from 1966 to 2014; the results are shown in Table 13.38 The highest percentages for each time period are highlighted in the table, indicating those cities with the greatest representation of female partners as a function of overall partners in those cities.
The results for the time period 1946–1965 are not included in Table 13 because of such low female partnership rates in the listed locations. For the time period 1956–1965,
37. In order of size these markets include: (1) New York City: (2) Washington,
D.C.; (3) Chicago; (4) Los Angeles; (5) Boston; (6) San Francisco; (7) Philadelphia;
(8) Atlanta; (9) Houston; (10) Dallas; (11) Palo Alto; (12) Miami; (13) Seattle;
(14) Kansas City; (15) San Diego; (16) Denver; (17) Minneapolis; (18) Saint Louis;
(19) Pittsburgh; (20) Charlotte; (21) Indianapolis; (22) Cleveland; (23) Richmond;
(24) Phoenix; and (25) Austin.
38. The results for the years 1946–1955 and 1956–1965 are not included in
Table 20.
1234 BUFFALO LAW REVIEW [Vol. 63
Indianapolis and Richmond firms had no partners in the top firms studied. Only Atlanta had female partners from this era; all other locations studied had no female partners for this time period.39 For the time period 1946–1955, only twelve of the twenty-five cities studied had partners in the 115 firms but none of them had any female partners.40
The results of the breakdown in Table 13 reflect the conclusions reached in Part II.C. Of the four biggest cities for large law firms, New York City and Washington D.C. have both seen relatively low growth in the numbers of female partners in comparison to trends in the other cities. Again, female attorneys hoping to make partner at large law firms should focus on locations on the West Coast and in various locations throughout middle America. Cleveland, Palo Alto, and Pittsburgh have all shown tremendous growth in the last decade and will be interesting areas to look at in the future for women.
Overall, Table 13 reveals both the substantial progress that has been achieved and the further work that is required. As recently as 1996, a prominent commentator on the issue noted that firms are amenable to interviewing and hiring female associates, but much slower to change their views with regards to female partners.41 Even in 2007, only 17% of partners at “big” law firms were female, a meager jump from 14% a decade earlier.42 After the explosion of female law students in the 1970s and early 1980s, this was a disappointing figure.43 A study conducted by the National
39. Atlanta firms have 8.33% female partners from this era.
40. These cities include: Atlanta, Boston, Charlotte, Chicago, Dallas, Kansas
City, Los Angeles, Miami, New York, San Francisco, Seattle, and Washington,
D.C.
41. See Ziewacz, supra note 28, at 978. Ziewacz noted that the level of female
associates is triple that of female partners (39% to 13%). Id. at 978-79. In a study
conducted the next year, the numbers estimated that approximately 41% of
associates were female, compared to only 14% of partners. See Elizabeth
Chambliss & Christopher Uggen, Men and Women of Elite Law Firms:
Reevaluating Kanter’s Legacy, 25 L. & SOC. INQUIRY 41, 47 (2000).
42. See Jennifer Salvatore, Why Don’t More Men Leave Big Law Firms?,
86 MICH. B.J., Aug. 2007, at 41, 41.
43. Judith S. Kaye & Anne C. Reddy, The Progress of Women Lawyers at Big
Firms: Steady or Simply Studied, 76 FORDHAM L. REV. 1941, 1944 (2008) (citing
2015] GENDER DIVERSITY AND DISPARITY 1235
Survey of Women Lawyers confirmed both the above statistic and Table 13 generally.44 These numbers have produced what is referred to as the “50/15/15 conundrum,”45 although these numbers are not precise.46 The result is that a significant majority of women who have been drawn to private practice have ended up in small firms or as solo practitioners.47 These findings, taken together, constitute what has been frequently referred to as a “glass ceiling” for women lawyers.48 Yet, the table below depicts the fiction of the “50/15/15” phenomenon.
Am. Bar. Assoc., First Year and Total J.D. Enrollment by Gender, 1947–2005,
(n.d.), http://www.abanet.org/legaled/statistics/charts/stats%20-%206.pdf
(stating that females composed 4.3% of law students in 1967, compared to 40.7%
by 1987). For updated statistics from the American Bar Association, see First
Year and Total J.D. Enrollment by Gender, A.B.A., http://www.americanbar.org/
content/dam/aba/administrative/legal_education_and_admissions_to_the_bar/
statistics/jd_enrollment_1yr_total_gender.authcheckdam.pdf (last visited Sept.
15, 2015).
44. Nat’l Assoc. of Women Lawyers, 2007 Survey of the Status of Women in
Law Firms, 93 WOMEN LAW. J., Fall/Winter 2008, at 13, 13 [hereinafter NAWL].
The survey included the 200 largest law firms and concluded that 16% of equity
partners were women. Id. In the survey, only 10% of equity partners who
graduated before 1980 were women, while about 20% who graduated between
1983 and 1998 were women. Id.
45. Kaye & Reddy, supra note 43, at 1946. The numbers refer to the fact that
females constituted approximately 50% of big-law associates, but only about 15%
of big-law partners, for the entirety of the 15-year period between 1992 and 2007.
46. For example, in the mid-1990s females constituted 39% of associates
(compared to 43% of law students), 25% of newly promoted partners, and 14% of
all partners. Elizabeth H. Gorman & Julie A. Kmec, Hierarchical Rank and
Women’s Organizational Mobility: Glass Ceilings in Corporate Law Firms,
114 AM. J. SOC. 1428, 1455 (2009).
47. See generally Laura Allen, Small Firms Mean Big Opportunities for
Women, 7 COMPLEAT LAW., Summer 1990, at 35, 37 (1990) (discussing reasons
which might explain this phenomenon). Allen also quotes an attorney who stated
that “larger firms suffer from a . . . ‘male-dominated hierarchy.’” Id. at 36. But see
Fiona Kay & Elizabeth Gorman, Women in the Legal Profession, 4 ANN. REV. L. &
SOC. SCI., 299, 303 (2008) (citing GITA Z. WILDER, WOMEN IN THE LEGAL
PROFESSION: FINDINGS FROM THE FIRST WAVE OF THE AFTER THE JD STUDY 8 (2007))
(providing percentage numbers in different areas of legal work that are relatively
equal).
48. See Ziewacz, supra note 28, at 10; see also, e.g., Mark S. Kende, Shattering
the Glass Ceiling: A Legal Theory for Attacking Discrimination Against Women
Partners, 46 HASTINGS L.J. 17 (1994); Karen Blumenthal, Room at the Top, WALL.
ST. J., Mar. 24, 1986, at 7D; Terri A. Scandura, Breaking the Glass Ceiling in the
1990s, WOMEN’S BUREAU, U.S. DEP’T LABOR (1992) microformed on Gov’t Doc. No.
L 36.102:G 46 (U.S. Gov’t Printing Office).
1236 BUFFALO LAW REVIEW [Vol. 63
Recent hiring statistics show that 30% or more of big-law partnerships are being given to female lawyers. In fact, the oft-quoted 15% number simply has not been an accurate reflection of the big law firm promotions for more than a generation.
Cities Time Periods
2005–2014 1996–2005 1986–1995 1976–1985 1966–1975
Atlanta 38.10% 29.43% 26.28% 13.24% 6.35%
Austin 0.00% 28.36% 20.31% 23.53% 13.33%
Boston 24.00% 29.02% 25.06% 15.82% 4.40%
Charlotte 0.00% 30.48% 14.46% 12.28% 7.14%
Chicago 32.29% 31.43% 20.82% 15.96% 3.59%
Cleveland 60.00% 32.05% 24.66% 11.11% 0.00%
Dallas 0.00% 24.71% 21.53% 15.08% 0.00%
Denver 25.00% 38.51% 19.33% 13.58% 4.17%
Houston 26.09% 23.26% 18.37% 16.89% 0.00%
Indianapolis 16.67% 32.22% 20.48% 10.61% 23.08%
Kansas City 33.33% 30.13% 23.93% 11.58% 0.00%
Los Angeles 36.17% 34.65% 24.03% 18.95% 6.16%
Miami 14.29% 33.99% 26.90% 15.60% 8.16%
Minneapolis 33.33% 40.00% 24.07% 13.04% 0.00%
New York 25.95% 24.02% 19.94% 14.18% 6.21%
Palo Alto 40.00% 33.83% 15.28% 11.76% 7.69%
Philadelphia 16.67% 29.50% 22.97% 19.22% 3.19%
Phoenix 0.00% 34.38% 13.33% 20.00% 10.00%
Pittsburgh 50.00% 26.60% 15.15% 23.75% 8.33%
Richmond 0.00% 27.63% 21.43% 12.31% 4.00%
Saint Louis 0.00% 31.25% 19.48% 18.52% 6.90%
San Diego 28.57% 25.68% 19.67% 14.61% 0.00%
San Francisco 23.08% 35.70% 29.92% 16.72% 10.28%
Seattle 12.50% 35.29% 23.66% 25.86% 4.88%
Washington 27.69% 27.37% 21.15% 15.49% 5.22%
Averages 26.37% 30.95% 21.04% 15.05% 5.19%
Table 13: Female Partnership Rates by City over Time
2015] GENDER DIVERSITY AND DISPARITY 1237
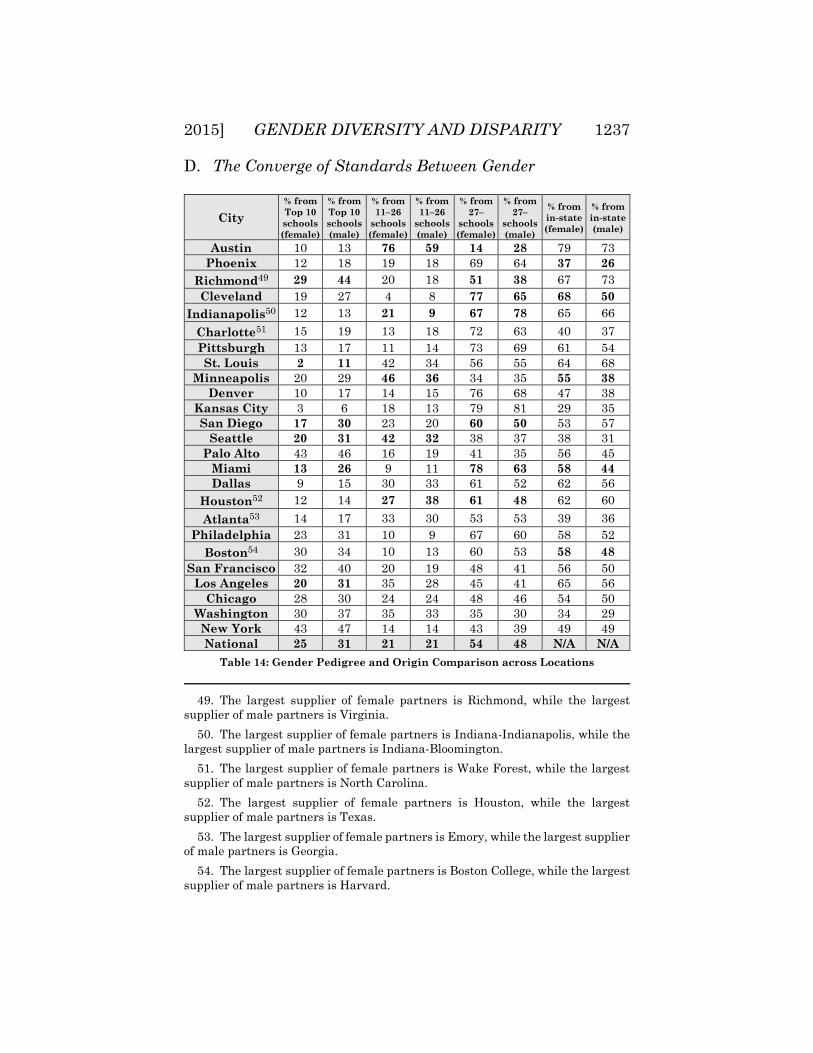
D. The Converge of Standards Between Gender
City
% from
Top 10
schools
(female)
% from
Top 10
schools
(male)
% from
11–26
schools
(female)
% from
11–26
schools
(male)
% from
27–
schools
(female)
% from
27–
schools
(male)
% from
in-state
(female)
% from
in-state
(male)
Austin 10 13 76 59 14 28 79 73
Phoenix 12 18 19 18 69 64 37 26
Richmond49 29 44 20 18 51 38 67 73
Cleveland 19 27 4 8 77 65 68 50
Indianapolis50 12 13 21 9 67 78 65 66
Charlotte51 15 19 13 18 72 63 40 37
Pittsburgh 13 17 11 14 73 69 61 54
St. Louis 2 11 42 34 56 55 64 68
Minneapolis 20 29 46 36 34 35 55 38
Denver 10 17 14 15 76 68 47 38
Kansas City 3 6 18 13 79 81 29 35
San Diego 17 30 23 20 60 50 53 57
Seattle 20 31 42 32 38 37 38 31
Palo Alto 43 46 16 19 41 35 56 45
Miami 13 26 9 11 78 63 58 44
Dallas 9 15 30 33 61 52 62 56
Houston52 12 14 27 38 61 48 62 60
Atlanta53 14 17 33 30 53 53 39 36
Philadelphia 23 31 10 9 67 60 58 52
Boston54 30 34 10 13 60 53 58 48
San Francisco 32 40 20 19 48 41 56 50
Los Angeles 20 31 35 28 45 41 65 56
Chicago 28 30 24 24 48 46 54 50
Washington 30 37 35 33 35 30 34 29
New York 43 47 14 14 43 39 49 49
National 25 31 21 21 54 48 N/A N/A
Table 14: Gender Pedigree and Origin Comparison across Locations
49. The largest supplier of female partners is Richmond, while the largest
supplier of male partners is Virginia.
50. The largest supplier of female partners is Indiana-Indianapolis, while the
largest supplier of male partners is Indiana-Bloomington.
51. The largest supplier of female partners is Wake Forest, while the largest
supplier of male partners is North Carolina.
52. The largest supplier of female partners is Houston, while the largest
supplier of male partners is Texas.
53. The largest supplier of female partners is Emory, while the largest supplier
of male partners is Georgia.
54. The largest supplier of female partners is Boston College, while the largest
supplier of male partners is Harvard.
1238 BUFFALO LAW REVIEW [Vol. 63
The preceding table lists the twenty-five largest legal markets (in ascending order), according to the number of partners included in the Study. A variety of significant, and to varying degrees, surprising trends emerge from the data. First, in every one of the above listed legal markets, a higher percentage of male partners than female partners attended elite law schools. Correspondingly, in nearly every market, a higher percentage of female partners than male partners graduated from unranked law schools. Furthermore, in nearly every market, a higher percentage of female partners graduated from in-state law schools. The first two points are necessarily related, and the second and third point could be, to some degree, related. Each of these points is considered in turn.
The difference between columns (2) and (3) varies somewhat significantly from a mere 1% in Indianapolis to 15% in Richmond. Yet, in every single market, the fact remains the same: it is more likely a law firm partner went to an elite school if the partner is male than female. If one were to observe that a law firm office had female partners who were generally from elite law schools and male partners who were generally from unranked law schools, it would be a small step to conclude that females were discriminatorily being held to a higher standard. The above table demonstrated that the pattern is the opposite. Is this an indication of affirmative action? Is there some other underlying flaw in the data? Are differences in gender priorities playing a dominant role?55
A brief discussion of these gender priorities is warranted. It has been stated that familial demands, lack of social integration in big-law, and an intensifying atmosphere at big law firms disproportionately causes women to leave big-law.56
55. One reasonable and common response to this information might be the
conclusion that women exit big-law more frequently than men. The implication
would be that a woman is more likely to exit biglaw if she has desirable
alternatives, and those alternatives are more likely to be present if she attended
an elite law school.
56. See Salvatore, supra note 42, at 41 (characterizing these reasons as
“conventional wisdom”). Other studies present data that questions the validity of
these factors. See Kaye & Reddy, supra note 43, at 1948 (citing NALP, UPDATE ON
ASSOCIATE ATTRITION: FINDINGS FROM A NATIONAL STUDY OF LAW FIRM ASSOCIATE
2015] GENDER DIVERSITY AND DISPARITY 1239
The decrease in the percentage of women at each level within law firms certainly begs an answer.57 The data certainly is compatible with, and probably supports, the contention that women are choosing to leave large law firms.58
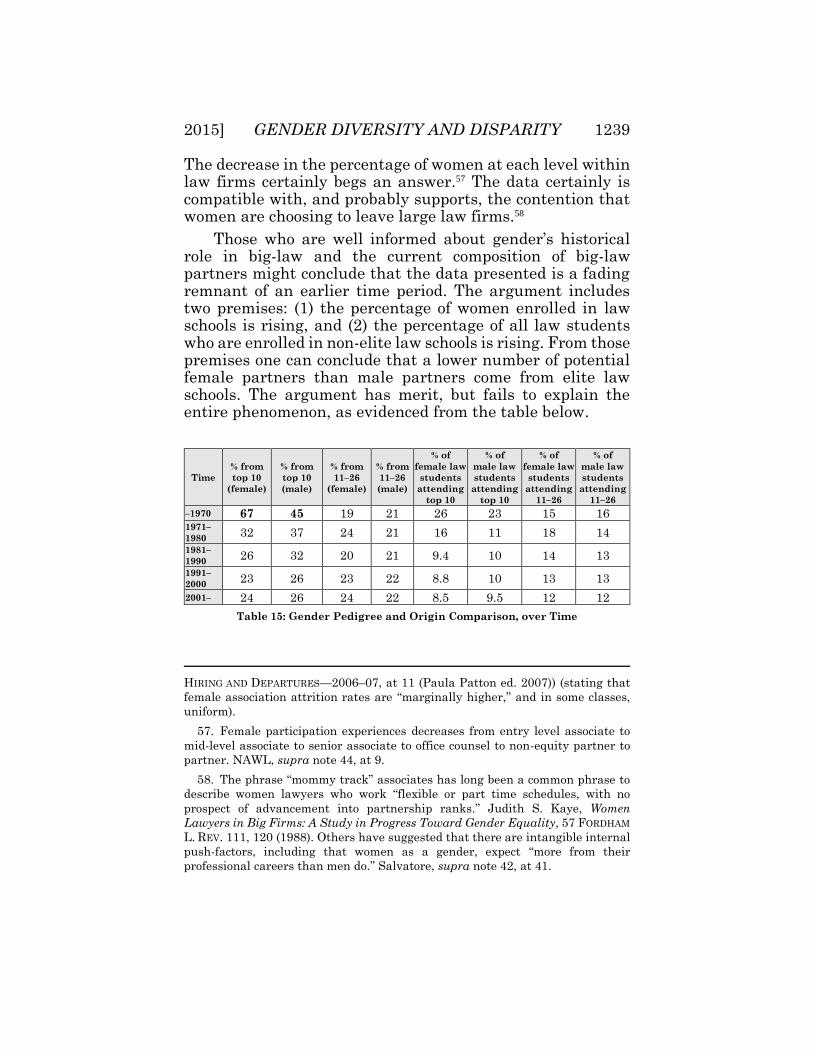
Those who are well informed about gender’s historical role in big-law and the current composition of big-law partners might conclude that the data presented is a fading remnant of an earlier time period. The argument includes two premises: (1) the percentage of women enrolled in law schools is rising, and (2) the percentage of all law students who are enrolled in non-elite law schools is rising. From those premises one can conclude that a lower number of potential female partners than male partners come from elite law schools. The argument has merit, but fails to explain the entire phenomenon, as evidenced from the table below.
Time
% from
top 10
(female)
% from
top 10
(male)
% from
11–26
(female)
% from
11–26
(male)
% of
female law
students
attending
top 10
% of
male law
students
attending
top 10
% of
female law
students
attending
11–26
% of
male law
students
attending
11–26
–1970 67 45 19 21 26 23 15 16 1971–
1980 32 37 24 21 16 11 18 14
1981–
1990 26 32 20 21 9.4 10 14 13
1991–
2000 23 26 23 22 8.8 10 13 13
2001– 24 26 24 22 8.5 9.5 12 12
Table 15: Gender Pedigree and Origin Comparison, over Time
HIRING AND DEPARTURES—2006–07, at 11 (Paula Patton ed. 2007)) (stating that
female association attrition rates are “marginally higher,” and in some classes,
uniform).
57. Female participation experiences decreases from entry level associate to
mid-level associate to senior associate to office counsel to non-equity partner to
partner. NAWL, supra note 44, at 9.
58. The phrase “mommy track” associates has long been a common phrase to
describe women lawyers who work “flexible or part time schedules, with no
prospect of advancement into partnership ranks.” Judith S. Kaye, Women
Lawyers in Big Firms: A Study in Progress Toward Gender Equality, 57 FORDHAM
L. REV. 111, 120 (1988). Others have suggested that there are intangible internal
push-factors, including that women as a gender, expect “more from their
professional careers than men do.” Salvatore, supra note 42, at 41.
1240 BUFFALO LAW REVIEW [Vol. 63
It is clear that the phenomenon is decreasing over time. Yet, in a study that includes tens of thousands of partners, the fact that it is still present at this very time is somewhat surprising, primarily because common sense would lead one to the opposite conclusion. Literature in this area is replete with evidence that women are being held to a higher standard in big-law and that gender discrimination is still a widespread occurrence in the profession. If this higher standard is indeed still consciously or unconsciously part of big-law culture, should not the opposite results be found?
Table 16 identifies a “big-law partnership prospect multiplier.”59 This multiplier, together with the factor of time, fully explains the legal market trend evidenced above. As can be seen in Table 15, only 8.5% of female law students in the year 2000 attended elite law schools, compared to 9.5% of male law students.
In both the elite and good law school categories, it is clear that the value of the degree for women is increasing relative to the value for men. The drop-off for men is also steeper. There are at least a couple ways of interpreting this data: in the 1970s and 1980s, affirmative action and a commitment to a better integration of women in the legal market led to more promotions of women who did not attend elite law schools. An alternative explanation is that womens’ promotion chances are affected more by “soft” qualifications (such as personality, work ethic, participation in office politics, etc.) than their male counterparts. Regardless of one’s interpretation, the fact that the phenomenon has steadily and invariably shifted is clear evidence that gender standards are becoming equalized.
59. The multiplier is how much more likely it is that an individual from the
given group becomes a big-law partner than the average individual of their gender
and age range.
2015] GENDER DIVERSITY AND DISPARITY 1241
Time Female
Top 10
Male Top
10
Female
11–26
Male
11–26
–1970 2.59 2.01 1.30 1.28
1971–1980 1.93 3.56 1.34 1.49
1981–1990 2.74 3.14 1.43 1.66
1991–2000 2.63 2.63 1.74 1.70
2001– 2.82 2.70 2.02 1.79
Table 16: Importance of Law School Attended, by Gender, over Time
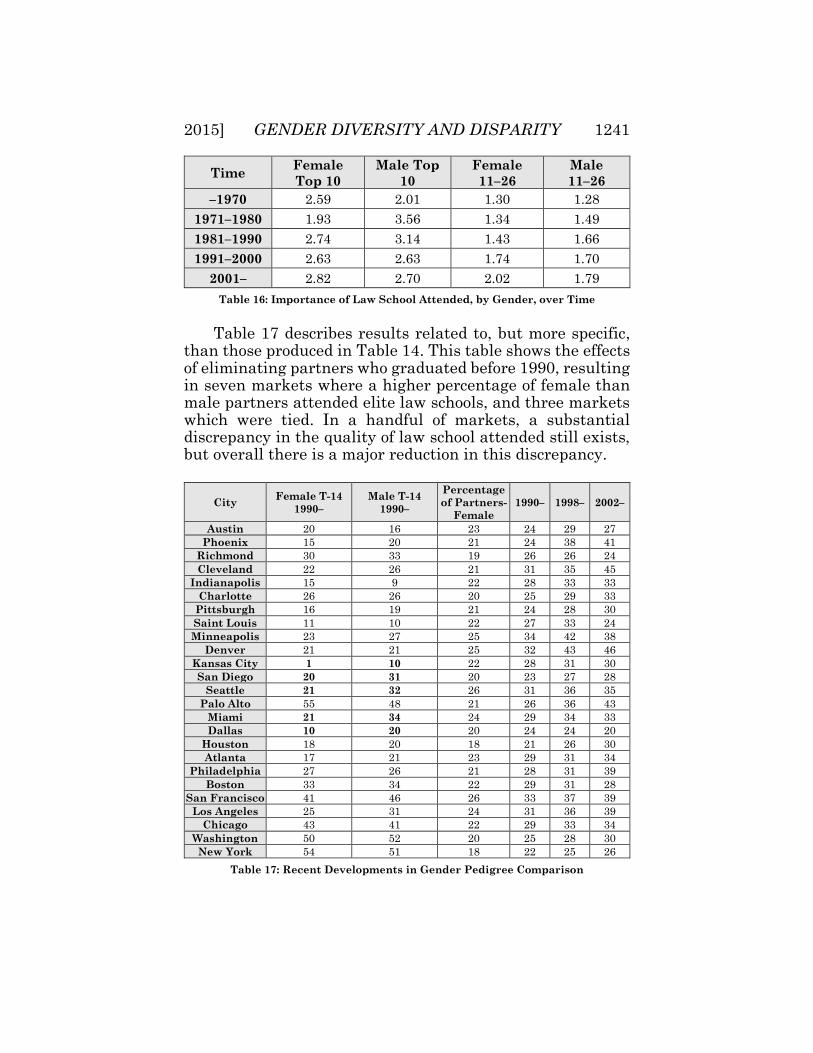
Table 17 describes results related to, but more specific,
than those produced in Table 14. This table shows the effects of eliminating partners who graduated before 1990, resulting in seven markets where a higher percentage of female than male partners attended elite law schools, and three markets which were tied. In a handful of markets, a substantial discrepancy in the quality of law school attended still exists, but overall there is a major reduction in this discrepancy.
City Female T-14
1990–
Male T-14
1990–
Percentage
of Partners-
Female
1990– 1998– 2002–
Austin 20 16 23 24 29 27
Phoenix 15 20 21 24 38 41
Richmond 30 33 19 26 26 24
Cleveland 22 26 21 31 35 45
Indianapolis 15 9 22 28 33 33
Charlotte 26 26 20 25 29 33
Pittsburgh 16 19 21 24 28 30
Saint Louis 11 10 22 27 33 24
Minneapolis 23 27 25 34 42 38
Denver 21 21 25 32 43 46
Kansas City 1 10 22 28 31 30
San Diego 20 31 20 23 27 28
Seattle 21 32 26 31 36 35
Palo Alto 55 48 21 26 36 43
Miami 21 34 24 29 34 33
Dallas 10 20 20 24 24 20
Houston 18 20 18 21 26 30
Atlanta 17 21 23 29 31 34
Philadelphia 27 26 21 28 31 39
Boston 33 34 22 29 31 28
San Francisco 41 46 26 33 37 39
Los Angeles 25 31 24 31 36 39
Chicago 43 41 22 29 33 34
Washington 50 52 20 25 28 30
New York 54 51 18 22 25 26
Table 17: Recent Developments in Gender Pedigree Comparison

1242 BUFFALO LAW REVIEW [Vol. 63
Furthermore, the right half of the table lists the percentage of big-law partners who are women. While the median total of the largest markets is 22%, that number jumps to 28% when limiting the sample to partners who graduated in 1990 or later, 31% when considering 1998 or later, and 33% when considering 2002 or later.
E. Why Do Men Dominate the Most Profitable Firms?
There is a significant negative correlation between number of female partners and profit/revenue per partner.60 The direction of causation is unclear, however, and there could be complicated underlying factors that cause this relationship.61 This can be broken down into two groups: (1) firms that have a higher than average number of female partners because they have a higher than average number of female associates, and (2) firms that have a higher number of female partners because they promote a relatively high percentage of their female partners. In both cases there is a negative correlation with the financial metrics of the firm, but group (1) holds a noticeably stronger correlation.
There are multiple ways to view this data: those firms that are more financially successful have less incentive to change their hiring policies and will retain older policies
60. Some commentators have suggested that “Rambo-style” tactics in place at
“larger” firms are more frequently rejected by women lawyers. See Allen, supra
note 47, at 36-37 (discussing some issues for women lawyers at large law firms).
When discussing “large” law firms in the context of women partners, “large” more
aptly refers to revenue instead of headcount. This Study found no correlation
between the percentage of partners who are women and law firm size. Admittedly
all of the law firms in the Study could be considered to be “large,” but smaller,
high profit law firms (think Wachtell) seem to possess more characteristics that
are seen as detrimental to women lawyers than large, lower profit firms (think
Lewis Brisbois), and the data supports this theoretical conclusion.
61. One important theme in the existing literature is the effect of high required
(officially or just expected) billable hours. In general, it is probably safe to assume
that there is a correlation between profit (or revenue) and required/expected
billable hours. If this is true, then it might be that women are simply choosing
not to work in the most profitable law firms. Kaye, supra note 58, at 122
(discussing how high billable hour requirements are troubling for women with
family responsibilities). Yet a different study suggested that flex time
opportunities are not an adequate solution to this problem. See Allen, supra note
47, at 39.
2015] GENDER DIVERSITY AND DISPARITY 1243
longer. The alternatives are that women choose to leave/not work at highly profitable firms or that a higher percentage of female partners is bad for the economics of the firm.62 Using change in number of partners as a proxy for change in revenue,63 we can offer a reasonable speculation regarding casuistry, albeit one with severe qualifications. The data produces a bifurcated answer: in both cases the negative correlation mentioned above is partially explained for under the proxy, suggesting that increasing the percentage of female associates promoted to partner is, in general, economically bad for a firm. 64 Yet, in both cases65 an equal or slightly greater part of the correlation is left unaccounted for, suggesting that conservative hiring policies at the most successful firms are also responsible for the observation.66
Neither one of these observations should come as much of a surprise: the most successful firms have little incentive to change their internal policies, while literature in this area has noted a couple areas where female lawyers are typically at a disadvantage (most notably social capital, possibly personality). Should measures be taken to address this? As has been noted elsewhere, there is, as expected, a significant relationship between percentage of partners who are female
62. This represents the dichotomy between supply-side and demand-side
factors. See Kay & Gorman, supra note 47, at 304, for a brief discussion of these
factors and the dichotomy.
63. The accuracy of this proxy is unclear. In general there would be an expected
correlation between change in revenue and change in partners at a firm, but
unstable salaries and the partnership structures might challenge that
correlation.
64. This result was controlled by relating the change in male promotions to the
change in female promotions.
65. Roughly 2/3 and 1/2 of the correlation in female associate numbers and
promotion percentage, respectively. This is even more important because the
negative correlation between female associates and profit per partner is much
more significant.
66. To some readers, this correlation might not be surprising. See Allen, supra
note 47, at 38 (“Many doubt the success of a law firm of all women.”). Fragomen,
Del Rey, Bernsen, and Loewy is an interesting case for those readers. The firm
has a significantly higher percentage of female partners than any other firm,
while the majority of partners in its main office (New York City) are female. Yet,
the firm’s revenue and profit per partner are significantly above average for the
largest firms.
1244 BUFFALO LAW REVIEW [Vol. 63
and percentage of associates who are female at a firm. Suggestions have been made that law firms that have more workplace flexibility or a less competitive confrontational atmosphere are positive for female partnership prospects, yet our data clearly rejects that notion.67 If it were desirable, and if it could be achieved, promoting female partners would help eradicate the gender discrepancy at the best firms. Is affirmative action beneficial though, and does it even work?
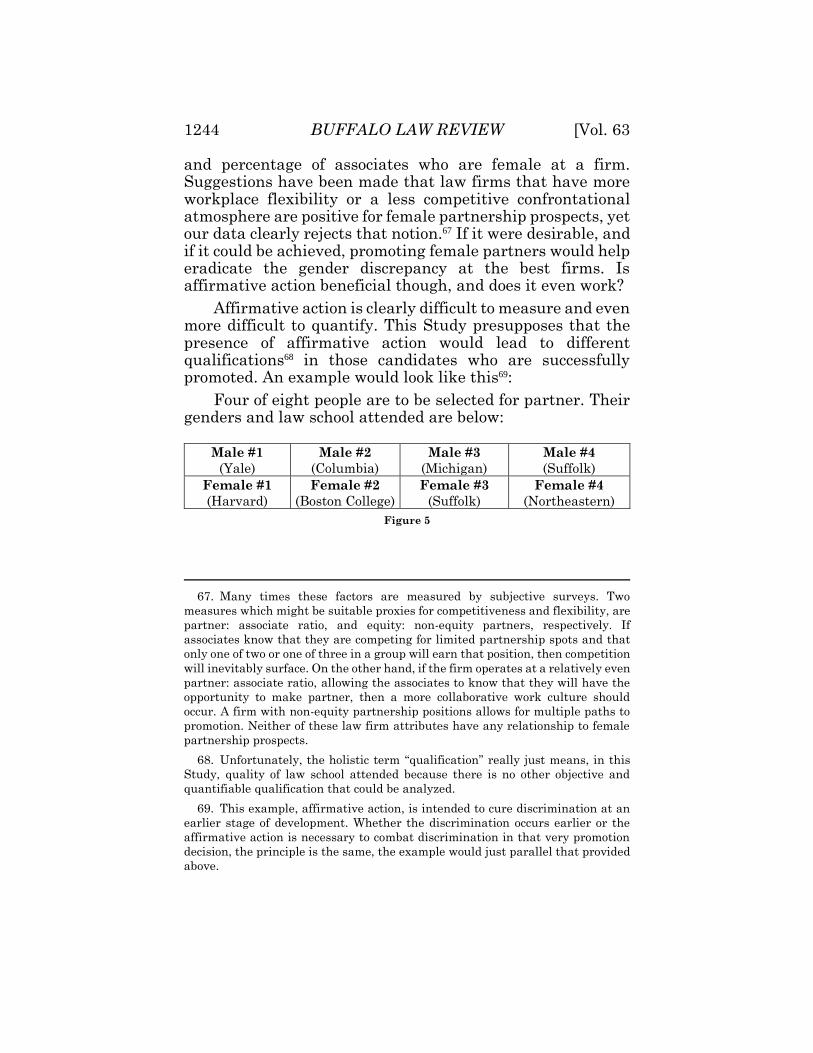
Affirmative action is clearly difficult to measure and even more difficult to quantify. This Study presupposes that the presence of affirmative action would lead to different qualifications68 in those candidates who are successfully promoted. An example would look like this69:
Four of eight people are to be selected for partner. Their genders and law school attended are below:
Male #1
(Yale)
Male #2
(Columbia)
Male #3
(Michigan)
Male #4
(Suffolk)
Female #1
(Harvard)
Female #2
(Boston College)
Female #3
(Suffolk)
Female #4
(Northeastern)
Figure 5
67. Many times these factors are measured by subjective surveys. Two
measures which might be suitable proxies for competitiveness and flexibility, are
partner: associate ratio, and equity: non-equity partners, respectively. If
associates know that they are competing for limited partnership spots and that
only one of two or one of three in a group will earn that position, then competition
will inevitably surface. On the other hand, if the firm operates at a relatively even
partner: associate ratio, allowing the associates to know that they will have the
opportunity to make partner, then a more collaborative work culture should
occur. A firm with non-equity partnership positions allows for multiple paths to
promotion. Neither of these law firm attributes have any relationship to female
partnership prospects.
68. Unfortunately, the holistic term “qualification” really just means, in this
Study, quality of law school attended because there is no other objective and
quantifiable qualification that could be analyzed.
69. This example, affirmative action, is intended to cure discrimination at an
earlier stage of development. Whether the discrimination occurs earlier or the
affirmative action is necessary to combat discrimination in that very promotion
decision, the principle is the same, the example would just parallel that provided
above.
2015] GENDER DIVERSITY AND DISPARITY 1245
Based solely on qualifications, the firm would choose Female #1 and Males #1 to #3. The firm, however, wishes to help decrease its gender disparity among the partners, and chooses Female #2 over Male #3. This leads to an increase in the average qualifications of the male partners selected that year and a decrease in the average qualifications of the female partners.
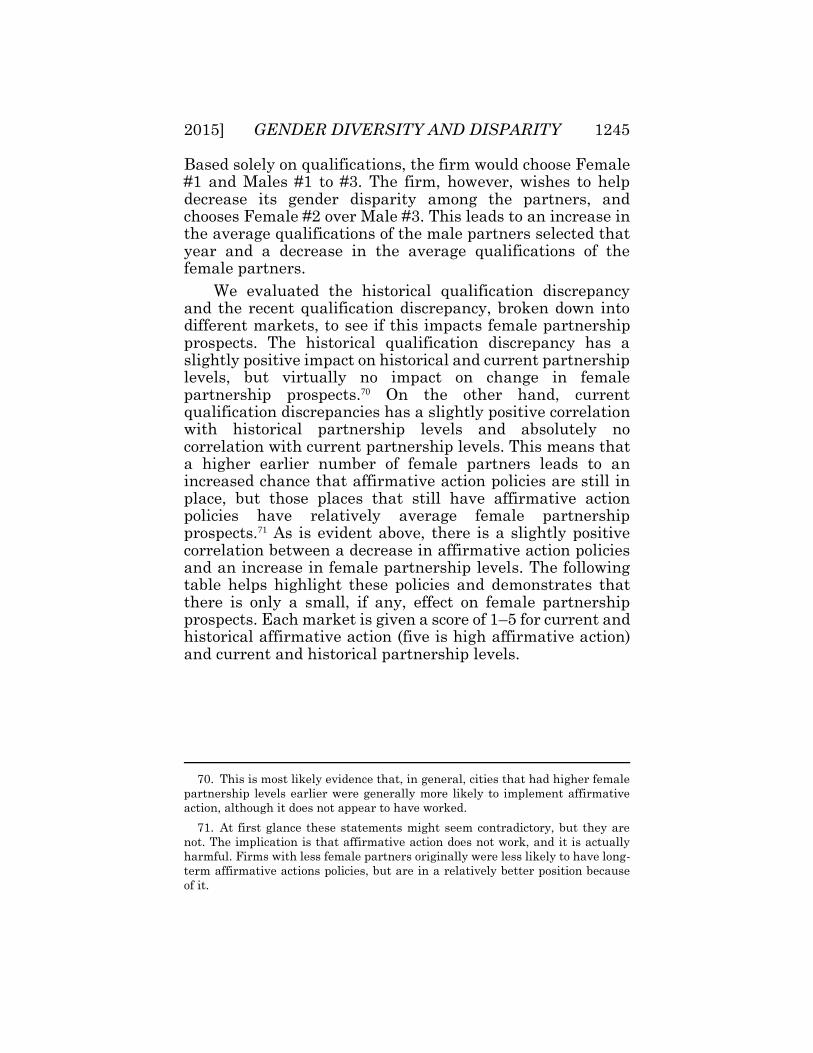
We evaluated the historical qualification discrepancy and the recent qualification discrepancy, broken down into different markets, to see if this impacts female partnership prospects. The historical qualification discrepancy has a slightly positive impact on historical and current partnership levels, but virtually no impact on change in female partnership prospects.70 On the other hand, current qualification discrepancies has a slightly positive correlation with historical partnership levels and absolutely no correlation with current partnership levels. This means that a higher earlier number of female partners leads to an increased chance that affirmative action policies are still in place, but those places that still have affirmative action policies have relatively average female partnership prospects.71 As is evident above, there is a slightly positive correlation between a decrease in affirmative action policies and an increase in female partnership levels. The following table helps highlight these policies and demonstrates that there is only a small, if any, effect on female partnership prospects. Each market is given a score of 1–5 for current and historical affirmative action (five is high affirmative action) and current and historical partnership levels.
70. This is most likely evidence that, in general, cities that had higher female
partnership levels earlier were generally more likely to implement affirmative
action, although it does not appear to have worked.
71. At first glance these statements might seem contradictory, but they are
not. The implication is that affirmative action does not work, and it is actually
harmful. Firms with less female partners originally were less likely to have long-
term affirmative actions policies, but are in a relatively better position because
of it.
1246 BUFFALO LAW REVIEW [Vol. 63
City Historical
AA
Current
AA
Historical
Partner
Current
Partner
Austin 2 1 5 2
Phoenix 3 4 4 5
Richmond 5 3 1 3
Cleveland 4 4 1 4
Indianapolis 1 1 2 3
Charlotte 2 2 1 2
Pittsburgh 2 3 4 2
Saint Louis 4 1 4 4
Minneapolis 4 4 3 5
Denver 3 2 3 5
Kansas City 1 5 1 3
San Diego 5 5 2 1
Seattle 5 5 5 4
Palo Alto 2 1 1 5
Miami 5 5 5 4
Dallas 3 5 2 1
Houston 1 3 3 1
Atlanta 1 3 3 2
Philadelphia 4 2 4 3
Boston 3 2 4 2
San Francisco 4 4 5 5
Los Angeles 5 4 5 4
Chicago 1 1 2 3
Washington 3 3 3 1
New York 2 2 2 1
Table 18: Affirmative Action Grid
If affirmative action (or even differences in original
hiring criteria) does not have a demonstrable effect on women lawyers’ partnership prospects, then what is the appropriate solution? Scholarly commentary addressing the issue continually returns to an increased emphasis on work/life balance and overall quality of life.72 Additionally, part-time
72. E.g., Allen, supra note 47, at 38 (“Quality of life is an issue coming up more
frequently, . . . .”) (quoting Gerry Malone, of Hildebrandt, a law-firm
management consulting company); id. at 35 (flex-time and parental leave are
some of the policies that have drawn women to small firms); Kaye & Reddy, supra

2015] GENDER DIVERSITY AND DISPARITY 1247
arrangements, depending on the culture and policy of a specific firm, still constitute an area where significant progress remains possible.73 While flextime programs74 or private arrangements75 are more commonplace, working officially as a part-time attorney carries a substantially negative stigma.76 At the macro level, firm initiatives77 and firm structuring78 are potential avenues to help eradicate the disparity. Finally, gradual improvement should be expected as the progress already made should lead to further progress through increased mentoring possibilities, increased ability to generate clientele, and modification of firm policies.79 As expected, this Study found a significant correlation between percentage of partners who were female and percentage of associates who were female. The theoretical underpinning of this trickle-down effect in this situation is commonly ascribed to Rosabeth Moss Kanter.80 Under this view, the sheer existence of the high relative magnitude of female participation in the law firm would allow for better
note 43, at 1943 (stating that firms today are more amenable to adjusting for
associates with young children and are more open to hiring attorneys who have
previously taken time off for family); id. at 1952 (stating that work/life balance
has become a gender-neutral issue).
73. See Kaye & Reddy, supra note 43, at 1951 (“[S]urprisingly low percentages
of women attorneys take advantage of part-time or flextime programs . . . .”);
NAWL, supra note 44, at 13 (stating that 1 in 8 women works part-time).
74. Kaye & Reddy, supra note 43, at 1960-61 (stating that many lawyers,
officially or unofficially, practice flex-time on a daily basis).
75. See Kaye, supra note 58, at 123 (“[D]epending on the specialty, all sorts of
private arrangements are in progress . . . .”).
76. See Kaye & Reddy, supra note 43, at 1958-59 (stating that opting for part-
time or flex-time programs can be a “professional kiss of death,” can lead to
“newfound skepticism about their, [lawyers who opt], level of commitment,” and
can produce “schedule creep”—the phenomenon where part-time lawyers are
overworked, defeating the purpose of part-time).
77. See, e.g., id. at 1965 (firms setting benchmarks for hiring and promoted
female attorneys).
78. See id. at 1966-71.
79. See Ziewacz, supra note 28, at 990-97 (listing three possible solutions: (1)
change in attitude, (2) mentoring relationships, and (3) learning the art of the
“rain-dance”).
80. See, e.g., Chambliss & Uggen, supra note 41, at 41-43.
1248 BUFFALO LAW REVIEW [Vol. 63
professional connections,81 more tolerance of women’s issues,82 less sub-conscious discrimination,83 and might even mitigate disadvantages earlier in a female lawyer’s development.84 Yet, statistical support for Kanter’s proposition is mixed85 and there may even be some unintended negative consequences.86
F. Gender over Time
Over the last sixty years, gender diversity in law schools and large law firms has changed dramatically. The proportions of female law students consistently increased over time from a national average of 3% female students in 1950 to a national average of 46% female students in 2014.
Table 19 provides historical data for law firms, divided into ten-year periods. This information clearly shows the progression over the last sixty years in the “big” law firm setting from no female partners at all between 1946 and 1955 to a 10% increase in the twenty years between 1966 and 1985. While the greatest increase in female partners occurred in the mid-1970s to mid-1980s, Table 19 shows that such growth has subsequently continued. In fact, in the late 1990s
81. “I think [partners] like mentoring people who look like them.” Id. at 47
(citing David Segal, For Minority Attorneys, Big Law Firms Prove Trying, WASH.
POST, Jan. 16, 1998, at A11 (quoting Helen Ho)).
82. ROSABETH MOSS KANTER, MEN AND WOMEN OF THE CORPORATION 283 (1977).
83. See, e.g., Gorman & Kmec, supra note 46, at 1432-33 (listing three principal
mechanisms: (1) gender as an indicator of competence, (2) identifying the desired
traits as masculine traits, and (3) simple in-group favoritism). Gorman and Kmec
explain why these factors increase as women move up the ladder, a phenomenon
they call the “increased disadvantage model.” See also Gorman, supra note 28, at
868-70 (providing an in-depth review of promotion decision and psychological
factors that influence them).
84. There are a variety of hoops to jump through to become a big-law partner.
If women are slightly disadvantaged at each step, then the result is a huge
disparity at the end. See Gorman, supra note 28, at 868.
85. See Chambliss & Uggen, supra note 41, at 43. Chambliss and Uggen’s own
data lends modest support to Kanter’s ideas. Id. at 57-58.
86. An attempt to achieve “relative numbers” must start somewhere. There is
evidence that early, “token” hires suffer significant disadvantages in the
workplace. Id. at 42-44.

2015] GENDER DIVERSITY AND DISPARITY 1249
through the early 2000s the number of male partners and the number of total partners both decreased, but the number of female partners increased.87
Year
Range
Female
Partners
Male
Partners
Total
Partners
Percentage of
Female Partners
2005–present 224 638 862 25.99%
1996–2005 2974 7316 10,290 28.90%
1986–1995 2230 8112 10,342 21.56%
1976–1985 1250 6887 8137 15.36%
1966–1975 126 2465 2591 4.86%
1956–1965 3 243 246 1.22%
1946–1955 0 39 39 0.00%
Totals 6807 25,700 32,507 20.94% (avg.)
Table 19: Historical Gender Diversity in Law Firms Table 20 depicts the percentage of partners who are
female in each of the ten most profitable (left side) and least profitable (right side) significant legal markets.88 The table demonstrates that there is a slight tendency for women to be practicing in lower profit areas. New York City, the king of the legal market, has a rather low female partnership percentage and drives much of the data exploring the low levels of female partnership.
87. This might suggest that women who do get promoted to partner at big-law
firms, get promoted at an earlier age than their male counterparts.
88. See An Empirical Analysis, supra note 5, at 656-57 tbl.22.

1250 BUFFALO LAW REVIEW [Vol. 63
City
Percentage
of Partners-
Female
City
Percentage
of Partners-
Female
New York City 18.2 Cincinnati 15.4
Palo Alto 21.2 Omaha 31.7
San Francisco 26.2 Kansas City 21.5
Washington,
D.C. 19.8 Cherry Hill 25.0
Los Angeles 24.4 Columbus 19.3
Boston 22.3 Jackson 14.0
Chicago 22.3 Saint Louis 22.0
San Diego 19.8 Nashville 24.3
McLean 15.7 Memphis 22.9
Houston 18.4 Cleveland 21.3
Median 20.5 Median 21.7
Table 20: Most and Least Profitable Cities, Compared
Table 21 lists each multi-office firm in the Study and the difference between the female partnership level in their main office and the firm as a whole.89 The table emphatically demonstrates that it is not more likely for a woman to become a partner in a secondary big law office than a firm’s primary office. Slightly more than half the offices have a higher percentage of female partners in their main office. Additionally, the percentage of female partners in primary and secondary offices is equal to the nearest tenth of a percent. This information is surprising given, that many times, the main office is more profitable or exercises more control over firm operations.
89. And the firm as a whole, not the rest of the firm.

2015] GENDER DIVERSITY AND DISPARITY 1251
Akerman 7.0
Akin Gump -1.3
Alston Bird 1.8
Arnold Porter -1.7
Baker Botts 2.7
Baker Donelson 1.1
Baker Hostetler 2.6
Baker McKenzie -3.4
Ballard Spahr -2.4
Barnes Thornburg -1.3
Bingham McCutchen 1.7
Blank Rome -2.4
Boies Schiller -12.3
Bracewell Giuliani -2.1
Bryan Cave 2.2
Cadwalader -2.2
Cahill -1.2
Cleary Gottlieb -0.1
Cooley 4.0
Covington Burling 0.6
Cozen O’Connor -6.0
Crowell Moring -0.1
Davis Polk -0.6
Davis Wright -2.9
Debevoise Plimpton 1.3
Dechert -4.0
Denton -7.4
DLA Piper -3.7
Dorsey Whitney 5.4
Drinker Biddle 0.5
Duane Morris 3.2
Edward Wildman 2.3
Faegre -1.6
Finnegan 2.2
Fish Richardson -1.0
Foley Lardner 1.0
Fox Rothschild -2.8
Fragomen 15.9
Fried Frank 2.6
Gibson Dunn 0.2
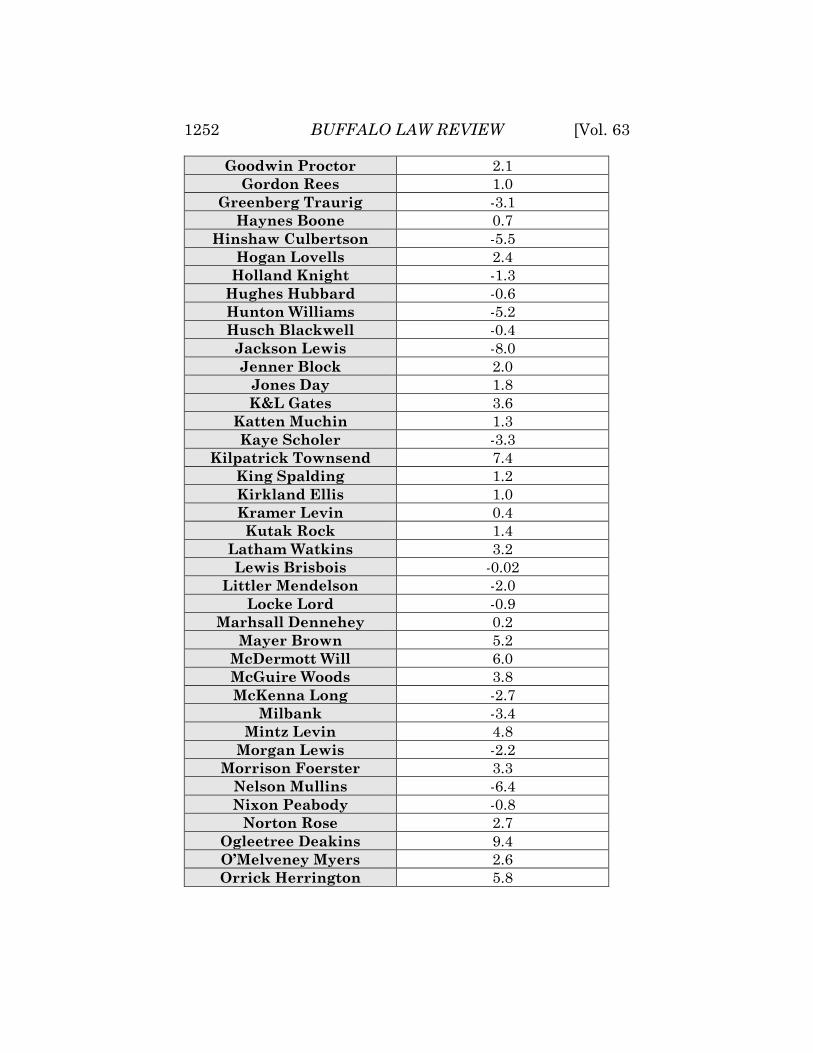
1252 BUFFALO LAW REVIEW [Vol. 63
Goodwin Proctor 2.1
Gordon Rees 1.0
Greenberg Traurig -3.1
Haynes Boone 0.7
Hinshaw Culbertson -5.5
Hogan Lovells 2.4
Holland Knight -1.3
Hughes Hubbard -0.6
Hunton Williams -5.2
Husch Blackwell -0.4
Jackson Lewis -8.0
Jenner Block 2.0
Jones Day 1.8
K&L Gates 3.6
Katten Muchin 1.3
Kaye Scholer -3.3
Kilpatrick Townsend 7.4
King Spalding 1.2
Kirkland Ellis 1.0
Kramer Levin 0.4
Kutak Rock 1.4
Latham Watkins 3.2
Lewis Brisbois -0.02
Littler Mendelson -2.0
Locke Lord -0.9
Marhsall Dennehey 0.2
Mayer Brown 5.2
McDermott Will 6.0
McGuire Woods 3.8
McKenna Long -2.7
Milbank -3.4
Mintz Levin 4.8
Morgan Lewis -2.2
Morrison Foerster 3.3
Nelson Mullins -6.4
Nixon Peabody -0.8
Norton Rose 2.7
Ogleetree Deakins 9.4
O’Melveney Myers 2.6
Orrick Herrington 5.8
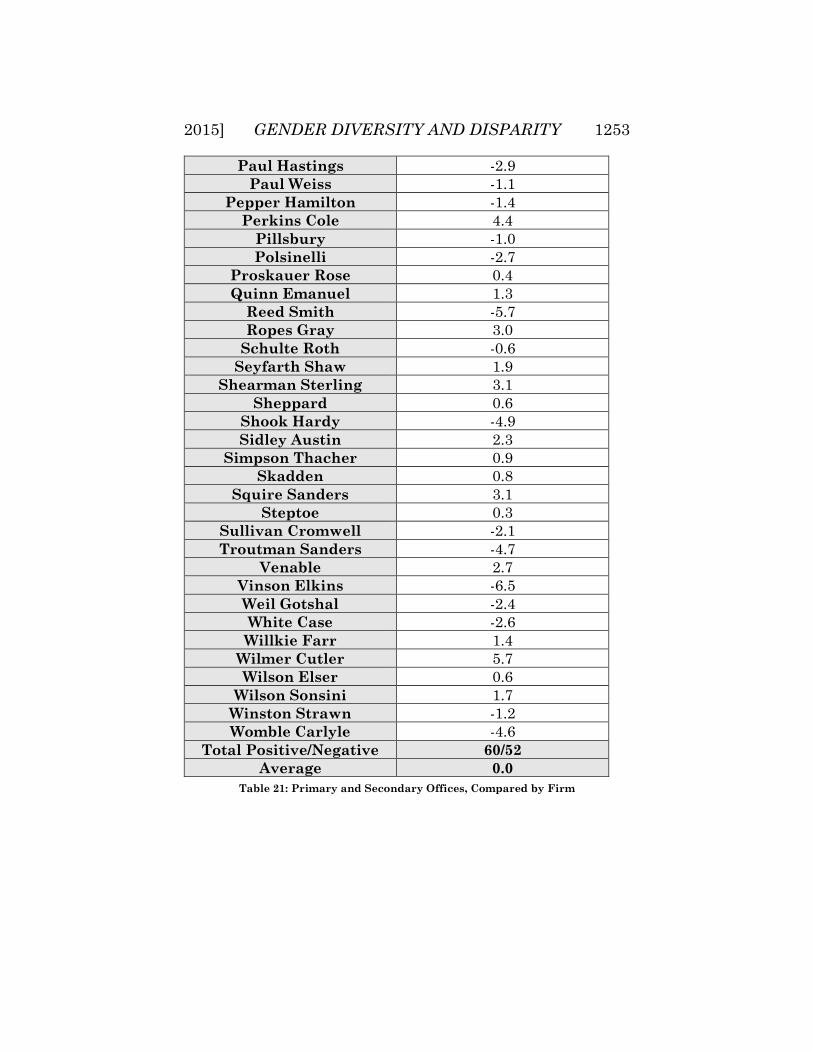
2015] GENDER DIVERSITY AND DISPARITY 1253
Paul Hastings -2.9
Paul Weiss -1.1
Pepper Hamilton -1.4
Perkins Cole 4.4
Pillsbury -1.0
Polsinelli -2.7
Proskauer Rose 0.4
Quinn Emanuel 1.3
Reed Smith -5.7
Ropes Gray 3.0
Schulte Roth -0.6
Seyfarth Shaw 1.9
Shearman Sterling 3.1
Sheppard 0.6
Shook Hardy -4.9
Sidley Austin 2.3
Simpson Thacher 0.9
Skadden 0.8
Squire Sanders 3.1
Steptoe 0.3
Sullivan Cromwell -2.1
Troutman Sanders -4.7
Venable 2.7
Vinson Elkins -6.5
Weil Gotshal -2.4
White Case -2.6
Willkie Farr 1.4
Wilmer Cutler 5.7
Wilson Elser 0.6
Wilson Sonsini 1.7
Winston Strawn -1.2
Womble Carlyle -4.6
Total Positive/Negative 60/52
Average 0.0
Table 21: Primary and Secondary Offices, Compared by Firm
1254 BUFFALO LAW REVIEW [Vol. 63
CONCLUSION
A generation ago, the ABA lamented that it appeared that bias against women still existed, that they were not rising to positions of power, and that it was not clear whether their entry into the profession would earn them comparable influence.90 For those who are truly concerned with eradicating the gender disparity, the progress that has been made is very promising.91 Whenever reading any quantitative data describing associate and partnership levels for women, remember that within the same position, there are inevitably different levels of participation.92 In the end though, this is not a science. We are not putting a man on the moon: we are attempting to improve a complicated sphere of human interaction. But we can be proud of the progress that has been made, despite the disturbing anomalies that become media talking points.
ANNEX
See Part I for more information about how data was obtained and how it is used. The term “partner” refers to those people designated as such by the law firm website. If the firm does not use the designation partner, other designations such as “shareholder” or “member” were used instead.
For all Figures and Tables, “Law School Attended” refers to the law school that a partner received a J.D. from, unless that school was a foreign school, and the lawyer received an LL.M. from an American law school, in which case the American school and corresponding graduation date were listed.
90. See Kaye, supra note 58, at 119 (citing ABA Report: Women in Law Face
Overt, Subtle Barriers, N.Y.L.J., Aug. 19, 1988, at 1); see also Ziewacz, supra note
28, at 989-90.
91. Others have found gains similar to those described in this Article. See, e.g.,
N.Y.C. BAR ASS’N, 2006 DIVERSITY BENCHMARKING STUDY: A REPORT TO SIGNATORY
LAW FIRMS 5 (2006), http://www.abcny.org/Diversity/FirmBenchmarking06.pdf.
92. See generally Simon & Matarese, supra note 29, at 7 (stating that survey
respondents did not believe there was any difference in partnership prospects
between genders, but there was a major difference in potential for management).
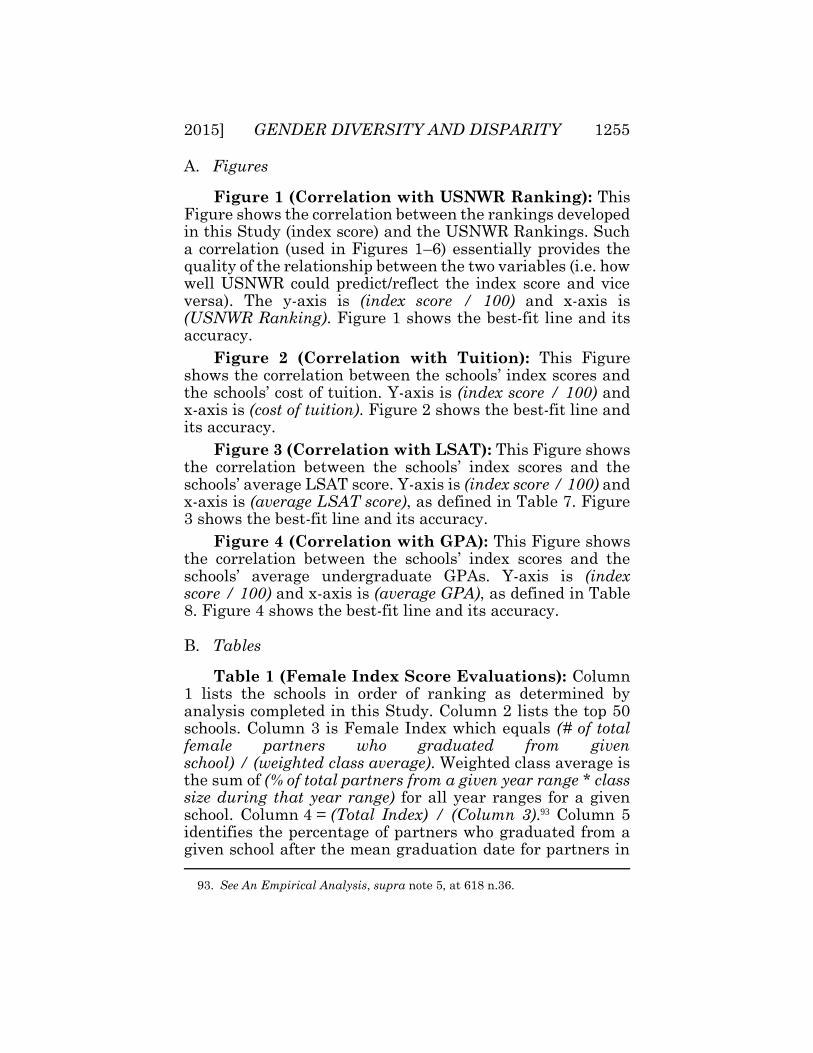
2015] GENDER DIVERSITY AND DISPARITY 1255
A. Figures
Figure 1 (Correlation with USNWR Ranking): This Figure shows the correlation between the rankings developed in this Study (index score) and the USNWR Rankings. Such a correlation (used in Figures 1–6) essentially provides the quality of the relationship between the two variables (i.e. how well USNWR could predict/reflect the index score and vice versa). The y-axis is (index score / 100) and x-axis is (USNWR Ranking). Figure 1 shows the best-fit line and its accuracy.
Figure 2 (Correlation with Tuition): This Figure shows the correlation between the schools’ index scores and the schools’ cost of tuition. Y-axis is (index score / 100) and x-axis is (cost of tuition). Figure 2 shows the best-fit line and its accuracy.
Figure 3 (Correlation with LSAT): This Figure shows the correlation between the schools’ index scores and the schools’ average LSAT score. Y-axis is (index score / 100) and x-axis is (average LSAT score), as defined in Table 7. Figure 3 shows the best-fit line and its accuracy.
Figure 4 (Correlation with GPA): This Figure shows the correlation between the schools’ index scores and the schools’ average undergraduate GPAs. Y-axis is (index score / 100) and x-axis is (average GPA), as defined in Table 8. Figure 4 shows the best-fit line and its accuracy.
B. Tables
Table 1 (Female Index Score Evaluations): Column 1 lists the schools in order of ranking as determined by analysis completed in this Study. Column 2 lists the top 50 schools. Column 3 is Female Index which equals (# of total female partners who graduated from given school) / (weighted class average). Weighted class average is the sum of (% of total partners from a given year range * class size during that year range) for all year ranges for a given school. Column 4 = (Total Index) / (Column 3).93 Column 5 identifies the percentage of partners who graduated from a given school after the mean graduation date for partners in
93. See An Empirical Analysis, supra note 5, at 618 n.36.
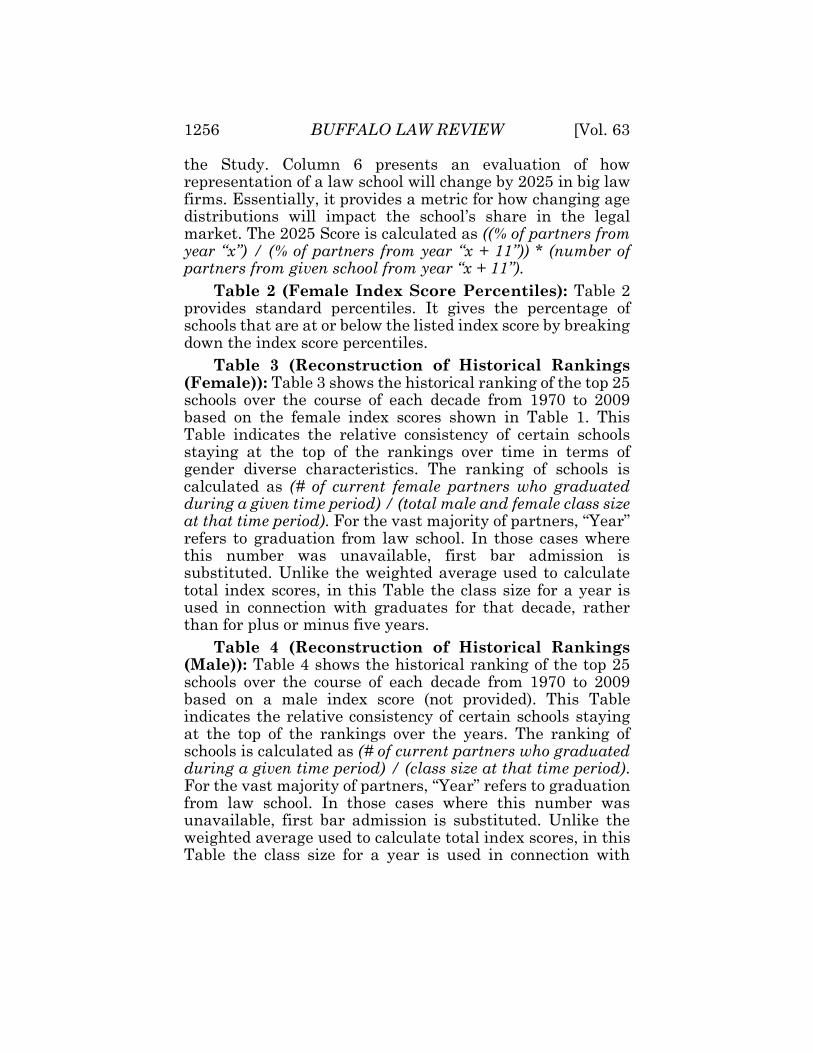
1256 BUFFALO LAW REVIEW [Vol. 63
the Study. Column 6 presents an evaluation of how representation of a law school will change by 2025 in big law firms. Essentially, it provides a metric for how changing age distributions will impact the school’s share in the legal market. The 2025 Score is calculated as ((% of partners from year “x”) / (% of partners from year “x + 11”)) * (number of partners from given school from year “x + 11”).
Table 2 (Female Index Score Percentiles): Table 2 provides standard percentiles. It gives the percentage of schools that are at or below the listed index score by breaking down the index score percentiles.
Table 3 (Reconstruction of Historical Rankings (Female)): Table 3 shows the historical ranking of the top 25 schools over the course of each decade from 1970 to 2009 based on the female index scores shown in Table 1. This Table indicates the relative consistency of certain schools staying at the top of the rankings over time in terms of gender diverse characteristics. The ranking of schools is calculated as (# of current female partners who graduated during a given time period) / (total male and female class size at that time period). For the vast majority of partners, “Year” refers to graduation from law school. In those cases where this number was unavailable, first bar admission is substituted. Unlike the weighted average used to calculate total index scores, in this Table the class size for a year is used in connection with graduates for that decade, rather than for plus or minus five years.
Table 4 (Reconstruction of Historical Rankings (Male)): Table 4 shows the historical ranking of the top 25 schools over the course of each decade from 1970 to 2009 based on a male index score (not provided). This Table indicates the relative consistency of certain schools staying at the top of the rankings over the years. The ranking of schools is calculated as (# of current partners who graduated during a given time period) / (class size at that time period). For the vast majority of partners, “Year” refers to graduation from law school. In those cases where this number was unavailable, first bar admission is substituted. Unlike the weighted average used to calculate total index scores, in this Table the class size for a year is used in connection with
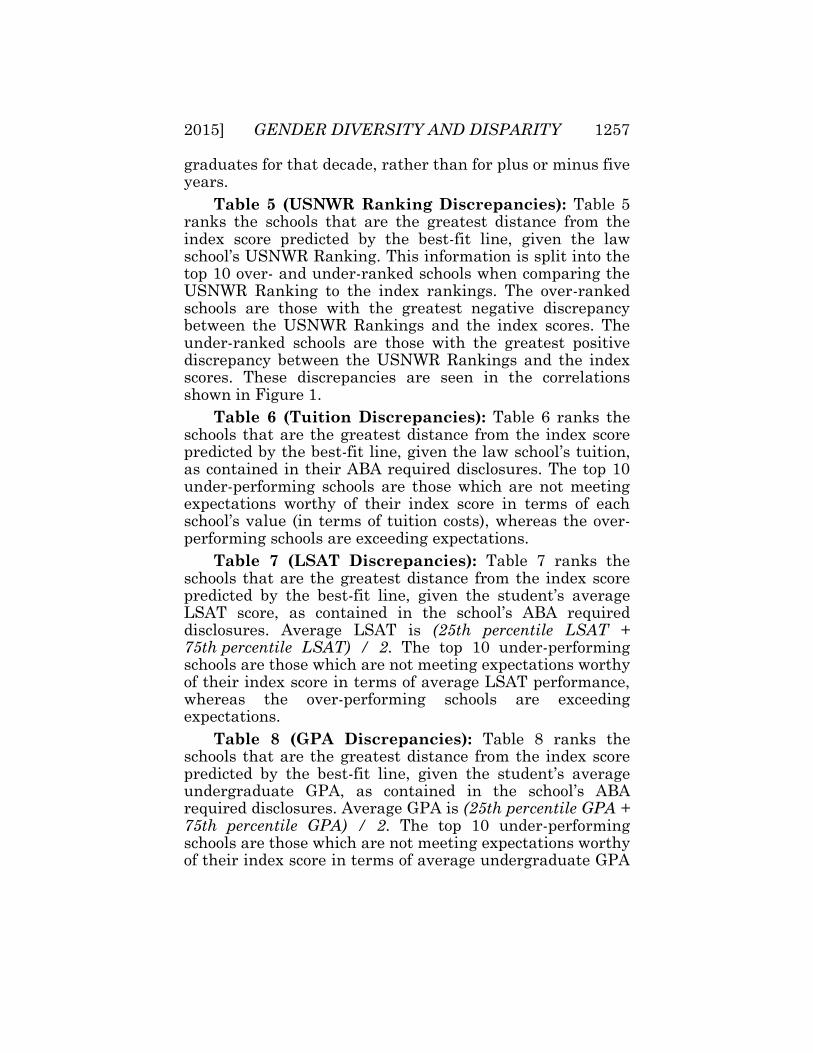
2015] GENDER DIVERSITY AND DISPARITY 1257
graduates for that decade, rather than for plus or minus five years.
Table 5 (USNWR Ranking Discrepancies): Table 5 ranks the schools that are the greatest distance from the index score predicted by the best-fit line, given the law school’s USNWR Ranking. This information is split into the top 10 over- and under-ranked schools when comparing the USNWR Ranking to the index rankings. The over-ranked schools are those with the greatest negative discrepancy between the USNWR Rankings and the index scores. The under-ranked schools are those with the greatest positive discrepancy between the USNWR Rankings and the index scores. These discrepancies are seen in the correlations shown in Figure 1.
Table 6 (Tuition Discrepancies): Table 6 ranks the schools that are the greatest distance from the index score predicted by the best-fit line, given the law school’s tuition, as contained in their ABA required disclosures. The top 10 under-performing schools are those which are not meeting expectations worthy of their index score in terms of each school’s value (in terms of tuition costs), whereas the over-performing schools are exceeding expectations.
Table 7 (LSAT Discrepancies): Table 7 ranks the schools that are the greatest distance from the index score predicted by the best-fit line, given the student’s average LSAT score, as contained in the school’s ABA required disclosures. Average LSAT is (25th percentile LSAT + 75th percentile LSAT) / 2. The top 10 under-performing schools are those which are not meeting expectations worthy of their index score in terms of average LSAT performance, whereas the over-performing schools are exceeding expectations.
Table 8 (GPA Discrepancies): Table 8 ranks the schools that are the greatest distance from the index score predicted by the best-fit line, given the student’s average undergraduate GPA, as contained in the school’s ABA required disclosures. Average GPA is (25th percentile GPA + 75th percentile GPA) / 2. The top 10 under-performing schools are those which are not meeting expectations worthy of their index score in terms of average undergraduate GPA
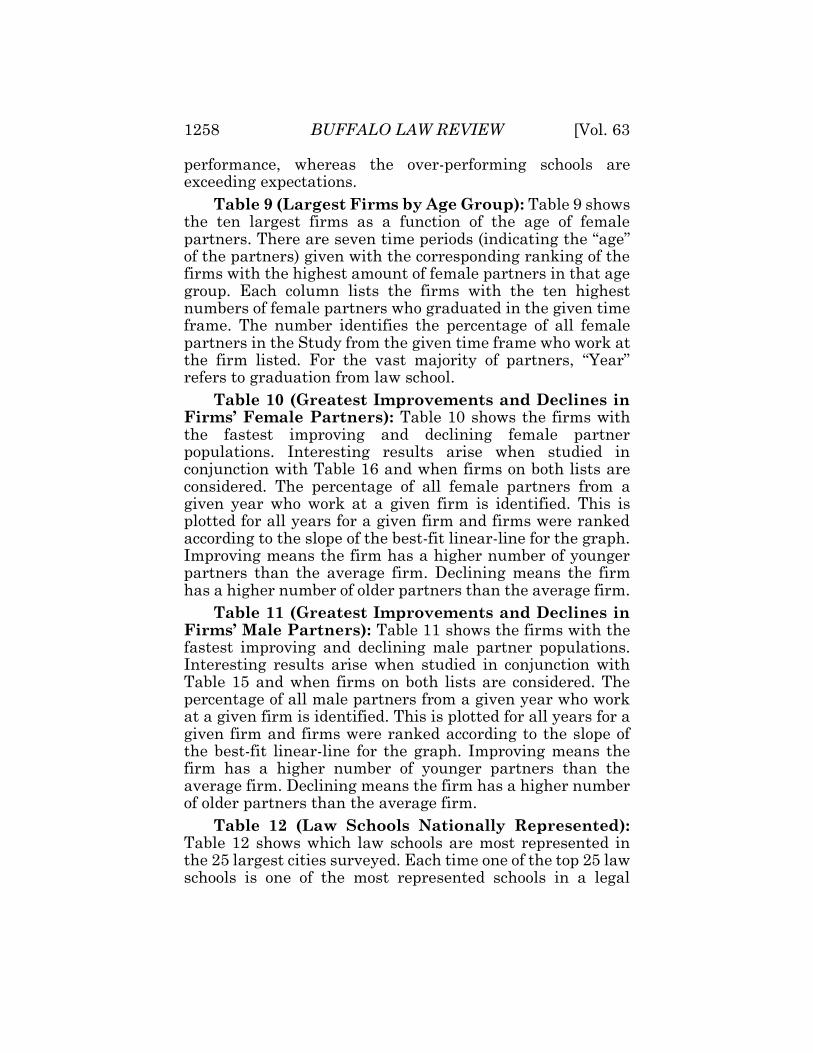
1258 BUFFALO LAW REVIEW [Vol. 63
performance, whereas the over-performing schools are exceeding expectations.
Table 9 (Largest Firms by Age Group): Table 9 shows the ten largest firms as a function of the age of female partners. There are seven time periods (indicating the “age” of the partners) given with the corresponding ranking of the firms with the highest amount of female partners in that age group. Each column lists the firms with the ten highest numbers of female partners who graduated in the given time frame. The number identifies the percentage of all female partners in the Study from the given time frame who work at the firm listed. For the vast majority of partners, “Year” refers to graduation from law school.
Table 10 (Greatest Improvements and Declines in Firms’ Female Partners): Table 10 shows the firms with the fastest improving and declining female partner populations. Interesting results arise when studied in conjunction with Table 16 and when firms on both lists are considered. The percentage of all female partners from a given year who work at a given firm is identified. This is plotted for all years for a given firm and firms were ranked according to the slope of the best-fit linear-line for the graph. Improving means the firm has a higher number of younger partners than the average firm. Declining means the firm has a higher number of older partners than the average firm.
Table 11 (Greatest Improvements and Declines in Firms’ Male Partners): Table 11 shows the firms with the fastest improving and declining male partner populations. Interesting results arise when studied in conjunction with Table 15 and when firms on both lists are considered. The percentage of all male partners from a given year who work at a given firm is identified. This is plotted for all years for a given firm and firms were ranked according to the slope of the best-fit linear-line for the graph. Improving means the firm has a higher number of younger partners than the average firm. Declining means the firm has a higher number of older partners than the average firm.
Table 12 (Law Schools Nationally Represented): Table 12 shows which law schools are most represented in the 25 largest cities surveyed. Each time one of the top 25 law schools is one of the most represented schools in a legal

2015] GENDER DIVERSITY AND DISPARITY 1259
market (in terms of female partners), points were awarded. If a school was first in a legal market (i.e. city), it was awarded 10 points; 9 points for second; and down to 1 point for tenth. Thus, the score is a culmination of how well represented the listed schools are across the country in terms of female partners.
Table 13 (Female Partnership Rates by City over Time): Table 13 lists the 25 largest legal markets (in terms of large law firm populations) and breaks down female partner representation by time period. For a given city and a given time period, this Table identifies the percentage of partners that are female. For the vast majority of partners, “Year” refers to graduation from law school. In those cases where this number was unavailable, first bar admission is substituted. In order to be listed at a certain location in the Study, a partner needed to have a distinct phone number for each location, and, if the locations were in different jurisdictions, bar membership in both locations.
Table 14 (Gender Pedigree and Origin Comparison Across Locations): Column 1 lists the 25 largest legal markets (in ascending order) by number of big-law partners. The other columns list the percentage of partners of the given gender who went to a law school meeting the stated criteria. The ranking refers to the USNWR law school ranking published in 2014. Entries are bolded when there is a significant disparity between the two genders. Footnotes detail when the largest supplier of female partners differs from the largest supplier of male partners.
Table 15 (Gender Pedigree and Origin Comparison, over Time): Column 1 lists decades. The other columns list the percentage of partners of the given gender who went to a law school meeting the stated criteria. The ranking refers to the USNWR law school ranking published in 2014. Entries are bolded when there is a significant disparity between the two genders.
Table 16 (Importance of Law School Attended, by Gender, over Time): Column 1 lists decades. The other columns list the amount more likely a person who attended a law school ranked within the given range is a big-law partner than the average law school graduate of their gender. For instance, if the average female law student in a given decade

1260 BUFFALO LAW REVIEW [Vol. 63
had a 2% chance of becoming a big-law partner, and the average female law student who attended a top 10 law school had a 5% chance of becoming a big-law partner, then the multiplier is 5/2, or 2.5.
Table 17 (Recent Developments in Gender Pedigree Comparison): Column 1 lists the 25 largest legal markets (in ascending order) by number of big-law partners. Columns 2 and 3 list the percentage of big-law partners, graduating in the given time frame, who attended a top-14 school (USNWR 2014 rankings), for each gender. Columns 4–7 list the percentage of big-law partners, graduating in the given time frame, who are female. Column 4 includes all big-law partners, regardless of graduation year. In Columns 2 and 3, entries are bolded when there is a significant disparity between genders.
Table 18 (Affirmative Action Grid): Column 1 lists the 25 largest legal markets (in ascending order) by number of big-law partners. Columns 2–5 break each of the 25 schools into five categories of equal size. Column 2 classifies the difference between (Column 3 and Column 2) in Table 14. A higher total in Table 14 equals a higher score in Table 18. Column 3 classifies the difference between (Column 3 and Column 2) in Table 17. A higher total in Table 17 earns a higher score in Table 18. Columns 4 and 5 are related to Columns 4 and 7 in Table 17, respectively, with a higher number in Table 17 earning a higher score in Table 18.
Table 19 (Historical Gender Diversity in Law Firms): Table 19 provides historical information for female representation in law firms nationally from 1946 to the present. It provides the raw data numbers in terms of both male and female partners and then records the percentage of female partners for each time period, as well as the historical average. Percentage of female partners = (# of female partners) / (# of total partners). Total partners = (# of female partners) + (# of male partners). Data was collected from the database. For the vast majority of partners, “Year” refers to graduation from law school. In those cases where this number was unavailable, first bar admission is substituted.
Table 20 (Most and Least Profitable Cities, Compared): Column 1 lists the most profitable cities (in descending order) and Column 3 lists the least profitable
2015] GENDER DIVERSITY AND DISPARITY 1261
cities (in descending order) according to An Empirical Analysis,94 Columns 2 and 4 list the percentage of female partners in the given locations. The final row lists the median of the ten cities listed above.
Table 21 (Primary and Secondary Offices, Compared by Firm): Column 1 lists the 112 firms in the Study that have multiple offices, in alphabetical order. Column 2 = (percentage of female partners in the main office) – (percentage of female partners in the firm as a whole). “Main Office” refers to the office with the highest amount of total partners. The final two rows state that there are 60 firms with a higher percentage of partners who are female in the main office than in the firm as a whole, whereas 52 have a lower percentage of partners who are female in the main office. The final row shows that the percentage of partners who are female in main offices is equal to the percentage of partners who are female in the entirety of the Study.
94. An Empirical Analysis, supra note 5.