Gender Disparity in Education in Sindh - IRC...
50
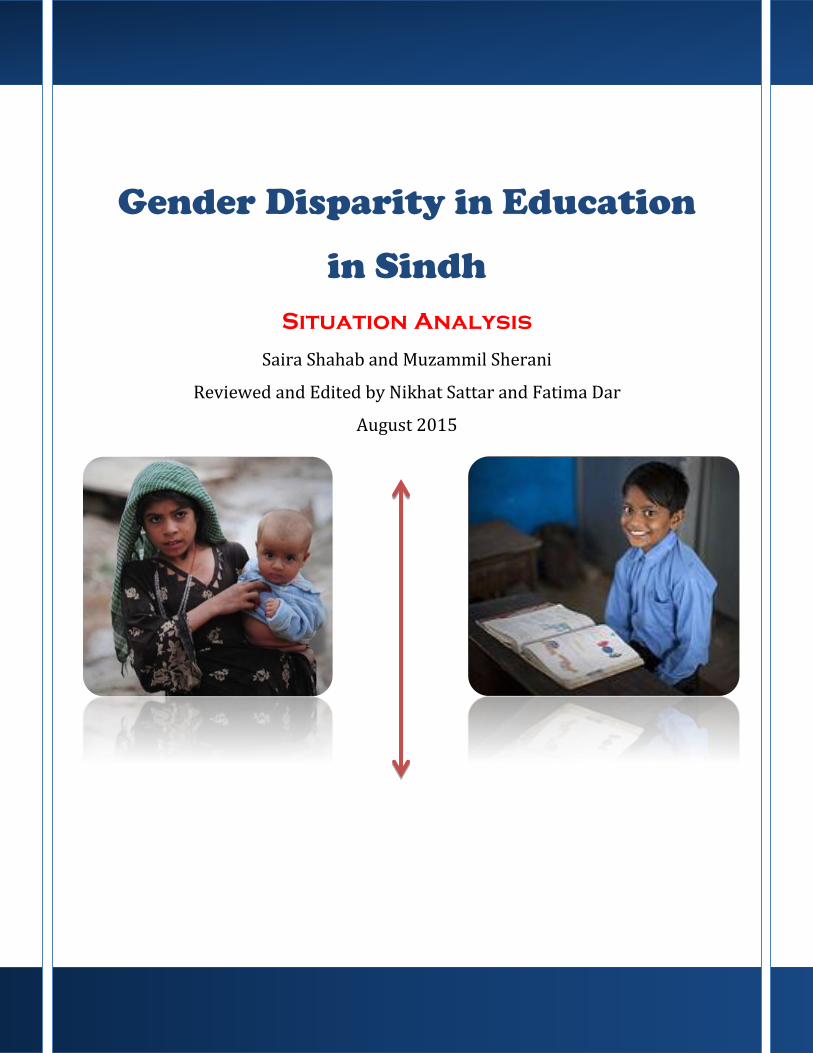
Gender Disparity in Education in Sindh Situation Analysis Saira Shahab and Muzammil Sherani Reviewed and Edited by Nikhat Sattar and Fatima Dar August 2015
Transcript of Gender Disparity in Education in Sindh - IRC...
0
Gender Disparity in Education
in Sindh
Situation Analysis
Saira Shahab and Muzammil Sherani
Reviewed and Edited by Nikhat Sattar and Fatima Dar
August 2015
TABLE OF CONTENTS
1.Introduction ............................................................................................................................................ 0
2. Contextualizing the Problem ................................................................................................................ 1
3.Pakistan’s Educational Dilemma ............................................................................................................ 6
4.-Educational Apathy that strikes Pakistan: A Statistical Overview .................................................. 9
5. Issues Impeding Girl Education ......................................................................................................... 29
6. Budget Allocation for Education ........................................................................................................ 33
7. The Sindh Education Sector Plan (SESP) 2014-2018 ....................................................................... 34
8. Initiatives to Reduce Gender Gap ...................................................................................................... 37
9. Challenges to Thwart the Status Quo ................................................................................................ 39
References ................................................................................................................................................ 41
Acronyms
AEPAM Academy of Education Planning and Development
AJK Azad Jammu Kashmir
AKU-IED Aga Khan University-Institute of Educational Development
ASER Annual Status of Education Report
ATM Automated Teller Machine
CEDAW Convention on Elimination of All Types of Discrimination
Against Women
CPD Continuous Professional Development
EFA Education for All
ESR Education Sector Reforms
FATA Federally Administered Tribal Area
GDP Gross Domestic Product
GEM Gender Equality Measures
GNP Gross National Product
GPI Gender Parity Index
HEC Higher Education Commission
ICPD International Conference on Population and Development
ICT Islamabad Capital Territory

IDA International Development Programme
KPK Khyber PakhtunKhwa
MDG Millennium Development Goal
NAVTEC National Vocational and Technical Education Commission
NEMIS National Education Management Information System
NEP National Education Policy
NER Net Enrollment Rate
NGO Non-Government Organization
NIPS National Institute of Population Studies
NIU National Implementation Unit
NPA National Plan of Action
OOSC Out of School Children
PBM Pakistan Bait-ul-Mal
PEC Pakistan Engineering Council
PMDC Pakistan Medical and Dental Council
PNG Papua New Guinea
PRSP Poverty Reduction Strategy Paper
PSLM Pakistan Social and Living Standards Measurement
RSU Research Support Unit
RTE Right to Education
SERP Sindh Education Reform Programme
SESP Sindh Education Sector Plan
SSA SarvaShikshaAbhivan
TED Teacher Education and Development
UNESCO United Nations Educational, Scientific and Cultural
Organization
UNICEF United Nations Children’s Fund
UPE Universal Primary Education
WFP World Food Program
0
1. Introduction
Female literacy is a critical factor that directly influences a number of development
indicators including national fertility rates, infant mortality, family income and productivity. The
World Bank recognises girls’ education as a single development intervention with the greatest
individual and social returns (Brent, 2005). Girls’ education is not only important as a social
indicator and an engine for economic development leading to a greater level of health, economy,
security, liberty and participation in social and political activity, but can possibly yield higher
rate of return than any other investment available in the developing world (World Bank,
2002).The state of the world’s children report by UNICEF (2003) report indicates that girls’
education leads to more equitable development, stronger families, better services, better child
health and effective participation in governance. Pakistan’s constitution gives the right to all
children between the age group of 5-16 years to get compulsory education. Article 25-A of
theConstitution of Pakistan also vows to provide free and compulsory education to all children of
this age.
Against the backdrop of the status of education as a key economic indicator irrespective
of gender, this paper initiates a discussion on the issue of gender disproportion in education in
Pakistan in general and most particularly in Sindh, provides ideas for possible actions and policy
changes by the government to minimize the concerned gap. The paper looks at the state of
education in the light of the overall state of urban and rural literacy, male and female child
enrollment and dropout rate in Pakistan. It explores district wise literacy levels, enrolment and
dropout rates at the primary and the secondary levels from 2010 onwards. It also presents the
education budgets over the years to show the extent to which the educational policieshave been
transformed into implementation. The paper identifies the main issues preventing access to
qualityeducation and the contextual reasons for the wide gender gap that prevails in the country.
In view of the challenges that Pakistan faces to ensure ‘education for all’, the paper summarises a
few of the main initiatives that have been taken by the government to improve the state of
education.
The study also makes a cross analysis by observing the challenges faced by other
countries with respect to gender discrimination and the measures taken by them to address the
issues of gender disparity.
2. Contextualizing the Problem
The political paradigm shifts in Pakistan over a span of almost 69 yearshave impacted the
educational policies of the country. After the first year of its independence, Pakistan signed the
United Nation’s Universal Declaration of Human Rights and endorsed to Article 26 (1) that
affirmed that everyone hadthe right to education. Education would be free, at least in the
elementary and fundamental stages and that elementary education would be compulsory.(United
Nations Universal Declaration of Human Rights, 1948). Pakistan made commitments to improve
its policies by specifying its focus on illiteracy in 1973’s Constitution, Article 37-B which made
a commitment thatthe state [of Pakistan] wouldreduce illiteracy and provide free and compulsory
secondary education within a minimum possible period.(Constitution of Pakistan, 1973).
2.1 Low female literacy rate prevails in the country. Despite the efforts to promulgate
access to free and compulsory education, the academic situation in the country presents a bleak
picture. Pakistan is in a state of an education emergency and is still struggling with myriad
problems, of which the predicament of the female child remains a grave concern. According to
the United Nations’ Department of Economic and Social Affairs, Population Division (2015), of
the 188 million people in 2015, more than five times than in 1950, 57 per cent women werestill
illiterate, poor and had no access to basic health services. The female literacy rate therefore
stands very low. The Pakistan Economic Survey 2014-15 states that the country’s overall
female literacy rate has come down by one% from 48 percent in 2012-13 to 47 percent in
2013-14. The problem is compounded further when the number and percentiles of out of school
children are analysed. The Pakistan Education Statistics (2013-2014) report says that 6.2 million
children are still out of school, out of which 2.9 million reside in Punjab, 1.8 in Sindh, 0.54
million in Baluchistan and 0.4 million in Khyber Pakhtunkhwa.
2.2 Factors that lead to dropout rates Among Girls. The struggle for the right of
education for women has been a part of the subcontinent since the nineteenth century when
Muslim reformers put in great effort to introduce female education. However progress was slow.
By 1921 only four out of every 1,000 Muslim females were literate.1
The Pakistan Standards of Living Measurement survey report 2014 looks at the causes of
dropout rates in schools. The most common reason highlighted for dropout rates is that 56% boys
and 33 percent girls are not willing to attend school. 21percent of girls are not allowed by their
parents. Nine percent of boys in Pakistan are not sent to school because they are needed at home
compared to 12.1 percent girls, the highest number for this lies in KPK where 23 percent boys
and 10 percent girls are not sent to school because it disrupts time for housework. These figures
vary between provinces, as for example, a higher figure for girls is observed in Sindh where girls
are required to look after their small siblings and work in the fields.
Among many other issues that create hurdles for girls to acquire education, socio-
economic issues are the most significant. Preference is given to boys from the onset of birth. The
act of not providing education to girls based on economic reasons largely arises from the social
discrimination towards the female gender. According to a study conducted in two villages of
Faisalabad, 91% of the respondents had a favorable attitude towards sending males to schools
(Sandhu, Chaudhary, Akbar & Ahmad (2005). It has also been observed that the level of
education of the family has an impact on the family’s decision to send girls to school, as implied
by Sandhuet. al, (2005)
As stated by Jalal-ud-Din and Khan (2008) in their paper based on a study conducted in
the Mardan district, gender disparity is prevalent in every aspect of a girl child’s life from
provision of food, to access to health and admission to school. Hence the emergence of
preference for boys, especially when low income is a major factor in decision-making. Girls are
not sent to school as it is believed that any education she receives will not benefit the family
because girls are not considered permanent members of the family. When the financial position
of a family is weak, girls are required to stay at home rather than the boys (Jalal-ud-Din & Khan,
2008).
The overall cultural and social structure of the Pakistani society discourages women
fromobtaining education. It is a barrier that the women are still trying to overcome, as socially
women are considered the weaker and subordinated sex.
2.3. Gender Discrimination and the international World.The world has endorsed
literacy on equal bases for men and women for the individual and collective wellbeing. The
International Conference on Population and Development (ICPD, 1994 to ICPD, 2014) took up
gender parity as a prime area of concern. It says that it is essential to revisit education policies
and curricula to ensure that textbook content has balanced gender representation. By eliminating
gender disparity from educational materials that enforce inequality between men and women in
the form of sex-stereotyping in primary and secondary education, changes in societal attitudes
and improved girl enrolment could be anticipated. Likewise, there are other international forums
where gender equality has been addressed. The Convention on Elimination of all types of
Discrimination against Women (CEDAW, 1979), the Copenhagen Declaration (1995), the
Millennium Goals (2000) and the Sustainable Development Goals (2015) have worked over a
period of time and established concrete action programmes to integrate gender equity in
education to help in empowerment of women for social justice and socio-economic
transformation.
Despite the concerted efforts of international commitments to promote female literacy
and emancipation for women, the situation presents a grim scenario. Women are often deprived
of having equal rights to live a life that is based on justice. An estimate made by UNESCO
Institute of Statistics (2006) shows that, of the 781 million uneducated people in the world, only
36 percent are men and 64 percent are women.
Education and gender disparity has been seen in different perspectives, as in countries
such as Papua New Guinea (PNG). Johnson (1993) reflects in his research how people of Papua
New Guinea dismiss gender as a source of inequality. According to his findings, people in PNG
take educational opportunities as the prime factor for gaining wealth and political empowerment.
He says that rural women, because of their illiteracy, are considered to be a disadvantaged group
and have fewer opportunities for education. In turn, they are unable to enjoy high incomes or
positions in the political office. Economic prosperity is thus deeply conjoined with literacy skill
development.
Another study by Filmer (2005) sheds light upon the regions of South Asia and North,
Western and Central Africa. These have large female populations that have been deprived of
education. Inequalities have been found in female enrollment and attainment, whereas male
children have been given preference for primary and secondary education. The significant fact of
this study is that, at one end, the study finds gender inequality in these countries and, on the other
hand, large wealth gaps are found in the same regions. This demonstrates that, when a large
proportion of the population has been deprived of acquiring knowledge and building their
capacities in every aspect of life, it results in inequitable wealth distribution and economic
instability.
There are countries where gender disparity is deep rooted, but over a period of time, this
gap has been reduced due to better governance and improved government policies and
amendments in law. Kenya is a significant example that has a history of gender disparity in its
culture, from ancient times to the recent past. Kenya had deprived women of their basic right of
inheritance before the 1972 Law of Succession became the part of their constitution. (Ackers,
Migoli&Nzomo, 2001) Gender disparities in Kenya resulted in denial of access to education for
girls, with roles confined to domestic work and early marriages. From 1943-1963, girl’s
enrollment was only 25 percent of all children enrolled. According to a UNICEF study, girls’
enrollment has significantly increased as of 2012, although gender disparity still exists in various
parts of Kenya.
Probing the factors involved at domestic level that hamper girls’ education and nurtures
gender disparity, Rahji (2005) examines school enrollment and gender inequality of rural
household children at primary level in South Western Nigeria. The findings of the study show
that male enrollment is significantly higher than female enrollment. A gender gap of 12.56
percent in favour of male enrollment is recorded. The gender gap indicates how families perceive
incentives they may get as a result of education. The inclination of families in favor of educating
the male child rests on the economic prosperity that an educated male child can bring to the
family. Another interesting factor that is derived from the study is the correlation between boys’
enrollment and their fathers’ literacy. Most enrolled male students support literate fathers who
understand the significance of education for their boys, but the same understanding does not
work for their female children. The study recommends incentives in the form of subsidized fee
structure, free tuition and improved public subsidies for the encouragement of higher female
enrollment rate.
Analysing the invisible factors that hamper women empowerment, Kumar and Gupta
(2008) attribute gender disparity in education to the result of “mental blocks” that limit the role
of women to only traditional boundaries, domestic duties and family care. Even the girls who
make their way to schools are bound to have limited choices to select from a vast variety of
subjects and skills. Due to this typical mind set, girls are generally limited to subjects of social
sciences, humanities, home sciences and languages, whereas mathematics, physics, chemistry,
biology, business studies are subjects that are considered to be beyond their acumen. Along with
all the significant measures that have to be taken in order to bring girls back to school, it is
important to work on removing the traditional mind sets and mental blocks.
Another factor that is quite persistent in many countries of the world is gender bias in
textbooks (Blumberg, 2008). The study shows that textbooks cover up to 80 percent of the
classroom time and contribute to dropping girls’ achievements, predominantly in developing
countries. Textbooks usually have under-representation of females along with the stereotypes of
male and female occupational and domestic roles. Several case studies from Romania, Syria,
United States, China and India cite gender disparity.However, state level initiatives have been
taken to reduce gender bias in textbooksin Latin America and Sweden. . The study indicates a
partial achievement in this regard as it is found to be quite expensive in altering the textbooks at
a larger scale.
Ifegbesan (2010) investigates the traces of gender-stereotyping in beliefs and perceptions
of 250 secondary teachers. The purpose is to see how gender-stereotyping is integrated in
classroom practices. The results reveal that most teachers overtly or covertly endorse and
practice gender-stereotypes and this is mainly because of lack of professional training for
teachers. It has been suggested that curricula for pre and in-service teacher education must
integrate a component of gender sensitivity in order to bring the required awareness and develop
skills that improve attitudes in classrooms, along with classroom language and teacher-student
interaction.
A country as deeply diverse as India faces gender disparity as its major challenge in
education. According to Desai (2007), the Indian government has made female education its
priority by introducing a programme,‘SarvaShikshaAbhivan(SSA) or ‘Education for All’. SSA
places distinct emphasis on female education and has devised a programme in two categories: the
first is to create ‘Pull Factors’ by increasing access and enrollment rate and retention of female
students in schools, while the second programmeis to create ‘Push Factors’ that foster in society
the conditions conducive to guarantee girls’ education. Under this programme, several initiatives
have been taken to alter the traditional strategy of only advocating people to send the female
child to school. It has implemented various strategies such as providing free textbooks to female
students and back-to-school bridging courses for older girls who are overage for acquiring initial
literacy skills. The government has extended its repertoire of facilitating girls’ education by
providing ‘Early childhood care centres’ inside the school or closely placed near the schools in
order to free girls from the burden of ‘sibling care responsibilities’. Other programmeshave also
initiated recruitment of at least 50 per cent of female teaching staff, enhancing mothers’ role in
committees and school related activities, , providing free bicycles to female students for safely
commuting between school and home in Haryana, and improved sports and cultural
extracurricular activities within schools and communities. However, despite these steps, India
still struggles to achieve the goal of education for all.
3. Pakistan’s Educational Dilemma
Education in Pakistan has never received much attention from successive governments,
apart from developing policies and plans on paper. The education system in Pakistan has
suffered from copious inadequacies, from a dismal allocation of financial resources required, to
establishing a countrywide network of good schools, to the development of a cadre of teachers
who are committed to their profession. The education sector has been symbolised by poor
infrastructure, unmotivated and incompetent teaching workforce, disinterested student populace
and disenchanted parents. In the vision of Pakistan’s pledge to the Millennium Development
Goal (MDG) of universal primary education, its foremost challenge is gender imbalance, along
with the resulting economic and societal constraints that preclude admittance of females to
primary schools. The continuous low educational participation of girls has had an adverse impact
on female empowerment and the quality of life. The slow and low national progress is a result of
educational backwardness that has hampered Pakistan’s human resource development, both at
the individual and national levels. Education leads to empowerment and strengthens the innate
ability to gain knowledge. According to the Global Gender Gap Report, (2006), the overall
improvement in Pakistan’s literacy rate since its existence is 45 percent (56.5 percent male and
32.6 percent females, which is quite low compared with other countries in the region.
Sathar and Lloyd (1994) state that the educational priorities of Pakistan as a nation have
an alarmingly abysmal record. The future looks no better. The study used the Pakistan Integrated
Household Survey (1991) to examine the factors that influences parents’ decisions for enrolling
their children in schools. The findings indicate that a decision for their children’s basic education
depends upon the parents’ education, especially the female parent and the income level of the
father. Thus, if the mother is illiterate, it is unlikely that her daughter will be sent to school- a
situation that continues the downward spiral. The study also refers to priority given to male child
education because of financial constraints. It also found that the female child was deprived of
basic primary education because of the non-availability of “single-sex schools”.
Loyd, Mete and Grant (2009) evaluate factors such as primary school environment,
household scenario, economic and demographic influences upon the dropout rates in primary and
middle schools in rural Khyber Pakhtunkhwa and Punjab. The source is the panel data collected
in 1997 and 2004. The study shows the correlation of dropout rate with the school environment
and teachers’ availability and efficiency, along with the household circumstances including the
influx of unplanned births. The dropout rates amongst girls by the end of primary level remain
high, whereas improvement is seen in boys’ enrollment and retention.
Amongst the reasons outlined by Ismail (1996) for the declining quality of education, the
differences in the number of school constructed and the number of teachers inducted, especially
in the case of Sindh for girls and Punjab for boys remain in the forefront. The study considered
data of annual enrollment and output costs by gender, for each province for the period, 1972-73
to 1990-91. The study also observes that the increase in gender disparity growth rates results in
the decline of the quality of education in the case of female primary education in Sindh and male
primary education in Punjab.
Daraz, Khan and Sheikh (2013) are of the view that women education has been one of the
primary factors of transformation towards progress and development. The study examines the
physical and infrastructural factors that become hindrances for women’s education and results in
gender inequality.
Chauhdary and Rehman (2009) research the impact of gender discrimination in education
on rural poverty in Pakistan. The research determines that gender disparity in education has a far
reaching, highly adverse effect on rural destitution. The empirical findings of the study indicate
that a balanced male-female proportion of earners and education of household members
contributes to decrease in rural poverty. The inverse relationship between gender inequality in
education and rural poverty suggests that education stipulates improved employment
opportunities and helps in reducing poverty in developing countries such as Pakistan.
Jabeen, Chaudharyand Omar (2014) review the extent of gender stereotypes in the
English and Urdu textbooks at primary level in Punjab textbook board. The study evaluates
thepresence of women representationin texts and their role depiction. The findings confirm the
presence of unequal gender representation and perpetuation of stereotypes in the content of
textbooks. Qualitative and quantitative data analysis show the edifice of gender stereotyping
through confining men and women in distinct spheres of life, where women possess lower status
in family, community and society with restricted mobility as compared to men.The language
used in the textbooks is based on stereotypical mindsets.
In the light of the stated issue of gender disparity and unequal role distribution of males
and females in society, the National Education Policy (2009) takes serious notice of the situation
andfocuses on the importance of gender parity. It proposesthe reduction of the disparity gap by
emphasising on equal facilities provided to girls and boys. The NEP (2009) commitsto equal
access to education through provision of basic facilities for girls and boys alike,
underprivileged/marginalized groupsand special children and adults.It also recommendsthe
organisation of a national process for educational development that will reduce disparities across
provinces and areas and support coordination and sharing of experiences.
The policy remains a useful overarching document through which gender parity could be
attained. However, it is significant that, despite this policy, Pakistan is far below any targeted
level of achievement for Universal Primary Education by the year 2015
4.-Educational Apathy in Pakistan: A Statistical Overview
The analysis of the state of education in Pakistan and issues pertaining to gender disparity
is based on data that spans over the last 5 years, i.e. from 2010-2015 and targets public sector
education..
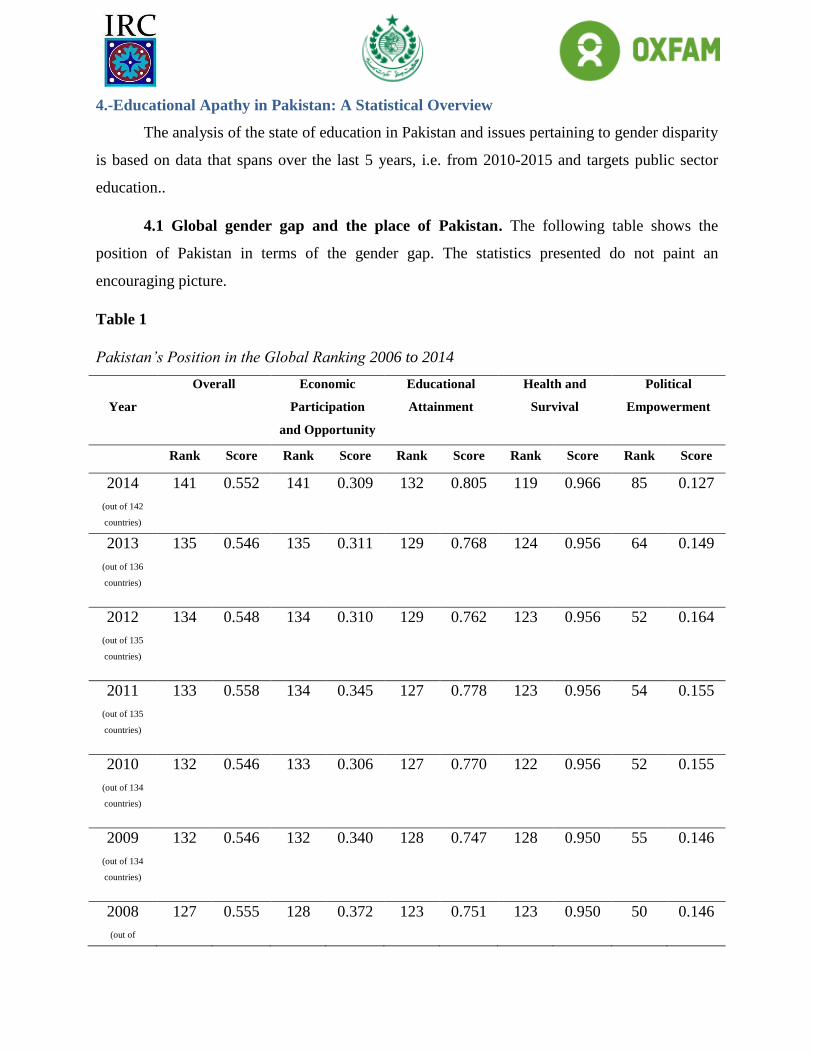
4.1 Global gender gap and the place of Pakistan. The following table shows the
position of Pakistan in terms of the gender gap. The statistics presented do not paint an
encouraging picture.
Table 1
Pakistan’s Position in the Global Ranking 2006 to 2014
Year
Overall Economic
Participation
and Opportunity
Educational
Attainment
Health and
Survival
Political
Empowerment
Rank Score Rank Score Rank Score Rank Score Rank Score
2014
(out of 142
countries)
141 0.552 141 0.309 132 0.805 119 0.966 85 0.127
2013
(out of 136
countries)
135 0.546 135 0.311 129 0.768 124 0.956 64 0.149
2012
(out of 135
countries)
134 0.548 134 0.310 129 0.762 123 0.956 52 0.164
2011
(out of 135
countries)
133 0.558 134 0.345 127 0.778 123 0.956 54 0.155
2010
(out of 134
countries)
132 0.546 133 0.306 127 0.770 122 0.956 52 0.155
2009
(out of 134
countries)
132 0.546 132 0.340 128 0.747 128 0.950 55 0.146
2008
(out of
127 0.555 128 0.372 123 0.751 123 0.950 50 0.146
130countries)
2007
(out of 128
countries)
126 0.551 126 0.372 123 0.734 121 0.950 43 0.148
2006
(out of 115
countries)
112 0.543 112 0.369 110 0.706 112 0.951 37 0.148
Source: The Global Gender Gap Report 2014 (World Economic Forum, 2014)
According to Table 1, Pakistan’s global ranking in terms of its overall performance,
economic participation, educational attainment, health survival and political empowerment, is
not encouraging. In 2014, Pakistan has been placed at the last rank in the regional ranking and
second last in the world ranking. For the overall position, Pakistan and its economic participation
has secured the second last position (141) globally. Only Yemen has been rankedbelow Pakistan.
Furthermore, for its educational attainment, Pakistan’s rank is 132 which signifiesthat Pakistan is
one of the last ten countries in the world that have high gender gaps in their educational
attainment. The health and political empowerment indicators are slightly better as Pakistan
stands at 119 for health and 85 for political empowerment. The report also indicates that Pakistan
falls in the group of lower-middle income group having a per capita income range of 1,036 to
4,085 US dollars.
Table 1 also shows the data of Pakistan’s position in global ranking for the past nine
years. It apparently seems that Pakistan’s rankings in the past were better compared to that of
2014. Table 2 shows Pakistan’s position in terms of educational attainment and the countries that
rank below her:
Table 2
Educational Attainment and
Countriesbelow Pakistan
Country Rank
Pakistan 132
Burkina Faso 133
Nigeria 134
Liberia 135
Mali 136
Cote d’lvoire 137
Angola 138
Ethiopia 139
Yemen 140
Guinea 141
Chad 142
Source: The Global Gender Gap Report 2014 (World Economic Forum)
Pakistan is only above 9 other countries with respect to achieving educational targets.
This is despite the fact that Pakistan is a nuclear power and the 6th largest country in the world.
Table 3 shows the gender gap report from 2006-14. Pakistan’s score shows slight
improvement in 2014 as compared to 2006. It represents an improvement of 1.6 percent in the
Global Gender Gap Report-2014.
Table 3
Change in Score, 2006-2014
Country 2006 score 2014 score
Absolute change
in score (2006-
20014)
Percentage
change relative to
2006 score
Pakistan 0.5434 0.5522 0.0088 1.6
Source: The Global Gender Gap Report 2014 (World Economic Forum)
Table 4 presents the global gender gap index from 2006-2014.The global gender gap
index shows Pakistan’s rank in percentage over a period of 9 years. In these years, Pakistan has
shown improvement from rank 19 to 15, which could be considered as a minor progress.
Table 4
Global Gender Gap Index 2006-2014 for Pakistan
Country 2014 2013 2012 2011 2010 2009 2008 2007 2006
Pakistan 15 12 15 19 18 14 10 13 19
Source: The Global Gender Gap Report 2014 (World Economic Forum)
The Global Gender Gap Report has identified three indicators upon which the gender
situation of countrieshas been evaluated. They are; (i) Economic Participation and Opportunity,
(ii) Political Empowerment and (iii) Education Attainment. They are distinct in nature, yet they
are interdisciplinary and are integrated with one another. Following are the findings for each
indicator:
Table 5below presents the statistics of Pakistan’s economic participation and opportunity.
Table 5
Pakistan’s Economic Participation and Opportunity
Category Female Male Female-Male
Ratio Rank
Labour force participation 25 86 0.30 137
Estimated earned income 1,342 7,367 0.18 136
Source: The Global Gender Gap Report 2014 (World Economic Forum)
Table 5 shows that the female participation in the labour force is 25 percent, whereas
male participation stands at 86 percent, bringing Pakistan to the 137th rank. The difference in the
male/female earned income ratio is 0.18 percent bringing Pakistan to 136th global ranking. Table
6 presents female representation in political empowerment:
Table 6
Pakistan’s Political Empowerment
Category Female Male Female-Male
Ratio Rank
Legislators, senior officials
and managers 3 97 0.03 124
Professional and technical
worker 22 78 0.28 119
Women in parliament 21 79 0.26 71
Women in ministerial
positions 0 100 0.00 138
Years with female head of
the state 5 45 0.10 23
Source: The Global Gender Gap Report 2014 (World Economic Forum)
Asindicated in the table above, women’s role in the political activities indicates a huge
gender gap, as out of 100, only three percent of women are legislators and senior officials, 22
percent are professional and technical workers, 21 percent are in the parliament, zero percent in
ministerial positions. Having Mohtarma Benazir Bhutto as the prime minister for 5 years has put
Pakistan at the 23rd rank.
Table 7 exhibits the wage equality ratio and rank.
Table 7
Pakistan’s Wage equality Ratio and Rank
Country Survey data Female-Male Ratio Rank
Pakistan 3.87 0.55 111
Source: The Global Gender Gap Report 2014 (World Economic Forum)
1= Not at all – significantly below those of men; 7=fully – equal to those of men
The table shows that women’s wage scale is significantly low as females get half of what
males are paid in Pakistan. This puts Pakistan at the position of 111 in the global ranking.
Table 8 presents the literacy rate of Pakistan together with educational enrollment at the
primary, secondary and tertiary levels.
Table 8
Pakistan’s Educational Attainment
Category Female Male Female-Male
Ratio Rank
Literacy rate 42 67 0.63 129
Enrollment in Primary 67 77 0.87 131
Enrollment in Secondary 31 41 0.74 119
Enrollment in Tertiary 9 10 0.95 103
Source: The Global Gender Gap Report 2014 (World Economic Forum)
4.2 National Statistics on Educational Degradation. Pakistan has not been able to
fulfill its commitment to MDG 2; Universal Primary Education (UPE) by the year 2015 and has
not achieved the Universal Primary Education goal as specified in the Dakar Declaration (2000),
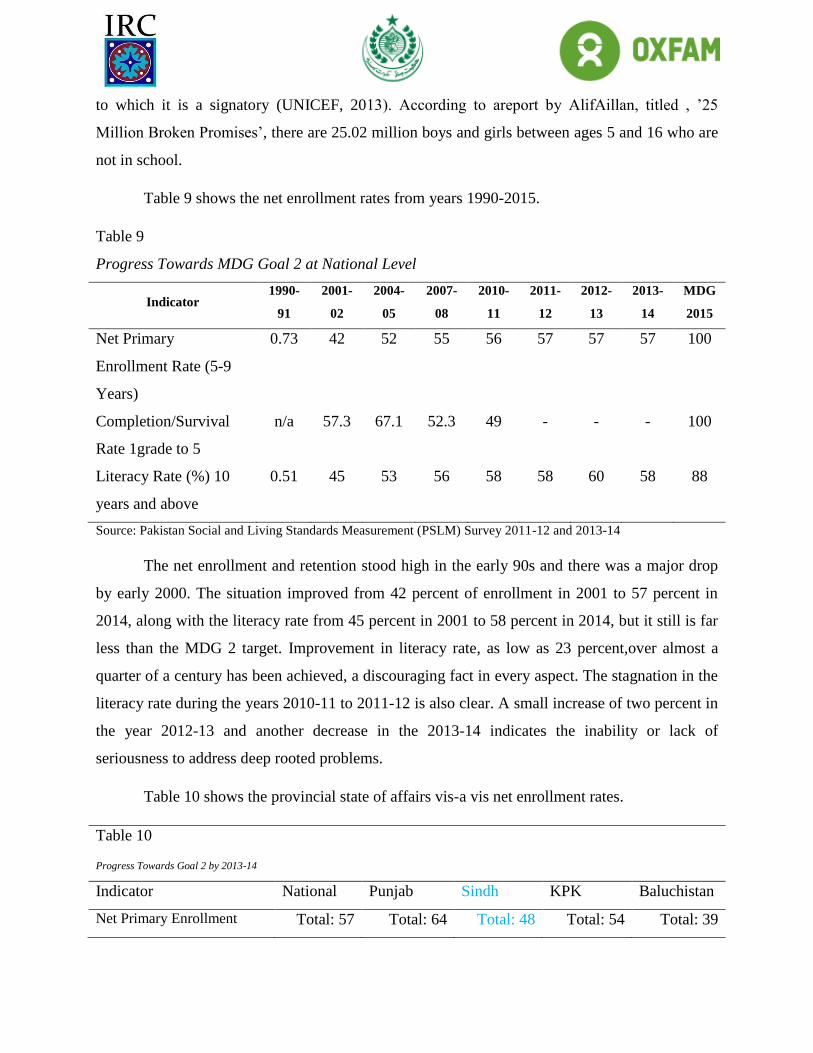
to which it is a signatory (UNICEF, 2013). According to areport by AlifAillan, titled , ’25
Million Broken Promises’, there are 25.02 million boys and girls between ages 5 and 16 who are
not in school.
Table 9 shows the net enrollment rates from years 1990-2015.
Table 9
Progress Towards MDG Goal 2 at National Level
Indicator 1990-
91
2001-
02
2004-
05
2007-
08
2010-
11
2011-
12
2012-
13
2013-
14
MDG
2015
Net Primary
Enrollment Rate (5-9
Years)
0.73 42 52 55 56 57 57 57 100
Completion/Survival
Rate 1grade to 5
n/a 57.3 67.1 52.3 49 - - - 100
Literacy Rate (%) 10
years and above
0.51 45 53 56 58 58 60 58 88
Source: Pakistan Social and Living Standards Measurement (PSLM) Survey 2011-12 and 2013-14
The net enrollment and retention stood high in the early 90s and there was a major drop
by early 2000. The situation improved from 42 percent of enrollment in 2001 to 57 percent in
2014, along with the literacy rate from 45 percent in 2001 to 58 percent in 2014, but it still is far
less than the MDG 2 target. Improvement in literacy rate, as low as 23 percent,over almost a
quarter of a century has been achieved, a discouraging fact in every aspect. The stagnation in the
literacy rate during the years 2010-11 to 2011-12 is also clear. A small increase of two percent in
the year 2012-13 and another decrease in the 2013-14 indicates the inability or lack of
seriousness to address deep rooted problems.
Table 10 shows the provincial state of affairs vis-a vis net enrollment rates.
Table 10
Progress Towards Goal 2 by 2013-14
Indicator National Punjab Sindh KPK Baluchistan
Net Primary Enrollment Total: 57 Total: 64 Total: 48 Total: 54 Total: 39

Rate (5-9 Years) Male: 60
Female: 53
Male: 66
Female:63
Male: 53
Female: 43
Male: 62
Female:46
Male: 46
Female: 30
Completion/Survival Rate
Grade 1 to 5
- - - - -
Literacy Rate (%) 10 years
and above
Total: 58
Male: 70
Female: 47
Total: 61
Male: 71
Female: 52
Total: 56
Male: 67
Female: 43
Total: 53
Male: 72
Female: 36
Total: 43
Male: 59
Female: 25
Source: Pakistan Social and Living Standards Measurement (PSLM) Survey 2013-2014
Narrowing down the statistics to the provincial level, Table 10 shows that in 2014, the net
primary enrollment rate was highest in Punjab with 64 percent, having 66 percent male
participation and 63 percent female participation, and lowest in Baluchistan with 39 percent,
having 46 percent male participation and 30 percent female participation. The situation in Sindh
is not encouraging, with a net enrollment rate of 48 percent, having a share of 53 percent male
participation and 43 percent female participation. The literacy rate is highest in Punjab with 61
percent and lowest in Baluchistan with only 43 percent.
Looking back at the past few years, it is evident that the girls’ enrollment rate has always
been on the lower side. The data from the year 1999 to 2009 in Table 11 shows that girls’
enrollment rate in the year 1999-2000 is as low as 36 percent at the primary schools level, 39
percent at middle school level and 36 percent at secondary level. Though it has increased over a
period of ten years to 44 percent in primary schools level, 42 percent in the middle schools level
and 40 percent in the secondary schools level, but this increase is still far below any substantive
growth.
Table 11
Enrollment in Educational Institutions over the Period of 1999-2009
Year Primary Schools
(In thousands)
Middle Schools
(In thousands)
Secondary Schools
(In thousands)
Total Female (F) % Total Female (F) % Total Female (F) %
1999-00 19148 7044 36 4112 1615 39 1817 670 36
2000-01 17136 6893 40 3759 1706 45 1648 689 41
2001-02 17529 7167 40 3821 1506 39 1657 659 39
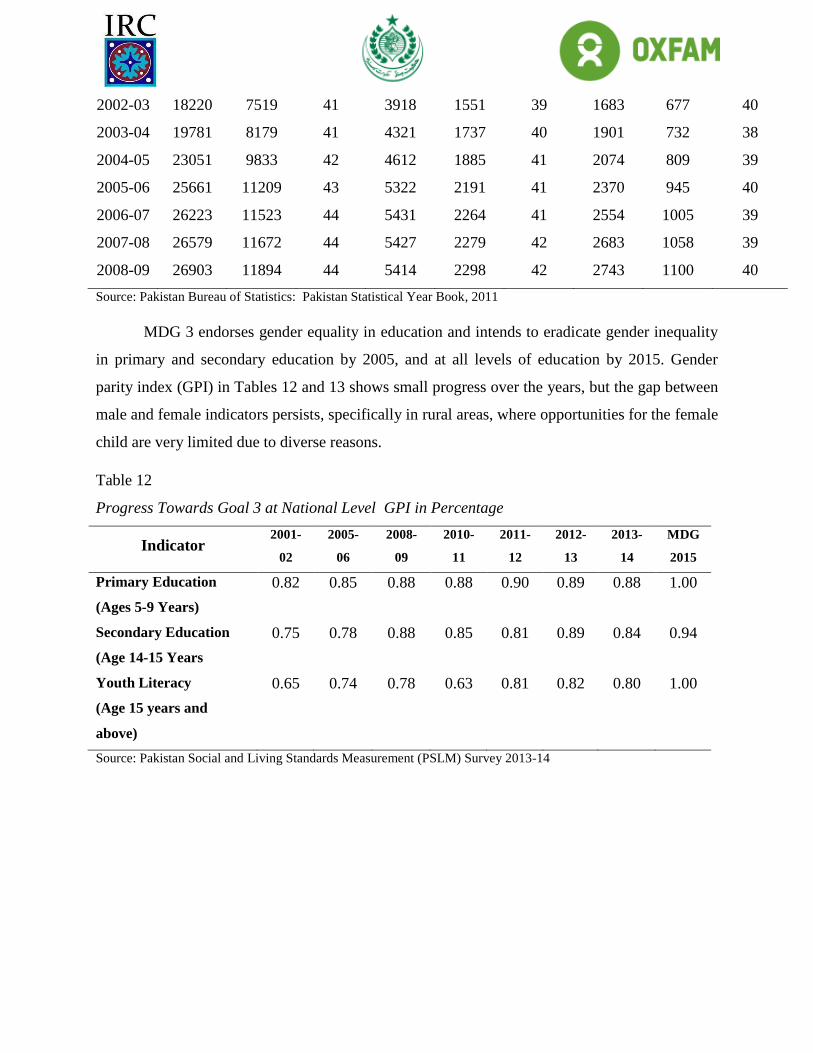
2002-03 18220 7519 41 3918 1551 39 1683 677 40
2003-04 19781 8179 41 4321 1737 40 1901 732 38
2004-05 23051 9833 42 4612 1885 41 2074 809 39
2005-06 25661 11209 43 5322 2191 41 2370 945 40
2006-07 26223 11523 44 5431 2264 41 2554 1005 39
2007-08 26579 11672 44 5427 2279 42 2683 1058 39
2008-09 26903 11894 44 5414 2298 42 2743 1100 40
Source: Pakistan Bureau of Statistics: Pakistan Statistical Year Book, 2011
MDG 3 endorses gender equality in education and intends to eradicate gender inequality
in primary and secondary education by 2005, and at all levels of education by 2015. Gender
parity index (GPI) in Tables 12 and 13 shows small progress over the years, but the gap between
male and female indicators persists, specifically in rural areas, where opportunities for the female
child are very limited due to diverse reasons.
Table 12
Progress Towards Goal 3 at National Level GPI in Percentage
Indicator 2001-
02
2005-
06
2008-
09
2010-
11
2011-
12
2012-
13
2013-
14
MDG
2015
Primary Education
(Ages 5-9 Years)
0.82 0.85 0.88 0.88 0.90 0.89 0.88 1.00
Secondary Education
(Age 14-15 Years
0.75 0.78 0.88 0.85 0.81 0.89 0.84 0.94
Youth Literacy
(Age 15 years and
above)
0.65 0.74 0.78 0.63 0.81 0.82 0.80 1.00
Source: Pakistan Social and Living Standards Measurement (PSLM) Survey 2013-14
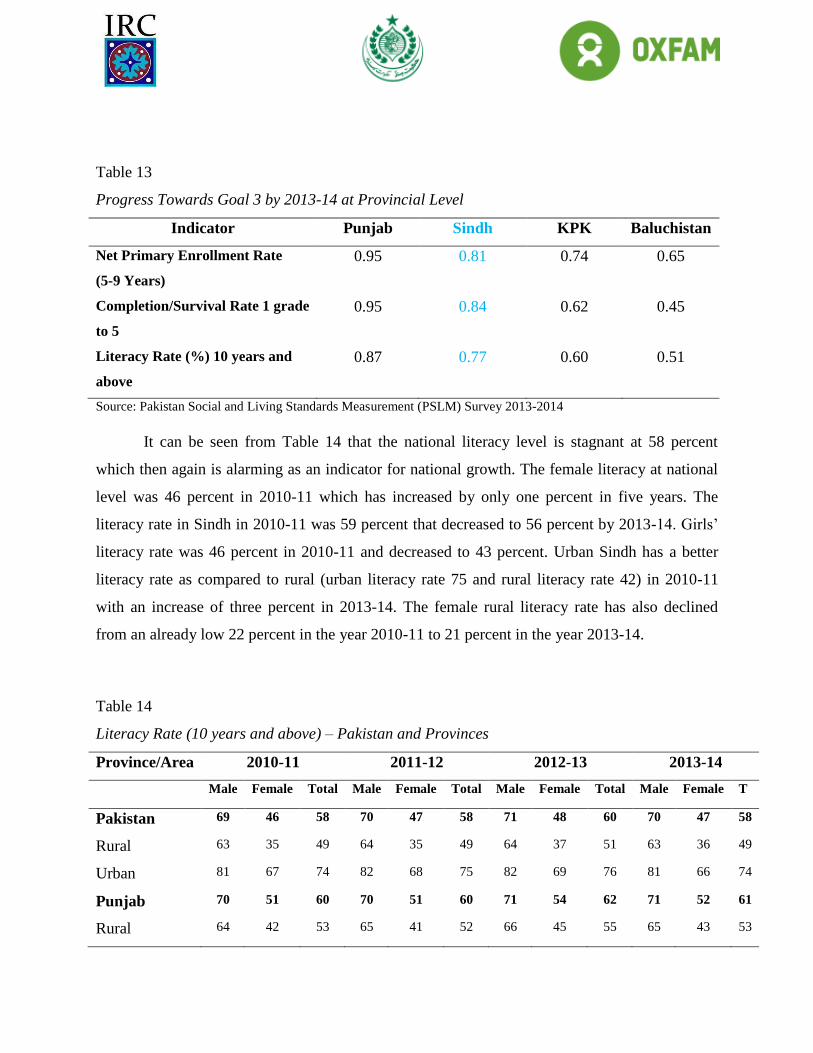
Table 13
Progress Towards Goal 3 by 2013-14 at Provincial Level
Indicator Punjab Sindh KPK Baluchistan
Net Primary Enrollment Rate
(5-9 Years)
0.95 0.81 0.74 0.65
Completion/Survival Rate 1 grade
to 5
0.95 0.84 0.62 0.45
Literacy Rate (%) 10 years and
above
0.87 0.77 0.60 0.51
Source: Pakistan Social and Living Standards Measurement (PSLM) Survey 2013-2014
It can be seen from Table 14 that the national literacy level is stagnant at 58 percent
which then again is alarming as an indicator for national growth. The female literacy at national
level was 46 percent in 2010-11 which has increased by only one percent in five years. The
literacy rate in Sindh in 2010-11 was 59 percent that decreased to 56 percent by 2013-14. Girls’
literacy rate was 46 percent in 2010-11 and decreased to 43 percent. Urban Sindh has a better
literacy rate as compared to rural (urban literacy rate 75 and rural literacy rate 42) in 2010-11
with an increase of three percent in 2013-14. The female rural literacy rate has also declined
from an already low 22 percent in the year 2010-11 to 21 percent in the year 2013-14.
Table 14
Literacy Rate (10 years and above) – Pakistan and Provinces
Province/Area 2010-11 2011-12 2012-13 2013-14
Male Female Total Male Female Total Male Female Total Male Female T
Pakistan 69 46 58 70 47 58 71 48 60 70 47 58
Rural 63 35 49 64 35 49 64 37 51 63 36 49
Urban 81 67 74 82 68 75 82 69 76 81 66 74
Punjab 70 51 60 70 51 60 71 54 62 71 52 61
Rural 64 42 53 65 41 52 66 45 55 65 43 53
Urban 80 71 76 80 70 75 82 72 77 82 71 76
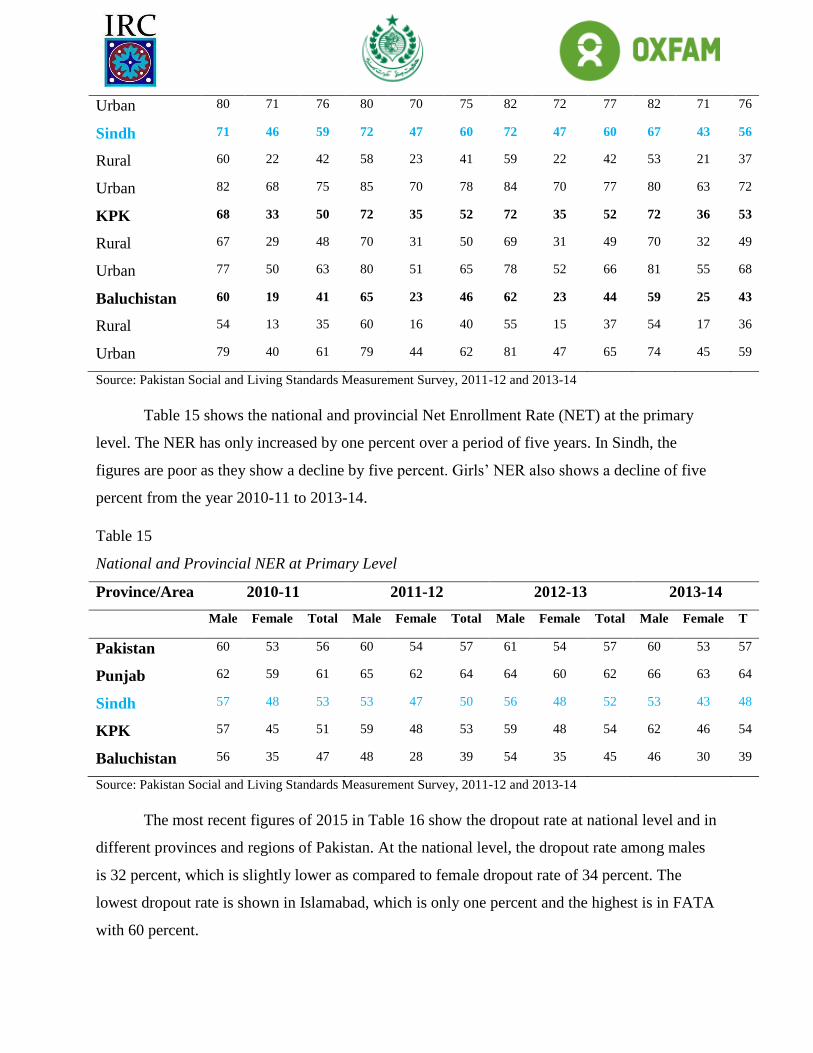
Sindh 71 46 59 72 47 60 72 47 60 67 43 56
Rural 60 22 42 58 23 41 59 22 42 53 21 37
Urban 82 68 75 85 70 78 84 70 77 80 63 72
KPK 68 33 50 72 35 52 72 35 52 72 36 53
Rural 67 29 48 70 31 50 69 31 49 70 32 49
Urban 77 50 63 80 51 65 78 52 66 81 55 68
Baluchistan 60 19 41 65 23 46 62 23 44 59 25 43
Rural 54 13 35 60 16 40 55 15 37 54 17 36
Urban 79 40 61 79 44 62 81 47 65 74 45 59
Source: Pakistan Social and Living Standards Measurement Survey, 2011-12 and 2013-14
Table 15 shows the national and provincial Net Enrollment Rate (NET) at the primary
level. The NER has only increased by one percent over a period of five years. In Sindh, the
figures are poor as they show a decline by five percent. Girls’ NER also shows a decline of five
percent from the year 2010-11 to 2013-14.
Table 15
National and Provincial NER at Primary Level
Province/Area 2010-11 2011-12 2012-13 2013-14
Male Female Total Male Female Total Male Female Total Male Female T
Pakistan 60 53 56 60 54 57 61 54 57 60 53 57
Punjab 62 59 61 65 62 64 64 60 62 66 63 64
Sindh 57 48 53 53 47 50 56 48 52 53 43 48
KPK 57 45 51 59 48 53 59 48 54 62 46 54
Baluchistan 56 35 47 48 28 39 54 35 45 46 30 39
Source: Pakistan Social and Living Standards Measurement Survey, 2011-12 and 2013-14
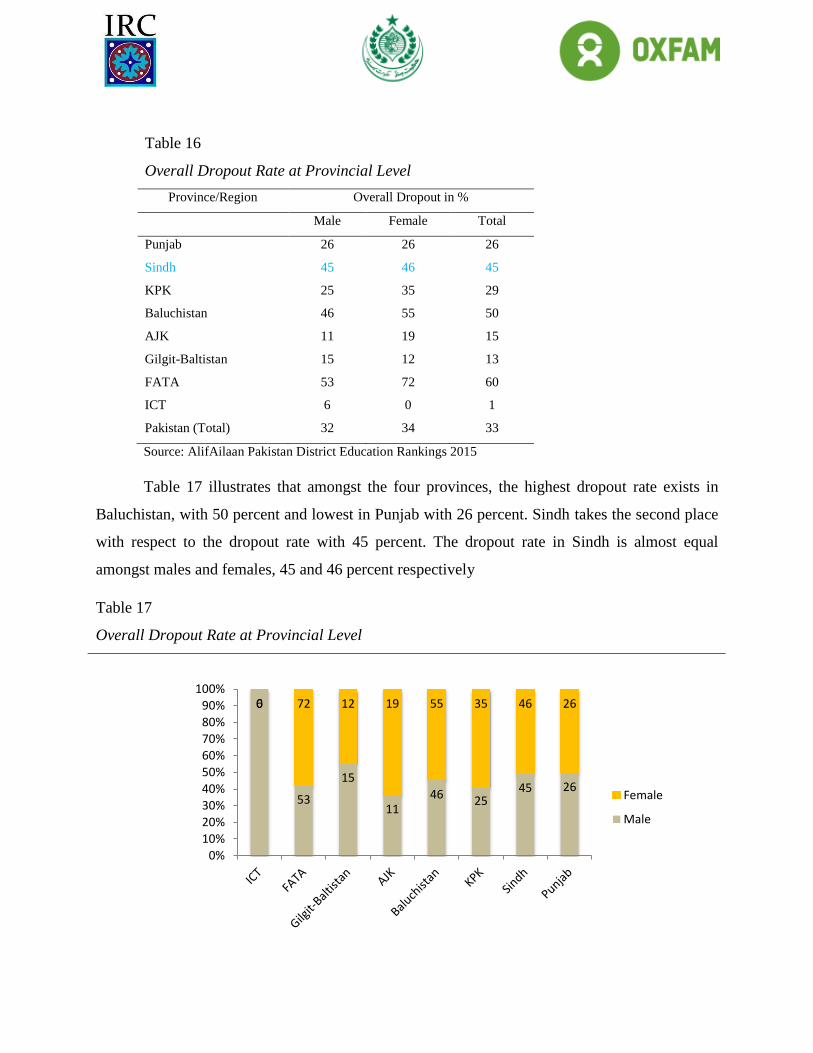
The most recent figures of 2015 in Table 16 show the dropout rate at national level and in
different provinces and regions of Pakistan. At the national level, the dropout rate among males
is 32 percent, which is slightly lower as compared to female dropout rate of 34 percent. The
lowest dropout rate is shown in Islamabad, which is only one percent and the highest is in FATA
with 60 percent.
6
53
15
1146 25
45 26
0 72 12 19 55 35 46 26
0%
10%
20%
30%
40%
50%
60%
70%
80%
90%
100%
Female
Male
Table 16
Overall Dropout Rate at Provincial Level
Province/Region Overall Dropout in %
Male Female Total
Punjab 26 26 26
Sindh 45 46 45
KPK 25 35 29
Baluchistan 46 55 50
AJK 11 19 15
Gilgit-Baltistan 15 12 13
FATA 53 72 60
ICT 6 0 1
Pakistan (Total) 32 34 33
Source: AlifAilaan Pakistan District Education Rankings 2015
Table 17 illustrates that amongst the four provinces, the highest dropout rate exists in
Baluchistan, with 50 percent and lowest in Punjab with 26 percent. Sindh takes the second place
with respect to the dropout rate with 45 percent. The dropout rate in Sindh is almost equal
amongst males and females, 45 and 46 percent respectively
Table 17
Overall Dropout Rate at Provincial Level
Source: AlifAilaan Pakistan District Education Ranking s 2015
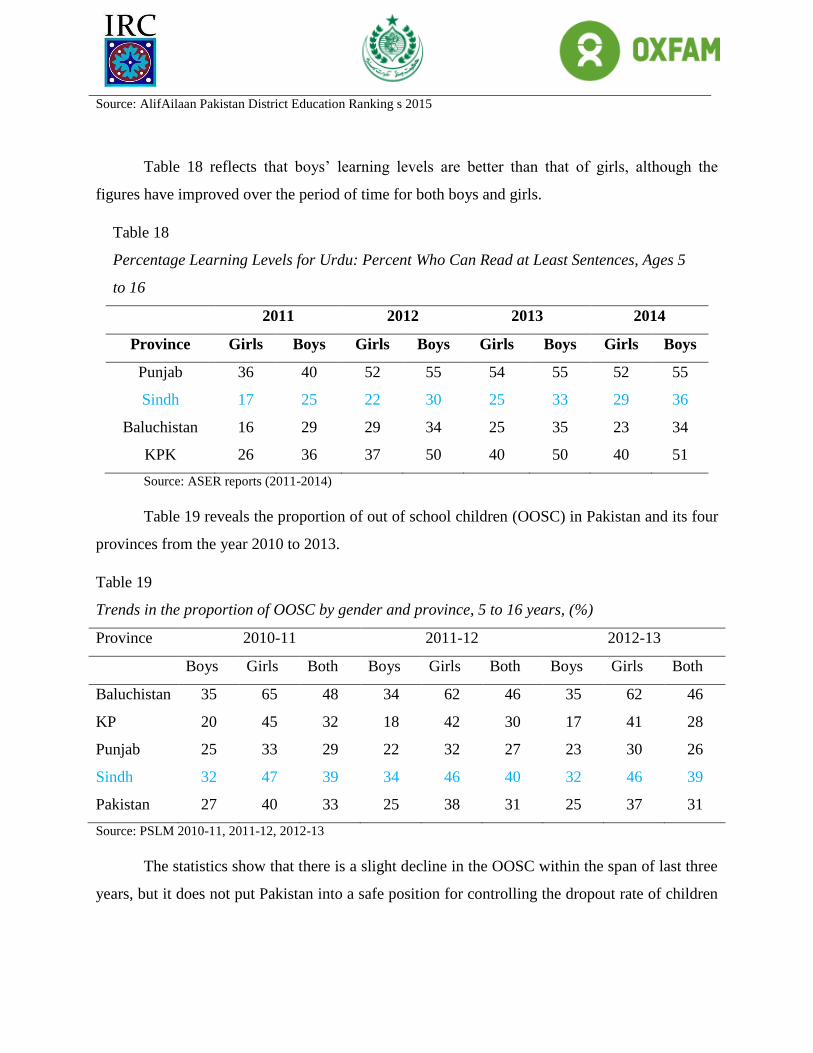
Table 18 reflects that boys’ learning levels are better than that of girls, although the
figures have improved over the period of time for both boys and girls.
Table 18
Percentage Learning Levels for Urdu: Percent Who Can Read at Least Sentences, Ages 5
to 16
2011 2012 2013 2014
Province Girls Boys Girls Boys Girls Boys Girls Boys
Punjab 36 40 52 55 54 55 52 55
Sindh 17 25 22 30 25 33 29 36
Baluchistan 16 29 29 34 25 35 23 34
KPK 26 36 37 50 40 50 40 51
Source: ASER reports (2011-2014)
Table 19 reveals the proportion of out of school children (OOSC) in Pakistan and its four
provinces from the year 2010 to 2013.
Table 19
Trends in the proportion of OOSC by gender and province, 5 to 16 years, (%)
Province 2010-11 2011-12 2012-13
Boys Girls Both Boys Girls Both Boys Girls Both
Baluchistan 35 65 48 34 62 46 35 62 46
KP 20 45 32 18 42 30 17 41 28
Punjab 25 33 29 22 32 27 23 30 26
Sindh 32 47 39 34 46 40 32 46 39
Pakistan 27 40 33 25 38 31 25 37 31
Source: PSLM 2010-11, 2011-12, 2012-13
The statistics show that there is a slight decline in the OOSC within the span of last three
years, but it does not put Pakistan into a safe position for controlling the dropout rate of children
and improve the enrollment rate. It is also noteworthy that the ratio of out of school girls is more
than the boys in every province of Pakistan during the past four.
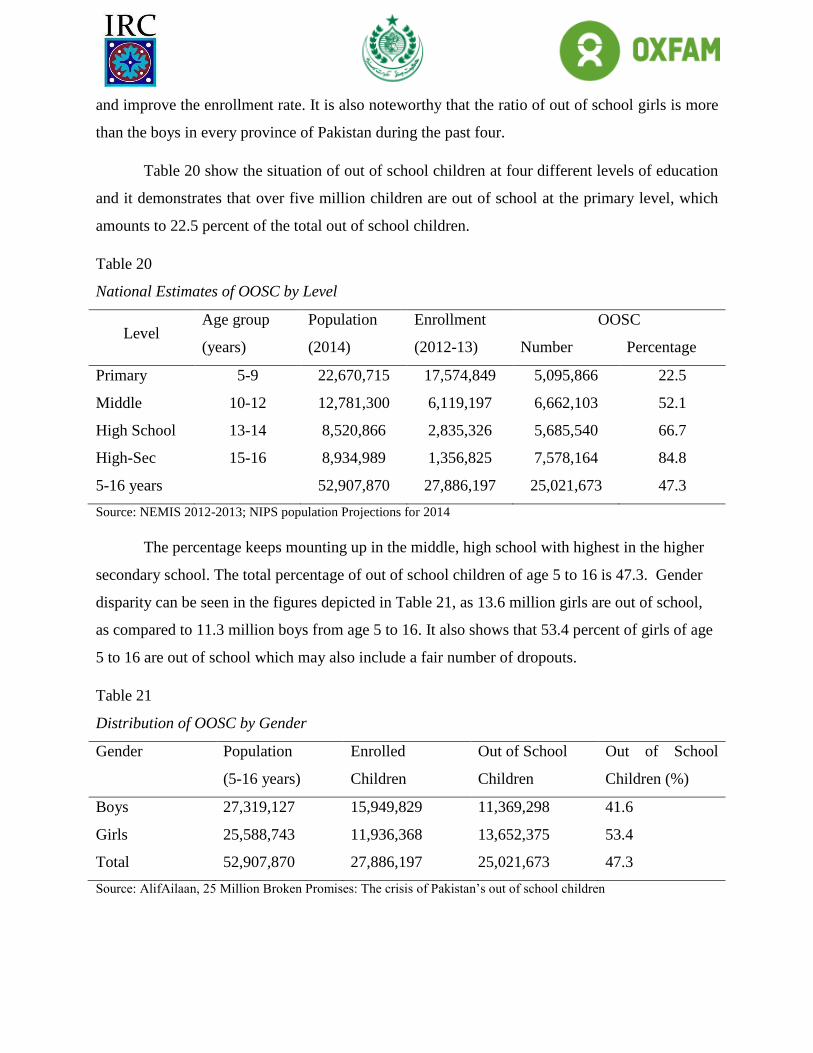
Table 20 show the situation of out of school children at four different levels of education
and it demonstrates that over five million children are out of school at the primary level, which
amounts to 22.5 percent of the total out of school children.
Table 20
National Estimates of OOSC by Level
Level Age group
(years)
Population
(2014)
Enrollment
(2012-13)
OOSC
Number Percentage
Primary 5-9 22,670,715 17,574,849 5,095,866 22.5
Middle 10-12 12,781,300 6,119,197 6,662,103 52.1
High School 13-14 8,520,866 2,835,326 5,685,540 66.7
High-Sec 15-16 8,934,989 1,356,825 7,578,164 84.8
5-16 years 52,907,870 27,886,197 25,021,673 47.3
Source: NEMIS 2012-2013; NIPS population Projections for 2014
The percentage keeps mounting up in the middle, high school with highest in the higher
secondary school. The total percentage of out of school children of age 5 to 16 is 47.3. Gender
disparity can be seen in the figures depicted in Table 21, as 13.6 million girls are out of school,
as compared to 11.3 million boys from age 5 to 16. It also shows that 53.4 percent of girls of age
5 to 16 are out of school which may also include a fair number of dropouts.
Table 21
Distribution of OOSC by Gender
Gender Population
(5-16 years)
Enrolled
Children
Out of School
Children
Out of School
Children (%)
Boys 27,319,127 15,949,829 11,369,298 41.6
Girls 25,588,743 11,936,368 13,652,375 53.4
Total 52,907,870 27,886,197 25,021,673 47.3
Source: AlifAilaan, 25 Million Broken Promises: The crisis of Pakistan’s out of school children
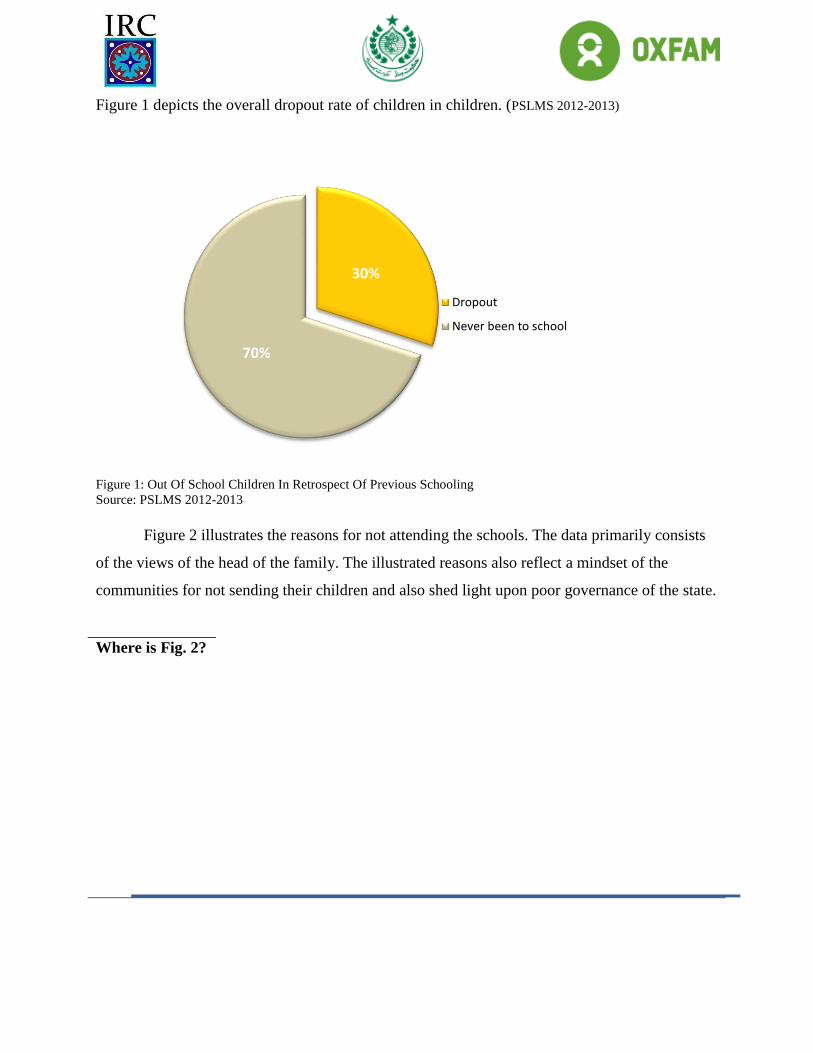
Figure 1 depicts the overall dropout rate of children in children. (PSLMS 2012-2013)
Figure 1: Out Of School Children In Retrospect Of Previous Schooling
Source: PSLMS 2012-2013
Figure 2 illustrates the reasons for not attending the schools. The data primarily consists
of the views of the head of the family. The illustrated reasons also reflect a mindset of the
communities for not sending their children and also shed light upon poor governance of the state.
Where is Fig. 2?
30%
70%
Dropout
Never been to school
Figure 2: Reasons for not Attending School
Source: PSLMS 2012-13 as cited in AlifAillan
As is evident from the statistics presented above, the parents do not view girls as
being earners and they are also unaware of the larger benefits of education in terms of a better
quality of life. The main reason for out of school girls (33.6 percent) is that the parents do not
want their female child to be educated and 38.2 percent boys show their disinterest in going to
school. Twelve percent girls and 11.4 percent boys do not attend school because of the distance
between their residence and school. Another significant fact is that three percent girls and 6.1
percent boys do not attend school because of illness or being handicapped. More than half of the
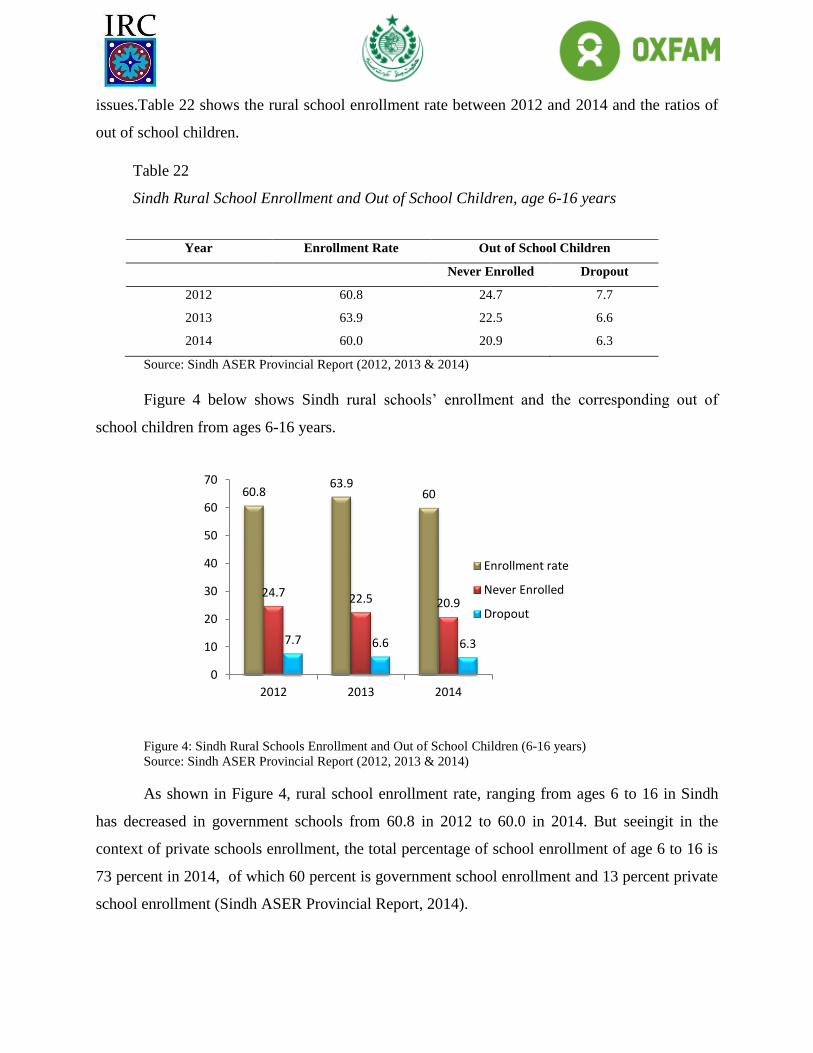
girls of school going age are out of school. As shown in figure 3 the ratio of out of school boys is
10 percent less compared to girls. The majority of girls are compelled to help with either
household errands or help the parents in agri-fields. One percent girls are forced to discontinue
due to early child-marriages.
Figure 3 represents the ratio of out of school girls and boys.
Figure 3: Ratio of Out of School Girls and Boys
Source: PSLMS 2012-13 as cited in AlifAillan
The above figures thus present a grim reality as far as the education landscape of Pakistan
is concerned. The socio-cultural factors together with state apathy make Pakistan stand
considerably low in the world in terms of educational attainment and gender parity.
4.3 Sindh specific education scenario. The following statistics will give the education
status of Sindh with particular reference to school enrollment, dropout rates and gender specific
issues.Table 22 shows the rural school enrollment rate between 2012 and 2014 and the ratios of
out of school children.
Table 22
Sindh Rural School Enrollment and Out of School Children, age 6-16 years
Year Enrollment Rate Out of School Children
Never Enrolled Dropout
2012 60.8 24.7 7.7
2013 63.9 22.5 6.6
2014 60.0 20.9 6.3
Source: Sindh ASER Provincial Report (2012, 2013 & 2014)
Figure 4 below shows Sindh rural schools’ enrollment and the corresponding out of
school children from ages 6-16 years.
Figure 4: Sindh Rural Schools Enrollment and Out of School Children (6-16 years)
Source: Sindh ASER Provincial Report (2012, 2013 & 2014)
As shown in Figure 4, rural school enrollment rate, ranging from ages 6 to 16 in Sindh
has decreased in government schools from 60.8 in 2012 to 60.0 in 2014. But seeingit in the
context of private schools enrollment, the total percentage of school enrollment of age 6 to 16 is
73 percent in 2014, of which 60 percent is government school enrollment and 13 percent private
school enrollment (Sindh ASER Provincial Report, 2014).
60.863.9
60
24.7 22.5 20.9
7.7 6.6 6.3
0
10
20
30
40
50
60
70
2012 2013 2014
Enrollment rate
Never Enrolled
Dropout
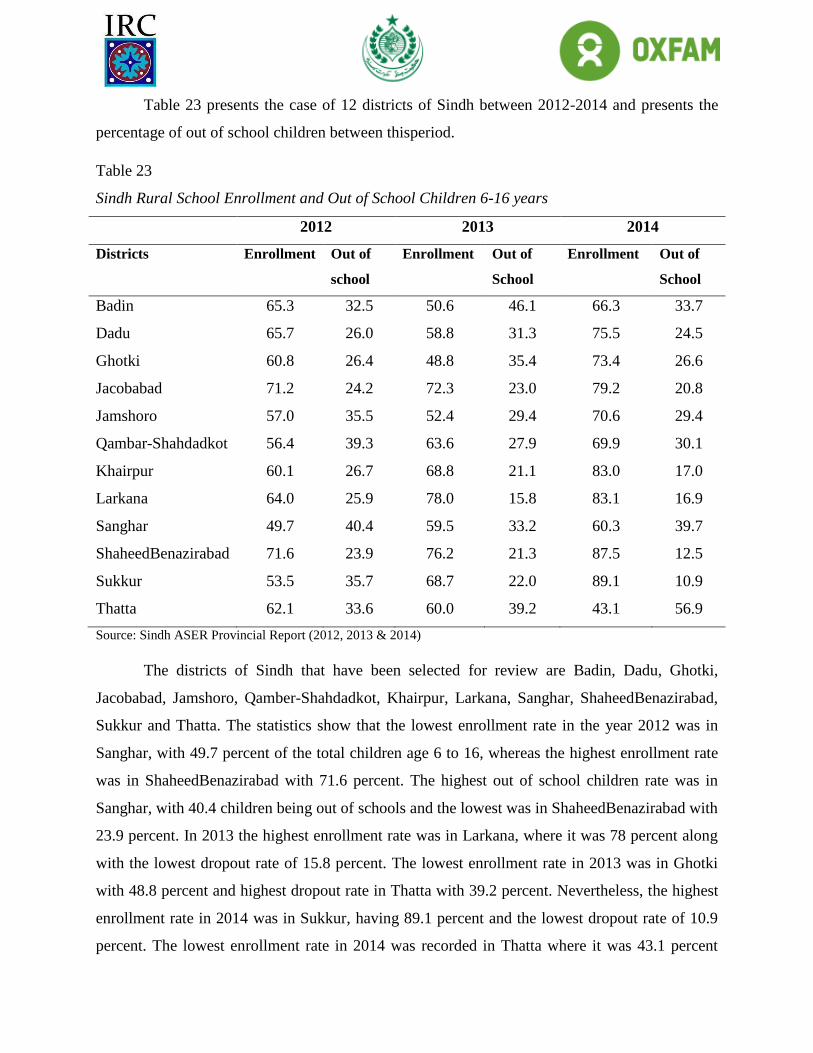
Table 23 presents the case of 12 districts of Sindh between 2012-2014 and presents the
percentage of out of school children between thisperiod.
Table 23
Sindh Rural School Enrollment and Out of School Children 6-16 years
2012 2013 2014
Districts Enrollment Out of
school
Enrollment Out of
School
Enrollment Out of
School
Badin 65.3 32.5 50.6 46.1 66.3 33.7
Dadu 65.7 26.0 58.8 31.3 75.5 24.5
Ghotki 60.8 26.4 48.8 35.4 73.4 26.6
Jacobabad 71.2 24.2 72.3 23.0 79.2 20.8
Jamshoro 57.0 35.5 52.4 29.4 70.6 29.4
Qambar-Shahdadkot 56.4 39.3 63.6 27.9 69.9 30.1
Khairpur 60.1 26.7 68.8 21.1 83.0 17.0
Larkana 64.0 25.9 78.0 15.8 83.1 16.9
Sanghar 49.7 40.4 59.5 33.2 60.3 39.7
ShaheedBenazirabad 71.6 23.9 76.2 21.3 87.5 12.5
Sukkur 53.5 35.7 68.7 22.0 89.1 10.9
Thatta 62.1 33.6 60.0 39.2 43.1 56.9
Source: Sindh ASER Provincial Report (2012, 2013 & 2014)
The districts of Sindh that have been selected for review are Badin, Dadu, Ghotki,
Jacobabad, Jamshoro, Qamber-Shahdadkot, Khairpur, Larkana, Sanghar, ShaheedBenazirabad,
Sukkur and Thatta. The statistics show that the lowest enrollment rate in the year 2012 was in
Sanghar, with 49.7 percent of the total children age 6 to 16, whereas the highest enrollment rate
was in ShaheedBenazirabad with 71.6 percent. The highest out of school children rate was in
Sanghar, with 40.4 children being out of schools and the lowest was in ShaheedBenazirabad with
23.9 percent. In 2013 the highest enrollment rate was in Larkana, where it was 78 percent along
with the lowest dropout rate of 15.8 percent. The lowest enrollment rate in 2013 was in Ghotki
with 48.8 percent and highest dropout rate in Thatta with 39.2 percent. Nevertheless, the highest
enrollment rate in 2014 was in Sukkur, having 89.1 percent and the lowest dropout rate of 10.9
percent. The lowest enrollment rate in 2014 was recorded in Thatta where it was 43.1 percent
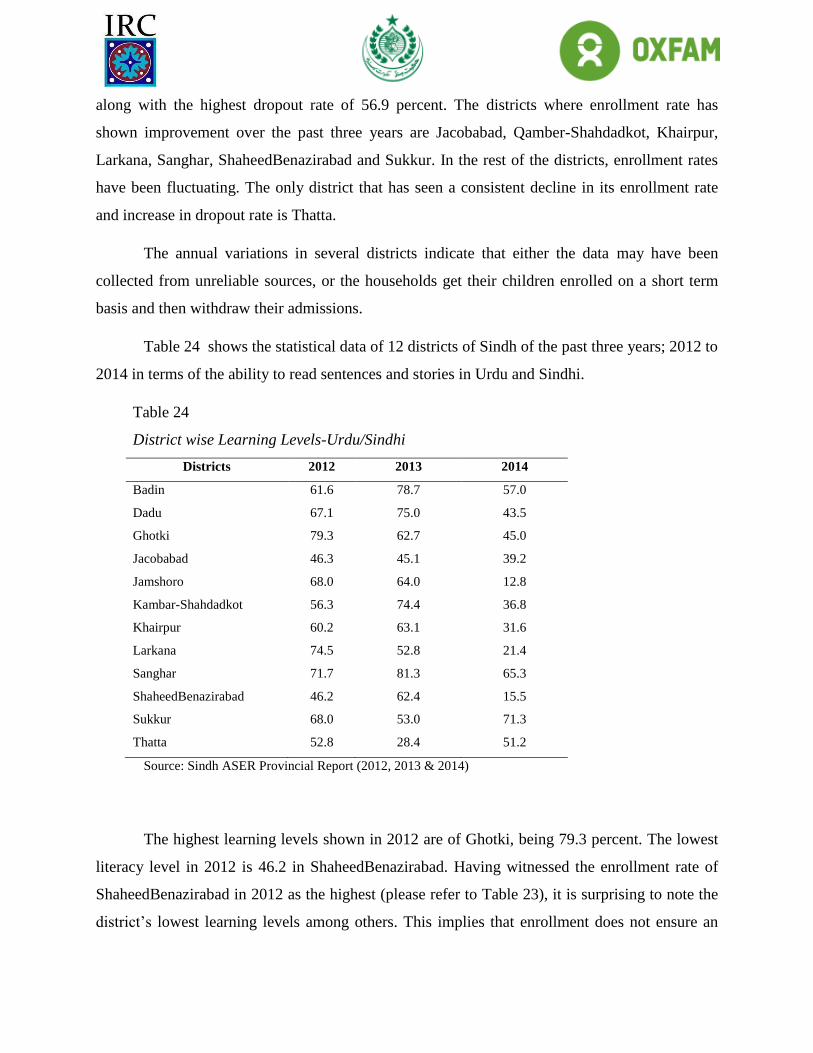
along with the highest dropout rate of 56.9 percent. The districts where enrollment rate has
shown improvement over the past three years are Jacobabad, Qamber-Shahdadkot, Khairpur,
Larkana, Sanghar, ShaheedBenazirabad and Sukkur. In the rest of the districts, enrollment rates
have been fluctuating. The only district that has seen a consistent decline in its enrollment rate
and increase in dropout rate is Thatta.
The annual variations in several districts indicate that either the data may have been
collected from unreliable sources, or the households get their children enrolled on a short term
basis and then withdraw their admissions.
Table 24 shows the statistical data of 12 districts of Sindh of the past three years; 2012 to
2014 in terms of the ability to read sentences and stories in Urdu and Sindhi.
Table 24
District wise Learning Levels-Urdu/Sindhi
Districts 2012 2013 2014
Badin 61.6 78.7 57.0
Dadu 67.1 75.0 43.5
Ghotki 79.3 62.7 45.0
Jacobabad 46.3 45.1 39.2
Jamshoro 68.0 64.0 12.8
Kambar-Shahdadkot 56.3 74.4 36.8
Khairpur 60.2 63.1 31.6
Larkana 74.5 52.8 21.4
Sanghar 71.7 81.3 65.3
ShaheedBenazirabad 46.2 62.4 15.5
Sukkur 68.0 53.0 71.3
Thatta 52.8 28.4 51.2
Source: Sindh ASER Provincial Report (2012, 2013 & 2014)
The highest learning levels shown in 2012 are of Ghotki, being 79.3 percent. The lowest
literacy level in 2012 is 46.2 in ShaheedBenazirabad. Having witnessed the enrollment rate of
ShaheedBenazirabad in 2012 as the highest (please refer to Table 23), it is surprising to note the
district’s lowest learning levels among others. This implies that enrollment does not ensure an
improvement in literacy (or the child having attended school at all). It is discouraging to see that
the learning level of Ghotki has declined in the years 2013 and 2014. The highest learning level
in 2013 was 81.3 in Sanghar and the lowest learning level was 28.4 in Thatta. Sukkur’s learning
level improved from 53 percent to 71.3 percent and became the highest for 2014. The continuous
decline in learning levels has been evident in Jacobabad, Jamshoro, and Larkana. The very sharp
decline in Jamshoro, from 68 and 64 percent in 2012 and 2013, to 12.6 in 2014 indicates a
serious problem, either in data collection, authenticity of the data or teaching methodology.
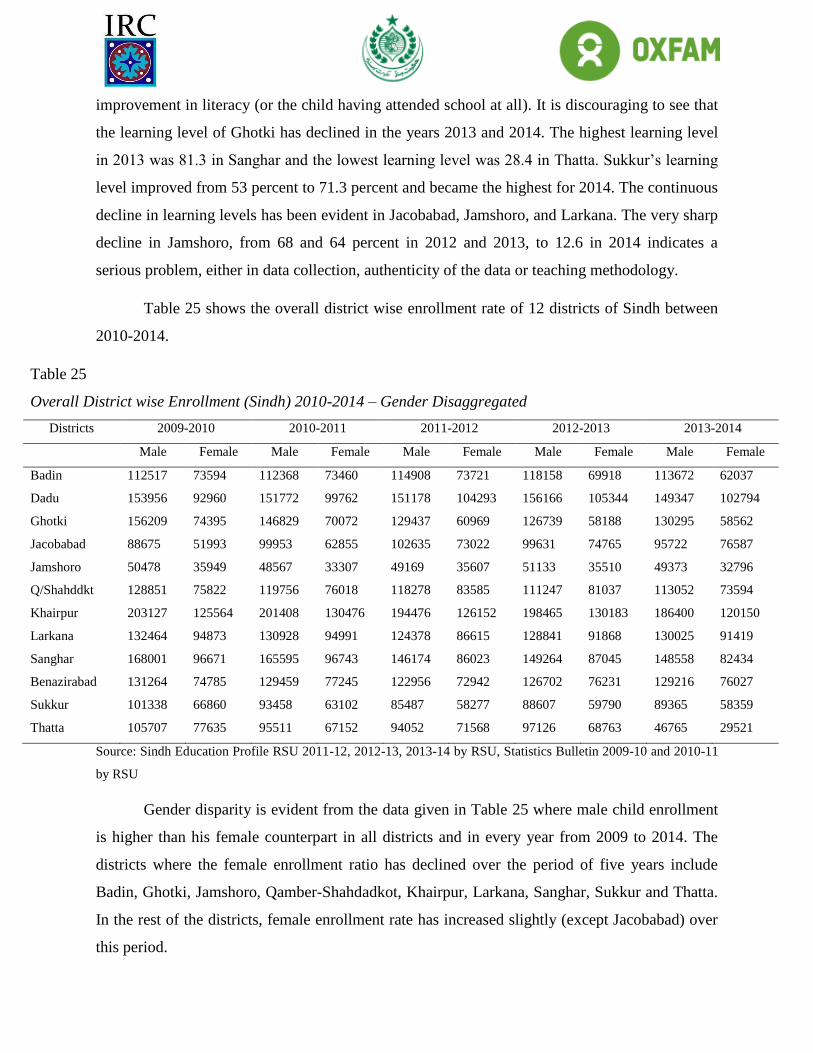
Table 25 shows the overall district wise enrollment rate of 12 districts of Sindh between
2010-2014.
Table 25
Overall District wise Enrollment (Sindh) 2010-2014 – Gender Disaggregated
Districts 2009-2010 2010-2011 2011-2012 2012-2013 2013-2014
Male Female Male Female Male Female Male Female Male Female
Badin 112517 73594 112368 73460 114908 73721 118158 69918 113672 62037
Dadu 153956 92960 151772 99762 151178 104293 156166 105344 149347 102794
Ghotki 156209 74395 146829 70072 129437 60969 126739 58188 130295 58562
Jacobabad 88675 51993 99953 62855 102635 73022 99631 74765 95722 76587
Jamshoro 50478 35949 48567 33307 49169 35607 51133 35510 49373 32796
Q/Shahddkt 128851 75822 119756 76018 118278 83585 111247 81037 113052 73594
Khairpur 203127 125564 201408 130476 194476 126152 198465 130183 186400 120150
Larkana 132464 94873 130928 94991 124378 86615 128841 91868 130025 91419
Sanghar 168001 96671 165595 96743 146174 86023 149264 87045 148558 82434
Benazirabad 131264 74785 129459 77245 122956 72942 126702 76231 129216 76027
Sukkur 101338 66860 93458 63102 85487 58277 88607 59790 89365 58359
Thatta 105707 77635 95511 67152 94052 71568 97126 68763 46765 29521
Source: Sindh Education Profile RSU 2011-12, 2012-13, 2013-14 by RSU, Statistics Bulletin 2009-10 and 2010-11
by RSU
Gender disparity is evident from the data given in Table 25 where male child enrollment
is higher than his female counterpart in all districts and in every year from 2009 to 2014. The
districts where the female enrollment ratio has declined over the period of five years include
Badin, Ghotki, Jamshoro, Qamber-Shahdadkot, Khairpur, Larkana, Sanghar, Sukkur and Thatta.
In the rest of the districts, female enrollment rate has increased slightly (except Jacobabad) over
this period.
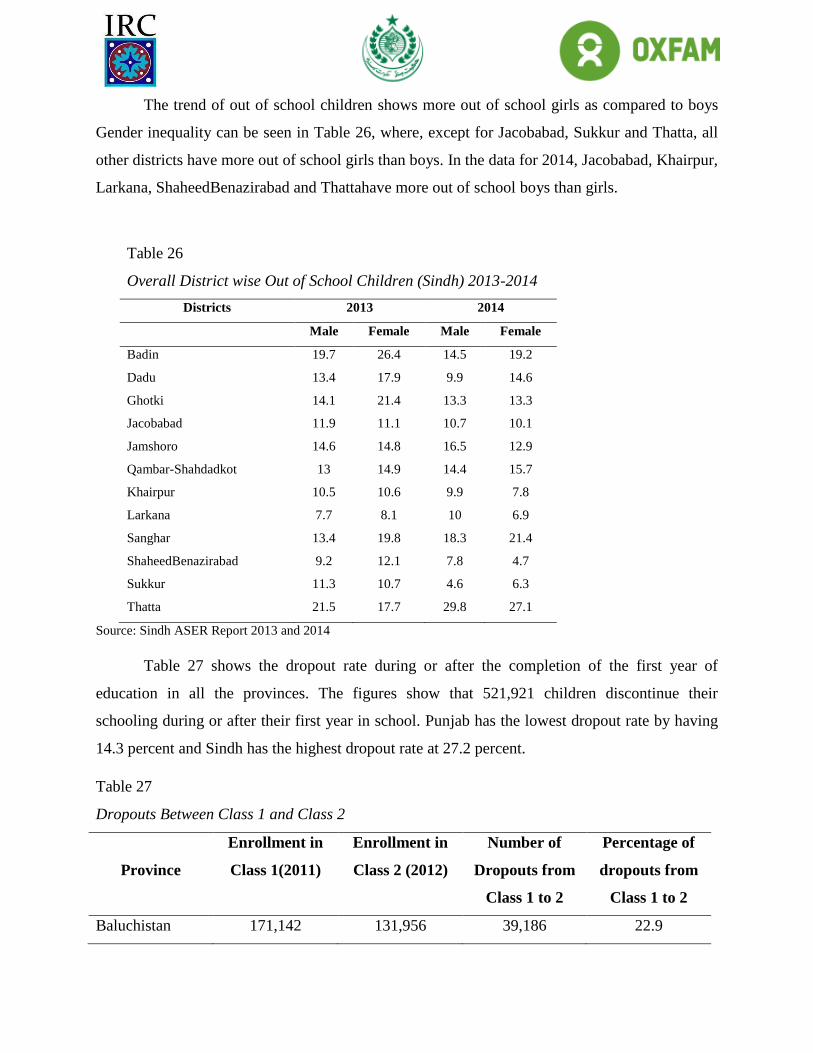
The trend of out of school children shows more out of school girls as compared to boys
Gender inequality can be seen in Table 26, where, except for Jacobabad, Sukkur and Thatta, all
other districts have more out of school girls than boys. In the data for 2014, Jacobabad, Khairpur,
Larkana, ShaheedBenazirabad and Thattahave more out of school boys than girls.
Table 26
Overall District wise Out of School Children (Sindh) 2013-2014
Districts 2013 2014
Male Female Male Female
Badin 19.7 26.4 14.5 19.2
Dadu 13.4 17.9 9.9 14.6
Ghotki 14.1 21.4 13.3 13.3
Jacobabad 11.9 11.1 10.7 10.1
Jamshoro 14.6 14.8 16.5 12.9
Qambar-Shahdadkot 13 14.9 14.4 15.7
Khairpur 10.5 10.6 9.9 7.8
Larkana 7.7 8.1 10 6.9
Sanghar 13.4 19.8 18.3 21.4
ShaheedBenazirabad 9.2 12.1 7.8 4.7
Sukkur 11.3 10.7 4.6 6.3
Thatta 21.5 17.7 29.8 27.1
Source: Sindh ASER Report 2013 and 2014
Table 27 shows the dropout rate during or after the completion of the first year of
education in all the provinces. The figures show that 521,921 children discontinue their
schooling during or after their first year in school. Punjab has the lowest dropout rate by having
14.3 percent and Sindh has the highest dropout rate at 27.2 percent.
Table 27
Dropouts Between Class 1 and Class 2
Province
Enrollment in
Class 1(2011)
Enrollment in
Class 2 (2012)
Number of
Dropouts from
Class 1 to 2
Percentage of
dropouts from
Class 1 to 2
Baluchistan 171,142 131,956 39,186 22.9
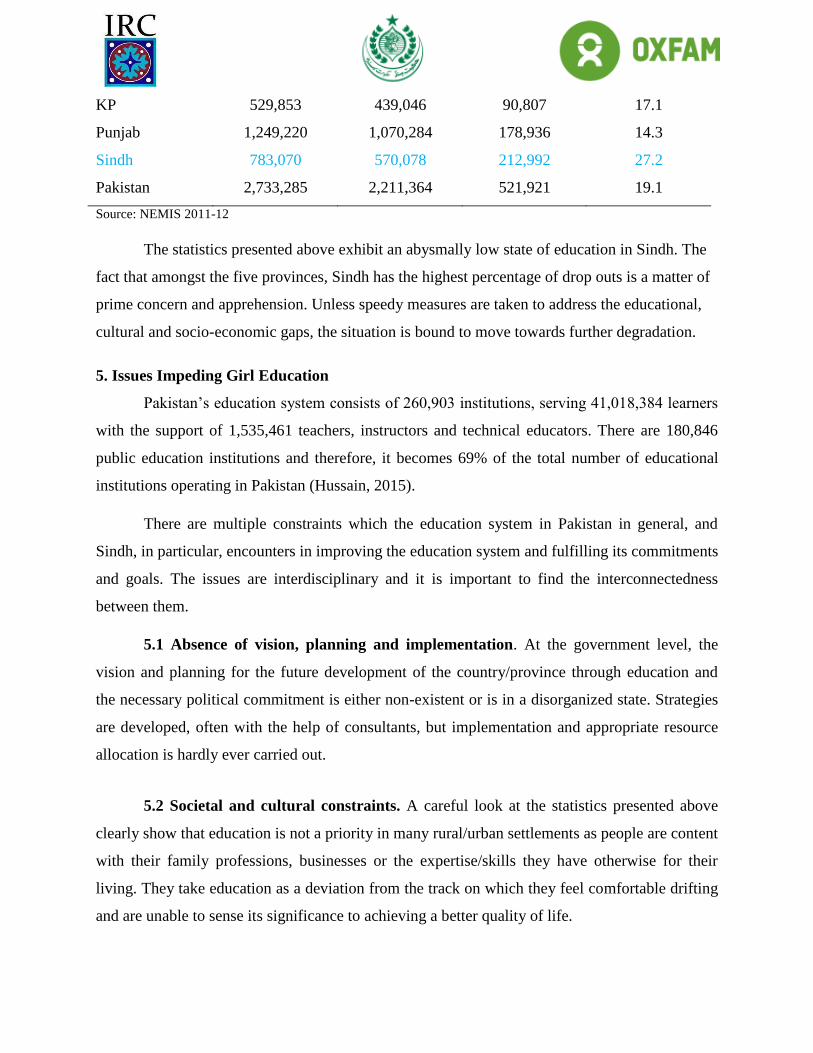
KP 529,853 439,046 90,807 17.1
Punjab 1,249,220 1,070,284 178,936 14.3
Sindh 783,070 570,078 212,992 27.2
Pakistan 2,733,285 2,211,364 521,921 19.1
Source: NEMIS 2011-12
The statistics presented above exhibit an abysmally low state of education in Sindh. The
fact that amongst the five provinces, Sindh has the highest percentage of drop outs is a matter of
prime concern and apprehension. Unless speedy measures are taken to address the educational,
cultural and socio-economic gaps, the situation is bound to move towards further degradation.
5. Issues Impeding Girl Education
Pakistan’s education system consists of 260,903 institutions, serving 41,018,384 learners
with the support of 1,535,461 teachers, instructors and technical educators. There are 180,846
public education institutions and therefore, it becomes 69% of the total number of educational
institutions operating in Pakistan (Hussain, 2015).
There are multiple constraints which the education system in Pakistan in general, and
Sindh, in particular, encounters in improving the education system and fulfilling its commitments
and goals. The issues are interdisciplinary and it is important to find the interconnectedness
between them.
5.1 Absence of vision, planning and implementation. At the government level, the
vision and planning for the future development of the country/province through education and
the necessary political commitment is either non-existent or is in a disorganized state. Strategies
are developed, often with the help of consultants, but implementation and appropriate resource
allocation is hardly ever carried out.
5.2 Societal and cultural constraints. A careful look at the statistics presented above
clearly show that education is not a priority in many rural/urban settlements as people are content
with their family professions, businesses or the expertise/skills they have otherwise for their
living. They take education as a deviation from the track on which they feel comfortable drifting
and are unable to sense its significance to achieving a better quality of life.
The overall cultural and social structure of the Pakistani societydiscourages women to get
education. The women aregiven traditional roles and society has expectations from them mostly
at home.They are seen only with the roles to reproduce, child-care, house work, cooking and
looking after the extended family. This structure is more enforced in the rural areas of Pakistan,
where violence against women is commonly witnessed. People living in theseareas fail to
recognise that in the future, their female child will be an educated mother who can illuminate and
enlighten society through educating her children. She may alsobe a support in the household asan
earner.
5.3 Milieu and mindset.Rural people see themselves as the flag bearers of the traditional
values, and view women and their rights in terms of traditions of their ancestors. These traditions
have been developed over centuries and have now become ingrained, even in day to day
language and discourse. Often, men in rural Sindh, when in a conversation about the value they
give to their women folks, talk about [رے ےیلٔ وعرت اک اقمم است رقآن انتج ےہ the respect of women for us) ,[امہ
is equal to seven Holy Qurans). Apparently it gives an impression of giving the highest level of
respect to a woman, but it translates into women being kept hidden, not exposed to any
experiences of the external world. Another example is, [اکچن یک رطح ےہ
ل
a woman is as fragile) ,[وعرت ابُکل
and delicate as a piece of glass). Because she is fragile, it is most likely that going out of the
house increases the possibility of encountering a dangerous situation, so she must be confined to
the house. Traditionally, there is another category of women called [ڈنہوےل وایل ایبیبں], (women of the
cradle/carousel). They are the ones who have been prevented from marrying. This is either
because no male member of her own family was available for her, or the men want to keep their
inheritance within the family. Therefore, the women are betrothed to the Holy Quran. Gender
disparity is deep rooted in the traditional and cultural values of many communities,
predominantly because of illiteracy. Lack of education Table 7 exhibits the wage equality ratio
and rank.
oreventstraditional mindsets from breaking. Only education can spearhead progressive
thinking and deactivate fossilized values.
5.4 Quality of education. Quality of education is a compromised factor at government
schools mainly due to lack of governance and administration. In the absence of accountability of
those responsible at any level, education is considered a matter of least priority. Even those
children who go to school hardly learn to read and write. Parents thus find very little benefit in
sending their offspring to waste their time, which could be used more productively otherwise.
5.5 Education budget. One of the issues that Pakistan keeps grappling with is the low
allocation of education budget.UNESCO (2010) reports that Pakistan has been consistently
spending around one percent on education for the last 20 years, mainly because of low priority.
Even todate the education budget is merely 2.4 percent of the total GDP, which has 94 percent
share of salaries of administration and teaching staff and six percent only for development
expenditure. This is an excessively low budget for the upgradation and uplift of education.
5.6 Lack of basic facilities. Most government schools lack clean drinking water, toilets,
furniture and teaching aids. Security is nonexistent. Both parents and girls, in particular, are
unwilling to attend schools where such facilities are unavailable or not working. Bajwa (2011)
contends that gender equality will remain elusive in Sindh and the reasons can be attributed to
insecure school environment and inadequate sanitation that disproportionately affect girls’ self-
esteem, their participation and school retention.
5.7Absentee and incompetent teachers.Teachers’ absenteeism and their incompetence
are major contributing factors in school retention. Ladd andVigdor(as cited in Alao, 2015) stress
that effective teachers have significant impact on students’ ability to learn.The issues connected
with teachers’ incompetence are politicized appointments, degrees acquired through unfair
means, unprofessional attitudes, lack of content and social-emotional knowledge, use of corporal
punishment and absence of any professional training or ethics. In such circumstances, parents are
loath to send their children to school as this will amount to a waste of time and energy.
5.8 Distant Commuting. A limited number of schools (primary, middle and secondary)
are functional in rural areas and children normally go to school on foot. Parents dislike sending
their daughters alone to schools as they may run the risk of abduction and other improprieties
which are prevalent in society. In the absence of secure and cheap means of transport for girls,
parents prefer restricting their girls to homes.
5.9 Unavailability of female teachers.Another key reason for girls’ low enrollment rates
and high dropout is the unavailability of female teaching staff. It is a proven fact that women are
better teachers, especially at primary levels. Malam (2005), in his study of the impact of gender
of teacher on students’ attitudes toward mathematics, found that female students learned
mathematics better when they were taught by female teachers. The lack of educated women in
rural areas and the requirement of a bachelor’s degree prevent motivated young women to get
into this profession. Parents prefer not to send their girls to schools where only male teachers are
present.
5.10 Poverty. Culturally and due to other socioeconomic factors, rural communities have
a bigger family network than their urban counterparts. Limited resources, especially in the rural
context drive parents to make choices for their children. The parents prefer their male child to be
educated as they think it benefits them in their future. UNESCO (2010) reports the same and
reiterates that a male child’s education is regarded as a good investment compared to a girl
child,because girls are expected early and leave the family. Girls’ education is therefore
considered as a monetary loss. Thus, the female child’s role is perceived to be limited to be a
helping hand for household errands, raising siblings and a caretaker. She may also be required to
work in the fields along with her mother.
5.11Early marriages.The rural-community system (bradari) forces early marriages
where parents primarily take it as a mark of safeguarding their family’s respect to get their girls
safely transferred to their husband’s family. Culturally, the girls’ fate is decided in childhood
through a promise in marriage to any male belonging to the same family or a similar community.
Another reason of early marriage is the scarcity of resources due to poverty. The family wants to
layoff the burden of an extra mouth to feed by handing over the daughter to her in-laws. It is
generally considered that education brings awareness and with awareness girls may start
questioning their docile existence. It is, therefore, generally conjectured that denial of the right to
education will keep the girls ignorant of their rights,hence subservient to the wishes of parents
and in-laws.
5.12 Failure to link education with livelihoods. Lack of employment or
entrepreneurship in Sindh prevents people from recognising that education is key to economic
prosperity. Most people strive for low paid government jobs that are promised on the basis of
political affiliations and have little to do with merit. People will get salaries whether they work
or not, and whether they have the necessary qualifications or not. The situation for girls is even
worse. In their case, there is little skill development or further income earning opportunities and
their education is not considered to be linked to market demands.
6. Budget Allocation for Education
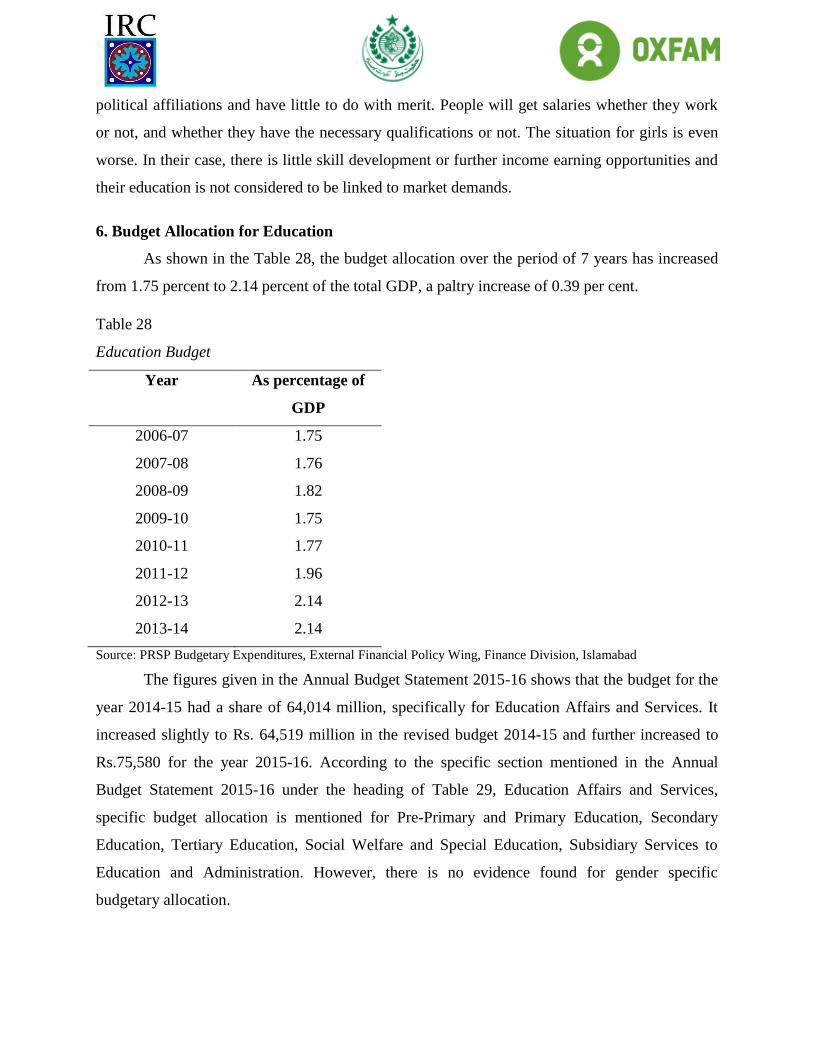
As shown in the Table 28, the budget allocation over the period of 7 years has increased
from 1.75 percent to 2.14 percent of the total GDP, a paltry increase of 0.39 per cent.
Table 28
Education Budget
Year As percentage of
GDP
2006-07 1.75
2007-08 1.76
2008-09 1.82
2009-10 1.75
2010-11 1.77
2011-12 1.96
2012-13 2.14
2013-14 2.14
Source: PRSP Budgetary Expenditures, External Financial Policy Wing, Finance Division, Islamabad
The figures given in the Annual Budget Statement 2015-16 shows that the budget for the
year 2014-15 had a share of 64,014 million, specifically for Education Affairs and Services. It
increased slightly to Rs. 64,519 million in the revised budget 2014-15 and further increased to
Rs.75,580 for the year 2015-16. According to the specific section mentioned in the Annual
Budget Statement 2015-16 under the heading of Table 29, Education Affairs and Services,
specific budget allocation is mentioned for Pre-Primary and Primary Education, Secondary
Education, Tertiary Education, Social Welfare and Special Education, Subsidiary Services to
Education and Administration. However, there is no evidence found for gender specific
budgetary allocation.
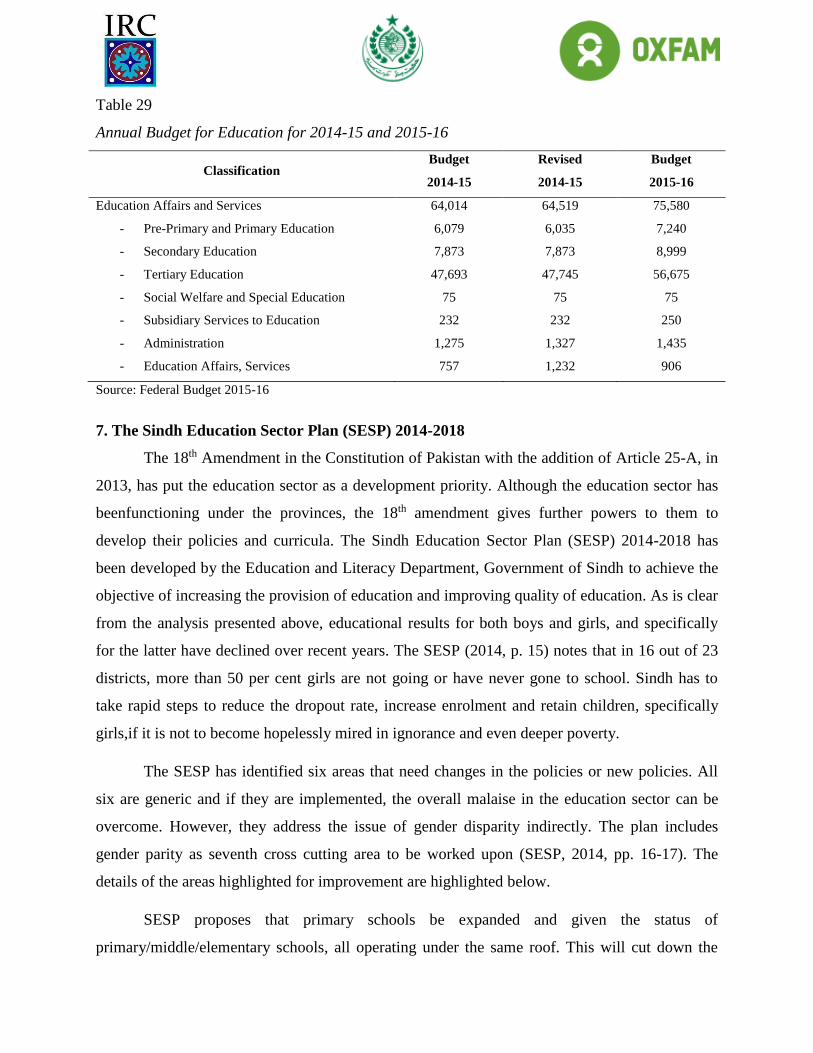
Table 29
Annual Budget for Education for 2014-15 and 2015-16
Classification Budget
2014-15
Revised
2014-15
Budget
2015-16
Education Affairs and Services 64,014 64,519 75,580
- Pre-Primary and Primary Education 6,079 6,035 7,240
- Secondary Education 7,873 7,873 8,999
- Tertiary Education 47,693 47,745 56,675
- Social Welfare and Special Education 75 75 75
- Subsidiary Services to Education 232 232 250
- Administration 1,275 1,327 1,435
- Education Affairs, Services 757 1,232 906
Source: Federal Budget 2015-16
7. The Sindh Education Sector Plan (SESP) 2014-2018
The 18th Amendment in the Constitution of Pakistan with the addition of Article 25-A, in
2013, has put the education sector as a development priority. Although the education sector has
beenfunctioning under the provinces, the 18th amendment gives further powers to them to
develop their policies and curricula. The Sindh Education Sector Plan (SESP) 2014-2018 has
been developed by the Education and Literacy Department, Government of Sindh to achieve the
objective of increasing the provision of education and improving quality of education. As is clear
from the analysis presented above, educational results for both boys and girls, and specifically
for the latter have declined over recent years. The SESP (2014, p. 15) notes that in 16 out of 23
districts, more than 50 per cent girls are not going or have never gone to school. Sindh has to
take rapid steps to reduce the dropout rate, increase enrolment and retain children, specifically
girls,if it is not to become hopelessly mired in ignorance and even deeper poverty.
The SESP has identified six areas that need changes in the policies or new policies. All
six are generic and if they are implemented, the overall malaise in the education sector can be
overcome. However, they address the issue of gender disparity indirectly. The plan includes
gender parity as seventh cross cutting area to be worked upon (SESP, 2014, pp. 16-17). The
details of the areas highlighted for improvement are highlighted below.
SESP proposes that primary schools be expanded and given the status of
primary/middle/elementary schools, all operating under the same roof. This will cut down the

distances students have to travel for higher classes. It is expected that this would strengthen the
retention rate in the middle/elementary class levels. This would also complement the probability
of increasing girls’ enrollment rate, along with the retention rate in the higher classes.
The second challenge is improving learning outcomes. Regular evaluations of learning
outcomes have been recommended in order to inform policy-making and drive budgetary
decisions. Teachers will also be provided with tools to conduct ongoing classroom-level
assessments of learning in core subjects such as reading and mathematics.
Improving teaching quality is the third challenge. One of the main strategies proposed is
fresh teacher recruitment on the basis of merit. Bachelor’s Degree in Education becomes a pre-
requisite for entering as a teacher along with having a Continuous Professional Development
(CPD) Programme as a long term teacher accreditation.
The fourth challenge is strengthening governance and service delivery. To address the
issue the, focus will be on increasing responsibility and resource availability at the district and
sub-district levels. SMCs will also be revitalized and a professional team will be developed.
The fifth challenge is improving resource allocation and for this purpose, education
sector financing will be revisited by proposing a series of improved measures.
The sixth challenge is adult literacy and non-formal basic education that will be tackled
by re-designing literacy and non-formal basic education by reducing dependency upon formal
classroom settings and devising an alternative plan by taking prospects of mass media and social
media.
7.1 SESP: objectives and strategies for gender parity and education. The main goal
of SESP for achieving gender parity in Sindh is to ensure gender equity in the provision of
education in Sindh. There are seven main objectives that SESP aims to achieve in its five year
vision for fulfilling its prime aim. These are commendable objectives and the suggestions made
to achieve them are doable, provided the stakeholders themselves are committed to accomplish
them.
The first objective is to guarantee the implementation of national laws and policies which
deal with gender disparities and gender-based violence. The strategies in order to accomplish this

target propose to have (i) regular gender audit at the provincial level for informing and
sometimes reinforcing policies and standards, (ii) rectifying cases relating to anti-harassment and
(iii) reviewing gender discriminatory legislation and its implementation at all levels of education
in the province.
The second objective is to develop management capacity to promote gender equality and
empower women. The strategies for fulfilling this objective are (i) relevant planning for
promoting gender equality at all levels in the system, (ii) establishment of Gender Focal Points
at district levels and (iii) gender sensitization.
The third objective is to ensure that the content, language and pictorial representation in
textbooks is free of gender bias. The approaches for fulfilling this objective include; (i)
establishment of a Gender Unit, (ii) review of the curriculum in relation to gender bias, (iii)
ensure provision/use of gender sensitive textbooks and teacher guides by removing gender
bias and (iv)on-going capacity building of curriculum designers, textbook writers and teacher
educators to promote gender equality.
The fourth objective is to mainstream gender as part of TED by 2015 and the strategy to
achieve is to ensure that gender is included in teacher education programmes as one of the
themes for teachers’ capacity building.
The fifth objective is to allocate budget for promotion of gender equality in education by
2015 and in order to fulfill this, intended strategy is to provide sufficient budget allocation and
implementation of all activities relating to gender equity.
The sixth objective is to strengthen linkages and coordination between line departments
on gender issues. In order to accomplish this objective the strategy would be to strengthen
cooperation and linkages of the Educational Department on gender planning and action
with key governmental agencies, e.g. Ministry of Women Development, Female
Parliamentarians, Ministry of Finance, Ministry of Health, and Government of Sindh.
The seventh objective is to set minimum quota for females at administrative level. The
proposed strategies are; (i) notify a task force, (ii) develop policy paper for female quota and
(iii) notify quota for females.( Note: but not female teachers).
8. Initiatives to Reduce Gender Gap
Several policy and field initiatives have been implemented over the past ten years, most
of which have been funded by foreign donor agencies. It would not be incorrect to say that very
little improvement has resulted, and policy and structural changes have not been internalisedby
the government system.
8.1-The National Education Policy (1998-2010). The National Educational Policy
(1998-2010)focused on improved enrollment rates in government schools. It also emphasised
upon increasing the education budget and reducing the gender imbalance, urban-rural divide, and
improving the quality of education at all levels. It advocated curriculum reform and improvement
in education facilities. It targeted the issue of out of school children and initiatives for non-
formal education.
8.2-Education Sector Reforms (ESR: 2001-2006). The Education Sector Reforms
(2001-2006) were formulated in view of the National Policy 1998-2010. The areas that were
prioritized were provision of quality primary education, enhanced allocation of budget up to
three percent of GDP, better public-private partnerships along with improved technical and
higher education. All the pertinent stakeholders were on board in developing this policy paper.
8.3The EFA National Plan of Action (2001-2015). Thiswas formulated and validated
by the first Poverty Reduction Strategy Paper (PRSP I 2003-2006). The objectives of the NPA
were (i) to guarantee access to education for disadvantaged rural and urban populace,
predominantly girls, (ii)encourage community involvement and ownership of basic education
programmes and (iii) improve the significance and quality of basic education (Iqbal, 2010).
Apart from the endorsement it received, it did not materialize into action due to the absence of
local and international monetary support.
8.4-The National Education Policy (2009).The National Education Policy, 2009was
developed through mutual consensus among all the stakeholders. A series of negotiations took
place by evaluating the deep rooted problems, contextual challenges, budgetary limitations,
future goals and commitments for the education sector. The policy was prepared with the
recommendations and participation of civil society, universities, federal and provincial
government officials, education experts, Higher Education Commission (HEC), National
Vocational and Technical Education Commission (NAVTEC), Institute of Educational
Development- Aga Khan University (IED-AKU), Academy of Education Planning and
Management (AEPAM), Pakistan Medical and Dental Council (PM&DC), Pakistan Engineering
Council (PEC), government of all the federating units along with academia, teachers, students
and parents. The NEP (2009) acknowledged the need for equity in educational opportunities and
realised that the education system based on a divisive foundation may create division in society
and can jeopardize the long run economic development and societal progression.
Amongst the aims and objectives the NEP (2009) adopted, two are mentioned here that
are specifically focused upon gender parity:
To equalize access to education through provision of basic facilities for girls and boys
alike, under-privileged/marginalized groups and special children and adults
To enable Pakistan to fulfill its commitments to achieve Dakar Framework of Action,
Education for All goals and Millennium Development Goals relating to education
8.5Right to Education (RTE) in Sindh Pakistan Article 25-A.Under the 18th
Amendment, the Sindh Government took an initiative in 2010 and appended the Right to
Education Article 25-A in the constitution of Pakistan in which it held itself responsible for
providing free and compulsory education to all the children of Sindh aged 5 to 16 years.
8.6-Tawana Pakistan- school nutrition package for rural girls.Tawana Pakistan
Project was developed and implemented by the National Implementation Unit (NIU) through
Pakistan Bait-ul-Mal (PBM) and The Aga Khan University (AKU) and its partner NGOs. The
project aimedto improve nutritional status, increase school enrollment and reduce dropout rate
of girls in the selected districts from each province across Pakistan. It was also aimed at reducing
the gender gap and creating awareness amongst communities regarding nutrition and its
importance. (Badruddin, Agha, Peermohamed, Rafique,, Khan, & Pappas, 2008). It was a Rs.
3,600 million mega social safety net intervention, to compensate for the nutritional and
educational deficit of 530,000 rural girls aged 5 to 12 years in 5,300 Government Girls Primary
schools of 29 high poverty districts of Pakistan. The school nutrition package offered the
provision of nutritionally balanced midday meal at the cost of Rs. 7.00, offering approximately
600 calories per meal, along with medicinal aid for deworming students’ stomachs and multi-
micronutrient supplements for two years. The selected districts from Sindh were Badin,
Tharparkar, Mirpurkhas and Thatta.
8.7School girls’ stipend through easy paisa/ATM card scheme by Government of
Sindh, Pakistan.In order to increase the enrollment rate, the Government of Sindh initiated a
girls’ stipend scheme through Easy Paisa and ATM card to 4,25,000 girls of class sixth to class
ten. In June, 2014, the Sindh Education Reform Programme (SERP) unit within the Government
of Sindh signed an agreement with Easy Paisa for educational stipend disbursements, in order to
improve girls’ access to school in rural areas. The main objective of this project is to address
gender disparity in education attainment in Sindh. Selected students have the liberty of using
specially designed ATM cards that can be operated in Easy paisa shops and all ATM machines
installed across Pakistan. The World Bank and the European Commission are also offering
support to this project through the International Development Association (IDA).
8.8-School feeding programme.The World Food Programme (WFP) and the Education
and Literacy Department Government of Sindh initiated a school feeding programme for girls’
primary education in Sindh. Five districts namely Dadu, Badin, Thatta, Jamshoro and Tharparkar
have been selected for the project for thedistribution of edible oil for the promotion of primary
education for girls in Sindh. Under this programme, 500 girls’ primary schools are covered,
where a tin of imported vegetable oil weighing 3.7 kg is distributed to girls who complete 20
days attendance requirement. The teachers can also benefit with this provision by proving 22
days of attendance in the school. The initiative is to motivate female students and female
teachers to attend the school.
9. Necessary steps to change the status quo
Numerous reports have been prepared to analyse the state of education and the issues that
continue to persist at national, provincial and district levels with regard to education
insufficiency and gender disparity. Policy documents and plans have been developed by
international consultants and projects have been implemented. Yet, the problems remain much
the same as before and any initiatives that are taken hardly seem to make a significant
improvement.
Some of the main steps that need to be taken are:
recogniseeducation for all as the top most priority
ensure enrollment through community engagement, incentives and improved facilities
including teacher attendance, ratio of teacher to students and number of female teachers
conduct an objective evaluation of performance of teaching staff
facilitate training and capacity building of teachers in their respective subjects
train and sensitize teachers on gender issues and the correct attitude, including language
they should adopt in and outside the classroom.
remove internal structural barriers and systems of recruitments
remove political interference in education sector
increase the education budget, balance out the developmental and non-developmental
allocation and prepare gender sensitive budgets.
review and revise curricula to remove gender stereotypical material
review the models implemented by civil society and adopt/upscale those that have
worked to enhance enrollment and quality of education
implement gender specific actions
link education with economic prosperity both for girls and boys
The above are some basic steps that must be taken if the objectives of the SESP are to be
met with any degree of success and if the increasing gender gap in education is to be reduced.
Unless this is done, Pakistan’s population will continue to increase at a high rate and standards of
education will remain at the lowest ebb. Further, given the present circumstances, Pakistan will
keep enduring economic and social challenges. This consistent socio-economic derailment needs
to be stopped at an emergency basis if Pakistan needs to compete in the international world
market.
References
1. Abu-Ghaida, D., &Klasen, S. (2004). The costs of missing the Millennium
Development Goal on gender equity. World Development, 32(7), 1075-1107.
2. Ackers, J., Migoli, J., &Nzomo, J. (2001). Identifying and addressing the causes of
declining participation rates in Kenyan primary schools.International Journal of
Educational Development, 21(4), 361-374.
3. Alao, I. F. (2015). Teacher Effectiveness among Female Teachers in Primary and
Secondary Schools in Southwestern Nigeria. Journal of Educational Leadership in
Action. Vol. 4 (1). Retrieved from:
http://webcache.googleusercontent.com/search?q=cache:PkFGUAgfNHsJ:www.linde
nwood.edu/ela/issue02/alao.html&hl=en&gl=pk&strip=1&vwsrc=0
4. AlifAilaan, (2014). 25 million broken promises: the crisis of Pakistan’s out-of-school
children.Retrieved from: http://www.alifailaan.pk/broken_promises.
5. Annual Status of Education Report (n.d.). Retrieved from:
http://www.aserpakistan.org/
6. Badruddin, S. H., Agha, A., Peermohamed, H., Rafique, G., Khan, K. S., & Pappas,
G. (2008). Tawana project—school nutrition program in Pakistan—its success,
bottlenecks and lessons learned. Asia Pacific Journal of Clinical Nutrition, 17(S1),
357-360.
7. Bajwa, A. (2011). Out of school children in Sindh: looking at access & equity.
Retrieved from:
http://aserpakistan.org/document/aser_policy_briefs/2011/Out_of_School_Children_i
n_Sindh_Looking_at_Access_and_Equity.pdf
8. Burrows, N. (1985). The 1979 convention on the elimination of all forms of
discrimination against women. Netherlands International Law Review, 32(03), 419-
460.
9. Blumberg, R. L. (2008). The invisible obstacle to educational equality: Gender bias in
textbooks. Prospects, 38(3), 345-361.
10. Brent, N. (2005). Achieving the promise of girls’ education strategies to overcome
gender based violence. In Beninese schools.
11. Chaudhary, I., S. &Rehman S. (2009). The Impact of Gender Inequality on Rural
Poverty in Pakistan: An Empirical Analysis. European Journalof Economics, Finance
and Administrative Sciences,15,174-188.
12. Claiming Human Rights (n.d.) Retrieved from:
http://www.claiminghumanrights.org/udhr_article_26.html#at28
13. Constitution of Pakistan (n.d.) Retrieved from:
http://www.infopakistan.pk/constitution-of-pakistan/article/37-Promotion-of-social-
justice-and-eradication-of-social-evils
14. Daraz,A. N. U., Khan, W., & Sheikh, I. (2013). Physical and Infrastructural Obstacles
to Women’s Education in Khyber Pakhtunkhuwa Pakistan. FWU Journal of Social
Sciences. SBB Women University Peshawar, 7(02), 139-145.
15. Desai, S. (2007). Gender disparity in primary education: The experience in India. UN
Chronicle.Vol. XLIV No.4. Retrieved from:http://unchronicle.un.org/article/gender-
disparity-primary-education-experience-india/
16. Filmer, D. (2005). Gender and Wealth Disparities in Schooling: Evidence from 44
Countries.International Journal of Educational Research, 43, 351–369.
17. Government of Pakistan. 2009. National Education Policy, 2009. Islamabad:
Ministryof Education.
18. Government of Pakistan, 2003.Constitution of the Republic of Pakistan,
1973.Islamabad: Government of Pakistan [online]. Retrieved from:
http://www.pakistanconstitutionlaw.com/const_resultss.asp?artid=251&title=National
%20language
19. Government of Pakistan, Ministry of Finance (2015). Retrieved from:
http://www.finance.gov.pk/budget/Budget_in_Brief_2015_16.pdf
20. Hausmann, R. (2014). Gender Gap Report 2014.
21. Hussain, A. (2015). Education system of Pakistan: Issues, problems and solutions.
Pakistan: IPRI Building Consensus. Retrieved from:
http://www.ipripak.org/education-system-of-pakistan-issues-problems-and-solutions/
22. Ifegbesan, A. (2010). Gender-stereotypes belief and practices in the classroom: The
Nigerian post-primary school teachers. Global Journal of Human-Social Science
Research, 10(4).
23. Iqbal, F. (2010), Why gender equality in Basic Education in Pakistan? UNESCO,
Islamabad.
24. Ismail, Z. H. (1996). Gender differentials in the cost of primary education: a study of
Pakistan. The Pakistan Development Review, 835-849.
25. Jabeen, S., Chaudhary, A. Q., & Omar, S. (2014). Gender Discrimination in
Curriculum: A Reflection from Punjab Textbook Board. Bulletin of Education &
Research, 36(1).
26. Jalal-ud-Din, M., & Khan, M. (2008). Socio-Economic and Cultural Constraints of
Women in Pakistan with Special Reference to Mardan District, NWFP
Province. Sarhad Journal of Agriculture, 24(3), 485-493.
27. Johnson, L. P. (1993). Education and “New” Inequality in Papua Guinea.
Anthropology andEducationQuarterly, 2,183-204.
28. Kumar, K., & Gupta, L. (2008). What Is Missing in Girls' Empowerment? Economic
and Political Weekly, 19-24.
29. Lloyd, C. B., Mete, C., & Grant, M. J. (2009). The implications of changing
educational and family circumstances for children's grade progression in rural
Pakistan: 1997–2004. Economics of Education Review, 28(1), 152-160.
30. Malam, W. A. (2005). Impact of school-type and sex of the teacher on female
student’ attitudes towards mathematics. Education Studies in Mathematics. 24 92),
223-229.
31. Pakistan Annual Report (2013) Islamabad: United Nations Children’s Fund.
Retrieved from:
http://www.unicef.org/pakistan/FINAL_UNICEF_Annual_Report_2013_-
_Version_11.1.pdf
32. Pakistan Education Statistics (n.d.) Retrieved from:
http://www.aepam.edu.pk/Index.asp?PageId=18
33. Pakistan Bureau of Statistics (2014). Retrieved from:
http://www.pbs.gov.pk/content/pakistan-social-and-living-standards-measurement
34. Rahji, M.A.Y. (2005). Primary School Enrolment and Gender Gap of Rural
Households: Children in South Western Nigeria. Retrieved
from:www.saga.cornell.edu/saga/educconf/rahji.pdf
35. Reform Support Unit (n.d.) retrieved
from:http://www.rsusindh.gov.pk/units/sindhEducationProfile2013-14.php
36. Ray, R. (2000). Child labor, child schooling, and their interaction with adult labor:
Empirical evidence for Peru and Pakistan. The World Bank Economic Review, 14(2),
347-367.
37. Sandhu, T.A., Chaudhry, A., Akbar, N., Ahmad, I (2005)Effect of Socio-Economic
Factors on the female education inrural Areas of Faisalabad (Pakistan). Journal
of Agriculture & Social Sciences. (pp.1813–2235) 01–1–41–42. Retrieved from:
http://www.ijabjass.org
38. Sather, Z. and Lloyd, C. (1994)."Who Gets Primary Schooling in Pakistan:
Inequalities Among and Within Families" New York: The Population Council
Working Paper No. 52.
39. Shaw, D. J. (2007). International Conference on Population and Development, 1994.
In World Food Security (pp. 321-327). Palgrave Macmillan UK.
40. Sindh Budget (2014). Retrieved from: www.incpak.com/sindh/sindh-budget-2014-15/
41. Sindh Education sector Plan (2014). Retrieved from:
http://www.sindheducation.gov.pk/Contents/Menu/Final%20SESP.pdf
42. Statistical Bulletin (2012). Retrieved from:
http://www.sbp.org.pk/reports/stat_reviews/Bulletin/2012/Feb/
43. Sustainable Development Policy Institute (n.d.) Retrieved from:
http://www.sdpi.org/research_programme/researchproject-259-24-38.html
44. The Dakar Framework for Action (2000). Retrieved from:
http://www.unesco.at/bildung/basisdokumente/dakar_aktionsplan.pdf
45. The Global gender Gap Report (2006). Retrieved from:
http://www3.weforum.org/docs/WEF_GenderGap_Report_2006.pdf
46. The State of the World’s Children (2003). New York: The United Nations Children’s
Fund. Retrieved from: http://www.unicef.org/sowc04/files/SOWC_O4_eng.pdf
47. UNESCO (2006).Institute of Statistics (UIS) Literacy and NonFormal Education.
Wessington DC, Retrieved from: www.worlldbank.org visited on 13-06-2007.
48. United Nations Department of Economic and Social Affairs, Population Division
(2015). Retrieved from: http://populationpyramid.net/pakistan/1955/

49. United Nations Educational, Scientific and Cultural Organization (2010). Why gender
equality in basic education in Pakistan. Islamabad: UNESCO.
50. United Nations Universal Declaration of Human Rights (1948). Retrieved from:
http://www.supremecourt.ge/files/upload-file/pdf/act3.pdf
51. World Bank. (2001). Engendering Development: Throughgender equality in rights,
resources, and voice. NewYork: Oxford University Press.
52. World Bank, (2002).Education and HIV/AIDS.A window of hope. Washington DC:
The International bank for Reconstruction and Development/ The World Bank.