GEE Papers · GEE Papers Número 20 Setembro de 2009 Outward FDI Effects on the Portuguese Trade...
31
Av. da República nº. 79 1050 – 243 Lisboa Telf: (351) 217998150 Fax: (351) 217998154 Web Site: www.gee.min-economia.pt ISSN 1647-6212 GEE Papers Número 20 Setembro de 2009 Outward FDI Effects on the Portuguese Trade Balance, 1996-2007 Miguel Fonseca António Mendonça José Passos
Transcript of GEE Papers · GEE Papers Número 20 Setembro de 2009 Outward FDI Effects on the Portuguese Trade...

Av. da República nº. 79 1050 – 243 Lisboa Telf: (351) 217998150 Fax: (351) 217998154 Web Site: www.gee.min-economia.pt ISSN 1647-6212
GEE Papers Número 20 Setembro de 2009
Outward FDI Effects on the Portuguese Trade Balance, 1996-2007
Miguel Fonseca António Mendonça
José Passos

GEE Outward FDI Effects on the Portuguese Trade Balance, 1996-2007 - Miguel Fonseca, António Mendonça and José Passos
Outward FDI Effects on the Portuguese Trade Balance, 1996-2007
Miguel Fonseca
Faculdade de Economia da Universidade do Porto Rua Dr. Roberto Frias 4200-464 Porto; Tel.: +351 225 571 100; E-mail: [email protected] António Mendonça
Instituto Superior de Economia e Gestão / Universidade Técnica de Lisboa Rua do Quelhas, n.º 6 1200-781 Lisboa; Tel.: +351 213 925 800 / 900; E-mail: [email protected] José Passos
Instituto Superior de Economia e Gestão / Universidade Técnica de Lisboa Rua do Quelhas, n.º 6 1200-781 Lisboa; Tel.: +351 213 925 800 / 900; E-mail: [email protected] Classificação JEL codes: F21; C23; F14 Keywords: Foreign Direct Investment, Trade, Gravity Model, Portugal Abstract
Given the increased internationalisation of the Portuguese economy through outward Foreign Direct
Investment (FDI), particularly on the Portuguese-speaking countries, our main objective is to discuss the
empirical relationship between this outward FDI and trade.
We use panel data analysis within a framework of gravity equations for exports and imports, with a sample
composed by EU-15, U.S.A., Brazil, Angola, Japan and China, for the period 1996-2007. Our main
conclusion is that the empirical evidence for Portugal is consistent with a substitution hypothesis between
direct investment abroad and trade, and consequently we detect a negative trade balance effect with the
majority of countries in our sample, excepting Angola and, in a lesser extension, Spain.
GEE
Outward FDI Effects on the Portuguese Trade Balance, 1996-2007. Miguel Fonseca, António Mendonça, José Passos.
3
Index
1. Introduction 5
2. Outward FDI effects on trade – Theoretical background 5
3. Empirical studies 8
4. Our study 15
4.1. Data and methodology 15
4.2. Results 17
5. Conclusions 19
References 21

* University of Porto – Faculty of Economics ** Technical University of Lisbon – School of Economics and Business Administration
Outward FDI Effects on the Portuguese Trade Balance, 1996-2007
Miguel Fonseca *
António Mendonça **
José Passos **
ABSTRACT
Given the increased internationalisation of the Portuguese economy through outward
Foreign Direct Investment (FDI), particularly on the Portuguese-speaking countries, our
main objective is to discuss the empirical relationship between this outward FDI and trade.
We use panel data analysis within a framework of gravity equations for exports and imports,
with a sample composed by EU-15, U.S.A., Brazil, Angola, Japan and China, for the period
1996-2007.
Our main conclusion is that the empirical evidence for Portugal is consistent with a
substitution hypothesis between direct investment abroad and trade, and consequently we
detect a negative trade balance effect with the majority of countries in our sample,
excepting Angola and, in a lesser extension, Spain.
Keywords: Foreign Direct Investment, Trade, Gravity Model, Portugal
JEL Classification: F21, C23, F14

5
1. Introduction
The main objective of this paper is to analyse the effect emanating from Portuguese
outward Foreign Direct Investment (FDI) on exports and imports with its main economic
partners, in the period between 1996 and 2007.
This study seemed particularly relevant to us for two reasons. Firstly, we want to participate
on the debate that has emerged in the last decade about what happens in home country
when national firms become increasingly multinational. Before, the discussion on the
effects of multinational firms tended to be focused on host countries, i.e. the countries
where they operate.
Secondly, we want to evaluate if the complementary relationship between foreign
production and trade, shown in most studies for traditionally outward investor economies
(the most developed nations) also holds for a country like Portugal, where outward FDI is a
more recent phenomenon.
The paper is structured as follows: section 2 presents the theoretical background of our
research; section 3 briefly reviews the previous empirical studies regarding the question in
analysis and section 4 contains the description of data and econometric methodology,
jointly with the presentation of main empirical results. Finally, section 5 presents the
conclusions and further research questions.
2. Outward FDI effects on trade – Theoretical background
Traditionally, there has been a divergence in terms of the theories on FDI and international
trade: the latter try to explain why countries trade with each other and the former try to
account for why firms produce and invest outside its borders.

6
In the neoclassical approach of trade theory, Mundell (1957) was the first to focus on the
relationship between capital movements and trade of goods, demonstrating that FDI and
exports become substitutes for each other. Upon the assumptions of the Heckscher-Ohlin-
Samuelson (HOS) general equilibrium model, the flows of FDI depend on the differences
in factor price and factor endowment between countries. So, he showed that the
international movement of capital driven by FDI displaces the movement of those goods
produced in a capital-intensive manner, leading to an equilibrium in which factor prices and
product prices have the same characteristics as in the free trade equilibrium.
We can say that the substitution effect plays a prominent role in theory, like in the product
cycle model developed by Vernon (1966), in which he considered that FDI affiliates´
production and sales in foreign market replace trade in the same market. Additionally, the
theory of internalization (Williamson 1975; Markusen 1984) suggested that FDI substitutes
for exports when there are sufficient costs to external transactions such as exporting or
licensing. Moreover, the eclectic theory or OLI paradigm introduced by Dunning (1981),
whose basic assumption is that a firm will engage in international production (i.e. become
multinational) instead of exporting when it possesses at the same time ownership, location
and internalization advantages, also considered trade and FDI as alternative strategies.
Over the last two decades, some models were developed in order to incorporate the concept
of the multinational enterprise (MNE) into the standard theory of international trade. They
show that the results on the relationship between capital movements and trade depend on
whether the foreign operations are in goods industries or in services, are in developed or
developing countries, and specially if the foreign operations´ relation to home operations is
“horizontal” or “vertical”. In the first case, the MNE produces the same goods in their

7
home country and in multiple plants located in the host countries, and so the same
(horizontal) stage of the production process is duplicated. This type of FDI is a mean to
avoid some costs like trade barriers, transportation costs and other transaction costs that
discourage exports, and is also known as market-seeking FDI, because is driven by market
considerations.
In the second case, the firms fragment the production process geographically and locate
specific stages of the value chain if countries that have factor-price differences. This type of
FDI is motivated by cost considerations and it is also known as efficiency-seeking FDI.
The models based on horizontal FDI, such as Markusen (1984) and Markusen and Venables
(1995) consider that the choice of MNEs is determined by factors such as the firm specific
advantages (activities of research and development, marketing, managerial know.how, etc.),
the firm- and plant-level economies of scale and transport costs. The firm faces the
dilemma of either producing abroad or exporting and naturally the substitutability between
such foreign investments and trade tends to prevail.
On the other hand, the theoretical contributions of Helpman (1984) and Helpman and
Krugman (1985) show that outward FDI and trade might be complements. That occurs in
the case of vertical FDI, as it generates complementary trade flows of final goods from
foreign affiliates to parent firms or to the home country and intra-firm transfers of
intangible headquarter services from parent firms to foreign affiliates. Lipsey and Weiss
(1984) argue that one way by which complementarity occurs is when a firm´s production
presence in a foreign market with one product may increase total demand for the whole line
of products.

8
Recent studies like Carr et al. (1998) attempted to combine both horizontal and vertical
motives for FDI. They basically imply that horizontal FDI is more prevalent with countries
that are similar in market size, relative factor endowments and technical efficiency and
vertical FDI arises when countries differ substantially in terms of factor endowments.
Accordingly to them, trade and FDI between developed countries could be regarded as
substitutes while between developed and developing countries tend to be complements.
Thus, as both substitution and complementary effects can occur, the main conclusion of the
theoretical literature is that the impact of outward FDI on home country´s exports is not
predicable a priori by any economic theory, but it is mainly an empirical question
3. Empirical studies
The question regarding the impact of outward foreign investment on domestic exports has
been addressed all over the years in several countries by two different ways, which means
that there is quite some variation in methodology and generality of results: the business-
oriented authors analyses have attempted to examine what would have happened in specific
cases if investment abroad had not been possible, and the econometric studies have tried to
detect the overall relationship between FDI and home country exports in larger samples of
firms or industries.
In what refers the business-oriented analyses, we can highlight the earliest contributions of
Stobaught et al. (1972), who studied nine U.S. firms, and Jordan and Vahlne (1981) whose
study aims to compare the domestic effects of foreign direct investment with alternative
ways (like exports, licensing, and minority joint ventures) to exploit the competitive
advantages of a sample of Swedish firms. The overall conclusion they reached is that
9
foreign direct investment has positive effects on home country exports and employment,
particularly for low-technology products with high transportation costs, because the
establishment of foreign affiliates resulted in large increases in the foreign market shares
and in exports of intermediate products to affiliates. However, these results were based on
very specific assumptions about export survival rates, i.e. the fractions of the affiliates’
market share that could have been served by home exports, which were very low,
concluding that most of the foreign markets have been lost in the absence of FDI.
So, these assumptions were criticized by Frank and Freeman (1978: 9), who noted that the
estimates of survival rates are often based on surveys and interviews with company
officials. They proposed a more “neutral” approach and used an alternative model for the
U.S. economy, estimating survival rates from data on costs, revenues and demand
conditions. Their calculations suggested survival rates ranging between 20 and 40 per cent,
depending on industry, implying that foreign direct investment substituted for U.S. exports
and that the net employment effect of FDI was negative.
The discussion about what is the appropriate counterfactual remains one of the core
questions in this kind of studies, and it is likely that this debate will continue, probably with
mixed results depending on assumed survival rates. In one of the most recent contributions
Barba Navaretti and Castellani (2004:4) observed that “the effects of outward investment
on home activities are not relevant per se, but with respect to what would have happened if
firms had not invested abroad”. In this study, they use propensity score matching to
compare the performance of a group of Italian firms that do not invest abroad and another
of Italian outward investors, and their results suggest that outward FDI has no significant

10
effect on employment growth, at the same time that significantly enhances the rate of
productivity growth and output.
This problem of assessing survival rates and counterfactuals does not usually come up in
the other type of studies about the relationship that we are analyzing. Indeed, the
econometric studies usually employ regression analysis to determine the relation between
exports and various firm, industry, and country characteristics. Controlling for as many
other determinants as possible, the focus is on the partial effect of FDI — a negative
coefficient implies that foreign production substitutes for exports, whereas a positive sign
suggests that the opposite effect of complementarity, i.e. the stimulus to home exports of
intermediate and other related products, prevails in aggregate.
The most relevant econometric studies developed over the last three decades were about
countries with large experience and high levels of outward investment, like U.S.A., Sweden,
Japan and France. The majority of them predict a positive relationship between outward
FDI and domestic exports, and can be divided according to the level of aggregation used.
Starting by the analysis on country-level, they show dominantly a complementary effect. In
this context, Swedenborg (1979, 1982 and 2001), Blomstrom, Lipsey, and Kulchycky
(1988), and Svensson (1996) all based their studies on data from Swedish multinationals,
although there are significant differences in the methodology used and the considered time
period. The major innovation in both of Swedenborg's analyses was the introduction of
2SLS (two-stage least squares) estimations, in order to deal with the endogeneity of exports
and the mutual determination with investment, i.e. the fact that both foreign production and
exports may be affected by the same omitted variables. Her findings suggest that there was

11
no significant overall effect, or a small positive effect, of foreign production on the exports
of Swedish enterprises.
The findings in Blomstrom, Lipsey, and Kulchycky (1988) do not differ significantly from
those presented by Swedenborg. They concluded about no signs that large foreign
production in a country reduces the country's subsequent imports from Sweden and so there
are mainly positive relationships between outward FDI and exports growth, with exception
of one major industry – metal manufacturing – in which an opposite effect was found.
Svensson (1996) focus his analysis on the developments during the late 1980s and early
1990s and challenged the results of these studies, arguing that is necessary to account for
the foreign affiliates’ exports to third countries, because they are likely to substitute directly
for parent exports. Doing this, he found a substitution effect (relatively small) between
Swedish investment abroad and exports from Sweden. The increasing preference among
Swedish MNEs for acquisitions rather than greenfield ventures as mode of foreign market
entry is likely to strengthen this conclusion. Since acquired affiliates have already
established linkages with local suppliers and subcontractors, they are less dependent on
imports of intermediates from the home country, at least in the short run.
Braunerhjelm and Oxelheim (2000) also analyse this relationship on Swedish economy and
argue it may vary depending on industry characteristics. They found that outward FDI and
exports tend to be complements in industries that rely on immobile natural resources
(Heckscher-Ohlin industries), but that they may be substitutes in industries relying on
technology, brand names, and other intangible assets (Schumpeter industries).

12
In this context, we can also refer Eaton and Tamura (1994), who analyse the American and
Japanese bilateral flows of trade and FDI with a hundred of partners for the period 1985-
1990. They used a modified gravity model, by which each variable of internationalisation
(export, import, inward FDI and outward FDI) is explained by the population of the partner
country, its income per capita, its density and its endowment in human capital, finding for
the Japan and U.S.A. a strong correlation between outward FDI and exports, as well as for
imports. In contrast, Andersen and Hainault (1998) used time-series analysis and find
evidence of complementarity between exports and outward FDI flows for U.S.A., Japan
and Germany, but no significant relationship for the United Kingdom.
Using two panel data sets on the operations of 29 U.S. multinational firms abroad and the
operations of foreign affiliates operating in the United States, Clausing (2000) find a strong
positive effect of outward FDI on exports, particularly when the intra-firm trade is
considered. Finally, the time-series analysis of Alguacil and Orts (2002), for the period
1970-1992, found evidence of a positive Granger-causality from Spanish FDI to exports.

13
Considering the studies on industry-level, they have mixed results. Lipsey and Weiss (1981)
consider 44 foreign markets in which U.S. firms compete against 13 other exporting
countries in 1970 and found a positive effect. According to them, and depending on the
industry, one dollar of local sales leads to a 2 cents to 78 cents of additional exports to the
corresponding market, at the same time that the production of U.S. affiliates abroad
substituted for exports to the host country of third countries. In a later study, the same
authors (Lipsey and Weiss 1984) analyzed foreign production and U.S. exports in 14
industries in the manufacturing sector, obtaining a positive and significant relationship in
11 of them.
Focusing on bilateral trade and direct investment relationships for France, Fontagné and
Fajot (2002) found complementary relationship between outward FDI flows and net exports
both for countries as a whole and for individual industries. Furthermore, the impact of
outward FDI on trade is much larger impact when spillovers between sectors are considered.
A similar conclusion was obtained by Chédor, Mucchielli and Soubaya (2002), whose
analysis on panel data for individual French firms reported complementarity between direct
investment abroad and home country exports.
Also the analysis who used data from Japan (Lipsey, Ramstetter and Blomstrom 2000) and
Australia (Productivity Commission 2002) concluded about a positive effect of outward
investment on home exports in the minority of industries where it can be discerned.
At this level of aggregation, there have been some studies who concluded about the
opposite effect, but in a lesser dimension. That was the case of Graham (1996), whose
analysis for years 1983, 1988 and 1991 demonstrate a predominant complementarity
relation between U.S. outward FDI and exports, but also a confirmation of the substitution

14
hypothesis. It deserves specially relevance Brainard (1997) whose cross-section analysis for
1989 of total sales, exports and imports of the U.S. MNEs affiliates, in 27 markets, found
evidence of a strong substitution effect on industry level, that he called “proximity-
concentration trade off”. According to him, when the income per capita of the destination
market catches up the U.S. level, the U.S. multinationals tend to substitute FDI for exports.
Referring to studies with firm-level data, Lipsey and Weiss (1984) used information on
intermediate versus finished products within the firms in their sample. They found, in 1970,
a strong complementary relationship between the U.S. affiliates production of intermediate
goods in the host country and the exports in the same region. At the same time, this relation
becomes weaker and even negative when finished goods are taken into account. Head and
Ries (2001) used a panel data set to examine the relation between outward production and
exports for 932 Japanese manufacturing firms, over the period 1966-1990. They concluded
about a net positive effect, but also important differences across firms. In particular, those
firms that are not vertically integrated and are unlikely to ship intermediate inputs to
overseas production affiliates show evidence of substitution.
In a recent empirical study for companies from 10 European countries, Oberhofer and
Pfaffermayr (2007) confirmed the complementarity hypothesis between FDI and exports
and, at the same time, stated that a considerable number of firms use a combination of both
FDI and exports to serve foreign markets.
Finally, using product-level data, Blonigen (2001) found that both effects may arise,
depending on the nature of the relationship between parents and foreign affiliates: he
detected for the period 1978-1994 a substitution effect between the production of Japanese
automobile parts in the U.S. and Japanese exports of the same products to the U.S., at the

15
same time that a complementarity between Japanese automobiles (final goods) production
in the U.S.A. and Japanese exports of automobile parts. In a recent study, Türkan (2006)
used a panel data analysis and identified for the period 1989-2003 a strong complementary
relation for intermediate goods and a slight negative effect for finished goods.
Thus, the main conclusion emerging from the empirical studies on the effects of outward
FDI on home-country exports is that positive associations are more common, although
there are some examples of negative correlations. The most relevant explanations for
diverging results is the level of aggregation used and, at the same time, we should also
consider “the frequency of results indicating no association in either direction” (Lipsey
2002, p.12).
4. Our study
4.1 Data and methodology
The main sources of this research were the Banco de Portugal Statistical Database, for data
on trade (exports and imports) and outward FDI, and Eurostat for data on GDP, both
measured in Mio Euro. We have also collected data on population from United Nations and
Eurostat, and on straight line distance between Lisbon and the other countries´ capital city
from www.globefeed.com.
Our data cover a 12-year period (1996-2007) and, being Portugal the home country, the
sample is composed of 18 host countries – UE15 (considering Belgium and Luxembourg
together), U.S.A., Angola, Brazil, China and Japan.
The following table contain the descriptive statistics for the totality of sample, while in the
appendix we present the same information by country, taking in account that for some of

16
the countries there are only nine temporal statistic moments because data on GDP are only
available after 1998.
Table 1: Summary statistics (totality of sample)
. summarize Variable | Obs Mean Std. Dev. Min Max -------------+-------------------------------------------------------- exp | 216 1345810 1815718 17796 1.07e+07 imp | 216 1902801 2908322 5896 1.69e+07 inv | 216 1284299 1782580 4 6314408 gdp | 207 1385983 2254599 5782.511 1.13e+07 pop | 216 1.24e+08 2.85e+08 3620065 1.31e+09 dist | 216 3698.571 2925.815 516.05 11145.27 -------------+--------------------------------------------------------
In this paper, we use random-effects panel data analysis within a framework of gravity
equations for exports and imports.
On the one hand, gravity models have been strongly used in the empirical literature on the
determinants of FDI and trade. They were formulated in analogy with Newton’s law of
universal gravitation (two objects attract each other in direct proportion of their masses and
in inverse proportion of the distance separating them) to explain the volume of trade and
capital flows among countries. Their basic assumption is that exports and imports are positively
related to GDP per capita and population, interpreted in terms of effective demand and market
size, and negatively to distance, as a proxy for transportation costs. Additionally to these
standard variables, in the present study we include outward FDI as an explanatory variable,
whose coefficient reflects the substitution or complementarity effect on trade.
On the other hand, panel data or longitudinal data is an increasingly popular technique of
analysis, with several advantages over conventional cross-section or time-series models.
The major one is that panel data endows regression with both a spatial and temporal
dimension, and thus it follows the same cross-sectional units (countries, states, firms,

17
households) over a particular time span. Furthermore, it gives the researcher a large number
of observations, increasing the degrees of freedom and hence improving the efficiency of
econometric estimates. In our study, we use random-effects panel data model because it
allows for time-invariant variables (like distance) to be included among the regressors.
4.2 Results
Before interpreting the estimation results, presented in Tables 2 and 3, we should refer that
we use the logarithmic form of the variables1, and thus each one represent:
lexp the log of Portuguese exports for host country,
limp the log of Portuguese imports from host country,
lgdpcap the log of host country´s GDP per capita,
lpop the log of host country´s population,
ldist the log of distance between Lisbon and the host country´s capital city,
inv* the log of Portuguese direct investment in host country, with ang=Angola, bra=Brazil,
usa=U.S.A., jap=Japan, chi=China, spa=Spain and eu=EU15 without Spain.
Table 2: Estimation model for exports
. xtreg lexp lgdpcap lpop ldist linvang linvbra linvusa linvjap linvchi linvspa linveu, re Random-effects GLS regression Number of obs = 207 Group variable: id Number of groups = 18 R-sq: within = 0.4896 Obs per group: min = 9 between = 0.8240 avg = 11.5 overall = 0.8118 max = 12
1 As a consequence, the coefficients are expressed in terms of elasticities, measuring the responsiveness of
trade flows with regard to percentage changes in the independent variable

18
Random effects u_i ~ Gaussian Wald chi2(10) = 283.00 corr(u_i, X) = 0 (assumed) Prob > chi2 = 0.0000 ------------------------------------------------------------------------------ lexp | Coef. Std. Err. z P>|z| [95% Conf. Interval] -------------+---------------------------------------------------------------- lgdpcap | .5744213 .0739333 7.77 0.000 .4295148 .7193278 lpop | .8010306 .0995913 8.04 0.000 .6058353 .9962259 ldist | -.7429428 .2874844 -2.58 0.010 -1.306402 -.1794838 linvang | .1573063 .0332695 4.73 0.000 .0920992 .2225134 linvbra | -.0773881 .0390169 -1.98 0.047 -.1538598 -.0009165 linvusa | -.0512798 .0432297 -1.19 0.236 -.1360085 .0334489 linvjap | -.2102121 .0604741 -3.48 0.001 -.3287393 -.091685 linvchi | -.3582747 .0722592 -4.96 0.000 -.4999001 -.2166494 linvspa | .0795772 .0399897 1.99 0.047 .0011988 .1579556 linveu | -.0083314 .0115327 -0.72 0.470 -.0309351 .0142724 _cons | 7.970356 2.507655 3.18 0.001 3.055443 12.88527 -------------+---------------------------------------------------------------- sigma_u | .42016864 sigma_e | .18742516 rho | .83404256 (fraction of variance due to u_i) ------------------------------------------------------------------------------
Concerning the relationship between Portuguese outward FDI and exports, the results
reported in Table 2 depend on the partner country. For Angola, we observe a positive and
highly significant correlation (the respective coefficient shows that a 1% increase in
Portuguese FDI in this country implies a 0.16% increase in exports) and there is also
evidence of a complementarity effect for Spain, at 5% significance level. By other way, we
find a very significant substitution effect for Japan and China (a 1% increase in Portuguese
FDI in these economies is associated with 0.21% and 0.36% decreases in exports,
respectively) whereas in case of Brazil such negative relationship is significant at 5% level.
Table 3: Estimation model for imports
. xtreg limp lgdpcap lpop ldist linvang linvbra linvusa linvjap linvchi linvspa linveu, re Random-effects GLS regression Number of obs = 207 Group variable: id Number of groups = 18 R-sq: within = 0.3742 Obs per group: min = 9 between = 0.8789 avg = 11.5 overall = 0.8424 max = 12

19
Random effects u_i ~ Gaussian Wald chi2(10) = 217.43 corr(u_i, X) = 0 (assumed) Prob > chi2 = 0.0000 ------------------------------------------------------------------------------ limp | Coef. Std. Err. z P>|z| [95% Conf. Interval] -------------+---------------------------------------------------------------- lgdpcap | .7875787 .103995 7.57 0.000 .5837522 .9914052 lpop | .9251523 .1226934 7.54 0.000 .6846777 1.165627 ldist | -1.087938 .375721 -2.90 0.004 -1.824338 -.3515383 linvang | .1080935 .0445392 2.43 0.015 .0207983 .1953886 linvbra | .0356726 .0504695 0.71 0.480 -.0632459 .1345911 linvusa | -.0905869 .0552145 -1.64 0.101 -.1988053 .0176314 linvjap | .0079596 .0804228 0.10 0.921 -.1496662 .1655854 linvchi | -.0170666 .1010815 -0.17 0.866 -.2151827 .1810495 linvspa | .0345169 .050541 0.68 0.495 -.0645418 .1335755 linveu | .0325443 .0169438 1.92 0.055 -.000665 .0657535 _cons | 9.092187 3.370479 2.70 0.007 2.486171 15.6982 -------------+---------------------------------------------------------------- sigma_u | .52937068 sigma_e | .29872086 rho | .75847901 (fraction of variance due to u_i) ------------------------------------------------------------------------------
Similarly to exports, the impact of outward FDI on imports, expressed in Table 3, depends
on the partner country. Thus, we detect a significant complementarity effect for Angola (a
1% increase in Portuguese FDI implies a 0.1% growth of imports), but weaker than for
exports, and also a positive correlation for European Union countries without Spain. In
what refers to Brazil and Spain, the positive relationships observed are not statistically
significant.
For the two models, the coefficients associated to GDP per capita, population and distance
have the expected sign and are highly significant. So, both exports and imports are
increasing in the partner country´s population as well as its per capita income, and
decreasing in distance between Portugal and the partner country.
5. Conclusions
The results we achieved on this paper confirm that the impact on home country´s trade of
the increased internationalisation of the Portuguese economy on the last decade,

20
transforming the country to a net exporter of capital, is not predicable with certainty and
must rely on empirical evidence.
In this context, our main conclusion is that, contrarily to most of the previous empirical
works, the Portuguese outward FDI is negatively related to exports suggesting a
substitution effect, and thus a negative trade balance effect, for the majority of countries in
our sample. The exceptions to this tendency were Angola and, in a lesser extension, Spain,
for which the effect on exports outweighs that on imports, and consequently direct
investments abroad have a positive contribution to the trade balance of Portugal with these
countries. This finding is particularly relevant, and may act as a stimulus to a stronger
Government support to outward FDI, taking in account that Spain is Portugal´s top trading
partner (with a share of about one third of the country´s international trade) while Angola is
a former colony which was in 2007 the sixth most important client of Portuguese products
and a growing destination for Portuguese investment overseas.
The present study requires further analysis with more disaggregated data that would allow
us to evaluate how outward FDI affected trade within the manufacturing sector, as well as
to apply a more sophisticated model than the gravity model we used. Unfortunately those
data are not available in Portugal, so that this constraint could be overcome by case studies
on major outward firms.

21
REFERENCES
AFRICANO, A.P. and MAGALHÃES, M. (2005), “FDI and Trade in Portugal: a gravity
analysis”, FEP Working Papers, no. 174, Porto
ALGUACIL, M. and ORTS, V. (2002), “A Multivariate Cointegrated Model Testing for
Temporal Causality between Exports and Outward Foreign Investment: the Spanish Case”,
Applied Economics, 34, pp. 119-132
ANDERSEN, P.S. and HAINAULT, P. (1998), “Foreign Direct Investment and
Employment in the Industrial Countries”, Bank for International Settlements Working
Paper, 61
BARBA NAVARETTI, G. and CASTELLANI, D. (2004), “Investment Abroad and
Performance at Home: Evidence from Italian Multinationals”, CEPR Discussion Paper, no.
4284, London
BARBA NAVARETTI, G., VENABLES, A.J. et al. (2004), Multinational firms in the
world economy, Princeton University Press, Princeton
BLOMSTRÖM, M., and KOKKO, A. (1997), “Home Country Effects of Foreign Direct
Investment: Evidence from Sweden”, NBER Working Paper, no. 4639, Cambridge
BLOMSTRÖM, M. and KOKKO, A. (1998), “Multinational Corporations and Spillovers”,
Journal of Economic Surveys, vol. 12: pp. 247-277
BLOMSTRÖM, M., LIPSEY, R.E. and KULCHUCKY, K. (1988), “US and Swedish
Direct Investment and Exports” in R. Baldwin, ed., Trade Policy Issues and Empirical
Analysis, University of Chicago Press, Chicago

22
BLONIGEN, B. (2001), “In Search of Substitution Between Foreign Production and
Exports”, Journal of International Economics, no. 53: pp. 81-104
BLONIGEN, B. (2005), “A review of the empirical literature on FDI determinants”, NBER
Working Paper, no. 11299, Cambridge
BRAINARD, S.L. (1997), “An Empirical Assessment of the Proximity-Concentration
Trade-Off between multinational Sales and Trade”, American Economic Review, vol. 87,
no. 4, pp. 520-544
BRAUNERHJELM, P. and OXELHEIM, L. (2000), “Does Foreign Direct Investment
Replace Home Country Investment? The Effect of European Integration on the Location of
Swedish Investment”, Journal of Common Market Studies, vol. 38, no. 2: pp. 199-221
CARR, D.L. et al. (1998), “Estimating the Knowledge-Capital Model of the Multinational
Enterprise”, NBER Working Paper, no.6773, Cambridge
CHÉDOR, S., MUCCHIELLI, J.L. and SOUBAYA, I. (2002), “Intra-Firm Trade and
Foreign Direct Investment: An Analysis of French Firms”, in LIPSEY, R.E. e
MUCCHIELLI, J.L., eds., Multinational Firms and Impacts on Employment, Trade, and
Technology, Routledge, London and New York
CLAUSING, K. A. (2000), “Does Multinational Activity Displace Trade”, Economic
Inquiry, vol. 38, no.2, pp. 190-205
DESAI, M.A., FOLEY, C.F. and HINES JR., J. R. (2005), “Foreign Direct Investment and
Domestic Economic Activity”, NBER Working Paper, no. 11717, Cambridge

23
DUNNING, J. H. (1981), “Explaining the International Direct Investment Position of
Countries: Towards a dynamic and development approach”, Weltwirtschaftliches Archiv,
vol. 117: pp. 30-64
EATON, J. and TAMURA, A. (1994), “Bilateralism and Regionalism in Japanese and US
Trade and Direct Foreign Investment Patterns”, NBER Working Paper, no. 4758,
Cambridge
ELLINGSEN, G., LIKUMAHUWA, W. and NUNNENKAMP, P. (2006), “Outward FDI
by Singapore: a different animal?”, Transnational Corporationss, vol. 15, no. 2: pp. 1-40
FALK, M. and HAKE, M. (2007), “A Panel Data Analysis on FDI and Exports”, FIW
Research Report, no.12, Vienna
FONTAGNÉ, L. and PAJOT, M. (2002), “Relationships between Trade and FDI Flows
within Two Panels of US and French Industries”, in LIPSEY, R.E. e MUCCHIELLI, J.L.,
eds., Multinational Firms and Impacts on Employment, Trade, and Technology, Routledge,
London and New York
FRANK, R.H. and FREEMAN, R.T. (1978), Distributional Consequences of Direct
Foreign Investment, Academic Press, New York
GRAHAM, E.M. (1996), “On the Relationships among Direct Investment and International
Trade in the Manufacturing Sector: Empirical Results for the United States and Japan”,
Working Paper of the Institute of International Economics, Washington D.C.
HEAD, K. and RIES, J. (2001), “Overseas Investment and Firms Exports”, Review of
International Economics, vol. 9, no. 1: pp. 108-122

24
HELPMAN, E. (1984), “A Simple Theory of International Trade with Multinational
Corporations”, Journal of Political Economy, vol. 92, no. 3: pp. 451-471
HELPMAN, E. and KRUGMAN, P.R. (1985), Market Structure and Foreign Trade, The
MIT Press, Cambridge
HYMER, S. H. (1960): The International Operations of National Firms: A Study of Direct
Foreign Investment, MIT Monographs, The MIT Press, Cambridge
JORDAN, J.L and VAHLNE, J.E. (1981),”Domestic Employment Effects of Direct
Investment Abroad by Two Swedish Multinationals”, Working Paper, no. 13, Multinational
Enterprises Programme, International Labour Office, Geneve
KOKKO, A. (2002), “FDI and the Structure of Home Country Production”, in B. Bora, eds.,
Foreign Direct Investment: Research Issues, Routledge, London and New York
KOKKO, A. (2006), “The Home Country Effects of FDI in Developed Economies”,
Working Paper, no. 225, European Institute of Japanese Studies, Stockholm School of
Economics, Stockholm
LIPSEY, R.E. (1995), “Outward Direct Investment and the U.S. economy”, in
FELDSTEIN, M., HINES, J.R. e HUBBARD, R.G., eds., The Effects of Taxation on
Multinational Corporations, University of Chicago Press, Chicago
LIPSEY, R.E. (2002), “Home and Host Country Effects of FDI”, NBER Working Paper, no.
9293, Cambridge
LIPSEY, R.E. and WEISS, M.E. (1981), “Foreign Production and Exports in
Manufacturing Industries”, Review of Economics and Statistics, vol. 63: pp. 488-494

25
LIPSEY, R.E. and WEISS, M.E. (1984), “Foreign Production and Exports of Individual
Firms”, Review of Economics and Statistics, vol. 66, no. 2: pp. 304-308
LIPSEY, R.E., RAMSTETTER, E. and BLOMSTRÖM, M. (2000), “Outward FDI and
Parent Exports and Employment: Japan, the United States and Sweden”, NBER Working
Paper, no. 7623, Cambridge
LIPSEY, R.E. (2002), “Home and Host Country Effects of FDI”, NBER Working Paper, no.
9293, Cambridge
MARKUSEN, J.R. (1984), “Multinational Firms, Multiplant Economies and Gains from
Trade”, Journal of International Economics, vol. 16, no.1: pp. 205-226
MARKUSEN, J.R. (2002), Multinational Firms and the Theory of International Trade, The
MIT Press, Cambridge
MARKUSEN, J.R. and VENABLES, A.J. (1995), “Multinational Firms and the New Trade
Theory”, NBER Working Paper, no.5036, Cambridge
MUNDELL, R. (1957), ‘International Trade and factor Mobility’, American Economic
Review, 47 (3), pp. 321-335
OBERHOFER, H. and PFAFFERMAYR, M. (2007), “FDI versus Exports, Substitutes or
Complements? A Three Nations Model and Empirical Evidence”, Paper presented on the
ETSG 2007
PRODUCTIVITY COMMISSION (2002), Offshore Investment by Australian Firms:
Survey Evidence, Australian Productivity Commission, Melbourne

26
RIESS, A. and UPPENBERG, K. (2004), “The internationalisation of production: moving
plants, products, and people”, EIB Papers, vol. 9, no. 1
STOBAUGH, R.B. et al. (1972), US Multinational Enterprises and the US Economy,
Harvard Graduate School of Business Administration, Cambridge
SVENSSON, R. (1996), “Effects of Overseas Production on Home Country Exports:
Evidence Based on Swedish Multinationals”, Weltwirtschaftliches Archiv, 132, pp. 304-329
SWEDENBORG, B. (1979), The Multinational Operations of Swedish Firms, Almqvist &
Wicksell International, Stockholm
SWEDENBORG, B. (1982), Svensk industri i utlandet. En analys av drivkrafter och
effekter, Industrial Institute for Economic and Social Research, Stockholm
SWEDENBORG, B. (2001), “Determinants and Effects of Multinational Growth: The
Swedish Case Revisited”, in BLOMSTRÖM, M. e GOLDBERG, L., eds., Topics in
Empirical International Economics, University of Chicago Press, Chicago
TÜRKAN, K. (2006), “Foreign Direct Investment and Intermediate Goods Exports:
Evidence from USA”, Akdeniz University, Antalya
UNCTAD (2006), World Investment Report 2006 FDI from Developing and Transition
Economies: Implications for Development, United Nations, New York and Geneve
VERNON, R. (1966), “International Investment and International Trade in the Product
Cycle”, Quarterly Journal of Economics, 80, pp. 190-207
WILLIAMSON, O. (1975), Markets and Hierarchies: Analysis and Antitrust Implications,
Free Press, New York
27
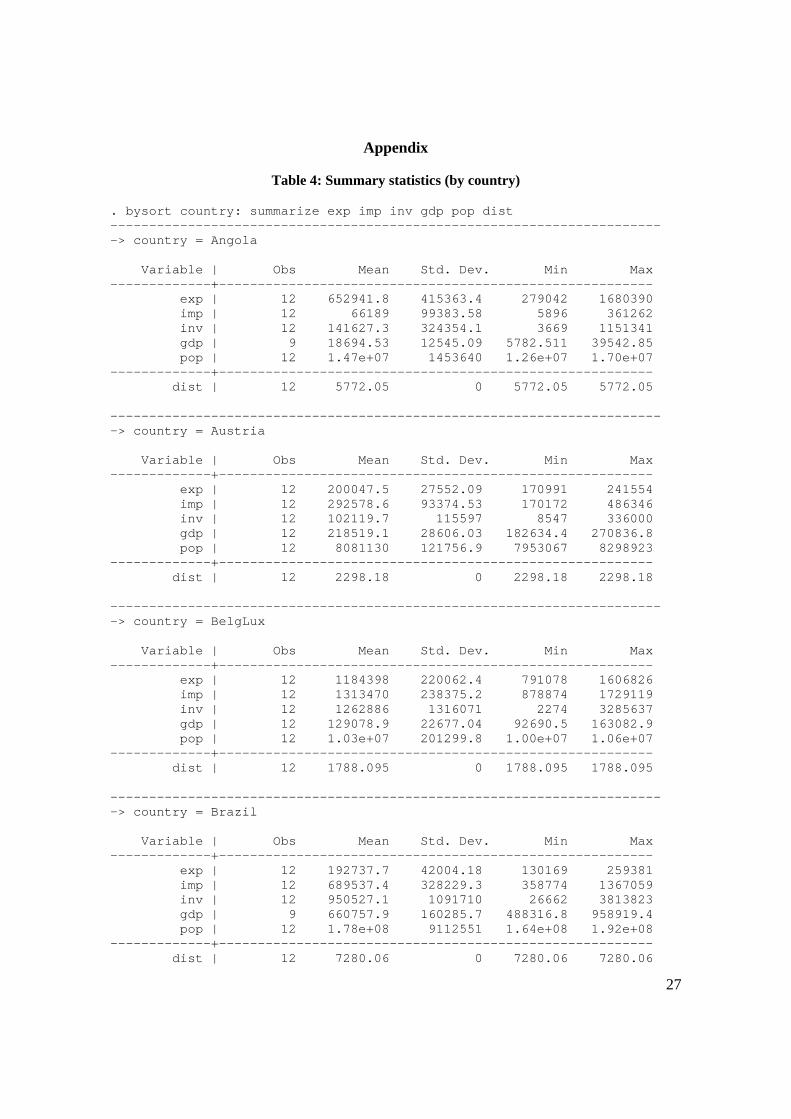
Appendix
Table 4: Summary statistics (by country)
. bysort country: summarize exp imp inv gdp pop dist ----------------------------------------------------------------------- -> country = Angola Variable | Obs Mean Std. Dev. Min Max -------------+-------------------------------------------------------- exp | 12 652941.8 415363.4 279042 1680390 imp | 12 66189 99383.58 5896 361262 inv | 12 141627.3 324354.1 3669 1151341 gdp | 9 18694.53 12545.09 5782.511 39542.85 pop | 12 1.47e+07 1453640 1.26e+07 1.70e+07 -------------+-------------------------------------------------------- dist | 12 5772.05 0 5772.05 5772.05 ----------------------------------------------------------------------- -> country = Austria Variable | Obs Mean Std. Dev. Min Max -------------+-------------------------------------------------------- exp | 12 200047.5 27552.09 170991 241554 imp | 12 292578.6 93374.53 170172 486346 inv | 12 102119.7 115597 8547 336000 gdp | 12 218519.1 28606.03 182634.4 270836.8 pop | 12 8081130 121756.9 7953067 8298923 -------------+-------------------------------------------------------- dist | 12 2298.18 0 2298.18 2298.18 ----------------------------------------------------------------------- -> country = BelgLux Variable | Obs Mean Std. Dev. Min Max -------------+-------------------------------------------------------- exp | 12 1184398 220062.4 791078 1606826 imp | 12 1313470 238375.2 878874 1729119 inv | 12 1262886 1316071 2274 3285637 gdp | 12 129078.9 22677.04 92690.5 163082.9 pop | 12 1.03e+07 201299.8 1.00e+07 1.06e+07 -------------+-------------------------------------------------------- dist | 12 1788.095 0 1788.095 1788.095 ----------------------------------------------------------------------- -> country = Brazil Variable | Obs Mean Std. Dev. Min Max -------------+-------------------------------------------------------- exp | 12 192737.7 42004.18 130169 259381 imp | 12 689537.4 328229.3 358774 1367059 inv | 12 950527.1 1091710 26662 3813823 gdp | 9 660757.9 160285.7 488316.8 958919.4 pop | 12 1.78e+08 9112551 1.64e+08 1.92e+08 -------------+-------------------------------------------------------- dist | 12 7280.06 0 7280.06 7280.06

28
----------------------------------------------------------------------- -> country = China Variable | Obs Mean Std. Dev. Min Max -------------+-------------------------------------------------------- exp | 12 93998 68196.32 17796 213905 imp | 12 420313.7 240171.7 174049 1012905 inv | 12 1158.583 868.8497 176 2953 gdp | 9 1653888 453643.6 1030993 2481103 pop | 12 1.26e+09 3.30e+07 1.20e+09 1.31e+09 -------------+-------------------------------------------------------- dist | 12 9664.06 0 9664.06 9664.06 ----------------------------------------------------------------------- -> country = Denmark Variable | Obs Mean Std. Dev. Min Max -------------+-------------------------------------------------------- exp | 12 298559.6 46739.68 239483 383200 imp | 12 264835 48710.05 200246 355161 inv | 12 344660.1 414789.2 12413 1485299 gdp | 12 182727.9 26906.84 145323.9 227671.2 pop | 12 5354106 62444.2 5251027 5447084 -------------+-------------------------------------------------------- dist | 12 2477.58 0 2477.58 2477.58 ----------------------------------------------------------------------- -> country = Finland Variable | Obs Mean Std. Dev. Min Max -------------+-------------------------------------------------------- exp | 12 171808.3 49903.21 121705 265344 imp | 12 230176.7 37042.68 143062 286259 inv | 12 675982.3 678848.9 2782 1850395 gdp | 12 138976.9 23720.59 101260.2 179734 pop | 12 5191553 49570.47 5116826 5276955 -------------+-------------------------------------------------------- dist | 12 3360.36 0 3360.36 3360.36 ----------------------------------------------------------------------- -> country = France Variable | Obs Mean Std. Dev. Min Max -------------+-------------------------------------------------------- exp | 12 3655074 600951.8 2750590 4756886 imp | 12 4039118 505327.5 2949637 4747636 inv | 12 2809740 1377712 641828 4509637 gdp | 12 1529017 214902.2 1239836 1892244 pop | 12 6.13e+07 1339687 5.95e+07 6.34e+07 -------------+-------------------------------------------------------- dist | 12 1452.94 0 1452.94 1452.94

29
----------------------------------------------------------------------- -> country = Germany Variable | Obs Mean Std. Dev. Min Max -------------+-------------------------------------------------------- exp | 12 4470739 436062.6 3768057 5181200 imp | 12 6080791 958129 4313057 7532267 inv | 12 3163857 2118395 339199 6012482 gdp | 12 2122846 161233.3 1907246 2422900 pop | 12 8.23e+07 239865.8 8.18e+07 8.25e+07 -------------+-------------------------------------------------------- dist | 12 2311.66 0 2311.66 2311.66 ----------------------------------------------------------------------- -> country = Greece Variable | Obs Mean Std. Dev. Min Max -------------+-------------------------------------------------------- exp | 12 114346.3 20090.61 86769 148630 imp | 12 72280.75 22030.37 35140 104176 inv | 12 162878.8 271745.3 4 720501 gdp | 12 160071.4 39013.16 109733.9 228180.3 pop | 12 1.09e+07 153026.3 1.07e+07 1.12e+07 -------------+-------------------------------------------------------- dist | 12 2851.63 0 2851.63 2851.63 ----------------------------------------------------------------------- -> country = Ireland Variable | Obs Mean Std. Dev. Min Max -------------+-------------------------------------------------------- exp | 12 143290.5 33554.26 90901 183891 imp | 12 305542.7 104074.8 152792 464887 inv | 12 570885.2 345669.9 73343 1183129 gdp | 12 122466.3 42914.29 58278.3 190602.5 pop | 12 3902970 225638.6 3620065 4314634 -------------+-------------------------------------------------------- dist | 12 1640.03 0 1640.03 1640.03 ----------------------------------------------------------------------- -> country = Italy Variable | Obs Mean Std. Dev. Min Max -------------+-------------------------------------------------------- exp | 12 1161581 262679.4 713233 1563268 imp | 12 2718197 240882.6 2223505 3030737 inv | 12 317961.3 272780.1 62043 1064041 gdp | 12 1263727 176813.4 992152.1 1535540 pop | 12 5.75e+07 838781.1 5.68e+07 5.91e+07 -------------+-------------------------------------------------------- dist | 12 1841.48 0 1841.48 1841.48

30
----------------------------------------------------------------------- -> country = Japan Variable | Obs Mean Std. Dev. Min Max -------------+-------------------------------------------------------- exp | 12 124952.8 57256.55 86391 299106 imp | 12 706744.7 182663.9 525359 1025677 inv | 12 19294.33 10704.33 6126 41096 gdp | 12 3879756 519867.1 3196746 5056700 pop | 12 1.27e+08 742244.7 1.26e+08 1.28e+08 -------------+-------------------------------------------------------- dist | 12 11145.27 0 11145.27 11145.27 ----------------------------------------------------------------------- -> country = Netherlands Variable | Obs Mean Std. Dev. Min Max -------------+-------------------------------------------------------- exp | 12 1122753 111509.4 937269 1298992 imp | 12 1895637 375176 1177748 2576481 inv | 12 4353214 2265287 306472 6314408 gdp | 12 444661.8 78490.21 329315.5 567066 pop | 12 1.60e+07 314215.9 1.55e+07 1.64e+07 -------------+-------------------------------------------------------- dist | 12 1863.73 0 1863.73 1863.73 ----------------------------------------------------------------------- -> country = Spain Variable | Obs Mean Std. Dev. Min Max -------------+-------------------------------------------------------- exp | 12 6118136 2533454 2873480 1.07e+07 imp | 12 1.15e+07 3331489 6077948 1.69e+07 inv | 12 3705201 1997352 745018 5695363 gdp | 12 726548.4 189106.1 490476.2 1050595 pop | 12 4.13e+07 1767046 3.94e+07 4.45e+07 -------------+-------------------------------------------------------- dist | 12 516.05 0 516.05 516.05 ----------------------------------------------------------------------- -> country = Sweden Variable | Obs Mean Std. Dev. Min Max -------------+-------------------------------------------------------- exp | 12 409850.5 35182.19 338499 459317 imp | 12 479873.2 83966.43 306639 598134 inv | 12 326007.6 164176.6 155760 635931 gdp | 12 266032.8 36504.97 217516.4 331952.2 pop | 12 8927179 91416.52 8837496 9113257 -------------+-------------------------------------------------------- dist | 12 2988.42 0 2988.42 2988.42

31
----------------------------------------------------------------------- -> country = United Kingdom Variable | Obs Mean Std. Dev. Min Max -------------+-------------------------------------------------------- exp | 12 2654480 261854.8 2065605 2915284 imp | 12 2162213 200374.3 1791204 2499549 inv | 12 3478810 1396053 982684 5996181 gdp | 12 1588248 317355.4 960590.2 2047289 pop | 12 5.92e+07 883247.4 5.81e+07 6.09e+07 -------------+-------------------------------------------------------- dist | 12 1585.46 0 1585.46 1585.46 ----------------------------------------------------------------------- -> country = U.S.A. Variable | Obs Mean Std. Dev. Min Max -------------+-------------------------------------------------------- exp | 12 1454886 365057.6 841446 2114312 imp | 12 1046774 214070.6 828669 1618358 inv | 12 730569.2 325150.6 250986 1236655 gdp | 12 9385522 1592960 6156265 1.13e+07 pop | 12 2.89e+08 1.07e+07 2.73e+08 3.06e+08 -------------+-------------------------------------------------------- dist | 12 5737.22 0 5737.22 5737.22