gas Chromatography
8
Journal of Chromatographic Science, Vol. 35, March 1997 Speciation of Nitrogen Compounds in Gasoline and Diesel Range Process Streams by Capillary Column Gas Chromatography with Chemiluminescence Detection Birbal Chawla Mobil Technology Company, Paulsboro Technical Center, Paulsboro, New Jersey 08066 Abstract This paper describes the development of a gas chromatographic method that uses nitrogen-specific detection based on chemiluminescence. A highly sensitive nitrogen-specific detector (Antek 705D) coupled to a Hewlett-Packard gas chromatograph is optimized to speciate nitrogen compounds in gasoline and diesel range process streams. Under optimized conditions, the nitrogen- to-carbon selectivity is greater than 10 6 . The nitrogen chemiluminescence detector (NCD) provides a uniform response to different classes of nitrogen compounds and can detect concentration of individual components down to 100 ppb nitrogen. The detector's linear response in a range of 0.2 to 54 ppm nitrogen for an individual nitrogen component is established using several aliphatic and aromatic nitrogen-containing compounds. Gasoline and diesel range streams containing any level of total nitrogen can be analyzed after appropriate dilution so that each nitrogen component is below 50 ppm. In addition to the nitrogen speciation, total nitrogen can simultaneously be determined with reasonable accuracy using the NCD system. The repeatability and accuracy of the nitrogen quantitation is found to be within 7% at the 95% confidence level based on six to seven measurements. cess relatively inexpensive, heavy, and low-quality feed stocks containing large quantities of nitrogen and other heteroatoms' compounds. In order to obtain the desired product quality and also to understand the effect of nitrogen compounds during cat- alytic processes, it is beneficial to speciate nitrogen compounds that are present in various process streams. A few attempts (1–5) have been made to identify some of the nitrogen compounds in the petroleum streams. However, in these studies, nitrogen compounds were analyzed after being concentrated using different laborious techniques such as acid- treatment extraction, ion-exchange chromatography, etc. The results of these studies are not quantitative because some of the nitrogen compounds were either not extracted or were lost during the extraction. The concentrated fractions were analyzed by gas chromatography (GC) using different detectors or gas chromatography-mass spectrometry (GC-MS). The most commonly used nitrogen detectors are Hall detec- tors and nitrogen-phosphorus detectors (NPD). Hall detectors Introduction Though it is generally believed that nitrogen compounds cause color and gum formation and are responsible for catalyst poi- soning during catalytic hydrotreating/hydro- cracking processes, refiners have not been very enthusiastic about nitrogen speciation. This is probably due to relatively small quan- tities of nitrogen compounds present in con- ventional feed stocks and also partially due to the fact that there has been no specification for total nitrogen in the final product. How- ever, in the near future, the situation will change because of the growing need to pro- Figure 1. Nitrogen-selective chemiluminescence detection system. Reproduction (photocopying) of editorial content of this journal is prohibited without publisher's permission. 97
-
Upload
dwivelia-aftika -
Category
Documents
-
view
224 -
download
2
Transcript of gas Chromatography
Journal of Chromatographic Science, Vol. 35, March 1997
Speciation of Nitrogen Compounds in Gasoline and Diesel Range Process Streams by Capillary Column Gas Chromatography with Chemiluminescence Detection
Birbal Chawla M o b i l Technology Company, Paulsboro Technical Center, Paulsboro, N e w Jersey 08066
Abstract
This paper describes the development of a gas chromatographic method that uses nitrogen-specific detection based on chemiluminescence. A highly sensitive nitrogen-specific detector (Antek 705D) coupled to a Hewlett-Packard gas chromatograph is optimized to speciate nitrogen compounds in gasoline and diesel range process streams. Under optimized conditions, the nitrogen-to-carbon selectivity is greater than 106. The nitrogen chemiluminescence detector (NCD) provides a uniform response to different classes of nitrogen compounds and can detect concentration of individual components down to 100 ppb nitrogen. The detector's linear response in a range of 0.2 to 54 ppm nitrogen for an individual nitrogen component is established using several aliphatic and aromatic nitrogen-containing compounds. Gasoline and diesel range streams containing any level of total nitrogen can be analyzed after appropriate dilution so that each nitrogen component is below 50 ppm. In addition to the nitrogen speciation, total nitrogen can simultaneously be determined with reasonable accuracy using the NCD system. The repeatability and accuracy of the nitrogen quantitation is found to be within 7% at the 95% confidence level based on six to seven measurements.
cess relatively inexpensive, heavy, and low-quality feed stocks containing large quantities of nitrogen and other heteroatoms' compounds. In order to obtain the desired product quality and also to understand the effect of nitrogen compounds during catalytic processes, it is beneficial to speciate nitrogen compounds that are present in various process streams.
A few attempts (1–5) have been made to identify some of the nitrogen compounds in the petroleum streams. However, in these studies, nitrogen compounds were analyzed after being concentrated using different laborious techniques such as acid-treatment extraction, ion-exchange chromatography, etc. The results of these studies are not quantitative because some of the nitrogen compounds were either not extracted or were lost during the extraction. The concentrated fractions were analyzed by gas chromatography (GC) using different detectors or gas chromatography-mass spectrometry (GC-MS).
The most commonly used nitrogen detectors are Hall detectors and nitrogen-phosphorus detectors (NPD). Hall detectors
Introduction
Though it is generally believed that nitrogen compounds cause color and gum formation and are responsible for catalyst poisoning during catalytic hydrotreating/hydro-cracking processes, refiners have not been very enthusiastic about nitrogen speciation. This is probably due to relatively small quantities of nitrogen compounds present in conventional feed stocks and also partially due to the fact that there has been no specification for total nitrogen in the final product. However, in the near future, the situation will change because of the growing need to pro-
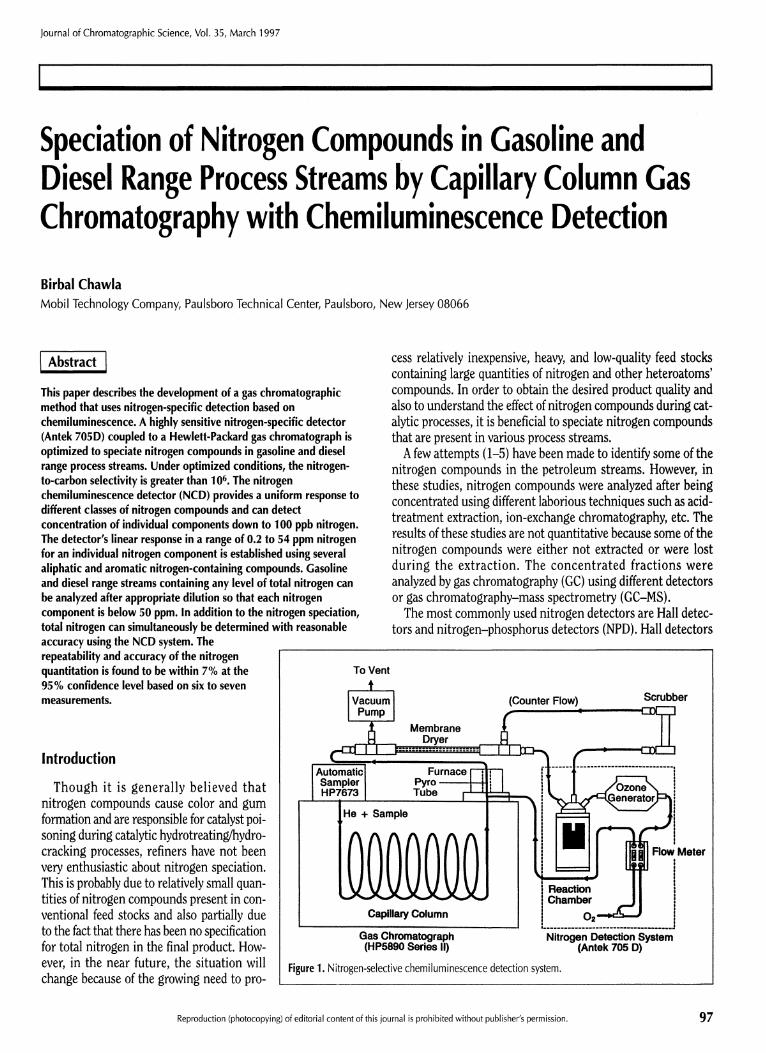
Figure 1. Nitrogen-selective chemiluminescence detection system.
Reproduction (photocopying) of editorial content of this journal is prohibited without publisher's permission. 97

Journal of Chromatographic Science, Vol. 35, March 1997
are selective for halogens, sulfur, nitrogen, phosphorus, and oxygen (6). The NPD detector is selective for nitrogen, phosphorous, sulfur, halogens, argon, and lead (7). However, a recently developed Antek (705D) nitrogen chemiluminescence detector (NCD) is selective for only nitrogen (3) and has a nitrogen-to-carbon selectivity greater than 106 under optimum conditions, whereas Hall and NPD have only within 104–106
nitrogen-to-carbon selectivity. In the last few years, the NCD has been used for a wide range of applications (3-12) including qualitative analyses of light cycle oil and crude oil (12). To our knowledge, this study represents the first time NCD has been optimized and used for quantitative speciation of nitrogen compounds in petroleum streams.
Experimental
A Hewlett-Packard (Avondale, PA) gas chromatograph, model HP-5890 series II equipped with an on-column injector, an automatic sampler (HP-7673), and a flame ionization detector was employed under the following operating conditions. The column used was an HP-Ultra-2 (50 m × 0.32-mm i.d., 0.50-μm film thickness) (Hewlett Packard). The oven temperature was increased from 20 to 150°C at 20°C/min and then to 180°C at 1.5°C/min, held for 20 min, and then increased to 220°C at 2°C/min; the final time was 20 min. An on-column injector was used at a temperature of 30-300°C at a rate of 100°C/min; the
final time was 100 min. The injection size was 0.1-0.5 uL of neat sample. Samples containing more than 350 ppm total nitrogen were proportionally diluted. Helium was the carrier gas (260 kpa at 20°C), held at a constant pressure. A 4-decyl-aniline (DA) solution in toluene was used as the internal standard. The data acquisition, processing, storage, and retrieval were performed using an HP-3365 ChemStation (MS-DOS series).
Figure 1 displays the major components of the nitrogen-selective chemiluminescence detection system (Antek 750D) (Antek, Houston, Texas) coupled to a gas chromatograph (HP-5890 series II) and the general location of each flow-related component. Initially, the carrier gas (helium) flow rate was set within 2–4 mL/min and was optimized during the GC method development after optimization of the detector. The carrier gas flow rate was measured at the exit of the nickel pyrotube. Hydrogen is not recommended as a carrier gas within a 705D system because it will produce large amounts of water in the pyroreactor and may have a negative effect on system performance.
The carrier gas containing the sample eluted from the GC column and the pyro oxygen were mixed at the base of the pyrotube. These gases then entered the nickel tube, which was maintained at a high temperature (800°C), and the oxidation reactions occurred. A pyro oxygen flow of approximately 4 mL/min was always maintained to ensure an excess of oxygen for complete oxidation of the sample.
Figure 2. NCD chromatogram of light cycle oil (nitrogen = 596 ppm).
98
Journal of Chromatographic Science, Vol. 35, March 1997
All combustion products, including water, exited the pyro-tube and entered the membrane dryer where water was removed from the sample stream. The dried stream was routed to the detector reaction chamber for quantitation, where it was mixed and reacted with ozone-rich oxygen supplied from the ozone generator (embodied in the nitrogen-specific detector) and then detected by chemiluminescence emission at a specific wavelength.
Results and Discussion
Optimization of NCD system The Antek 705D, a GC detector, is highly selective to nitrogen
by rendering most organic compounds transparent under optimum conditions. The principle of operation is illustrated in the following chemical reactions. The emerging components from the GC column are combined with oxygen in a furnace maintained at high temperature to produce oxidation products which include NO, CO 2, H 2O, SO 2, etc. The NO (produced from all chemically-bound nitrogen compounds) combines with ozone (O3) to form nitrogen dioxide in the excited state (NO2*). The NO 2* emits light during its decay to the ground state. The emitted light is detected at specific wavelengths by a photomultiplier tube.
Initially, the detector's selectivity and sensitivity for nitrogen were optimized using a 1-ppm nitrogen solution of indole in toluene under the following conditions. The furnace temperature was 1050°C, the flow rates of the pyro oxygen and ozone oxygen were 3.0 and 1.5 mL/min, respectively, and the PMT voltage was 900 V.
Several GC runs were made by injecting 1 μL of the indole solution each time while the pyro and ozone generator oxygen flows were varied from 2 to 5 mL/min and from 1 to 2 mL/min, respectively, in increments of approximately 0.2 mL/min. There was no nitrogen signal when the ozone generator oxygen flow was below 1 mL/min, whereas the carbon signal from toluene became very strong above 2 mL/min. The carbon and nitrogen signals were very sensitive to the ozone generator oxygen flow, whereas the change in pyro oxygen flow did not seem to have any significant effect. At the optimum ozone generator oxygen rate of 1.2 mL/min, the nitrogen-to-carbon selectivity was better than 106.
GC column selection Speciation of the nitrogen compounds (quantitatively),
which are polar and somewhat basic in nature, requires careful selection of an appropriate GC column and rigorous optimization of the GC conditions. Seven different capillary columns from five different manufacturers were evaluated using a light cycle oil (LCO) sample containing 596 ppm of
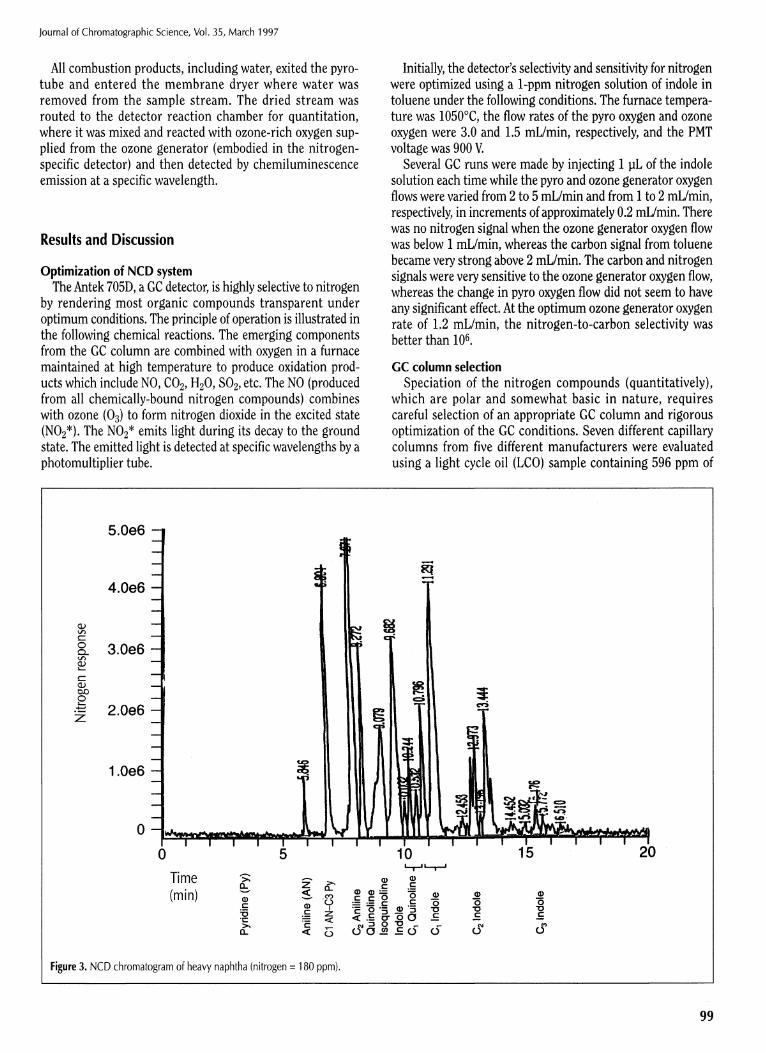
Figure 3. NCD chromatogram of heavy naphtha (nitrogen = 180 ppm).
99

Journal of Chromatographic Science, Vol. 35, March 1997
Boiling point Retention time Boiling point Retention time Compound (°F) (min) Compound (°F) (min)
Pyridines 31. 6-Me-lndole 501 11.14 1. Pyridine 240 3.65 32. 5-Me-lndole - 11.14 2. Hexahydropyridine 223 3.82 33. 4-Me-lndole 513 11.20
(piperidine) 34. 1,2-Me2-lndoIe - 11.85 3. 4-Me-Pyridine 294 4.72 35. 2,5-Me2-lndole - 13.30 4. 2,4-Me2-Pyridine 318 5.36 36. 2,3-Me2-lndole 545 13.50
37. 2-Phenylindole 770 42.46 Pyrroles
5. 1-Me-Pyrrole 235 3.53 Quinolines
6. Pyrrole 268 4.07 38. Quinoline 459 8.81
7. 2,5-Me2-Pyrrole 333 5.35 39. Isoquinoline 468 9.04
8. 1,2,5-Me3-Pyrrole 343 7.70 40. 8-Me-Quinoline 482 9.90 8. 1,2,5-Me3-Pyrrole 41. 7-Me-Quinoline 496 10.50
Anilines 42. 6-Me-Quinoline 498 10.52
9. Aniline 363 5.91 43. 2,8-Me2-Quinoline 500 10.92
10. N-Me-Aniline 385 6.74 44. 2,6-Me2-Quinoline - 11.85
11. N,N-Me2-Aniline 379 6.79 45. 2,7-Me2-Quinoline - 11.85
12. 2,6-Me2-Aniline 418 7.78 46. 7,8-Benzo-quinoline 650 24.86
13. 2,4-Me2-Aniline 424 7.76 47. Acridine 655 25.43
14. 2,5-Me2-Aniline 424 7.82 Carbazoles 15. 2,3-Me2-Aniline 430 7.83 48. Tetrahydrocarbzole 617 25.42 16. 3,5-Me2-Aniline 432 7.84 49. 9-Me-Carbazole _ 26.39 17. 3 /4-Me2-Aniline 439 8.10 50. Carbazole 671 26.97 18. 2-Propylaniline 435 8.61 51. 9-Et-Carbazole 27.87 19. 4-Octylaniline 590 24.25 52. 9-Phenylcarbazole _ 63.52 20. 4-Decylaniline ~670 37.37
52. 9-Phenylcarbazole
21. 4-Dodecylaniline - 60.39 Miscellaneous 22. 4-Tetradecylaniline - Retained 53. Propylamine 118 1.71
54. 1-Phenylpiperazine 547 14.21 Indoles 55. Diphenylamine 576 17.51
23. Tetrahydroindole - 8.23 56. Dibenzyfamine ~600 21.61 24. 2-Me-lndoline - 8.47 57. 4/4'-Trimethylene-bis ~610 25.90 25. 1-Me-lndole 468 9.15 (p-Methylpiperdine) 26. Indole 489 9.44 58. Hexadecylamine 626 27.88 27. 2,3-Me2-lndoline 482 9.50 59. Phenoxazine - 27.93 28. 7-Me-lndole 511 10.66 60. Phenothiazine -700 41.53 29. 3-Me-lndole 509 11.05 61. Octadecylamine - 44.45 30. 2-Me-lndole 523 11.06 62. N-Phenyl-1-naphthaylamine -700 52.32
100
Table I. Retention Time Data for Selected Classes of Nitrogen Compounds

Journal of Chromatographic Science, Vol. 35, March 1997
nitrogen. A direct on-column injection technique was used to prevent boiling point discrimination and adsorption due to strong interactions of the basic nitrogen compounds on active surfaces in the injection port. The columns investigated were: (a) HP-Ultra-2 (Hewlett-Packard), 50 m × 0.32-mm i.d., 0.5-
μm film thickness; (b) CP-SIL-13 (Chrompack, Raritan, NJ), 50 m × 0.32-mm i.d., 0.4-μm film thickness; (c) AT-35 (Alltech, Deerfield, IL), 30 m × 0.32-mm i.d., 0.5-μm film thickness; (d) SPB-5 (Supelco, Bellefonte, PA), 30 m × 0.32-mm i.d., 1.0-μm film thickness; (e) SPB-1 (Supelco), 30 m
Figure 4. NCD response for indole at different temperatures.
× 0.32-mm i.d., 4.0-μm film thickness; (f) DB-5 MS (J & W Scientific, Folsom, CA), 30 m × 0.32-mm i.d., 1.0-μm film thickness; and (g) DB-1 (J & W Scientific), 50 m × 0.25-mm i.d., 0.25-μm film thickness. Only the first two capillary columns (HP-Ultra-2 and CP-SIL-13) gave satisfactory resolution of the low- as well as high-boiling nitrogen compounds (see Figures 2 and 3) with little column bleed. The HP-Ultra-2 capillary column with lesser column bleed was chosen.
Figures 2 and 3 represent the typical chromatograms of LCO and gasoline samples (180 ppm nitrogen), respectively, with major components identified. As shown in Figures 2 and 3, the major nitrogen components identified in the LCO were carbazoles, whereas the gasoline sample contained mostly anilines. Table I lists the retention times for 62 nitrogen compounds of different classes such as pyridines, piperidine,
Detector response
Compound 600°C 800°C 900°C 1000°C
Indole 1.04 1.01 1.00 0.99 Quinoline 1.07 1.05 0.97 0.99 Carbazole 1.00 1.01 0.99 1.06
Figure S. NCD response for LCO at different temperatures.
101
Table II. Detector Response for Toluene Solution at Four Furnace Temperatures
journal of Chromatographic Science, Vol. 35, March 1997
pyrroles, anilines, indoles, carbazoles, and other miscellaneous nitrogen compounds including aliphatic amines. The model compounds were chromatographed at a concentration level of 4-5 mg/20 mL of toluene. Structures of selected classes of nitrogen compounds are provided in Table I.
Optimization of pyro furnace temperature Initially, as per manufacturer instructions,
the pyro furnace was operated at 1050°C. This high furnace temperature was recommended in order to ensure complete conversion of chemically bound nitrogen compounds. However, the furnace was breaking down after about one month of use because the heater filament was burning out. The effect of furnace temperature on combustion of nitrogen compounds in the presence of oxygen was investigated using a dilute solution of indole in toluene (approximately 2 ppm nitrogen). The furnace temperature was varied from 400 to 1100°C in 100° intervals.
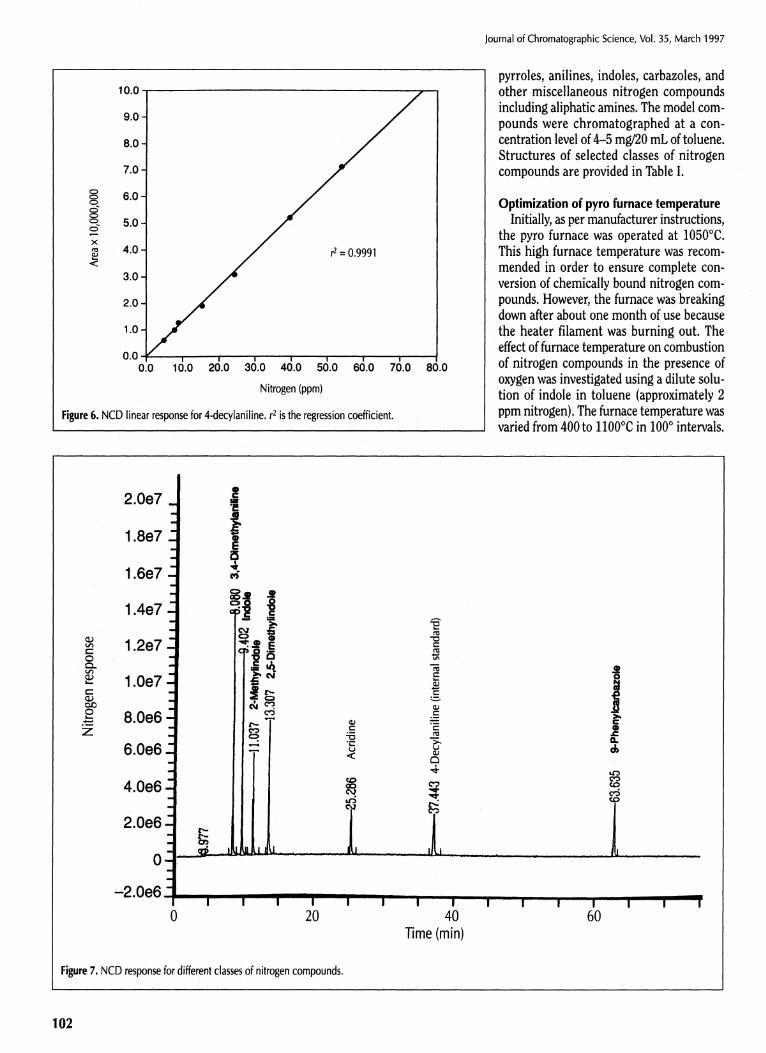
Figure 7. NCD response for different classes of nitrogen compounds.
102
Figure 6. NCD linear response for 4-decylaniline. r2 is the regression coefficient.

Journal of Chromatographic Science, Vol. 35, March 1997
Table III. Repeatability and Equimolar Response Data for Different Classes of Nitrogen Compounds
3,4-Dimethylaniline Indole
Nitroge
2-Methylindole
n (ppm)
2,5-Dimethylindole Acridine 9-Phenylcarbazole
100°C 38.1 37.1 21.9 34.1 18.5 27.2 39.0 38.7 22.6 35.1 18.6 26.7 41.0 41.5 22.9 37.1 18.7 29.3 39.0 38.6 23.9 37.1 18.7 29.3 40.2 40.9 24.2 36.9 17.4 29.4
Average value 39.6 39.7 23.2 36.5 18.4 28.3 Standard deviation 1.1 1.8 0.89 1.5 0.51 1.1
800°C 43.6 43.9 25.3 39.6 18.4 25.7 40.0 41.8 23.8 37.9 19.1 27.0 42.2 42.3 24.3 37.9 19.0 27.5 41.9 41.2 24.2 36.3 19.0 26.8 42.9 42.0 23.4 37.0 18.6 25.9 44.7 43.8 25.2 38.6 18.8 26.2
Average value 42.6 42.5 23.4 37.9 18.8 26.5 Standard deviation 1.6 1.1 0.76 1.2 0.27 0.70
Actual value 43.6 40.6 22.9 37.6 18.1 25.7 Relative errors (%)
800°C 2.3 4.7 2.2 0.80 3.3 3.1 1000°C 7.2 2.2 1.3 2.9 1.7 10.1
Table IV. Comparison of NCD and Elemental Determinations of Total Nitrogen in Light Petroleum Streams
IBP* (°F)
Sample description
T90*(°F) FBP* (°F)
Nitr
NCD
ogen (ppm)
Elemental
A 254 462 505 221 230 Β 194 491 511 193 180 C 231 487 560 129 140 D 224 485 556 68.6 73 Ε 213 481 550 12.8 14 F 216 481 551 4.5 4
* IBP = initial boiling point; FBP = final boiling point; T90 = temperature at which 90% boils off.
Peak areas obtained at different temperatures from identical injections of 0.1 μL of indole solution were plotted against the furnace temperature. Almost no change in peak area for indole signal over a temperature change of 400°C, as shown in Figure 4, clearly suggested that the extent of indole combustion remained unchanged when the furnace temperature was changed from 700 to 1100°C. However, the extent of indole combustion dropped significantly below 600°C furnace temperature. At 400°C, the indole signal was very poor (see Figure 4). Therefore, a furnace temperature of 800°C was chosen as the operating temperature. In order to confirm that the 800°C furnace temperature was suitable for the complete combustion of different classes of nitrogen compounds present in the gasoline and diesel range petroleum streams, an LCO sample was analyzed at three furnace temperatures: 800, 900, and 1000°C. The resulting nitrogen chromatograms were compared and
found to be similar (Figure 5). The furnace was operated at 800°C for about 4 months without any heater filament burnout.
Detector response was further checked by analyzing a dilute toluene solution containing indole, quinoline, carbazole, and DA at different furnace temperatures. The detector response for indole, quinoline, and carbazole was calculated with respect to DA (as an internal standard, see the Quantitation of nitrogen compounds section) using peak areas. Detector response for these compounds remained unchanged when the furnace temperature was changed from 600 to 1000°C. The results are given in Table II.
Quantitation of nitrogen compounds using the internal standard
During the early stages of optimization of the nitrogen detector, it was found that the detector response was drifting on a day-to-day basis. Therefore, an internal standard was used for accurate quantitation of nitrogen compounds. Out of 62 nitrogen compounds (Table I) investigated for retention time data, DA was chosen as the internal standard because it elutes in the middle of the LCO and is not present in the gasoline and diesel range petroleum streams.
The linearity of the nitrogen response was tested using a set of 10 solutions of DA in toluene. These solutions were prepared by weight from a stock solution of DA (nitrogen = 207.8 ppm) that was prepared by dissolving 0.15414 g of DA (97% pure) in 43.03150 g of toluene. The concentration range of
103

Journal of Chromatographic Science, Vol. 35, March 1997
these solutions was adjusted to cover a wide range of 0.2-54 ppm nitrogen. As shown in Figure 6, the detector response for DA was linear in this range. In all of the nitrogen speciation and quantitation work reported in this paper, the concentration of each of the components, including the internal standard, was kept below 50 ppm. It was also established that the Antek detector had the capability of detecting 100 ppb nitrogen per compound when operated under optimum conditions.
The detector repeatability and equimolar response for different classes of nitrogen compounds were investigated by analyzing a mixture of six nitrogen compounds. These compounds covered a wide range of boiling points for the nitrogen compounds expected to be present in the gasoline and diesel range streams. The compounds used were indole, 2-methyl-indole, 2,5-dimethylindole, 3,4-dimethylaniline, acridine [benzo(H)quinoline], 9-phenylcarbazole, and 4-decylaniline (internal standard). Compounds were chosen so that they were well-separated when chromatographed (Figure 7). The concentration of the internal standard (DA) was 28 ppm. The mixture of these compounds was analyzed several times at furnace temperatures of 800 and 1000°C by injecting 0.1 μL of solution. The absolute nitrogen concentration of each compound was obtained by converting peak area using the internal standard concentration. Results are given in Table III. Experimentally determined concentration values agreed quite well with the actual values. The overall repeatability for all these nitrogen compounds was better than 5% at 95% confidence level.
Determination of total nitrogen by NCD Six samples (A-F) of light petroleum process streams were
used to evaluate whether the NCD could be used for the determination of total nitrogen content. The nitrogen content of the samples investigated varied from approximately 4 to 230 ppm. The results are given in Table IV. The excellent agreement between the NCD results and the elemental determinations of nitrogen content strongly suggests that the NCD could also be used to determine total nitrogen within the accuracy shown in Table IV.
Conclusion
A GC method that utilizes the chemiluminescence detection system was developed for quantitative speciation of nitrogen components in gasoline and diesel range streams. The method has a low detection limit of 100 ppb of nitrogen per
compound and can be used for all levels of total nitrogen samples when analyzed after appropriate dilution. In addition to quantitative nitrogen speciation, total nitrogen content of the sample can also be determined accurately.
Acknowledgments
I am thankful to F.P. Di Sanzo and F.C. Kohout for encouragement and helpful discussions during the development of this method. This paper was presented at the 1996 Pittcon conference.
References
1. M . Li, S.R. Larter, D. Stoddart, and M . Bjorey. Liquid chromatographic separation schemes for pyrrole and pyridine nitrogen aromatic heterocycle fractions from crude oils suitable for rapid characterization of geochemical samples. Anal. Chem. 64: 1337–44 (1992).
2. M . Dorbon and C. Bernasconi. Nitrogen compounds in light cycle oils: Identification and consequences of ageing. Fuel 68: 1067–74 (1989).
3. H.V. Drushel. Needs of the chromatographer—detectors. J. Chro-matogr.Sci. 21: 375–84 (1983).
4. W. Xie-qing, H. Xin-fen, R. Cheng-min, and Z. Qing-en. Analysis of basic nitrogen compounds in cat-cracked gasoline by capillary gas chromatography/ mass spectrometry and thermionic detector. Proceedings of Si no-West German Symposium on Chromatography 5 2 W M A L , 275–89 (1983).
5. F.P. Di Sanzo. Characterization of basic nitrogen compounds in gasolines by gas chromatography-mass spectrometry. HRC & CC 4: 649–51 (1981).
6. M . Dressier. Selective gas chromatographic detectors. Journal of Chromatography Library, Vol . 36. Elsevier, New York, NY, 1986.
7. F.I. Onu ska and F.W. Karasek. Open Tubular Column Gas Chromatography in Environmental Sciences. Plenum, New York, NY, 1984.
8. A.J. Britten. Can your G C system find nitrogen in this flower? Research & Development 31 (9): 77–80 (1989).
9. R.E. Parks and R.L. Marietta. U.S. Patent 4018 562 (1975). 10. E.M. Fujinari and L.O Courthaudon. Nitrogen-specific liquid chro
matography detector based on chemiluminescence: Application to the analysis of ammonium nitrogen in waste water. J. Chromatogr. 592: 209-14 (1992).
11. R.J. Young and E.M. Fujinari. Nitrogen detection for simulated distillation of refinery streams. Am. Lab. 26(15): 38–45 (1994).
12. L.O. Courthaudon and E.M. Fujinari. Nitrogen-specific gas chromatography detection based on chemi luminescence. LC-GC 9(10): 732–34 (1991).
Manuscript accepted October 21, 1996.
104