Garibaldi et al, 2013 - Rachael Winfree · Wild Pollinators Enhance Fruit Set of Crops Regardless...
49
Wild Pollinators Enhance Fruit Set of Crops Regardless of Honey Bee Abundance Lucas A. Garibaldi, 1 * Ingolf Steffan-Dewenter, 2 Rachael Winfree, 3 Marcelo A. Aizen, 4 Riccardo Bommarco, 5 Saul A. Cunningham, 6 Claire Kremen, 7 Luísa G. Carvalheiro, 8,9 Lawrence D. Harder, 10 Ohad Afik, 11 Ignasi Bartomeus, 12 Faye Benjamin, 3 Virginie Boreux, 13,14 Daniel Cariveau, 3 Natacha P. Chacoff, 15 Jan H. Dudenhöffer, 16 Breno M. Freitas, 17 Jaboury Ghazoul, 14 Sarah Greenleaf, 7 Juliana Hipólito, 18 Andrea Holzschuh, 2 Brad Howlett, 19 Rufus Isaacs, 20 Steven K. Javorek, 21 Christina M. Kennedy, 22 Kristin M. Krewenka, 23 Smitha Krishnan, 14 Yael Mandelik, 11 Margaret M. Mayfield, 24 Iris Motzke, 13,23 Theodore Munyuli, 25 Brian A. Nault, 26 Mark Otieno, 27 Jessica Petersen, 26 Gideon Pisanty, 11 Simon G. Potts, 27 Romina Rader, 28 Taylor H. Ricketts, 29 Maj Rundlöf, 5,30 Colleen L. Seymour, 31 Christof Schüepp, 32,33 Hajnalka Szentgyörgyi, 34 Hisatomo Taki, 35 Teja Tscharntke, 23 Carlos H. Vergara, 36 Blandina F. Viana, 18 Thomas C. Wanger, 23 Catrin Westphal, 23 Neal Williams, 37 Alexandra M. Klein 13 The diversity and abundance of wild insect pollinators have declined in many agricultural landscapes. Whether such declines reduce crop yields, or are mitigated by managed pollinators such as honey bees, is unclear. We found universally positive associations of fruit set with flower visitation by wild insects in 41 crop systems worldwide. In contrast, fruit set increased significantly with flower visitation by honey bees in only 14% of the systems surveyed. Overall, wild insects pollinated crops more effectively; an increase in wild insect visitation enhanced fruit set by twice as much as an equivalent increase in honey bee visitation. Visitation by wild insects and honey bees promoted fruit set independently, so pollination by managed honey bees supplemented, rather than substituted for, pollination by wild insects. Our results suggest that new practices for integrated management of both honey bees and diverse wild insect assemblages will enhance global crop yields. H uman persistence depends on many nat- ural processes, termed ecosystem ser- vices, which are usually not accounted for in market valuations. The global degrada- tion of such services can undermine the ability of agriculture to meet the demands of the grow- ing, increasingly affluent, human population ( 1, 2). Pollination of crop flowers by wild insects is one such vulnerable ecosystem service (3), as the abundance and diversity of these insects are de- clining in many agricultural landscapes (4, 5). Globally, yields of insect-pollinated crops are often managed for greater pollination through the addition of honey bees (Apis mellifera L.) as an agricultural input (Fig. 1) (6–8). Therefore, the potential impact of wild pollinator decline on crop yields is largely unknown. Nor is it known whether increasing application of honey bees (9) compensates for losses of wild pollinators, or even promotes these losses. Fruit set, the proportion of a plant’ s flowers that develop into mature fruits or seeds, is a key component of crop yield (fig. S1). Wild insects may increase fruit set by contributing to polli- nator abundance, species number (richness), equity in relative species abundance (evenness), or some combination of these factors. Increased pollinator abundance, and therefore the rate of visitation to crop flowers, should augment fruit set at a decelerating rate until additional in- dividuals do not further increase fruit set (e.g., pollen saturation) or even decrease fruit set (e.g., pollen excess) (10–12). Richness of pollinator species should increase the mean, and reduce the variance, of fruit set (13) because of comple- mentary pollination among species (14, 15), fa- cilitation (16, 17), or “sampling effects” ( 18), among other mechanisms (19, 20). Pollinator evenness may enhance fruit set via comple- mentarity, or diminish it if a dominant species (e.g., honey bee) is the most effective pollinator (21). To date, the few studies on the importance of pollinator richness for crop pollination have revealed mixed results (22), the effects of even- ness on pollination services remain largely un- known, and the impact of wild insect loss on fruit set has not been evaluated globally for animal-pollinated crops. We tested four predictions arising from the assumptions that wild insects effectively polli- nate a broad range of crops, and that their role can be replaced by increasing the abundance of honey bees in agricultural fields: (i) For most crops, both wild insect and honey bee visitation enhance pollen deposition on stigmas of flow- ers; (ii) consequently, for most crops, wild insect and honey bee visitation both improve fruit set; (iii) visitation by wild insects promotes fruit set only when honey bees visit infrequently (i.e., there is a negative interaction effect between wild insect visitation and honey bee visitation); and (iv) pollinator assemblages with more spe- cies benefit fruit set only when honey bees visit infrequently (i.e., there is a negative interaction effect between richness and honey bee visitation). To test these predictions, we collected data at 600 fields on all continents, except Antarctica, for 41 crop systems (Fig. 1). Crops included a 1 Sede Andina, Universidad Nacional de Río Negro (UNRN) and ConsejoNacional de Investigaciones Científicas y Técnicas (CONICET), Mitre 630, CP 8400, San Carlos de Bariloche, Río Negro, Argentina. 2 Department of Animal Ecology and Trop- ical Biology, Biocentre, University of Würzburg, Am Hubland, D-97074 Würzburg, Germany. 3 Department of Ecology, Evo- lution and Natural Resources, Rutgers University, New Brunswick, NJ 08901, USA. 4 Laboratorio Ecotono, Centro Regional Univer- sitario Bariloche (CRUB), Universidad Nacional del Comahue and Instituto de Investigaciones en Biodiversidad y Medioambiente (INIBIOMA), CP 8400, San Carlos de Bariloche, Río Negro, Ar- gentina. 5 Department of Ecology, Swedish University of Agricul- tural Sciences, SE-750 07 Uppsala, Sweden. 6 CSIRO Ecosystem Sciences, Box 1700, Canberra, ACT, Australia. 7 Environmental Sciences Policy and Management, 130 Mulford Hall, University of California, Berkeley, CA 94720, USA. 8 School of Biology, University of Leeds, Leeds LS2 9JT, UK. 9 Naturalis Biodiversity Center, P.O. Box 9517, 2300RA Leiden, Netherlands. 10 Depart- ment of Biological Sciences, University of Calgary, Calgary, Alberta T2N 1N4, Canada. 11 Department of Entomology, Robert H. Smith Faculty of Agriculture, Food and Environ- ment, Hebrew University of Jerusalem, Rehovot, Israel. 12 De- partment of Entomology, Evolution and Natural Resources, Rutgers University, New Brunswick, NJ 08901, USA. 13 Institute of Ecology, Ecosystem Functions, Leuphana University, 21335 Lüneburg, Germany. 14 Department of Environmental Systems Science, ETH Zürich, 8092 Zürich, Switzerland. 15 Instituto de Ecología Regional, Facultad de Ciencias Naturales e IML, Universidad Nacional de Tucumán, CC 34, CP 4017, Yerba Buena, Tucumán, Argentina. 16 Ecological Farming Systems, Agroscope Reckenholz-Tänikon Research Station ART, Zürich, Switzerland. 17 Universidade Federal do Ceará, Departamento de Zootecnia–CCA, Campus Universitário do Pici, Bloco 808. 60.356-000 Fortaleza–CE, Brazil. 18 Universidade Federal da Bahia, Departamento de Zoologia, Instituto de Biologia, Rua Barão de Geremoabo, s/n. 40.170-110 Salvador–BA, Brazil. 19 New Zealand Institute for Plant and Food Research, Private Bag 4704, Christchurch, New Zealand. 20 Department of En- tomology, Michigan State University, East Lansing, MI 48824, USA. 21 Agriculture and Agri-Food Canada, Atlantic Food and Horticulture Research Centre, Kentville, Nova Scotia, Canada. 22 Development by Design Program, Nature Conservancy, Fort Collins, CO 80524, USA. 23 Agroecology, Department of Crop Sciences, Georg-August-University, Grisebachstr. 6, 37077 Goettingen, Germany. 24 School of Biological Sciences and Ecol- ogy Centre, University of Queensland, Brisbane, QLD, Australia. 25 Department of Biology, National Center for Research in Natural Sciences, CRSN-Lwiro, D.S. Bukavu, Sud-Kivu, Demo- cratic Republic of Congo. 26 Department of Entomology, Cornell University, New York State Agricultural Experiment Station, 630 West North Street, Geneva, NY 14456, USA. 27 School of Agri- culture, Policy and Development, University of Reading, Read- ing RG6 6AR, UK. 28 Department of Physical Geography and Quaternary Geology, Stockholm University, SE 106 91 Stockholm, Sweden. 29 Gund Institute for Ecological Economics, University of Vermont, Burlington, VT 05401, USA. 30 Department of Biol- ogy, Lund University, SE-223 62 Lund, Sweden. 31 Applied Bio- diversity Research Division, South African National Institute of Biodiversity, Private Bag X7, Claremont, 7735, South Africa. 32 Institute of Ecology and Evolution, Community Ecology, Uni- versity of Bern, 3012 Bern, Switzerland. 33 Ecosystem Analysis, University of Koblenz-Landau, Fortstrasse 7, D-76829 Landau, Germany. 34 Institute of Environmental Sciences, Jagiellonian University, ul. Gronostajowa 7, Kraków 30-387, Poland. 35 De- partment of Forest Entomology, Forestry and Forest Products Research Institute, 1 Matsunosato, Tsukuba, Ibaraki 305-8687, Japan. 36 Departamento de Ciencias Químico-Biológicas, Uni- versidad de las Américas Puebla, Cholula, Puebla, Mexico. 37 Department of Entomology, University of California, Davis, CA 96616, USA. *Corresponding author. E-mail: [email protected] 29 MARCH 2013 VOL 339 SCIENCE www.sciencemag.org 1608 REPORTS
Transcript of Garibaldi et al, 2013 - Rachael Winfree · Wild Pollinators Enhance Fruit Set of Crops Regardless...
Wild Pollinators Enhance FruitSet of Crops Regardless ofHoney Bee AbundanceLucas A. Garibaldi,1* Ingolf Steffan-Dewenter,2 Rachael Winfree,3 Marcelo A. Aizen,4
Riccardo Bommarco,5 Saul A. Cunningham,6 Claire Kremen,7 Luísa G. Carvalheiro,8,9
Lawrence D. Harder,10 Ohad Afik,11 Ignasi Bartomeus,12 Faye Benjamin,3 Virginie Boreux,13,14
Daniel Cariveau,3 Natacha P. Chacoff,15 Jan H. Dudenhöffer,16 Breno M. Freitas,17
Jaboury Ghazoul,14 Sarah Greenleaf,7 Juliana Hipólito,18 Andrea Holzschuh,2 Brad Howlett,19
Rufus Isaacs,20 Steven K. Javorek,21 Christina M. Kennedy,22 Kristin M. Krewenka,23
Smitha Krishnan,14 Yael Mandelik,11 Margaret M. Mayfield,24 Iris Motzke,13,23
Theodore Munyuli,25 Brian A. Nault,26 Mark Otieno,27 Jessica Petersen,26 Gideon Pisanty,11
Simon G. Potts,27 Romina Rader,28 Taylor H. Ricketts,29 Maj Rundlöf,5,30 Colleen L. Seymour,31
Christof Schüepp,32,33 Hajnalka Szentgyörgyi,34 Hisatomo Taki,35 Teja Tscharntke,23
Carlos H. Vergara,36 Blandina F. Viana,18 Thomas C. Wanger,23 Catrin Westphal,23
Neal Williams,37 Alexandra M. Klein13
The diversity and abundance of wild insect pollinators have declined in many agricultural landscapes.Whether such declines reduce crop yields, or are mitigated by managed pollinators such as honeybees, is unclear. We found universally positive associations of fruit set with flower visitation by wildinsects in 41 crop systems worldwide. In contrast, fruit set increased significantly with flower visitationby honey bees in only 14% of the systems surveyed. Overall, wild insects pollinated crops moreeffectively; an increase in wild insect visitation enhanced fruit set by twice as much as an equivalentincrease in honey bee visitation. Visitation by wild insects and honey bees promoted fruit setindependently, so pollination by managed honey bees supplemented, rather than substituted for,pollination by wild insects. Our results suggest that new practices for integrated management ofboth honey bees and diverse wild insect assemblages will enhance global crop yields.
Human persistence depends on many nat-ural processes, termed ecosystem ser-vices, which are usually not accounted
for in market valuations. The global degrada-tion of such services can undermine the abilityof agriculture to meet the demands of the grow-ing, increasingly affluent, human population (1, 2).Pollination of crop flowers by wild insects isone such vulnerable ecosystem service (3), as theabundance and diversity of these insects are de-clining in many agricultural landscapes (4, 5).Globally, yields of insect-pollinated crops are
often managed for greater pollination throughthe addition of honey bees (Apis mellifera L.)as an agricultural input (Fig. 1) (6–8). Therefore,the potential impact of wild pollinator decline oncrop yields is largely unknown. Nor is it knownwhether increasing application of honey bees (9)compensates for losses of wild pollinators, oreven promotes these losses.
Fruit set, the proportion of a plant’s flowersthat develop into mature fruits or seeds, is a keycomponent of crop yield (fig. S1). Wild insectsmay increase fruit set by contributing to polli-
nator abundance, species number (richness),equity in relative species abundance (evenness),or some combination of these factors. Increasedpollinator abundance, and therefore the rate ofvisitation to crop flowers, should augment fruitset at a decelerating rate until additional in-dividuals do not further increase fruit set (e.g.,pollen saturation) or even decrease fruit set (e.g.,pollen excess) (10–12). Richness of pollinatorspecies should increase the mean, and reducethe variance, of fruit set (13) because of comple-mentary pollination among species (14, 15), fa-cilitation (16, 17), or “sampling effects” (18),among other mechanisms (19, 20). Pollinatorevenness may enhance fruit set via comple-mentarity, or diminish it if a dominant species(e.g., honey bee) is the most effective pollinator(21). To date, the few studies on the importanceof pollinator richness for crop pollination haverevealed mixed results (22), the effects of even-ness on pollination services remain largely un-known, and the impact of wild insect loss onfruit set has not been evaluated globally foranimal-pollinated crops.
We tested four predictions arising from theassumptions that wild insects effectively polli-nate a broad range of crops, and that their rolecan be replaced by increasing the abundance ofhoney bees in agricultural fields: (i) For mostcrops, both wild insect and honey bee visitationenhance pollen deposition on stigmas of flow-ers; (ii) consequently, for most crops, wild insectand honey bee visitation both improve fruit set;(iii) visitation by wild insects promotes fruit setonly when honey bees visit infrequently (i.e.,there is a negative interaction effect betweenwild insect visitation and honey bee visitation);and (iv) pollinator assemblages with more spe-cies benefit fruit set only when honey bees visitinfrequently (i.e., there is a negative interactioneffect between richness and honey bee visitation).
To test these predictions, we collected data at600 fields on all continents, except Antarctica,for 41 crop systems (Fig. 1). Crops included a
1Sede Andina, Universidad Nacional de Río Negro (UNRN)and Consejo Nacional de Investigaciones Científicas y Técnicas(CONICET), Mitre 630, CP 8400, San Carlos de Bariloche, RíoNegro, Argentina. 2Department of Animal Ecology and Trop-ical Biology, Biocentre, University of Würzburg, Am Hubland,D-97074 Würzburg, Germany. 3Department of Ecology, Evo-lution and Natural Resources, Rutgers University, New Brunswick,NJ 08901, USA. 4Laboratorio Ecotono, Centro Regional Univer-sitario Bariloche (CRUB), Universidad Nacional del Comahue andInstituto de Investigaciones en Biodiversidad y Medioambiente(INIBIOMA), CP 8400, San Carlos de Bariloche, Río Negro, Ar-gentina. 5Department of Ecology, Swedish University of Agricul-tural Sciences, SE-750 07 Uppsala, Sweden. 6CSIRO EcosystemSciences, Box 1700, Canberra, ACT, Australia. 7EnvironmentalSciences Policy and Management, 130 Mulford Hall, Universityof California, Berkeley, CA 94720, USA. 8School of Biology,University of Leeds, Leeds LS2 9JT, UK. 9Naturalis BiodiversityCenter, P.O. Box 9517, 2300RA Leiden, Netherlands. 10Depart-ment of Biological Sciences, University of Calgary, Calgary,Alberta T2N 1N4, Canada. 11Department of Entomology,Robert H. Smith Faculty of Agriculture, Food and Environ-ment, Hebrew University of Jerusalem, Rehovot, Israel. 12De-partment of Entomology, Evolution and Natural Resources,Rutgers University, New Brunswick, NJ 08901, USA. 13Institute
of Ecology, Ecosystem Functions, Leuphana University, 21335Lüneburg, Germany. 14Department of Environmental SystemsScience, ETH Zürich, 8092 Zürich, Switzerland. 15Instituto deEcología Regional, Facultad de Ciencias Naturales e IML,Universidad Nacional de Tucumán, CC 34, CP 4017, YerbaBuena, Tucumán, Argentina. 16Ecological Farming Systems,Agroscope Reckenholz-Tänikon Research Station ART, Zürich,Switzerland. 17Universidade Federal do Ceará, Departamentode Zootecnia–CCA, Campus Universitário do Pici, Bloco 808.60.356-000 Fortaleza–CE, Brazil. 18Universidade Federal daBahia, Departamento de Zoologia, Instituto de Biologia, RuaBarão de Geremoabo, s/n. 40.170-110 Salvador–BA, Brazil.19New Zealand Institute for Plant and Food Research, PrivateBag 4704, Christchurch, New Zealand. 20Department of En-tomology, Michigan State University, East Lansing, MI 48824,USA. 21Agriculture and Agri-Food Canada, Atlantic Food andHorticulture Research Centre, Kentville, Nova Scotia, Canada.22Development by Design Program, Nature Conservancy, FortCollins, CO 80524, USA. 23Agroecology, Department of CropSciences, Georg-August-University, Grisebachstr. 6, 37077Goettingen, Germany. 24School of Biological Sciences and Ecol-ogy Centre, University of Queensland, Brisbane, QLD, Australia.25Department of Biology, National Center for Research inNatural Sciences, CRSN-Lwiro, D.S. Bukavu, Sud-Kivu, Demo-
cratic Republic of Congo. 26Department of Entomology, CornellUniversity, New York State Agricultural Experiment Station, 630West North Street, Geneva, NY 14456, USA. 27School of Agri-culture, Policy and Development, University of Reading, Read-ing RG6 6AR, UK. 28Department of Physical Geography andQuaternary Geology, Stockholm University, SE 106 91 Stockholm,Sweden. 29Gund Institute for Ecological Economics, Universityof Vermont, Burlington, VT 05401, USA. 30Department of Biol-ogy, Lund University, SE-223 62 Lund, Sweden. 31Applied Bio-diversity Research Division, South African National Institute ofBiodiversity, Private Bag X7, Claremont, 7735, South Africa.32Institute of Ecology and Evolution, Community Ecology, Uni-versity of Bern, 3012 Bern, Switzerland. 33Ecosystem Analysis,University of Koblenz-Landau, Fortstrasse 7, D-76829 Landau,Germany. 34Institute of Environmental Sciences, JagiellonianUniversity, ul. Gronostajowa 7, Kraków 30-387, Poland. 35De-partment of Forest Entomology, Forestry and Forest ProductsResearch Institute, 1 Matsunosato, Tsukuba, Ibaraki 305-8687,Japan. 36Departamento de Ciencias Químico-Biológicas, Uni-versidad de las Américas Puebla, Cholula, Puebla, Mexico.37Department of Entomology, University of California, Davis, CA96616, USA.
*Corresponding author. E-mail: [email protected]
29 MARCH 2013 VOL 339 SCIENCE www.sciencemag.org1608
REPORTS
wide array of animal-pollinated, annual andperennial fruit, seed, nut, and stimulant crops;predominantly wind-pollinated crops were notconsidered (fig. S2 and table S1). The sampledfields were subject to a diversity of agriculturalpractices, including extensive monocultures andsmall or diversified systems (fig. S2 and tableS1), fields stocked with low to high density ofhoney bees (Fig. 1 and table S2), and fields withlow to high abundance and diversity of wildinsects (fig. S3 and table S2). For each field, wemeasured flower visitation per unit of time (here-after “visitation”) for each insect species, fromwhich we estimated species richness and even-ness (23). We quantified pollen deposition for14 systems as the number of pollen grains perstigma, and fruit set (fig. S1) for 32 systems asthe percentage of flowers setting mature fruitsor seeds. Spatial or temporal variation of pollendeposition and fruit set were measured as thecoefficient of variation (CV) over sample pointsor days within each field (10). The multileveldata provided by fields within systems wereanalyzed with general linear mixed-effects mod-els that included crop system as a random effect,and wild insect visitation, honey bee visitation,evenness, richness, and all their interactions asfixed effects. Best-fitting models were selectedon the basis of the Akaike information criterion(AIC) (23).
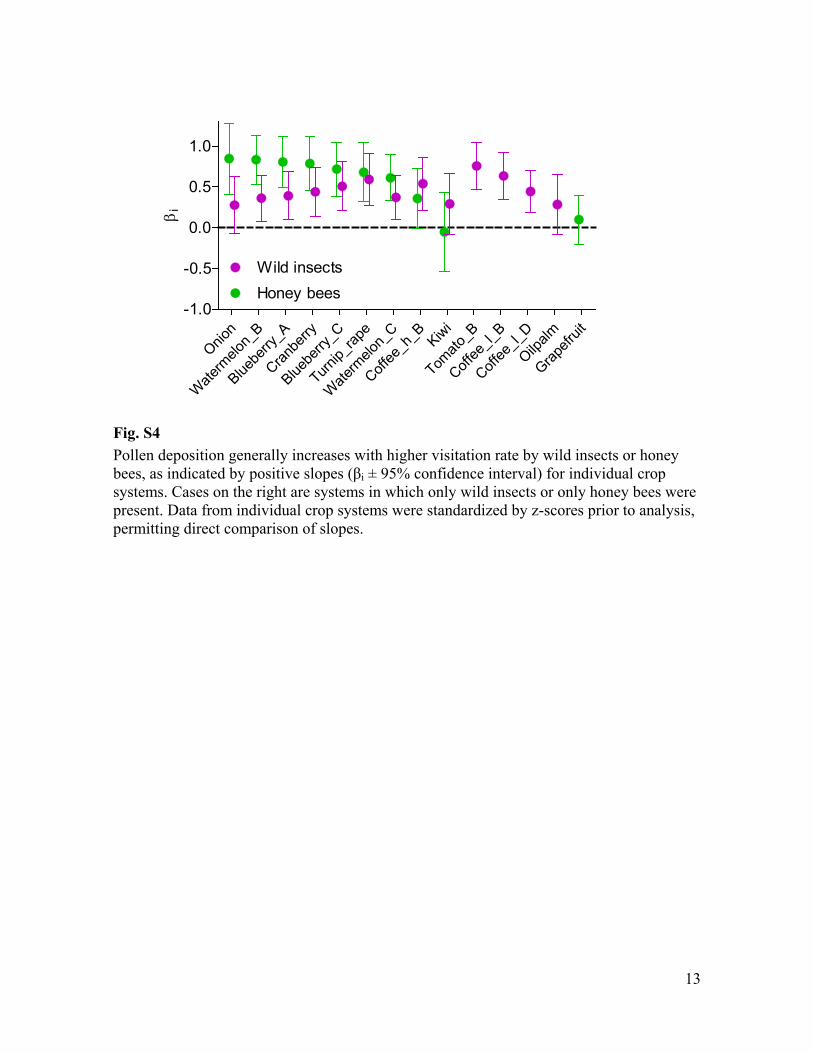
In agreement with the first prediction, cropsin fields with more flower visits received morepollen on stigmas, with an overall 74% strongerinfluence of visitation by honey bees than bywild insects (Fig. 2A and table S3). Honey beevisitation significantly increased pollen deposi-tion (i.e., confidence intervals for individual re-gression coefficients, bi, did not include zero)in 7 of 10 crop systems, and wild insects in 10
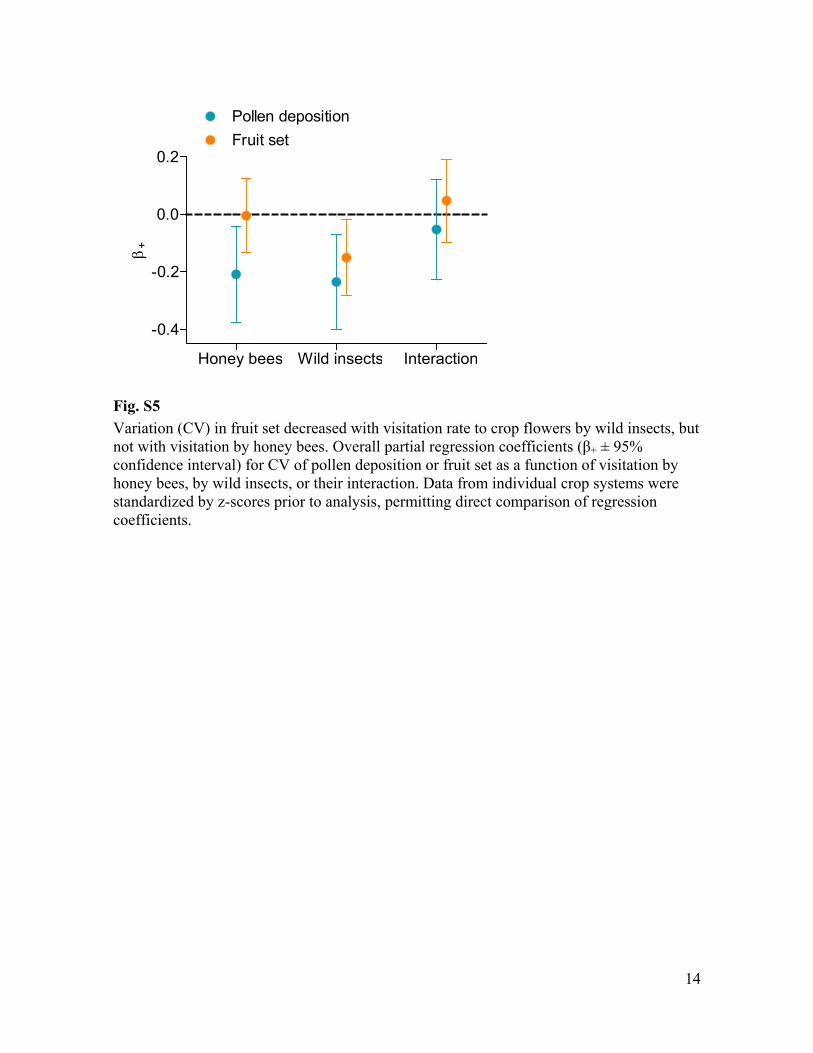
of 13 systems (fig. S4). Correspondingly, in-creased wild insect and honey bee visitationreduced variation in pollen deposition amongsamples (fig. S5).
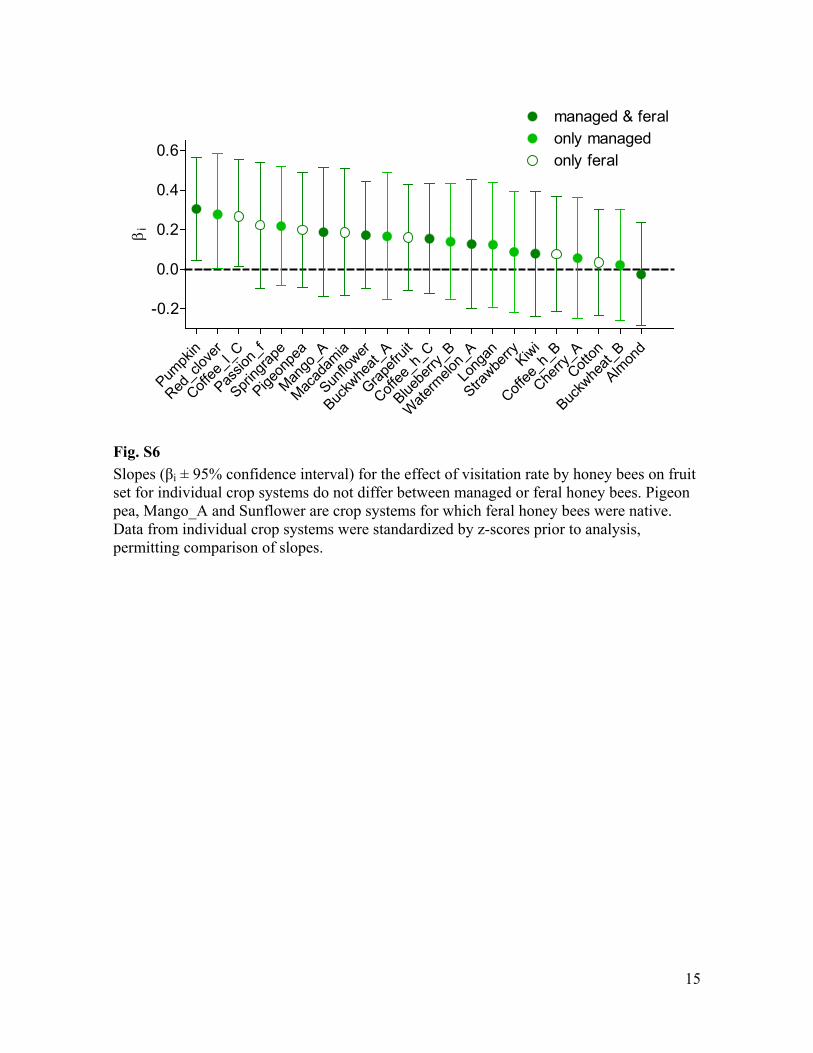
Contrary to the second prediction, fruit setincreased significantly with wild insect visita-tion in all crop systems, but with honey beevisitation in only 14% of the systems (Fig. 2B).In addition, fruit set increased twice as stronglywith visitation by wild insects as with visitationby honey bees (Fig. 2A). These partial regres-sion coefficients did not differ simply becauseof unequal abundance, nor because of dispar-ate variation in visitation between wild insectsand honey bees. In crop systems visited by bothhoney bees and wild insects, honey bees ac-counted for half of the visits to crop flowers[mean = 51%; 95% confidence interval (CI) = 40to 62%], and among-field CVs for visitation byhoney bees (mean = 73%; 95% CI = 57 to 88%)and by wild insects (mean = 79%; 95% CI = 62to 96%) were equivalent. Furthermore, wild in-sect visitation had stronger effects than honeybee visitation, regardless of whether honey beeswere managed or feral (fig. S6) and, compar-ing across systems, even where only wild insectsor honey bees occurred (Fig. 2B). Wild insectvisitation alone predicted fruit set better than didhoney bee visitation alone (DAIC = 16; table S4,model F versus model M). Correspondingly,the CV of fruit set decreased with wild insectvisitation but varied independently of honey beevisitation (fig. S5).
Pollinator visitation affected fruit set lessstrongly than did pollen deposition on stigmas(compare regression coefficients in Fig. 2A). Thiscontrast likely arose from pollen excess, filteringof pollen tubes by post pollination processes,and/or seed abortion (11, 24), and so reflects pol-
lination quality, in part. Intriguingly, the differ-ence in coefficients between pollen depositionand fruit set for honey bees greatly exceededthat for wild insects (Fig. 2A); this finding in-dicates that wild insects provide better-qualitypollination, such as greater cross-pollination(14, 16, 17, 19). These results occurred regardlessof which crop systems were selected (fig. S7),sample size (fig. S8), the relative frequency ofhoney bees in the pollinator assemblage (domi-nance) among systems, the pollinator depen-dence of crops, or whether the crop species wereherbaceous or woody, or native or exotic (fig.S9). Poor-quality pollination could arise if for-aging behavior on focal resources typical of honeybees (16, 17) causes pollen transfer betweenflowers of the same plant individual or the samecultivar within a field, thereby limiting cross-pollination and increasing the incidence of self-pollen interference and inbreeding depression (24).The smaller difference in coefficients betweenpollen deposition and fruit set for wild insects,and the stronger effect of wild insect visitationon fruit set, suggest that management to promotediverse wild insects has great potential to im-prove the global yield of animal-pollinated crops.
The third prediction was also not supported.Fruit set consistently increased with visitationby wild insects, even where honey bees visitedfrequently (i.e., no statistical interaction; Fig. 2,A and C). In particular, the best-fitting model(lowest AIC) for fruit set included additive ef-fects of visitation by both wild insects and hon-ey bees (table S4, model P), which suggests thatmanaged honey bees supplement the polli-nation service of wild insects but cannot re-place it. Overall, visitations by wild insects andhoney bees were not correlated among fields(fig. S10), providing no evidence either for
Wild insectsHoney bees
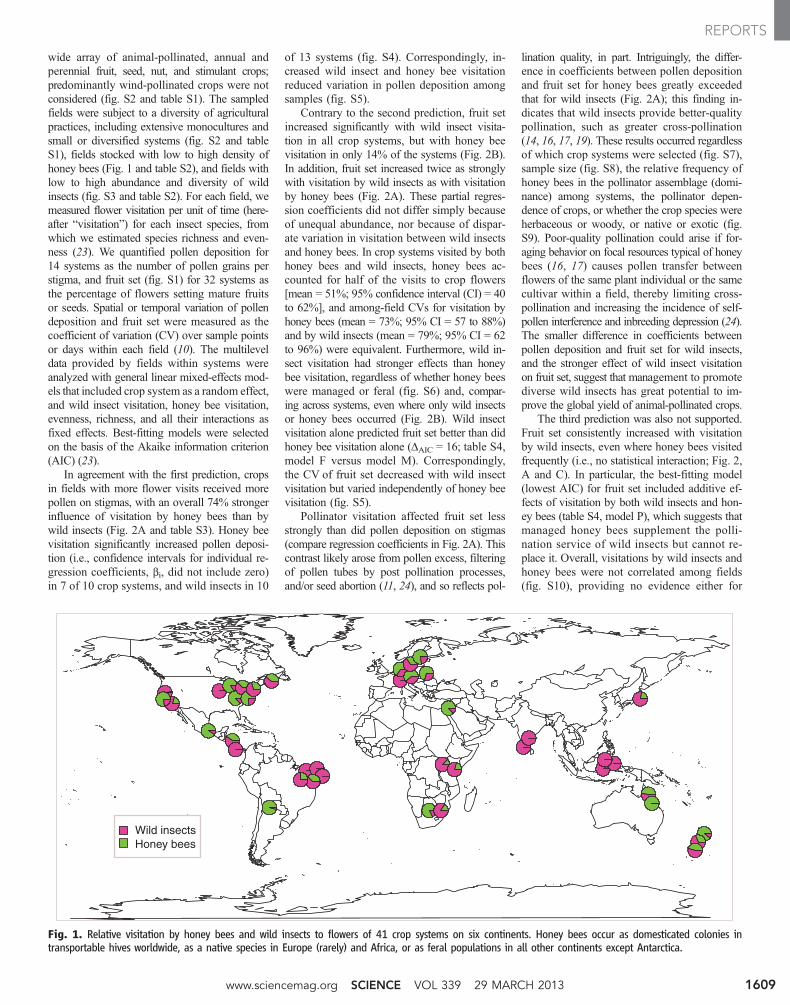
Fig. 1. Relative visitation by honey bees and wild insects to flowers of 41 crop systems on six continents. Honey bees occur as domesticated colonies intransportable hives worldwide, as a native species in Europe (rarely) and Africa, or as feral populations in all other continents except Antarctica.
www.sciencemag.org SCIENCE VOL 339 29 MARCH 2013 1609
REPORTS
competition for the resources obtained from cropflowers (pollen, nectar) or for density compensa-tion (13) between wild insects and honey beesat the field scale. Even if honey bees displacewild insects (or vice versa) at the flower scale(16, 17), this is unlikely to scale up to the field,as indicated by our data, if mass-flowering cropsprovide floral resources in excess of what canbe exploited by local pollinator populations.Therefore, insect pollinators appear not to belimited by crop floral resources, but crop yieldwas commonly pollen-limited, as crops set morefruit in fields with more visitation by pollinators(Fig. 2).
Contrary to the fourth prediction, fruit setincreased with flower-visitor richness indepen-
dently of honey bee visitation (fig. S11). Corre-spondingly, the CVs of fruit set decreased withrichness; in contrast, evenness did not affect themean or CV of fruit set (figs. S12 and S13). Vis-itation by wild insects increased strongly withrichness (Fig. 3) and improved model fit (lowerAIC), even when richness was included in themodel (table S4, model B versus model G).However, richness did not enhance model fitwhen added to a model with wild insect visi-tation (table S4, model F versus model G), whichsuggests that the effects of richness on fruit setreflect increased wild insect visitation (i.e., co-linear effects; fig. S13). Like wild insect visita-tion (fig. S10), richness did not correlate withhoney bee visitation (table S5). Previous studies
have shown that agricultural intensification re-duces both species richness of pollinator assem-blages and wild insect visitation (4, 5, 13, 19).Our results for multiple crop systems furtherdemonstrate that fields with fewer pollinatorspecies experience less visitation by wild insectsand reduced fruit set, independent of speciesevenness or honey bee visitation. Globally, wildinsect visitation is an indicator of both speciesrichness and pollination services, and its measure-ment can be standardized easily and inexpen-sively among observers in field samples (25).
Large, active colonies of honey bees provideabundant pollinators that can be moved as needed,hence their appeal for pollination managementin most animal-pollinated crops (6–8, 26). By
A B
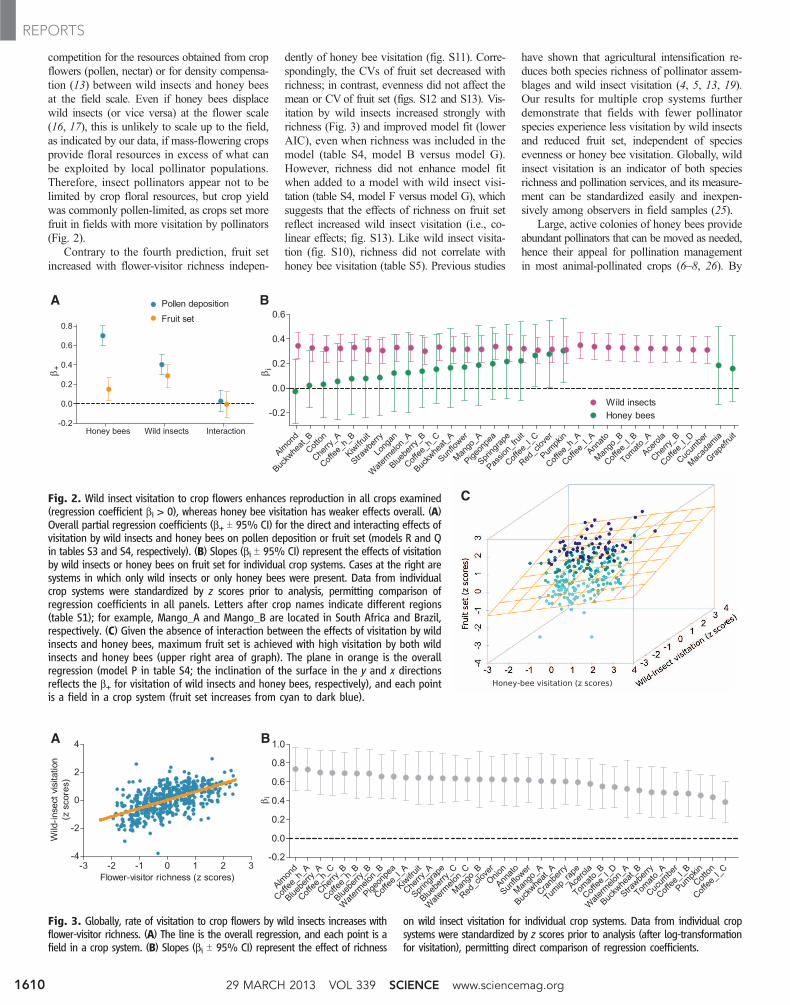
Fig. 3. Globally, rate of visitation to crop flowers by wild insects increases withflower-visitor richness. (A) The line is the overall regression, and each point is afield in a crop system. (B) Slopes (bi T 95% CI) represent the effect of richness
on wild insect visitation for individual crop systems. Data from individual cropsystems were standardized by z scores prior to analysis (after log-transformationfor visitation), permitting direct comparison of regression coefficients.
A B
C
i
Fig. 2. Wild insect visitation to crop flowers enhances reproduction in all crops examined(regression coefficient bi > 0), whereas honey bee visitation has weaker effects overall. (A)Overall partial regression coefficients (b+ T 95% CI) for the direct and interacting effects ofvisitation by wild insects and honey bees on pollen deposition or fruit set (models R and Qin tables S3 and S4, respectively). (B) Slopes (bi T 95% CI) represent the effects of visitationby wild insects or honey bees on fruit set for individual crop systems. Cases at the right aresystems in which only wild insects or only honey bees were present. Data from individualcrop systems were standardized by z scores prior to analysis, permitting comparison ofregression coefficients in all panels. Letters after crop names indicate different regions(table S1); for example, Mango_A and Mango_B are located in South Africa and Brazil,respectively. (C) Given the absence of interaction between the effects of visitation by wildinsects and honey bees, maximum fruit set is achieved with high visitation by both wildinsects and honey bees (upper right area of graph). The plane in orange is the overallregression (model P in table S4; the inclination of the surface in the y and x directionsreflects the b+ for visitation of wild insects and honey bees, respectively), and each pointis a field in a crop system (fruit set increases from cyan to dark blue).
29 MARCH 2013 VOL 339 SCIENCE www.sciencemag.org1610
REPORTS
comparison, methods for maintaining diversewild insects for crop pollination are less devel-oped, and research on such pollination servicesis more recent (3, 16, 17, 20, 26, 27) (table S1).Although honey bees are generally viewed as asubstitute for wild pollinators (3, 6–8), our re-sults show that they neither maximize pollinationnor fully replace the contributions of diverse wildinsect assemblages to fruit set for a broad rangeof crops and agricultural practices on all conti-nents with farmland. These conclusions hold evenfor crops stocked routinely with high densitiesof honey bees for pollination, such as almond,blueberry, and watermelon (Fig. 2 and table S2).Dependence on a single species for crop pollina-tion also carries the risks associated with predator,parasite, and pathogen development (4, 20, 28).
Our results support integrated managementpolicies (29) that include pollination by wild in-sects as ecosystem service providers, along withmanaged species—such as honey bees, bumblebees (Bombus spp.), leafcutter bees (Megachilespp.), mason bees (Osmia spp.), and stinglessbees (Meliponini)—as agricultural inputs, wherethey are not invasive species. Such policies shouldinclude conservation or restoration of natural orseminatural areas within croplands, promotionof land-use heterogeneity (patchiness), additionof diverse floral and nesting resources, and con-sideration of pollinator safety as it relates to pes-ticide application (3, 16, 17, 20, 27). Some ofthese recommendations entail financial and op-
portunity costs, but the benefits of implementingthem include mitigation against soil erosion aswell as improvements in pest control, nutrientcycling, and water-use efficiency (30). Withoutsuch changes, the ongoing loss of wild insects(4, 5) is destined to compromise agriculturalyields worldwide.
References and Notes1. L. Roberts, Science 333, 540 (2011).2. D. Tilman et al., Science 292, 281 (2001).3. A.-M. Klein et al., Proc. R. Soc. London Ser. B 274, 303
(2007).4. S. G. Potts et al., Trends Ecol. Evol. 25, 345 (2010).5. L. A. Garibaldi et al., Ecol. Lett. 14, 1062 (2011).6. R. A. Morse, Trends Ecol. Evol. 6, 337 (1991).7. R. M. Goodwin, H. M. Cox, M. A. Taylor, L. J. Evans,
H. M. McBrydie, New Zeal. J. Crop Hort. 39, 7 (2011).8. R. R. Rucker, W. N. Thurman, M. Burgett, Am. J.
Agric. Econ. 94, 956 (2012).9. M. A. Aizen, L. D. Harder, Curr. Biol. 19, 915 (2009).10. L. A. Garibaldi, M. A. Aizen, A.-M. Klein, S. A. Cunningham,
L. D. Harder, Proc. Natl. Acad. Sci. U.S.A. 108, 5909 (2011).11. N. P. Chacoff, M. A. Aizen, V. Aschero, Proc. R. Soc.
London Ser. B 275, 907 (2008).12. W. F. Morris, D. P. Vázquez, N. P. Chacoff, Ecology 91,
1276 (2010).13. R. Winfree, C. Kremen, Proc. R. Soc. London Ser. B 276,
229 (2009).14. P. Hoehn, T. Tscharntke, J. M. Tylianakis, I. Steffan-Dewenter,
Proc. R. Soc. London Ser. B 275, 2283 (2008).15. N. Blüthgen, A.-M. Klein, Basic Appl. Ecol. 12, 282 (2011).16. L. G. Carvalheiro et al., Ecol. Lett. 14, 251 (2011).17. S. S. Greenleaf, C. Kremen, Proc. Natl. Acad. Sci. U.S.A.
103, 13890 (2006).18. B. J. Cardinale et al., Nature 443, 989 (2006).19. A.-M. Klein, C. Müller, P. Hoehn, C. Kremen, in
Biodiversity, Ecosystem Functioning, and Human
Wellbeing: An Ecological and Economic Perspective,D. E. Bunker, A. Hector, M. Loreau, C. Perrings,S. Naeem, Eds. (Oxford Univ. Press, Oxford, 2009),pp. 195–208.
20. T. Tscharntke, A.-M. Klein, A. Kruess, I. Steffan-Dewenter,C. Thies, Ecol. Lett. 8, 857 (2005).
21. H. Hillebrand, D. M. Bennett, M. W. Cadotte, Ecology 89,1510 (2008).
22. B. J. Cardinale et al., Nature 486, 59 (2012).23. See supplementary materials on Science Online.24. M. A. Aizen, L. D. Harder, Ecology 88, 271 (2007).25. C. Kremen, K. S. Ullman, R. W. Thorp, Conserv. Biol. 25,
607 (2011).26. K. S. Delaplane, D. F. Mayer, Crop Pollination by Bees
(CABI, New York, 2000).27. C. Kremen et al., Ecol. Lett. 10, 299 (2007).28. R. Winfree, N. M. Williams, J. Dushoff, C. Kremen,
Ecol. Lett. 10, 1105 (2007).29. A. Aebi et al., Trends Ecol. Evol. 27, 142 (2012).30. S. D. Wratten, M. Gillespie, A. Decourtye, E. Mader,
N. Desneux, Agric. Ecosyst. Environ. 159, 112 (2012).
Acknowledgments: Funding acknowledgments and authorcontributions are listed in the supplementary materials.The data used in the primary analyses are available in thesupplementary materials, including tables S1 and S2.
Supplementary Materialswww.sciencemag.org/cgi/content/full/science.1230200/DC1Materials and MethodsSupplementary TextFigs. S1 to S13Tables S1 to S5References (31–79)Database S1
14 September 2012; accepted 5 February 2013Published online 28 February 2013;10.1126/science.1230200
Plant-Pollinator Interactionsover 120 Years: Loss of Species,Co-Occurrence, and FunctionLaura A. Burkle,1,2* John C. Marlin,3 Tiffany M. Knight1
Using historic data sets, we quantified the degree to which global change over 120 yearsdisrupted plant-pollinator interactions in a temperate forest understory community in Illinois,USA. We found degradation of interaction network structure and function and extirpation of50% of bee species. Network changes can be attributed to shifts in forb and bee phenologiesresulting in temporal mismatches, nonrandom species extinctions, and loss of spatialco-occurrences between extant species in modified landscapes. Quantity and quality of pollinationservices have declined through time. The historic network showed flexibility in response todisturbance; however, our data suggest that networks will be less resilient to future changes.
Almost 90% of flowering plant species,including many important crop species(1), rely on animal pollinators (2). Plant-
pollinator interaction networks may be particu-larly susceptible to anthropogenic changes, owingto their sensitivity to the phenology, behavior,
physiology, and relative abundances of multiplespecies (3). Alternatively, the overall structure ofplant-pollinator networks might be robust to per-turbations because of a high degree of nestednessand redundancy in interactions (4).
Several authors have speculated about howchanges in biodiversity (5) and phenology (6–8)might translate into changes in the structure (9, 10)and stability (11) of complex interaction networks.However, there has been a lack of historical dataon plant-pollinator networks and phenologies forboth plants and insects in the same community.
By using an extensive and unique data set, wewere able to examine changes in plant-pollinatornetwork structure and phenologies of forbs andbees across more than a century of anthropogenicchange.
In the late 1800s, Charles Robertson metic-ulously collected and categorized insect visitorsto plants, as well as plant and insect phenolo-gies, in natural habitats near Carlinville, Illinois,USA (12–14). Over the next century, this regionexperienced severe habitat alteration, includingconversion of most forests and prairies to agri-culture, and moderate climatic warming of 2°C inwinter and spring. In 2009 and 2010, we revisitedthe area studied by Robertson and re-collecteddata on the phenologies and structure of a subsetof this network—26 spring-blooming forest un-derstory forbs and their 109 pollinating bees(15). Hence, we could quantify changes in net-work structure, local bee diversity, and phenol-ogies of forbs and bees. Further analyses and anull model determined the degree to which changesin network structure and bee diversity were at-tributed to species’ traits, phenological mismatches,and land-use factors that spatially separate inter-acting species. To examine shifts in the quantityof pollinator services, we used a second histor-ical data set from Carlinville collected in theearly 1970s (16), examining the diversity andvisitation rate of bees to the most important floralresource in this network (Claytonia virginica).
1Washington University, Department of Biology, St. Louis, MO63130, USA. 2Montana State University, Department of Ecol-ogy, Bozeman, MT 59717, USA. 3University of Illinois, IllinoisSustainable Technology Center, Champaign, IL 61820, USA.
*Corresponding author. E-mail: [email protected]
www.sciencemag.org SCIENCE VOL 339 29 MARCH 2013 1611
REPORTS
www.sciencemag.org/cgi/content/full/science.1230200/DC1
Supplementary Materials for
Wild Pollinators Enhance F ruit Set of C rops Regardless of Honey Bee
Abundance
Lucas A. Garibaldi,* Ingolf Steffan-Dewenter, Rachael Winfree, Marcelo A. Aizen, Riccardo Bommarco, Saul A. Cunningham, Claire Kremen, Luísa G. Carvalheiro, Lawrence D. Harder, Ohad Afik, Ignasi Bartomeus, Faye Benjamin, Virginie Boreux, Daniel Cariveau, Natacha P. Chacoff, Jan H. Dudenhöffer, Breno M. Freitas, Jaboury Ghazoul, Sarah Greenleaf, Juliana Hipólito, Andrea Holzschuh, Brad Howlett, Rufus Isaacs, Steven K. Javorek, Christina M. Kennedy, Kristin Krewenka, Smitha Krishnan, Yael Mandelik, Margaret M. Mayfield, Iris
Motzke, Theodore Munyuli, Brian A. Nault, Mark Otieno, Jessica Petersen, Gideon Pisanty, Simon G. Potts, Romina Rader, Taylor H. Ricketts, Maj Rundlöf, Colleen L. Seymour, Christof Schüepp, Hajnalka Szentgyörgyi, Hisatomo Taki, Teja Tscharntke, Carlos H. Vergara, Blandina
F. Viana, Thomas C. Wanger, Catrin Westphal, Neal Williams, Alexandra M. Klein *To whom correspondence should be addressed. E-mail: [email protected]
Published 28 February 2013 on Science Express DOI: 10.1126/science.1230200
This PD F file includes:
Materials and Methods Supplementary Text Figs. S1 to S13 Tables S1 to S5 References (31 79) Caption for Database S1
Other Supplementary Material for this manuscript includes the following:
Database S1 [Database_S1.txt]
1
Materials and Methods Crop systems and pollinator species
We sampled 600 fields of 41 crop systems in 19 countries from all continents except
Antarctica (Fig. 1 and table S1). Crop systems are defined as a given crop species in a particular region subject to similar management (table S1). We restricted our study to field data to analyze the impact of wild insect loss on a global scale. We collected data matching the following selection criteria: (1) data sampled from at least three spatially separated fields, (2) direct standardized observations of insect species visiting crop flowers in the sampled fields, and (3) a standardized estimate of pollination success, i.e. pollen deposition and (or) seed or fruit set, for sampled fields. The crops considered include a wide array of annual and perennial fruit, seed, nut, and stimulant crops that are pollinator dependant to some degree (fig. S2 and table S1). Crops pollinated primarily by wind were not studied. Crop systems were selected to represent the spectrum of management practices (traditional, intensive agriculture, organic certified agriculture, sun vs. shade), landscape settings (cleared, simple, complex landscapes), crop species and varieties (growth form, breeding system, pollinator dependence), abiotic and biotic variables, and we also included crops in their native and non-native (exotic crops) range (fig. S2 and table S1). Fields also encompassed a wide contrast of pollination management practices, from high densities of honey bees managed exclusively for pollination to fields with low densities of honey bees. For example, in California (USA), surveyed fields ranged from extensive monocultures of almonds with honey-bee stocking rates of 6.5 hive ha-1 to small fields of organic-certified tomato production without honey-bee management (table S1). We also included examples of traditional agriculture in diversified landscapes, such as pumpkin growing in smallholder vegetable gardens of Indonesia (fig. S2 and table S1).
Apis mellifera was the only managed pollinator, except for coffee_ l_B and coffee_l_D (lowland coffee in India), for which Apis cerana indica was the common managed pollinator species. For coffee_1_B and coffee_l_D we excluded A. cerana indica from the analysis to evaluate the relation of fruit set to wild insects only, and we use "honey bee" in reference to only Apis mellifera. Managed colonies of honey bees were present in the landscapes of 52% of the systems, and in half of those systems colonies were managed purposefully for pollination of the studied crop (table S2).
Our study included many wild insect species, and fields with contrasting diversity and abundance of wild insects (fig. S3 and table S2). Most of the wild insects observed visiting flowers on the 41 crop systems were bees (Hymenoptera: Apoidea, Apiformes). Bee taxa observed regularly included stingless bees (Apidae: Meliponini), bumble bees (Apidae: Bombus spp.), apex-furrowed (or sweat) bees (Halictidae), plasterer bees (Colletidae), carpenter bees (Apidae: Xylocopini), small carpenter bees (Apidae: Ceratinini), Andrena bees (Andrenidae) and the giant honey bee (Apis dorsata) (bee taxonomy follows (31)). In some crop systems, syrphid flies (Diptera: Syrphidae), other flies, ants (Hymenoptera: Formicidae), and various beetle species (Coleoptera) occurred as dominant wild flower visitors (table S2).
2
In some agricultural landscapes, our samples may include more fields with high abundance of wild insects than is typical, because we sought to explore the roles of wild pollinators. This possibility is most likely for crops grown typically as extensive monocultures, with an attendant low abundance of wild insects. Our samples covered these situations, but also included fields with higher abundances of wild insects. This sampling emphasis does not invalidate the conclusions drawn from our study. On the contrary, it provided the contrast required to quantify the general relation of fruit set to flower visitation and the consequences of the loss of wild insects, rather than to quantify the relative importance of honey bees and wild insects for current agricultural production (e.g. tonnes per country). In addition, analysis of a subset of crop systems produced qualitatively similar results to the analysis of all systems (fig. S7), indicating that our conclusions are not biased by selection of crop systems. Furthermore, the relations of fruit set to visitation by honey bees and wild insects did not vary with sample sizes of individual crop systems (fig. S8), the relative frequency of honey bees in the pollinator assemblage (dominance), the pollinator dependence of crops, or whether the crop species were herbaceous or woody, native or exotic (fig. S9).
Variables In multiple fields of each of the 41 animal-pollinated crop systems (Fig 1 and tables
S2 and S3), we measured insect visitation rate, pollen deposition, and (or) fruit set to quantify different aspects of reproduction. Visitation rate (hereafter visitation) to crop flowers per insect species (or morphospecies) was measured as the number of visits per unit time and flower number. In nine systems, namely, blueberry_A, blueberry_C, buckwheat_A, cherry_A, cranberry, pigeon pea, strawberry, turnip rape, and watermelon_A (table S1), visitation was standardized with respect to a measure other than flower number (such as number of branches or standardized area), because, for example, some crops have hundreds of small flowers per plant, so visits could not be counted accurately per flower. This methodological difference should not introduce any bias in our analyses, as we focused on relative changes within each system through z-scores (see below). We analyzed visitation by honey bees and all other insects (referred to as wild insects) separately. Our analyses treated honey bees as a single group, because workers from managed or feral colonies cannot be distinguished in field observations of crop flowers.
We estimated richness as the number of species of flower visitors per field (mean = 9 species, SE = 1 species). We estimated five indices of evenness, because various indices of evenness have different properties and weight rare and abundant species differently. In particular, we employed the four indices proposed by (32), E1/DEvar, and J (33). As the five indices showed similar patterns (fig. S12), we present results for only Evar, as recommended by (32). We included honey bees in estimates of both species richness and evenness.
Pollen deposition was measured in 14 crop systems as the number of crop pollen grains deposited per stigma in several open-pollinated flowers per field, except for four systems (blueberry_A, cranberry, tomato_B, and watermelon_B) for which aggregate pollen deposition for each pollinator species was measured as the product of the number
3
of visits and the mean number of pollen grains deposited during a single visit (table S1). The latter systems showed the same patterns as those for which pollen deposition was measured on open-pollinated stigmas (fig. S4). Mature fruit set, the percentage of flowers setting fruits or seeds at ripeness or harvest, was measured in 32 crop systems (table S1 provides detailed information about the systems in which we measured pollen deposition and [or] fruit set). Fruit set was the main measure of pollination success and is an important component of fruit or seed yield per plant (yield = number ! weight per fruit; see Fig S1). Given that we measured fruit set in several plants or plots per field (table S1) subjected to open pollination, our results properly represent mean (or coefficient of variation, see below) field conditions and are not biased by resource translocation within the plants to different flowers. For systems for which visitation, pollen deposition or fruit set data were available for more than one year, we selected the year with most fields as the first criterion and most within-field measures as the second criterion to avoid pseudo-replication.
We assessed the influences of predictors (see Statistical analyses below) on both mean fruit set (or pollen deposition) per field, and its variation, as measured by the coefficient of variation (CV) (5). We estimated the temporal or spatial CV using data from different days during the flowering season or from different plant individuals or transects in each field, respectively, depending on data availability for the system (table S1). Observations for each variable (y) in each field (j) in each system (i) were
standardized using z-scores )(i
iji
SDyy
to allow comparison, despite contrasting means
)( iy and standard deviations )( iSD among systems, and differences in methodology (table S1 shows additional methods for each system). Unlike other standardizations (such as logarithms), z-scores do not modify the functional form (e.g. linear or non-linear) of the relation between response and predictor variables. Additional information concerning unpublished studies
Methods for all the studies not described below are published elsewhere (see
references in table S1). Insect visitation to flowers of acerola, annatto and cotton (tables S1 and S2) was
assessed following the same general methodology by choosing four (annatto) to five (acerola and cotton) plants at random, monitoring floral visitors during a fixed period, and counting the flowers they visited. Plants were monitored at different times of the day according to anthesis and floral longevity for each plant species. Acerola flowers were monitored five times per day (6, 9, 12, 15, 18 h), cotton flowers six times (7, 9, 11, 13, 15, 17 h) and annatto seven times (5, 6, 7, 8, 9, 10, 11 h) during at least six days per month during the blooming season. Each observation lasted 15 min and floral visitors were recorded, captured using sweep nets, and fixed in ethyl acetate. Later, they were pinned and identified. Pollination success was assessed as the percentage of flowers setting fruits at harvest.
In the Cucumber system in Indonesia (tables S1 and S2), insect visitation to flowers was assessed in 2011 on 25 fields. Visitors to five plants per field were counted during a
4
5-min observation period per day, between 9 and 14h during three days within the two-week flowering period. All insects were caught for identification. Fruit set was calculated as the ratio of the number of harvested fruits to the number of flowers.
In the Mango_A system in South Africa (tables S1 and S2), insect visitation was assessed by walking slowly (0.1-0.2 m2 s-1) along a 60 x 2 m transect composed of two linear 30 m sections parallel to the crop rows. All flower visitors that contacted the stigma or anthers were counted for a minimum of 5s. Visitation was surveyed during peak flowering season (August and September 2009; two surveys per plot about four weeks apart) in orchards with >75% of inflorescences in the plot in bloom, on warm, still, dry days (temperatures 20 39 °C, wind speed < 4 km.h-1) between 8 and 16h. When possible, flower visitors were collected, sorted to morphospecies and subsequently sent to professional taxonomists for identification. Farmers counted the commercially suitable fruits.
In the Pigeon pea system in Kibwezi District (Eastern Kenya; tables S1 and S2), bees visiting pigeon-pea flowers at each field were recorded along three, 100-m transects (2 m wide) laid in a North to South orientation, each separated by >10 m. Each transect was sampled for insects for 10 min, twice a day (between 9 and 16h) once weekly from April to June 2009. All visitors were identified in the field to species, or recognizable taxonomic level. Voucher specimens of unknown species were taken to the National Museums of Kenya for specialist identification. No floral visitors were observed other than insects. Fruit set attributable to insects was quantified for the plants at 5, 50 and 95m along each transect. Each selected plant had at least two 50-cm branches with unopened flower buds. The pods set on open-pollinated plants were counted at the end of the experiment.
In the Watermelon_A system (tables S1 and S2), data were collected during May-June 2011 in the Judean Foothills, a Mediterranean region in central Israel. The cultivar
studied in 5 fields located >1 km apart. Weather conditions were almost always suitable for bee activity, with only a single rainy day and temperatures constantly above 20°C during daylight. Most farmers in the region do not rent hives for watermelon pollination, but honey bees from nearby hives are usually abundant (feral colonies are absent). A few hives were placed along the edge of one field. Bee visits to randomly chosen clusters of 1-2 hermaphrodite and 3-5 male flowers were recorded during 3-min observations conducted 2-4 times every hour from 8 to 14 h during three days. The main wild bee visitors at all fields were Lasioglossum malachurum and L. politum, which are small semi-social species. Fruit set by open-pollinated flowers was evaluated for 10-20 randomly selected hermaphrodite flowers in each field. All other hermaphrodite flowers and previously set fruits on the experimental plants were removed on the day of the experiment. Monitored flowers that developed into mature fruits and were not aborted 30 days post-anthesis were considered as setting fruits.
In the Watermelon_C system (tables S1 and S2), visitation was measured on 3 days per field during bloom in central California, USA during June-August 2010. Observers used visual scans along a 50-m transect in the crop row bordering a field margin. The transect was sampled for 17 min four times on each date. After each scan, bees visiting watermelon flowers were collected for voucher specimens. The pollination function provided per flower visit per bee species was estimated by counting pollen grains
5
deposited by individual bees during single visits to unvisited flowers. Stigmas were stained using fuchsin dye and pollen grains counted under a light microscope (34).
In the Blueberry_A system (tables S1 and S2), insect visitation was measured by walking slowly along a 200-m transect comprising four 50-m segments of blueberry bush rows. Walking pace was standardized to 10 m min-1. During an observation period, observers scanned all visible flowers along one side of a row for bees, so that a given cluster of flowers was observed only once per observation bout. Both native bees and honey bees were recorded. Observation was repeated three times during a field-visit day for a total of 60 min. Each field was visited three times during 2010. All data were collected on days with sunny to partly cloudy skies and temperatures above 17ºC by 12h. Pollen deposition per visit was measured by offering unvisited flowers to bees foraging on blueberry bushes within the same planting block as the transect. After a single visit, the stigma was collected and stained with aniline blue. Pollen grains attached to the stigma by pollen tubes and pollen grains elsewhere on the slide with pollen tubes were counted.
In the Blueberry_C system (tables S1 and S2), at each field, all bees visiting blueberry flowers were collected by net for 1 h on three days corresponding to early, middle and late flowering of the crop during 2009. All collections were done between 10 and 15h on sunny and light-overcast days with temperatures >16 °C. On the same days, 45 blueberry stigmas were harvested per field and stained with basic fuchsin. Pollen tetrads deposited on stigmas were counted to determine the percent pollination of each blueberry field.
In Cranberry system (tables S1 and S2), all insects observed visiting flowers along two 1 x 60-m transects were collected using a hand net at each field. One transect was adjacent and parallel to natural habitat, whereas the second one was located in the interior of the field. Transects were walked for 30 min two times per day for a total of 120 min per field per day. Each field was visited twice during 2009. Pollen deposition was measured by presenting unvisited flowers to foraging bees. After a single visit, stigmas were stained with aniline blue dye and the number of pollen grains on the stigma and in the sample but with pollen tubes were counted.
In the Cherry_B system (tables S1 and S2), insect visitation to flowers and fruit set were measured during 2011 on experimentally planted, 7-year-old trees (35). Insect visitation was estimated per field using 30 min of video (Sony HDR-CX115E), recorded at three times (10-12, 12-14, 14-16 h) and each recording time on a separate day. After recording, vouchers of flower-visiting insects were captured with sweep nets. Fruit set was assessed on 4 trees per field as the percentage of flowers developing into swollen green fruit (~1 month after flowering period).
In the Pumpkin system (tables S1 and S2), insect visitation to flowers was assessed by walking slowly between two rows of plants along a 45-m transect and surveying the bees visiting flowers in both rows. Visitation was estimated at three transects per field, every two weeks during the blooming period (mid-July through August) for a total of three surveys per field. Surveys were conducted on still, dry days from 6 - 11h, or until flowers closed. In the same fields, Cucurbita pepo var. Gladiator transplants were planted into commercial fields two weeks after farmers had planted seeds, so that fruit set was recorded for a single variety.

6
In the Red clover system (tables S1 and S2), insect visitors to flowers were counted as described in (36). Fruit (seed) set was estimated from 20 flower heads per field as the proportion of flowers on a flower head that produced mature seeds. Seed set estimates were compensated for different levels of seed predation between fields and flower heads by excluding flowers that had been attached by seed predating Apion weevils (37).
In the Tomato_B system (tables S1 and S2), insect visitors to flowers were counted as described in (38). Pollen deposition was measured by presenting unvisited flowers to foraging bees. After a single visit, stigmas were stained with aniline blue dye and the pollen grains were counted. Statistical analyses
We analyzed general linear mixed-effects models of the influences of species
richness, species evenness, visitation rate ("visitation") by wild insects, visitation by honey bees, and all interactions (double, triple, and quadruple) on pollen deposition or fruit set and their CVs using R software (version 2.15.1, lme4 package, lmer function, Gaussian error distribution: this approach produces similar results to Bayesian hierarchical models when uninformative priors are employed, especially with large samples, as in our case) (39 42). Of particular interest was whether visitation by wild insects and honey bees affected reproduction additively or had interacting effects. A positive statistical interaction would suggest synergistic influences (facilitation) of wild insects and honey bees on pollination, i.e. the effects of wild insects on fruit set are higher when honey bees are more abundant. A negative interaction would suggest antagonistic influences, which would be expected if high abundance of honey bees maximizes pollination and therefore could be used to replace the services provided by wild insects, or vice versa. In contrast, the absence of interaction indicates that managed honey bees supplement, rather than substitute for, pollination provided by wild insects (see predictions in the main text).
We used AIC to select best-fitting models for combinations of the four predictor variables (tables S3, S4) to test the four predictions outlined in the main text (43, 44). AIC values (tables S3, S4) were obtained based on maximum-likelihood estimates of regression coefficients, because models differed in the fixed structure but shared the same random structure (random intercepts for different crop systems, see below), whereas parameter estimates for final models presented in figures were obtained using the restricted maximum likelihood method, as recommended by (45). Given the large number of fields (table S1), no correction was needed for small samples, AICc (43), and this correction showed no clear improvement in simulation studies despite low ratio of independent observations to estimated parameters (44). For visitation, we tested models with both linear and curvilinear (i.e., predictor variables log-transformed prior to z-transformation) forms; a curvilinear relation would be expected from a positive, but decelerating relation of fruit set to visitation (10 12). We found no clear improvement (i.e. lower AIC) when considering curvilinear relations in mixed-effect models, and therefore we present only models with linear forms (tables S3, S4). For models with CV as the response variable, the inclusion of an additional factor to differentiate trends
7
between temporal and spatial CV increased model AIC and therefore was excluded from analyses.
In general, mixed-effects models are effective for integrated analysis of data from different studies (42, 46, 47). By including crop system as a random variable, our models
i) for each system (i) to account for the hierarchical data structure and differences among systems (random intercept models) (40-42). Each overall
+) was considered a fixed effect reflecting the influence of a predictor (e.g. visitation by wild insects) on fruit set (or pollen deposition) over all crop systems. Inclusion of system- i) for one of the four predictor variables in this complete model selection analysis (tables S3, S4) would be an arbitrary decision; whereas inclusion of system-specific partial regression coefficients for each predictor (and interactions) would result in over-parameterization
i in reduced models as described below). In all the analyses described above we included only crop systems for which both wild insects and honey bees were active flower visitors, i.e. at least 5% of total visitation by either group. We tested the Gaussian and homoscedasticity assumptions for the standardized residuals of the models (45) with graphical analyses and Kolmogorov-Smirnov tests (Type I error rate = 0.05) and these assumptions were valid in all cases.
To quantify variation among crop systems in the influences of individual predictor variables (wild-insect visitation, honey-bee visitation, species richness, or species evenness) on fruit set, pollen deposition and their CVs, we estimated i) and
i) for each system (i) (40). These estimates were appropriate, as models with interactive effects did not fit better (i.e. lower AIC) than the same models without interactions (tables S3, S4). In these general linear mixed-effects models, the overall slope (µ i), where the relative influence of each system increases with the precision of its local model fit and its sample size (40-42). These models also allowed inclusion of data from systems for which either honey bees or wild insects were the only active flower visitors (Fig. 2B).
To understand the spatial association of honey bees and wild insects, we modeled visitation by wild insects as a function of visitation by honey bees with the same
i i for each system (i) i could indicate spatial segregation caused by competition for resources, or that farmers use more honey bees at fields with fewer wild insects.
Supplementary T ext Full acknowledgements
The authors declare no competing financial interests. This research was funded by Agencia Nacional de Promoción Científica y Tecnológica (PICT 01300), Consejo Nacional de Investigaciones Científicas y Técnicas (PIP 114-201101-00201, PIP 112-200801-01623), CNPq Brasília-Brazil (305062/2007-7), Fundação de Amparo a Pesquisa do Estado da Bahia (FAPESB - ET 33/2004), German Academic Exchange Service, Germany Science Foundation (KL 1849/4-1, KL 1849/10-1, TS 45/32-1), Global
8
Environment Research Fund (S-9) of the Ministry of the Environment of Japan, EU FP6 project ALARM (GOCE-CT-2003-506675, http://www.alarmproject.net), EU FP7 project STEP (244090, www.STEP-project.net), EU FP 7 project SCALES (226852, http://www.scales-project.net/), Israel Science Foundation (919/09), Israel Ministry of Agriculture (824-0112-08), National Science Foundation of the United States (BIO-DEB 0554790 and 0516205), Natural Sciences and Engineering Research Council of Canada, Projeto Conservação e Utilização Sustentável da Diversidade Biológica Brasileira (PROBIO - Convênio: 0126.00/04), Swedish Research Council Formas, Swiss National Science Foundation (FRAGMENT, 3100A0-127632), Universidad de Buenos Aires (UBACYT 20020100300014), Universidad Nacional del Comahue (B152/04), Universidad Nacional de Río Negro (PI 40-B-259), and United States Department of Agriculture (NIFA-AFRI 2009-65104-05782, Multi-state project 08204). L.A.G. and A.M.K. compiled data, L.A.G. and L.D.H. analyzed data, L.A.G., I.S.D., R.W., M.A.A., R.B., S.A.C., C.K., L G.C, L.D.H. and A.M.K discussed and revised earlier versions of the project and manuscript. The authors named between O.A. and N.W., are listed alphabetically, as they contributed equally, gathering field data, providing several important corrections to subsequent manuscript drafts, and discussing ideas.
9
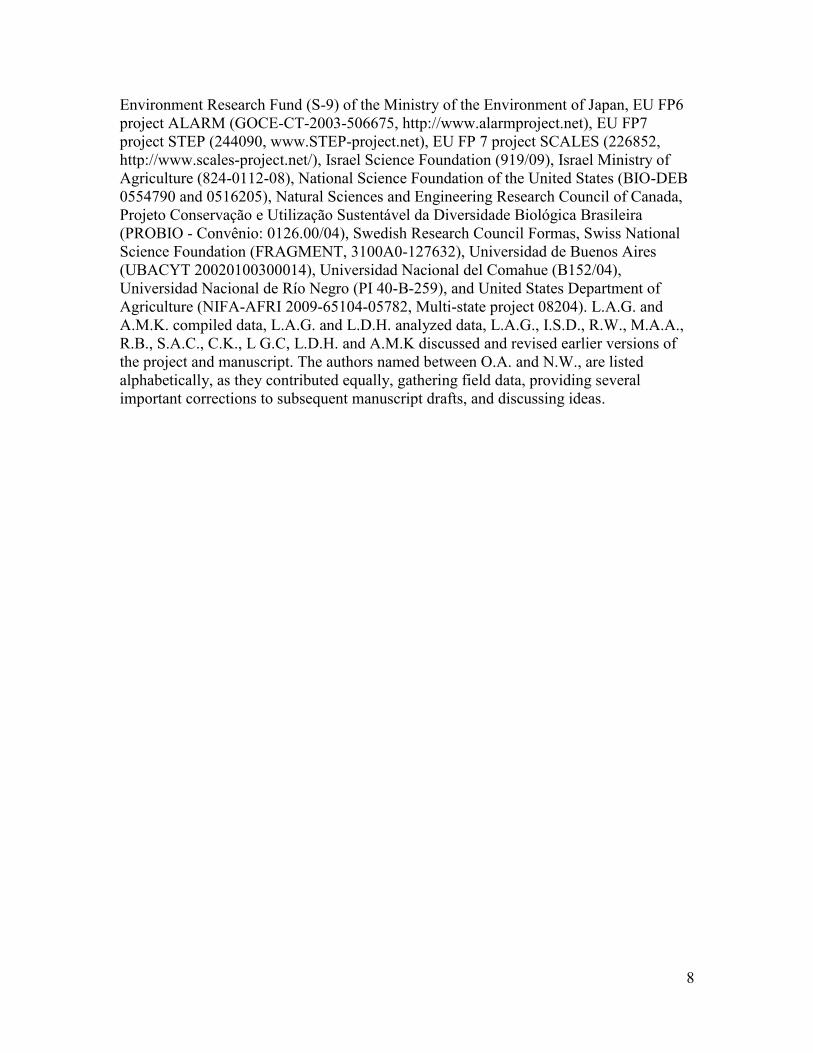
F ig. S1 Crop yield consistently increased with fruit set ( + = 0.67, CI95% = 0.50 - 0.82) across 85 agricultural fields from six crop systems for which yield data were available (namely, Cucumber, Mango_A, Pumpkin, Red clover, Spring rape, and Strawberry; see Table S1). Yield was measured as kg of harvest (fruits or seeds) per hectare for Mango_A, Red clover, and Strawberry, and as kg of harvest per plant for Cucumber, Pumpkin, and Spring rape. Data from individual crop systems were analyzed with a general linear mixed-effect model and standardized by z-scores prior to analysis. her information.
-2 -1 0 1 2-2
-1
0
1
2
Fruit set (z scores)
Cro
p yi
eld
(z s
core
s)
11
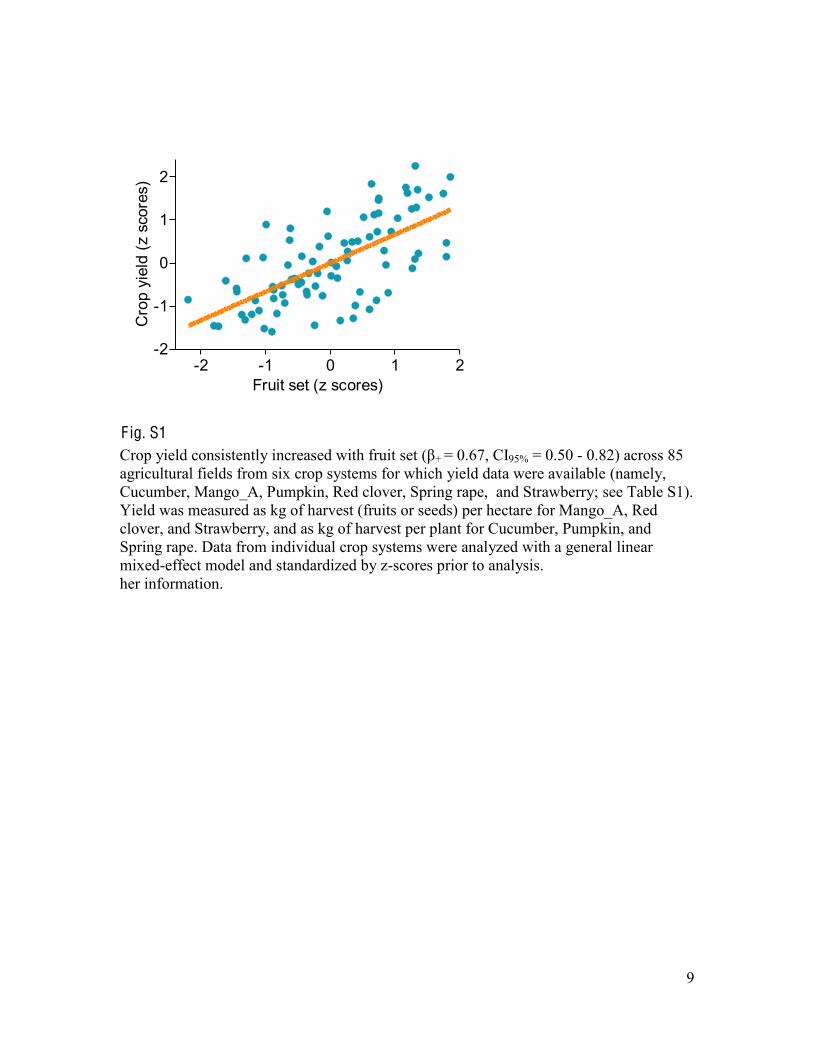
Fig. S2 Examples of crop systems reported in table S1. (A) Turnip rape field in New Zealand. (B) Coffee grown under native forest shade in India. (C) Highbush blueberry field with two cultivars that differ in their bloom phenology in USA. (D) Cherry orchard (after bloom; in the lower half of the picture) in a heterogeneous landscape in Germany. (E) Grapefruit plantation in Argentina. (F) Almond orchard with managed honey bees in USA. (G) Commercial lowbush blueberry field in Canada. (H) Watermelon field in Israel.
12
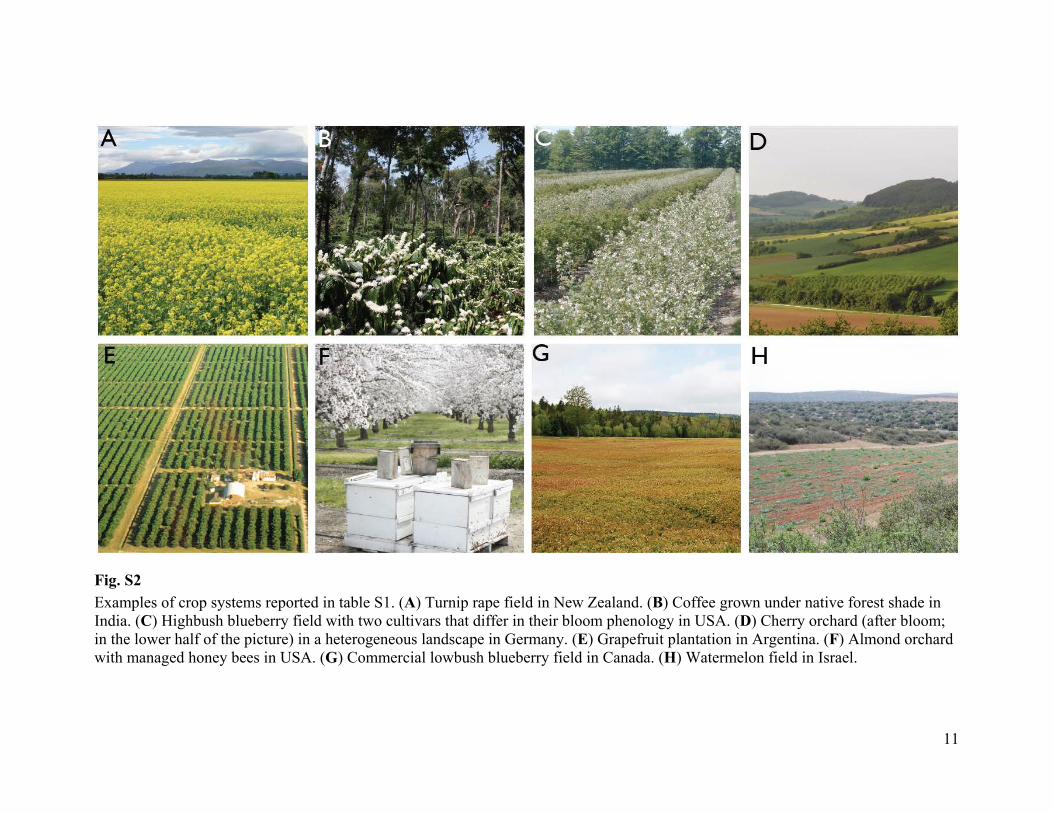
Fig. S3 Examples of pollinators reported in table S2. (A) Honey bee (Apis mellifera) visiting watermelon, Israel. (B) Oil palm weevils (Elaeidobius kamerunicus) visiting male oil palm flowers, Costa Rica. (C) New Zealand black hoverfly (Melangyna novaezelandiae) visiting Turnip rape, New Zealand. (D) Augochlorine bee visiting tomato, USA. (E) Diadem butterfly (Hypolimnas misippus) visiting sunflower, South Africa. (F) Oxaea sp. hovering in front an annato flower, Brazil. (G) Orange-belted bumblebee (Bombus ternarius) visiting lowbush blueberry, Canada. (H) Mining bee (Andrena subopaca) visiting strawberry, Germany.
13
Fig. S4 Pollen deposition generally increases with higher visitation rate by wild insects or honey bees, as indicated by positive s i ± 95% confidence interval) for individual crop systems. Cases on the right are systems in which only wild insects or only honey bees were present. Data from individual crop systems were standardized by z-scores prior to analysis, permitting direct comparison of slopes.
Onion
Wate
rmelo
n_B
Bluebe
rry_A
Cranbe
rry
Bluebe
rry_C
Turnip_
rape
Wate
rmelo
n_C
Coffee
_h_B Kiw
i
Tomato
_B
Coffee
_l_B
Coffee
_l_D
Oilpalm
Grapefr
uit-1.0
-0.5
0.0
0.5
1.0
Honey beesWild insects
i
14
Fig. S5 Variation (CV) in fruit set decreased with visitation rate to crop flowers by wild insects, but
+ ± 95% confidence interval) for CV of pollen deposition or fruit set as a function of visitation by honey bees, by wild insects, or their interaction. Data from individual crop systems were standardized by z-scores prior to analysis, permitting direct comparison of regression coefficients.
Honey bees Wild insects Interaction
-0.4
-0.2
0.0
0.2Fruit setPollen deposition
+
15
Fig. S6 i ± 95% confidence interval) for the effect of visitation rate by honey bees on fruit
set for individual crop systems do not differ between managed or feral honey bees. Pigeon pea, Mango_A and Sunflower are crop systems for which feral honey bees were native. Data from individual crop systems were standardized by z-scores prior to analysis, permitting comparison of slopes.
Pumpk
in
Red_c
lover
Coffee
_l_C
Passio
n_f
Spring
rape
Pigeon
pea
Mango
_A
Macad
amia
Sunflo
wer
Buckw
heat_
A
Grape
fruit
Coffee
_h_C
Bluebe
rry_B
Wate
rmelo
n_A
Long
an
Strawbe
rry Kiwi
Coffee
_h_B
Cherry
_A
Cotton
Buckw
heat_
B
Almon
d
-0.2
0.0
0.2
0.4
0.6
managed & feralonly managedonly feral
i
16
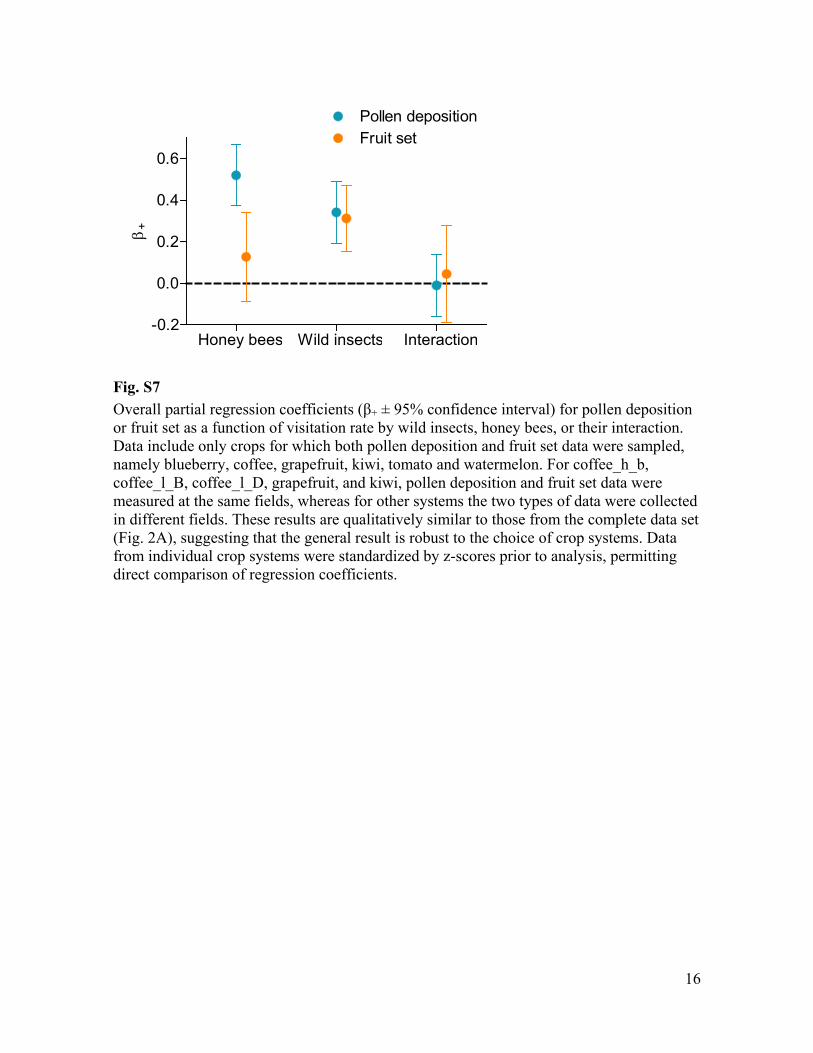
Fig. S7 + ± 95% confidence interval) for pollen deposition
or fruit set as a function of visitation rate by wild insects, honey bees, or their interaction. Data include only crops for which both pollen deposition and fruit set data were sampled, namely blueberry, coffee, grapefruit, kiwi, tomato and watermelon. For coffee_h_b, coffee_l_B, coffee_l_D, grapefruit, and kiwi, pollen deposition and fruit set data were measured at the same fields, whereas for other systems the two types of data were collected in different fields. These results are qualitatively similar to those from the complete data set (Fig. 2A), suggesting that the general result is robust to the choice of crop systems. Data from individual crop systems were standardized by z-scores prior to analysis, permitting direct comparison of regression coefficients.
Honey bees Wild insects Interaction-0.2
0.0
0.2
0.4
0.6Fruit setPollen deposition
+
17
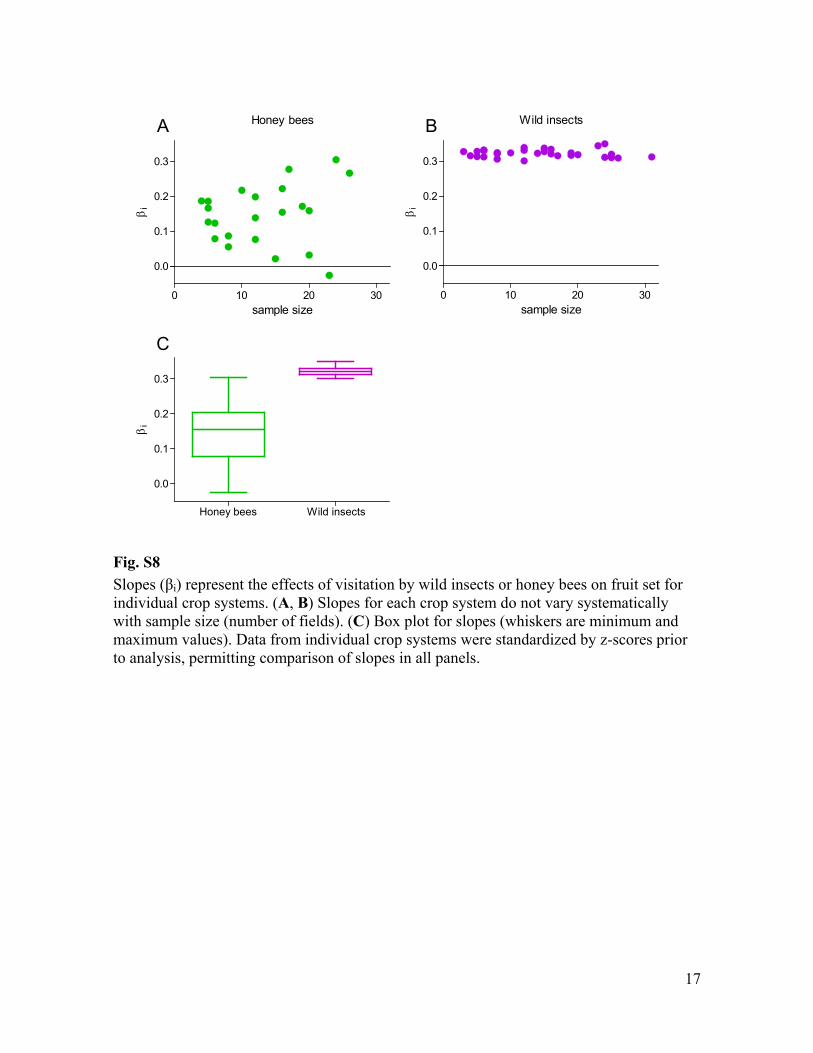
Fig. S8 i) represent the effects of visitation by wild insects or honey bees on fruit set for
individual crop systems. (A, B) Slopes for each crop system do not vary systematically with sample size (number of fields). (C) Box plot for slopes (whiskers are minimum and maximum values). Data from individual crop systems were standardized by z-scores prior to analysis, permitting comparison of slopes in all panels.
Honey bees
0 10 20 30
0.0
0.1
0.2
0.3
sample size
i
Wild insects
0 10 20 30
0.0
0.1
0.2
0.3
sample size
i
Honey bees Wild insects
0.0
0.1
0.2
0.3
iA B
C
18
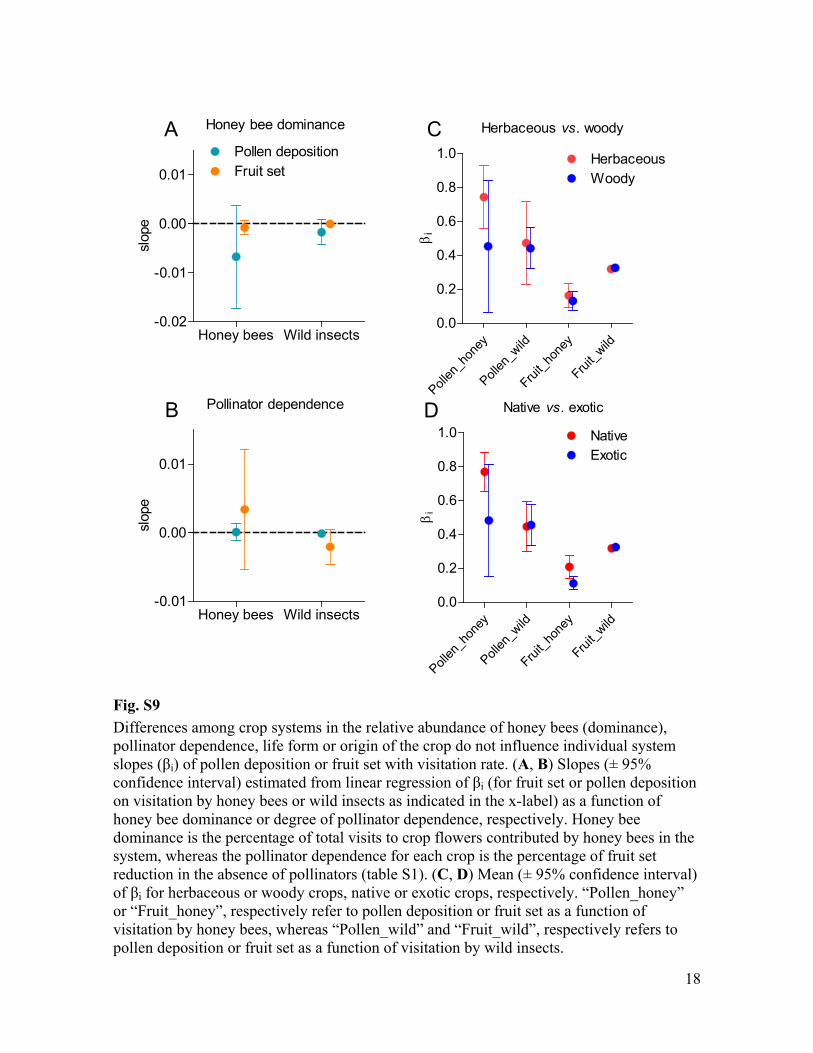
Fig. S9 Differences among crop systems in the relative abundance of honey bees (dominance), pollinator dependence, life form or origin of the crop do not influence individual system
i) of pollen deposition or fruit set with visitation rate. (A, B) Slopes (± 95% confidence interval) estimated from linear regression i (for fruit set or pollen deposition on visitation by honey bees or wild insects as indicated in the x-label) as a function of honey bee dominance or degree of pollinator dependence, respectively. Honey bee dominance is the percentage of total visits to crop flowers contributed by honey bees in the system, whereas the pollinator dependence for each crop is the percentage of fruit set reduction in the absence of pollinators (table S1). (C, D) Mean (± 95% confidence interval)
i for herbaceous or woody crops, native or exotic crops, respectively. “Pollen_honey” or “Fruit_honey”, respectively refer to pollen deposition or fruit set as a function of visitation by honey bees, whereas “Pollen_wild” and “Fruit_wild”, respectively refers to pollen deposition or fruit set as a function of visitation by wild insects.
Honey bee dominance
Honey bees Wild insects-0.02
-0.01
0.00
0.01Pollen depositionFruit set
slop
e Herbaceous vs. woody
Pollen
_hon
ey
Pollen
_wild
Fruit_h
oney
Fruit_w
ild0.0
0.2
0.4
0.6
0.8
1.0 HerbaceousWoody
i
Pollinator dependence
Honey bees Wild insects-0.01
0.00
0.01
slop
e
Native vs. exotic
Pollen
_hon
ey
Pollen
_wild
Fruit_h
oney
Fruit_w
ild0.0
0.2
0.4
0.6
0.8
1.0 NativeExotic
i
A
B D
C
19
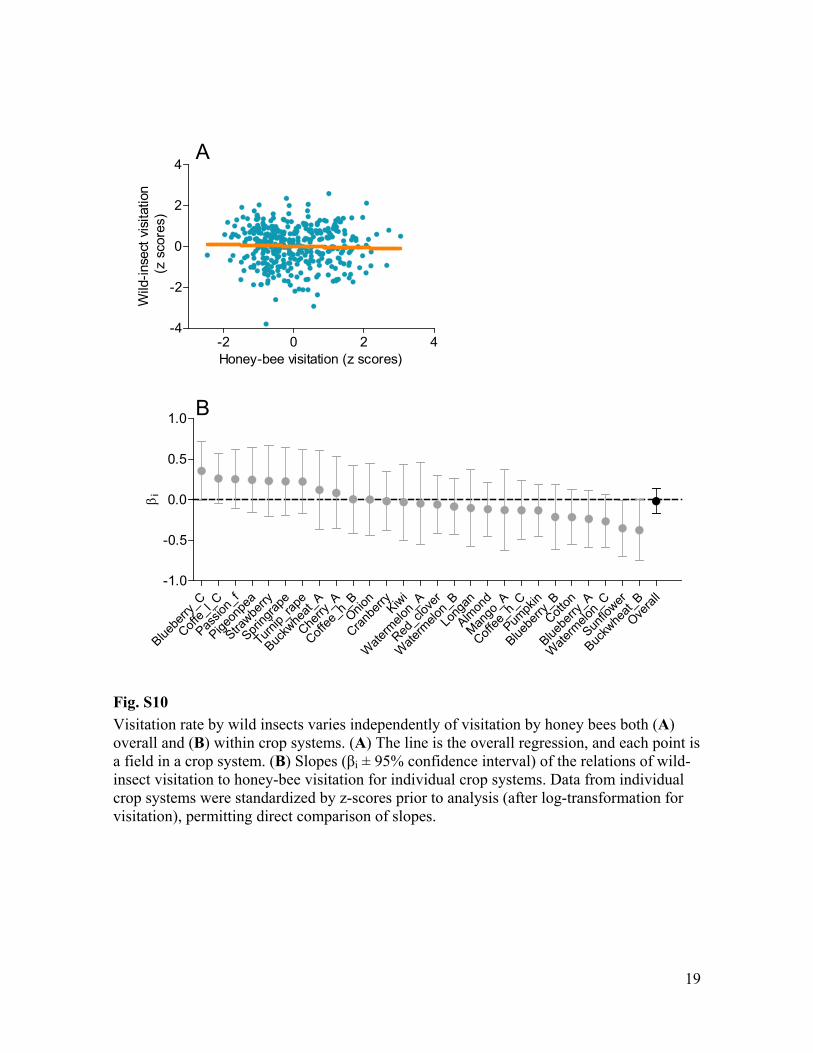
Fig. S10 Visitation rate by wild insects varies independently of visitation by honey bees both (A) overall and (B) within crop systems. (A) The line is the overall regression, and each point is a field in a crop system. (B) i ± 95% confidence interval) of the relations of wild-insect visitation to honey-bee visitation for individual crop systems. Data from individual crop systems were standardized by z-scores prior to analysis (after log-transformation for visitation), permitting direct comparison of slopes.
-2 0 2 4-4
-2
0
2
4
Honey-bee visitation (z scores)
Wild
-inse
ct v
isita
tion
(z s
core
s)
Bluebe
rry_C
Coffe_
l_C
Passio
n_f
Pigeon
pea
Strawbe
rry
Spring
rape
Turnip_
rape
Buckw
heat_
A
Cherry
_A
Coffee
_h_BOnio
n
Cranbe
rryKiwi
Wate
rmelo
n_A
Red_c
lover
Wate
rmelo
n_B
Long
an
Almon
d
Mango
_A
Coffee
_h_C
Pumpk
in
Bluebe
rry_BCott
on
Bluebe
rry_A
Wate
rmelo
n_C
Sunflo
wer
Buckw
heat_
B
Overal
l-1.0
-0.5
0.0
0.5
1.0
iA
B
20
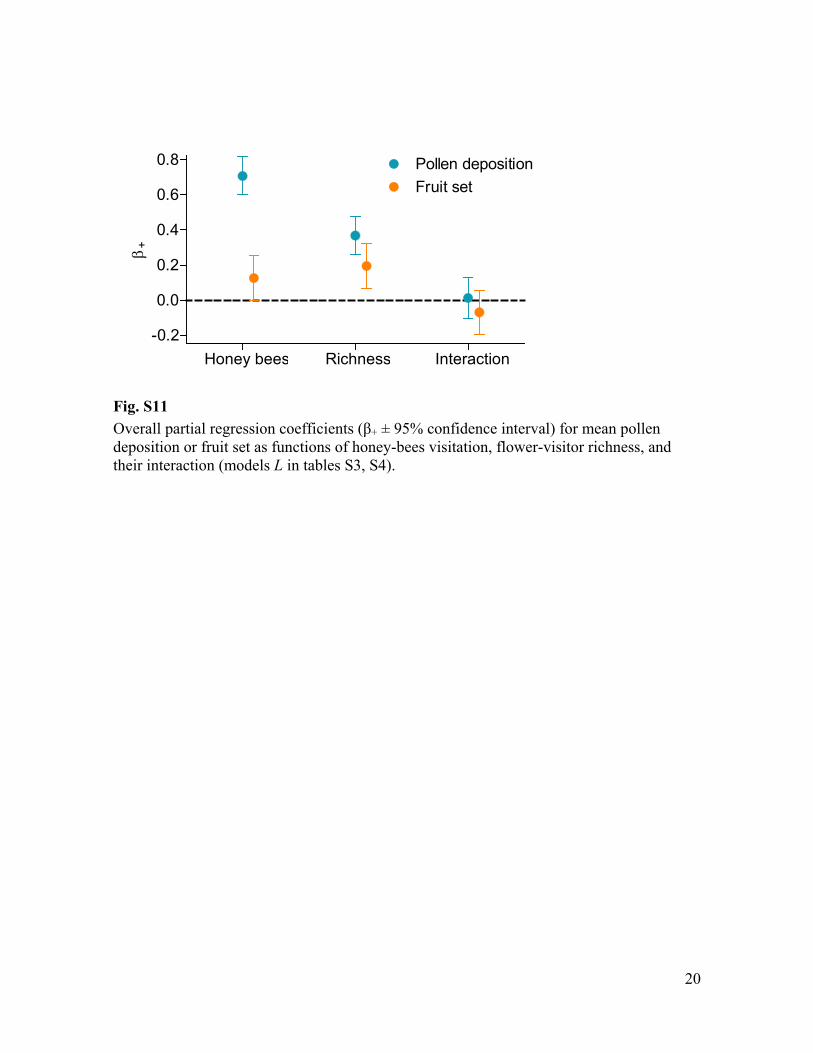
Fig. S11 Overall partial regression + ± 95% confidence interval) for mean pollen deposition or fruit set as functions of honey-bees visitation, flower-visitor richness, and their interaction (models L in tables S3, S4).
Honey bees Richness Interaction-0.2
0.0
0.2
0.4
0.6
0.8
Fruit setPollen deposition
+
21
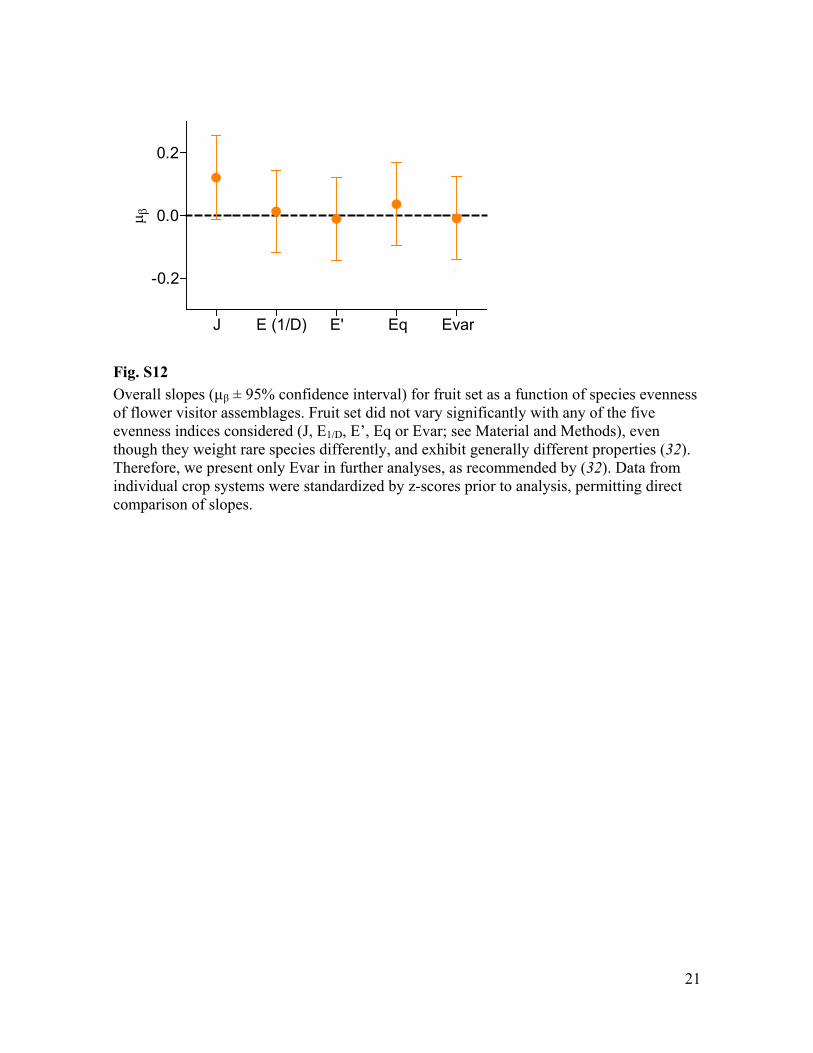
Fig. S12 Overall slopes (µ ± 95% confidence interval) for fruit set as a function of species evenness of flower visitor assemblages. Fruit set did not vary significantly with any of the five evenness indices considered (J, E1/D, E’, Eq or Evar; see Material and Methods), even though they weight rare species differently, and exhibit generally different properties (32). Therefore, we present only Evar in further analyses, as recommended by (32). Data from individual crop systems were standardized by z-scores prior to analysis, permitting direct comparison of slopes.
J E (1/D) E' Eq Evar
-0.2
0.0
0.2
22
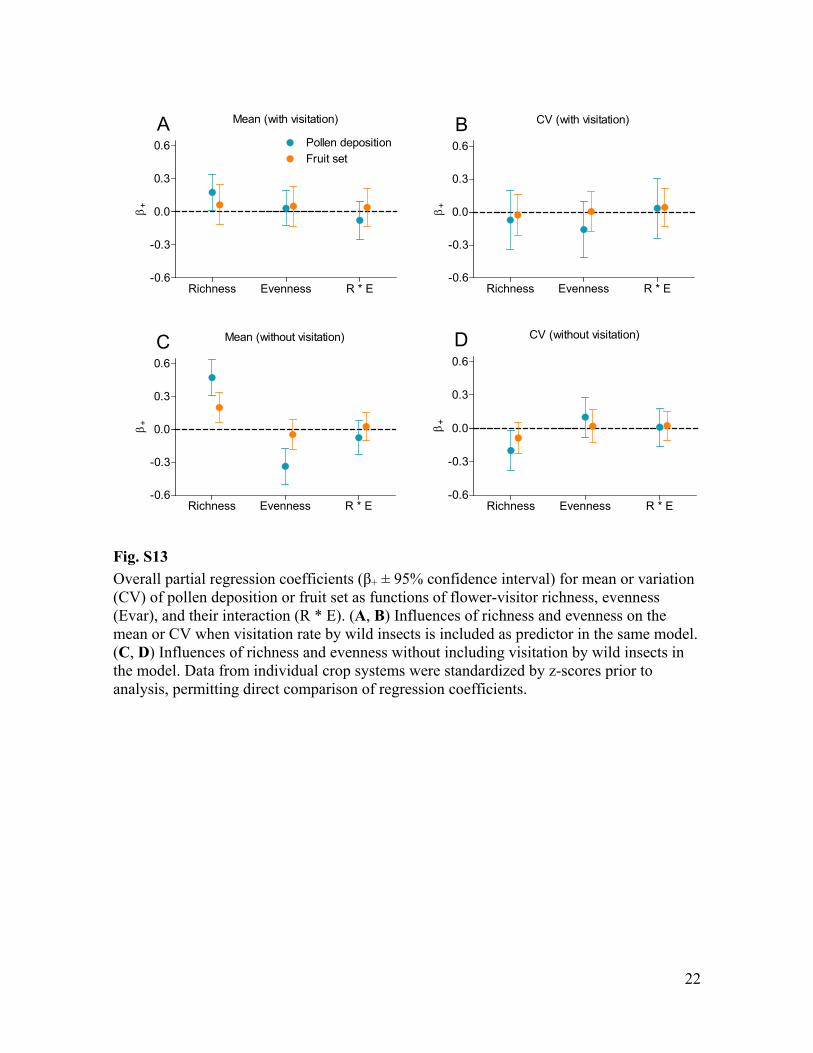
Fig. S13 Overall partial regression + ± 95% confidence interval) for mean or variation (CV) of pollen deposition or fruit set as functions of flower-visitor richness, evenness (Evar), and their interaction (R * E). (A, B) Influences of richness and evenness on the mean or CV when visitation rate by wild insects is included as predictor in the same model. (C, D) Influences of richness and evenness without including visitation by wild insects in the model. Data from individual crop systems were standardized by z-scores prior to analysis, permitting direct comparison of regression coefficients.
Mean (with visitation)
Richness Evenness R * E-0.6
-0.3
0.0
0.3
0.6
APollen depositionFruit set
+
CV (with visitation)
Richness Evenness R * E-0.6
-0.3
0.0
0.3
0.6
B
+
Mean (without visitation)
Richness Evenness R * E-0.6
-0.3
0.0
0.3
0.6
C
+
CV (without visitation)
Richness Evenness R * E-0.6
-0.3
0.0
0.3
0.6
D
+
23
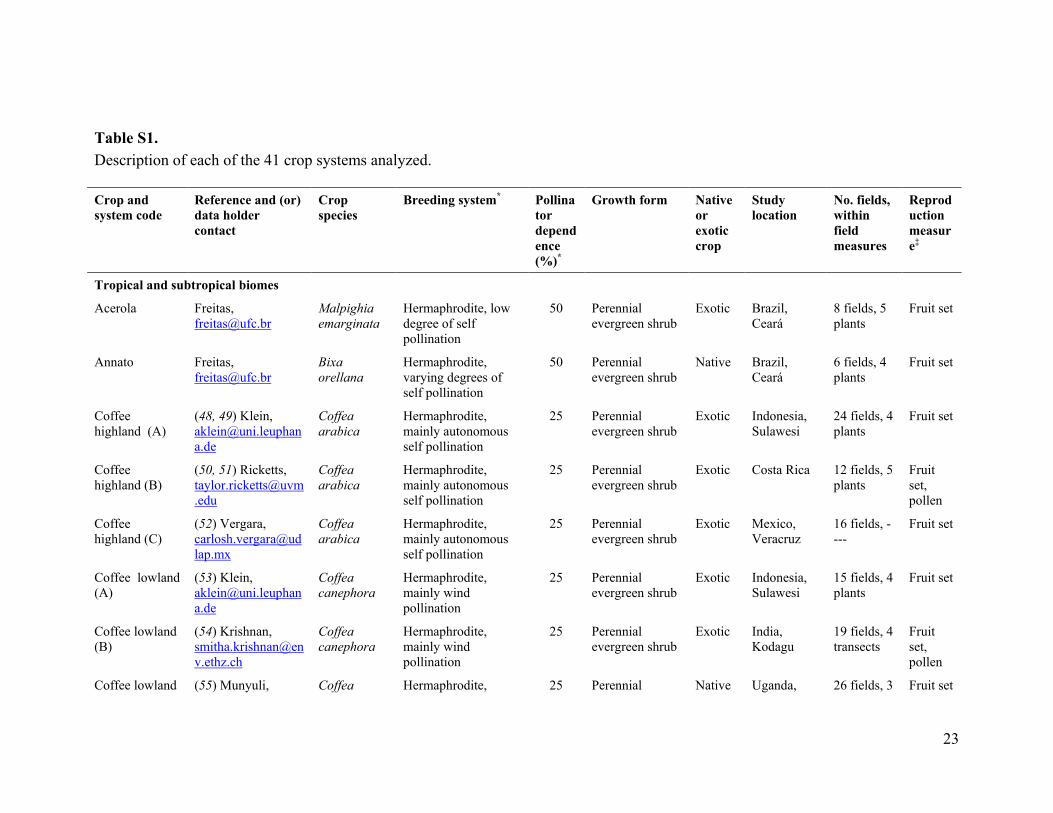
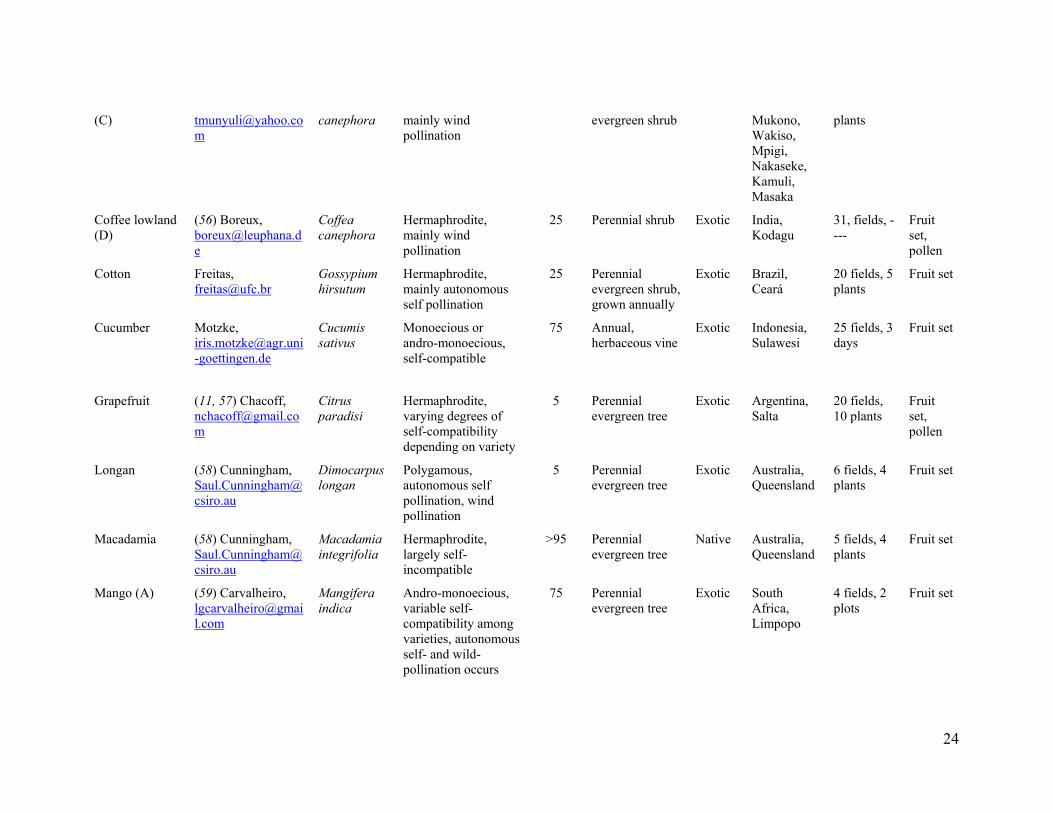
Table S1. Description of each of the 41 crop systems analyzed. Crop and system code
Reference and (or) data holder contact
Crop species
Breeding system* Pollinator dependence (%)*
Growth form Native or exotic crop
Study location
No. fields, within field measures
Reproduction measure‡
Tropical and subtropical biomes
Acerola Freitas, [email protected]
Malpighia emarginata
Hermaphrodite, low degree of self pollination
50 Perennial evergreen shrub
Exotic Brazil, Ceará
8 fields, 5 plants
Fruit set
Annato Freitas, [email protected]
Bixa orellana
Hermaphrodite, varying degrees of self pollination
50 Perennial evergreen shrub
Native Brazil, Ceará
6 fields, 4 plants
Fruit set
Coffee highland (A)
(48, 49) Klein, [email protected]
Coffea arabica
Hermaphrodite, mainly autonomous self pollination
25 Perennial evergreen shrub
Exotic Indonesia, Sulawesi
24 fields, 4 plants
Fruit set
Coffee highland (B)
(50, 51) Ricketts, [email protected]
Coffea arabica
Hermaphrodite, mainly autonomous self pollination
25 Perennial evergreen shrub
Exotic Costa Rica 12 fields, 5 plants
Fruit set, pollen
Coffee highland (C)
(52) Vergara, [email protected]
Coffea arabica
Hermaphrodite, mainly autonomous self pollination
25 Perennial evergreen shrub
Exotic Mexico, Veracruz
16 fields, ----
Fruit set
Coffee lowland (A)
(53) Klein, [email protected]
Coffea canephora
Hermaphrodite, mainly wind pollination
25 Perennial evergreen shrub
Exotic Indonesia, Sulawesi
15 fields, 4 plants
Fruit set
Coffee lowland (B)
(54) Krishnan, [email protected]
Coffea canephora
Hermaphrodite, mainly wind pollination
25 Perennial evergreen shrub
Exotic India, Kodagu
19 fields, 4 transects
Fruit set, pollen
Coffee lowland (55) Munyuli, Coffea Hermaphrodite, 25 Perennial Native Uganda, 26 fields, 3 Fruit set
24
canephora mainly wind pollination
evergreen shrub Mukono, Wakiso, Mpigi, Nakaseke, Kamuli, Masaka
plants
Coffee lowland (D)
(56) Boreux, [email protected]
Coffea canephora
Hermaphrodite, mainly wind pollination
25 Perennial shrub Exotic India, Kodagu
31, fields, ----
Fruit set, pollen
Cotton Freitas, [email protected]
Gossypium hirsutum
Hermaphrodite, mainly autonomous self pollination
25 Perennial evergreen shrub, grown annually
Exotic Brazil, Ceará
20 fields, 5 plants
Fruit set
Cucumber Motzke, [email protected]
Cucumis sativus
Monoecious or andro-monoecious, self-compatible
75 Annual, herbaceous vine
Exotic Indonesia, Sulawesi
25 fields, 3 days
Fruit set
Grapefruit (11, 57) Chacoff, [email protected]
Citrus paradisi
Hermaphrodite, varying degrees of self-compatibility depending on variety
5 Perennial evergreen tree
Exotic Argentina, Salta
20 fields, 10 plants
Fruit set, pollen
Longan (58) Cunningham, [email protected]
Dimocarpus longan
Polygamous, autonomous self pollination, wind pollination
5 Perennial evergreen tree
Exotic Australia, Queensland
6 fields, 4 plants
Fruit set
Macadamia (58) Cunningham, [email protected]
Macadamia integrifolia
Hermaphrodite, largely self-incompatible
>95 Perennial evergreen tree
Native Australia, Queensland
5 fields, 4 plants
Fruit set
Mango (A) (59) Carvalheiro, [email protected]
Mangifera indica
Andro-monoecious, variable self-compatibility among varieties, autonomous self- and wild-pollination occurs
75 Perennial evergreen tree
Exotic South Africa, Limpopo
4 fields, 2 plots
Fruit set
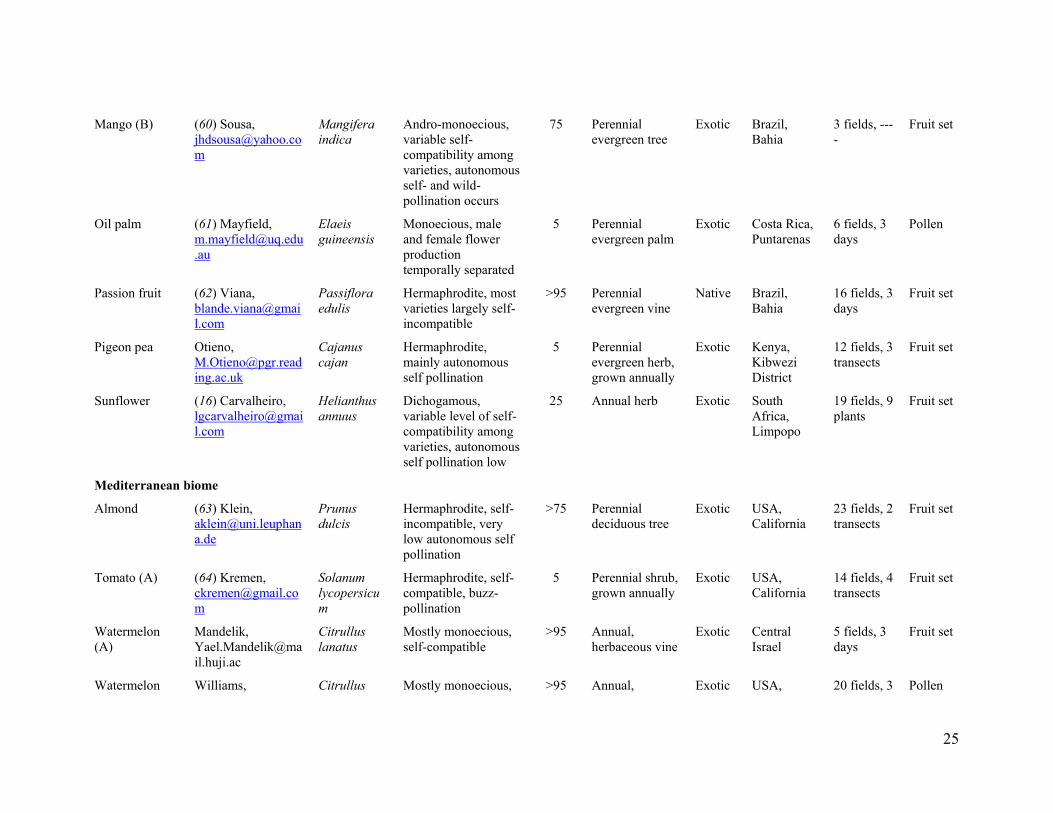
25
Mango (B) (60) Sousa, [email protected]
Mangifera indica
Andro-monoecious, variable self-compatibility among varieties, autonomous self- and wild-pollination occurs
75 Perennial evergreen tree
Exotic Brazil, Bahia
3 fields, ----
Fruit set
Oil palm (61) Mayfield, [email protected]
Elaeis guineensis
Monoecious, male and female flower production temporally separated
5 Perennial evergreen palm
Exotic Costa Rica, Puntarenas
6 fields, 3 days
Pollen
Passion fruit (62) Viana, [email protected]
Passiflora edulis
Hermaphrodite, most varieties largely self-incompatible
>95 Perennial evergreen vine
Native Brazil, Bahia
16 fields, 3 days
Fruit set
Pigeon pea Otieno, [email protected]
Cajanus cajan
Hermaphrodite, mainly autonomous self pollination
5 Perennial evergreen herb, grown annually
Exotic Kenya, Kibwezi District
12 fields, 3 transects
Fruit set
Sunflower (16) Carvalheiro, [email protected]
Helianthus annuus
Dichogamous, variable level of self-compatibility among varieties, autonomous self pollination low
25 Annual herb Exotic South Africa, Limpopo
19 fields, 9 plants
Fruit set
Mediterranean biome
Almond (63) Klein, [email protected]
Prunus dulcis
Hermaphrodite, self-incompatible, very low autonomous self pollination
>75 Perennial deciduous tree
Exotic USA, California
23 fields, 2 transects
Fruit set
Tomato (A) (64) Kremen, [email protected]
Solanum lycopersicum
Hermaphrodite, self-compatible, buzz-pollination
5 Perennial shrub, grown annually
Exotic USA, California
14 fields, 4 transects
Fruit set
Watermelon (A)
Mandelik, [email protected]
Citrullus lanatus
Mostly monoecious, self-compatible
>95 Annual, herbaceous vine
Exotic Central Israel
5 fields, 3 days
Fruit set
Watermelon Williams, Citrullus Mostly monoecious, >95 Annual, Exotic USA, 20 fields, 3 Pollen
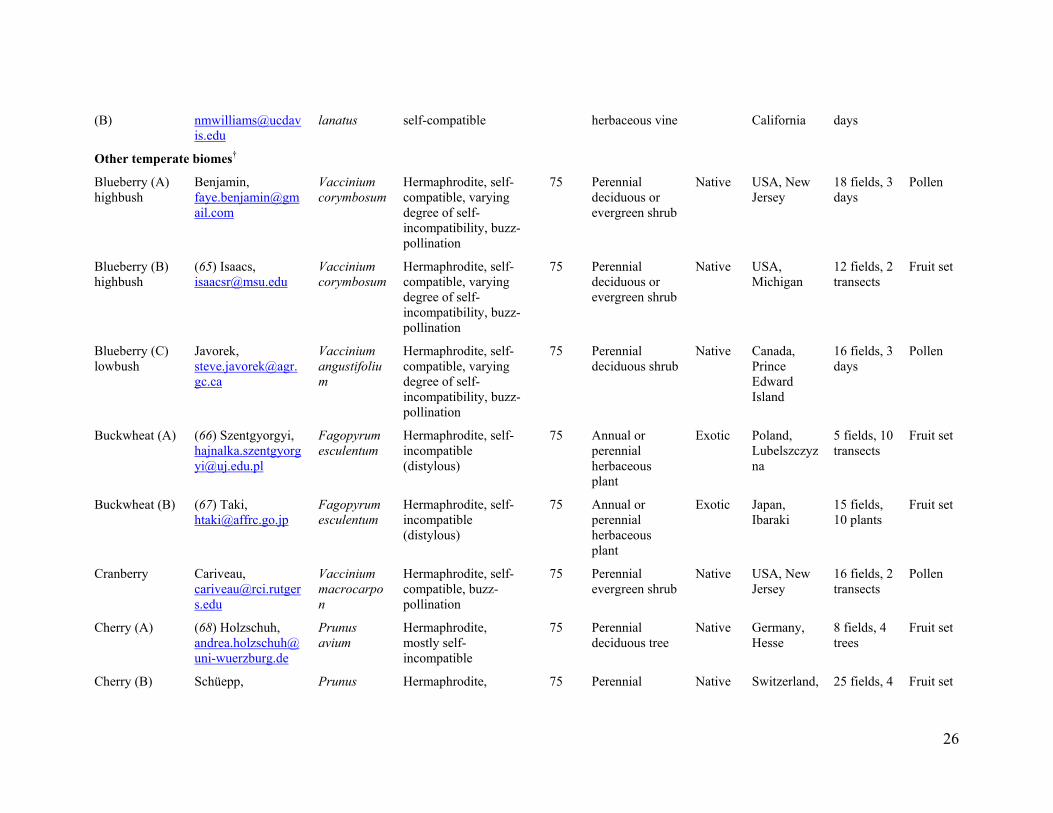
26
lanatus self-compatible herbaceous vine California days
Other temperate biomes†
Blueberry (A) highbush
Benjamin, [email protected]
Vaccinium corymbosum
Hermaphrodite, self-compatible, varying degree of self-incompatibility, buzz-pollination
75 Perennial deciduous or evergreen shrub
Native USA, New Jersey
18 fields, 3 days
Pollen
Blueberry (B) highbush
(65) Isaacs, [email protected]
Vaccinium corymbosum
Hermaphrodite, self-compatible, varying degree of self-incompatibility, buzz-pollination
75 Perennial deciduous or evergreen shrub
Native USA, Michigan
12 fields, 2 transects
Fruit set
Blueberry (C) lowbush
Javorek, [email protected]
Vaccinium angustifolium
Hermaphrodite, self-compatible, varying degree of self-incompatibility, buzz-pollination
75 Perennial deciduous shrub
Native Canada, Prince Edward Island
16 fields, 3 days
Pollen
Buckwheat (A) (66) Szentgyorgyi, [email protected]
Fagopyrum esculentum
Hermaphrodite, self-incompatible (distylous)
75 Annual or perennial herbaceous plant
Exotic Poland, Lubelszczyzna
5 fields, 10 transects
Fruit set
Buckwheat (B) (67) Taki, [email protected]
Fagopyrum esculentum
Hermaphrodite, self-incompatible (distylous)
75 Annual or perennial herbaceous plant
Exotic Japan, Ibaraki
15 fields, 10 plants
Fruit set
Cranberry Cariveau, [email protected]
Vaccinium macrocarpon
Hermaphrodite, self-compatible, buzz-pollination
75 Perennial evergreen shrub
Native USA, New Jersey
16 fields, 2 transects
Pollen
Cherry (A) (68) Holzschuh, [email protected]
Prunus avium
Hermaphrodite, mostly self-incompatible
75 Perennial deciduous tree
Native Germany, Hesse
8 fields, 4 trees
Fruit set
Cherry (B) Schüepp, Prunus Hermaphrodite, 75 Perennial Native Switzerland, 25 fields, 4 Fruit set
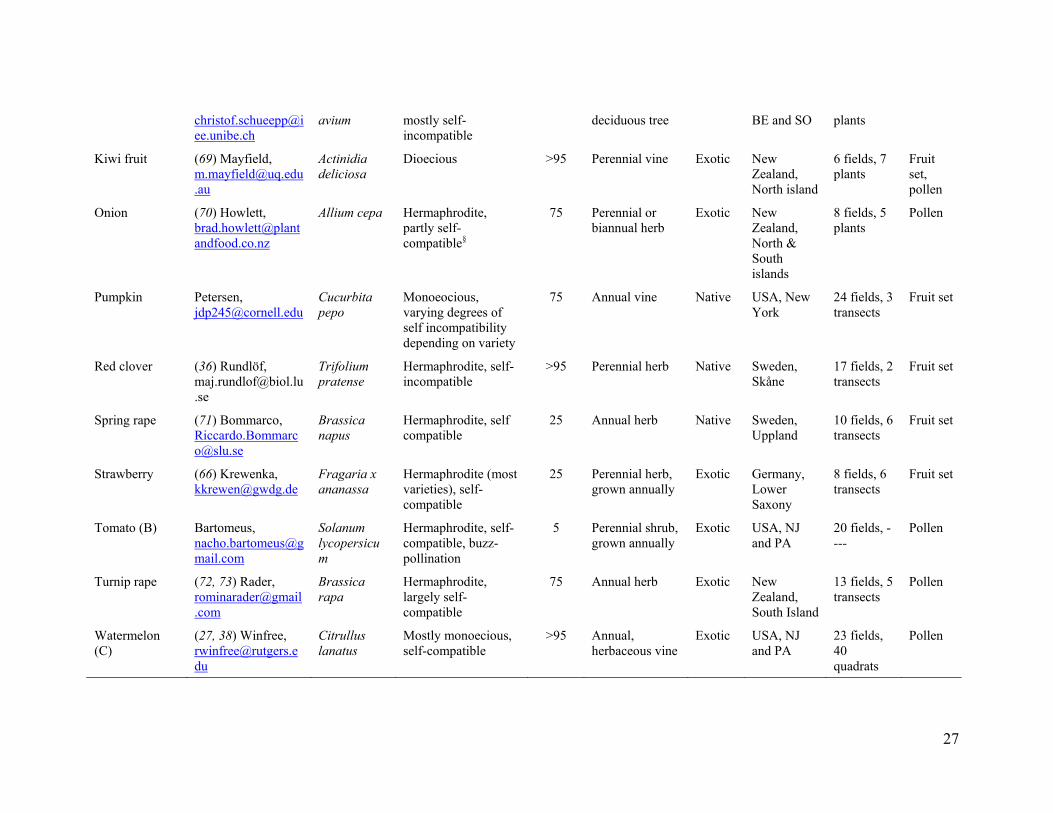
27
avium mostly self-incompatible
deciduous tree BE and SO plants
Kiwi fruit (69) Mayfield, [email protected]
Actinidia deliciosa
Dioecious >95 Perennial vine Exotic New Zealand, North island
6 fields, 7 plants
Fruit set, pollen
Onion (70) Howlett, [email protected]
Allium cepa Hermaphrodite, partly self-compatible§
75 Perennial or biannual herb
Exotic New Zealand, North & South islands
8 fields, 5 plants
Pollen
Pumpkin Petersen, [email protected]
Cucurbita pepo
Monoeocious, varying degrees of self incompatibility depending on variety
75 Annual vine Native USA, New York
24 fields, 3 transects
Fruit set
Red clover (36) Rundlöf, [email protected]
Trifolium pratense
Hermaphrodite, self-incompatible
>95 Perennial herb Native Sweden, Skåne
17 fields, 2 transects
Fruit set
Spring rape (71) Bommarco, [email protected]
Brassica napus
Hermaphrodite, self compatible
25 Annual herb Native Sweden, Uppland
10 fields, 6 transects
Fruit set
Strawberry (66) Krewenka, [email protected]
Fragaria x ananassa
Hermaphrodite (most varieties), self-compatible
25 Perennial herb, grown annually
Exotic Germany, Lower Saxony
8 fields, 6 transects
Fruit set
Tomato (B) Bartomeus, [email protected]
Solanum lycopersicum
Hermaphrodite, self-compatible, buzz-pollination
5 Perennial shrub, grown annually
Exotic USA, NJ and PA
20 fields, ----
Pollen
Turnip rape (72, 73) Rader, [email protected]
Brassica rapa
Hermaphrodite, largely self-compatible
75 Annual herb Exotic New Zealand, South Island
13 fields, 5 transects
Pollen
Watermelon (C)
(27, 38) Winfree, [email protected]
Citrullus lanatus
Mostly monoecious, self-compatible
>95 Annual, herbaceous vine
Exotic USA, NJ and PA
23 fields, 40 quadrats
Pollen
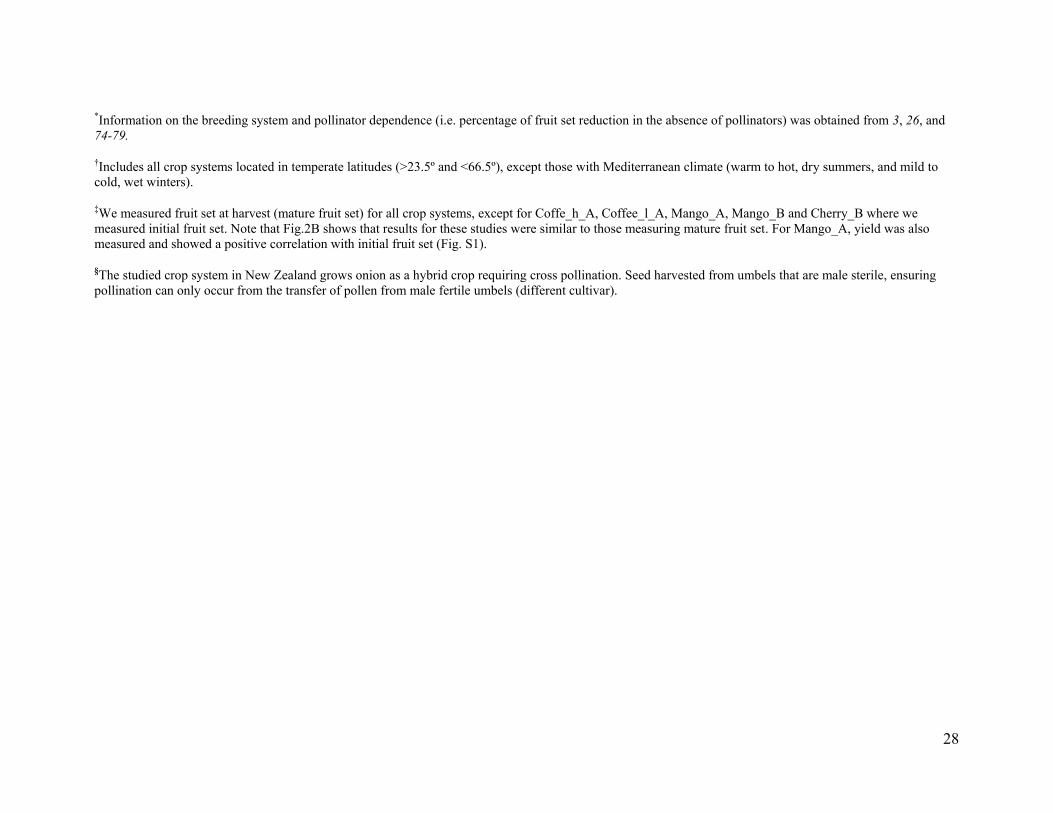
28
*Information on the breeding system and pollinator dependence (i.e. percentage of fruit set reduction in the absence of pollinators) was obtained from 3, 26, and 74-79.
†Includes all crop systems located in temperate latitudes (>23.5º and <66.5º), except those with Mediterranean climate (warm to hot, dry summers, and mild to cold, wet winters).
‡We measured fruit set at harvest (mature fruit set) for all crop systems, except for Coffe_h_A, Coffee_l_A, Mango_A, Mango_B and Cherry_B where we measured initial fruit set. Note that Fig.2B shows that results for these studies were similar to those measuring mature fruit set. For Mango_A, yield was also measured and showed a positive correlation with initial fruit set (Fig. S1).
§The studied crop system in New Zealand grows onion as a hybrid crop requiring cross pollination. Seed harvested from umbels that are male sterile, ensuring pollination can only occur from the transfer of pollen from male fertile umbels (different cultivar).
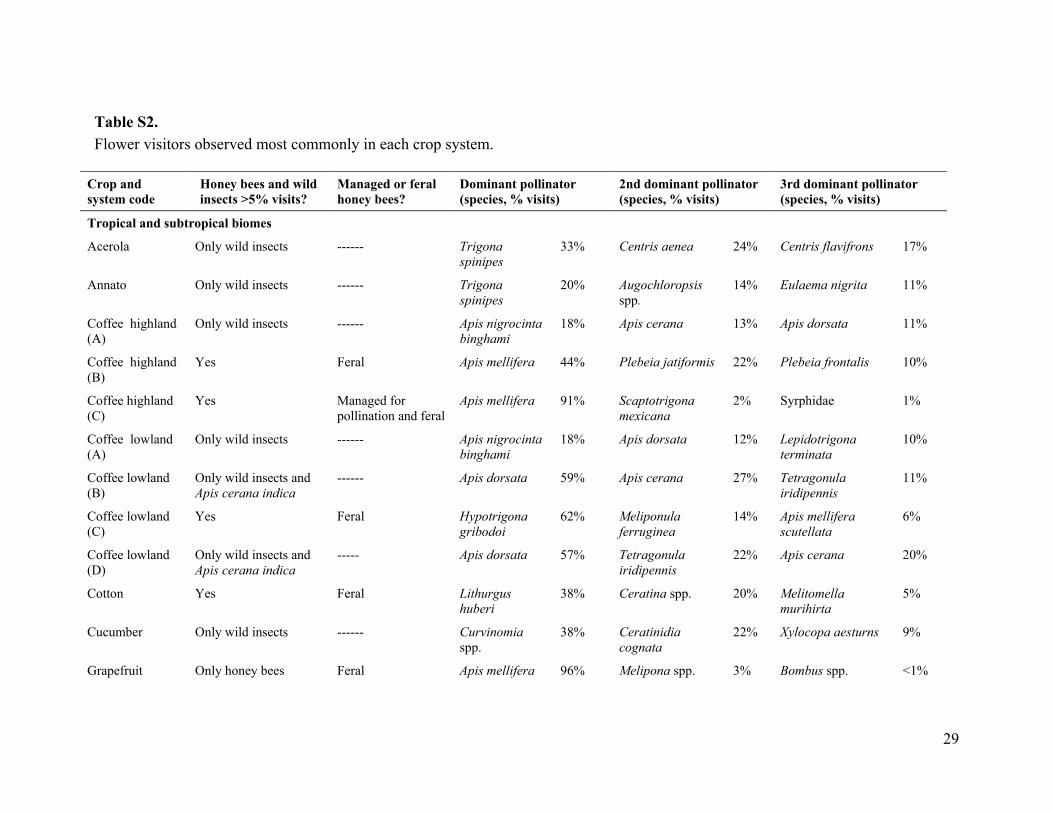
29
Table S2. Flower visitors observed most commonly in each crop system.
Crop and system code
Honey bees and wild insects >5% visits?
Managed or feral honey bees?
Dominant pollinator (species, % visits)
2nd dominant pollinator (species, % visits)
3rd dominant pollinator (species, % visits)
Tropical and subtropical biomes
Acerola Only wild insects ------ Trigona spinipes
33% Centris aenea 24% Centris flavifrons 17%
Annato Only wild insects ------ Trigona spinipes
20% Augochloropsis spp.
14% Eulaema nigrita 11%
Coffee highland (A)
Only wild insects ------ Apis nigrocinta binghami
18% Apis cerana 13% Apis dorsata 11%
Coffee highland (B)
Yes Feral Apis mellifera 44% Plebeia jatiformis 22% Plebeia frontalis 10%
Coffee highland (C)
Yes Managed for pollination and feral
Apis mellifera 91% Scaptotrigona mexicana
2% Syrphidae 1%
Coffee lowland (A)
Only wild insects ------ Apis nigrocinta binghami
18% Apis dorsata 12% Lepidotrigona terminata
10%
Coffee lowland (B)
Only wild insects and Apis cerana indica
------ Apis dorsata 59% Apis cerana 27% Tetragonula iridipennis
11%
Coffee lowland (C)
Yes Feral Hypotrigona gribodoi
62% Meliponula ferruginea
14% Apis mellifera scutellata
6%
Coffee lowland (D)
Only wild insects and Apis cerana indica
----- Apis dorsata 57% Tetragonula iridipennis
22% Apis cerana 20%
Cotton Yes Feral Lithurgus huberi
38% Ceratina spp. 20% Melitomella murihirta
5%
Cucumber Only wild insects ------ Curvinomia spp.
38% Ceratinidia cognata
22% Xylocopa aesturns 9%
Grapefruit Only honey bees Feral Apis mellifera 96% Melipona spp. 3% Bombus spp. <1%
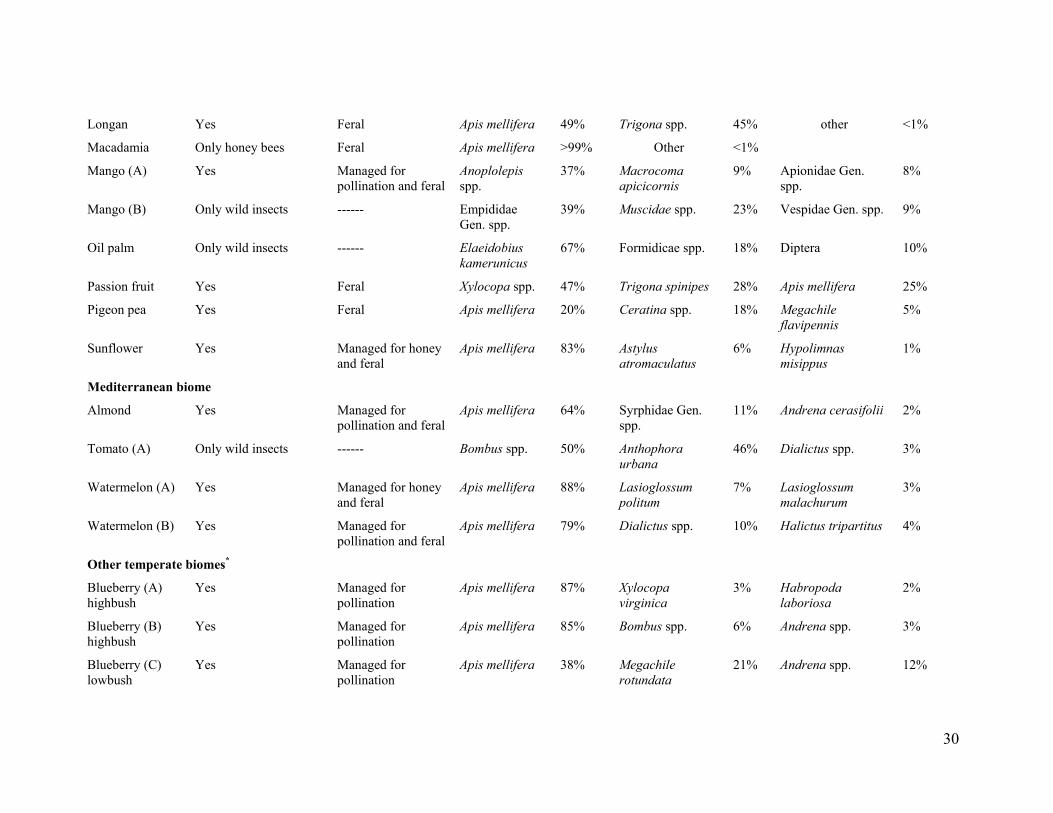
30
Longan Yes Feral Apis mellifera 49% Trigona spp. 45% other <1%
Macadamia Only honey bees Feral Apis mellifera >99% Other <1%
Mango (A) Yes Managed for pollination and feral
Anoplolepis spp.
37% Macrocoma apicicornis
9% Apionidae Gen. spp.
8%
Mango (B) Only wild insects ------ Empididae Gen. spp.
39% Muscidae spp. 23% Vespidae Gen. spp. 9%
Oil palm Only wild insects ------ Elaeidobius kamerunicus
67% Formidicae spp. 18% Diptera 10%
Passion fruit Yes Feral Xylocopa spp. 47% Trigona spinipes 28% Apis mellifera 25%
Pigeon pea Yes Feral Apis mellifera 20% Ceratina spp. 18% Megachile flavipennis
5%
Sunflower Yes Managed for honey and feral
Apis mellifera 83% Astylus atromaculatus
6% Hypolimnas misippus
1%
Mediterranean biome
Almond Yes Managed for pollination and feral
Apis mellifera 64% Syrphidae Gen. spp.
11% Andrena cerasifolii 2%
Tomato (A) Only wild insects ------ Bombus spp. 50% Anthophora urbana
46% Dialictus spp. 3%
Watermelon (A) Yes Managed for honey and feral
Apis mellifera 88% Lasioglossum politum
7% Lasioglossum malachurum
3%
Watermelon (B) Yes Managed for pollination and feral
Apis mellifera 79% Dialictus spp. 10% Halictus tripartitus 4%
Other temperate biomes*
Blueberry (A) highbush
Yes Managed for pollination
Apis mellifera 87% Xylocopa virginica
3% Habropoda laboriosa
2%
Blueberry (B) highbush
Yes Managed for pollination
Apis mellifera 85% Bombus spp. 6% Andrena spp. 3%
Blueberry (C) lowbush
Yes Managed for pollination
Apis mellifera 38% Megachile rotundata
21% Andrena spp. 12%
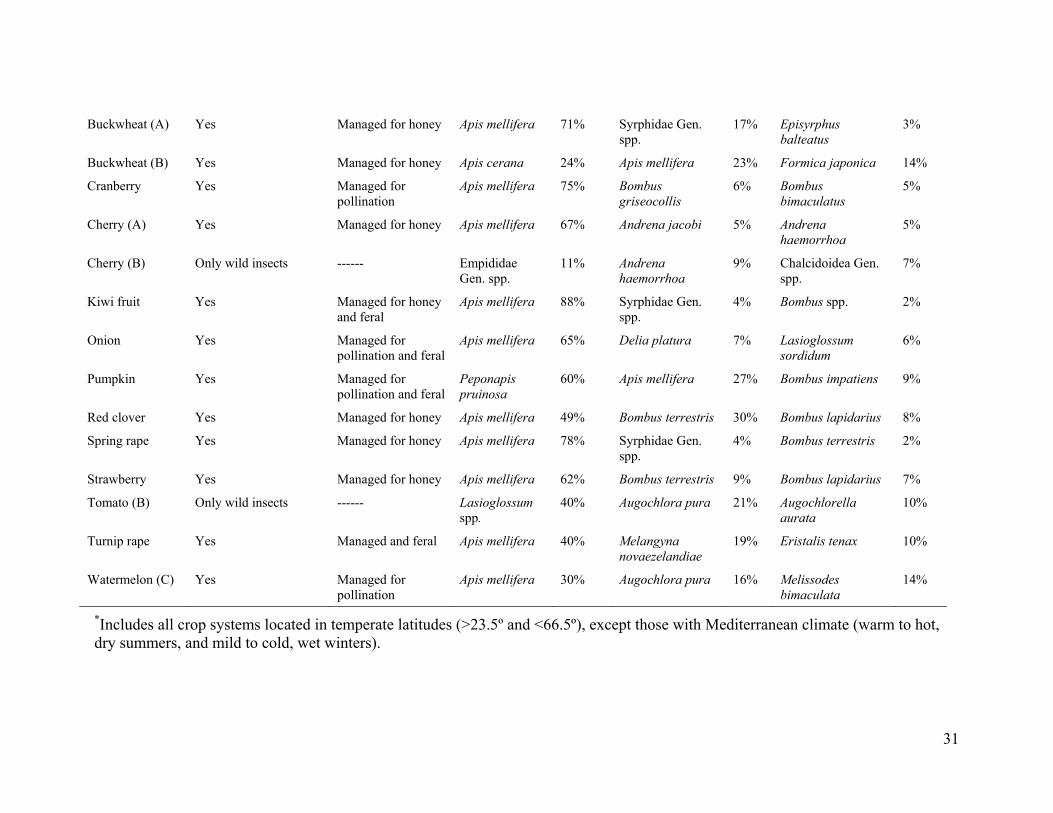
31
Buckwheat (A) Yes Managed for honey Apis mellifera 71% Syrphidae Gen. spp.
17% Episyrphus balteatus
3%
Buckwheat (B) Yes Managed for honey Apis cerana 24% Apis mellifera 23% Formica japonica 14%
Cranberry Yes Managed for pollination
Apis mellifera 75% Bombus griseocollis
6% Bombus bimaculatus
5%
Cherry (A) Yes Managed for honey Apis mellifera 67% Andrena jacobi 5% Andrena haemorrhoa
5%
Cherry (B) Only wild insects ------ Empididae Gen. spp.
11% Andrena haemorrhoa
9% Chalcidoidea Gen. spp.
7%
Kiwi fruit Yes Managed for honey and feral
Apis mellifera 88% Syrphidae Gen. spp.
4% Bombus spp. 2%
Onion Yes Managed for pollination and feral
Apis mellifera 65% Delia platura 7% Lasioglossum sordidum
6%
Pumpkin Yes Managed for pollination and feral
Peponapis pruinosa
60% Apis mellifera 27% Bombus impatiens 9%
Red clover Yes Managed for honey Apis mellifera 49% Bombus terrestris 30% Bombus lapidarius 8%
Spring rape Yes Managed for honey Apis mellifera 78% Syrphidae Gen. spp.
4% Bombus terrestris 2%
Strawberry Yes Managed for honey Apis mellifera 62% Bombus terrestris 9% Bombus lapidarius 7%
Tomato (B) Only wild insects ------ Lasioglossum spp.
40% Augochlora pura 21% Augochlorella aurata
10%
Turnip rape Yes Managed and feral Apis mellifera 40% Melangyna novaezelandiae
19% Eristalis tenax 10%
Watermelon (C) Yes Managed for pollination
Apis mellifera 30% Augochlora pura 16% Melissodes bimaculata
14%
*Includes all crop systems located in temperate latitudes (>23.5º and <66.5º), except those with Mediterranean climate (warm to hot, dry summers, and mild to cold, wet winters).
32
Table S3. Akaike’s Information Criterion (AIC) for mixed effects models of the potential influences on crop pollen deposition, including visitation rate by wild insects (w), visitation rate by honey bees (h), species richness (R) and species evenness (E). The column depicts the difference between a model’s AIC and that of the best- i) were estimated for each crop system in all models by including study system as a random factor (23). All variables were standardized using z-scores within each crop system prior to analyses.
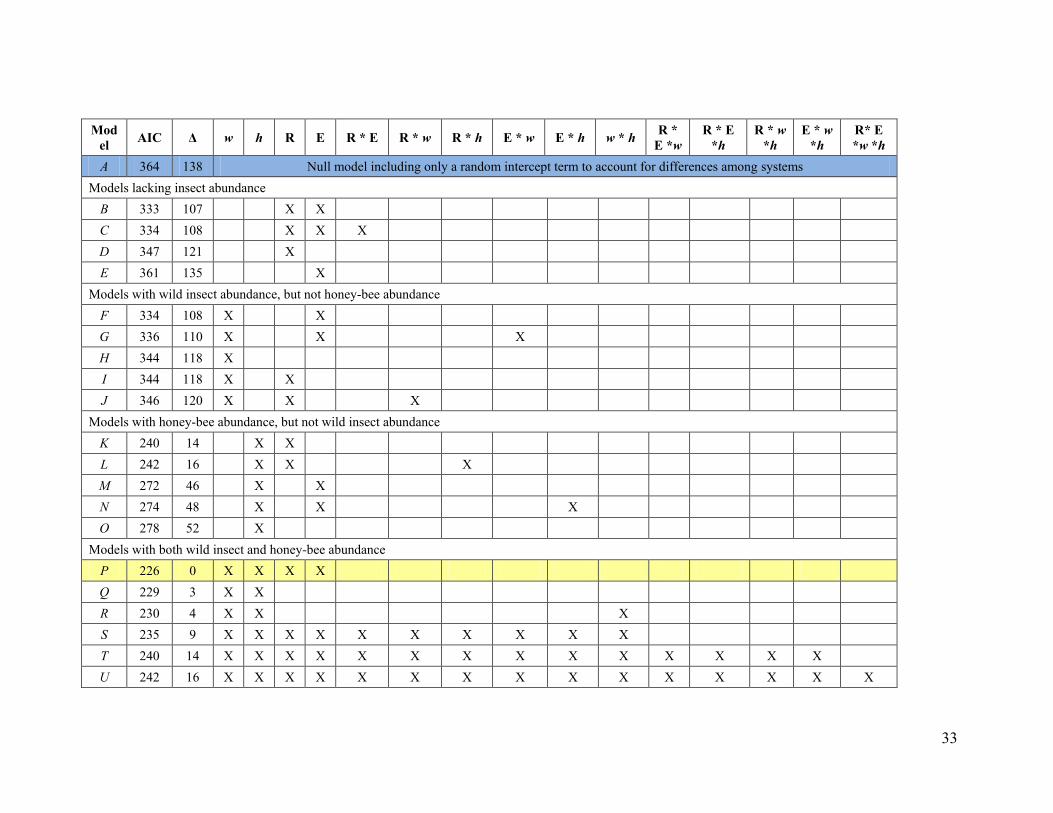
33
Model AIC w h R E R * E R * w R * h E * w E * h w * h R *
E *w R * E
*h R * w
*h E * w
*h R* E *w *h
A 364 138 Null model including only a random intercept term to account for differences among systems
Models lacking insect abundance
B 333 107 X X
C 334 108 X X X
D 347 121 X
E 361 135 X
Models with wild insect abundance, but not honey-bee abundance
F 334 108 X X
G 336 110 X X X
H 344 118 X
I 344 118 X X
J 346 120 X X X
Models with honey-bee abundance, but not wild insect abundance
K 240 14 X X
L 242 16 X X X
M 272 46 X X
N 274 48 X X X
O 278 52 X
Models with both wild insect and honey-bee abundance
P 226 0 X X X X
Q 229 3 X X
R 230 4 X X X
S 235 9 X X X X X X X X X X
T 240 14 X X X X X X X X X X X X X X
U 242 16 X X X X X X X X X X X X X X X
34
Table S4. Akaike’s Information Criterion (AIC) for mixed effects models of the potential influences on crop fruit set, including visitation rate by wild insects (w), visitation rate by honey bees (h), species richness (R) and species evenness (E). The column depicts the difference between a model’s AIC and that of the best- i) were estimated for each crop system in all models by including study system as a random factor (23). All variables were standardized using z-scores within each crop system prior to analyses.
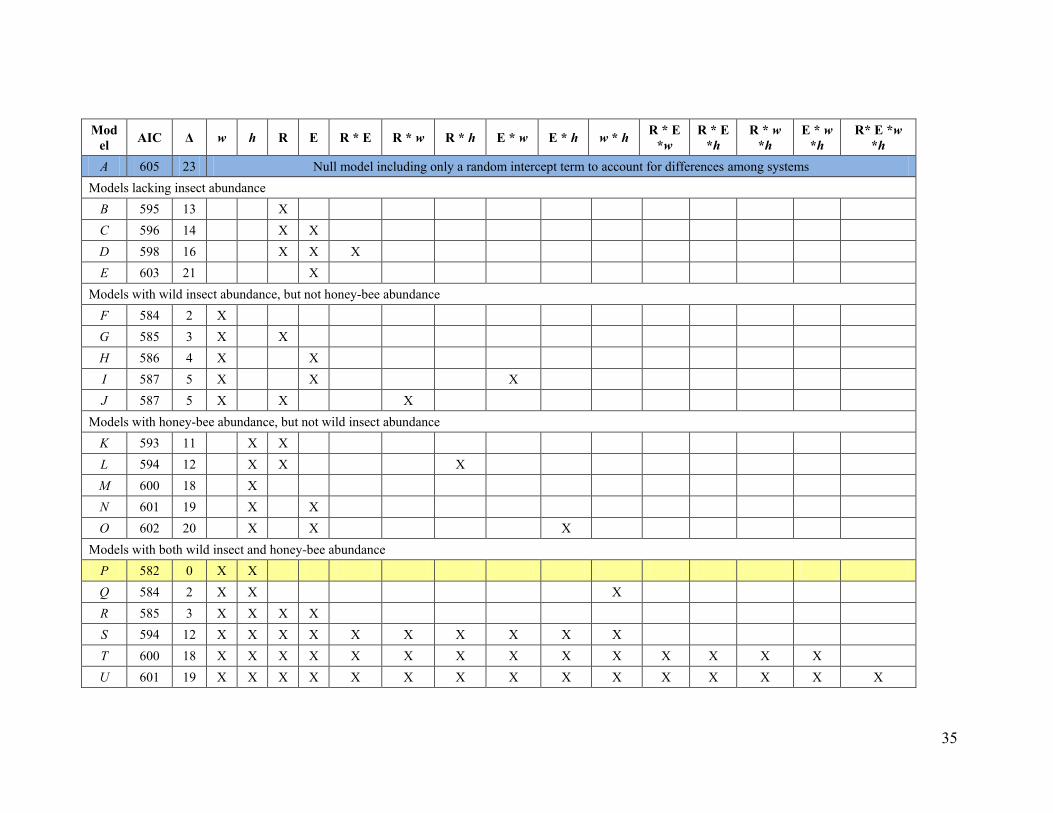
35
Model AIC w h R E R * E R * w R * h E * w E * h w * h R * E
*w R * E
*h R * w
*h E * w
*h R* E *w
*h
A 605 23 Null model including only a random intercept term to account for differences among systems
Models lacking insect abundance
B 595 13 X
C 596 14 X X
D 598 16 X X X
E 603 21 X
Models with wild insect abundance, but not honey-bee abundance
F 584 2 X
G 585 3 X X
H 586 4 X X
I 587 5 X X X
J 587 5 X X X
Models with honey-bee abundance, but not wild insect abundance
K 593 11 X X
L 594 12 X X X
M 600 18 X
N 601 19 X X
O 602 20 X X X
Models with both wild insect and honey-bee abundance
P 582 0 X X
Q 584 2 X X X
R 585 3 X X X X
S 594 12 X X X X X X X X X X
T 600 18 X X X X X X X X X X X X X X
U 601 19 X X X X X X X X X X X X X X X
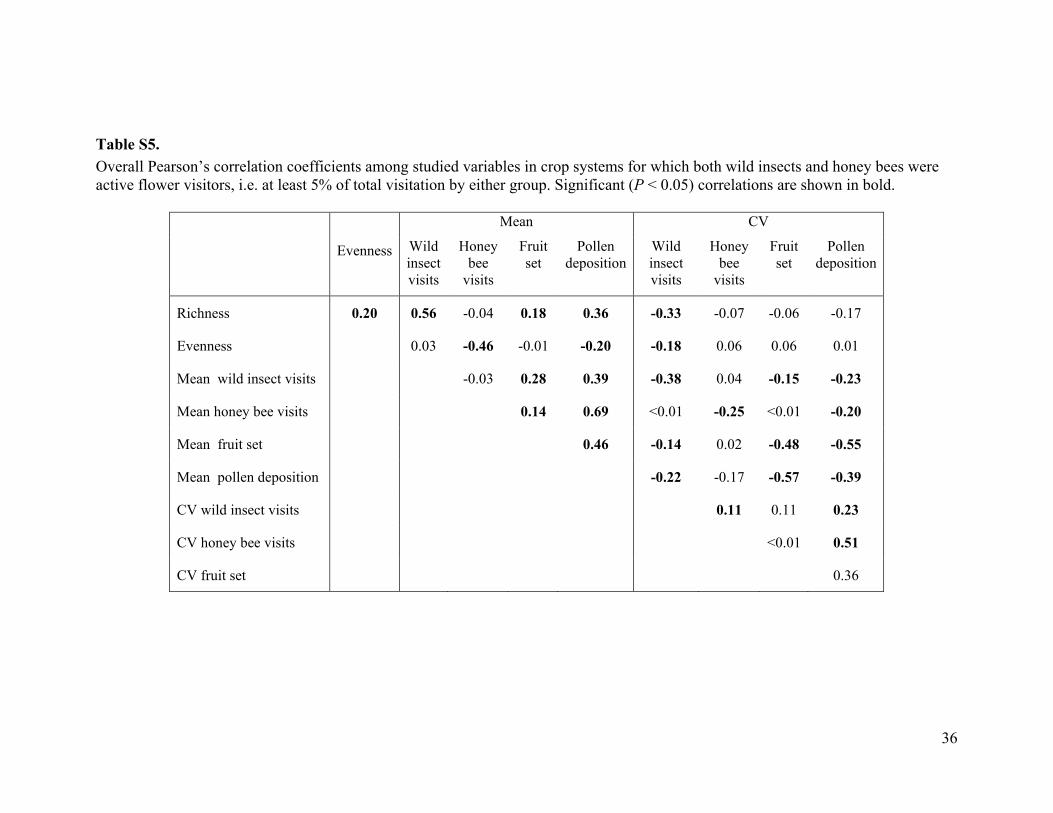
36
Table S5. Overall Pearson’s correlation coefficients among studied variables in crop systems for which both wild insects and honey bees were active flower visitors, i.e. at least 5% of total visitation by either group. Significant (P
Evenness
Mean CV
Wild insect visits
Honey bee
visits
Fruit set
Pollen deposition
Wild insect visits
Honey bee
visits
Fruit set
Pollen deposition
Richness 0.20 0.56 -0.04 0.18 0.36 -0.33 -0.07 -0.06 -0.17
Evenness 0.03 -0.46 -0.01 -0.20 -0.18 0.06 0.06 0.01
Mean wild insect visits -0.03 0.28 0.39 -0.38 0.04 -0.15 -0.23
Mean honey bee visits 0.14 0.69 <0.01 -0.25 <0.01 -0.20
Mean fruit set 0.46 -0.14 0.02 -0.48 -0.55
Mean pollen deposition -0.22 -0.17 -0.57 -0.39
CV wild insect visits 0.11 0.11 0.23
CV honey bee visits <0.01 0.51
CV fruit set 0.36

37
Additional Data table S1 (separate file) Database_S1.txt: Data used in the primary analyses of this article. Note that for some analyses a subset of these data was used (e.g. only crop systems including both wild insects and honey bees). See Material and Methods for further information.
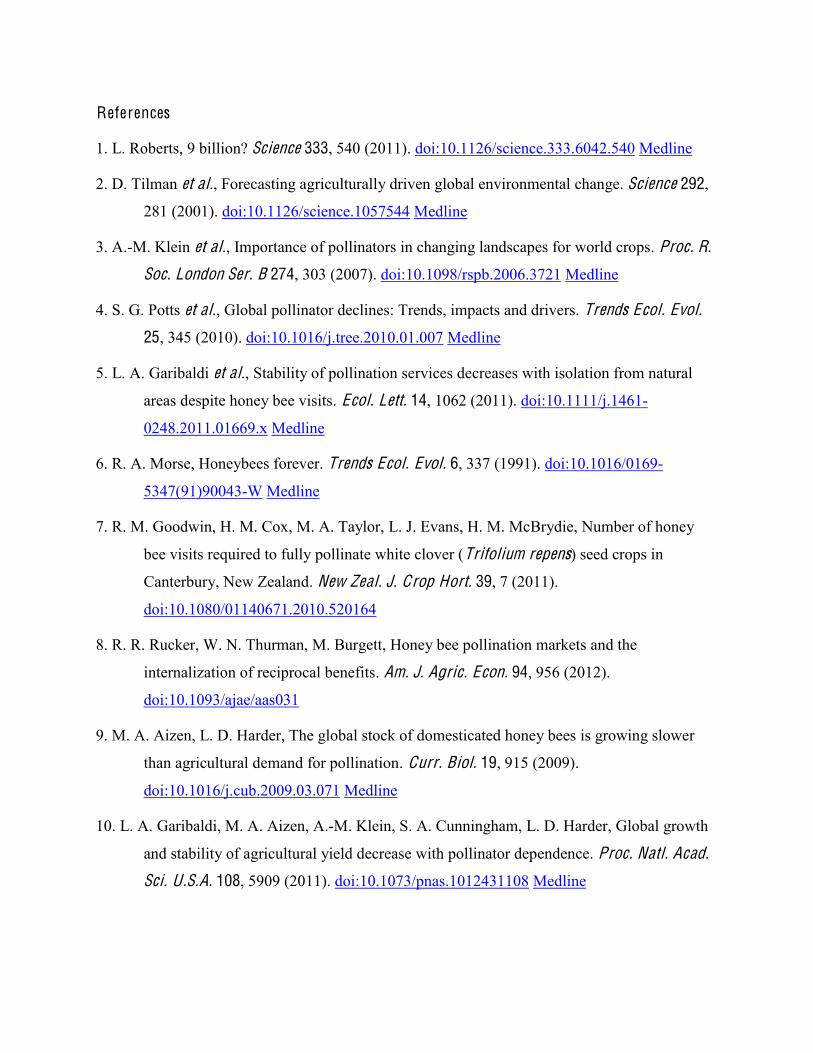
References
1. L. Roberts, 9 billion? Science 333, 540 (2011). doi:10.1126/science.333.6042.540 Medline
2. D. Tilman et al., Forecasting agriculturally driven global environmental change. Science 292,
281 (2001). doi:10.1126/science.1057544 Medline
3. A.-M. Klein et al., Importance of pollinators in changing landscapes for world crops. Proc. R.
Soc. London Ser. B 274, 303 (2007). doi:10.1098/rspb.2006.3721 Medline
4. S. G. Potts et al., Global pollinator declines: Trends, impacts and drivers. Trends Ecol. Evol.
25, 345 (2010). doi:10.1016/j.tree.2010.01.007 Medline
5. L. A. Garibaldi et al., Stability of pollination services decreases with isolation from natural
areas despite honey bee visits. Ecol. Lett. 14, 1062 (2011). doi:10.1111/j.1461-
0248.2011.01669.x Medline
6. R. A. Morse, Honeybees forever. Trends Ecol. Evol. 6, 337 (1991). doi:10.1016/0169-
5347(91)90043-W Medline
7. R. M. Goodwin, H. M. Cox, M. A. Taylor, L. J. Evans, H. M. McBrydie, Number of honey
bee visits required to fully pollinate white clover (Trifolium repens) seed crops in
Canterbury, New Zealand. New Zeal. J. Crop Hort. 39, 7 (2011).
doi:10.1080/01140671.2010.520164
8. R. R. Rucker, W. N. Thurman, M. Burgett, Honey bee pollination markets and the
internalization of reciprocal benefits. Am. J. Agric. Econ. 94, 956 (2012).
doi:10.1093/ajae/aas031
9. M. A. Aizen, L. D. Harder, The global stock of domesticated honey bees is growing slower
than agricultural demand for pollination. Curr. Biol. 19, 915 (2009).
doi:10.1016/j.cub.2009.03.071 Medline
10. L. A. Garibaldi, M. A. Aizen, A.-M. Klein, S. A. Cunningham, L. D. Harder, Global growth
and stability of agricultural yield decrease with pollinator dependence. Proc. Natl. Acad.
Sci. U .S.A. 108, 5909 (2011). doi:10.1073/pnas.1012431108 Medline
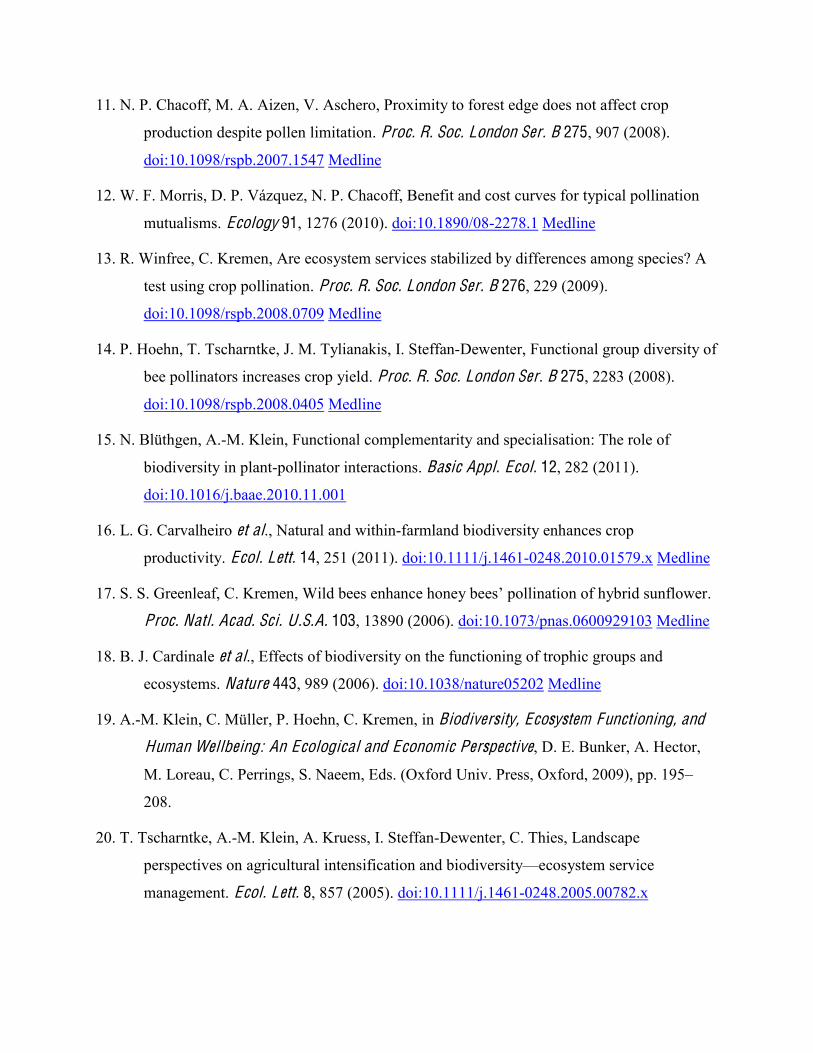
11. N. P. Chacoff, M. A. Aizen, V. Aschero, Proximity to forest edge does not affect crop
production despite pollen limitation. Proc. R. Soc. London Ser. B 275, 907 (2008).
doi:10.1098/rspb.2007.1547 Medline
12. W. F. Morris, D. P. Vázquez, N. P. Chacoff, Benefit and cost curves for typical pollination
mutualisms. Ecology 91, 1276 (2010). doi:10.1890/08-2278.1 Medline
13. R. Winfree, C. Kremen, Are ecosystem services stabilized by differences among species? A
test using crop pollination. Proc. R. Soc. London Ser. B 276, 229 (2009).
doi:10.1098/rspb.2008.0709 Medline
14. P. Hoehn, T. Tscharntke, J. M. Tylianakis, I. Steffan-Dewenter, Functional group diversity of
bee pollinators increases crop yield. Proc. R. Soc. London Ser. B 275, 2283 (2008).
doi:10.1098/rspb.2008.0405 Medline
15. N. Blüthgen, A.-M. Klein, Functional complementarity and specialisation: The role of
biodiversity in plant-pollinator interactions. Basic Appl. Ecol. 12, 282 (2011).
doi:10.1016/j.baae.2010.11.001
16. L. G. Carvalheiro et al., Natural and within-farmland biodiversity enhances crop
productivity. Ecol. Lett. 14, 251 (2011). doi:10.1111/j.1461-0248.2010.01579.x Medline
17. S. S. Greenleaf, C. Kremen, .
Proc. Natl. Acad. Sci. U .S.A. 103, 13890 (2006). doi:10.1073/pnas.0600929103 Medline
18. B. J. Cardinale et al., Effects of biodiversity on the functioning of trophic groups and
ecosystems. Nature 443, 989 (2006). doi:10.1038/nature05202 Medline
19. A.-M. Klein, C. Müller, P. Hoehn, C. Kremen, in Biodiversity, Ecosystem Functioning, and
Human Wellbeing: An Ecological and Economic Perspective, D. E. Bunker, A. Hector,
M. Loreau, C. Perrings, S. Naeem, Eds. (Oxford Univ. Press, Oxford, 2009), pp. 195
208.
20. T. Tscharntke, A.-M. Klein, A. Kruess, I. Steffan-Dewenter, C. Thies, Landscape
perspectives on agricultural intensification and biodiversity ecosystem service
management. Ecol. Lett. 8, 857 (2005). doi:10.1111/j.1461-0248.2005.00782.x
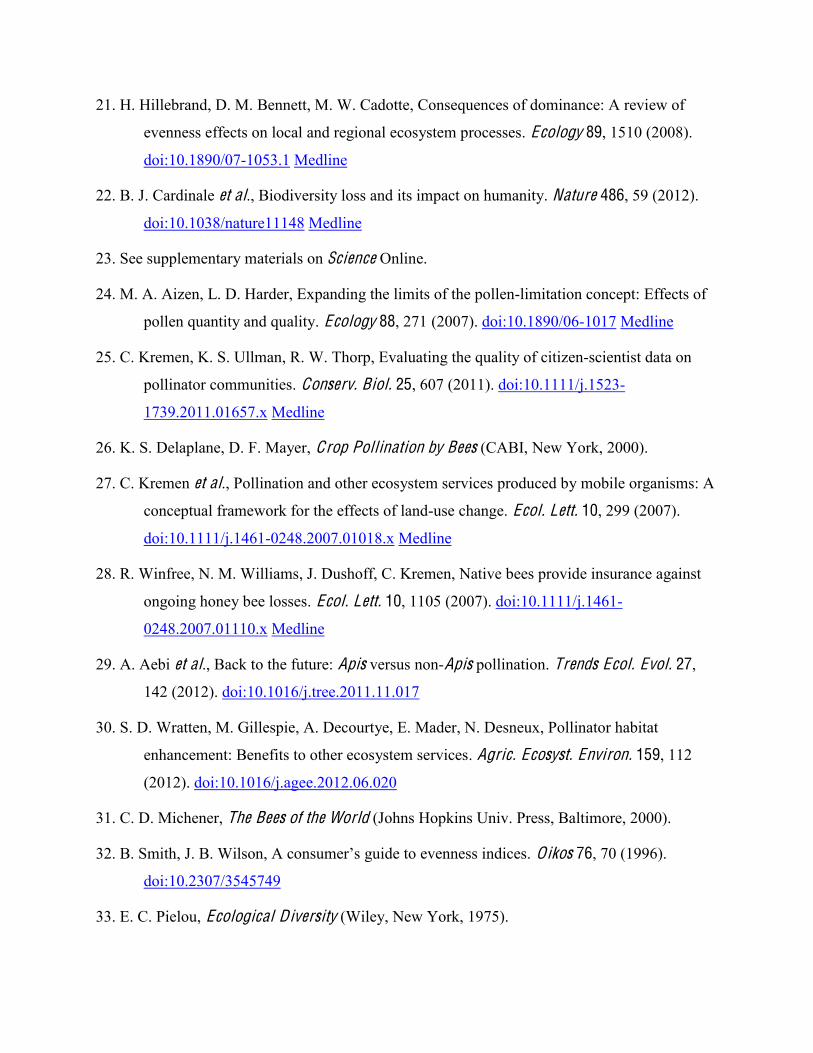
21. H. Hillebrand, D. M. Bennett, M. W. Cadotte, Consequences of dominance: A review of
evenness effects on local and regional ecosystem processes. Ecology 89, 1510 (2008).
doi:10.1890/07-1053.1 Medline
22. B. J. Cardinale et al., Biodiversity loss and its impact on humanity. Nature 486, 59 (2012).
doi:10.1038/nature11148 Medline
23. See supplementary materials on Science Online.
24. M. A. Aizen, L. D. Harder, Expanding the limits of the pollen-limitation concept: Effects of
pollen quantity and quality. Ecology 88, 271 (2007). doi:10.1890/06-1017 Medline
25. C. Kremen, K. S. Ullman, R. W. Thorp, Evaluating the quality of citizen-scientist data on
pollinator communities. Conserv. Biol. 25, 607 (2011). doi:10.1111/j.1523-
1739.2011.01657.x Medline
26. K. S. Delaplane, D. F. Mayer, Crop Pollination by Bees (CABI, New York, 2000).
27. C. Kremen et al., Pollination and other ecosystem services produced by mobile organisms: A
conceptual framework for the effects of land-use change. Ecol. Lett. 10, 299 (2007).
doi:10.1111/j.1461-0248.2007.01018.x Medline
28. R. Winfree, N. M. Williams, J. Dushoff, C. Kremen, Native bees provide insurance against
ongoing honey bee losses. Ecol. Lett. 10, 1105 (2007). doi:10.1111/j.1461-
0248.2007.01110.x Medline
29. A. Aebi et al., Back to the future: Apis versus non-Apis pollination. Trends Ecol. Evol. 27,
142 (2012). doi:10.1016/j.tree.2011.11.017
30. S. D. Wratten, M. Gillespie, A. Decourtye, E. Mader, N. Desneux, Pollinator habitat
enhancement: Benefits to other ecosystem services. Agric. Ecosyst. Environ. 159, 112
(2012). doi:10.1016/j.agee.2012.06.020
31. C. D. Michener, The Bees of the World (Johns Hopkins Univ. Press, Baltimore, 2000).
32. B. Smith, J. B. Wilson, A c . Oikos 76, 70 (1996).
doi:10.2307/3545749
33. E. C. Pielou, Ecological Diversity (Wiley, New York, 1975).
34. C. Kremen, N. M. Williams, R. W. Thorp, Crop pollination from native bees at risk from
agricultural intensification. Proc. Natl. Acad. Sci. U .S.A. 99, 16812 (2002).
doi:10.1073/pnas.262413599 Medline
35. C. Schüepp, J. D. Herrmann, F. Herzog, M. H. Schmidt-Entling, Differential effects of
habitat isolation and landscape composition on wasps, bees, and their enemies. Oecologia
165, 713 (2011). doi:10.1007/s00442-010-1746-6 Medline
36. R. Bommarco, O. Lundin, H. G. Smith, M. Rundlöf, Drastic historic shifts in bumble-bee
community composition in Sweden. Proc. R. Soc. London Ser. B 279, 309 (2012).
doi:10.1098/rspb.2011.0647 Medline
37. O. Lundin, M. Rundlöf, H. G. Smith, R. Bommarco, Towards integrated pest management in
red clover seed production. J. Econ. Entomol. 105, 1620 (2012). doi:10.1603/EC12179
Medline
38. R. Winfree, N. M. Williams, H. Gaines, J. S. Ascher, C. Kremen, Wild bee pollinators
provide the majority of crop visitation across land-use gradients in New Jersey and
Pennsylvania, USA. J. Appl. Ecol. 45, 793 (2008). doi:10.1111/j.1365-
2664.2007.01418.x
39. R Development Core Team, R: A Language and Environment for Statistical Computing
(2011) (www.r-project.org).
40. A. Gelman, J. Hill, Data Analysis Using Regression and Multilevel/Hierarchical Models
(Cambridge Univ. Press, Cambridge, 2007).
41. D. Bates, M. Maechler, B. Bolker, lme4: Linear Mixed-Effects Models Using s4 Classes
(2011).
42. S. S. Qian, T. F. Cuffney, I. Alameddine, G. McMahon, K. H. Reckhow, On the application
of multilevel modeling in environmental and ecological studies. Ecology 91, 355 (2010).
doi:10.1890/09-1043.1 Medline
43. J. B. Johnson, K. S. Omland, Model selection in ecology and evolution. Trends Ecol. Evol.
19, 101 (2004). doi:10.1016/j.tree.2003.10.013 Medline
44. S. A. Richards, Testing ecological theory using the information-theoretic approach:
Examples and cautionary results. Ecology 86, 2805 (2005). doi:10.1890/05-0074
45. A. F. Zuur, E. N. Ieno, N. J. Walker, A. A. Saveliev, G. M. Smith, Mixed E ffects Models and
Extensions in Ecology with R (Springer, New York, 2009).
46. D. O. Stram, Meta-analysis of published data using a linear mixed-effects model. Biometrics
52, 536 (1996). doi:10.2307/2532893 Medline
47. S. A. Smith-Warner et al., Methods for pooling results of epidemiologic studies: The pooling
project of prospective studies of diet and cancer. Am. J. Epidemiol. 163, 1053 (2006).
doi:10.1093/aje/kwj127 Medline
48. A.-M. Klein, I. Steffan-Dewenter, T. Tscharntke, Fruit set of highland coffee increases with
the diversity of pollinating bees. Proc. R. Soc. London Ser. B 270, 955 (2003).
doi:10.1098/rspb.2002.2306 Medline
49. A.-M. Klein, Nearby rainforest promotes coffee pollination by increasing spatio-temporal
stability in bee species richness. For. Ecol. Manage. 258, 1838 (2009).
doi:10.1016/j.foreco.2009.05.005
50. T. H. Ricketts, Tropical forest fragments enhance pollinator activity in nearby coffee crops.
Conserv. Biol. 18, 1262 (2004). doi:10.1111/j.1523-1739.2004.00227.x
51. T. H. Ricketts, G. C. Daily, P. R. Ehrlich, C. D. Michener, Economic value of tropical forest
to coffee production. Proc. Natl. Acad. Sci. U .S.A. 101, 12579 (2004).
doi:10.1073/pnas.0405147101 Medline
52. E. I. Badano, C. H. Vergara, Potential negative effects of exotic honey bees on the diversity
of native pollinators and yield of highland coffee plantations. Agric. For. Entomol. 13,
365 (2011). doi:10.1111/j.1461-9563.2011.00527.x
53. A.-M. Klein, I. Steffan-Dewenter, T. Tscharntke, Pollination of Coffea canephora in relation
to local and regional agroforestry management. J. Appl. Ecol. 40, 837 (2003).
doi:10.1046/j.1365-2664.2003.00847.x
54. S. Krishnan, C. G. Kushalappa, R. U. Shaanker, J. Ghazoul, Status of pollinators and their
efficiency in coffee fruit set in a fragmented landscape mosaic in South India. Basic Appl.
Ecol. 13, 277 (2012). doi:10.1016/j.baae.2012.03.007
55. M. B. T. Munyuli, Micro, local, landscape and regional drivers of bee biodiversity and
pollination services delivery to coffee (Coffea canephora) in Uganda. Int. J. Biodivers.
Sci. Ecosyst. Serv. Manage. 8, 190 (2012). doi:10.1080/21513732.2012.682361
56.V. Boreux, S. Krishnan, K. G. Cheppudira, J. Ghazoul, Impact of forest fragments on bee
visits and fruit set in rain-fed and irrigated coffee agro-forests. Agric. Ecosyst. Environ.
10.1016/j.agee.2012.05.003 (2012). doi:10.1016/j.agee.2012.05.003 Medline
57. N. P. Chacoff, M. A. Aizen, Edge effects on flower-visiting insects in grapefruit plantations
bordering premontane subtropical forest. J. Appl. Ecol. 43, 18 (2006).
doi:10.1111/j.1365-2664.2005.01116.x
58. K. R. Blanche, J. A. Ludwig, S. A. Cunningham, Proximity to rainforest enhances pollination
and fruit set in orchards. J. Appl. Ecol. 43, 1182 (2006). doi:10.1111/j.1365-
2664.2006.01230.x
59. L. G. Carvalheiro, C. L. Seymour, S. W. Nicolson, R. Veldtman, Creating patches of native
flowers facilitates crop pollination in large agricultural fields: Mango as a case study. J.
Appl. Ecol. 49, 1373 (2012). doi:10.1111/j.1365-2664.2012.02217.x
60. J. Hipólito de Sousa, C. M. Pigozzo, B. F. Viana, Polinizaçao de manga (Mangifera indica L.
- Anacardiaceae) variedade Tommy Atkins, no vale do Sao Francisco, Bahia. Oecol.
Austral. 14, 165 (2010). doi:10.4257/oeco.2010.1401.09
61. M. M. Mayfield, The importance of nearby forest to known and potential pollinators of oil
palm (Elaeis guineënsis Jacq.; Areceaceae) in southern Costa Rica. Econ. Bot. 59, 190
(2005). doi:10.1663/0013-0001(2005)059[0190:TIONFT]2.0.CO;2
62. T. H. Ricketts et al., Landscape effects on crop pollination services: Are there general
patterns? Ecol. Lett. 11, 499 (2008). doi:10.1111/j.1461-0248.2008.01157.x Medline
63. A.-M. Klein et al., Wild pollination services to California almond rely on semi-natural
habitat. J. Appl. Ecol. 49, 723 (2012).
64. S. S. Greenleaf, C. Kremen, Wild bee species increase tomato production and respond
differently to surrounding land use in Northern California. Biol. Conserv. 133, 81 (2006).
doi:10.1016/j.biocon.2006.05.025
65. R. Isaacs, A. K. Kirk, Pollination services provided to small and large highbush blueberry
fields by wild and managed bees. J. Appl. Ecol. 47, 841 (2010). doi:10.1111/j.1365-
2664.2010.01823.x
66. G. Carré et al., Landscape context and habitat type as drivers of bee diversity in European
annual crops. Agric. Ecosyst. Environ. 133, 40 (2009). doi:10.1016/j.agee.2009.05.001
67. H. Taki et al., Effects of landscape metrics on Apis and non-Apis pollinators and seed set in
common buckwheat. Basic Appl. Ecol. 11, 594 (2010). doi:10.1016/j.baae.2010.08.004
68. A. Holzschuh, J. H. Dudenhöffer, T. Tscharntke, Landscapes with wild bee habitats enhance
pollination, fruit set and yield of sweet cherry. Biol. Conserv. 153, 101 (2012).
doi:10.1016/j.biocon.2012.04.032
69. T. H. Ricketts, N. M. Williams, M. M. Mayfield, in Connectivity for Conservation, M.
Sanjayan, K. Crooks, Eds. (Cambridge Univ. Press, Cambridge, 2006), pp. 255 289.
70. B. G. Howlett, M. K. Walker, L. E. Newstrom-Lloyd, B. J. Donovan, D. A. J. Teulon,
Window traps and direct observations record similar arthropod flower visitor
assemblages in two mass flowering crops. J. Appl. Entomol. 133, 553 (2009).
doi:10.1111/j.1439-0418.2009.01395.x
71. R. Bommarco, L. Marini, B. E. Vaissière, Insect pollination enhances seed yield, quality, and
market value in oilseed rape. Oecologia 169, 1025 (2012). doi:10.1007/s00442-012-
2271-6 Medline
72. R. Rader, B. G. Howlett, S. A. Cunningham, D. A. Westcott, W. Edwards, Spatial and
temporal variation in pollinator effectiveness: Do unmanaged insects provide consistent
pollination services to mass flowering crops? J. Appl. Ecol. 49, 126 (2012).
doi:10.1111/j.1365-2664.2011.02066.x
73. R. Rader et al., Alternative pollinator taxa are equally efficient but not as effective as the
honeybee in a mass flowering crop. J. Appl. Ecol. 46, 1080 (2009). doi:10.1111/j.1365-
2664.2009.01700.x
74. R. da Silva Guedes et al., Déficit de polinização da aceroleira no período seco no semíarido
paraibano. Rev. Bras. F rutic. 33, 465 (2011). doi:10.1590/S0100-29452011005000060
75. J. B. Free, Insect Pollination of Crops (Academic Press, London, 1993).
76. N. Joseph, E. A. Siril, G. M. Nair, Reproductive characterization and preliminary studies on
controlled breeding of Annatto (Bixa orellana L.). Plant Syst. Evol. 298, 239 (2012).
doi:10.1007/s00606-011-0541-0
77. K. M. Medeiros de Siquiera et al., Estudo comparativo da polinização em variedades de
aceroleiras (Malpighia emarginata DC, Malpighiaceae). Rev. Caatinga 24, 18 (2011).
78. R. Rivera-Madrid et al., Preliminary studies toward genetic improvement of annatto (Bixa
orellana L.). Sci. Hortic. 109, 165 (2006). doi:10.1016/j.scienta.2006.03.011
79. D. W. Roubik, Pollination of Cultivated Plants in the Tropics (Food and Agriculture
Organization of the United Nations, Rome, 1995).


![Felicita Garibaldi [02 e 03 quartos na Garibaldi, Salvador/BA]](https://static.fdocuments.net/doc/165x107/55860eb4d8b42a90638b50c6/felicita-garibaldi-02-e-03-quartos-na-garibaldi-salvadorba.jpg)