GARCINIA PARVIFOLIA AND THEIR ANTIOXIDANT...
134
INVESTIGATION OF CHEMICAL CONSTITUENTS FROM GARCINIA PARVIFOLIA AND THEIR ANTIOXIDANT ACTIVITIES By CHIA LUN CHANG A project report submitted to the Department of Chemical Science Faculty of Science Universiti Tunku Abdul Rahman in partial fulfillment of requirement for the degree of Degree of Bachelor of Science (Hons) Chemistry MAY 2016
Transcript of GARCINIA PARVIFOLIA AND THEIR ANTIOXIDANT...

i
INVESTIGATION OF CHEMICAL CONSTITUENTS FROM
GARCINIA PARVIFOLIA AND THEIR ANTIOXIDANT ACTIVITIES
By
CHIA LUN CHANG
A project report submitted to the Department of Chemical Science
Faculty of Science
Universiti Tunku Abdul Rahman
in partial fulfillment of requirement for the degree of
Degree of Bachelor of Science (Hons) Chemistry
MAY 2016

ii
ABSTRACT
INVESTIGATION OF CHEMICAL CONSTITUENTS FROM
GARCINIA PARVIFOLIA AND THEIR ANTIOXIDANT ACTIVITIES
CHIA LUN CHANG
Garcinia species are rich in phenolic compounds which are potential antioxidants.
In line with the search for natural antioxidant, the stem bark of Garcinia parvifolia
was investigated for its phytochemicals and antioxidant activity. The plant
material was subjected to sequential solvent extraction by using dichloromethane,
ethyl acetate and methanol. The crude extracts obtained were subsequently
fractionated and purified via column chromatography to give pure compounds.
From the crude ethyl acetate extract, three xanthone derivatives and a terpenoid
were successful isolated, namely brasixanthone B [67], 1,3,6-trihydroxy-2,4-bis(3-
methylbut-2-enyl)xanthone [68], rubraxanthone [69] and tetraprenyltoluquinone
(TPTQ) [70]. The structures of isolated compounds were characterized and
elucidated via various spectroscopic techniques including 1D- and 2D-NMR, LC-
MS, UV-Vis and IR analyses. In the DPPH assay, the crude dichloromethane and
ethyl acetate extracts showed significant antioxidant activity with IC50 values of
40.0 and 44.5 µg/ml, respectively. Meanwhile, isolated compounds 68 and 69
were tested to give weak activity with IC50 values of 185 and 195 µg/ml,
respectively, whereas compounds 67 and 70 were found to be inactive in the assay
showing IC50 values of more than 240 µg/ml.

iii
ABSTRAK
Spesies Garcinia adalah kaya dengan kompaun fenolik yang berpotensi
antioksidan. Selaras dengen mencari antiokdisen semula jadi, kulit kayu batang
Garcinia parvifolia telah disiasat bagi fitokimia dan aktiviti antioksidan. Bahan
tumbuhan tetah diestrak berturutan dengan menggunakan diklorometana, etil
asetat and metanol. Ekstrak mentah yang diperolehi kemudiannya diasingkan dan
melalui kolum kromatografi untuk menghasilkan kompaun tulen. Daripada ekstrak
etil asetat, tiga xanthona derivatif dan satu terpenoid telah diasingkan, iaitu
brasixanthone B [67], 1,3,6-trihydroxy-2,4-bis(3-methylbut-2-enyl)xanthone [68],
rubraxanthone [69] and tetraprenyltoluquinone (TPTQ) [70]. Struktur-struktur
kompaun diperolehi telah dikenal pastikan melalui pelbagai spektroskopi analisis,
termasuklah 1D- and 2D-NMR, LC-MS, UV-Vis dan IR. Dalam kaedah DPPH,
ekstrak mentah diklorometana dan etil asetat menunjukkan ciri-ciri antioksidan
yang nyata dengan nilai IC50 iaitu 40.0 and 44.5 µg/ml. Sementara itu, kompaun
68 dan 69 menunjukkan activiti yang lemah dengan nilai IC50 iaitu 185 and 195
µg/ml manakala kompaun 66 dan 70 didapati tidak aktif dalm ujian tersebut,
menunjukkan nilai IC50 yang melebihi 240 µg/ml.

iv
ACKNOWLEDGEMENTS
First of all, I wish to express my sincere appreciation to my supervisor, Dr Lim
Chan Kiang, who has revealed his kindness in providing us continual guidance,
valuable knowledge, advices and support throughout the course of this project.
Thank you for sparing precious time in teaching and explaining patiently
whenever I faced difficulties in lab work and thesis writing.
Secondly, special thanks to my postgraduate senior, Ms Hemaroopini
Subramaniam for her guidance in chemical tests and handling instruments. Thanks
for her experiences and willingness in sharing knowledges which helped me a lot
during my bench work. Besides, I would like to appreciate the efforts of the lab
assistances in providing all the materials and the apparatus that I needed
throughout my lab work and running mass spectrometry analysis on my samples.
Last but not least, I would like to take this opportunity to show my gratitude to my
lab mates, Lee Le Weng for his motivation and sincere advices during my difficult
times. I sincerely appreciate all your help and generous in sharing information
with me. Last but not least, million thanks to my beloved friends and family for
their enduring love and emotional support which motivated me throughout this
research study.

v
DECLARATION
I hereby declare that the project report is based on my original work except for
quotations and citations which have been duly acknowledge. I also declare that it
has not been previously or concurrently submitted for any other degree at UTAR
or other institutions.
(CHIA LUN CHANG)

vi
APPROVAL SHEET
The project report entitled “INVESTIGATION OF CHEMICAL
CONSTITUENTS FROM GARCINIA PARVIFOLIA AND THEIR
ANTIOXIDANT ACTIVITIES” was prepared by CHIA LUN CHANG and
submitted as partial fulfillment of the requirements for the degree of Bachelor of
Science (Hons) Chemistry at Universiti Tunku Abdul Rahman.
Approved by:
Date:
(Dr. Lim Chan Kiang)
Supervisor
Department of Chemical Science
Faculty of Science
Universiti Tunku Abdul Rahman

vii
FACULTY OF SCIENCE
UNIVERSITI TUNKU ABDUL RAHMAN
Date:
PERMISSION SHEET
It is hereby certified that Chia Lun Chang (ID No: 12ADB02637) has completed
this final year project entitled “INVESTIGATION OF CHEMICAL
CONSTITUENTS FROM GARCINIA PARVIFOLIA AND THEIR
ANTIOXIDANT ACTIVITIES” under the supervision of Dr. Lim Chan Kiang
from the Department of Chemical Science, Faculty of Science.
I hereby give permission to the University to upload the softcopy of my final year
project in pdf format into the UTAR Institutional Repository, which may be made
accessible to the UTAR community and public.
Yours truly,
(CHIA LUN CHANG)

viii
TABLE OF CONTENTS
Page
ABSTRACT ii
ABSTRAK iii
ACKNOWLEDGEMENTS iv
DECLARATION v
APPROVAL SHEET vi
PERMISSION SHEET vii
TABLE OF CONTENTS viii
LIST OF FIGURES xi
LIST OF TABLES xiv
LIST OF ABBREVIATIONS xv
CHAPTER
1 INTRODUCITON
1.1 General Introduction
1.2 Botany of Plant Species Studied
1.2.1 Taxonomy
1.2.2 Morphology
1.2.3 Geographical Distribution and Habitat
1.2.4 Ethnomedical Uses and Pharmacological Studies
1.3 Problem statement
1.4 Objectives of Study
1
5
6
7
8
9
10

ix
2 LITERATURE REVIEW
2.1 Phytochemical studies
2.1.1 Xanthones
2.1.2 Terpenoids
2.1.3 Flavonoids
2.2 Chemistry of Garcinia Species
2.2.1 Chemistry and Biological Activities of
Garcinia mangostana
2.2.2 Chemistry and Biological Activities of
Garcinia cowa
2.2.3 Chemistry and Biological Activities of
Garcinia parvifolia
2.2.4 Chemistry and Biological Activities of
Garcinia fusca Pierre
2.3 Summary of Literature Review on the genus Garcinia
3 EXPERIMENTAL
3.1 Plant Material
3.2 Chemical Reagent
3.3 Instrument
3.3.1 Nuclear Magnetic Resonance
3.3.2 Infrared Spectrophotometer (IR)
3.3.3 Ultraviolet-Visible Spectrophotometer (UV-
Vis)
3.3.4 Liquid Chromatography-Mass Spectrometry
(LC-MS)
3.3.5 Melting Point Apparatus
3.3.6 Polarimeter
3.4 Chromatographic Methods
3.4.1 Column Chromatography
3.4.2 Thin Layer Chromatography
11
12
13
14
15
16
19
23
27
30
34
34
37
38
38
39
39
40
40
42

x
3.4.3 TLC Detection Methods
3.5 Extraction and Isolation of Chemical Constituents from
Garcinia parvifolia
3.5.1 Isolation pathway of pure compounds
3.6 Antioxidant Assay
4 RESULTS AND DISCUSSIONS
4.1 Isolation of Chemical Constituents from Garcinia
parvifolia
4.2 Characterization and Structural Elucidation of
Brasixanthone B [67]
4.3 Characterization and Structural Elucidation of 1,3,7-
trihydroxy-2,4-bis(3-methylbut-2-enyl)xanthone [68]
4.4 Characterization and Structural Elucidation of
Rubraxanthone [69]
4.5 Characterization and Structural Elucidation of
Tetraprenyltoluquinone [70]
4.6 Antioxidant Assay
5 CONCLUSION
5.1 Conclusion
5.2 Future Perspectives
REFERENCES
44
45
46
48
51
53
67
79
90
100
104
105
106

xi
LIST OF FIGURES
Figure Page
1.1
2.1
2.2
2.3
2.4
2.5
2.6
2.7
2.8
2.9
2.10
2.11
2.12
3.1
3.2
3.3
3.4
4.1
4.2
4.3
Garcinia parvifolia tree and its fruits
Molecular structure of xanthone
Molecular structure of isoprene (C5H8)
Basic molecular structure of flavonoid
Structures of chemical constituents isolated from Garcinia
mangostana
Structures of chemical constituents isolated from Garcinia
mangostana (continued)
Structures of chemical constituents isolated from Garcinia
mangostana (continued)
Structures of chemical constituents isolated from Garcinia cowa
Structures of chemical constituents isolated from Garcinia cowa
(continued)
Structures of chemical constituents isolated from Garcinia
parvifolia
Structures of chemical constituents isolated from Garcinia
parvifolia (continued)
Structures of chemical constituents isolated from Garcinia fusca
Structures of chemical constituents isolated from Garcinia fusca
(continued)
Apparatus set up for column chromatography
Developed TLC plate
Isolation Pathway of Pure Compounds
Summary of Methodology
Chemical structure of brasixanthone B [67]
HRESI mass spectrum of brasixanthone B [67]
UV-Vis spectrum of brasixanthone B [67]
7
12
13
14
17
18
19
21
22
25
26
28
29
41
43
47
50
53
58
59

xii
4.4
4.5
4.6
4.7
4.8
4.9
4.10
4.11
4.12
4.13
4.14
4.15
4.16
4.17
4.18
4.19
4.20
4.21
4.22
4.23
4.24
4.25
4.26
4.27
4.28
4.29
4.30
4.31
4.32
4.33
4.34
IR spectrum of brasixanthone B [67]
1H NMR spectrum of brasixanthone B [67]
13C NMR spectrum of brasixanthone B [67]
HMQC spectrum of brasixanthone B [67]
HMBC spectrum of brasixanthone B [67] (expanded)
HMBC spectrum of brasixanthone B [67] (expanded)
HMBC spectrum of brasixanthone B [67] (expanded)
HMBC spectrum of brasixanthone B [67] (expanded)
Chemical Structure of compound 68
HRESI mass spectrum of compound 68
UV-Vis spectrum of compound 68
IR spectrum of compound 68
1H NMR spectrum of compound 68
13C NMR spectrum of compound 68
DEPT spectrum of compound 68
HMQC spectrum of compound 68
HMBC spectrum of compound 68
Chemical structure of compound 69
HRESI mass spectrum of compound 69
UV-Vis spectrum of compound 69
IR spectrum of compound 69
1H NMR spectrum of compound 69
13C NMR spectrum of compound 69
DEPT spectrum of compound 69
HMQC spectrum of compound 69
HMBC spectrum of compound 69
Chemical Structure of compound 70
HRESI mass spectrum of compound 70
UV-Vis spectrum of compound 70
IR spectrum of compound 70
1H NMR spectrum of compound 70
59
60
61
62
63
64
65
66
67
72
73
73
74
75
76
77
78
79
83
84
84
85
86
87
88
89
90
94
94
94
95

xiii
4.35
4.36
4.37
4.38
4.39
4.40
13C NMR spectrum of compound 70
DEPT spectrum of compound 70
HMQC spectrum of compound 70
HMBC spectrum of compound 70
Graph of inhibition rate (%) against concentration of crude extracts
Graph of inhibition rate (%) against concentration of isolated
compounds
96
97
98
99
103
103

xiv
LIST OF TABLES
Table Page
1.1
2.1
3.1
3.2
3.3
3.4
3.5
3.6
4.1
4.2
4.3
4.4
4.5
Taxonomy of Garcinia parvifolia
Summary of literature data on the genus Garcinia
Industrial grade solvents and materials used in the extraction,
isolation and purification of chemical constituents
Analytical grade solvents and materials used in TLC analysis
Deuterated solvents used in NMR analysis
HPLC grade materials used in LC- and GC-MS analysis
Analytical grade solvents and materials used in UV-Vis analysis
Chemical reagents and materials used in antioxidant assay
Summary of NMR spectral data for brasixanthone B [67]
Summary of NMR spectral data for compound 68
Summary of NMR spectral data for compound 69
Summary of NMR spectral data for compound 70 in comparison
with literature values
Antioxidant results of test samples in DPPH assay
6
30
35
35
36
36
36
36
57
71
82
93
101

xv
LIST OF ABBREVIATIONS
DPPH
BPX5
A0
A1
α
β
C=C
13C
C-H
C-O
C=O
cm
δ
δC
δH
c
J
oC
Acetone-d6
CDCl3
DCM
d
dd
EtOAc
FTIR
GC-MS
IC50
1,1-diphenyl-2-picrylhydrazyl
5% phenyl 95% methyl polysilphenylene /
siloxane phase
Absorbance of the blank (negative control)
Absorbance of the test sample
Alpha
Beta
Carbon=Carbon
Carbon-13
Carbon-Hydrogen
Carbon-Oxygen (or Carbinol)
Carbon-Oxygen (or Carbonyl)
Centimeter
Chemical shift
Chemical shift of carbon
Chemical shift of proton
Concentration of sample in g/mL
Coupling constant in Hertz
Degree in Celsius
Deuterated acetone
Deuterated chloroform
Dichloromethane
Doublet
Doublet of doublets
Ethyl acetate
Fourier-Transform Infrared Spectroscopy
Gas Chromatography-Mass Spectrometry
Half maximal inhibitory concentration

xvi
Hz
JCH
HMBC
HMQC
HPLC
HRESIMS
IR
kg
LC-MS
m/z
λmax
µg
µL
µmol
mg
mL
mm
mM
mol
m
nm
NMR
1D-NMR
O-H
ppm
KBr
1H
Rf
s
Hertz
Heteronuclear coupling between carbon and
proton
Heteronuclear Multiple Bond Coherence
Heteronuclear Multiple Quantum Coherence
High Performance Liquid Chromatography
High Resolution Electrospray Ionization Mass
Spectrometry
Infrared
Kilogram
Liquid Chromatography-Mass Spectrometry
Mass-to-charge ratio
Maximum wavelength
Microgram
Microliter
Micromole
Miligram
Mililiter
Milimeter
Milimole
Mole
Multiplet
Nanometer
Nuclear Magnetic Resonance
One Dimension Nuclear Magnetic Resonance
Oxygen-Hydrogen (or Hydroxyl)
Part per million
Potassium bromide
Proton
Retention factor
Singlet
xvii
TMS
TLC
TPA
t
2D-NMR
UV-Vis
Tetramethylsilane
Thin Layer Chromatography
Tissue Plasminogen Activator
Triplet
Two Dimension Nuclear Magnetic Resonance
Ultraviolet-Visible

1
CHAPTER 1
INTRODUCTION
1.1 General Introduction
Nature has been the major source of medicinal agents which provides
ethnomedicinal properties for thousands of years. Historically, natural products
play a prominent role as natural medicine in therapeutic development. Natural
products are the organic compounds produced by living organisms, mostly derived
from plant species that usually possess pharmacological or biological effects
(James, 2012). Phytochemistry is a sub-division of natural product chemistry
which focuses on the study of plant derived metabolites.
Metabolites are known as the intermediates in the metabolic process in nature
which can be classified into primary and secondary metabolites (Ana, 2012). The
examples of primary metabolites are protein, carbohydrate, lipids, nucleic acids
and enzyme. Primary metabolites are involved in the normal growth, development,
respiration and reproduction which are typically crucial for the survival and
metabolic processes of a living organism (James, 2003). Meanwhile, secondary
metabolites are chemical compounds derived from living organisms, which are not
directly involved in metabolic processes, and apparently not necessary for the
survival, growth, development or reproduction process.

2
The common classes of secondary metabolites are xanthones, terpenoids,
flavonoid, depsidone and phloroglucinol. Secondary metabolites perform several
important functions, for instance, communication purpose, mediation of spatial
competition, prevention of fouling, protection against UV radiation and chemical
signaling to enhance adaptability to surrounding environment (Sonia, 2006). They
are normally produced from complex combinations of biosynthetic pathways in
order to defense against predators and pathogens, in providing reproductive
advantage as intraspecific and interspecific attractants, and to create competitive
advantage as poisons of rival species (Hailemichael, 2005). Simple principle
building blocks such as amino acids, acetate, shikimate and mevalonate are often
constructed in the form of secondary metabolites (Ma, 2011).
Plant kingdom has been well represented for their medicinal purposes over
millions of years due to their ethnopharmacological properties which play an
important role in the major sources of drug development (Phillipson, 2001).
According to the World Health Organization (WHO News, 2002), the majority of
people in the world are heavily relying on herbal medicine which serves as the
sources of health products for their primary health care.
Throughout history, the first compendium of medical herbal in China, Pen-Tsao,
which covered around 365 types of drugs, was compiled by Shen Nung in 2800
BC (Ari, 1993). Traditional Chinese Medicine such as Ginseng and Ling Zhi were
used for the purpose to alleviate diabetes and stabilize blood pressure. Other
important discovery was the introduction of medicinal mushrooms as anti-cancer

3
drug by the Japanese (Raymond and George, 2015). In addition, ancient
civilizations of both China and India have provided written evidence for the
employment of natural product in the medicine system. The earliest known written
describing the remedies used for treatment of different kinds of diseases was
recorded on a 4000 year old Sumerian clay tablet (Kong, et al., 2003). Besides,
one of the best-known pharmaceutical records that included around 700 drugs was
found in Egypt dated from 1500 BC (Wong, et al., 2009).
The early traditional medicines were mostly derived from natural plants through
chemicals and pharmacological researches (Sarker and Nahar, 2012). Some
examples of traditional medicines that were used in ancient time such as the
mandrake as pain relief agent, turmeric as blood clotting drugs, and circulatory
disorders can be treated by raw garlic. About nine pure natural products were
isolated as anticancer agents between the years 1981 to 2006, such as vincristine
and vinblastine (Newman and Cragg, 2007). In the early history, researchers
utilized the advantages of natural compounds in order to investigate and study the
natural medicine for drug application in the medicinal development.
Morphine, quinine and penicillin are among the famous and the earliest chemical
compounds that were isolated as natural products. Morphine is an alkaloid which
was introduced in 1826 as the first commercialized therapeutic agent by Merck.
Morphine was derived from opium poppy Papaver somniferum for the purpose of
pain relief during ancient Mesopotamia (James, 2003). From the bark of Cinchona,
quinine was isolated as antimalarial drug in 1820 (Phillipson, 2001). Through

4
historical experiences, natural products also play an important role in development
of new drug in the area of cancer and infectious diseases. For instance, vincristine
and vinblastine were separated from Catharanthus roseus, which have been
introduced as effective antineoplastic agents in 1994 (Sahu, et al., 2004).
Malaysia is a country in the tropical rain forest zone, with huge diversity of flora
which potentially to be rich sources of medicinal herbs. In terms of
commercialization, approximately 3700 pure compounds have been isolated from
15000 known plant species for applications as food additives and traditional
medicine. The earliest report on phytochemicals screening in Malaysia was
presented by Arthur in 1954, which included a total of 205 plants in Sabah (Bala
and Ahmed, 2008). Moreover, the isolation of a series of pure compounds from
Guttiferae species was reported by Goh et al., such as prenylated xanthones,
neoflavonoids and biflavonoids in 1990s. The availability of large diversity of
Malaysia flora catalyzed a rapid development in phytochemical research,
subsequently enhanced the pharmaceutical drug discovery and medicinal system
successfully (Phillipson, 2001).
Therapeutic drugs discovered from natural products were found to possess various
biological activities such as anti-inflammatory, antimalarial, antineoplastic,
antioxidant, antiplasmodial, antifungal, as well as anti-microbial (Goutam, 2009).
The common techniques used in the natural products research nowadays are
extraction, separation and isolation, and structural elucidation by using
spectroscopic and spectrometric methods (Dias, Urban and Roessner, 2012). The

5
development of technologies such as chromatographic and spectroscopic
techniques (UV-Vis, IR, MS and NMR) has enhanced the skills of structural
elucidation and characterization of pure compounds (Tsuda, 2004).
The discovery of drugs derived from natural products has become more significant
in the medicine system to serve as therapeutic agent in the years to come. Minimal
side effects become the main reason that natural products are widely used in the
pharmacological and medicinal field. In 21st century, the demand of natural
products as health-care products is at all-time high as it possesses different
significant values in different fields of study (Goutam, 2012). Thus, in future,
natural products will remain as main character in meeting these demands through
the study of world‟s biodiversity which has yet to be explored. Further
investigation and development have become more significant in the aspects of
natural products. However, there are several challenges in the research of natural
products nowadays. The loss of biodiversity and development of the western drugs
have become the main challenge for the natural products research (Rates, 2001).
1.2 Botany of Plant Species Studied
1.2.1 Taxonomy
Clusiaceae is a family of plants belongs to the order Malpighiales comprising of
37 genera and 1610 species of trees and shrubs, usually with milky sap and fruits
or capsules for seeds. Garcinia is one of the largest genus in the Guttiferae family

6
that comprises of about 250 species which are found to confine to the warm humid
tropics of the world (Bonnie, 1996). The plant studied, Garcinia parvifolia is
classified as a member of Clusiaceae (or Guttiferae) family. Table 1.1 shows the
taxonomy of Garcinia parvifolia.
Table 1.1: Taxonomy of Garcinia parvifolia
Kingdom Plantae
Phylum Magnoliophyta
Class Magnoliopsida
Order Malpighiales
Family Clusiaceae / Guttiferae
Genus Garcinia
Species Garcinia parvifolia
1.2.2 Morphology
Garcinia parvifolia is an evergreen tree, usually small to medium-sized which
grows up to 5 - 33 m high with a bole of about 23 cm, and it has a rather rough
bark. The branches of Garcinia parvifolia are normally black and they contain
yellow latex (Bonnie, 1996). Their leaves are often simple, opposite, glabrous with
dark green above and paler green below. It is normally in 3.5 – 17 cm long, 2-7 cm
wide, and the petiole is 0.5 -1.5 cm long with a shallow furrow on the anterior side.
The flowers of the plants are 0.5 – 1 cm across which can be unisexual,
monoecious or polygamous and they are pale yellow in colour. The sepals are pale

7
orange colour with 2.5 – 3 mm long. The petals are with 0.5 cm long usually pale
yellow or light pink in colour (Lim, 2012). Generally, the fruits produced from
Garcinia parvifolia are cherry-like which change from yellow to red when they are
ripe. The flesh contributes about 63% of the total weight (11 – 19 g) of fruits. The
flesh of fruits is similar to mangosteen-taste which is juicy, sweet and sours.
Figure 1.1 illustrates the tree and fruits of Garcinia parvifolia.
Figure 1.1 Garcinia parvifolia tree and its fruits
1.2.3 Geographical Distribution and Habitat
Garcinia belongs to family of Clusiaceae, is native in tropical and subtropical
countries of South East Asia such as Thailand, Brunei, Malaysia and Indonesia
(Ittipon, et al., 2014). The plant studied, Garcinia parvifolia is widely distributed
in tropical Africa, Asia, New Caledonia, and Polynesia (Vatcharin, et al., 2006).
Garcinia parvifolia grows well in humid tropical environment and it is commonly
found in primary and secondary forest and pear swamp forest (Lim, 2012). The
cherry-like fruit produced by Garcinia parvifolia is locally known as „asam kandis‟
or „asam kundong‟ in Sabah and Sarawak (Siti, Jeffrey and Mohd, 2013).

8
1.2.4 Ethnomedicinal Uses and Pharmacological Studies
The wood of the trees are a source of resin. A wide variety of natural products
including xanthones, triterpenes, flavonoids, coumarins, chalcones, depsidones and
phloroglucinol were reported for their isolation from the genus of Garcinia.
Phytochemical content of the plant Garcinia parvifolia was investigated due to
their ethnomedicinal and pharmaceutical potentials (Leonardus, et al., 2006). The
phytochemicals isolated from various parts of Garcinia parvifolia were found to
possess biological and pharmacological properties such as antioxidant,
antimicrobial, anticancer, antiplatelet, antiplasmodial and anti-inflammatory
activities and were used for treatment of allergic reaction (Ee and Cheow, 2007).
One of the recent studies reported that the extracts obtained from Garcinia
parvifolia are potential antifungal and antimalarial sources (Lathifah, et al., 2010).
Some chemical researches also reported that depsidones isolated from the leaves
of Garcinia parvifolia provides cytotoxic effect. The reported depsidone is
garcidepsidone which was isolated from the chloroform soluble fraction of the
plant (Xu, et al, 2000). Later, in 2006, a phloroglucinol isolated from the twigs of
Garcinia parvifolia, namely parvifoliol E was reported to show good antioxidant
activity, showing an IC50 of 0.02 µM. (Vatcharin, et al., 2006)

9
1.3 Problem Statement
Antioxidant is a molecule that inhibits oxidation that caused by free radicals.
These free radicals normally induce oxidative stress and cause cellular damage and
increase the risk of cancer. Therefore, some natural compounds which show
antioxidant property provide protection against free radicals by stabilizing them to
minimize the cell damage. Some secondary metabolites such as phenolic
compounds are found to be good antioxidant in nature. Natural antioxidants are
highly demanded in the worldwide market (Stoia and Oancea, 2011).
Nowadays, synthetic antioxidants are produced as alternatives to natural. However
they exert toxic side effects especially at high concentration. It might cause
pathological and carcinogenic effects (Rashmi, 2011). In addition, development of
synthetic antioxidants is a costly and lengthy process. Thus, most of the synthetic
antioxidants were not employed as food additive as they are not as health friendly
as the natural antioxidants.
In line with the search for new natural antioxidants, Garcinia parvifolia was
phytochemically investigated and evaluated for its antioxidant activity via DPPH
assay. Previously study on this plant species has revealed it to be rich in phenolic
compounds which are potential source of natural antioxidant (Ruma, Sunil and
Prakash, 2013).

10
1.4 Objectives of Study
The objectives of performing this study are:
To extract and isolate chemical constituents from the stem bark of
Garcinia parvifolia.
To identify and characterize the structures of isolated compounds via
modern spectroscopic and spectrometric analyses.
To investigate the antioxidant activity of the isolated compounds and
crude extracts of Garcinia parvifolia via DPPH assay.

11
CHAPTER 2
LITERATURE REVIEW
2.1 Phytochemical Studies
Phytochemistry is the study of phytochemicals, also known as specialized
compounds which are chemically derived from plants. Plants have built up its own
chemical defenses against the environmental threats over millions of years, such as
UV radiation, microbial attacks and reactive oxygen species. The phytochemical
produced from plants play a defensive role against biotic and abiotic threats such
as wounding, pathogen attack, and play an ecological role in regulating the
interactions between plants, microorganisms, insect and animals. Phytochemicals
that are derived from plants form the basis of traditional drug pharmacopeia and to
serve as a proven source of therapeutic medicines (William and Douglas, 2012).
Plant-derived bioactive compounds which have been extensively studied were
found to exhibit diverse and interesting biological activities such as antimalarial,
antineoplastic, antioxidant, anti-ulcer, anti-inflammation and antimicrobial
properties. There are several important classes of secondary metabolites which are
commonly reported from the plant kingdom such as xanthones, coumarins,
flavonoids, phloroglucinol, and terpenoids (Su, et al., 2008).

12
2.1.1 Xanthones
Xanthones are polyphenolic compounds that show unique chemical structures with
a basic molecular formula of C13H8O2, which is also named as 9H-xanthen-9-ones
(Luo, et al., 2013). The basic chemical structure of xanthones composes of three
aromatic rings in which the middle pyran ring is fused with two benzene rings
through a carbonyl group and an ethereal oxygen. In fact, natural occurring
xanthones and its derivatives are commonly found in higher plant families of
Clusiaceae, Gentianaceae, Moraceae, Polygalaceae, also in fungi and lichens (Negi,
et al., 2013). Figure 2.1 shows the basic skeleton of xanthone.
.
Figure 2.1: Molecular structure of xanthone
Various biological activities have been reported from xanthones apart from
antioxidant activity, such as antimalarial, antifungal, anti-HIV activity,
anticarcinogenic, antimicrobial, anti-allergic, antiviral, and antiasthmatic activity
(Surat, 2006). Some literatures also reported the use of xanthones as traditional
medicine to treat fever and loss of appetite (Sarawut, 2014).

13
2.1.2 Terpenoids
Terpenes are naturally-occurring organic compounds that are built up from
isoprene (C5H8) units which are linked in a head-to-tail manner. Terpenes are
basically made up of hydrocarbons whereas terpenoids consist of extra functional
groups such as carbonyl and hydroxyl groups (Nita, Rajesh and Anju, 2014). In
general, terpenoids are present in higher plants, and more than 23,000 individual
structures have been identified mainly from vegetative tissues. Terpenoids can be
grouped into monoterpenoids (C10), sesquiterpenoids (C15), diterpernoids (C20),
sesterterpenoids (C25), triterpenoids (C30) and carotenoids (C40). Terpenoids are a
large group of natural molecules majorly occur in plants, and other sources such as
fungi and marine animals. Terpenoids are volatile natural compounds which
provide fragrance in plants and flowers, and exhibit diverse pharmaceutical
properties such as antitumor, antineoplastic and antibacterial (Parayil, et al., 2008).
Figure 2.2 shows the molecular structure of isoprene unit.
Figure 2.2: Molecular structure of isoprene (C5H8)
Monoterpernoids are the major aroma constituents of plants. Mostly, terpenoids
are found to be colourless, volatile with steam, fragrant liquids which are lighter
than water (Sam, 2008). For instance, camphor is belongs to monoterpenoids
which can be obtained from Cinnamomum camphora, and to serve as protecting
agent in clothes against the moths, stimulant for heart muscles and antiseptic agent.

14
2.1.3 Flavonoids
Flavonoids are a group of polyphenolic compounds which are widely distributed
throughout the plant kingdom such as in the families of Malvaceae, Asteraceae,
Lamiaceae, Clusiaceae and Gentianaceae. However, the family of Leguminosae is
the most endowed with flavonoid constituents among all the plant families. The
basic structure of flavonoids comprises of a diphenylpropane skeleton (C6-C3-C6)
in which the three-carbon bridge between the two phenyl rings is normally
cyclized with oxygen to give the middle ring of flavonoids (Miguel, 2009).
There were about 3000 varieties of flavonoids which have been reported to be
widely used in healthcare products due to their low level of toxicity (Agrawal,
2011). Flavonoids are usually present as aglycones, glycosides and methylated
derivatives. In general, flavonoids occur in plants as glycosylated derivatives
which serve as plant pigments that contribute yellow or orange colour in leaves,
fruits and flowers. Naturally occurring flavonoids are categorized into 6 main
subclasses depending on the oxidation state of the central pyran ring such as
flavones, flavanones, flavonols, isoflavones, flavanols and anthocyanidins
(Hamdoon, 2009). Figure 2.3 shows the basic molecular structure of flavonoids.
Figure 2.3: Basic molecular structure of flavonoid

15
The chemical nature of flavonoids is dependent on their structural class, degree of
hydroxylation, degree of conjugation and level of polymerization (Agrawal, 2011).
Various biological activities were reported from flavonoids, including anti-
inflammatory, antibacterial, anti-allergic, and antiviral activities (Pier, 2000).
2.2 Chemistry of Garcinia Species
The genus Garcinia (family of Guttiferae) comprises of about 300 different
species which are commonly found in tropical Asia, Africa and Polynesia. In
Malaysia, Garcinia is best known as a genus of fruit trees. Throughout the
decades of study, a variety of plant parts of Garcinia have been widely
investigated such as fruits, stem barks, seeds, flowers, leaves and roots, mainly due
to the presence of bioactive natural products with their valuable pharmacological
properties. Phytochemical studies have revealed the genus Garcinia to be rich in a
variety of secondary metabolites including xanthones, triterpenoids,
phloroglucinols, depsidones, biflavonoids and benzophenones (Kuete, et al., 2007).
Among the Garcinia species, G. mangostana, G. cowa, G. indica, G. lanceaefolia,
G. diversifolia, G. parvifolia and G. cambogia have been extensively investigated
which led to many important publications. Some of the phytochemicals were
found to possess a wide variety of biological and ethnomedicinal properties such
as antihypertensive, antimalarial, antioxidant, and antifungal (Sunit, et al., 2003).

16
2.2.1 Chemistry and Biological Activities of Garcinia mangostana
In the period from 2008 to 2013, there have been about 454 scientific papers
reported on Garcinia mangostana which evidenced a great interest in the study of
mangosteen plant especially its fruit hulls. The fruit hulls are found to be rich in
various xanthones of pharmacological and ethnomedicinal importances (Dmitrily,
2009). Among the Garcinia species, G. mangostana is the earliest species to be
studied for its phytochemical content and biological activities.
In year 1958, isolation of mangostin [1] and β-mangostin [2] from the fruits, bark
and dried latex of G. mangostana were carried out by Yates and Stout (Bonnie,
1996). Through various chemical elucidation, mangostin [1] was identified as
1,3,6-trihydroxy-7-methoxy-2,8-di-(3-methyl-2-butenyl)-xanthone. Throughout
the years of study, there are about 68 xanthones reported for their isolation from
different parts of G. mangostana, in which 50 of them are commonly occurred in
the fruit‟s pericarp. α-Mangostin [3] and γ-mangostin [4] are the two most
abundant xanthones derived from the pericarp of mangosteen fruits. Apart from
chemistry study, α-mangostin [3] and γ-mangostin [4] were found to exhibit anti-
inflammatory effect in macrophage and adiposite cell (Sarawut, 2014).
Chemical investigation on the pericarp of G. mangostana led to the isolation of
two new highly oxygenated prenylated xanthones from methanol extract, namely
8-hydroxycudraxanthone G [5] and mangostingone [6]. These two xanthone were
appeared as yellow solid (Hyun, et al., 2006). Besides, a total of twelve known

17
xanthones were isolated from the dichloromethane extract which were
cudraxanthone G [7], 8-deoxygratanin [8], garcinmangosone [9], garcinone D [10],
garcinone E [11], gartanin [12], 1-isomangostin [13], α-mangostin [3], γ-
mangostin[4], mangostinone [14], smeathxanthone A [15], and tovophyllin A [16].
From the biological point of view, the isolated xanthones were subjected to
peroxynitrite-scavenging assay for evaluation of their antioxidant activity. The
isolated xanthones that showed potent antioxidant activities were 8-
hydroxycudraxanthone G [5], gartanin [12], α-mangostin [3], γ-mangostin [4], and
smeathxanthone A [15], with reported IC50 values in the range of 2.2 to 12.2 µM.
Besides, α-mangostin [3] has also been reported as an important anti-
mycobacterial agent against Mycobacterium tuberculosis with a minimum
inhibitory concentration of 6.25 µg/mL (Hyun, et al., 2006).
O
O OH
OHOH
O
CH3
CH3
CH3 CH3
CH3
O
O OH
OOH
O
CH3
CH3
CH3 CH3
CH3
CH3
[1] [2]
O
O OH
OHOH
O
CH3
CH3
CH3 CH3
CH3
O
O OH
OHOH
OH
CH3
CH3 CH3
CH3
[3] [4]
Figure 2.4: Structures of chemical constituents isolated from Garcinia
mangostana

18
O
OH
OH O OH
OH
CH3
CH3
CH3 CH3 O
O
OH
O
CH3
CH3 CH2
OOH
OH
CH3
CH3
[5] [6]
O
OH
O OH
O
CH3CH3
CH3
CH3
CH3
O
OH
O OH
OH
CH3CH3
CH3
CH3
[7] [8]
O O
O
H3CO
O OHCH3
CH3
CH3
CH3 O
O OH
OHOH
H3CO
CH3 CH3
OH
CH3
CH3
[9] [10]
O
OH
OH
O
OH
OH
CH3 CH3
CH3 CH3
CH3
CH3
O
OOH
OH
OH
CH3 CH3
CH3
CH3OH
[11] [12]
Figure 2.5: Structures of chemical constituents isolated from Garcinia
mangostana (continued)
19
O
O
OH
O
OH
H3CO
CH3 CH3CH3
CH3
O
OH
O OH
OH
CH3
CH3 CH3
[13] [14]
O
OH
O OH
OH
CH3
CH3 CH3OH
O
O
OH
O OH
OH
CH3
CH3
CH3 CH3
CH3
CH3
[15] [16]
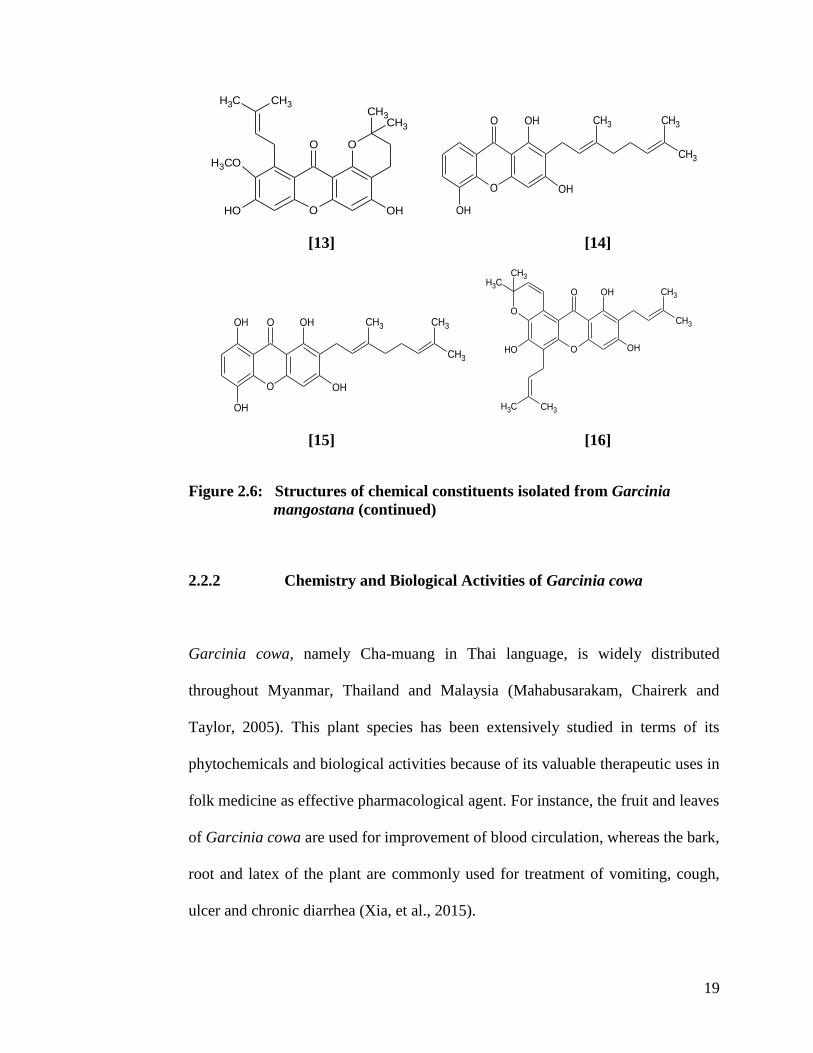
Figure 2.6: Structures of chemical constituents isolated from Garcinia
mangostana (continued)
2.2.2 Chemistry and Biological Activities of Garcinia cowa
Garcinia cowa, namely Cha-muang in Thai language, is widely distributed
throughout Myanmar, Thailand and Malaysia (Mahabusarakam, Chairerk and
Taylor, 2005). This plant species has been extensively studied in terms of its
phytochemicals and biological activities because of its valuable therapeutic uses in
folk medicine as effective pharmacological agent. For instance, the fruit and leaves
of Garcinia cowa are used for improvement of blood circulation, whereas the bark,
root and latex of the plant are commonly used for treatment of vomiting, cough,
ulcer and chronic diarrhea (Xia, et al., 2015).

20
In year 2014, two new compounds were reported by Ittipon and coworkers,
namely garciniacowol [17] and garciniacowone [18] which were isolated from the
acetone extract of the stem barks of G. cowa. Compound [17] was isolated as
colourless viscous oil with a molecular formula of C54H78O4 whereas compound
[18] was separated in the form of yellow viscous oil with a molecular formula of
C28H34O6. Along with these, 13 known compounds were isolated from the same
extract including parvifoliol F [19], cowaxanthone [20], norcowanin [21], cowanin
[22], cowanol [23], cowagarcinone B [24], cowagarcinone D [25], cowagarcinone
E [26], fuscaxanthone A [27], fuscaxanthone C [28], 6-O-methylmangostanin [29],
cowaxanthone D [30], 1,7-dihydroxyxanthone [31].
All these isolated compounds were further evaluated for their biological properties.
Among these, garciniacowone [18], a xanthonoid compound showed the strongest
antibacterial activities against MRSA SK1 and S. aureus with a minimum
inhibitory concentration (MIC) of 2 µg/mL (Siridechakorn, et al., 2012).
In year 2015, a new compound namely 6-hydroxycalabaxanthone [32] was
isolated as yellow amorphous powder. This compound showed potent cytotoxic
effect against DU-145 prostate cancer cell line with an IC50 value of 6.4 µM
(Fatma, 2015b).

21
O
O
OH
OH
CH3
CH3
CH3
CH3 CH3 CH3
CH3
CH3 CH3 CH3
CH3
CH3
O
O OH
OHO
CH3CH3
OH
CH3
CH3
CH3
CH3
[17] [18]
O
CH3
CH3
OH
CH3 CH3
CH3
CH3
O
O
H3CO
OH OH
CH3
CH3
CH3
[19] [20]
O
O
OHOH
OH
CH3
CH3 CH3
CH3
CH3
O
O
OHOH
H3CO
CH3
CH3 CH3
CH3
CH3
[21] [22]
O
O
OHOH
H3CO
CH3
CH3 CH3
CH3
OH
O
O
OH
H3CO
OCH3
OH
CH3
CH3
[23] [24]
Figure 2.7: Structures of chemical constituents isolated from Garcinia cowa

22
O
O
OH
OH
OH
CH3
CH3
O
CH3
CH3CH3
O
O OH
OHOH
AcO
CH3
CH3 CH3
CH3
OH
[25] [26]
O O
H3CO
OH
O OH
CH3
CH3
CH3
CH3
CH3
OOH
H3CO
CH3 CH3
O OH
OH
CH3
CH3CH3
[27] [28]
O OOH
H3CO
O OH
CH3 CH3
CH3
CH3
O
O
OH
O OH
OCH3
CH3
CH3
CH3
CH3
[29] [30]
O
OH
O OH
O OOH
O
H3CO
OH
CH3 CH3
CH3
CH3
[31] [32]
Figure 2.8: Structures of chemical constituents isolated from Garcinia cowa
(continued)

23
2.2.3 Chemistry and Biological Activities of Garcinia parvifolia
In this project, Garcinia parvifolia was selected as the plant material for
phytochemical investigation in the search for chemically interesting substances
and potential antioxidant agents. Previously, there were several chemical
investigations reported on different parts of this plant including leaves, twigs, latex,
fruits and barks, which led to the isolation of different classes of chemical
constituents from this plant species such as depsidones, xanthones, phloroglucinol,
flavonoid, alkaloids and terpenoids. In year 2000, Xu and coworkers reported the
isolation of four novel prenylated depsidones from the leaves of G. parvifolia.
These four isolated depsidones were obtained from the chloroform soluble fraction,
namely garcidepsidone A [33], garcidepsidone B [34], garcidepsidone C [35] and
garcidepsidone D [36], respectively (Xu, et al., 2000).
A year later, the same research group conducted another phytochemical
investigation on the dried bark of G. parvifolia which led to isolation of nine new
xanthones, namely parvixanthones A-I [37-45]. These xanthones were found to
have a common 1,3,6,7-oxygenated pattern which structurally varied by different
position of attachment of oxygenated isoprenyl or geranyl substituents in the
xanthone skeleton.
In year 2006, from the leaves extracts of G. parvifolia, a new benzoquinone
derivative, namely parvifoliquinone [46] and six known compounds were reported
by Vatcharin and coworkers. The known compounds isolated were parvifoliol B

24
[47], parvifoliol C [48], parvifoliol E [49], garcidepsidone B [34],
nigrolineaisoflavone A [50] and mangostinone [14].
From biological perspective, Vatcharin and coworkers revealed that the crude
methanol extract from the leaves of G. parvifolia exhibited remarkable
antibacterial activities against methicillin-resistance Staphylococcus aureus
(MRSA). All the compounds isolated from this plant were subjected to
antibacterial screening. Among these compounds, parvifoliol B [47] showed the
best antibacterial activity against MRSA with a minimum inhibitory concentration
of 32 µg/mL (Vatcharin, et al., 2006).
In the next year, chemical and biological investigations on Garcinia parvifolia by
Ee and Cheow, reported the isolation of a triterpenoid, named α-amyrin [51] and
two xanthones known as cowanin [22] and rubraxanthone [52]. These three pure
compounds which were obtained from the hexane and chloroform stem bark
extracts were further evaluated for their biological effects towards the larvae of
Aedes aegypti and HL-60 cell line. However, only rubraxanthone [52] showed
highly active against the larvae of Aedes aegypti (LC50 = 15.49 µg/mL), and HL-
60 cell line (IC50 = 7.5 µg/mL) (Ee and Cheow, 2007).

25
O
O
OH
OH
OH
OH
CH3CH3
CH3
CH3O
O
O
OH
OH
OH
OH
CH3CH3
CH3
CH3
CH3O
[33] [34]
O
O
OH
OH
OH
OH
CH3CH3
CH3
CH3
CH3
OH
O
O
O
OH
OH
OH
OH
CH3CH3
CH3
CH3O
[35] [36]
OOH
OH O
OH
OCH3
CH3
CH3
CH3
CH3 OH
OOH
OH O
OH
OCH3
CH3
CH3CH3
OH
[37] [38]
OOH
OH O
OH
OCH3
CH3 CH3
CH3
OH
OOH
OH O
OH
OCH3
CH3 CH3
CH3
O
[39] [40]
OOH
OH O
OH
OCH3
CH2 CH3
CH3O
OOH
OH O
OH
OCH3
CH3 CH3
CH3O
[41] [42]
Figure 2.9: Structures of chemical constituents isolated from Garcinia
parvifolia

26
OOH
OH O
OH
OCH3
CH3 CH3
CH3
OH
OOH
OH O
OH
OCH3
CH2 CH3
CH3OH
[43] [44]
O
OOH
OH O
OH
OCH3
CH3
CH3
CH3
OH
O
O
H3CO
CH3
CH3
[45] [46]
OHOH
OH
H3CO
O
CH3
CH3 CH3
OOH
OHO
H3COCH3
CH3CH3
[47] [48]
OCH3CH3
CH3
OH
CH3
CH3
CH3CH3
O
O
OH
OH
OH O
[49] [50]
OH
CH3 CH3
CH3
CH3
CH3
CH3
CH3
CH3
O
OH
OH
H3CO
O
CH3
CH3
CH3
OH
[51] [52]
Figure 2.10: Structures of chemical constituents isolated from Garcinia
parvifolia (continued)

27
2.2.4 Chemistry and Biological Activities of Garcinia fusca Pierre
Garcinia fusca Pierre is widely distributed in tropical Asian countries such as
Thailand, Vietnam, Malaysia, India and Indonesia. In Thailand, G. fusca is known
as „Madan-paa‟ or „Mak-Mong‟, meanwhile it is called as „Bứa lứa‟ by the
Vietnamese (Nguyen, 2015). The young leaves and fruits of this plant are usually
used in food preparation and served as refreshing drink. Traditionally, G. fusca
was introduced by botanist due to its interesting pharmaceutical characteristics,
and used in folk medicine collections. For instance, the roots, barks and leaves of
the plant are commonly used in the treatment of cough, fever and usually skin
diseases. Several previous articles reported that G. fusca are rich in
tetraoxygenated xanthones and biflavonoids (Jannarin, et al., 2013).
In year 2015, researcher Nguyen from University of Science in Vietnam carried
out phytochemical and biological investigations on the bark of G. fusca. The air-
dried and powdered bark of G. fusca was extracted with hexane and ethyl acetate.
There were a total of eight new xanthones isolated from the two bark extracts.
Pure compounds obtained from the hexane extract including fuscaxanthone I [53],
fuscaxanthone J [54], fuscaxanthone K [55], fuscaxanthone L [56], fuscaxanthone
M [57]. On the other hand, fuscaxanthone N [58], fuscaxanthone O [59] and
fuscaxanthone P [60] were derived from the ethyl acetate extract, simultaneously
with other known compounds such as benzaldehyde derivative, namely 11-
hydroxy-1-isomangostin [61], griffipavixanthone [62], morelloflavone [63],
volkinflavone [64], GB-1a [65] and GB-2 [66].

28
All the new xanthone isolated, except for fuscaxanthone K [55] and fuscaxanthone
M [57] which were biologically inactive, exhibited significant cytotoxic effect
against HeLa cells showing IC50 values in the range of 19.1-45.9 µM.
Griffipavixanthone [62], a bixanthone was reported to possess potent anti-
angiogenic property, and exhibit high cytotoxic effect against HeLa cells with IC50
value of 7.9 µM (Jannarin, 2011).
OOH
H3CO
O
OH
CH3 CH3
OH
CH3
CH3
OH
OOH
OH
O
OH
CH3 CH3
CH3
OH
OH
CH3
[53] [54]
OOH
H3CO
O
OH
CH3 CH3
OH
CH3
OH
O
CH3
O
OOH
H3CO
O
OH
OH
CH3
OH
H
CH3
CH3
H
CH3
[55] [56]
O
H3CO
OH
O OH
OH
CH3 CH3
CH3
CH3
O
OOH
H3CO
O OH
OH
CH3
OH
CH3 CH3
CH3
O
O
OH
OH
CH3
OH
H3CO
CH3
CH3
CH3
OH
OH
[57] [58]
Figure 2.11: Structures of chemical constituents isolated from Garcinia fusca

29
O
O
OH
OH
CH3
OH
H3CO
CH3
CH3
CH2
OH
OH
O
OH
OH
O
CH3
OH
OH
H3CO
CH3
CH3
OH
CH3
[59] [60]
O
O
OH
H3CO
O
OH
OH
CH3 CH3
CH3CH3
O
CH3
CH3
CH3
O
OH
O
OH
OH
OH
OH
OH
OH
OHO
[61] [62]
O
O
OH
OOH
OH
OH
OH O
OH
OH
O
O
OH
OOH
OH
OH
OH O
OH
[63] [64]
O
O
OH
OOH
OH
OH
OH O
OH
O
O
OH
OOH
OH
OH
OH O
OH
OH
[65] [66]
Figure 2.12: Structures of chemical constituents isolated from Garcinia fusca
(continued)

30
2.3 Summary of Literature Review on the Genus Garcinia
The classes of natural products isolated from Garcinia species and their
pharmacological importance are summarized in Table 2.1.
Table 2.1: Summary of literature data on the genus Garcinia
Plant Species Classes of
Compound
Biological
Activities
References
G. atroviridis Xanthones
Benzophenones
Flavonoids
Antioxidant
Antimicrobial
Cytotoxicity
Permana, et al.,
2002
Nursakina, et al.,
2012
G. bracteata Xanthones Antiproliferative
Anticancer
Antitumor
Tao, et al., 2013
Odile, et al., 2000
G. brasiliensis Sesquiterpene
Benzophenones
Anti-inflammatory
Cytotoxicity
Antioxidant
Anti-allergic
Arwa, et al., 2015
Vanessa, et al.,
2011
G. cambogia Xanthones
Benzophenones
Organic acids
Antiobesity
Antioxidant
Scott, et l., 2014
Kohsuke, et al.,
2008
G. cantleyana Benzophenones
Xanthones
Terpenoids
Steroids
Antioxidant
Cytotoxicity
Ibrahim and
Fadlina, 2012
Khalid, et al.,
2007
G.
cochinchinensis
Benzophenones
Xanthones
Anticancer
Cytotoxicity
Binh, et al., 2013
Nguyen, et al.,
2011

31
G. conrauana Lactones
Biflavonoids
Benzophenones
Anti-asthma
Antioxidant
Peter and
Elizabeth, 1980
Raouf and Peter,
1982
G. cowa Xanthones
Phloroglucinols
Organic acids
Depsidones
Flavonoids
Terpenes
Steroids
Antimalarial
Antibacterial
Anticancer
Cytotoxicity
Negi, et al., 2013
Xu, et al., 2000
Fatma, et al.,
2015a
G. dioica Flavonoids
Xanthones
Alkaloids
Antimicrobial Munekazu, et al.,
1995
G. dulcis Xanthones
Flavonoids
Benzophenones
Antibacterial
Antioxidant
Antimalarial
Mohd, et al., 2015
G. fusca Xanthones
Terpenoids
Biflavonoids
Antivirus
Anti-bacterial
Antioxidant
Anti-inflammatory
Cytotoxic
Antifungal
Nguyen, 2015
Jannarin, 2011
Jannarin, et al.,
2013
G. griffithii Xanthones
Benzophenones
Cytotoxicity
Antiplatelet
Aggregation
Bonnie, 1996
G. hombroniana Triterpenes
Lanostanes
Flavonoids
Xanthones
Organic acids
Antibacterial
Antioxidant
Antiplatelet
aggregation
Dyary, et al., 2015
Jamila, et al., 2015
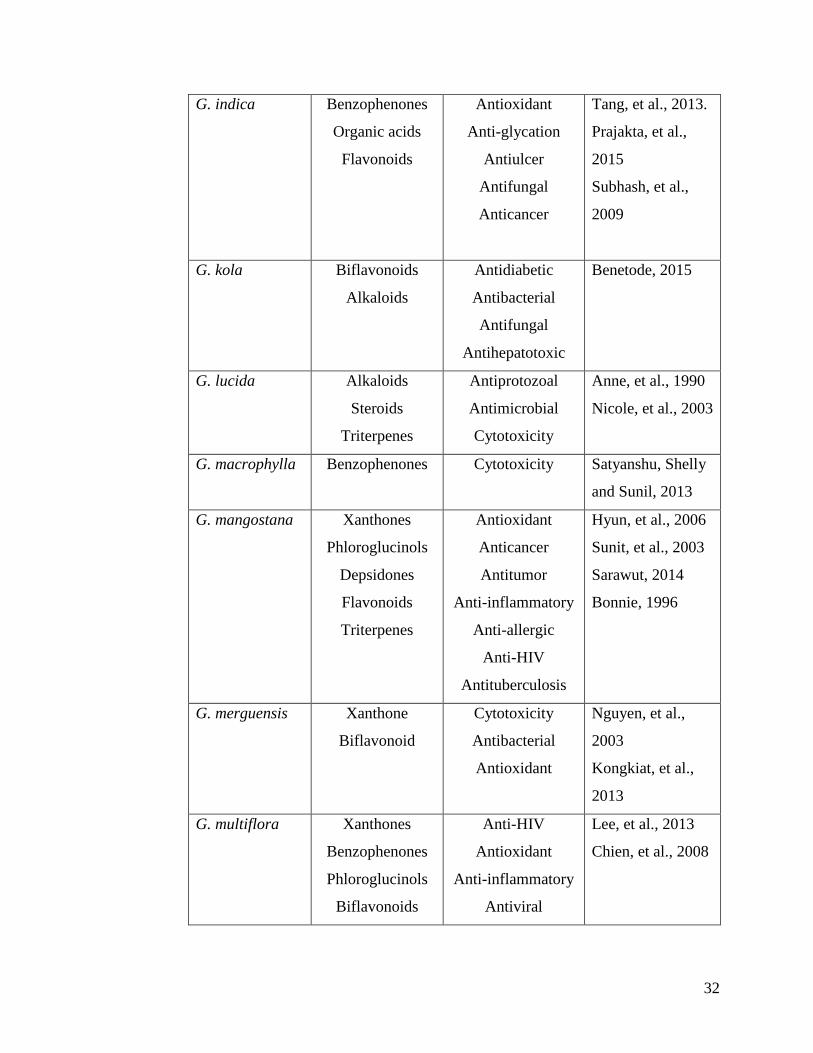
32
G. indica Benzophenones
Organic acids
Flavonoids
Antioxidant
Anti-glycation
Antiulcer
Antifungal
Anticancer
Tang, et al., 2013.
Prajakta, et al.,
2015
Subhash, et al.,
2009
G. kola Biflavonoids
Alkaloids
Antidiabetic
Antibacterial
Antifungal
Antihepatotoxic
Benetode, 2015
G. lucida Alkaloids
Steroids
Triterpenes
Antiprotozoal
Antimicrobial
Cytotoxicity
Anne, et al., 1990
Nicole, et al., 2003
G. macrophylla Benzophenones Cytotoxicity Satyanshu, Shelly
and Sunil, 2013
G. mangostana Xanthones
Phloroglucinols
Depsidones
Flavonoids
Triterpenes
Antioxidant
Anticancer
Antitumor
Anti-inflammatory
Anti-allergic
Anti-HIV
Antituberculosis
Hyun, et al., 2006
Sunit, et al., 2003
Sarawut, 2014
Bonnie, 1996
G. merguensis Xanthone
Biflavonoid
Cytotoxicity
Antibacterial
Antioxidant
Nguyen, et al.,
2003
Kongkiat, et al.,
2013
G. multiflora Xanthones
Benzophenones
Phloroglucinols
Biflavonoids
Anti-HIV
Antioxidant
Anti-inflammatory
Antiviral
Lee, et al., 2013
Chien, et al., 2008

33
G. oblongifolia Xanthones
Phloroglucinols
Benzophenones
Organic acids
Antibacterial
Antienteroviral
Cytotoxicity
Ittipon, et al., 2014
Zhang, et al., 2016
G. parvifolia Xanthones
Phloroglucinols
Depsidones
Flavonoids
Terpenoids
Benzophenones
Antioxidant
Anti-inflammatory
Antibacterial
Cytotoxicity
Antimicrobial
Vatcharin, et al.,
2006
Xu, et al., 2000
G. polyantha Xanthones
Triterpenoids
Organic acids
Flavonoids
Antimalarial
Antibacterial
Antifungal
Antioxidant
Gabin, et al., 2008
Lannang, et al.,
2005
Stephen and Peter,
1986
G.
shomburgkiana
Xanthones
Benzophenones
Biflavonoids
Steroids
Cytotoxicity Ito, et al., 2013
G.
smeathmannii
Xanthones
Benzophenones
Triterpene
Antimicrobial
Anticandidal
Antifungal
Kuete, et al., 2007
Justin, et al., 2005
G.subelliptica Xanthones
Benzophenones
Phloroglucinols
Antioxidant
Cytotoxicity
Lin, et al., 2012
Hiroyuki, et al.,
1998
G.
xamthochymus
Xanthoness
Phloroglucinols
Antioxidant
Anticancer
Antibacterial
Scott, et al., 2004
Manohar, et al.,
2014
Nethracathi, at al.,
2015

34
CHAPTER 3
EXPERIMENTAL
3.1 Plant Material
The plant studied in this project was Garcinia parvifolia. The stem bark of
Garcinia parvifolia was collected from the jungle in Landeh, Sarawak. It was
authenticated by Mr. Tinjan Anak Kuda, the botanist from Forest Department of
Sarawak. A voucher specimen (UITM 3008) detailing the collection of plant was
deposited at the herbarium of Universiti Teknologi MARA, Sarawak.
3.2 Chemical Reagent
The industrial grade solvents and materials used in the extraction, isolation and
purification of chemical constituents from Garcinia parvifolia are summarized in
Table 3.1. The analytical grade solvents and materials used in TLC analysis are
listed in Table 3.2. The deuterated solvents used in NMR analysis are listed in
Table 3.3. The materials and HPLC grade solvents used in LC- and GC-MS
analysis are shown in Table 3.4. The analytical grade solvents and materials used
in UV-Vis analysis are listed in Table 3.5. Chemical reagents and materials used in
antioxidant assay are summarized in Table 3.6.
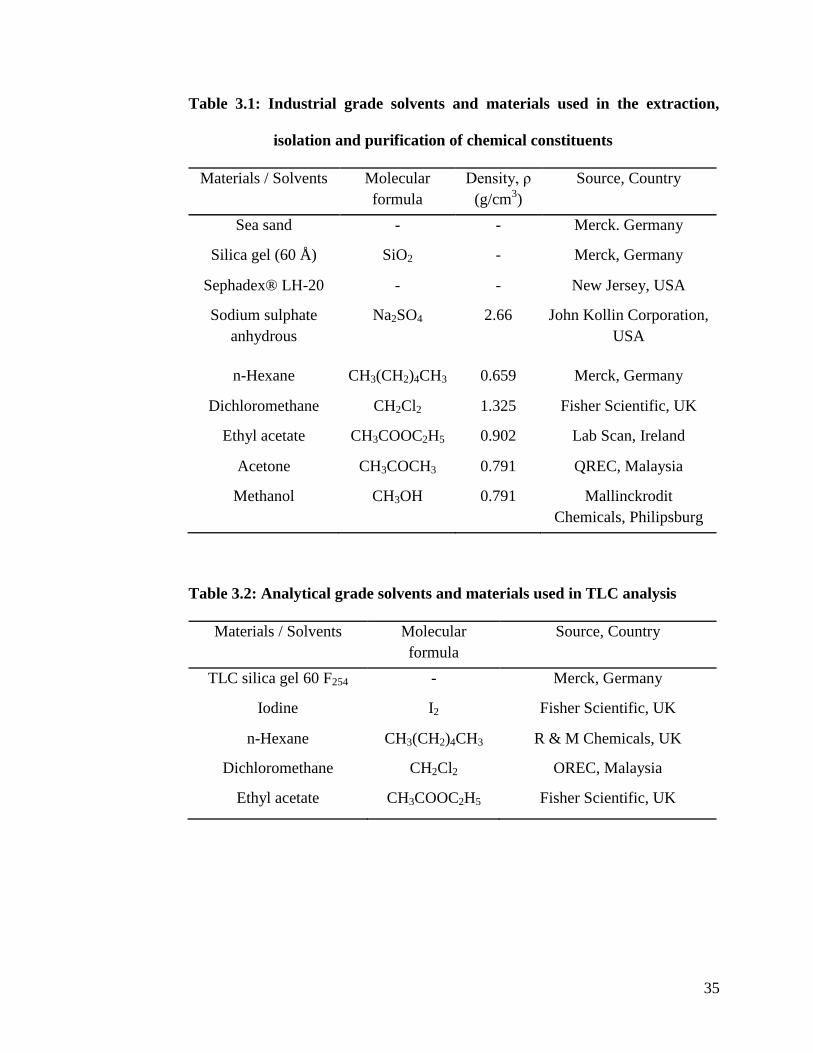
35
Table 3.1: Industrial grade solvents and materials used in the extraction,
isolation and purification of chemical constituents
Materials / Solvents Molecular
formula
Density, ρ
(g/cm3)
Source, Country
Sea sand - - Merck. Germany
Silica gel (60 Å) SiO2 - Merck, Germany
Sephadex® LH-20 - - New Jersey, USA
Sodium sulphate
anhydrous
Na2SO4 2.66 John Kollin Corporation,
USA
n-Hexane CH3(CH2)4CH3 0.659 Merck, Germany
Dichloromethane CH2Cl2 1.325 Fisher Scientific, UK
Ethyl acetate CH3COOC2H5 0.902 Lab Scan, Ireland
Acetone CH3COCH3 0.791 QREC, Malaysia
Methanol CH3OH 0.791 Mallinckrodit
Chemicals, Philipsburg
Table 3.2: Analytical grade solvents and materials used in TLC analysis
Materials / Solvents Molecular
formula
Source, Country
TLC silica gel 60 F254 - Merck, Germany
Iodine I2 Fisher Scientific, UK
n-Hexane CH3(CH2)4CH3 R & M Chemicals, UK
Dichloromethane CH2Cl2 OREC, Malaysia
Ethyl acetate CH3COOC2H5 Fisher Scientific, UK

36
Table 3.3: Deuterated solvents used in NMR analysis
Materials / Solvents Molecular
formula
Source, Country
Deuterated chloroform CDCl3 Acros Organics, Belgium
Acetone-d6 CD3COCD3 Acros Organics, Belgium
Methanol-d4 CD3OD Acros Organics, Belgium
Table 3.4: HPLC grade materials used in LC- and GC-MS analysis
Materials / Solvents Molecular
formula
Density, ρ
(g/cm3)
Source, Country
Acetonitrile CH3CN 41.05 Fisher Scientific, UK
Methanol CH3OH 32.04 Fisher Scientific, UK
Nylon Syringe filter
(0.5 µm)
- - Membrane solution,
USA
Table 3.5: Analytical grade solvents and materials used in UV-Vis analysis
Materials / Solvents Molecular
formula
Source, Country
Chloroform CHCl3 Fisher Scientific, UK
Cuvette (quartz) - Membrane Solution, USA
Table 3.6: Chemical reagents and materials used in antioxidant assay
Chemical reagents / Materials Source, Country
Kaempferol Sigma-Aldrich, USA
Ascorbic acid (Vitamin C) Sigma-Aldrich, USA
1,1-Diphenyl-2-picryhydrazyl (DPPH) Sigma-Aldrich, USA
96-well plate Techno Plastic, Switzerland
37
3.3 Instrument
3.3.1 Nuclear Magnetic Resonance (NMR)
Nuclear Magnetic Resonance (NMR) is a spectroscopic method that studies the
physical phenomenon based upon the magnetic property of an atom‟s nucleus. It
involves the absorption of radio frequency radiation by atomic nuclei in an applied
magnetic field. NMR is one of the non-destructive techniques used to obtain the
physical, chemical, electronic and structural information about a molecule. Thus,
by analyzing the peaks or signals of NMR spectra, the structural composition of
organic compounds can be determined. In this project, JEOL JNM-ECX 400 MHz
spectrometer was used to obtain 1H NMR,
13C NMR, DEPT, HMQC and HMBC
spectra of samples.
The common solvents used to dissolve the samples are deuterated-chloroform and
deuterated acetone. Tetramethylsilane (TMS) was used as an internal standard and
reference during analysis. The dissolved samples were separately transferred to
NMR tubes up to 4 cm in height and the tubes were then capped and sealed with
parafilm to avoid solvent evaporation. The selection of solvents is depending on
the degree of solubility of compound in the solvent.

38
3.3.2 Infrared Spectrophotometer (IR)
Infrared (IR) spectrophotometer is a spectroscopic instrument that is used to study
types of functional groups present in a compound. IR spectrum also provides
specific fingerprint region that can be used for structural identification of
compounds. The bands observed in IR spectra are due to the interaction of the
electrical vector of electromagnetic radiation with the electric dipole of non-
symmetrical bonds in the vibrational infrared region. In this project, Perkin Elmer
2000-FTIR spectrophotometer was used to analyse samples in the wavenumber
range of 4000 to 400 cm-1
. Sample preparation was done by mixing the finely
ground solid sample with powdered potassium bromide (KBr) evenly in a ratio of
1:10. Then, the mixture was pressed under high pressure which results in the KBr
melts and seals the compound into a matrix. The resulted KBr pellet was inserted
into a sample holder for IR analysis.
3.3.3 Ultraviolet – Visible Spectrophotometer (UV-Vis)
Ultraviolet-Visible (UV-Vis) spectrophotometer is a technique used to analyse the
chromophores present in a molecule by studying its conjugated system. As atoms
or molecules absorb energy, an electron is promoted from a ground state to an
excited state, known as electronic transition. By measuring the energy difference
between the excited and ground states, the characteristic absorption provides
information about classes, structure and properties of compounds. In this project,
the spectra of samples were obtained using Perkin Elmer Lambda 35, double-beam

39
spectrophotometer. Chloroform was used as blank, and to dissolve and dilute the
samples for analysis. UV-Vis spectra were obtained in the wavelength range of
200 – 400 nm.
3.3.4 Liquid Chromatography – Mass Spectrometry (LC-MS)
Liquid Chromatography–Mass Spectrometry (LC-MS) is a coupled technique of
liquid chromatography with mass spectrometry which is used to provide useful
structural information for non-volatile compounds. In the sample preparation, 1
mg of sample was dissolved in 1 mL of HPLC grade solvent. The HPLC grade
solvent was used in LC-MS to give a better quality of mass spectra. Sample
solution was filtered through nylon syringe filter in order to remove impurities or
undissolved solid. Agilent Technologies 6520 LC/MS equipped with an
electrospray ionization source was used for compound analysis.
3.3.5 Melting Point Apparatus
Melting point apparatus is an instrument used to determine the melting point, as
well as to assess the purity of a solid sample. A pure crystalline compound will
give a narrow and sharp range of melting point as compared to impure substances.
A little amount of solid sample was introduced into a hematocrit capillary tube and
the tube was then inserted into a heating block. The temperature range was
recorded when the compound started and completely melted. The melting point of
compound was measured by Stuart SMP 10 melting point apparatus.

40
3.3.6 Polarimeter
Polarimetry is a non-destructive technique used to measure the optical activity
exhibited by chiral active compound. For chiral compound, optical activity
(specific rotation) was measured by observing the rotation of the plane of
polarized light either clockwise or anti-clockwise when passing through it.
Chloroform was used to dissolve and dilute the sample before it was placed in the
polarimeter. In this study, JASCO, P-2000 polarimeter was used to measure the
optical rotation of samples.
3.4 Chromatographic Methods
3.4.1 Column Chromatography
Column chromatography is widely used for isolation and purification of chemical
constituents from the crude extracts. The purification of crude extracts involves
partitioning of chemical constituents between stationary phase and mobile phase.
In this study, gravity column chromatography packed with silica gel was selected
as separating medium in which silica gel served as the stationary phase which was
held in a glass column, meanwhile the mobile phase, a solvent mixture was flown
through the column by gravitational force.
The sizes of the glass columns used were 25 mm, 30 mm and 80 mm in internal
diameter, depending on the amount of sample available for purification. Silica

41
slurry was prepared by homogeneous mixing of silica gel with non-polar solvent,
hexane. Then, the slurry of silica gel was introduced into the column and was left
overnight for settlement of silica gel so that the column was densely packed. While
waiting for the silica gel to settle down, the side of the column was tapped gently
using a rubber pipe to eliminate air bubbles trapped in the packed column which
might lead to cracked column.
The sample was prepared using dry packing method, in which the samples were
blended with a minimal amount of silica gel, and was allowed to dry in the fume
hood before it was introduced into the packed column. After the sample mixture
was subjected to the packed column, mobile phase was introduced into the column
in order to elute out the chemical compounds. Figure 3.1 shows the apparatus set
up for column chromatography.
Figure 3.1: Apparatus set up for column chromatography

42
The solvent system applied was gradient elution in which the mobile phase was
introduced in increasing solvent polarity. Solvent mixtures of hexane-
dichloromethane, dichloromethane-ethyl acetate, ethyl acetate-acetone and
acetone-methanol were used in order to separate compounds with various
polarities out from the column. Separation was achieved through different
affinities exhibited by chemical components toward both stationary and mobile
phase, resulting in differences in migration rates. The eluent was collected
according to volume or separated bands. The fractions obtained were concentrated
using rotary evaporator and analysed using TLC. With the aids of developed TLC,
the number of components present in the fractions can be determined
quantitatively. The fractions which showed similar TLC pattern were combined,
and fractions of interest were subsequently subjected for further purification.
3.4.2 Thin Layer Chromatography (TLC)
Thin layer chromatography is a type of planar chromatography, which a thin layer
of adsorbent (silica gel) is coated on a flat plate (aluminium carrier sheet). In this
study, Merck silica gel 60 F254 TLC plate was used to find out the appropriate
solvent system to be introduced prior to column chromatographic separation.
Besides, TLC also provides information about the chemical identity and
composition of substances, and to check on the effectiveness of a purification step.
TLC plate was cut into smaller size of 4 cm x 8 cm. Dissolved sample was spotted
on the baseline which was drawn 0.5 cm from the bottom of TLC plate, using a
microcapillary tube. Developing chamber was prepared containing a mixture of

43
solvents and a half piece of filter paper lying against the internal wall of chamber.
Filter paper was used to saturate the solvent vapour atmosphere in the developing
chamber. TLC plate with the applied sample was placed into the developing
chamber and mobile phase (solvent mixture) moved up the stationary phase by
capillary action. As the solvent moved up the plate, the components of sample
were carried along up the plate until it reached the solvent front line, which is
about 1.0 cm from the top of the TLC plate. The TLC plate was then removed
from the developing chamber. After solvent evaporated from the plate, the TLC
plate was visualized using UV light (254 nm and 365 nm), stained with iodine
vapour, and tested with ferric chloride solution. The example of developed TLC
plate is illustrated in Figure 3.2.
Figure 3.2: Developed TLC plate
The identity of an unknown compound can be determined by comparing the
retention factor, Rf of the unknown compound with the retention factor, Rf of the
reference compound. The Rf value is determined by following equation:
Rf

44
3.4.3 TLC Detection Methods
3.4.3.1 Natural Colour
Coloured compound can be clearly observed with naked eyes under light. For
example, xanthophyll and chlorophyll compounds possess natural colour will
show distinct yellow and green spot on the TLC plate. However, most of the
organic compounds appeared to be colourless on TLC plate which needed further
visualization aids.
3.4.3.2 UV Detection
This method effectively detects the presence of UV active compounds which
contain aromatic ring or conjugated system. UV lamp with long (365 nm) and
short (254 nm) wavelengths were used to visualize the sample spots on a
developed TLC plate. TLC plates are usually impregnated with indicator such as
manganese-activated zinc silicate or fluorophore. Hence, compounds will appear
as dark grey spots on a bright green background under the short wavelength,
meanwhile at long wavelength on a pale purple background, sample spots will
appear in fluorescence colours.

45
3.4.3.3 Iodine Vapour Detection
The iodine vapour chamber was prepared by placing some iodine crystals into a
closed chamber. The developed TLC plate was placed into the iodine chamber
which was saturated with iodine vapour for detection of chemical compounds. The
TLC plate was removed from the chamber after a few minutes, and some yellow
or brown colour spots were observed. The staining effect is useful for detection of
colourless compound such as non-conjugated compounds or terpenoids. Iodine
forms dark-brown complex with chemical compounds and the brown spots were
marked down using a pencil immediately after removal from the iodine chamber
as the spots might dissipate over time.
3.4.3.5 Ferric Chloride Solution
Ferric chloride solution was prepared by dissolving 1.0 g of ferric chloride in 100
mL of methanol. TLC plate was sprayed with ferric chloride solution for detection
of phenolic compounds. Formation of dark blue and red colour spots indicates the
presence of phenols and hydroxamic acids, respectively.
3.5 Extraction and Isolation of Chemical Constituents from
Garcinia parvifolia
Solvent extractions on the stem bark of G. parvifolia (2.0 kg) yielded a total of
53.9, 52.3 and 51.9 g crude dichloromethane, ethyl acetate and methanol extracts,

46
respectively. Phytochemical studies on the crude extracts using chromatographic
methods have afforded four pure compounds. The ethyl acetate extract gave
brasixanthone B (29.7 mg), 1,3,7-trihydroxy-2,4-bis(3-methylbut-2-enyl)xanthone
(167.6 mg), rubraxanthone (3.3906 g) and tetraprenyltoluquinone (172.8 mg).
About 2 g of each crude extract were kept for antioxidant assay.
3.5.1 Isolation of Chemical Compounds from Ethyl Acetate Extract
Approximately 52.3 g of crude ethyl acetate extract was subject to silica gel
column chromatography (CC) (40-63 µm, 8.5 x 50 cm) packed in n-hexane and
eluted with solvent mixture of hexane-ethyl acetate, and ethyl acetate-acetone in
increasing polarity (90:10, 80:20, 70:30, 60:40, 50:50, 40:60, 30:70, 20:80, 10:90,
0:100) followed by increasing concentration of methanol in acetone (10:90, 20:80.
30:70) to give 16 fractions (LCA1-16). Fraction LCA12 was further fractionated
via silica gel CC (40-63 µm, 3.5 x 50 cm) to afford 25 subfractions (LCB1-25).
Fractions LCB10-11 were combined and separated by Si gel CC (40-63 µm, 3.5 x
50 cm) to give 26 subfractions (LCC1-26). Subfractions LCC12 and LCC17
afforded brasixanthone B (67, 29.7 mg) and 1,3,7-trihydroxy-2,4-bis(3-methylbut-
2-enyl)xanthone (68, 172.8 mg), respectively. Meanwhile, subfractions LCB13-16
were pooled and subjected to Si gel CC (40-63 µm, 3.5 x 50 cm) to yield 16
subfractions (LCD1-16). Subfractions LCD12 yielded rubraxanthone (69, 3.3906
g). Apart from that, fractions LCA14-16 were combined and purified by Si gel CC
(40-63 µm, 3.5 x 50 cm) to give 33 subfractions (LCE1-33). Subfractions LCE12-
14 were later combined and subjected to Si gel CC (40-63 µm, 3.5 x 50 cm) to

47
give 17 subfractions (LCF1-17). From subfraction LCF9, tetraprenyltoluquinone
(TPTQ) (70, 156.6 mg) was obtained.
Figure 3.3: Isolation Pathway of Pure Compounds
Ethyl Acetate Crude Extracts
Fractions LCA 1 – 16
Column Chromatography
LCA 12
Subfractions LCB1-25
Subfractions LCC1-26 Subfractions LCD1-16
LCB10-11 LCB13-16
LCC12 LCC17
Brasixanthone B (1)
LCD1
Rubraxanthone (3)
1,3,7-trihydroxy-2,4-bis(3-methylbut-2-enyl)xanthone (2)
LCA14-A16
Subfractions LCE1-33
LCE12-14
Subfractions LCF1-17
LCF9
Tetraprenyltoluquinone (TPTQ) (4)

48
3.6 Antioxidant Assay
The crude extracts, isolated compounds and standard compounds (kaempferol and
ascorbic acid) were separately dissolved in methanol for preparation of master
stocks at concentration of 1 mg/mL. The prepared master stocks were sonicated
for 5 minutes to homogenize the solutions. DPPH solution was prepared at 2
mg/mL by dissolving DPPH powder in methanol. The DPPH solution and the
prepared master stocks were kept in a 4oC chiller in dark condition. This is to
prevent samples exposure to light which may cause chemical decomposition.
Kaempferol and ascorbic acid served as positive control in this assay whereas
negative control was prepared, which consists only the DPPH solution in methanol.
The assay was conducted in a 96-well plate where the test compounds were
prepared at concentrations of 240, 120, 60, 30, 15, 7.5 and 3.75 µg/mL from the
master stocks through serial dilution, followed by addition of 10 µL DPPH
solution and 90 µL methanol.
The 96-well plate was wrapped with aluminium foil immediately after the addition
of reagents and stored in dark at room temperature for 30 minutes. Light is
avoided because DPPH reagent is a light sensitive chemical. After 30 minutes, the
absorbance of the mixtures was measured using a microplate reader, at wavelength
of 520 nm. The assay was performed in triplicate and hence, the average
absorbance value for each concentration was taken to calculate the inhibition rates
of the test samples, using the following equation:

49
A A1
A
where A0 = Absorbance of the negative control
A1 = Absorbance of the test sample
IC50 value of sample can be obtained from the plotted graph of inhibition rate
against concentration of sample. IC50 is defined as the concentration of sample that
required to inhibit 50% of DPPH radical scavenging activity.

50
Figure 3.4: Summary of Methodology
Column Chromatography Bioassay
(Antioxidant Assay)
Spectroscopic Analysis
(NMR, IR, UV-Vis, LC-MS)
Thin Layer
Chromatography
Air dried and finely ground stem bark of G. parvifolia
Pure Compounds
Extraction (twice for each solvent, each soaked for at least 2 days)
1. Dichloromethane
2. Ethyl Acetate
3. Methanol

51
CHAPTER 4
RESULTS AND DISCUSSION
4.1 Isolation of Chemical Constituents from Garcinia parvifolia
Extensive column chromatography on the crude ethyl acetate extract of G.
parvifolia led to the isolation of three xanthone derivatives, namely brasixanthone
B [67], 1,3,7-trihydroxy-2,4-bis(3-methylbut-2-enyl)xanthone [68] and
rubraxanthone [69], along with a terpenoid, tetraprenyltoluquinone (TPTQ) [70].
Compounds 69 (3.39 g) was isolated as a major compound. Meanwhile,
compounds 67 (29.7 mg), 68 (172.8 mg) and 70 (156.6 mg) gave a much lesser
yield than compound 69. All these isolated compounds were found to be known as
they have been previously reported from other Garcinia species along with their
biological activities.
Isolation of brasixanthone B [67] from the stem bark of Calophyllum soulattri
(Mah, et al, 2012) and Calophyllum brasiliensis (Chihiro, et al., 2002). It was
found to exhibit significant cytotoxic activities against several cancer cell lines,
such as Hep G2, HeLa, LS174T and IMR-32. Besides, this compound also showed
strong inhibitory effect on Epstein-Barr virus (EBV) with an IC50 value of 120 mol
ratio/32 pmol TPA.

52
1,3,7-Trihydroxy-2,4-bis(3-methylbut-2-enyl) xanthone [68] was reported for its
isolation from the stem bark of Garcinia dioica and Garcinia nitida (Munekazu,
et al, 1995). This compound was reported to show strong cytotoxic activity against
the MDA-MB-231 human breast cancer cell line with an IC50 of 2.2 µg/ml (Ee,
Lim and Rahmat, 2005).
Isolation of rubraxanthone [69] has been reported, from a few Garcinia species
including G. parvifolia (Ee and Cheow, 2007), G. eugenifolia (Taher, Idris and
Arbain, 2007), G. griffithii (Khaled, et al., 2013) and G. cowa (Fatma, et al.,
2015b). Compound 69 was found to exhibit cytotoxicity activities against HL-60
cell line (IC50 = 7.5 µg/ml) and CEM-SS cell line (IC50 = 5.0 µg/ml). Besides, this
compound also showed antioxidant activity (IC50 = 0.89 mM) in DPPH assay and
larvicidal activity (LC50 = 15.49 µg/ml) against larvae of Aedes aegypti.
Tetraprenyltoluquinone (TPTQ) [70] was previously reported for its isolation from
the stem bark of G. cowa Roxb. Compound 70 was reported to exhibit strong
cytotoxic activity towards H-460 cell line (lung cancer cells) with an IC50 value of
16.3 µg/ml (Fatma, et al., 2014).
In this study, the structural elucidation of isolated compounds 67-70 from the stem
bark of G. parvifolia was accomplished based on the spectral analyses (NMR, UV,
IR and LC-MS) and comparison with literature evidence.

53
4.2 Characterization and Structural Elucidation of Brasixanthone
B [67]
Figure 4.1: Chemical structure of brasixanthone B [67]
Brasixanthone B [67] was isolated from the crude ethyl acetate extract as pale
yellow crystals, mp 225 – 228 oC (Lit. 227 – 229
oC, Mah, et al., 2012). This
compound showed a single spot on TLC with an Rf value of 0.62 when developed
using the solvent system of 20% hexane and 80% dichloromethane. It appeared as
reddish-brown spot under 254 nm wavelength UV light, and as stained single
brown spot when placed in iodine chamber. Compound 67 reacted positively to
ferric chloride test, indicating it to be a phenolic compound.
The HRESI mass spectrum (Figure 4.2) indicated a pseudomolecular ion peak,
[M+H]+ at m/z 379.1540. The calculated accurate mass of compound 67 was
378.1484 g/mol which is consistent with the measured molecular weight, 378.1467
g/mol, and hence suggested compound 67 to have a molecular formula of
C23H22O5.

54
In the UV spectrum (Figure 4.3), compound 67 showed absorption maxima at
wavelength of 245 and 294 nm indicating the presence of chromophores group
with extended conjugation in the xanthone skeleton.
The proposed structure was further confirmed by FTIR analysis revealing the
presence of hydroxyl (3235 cm-1
), carbonyl (1619 cm-1
), C=C (1466 cm-1
) and C-
O (1229 cm-1
) functionalities in brasixanthone B [67]. The IR spectrum of
compound 67 was showed in Figure 4.4.
The 1H NMR (Figure 4.5) displayed signals suggesting a prenylated
pyranoxanthone structure. The chelated hydroxyl proton, 1-OH gave a low field
resonance at δH 13.28 (s, 1-OH). This hydroxyl proton is highly deshielded
because of the intramolecular hydrogen bonding with the peri keto group.
Meanwhile, the free hydroxy proton 7-OH displayed as sharp singlet at δH 8.95.
The presence of 3-methylbut-2-enyl group was evident by the signals at δH 5.23
(1H, t, J = 6.73 Hz, H-2‟), 3.46 (2H, d, J = 7.3 Hz, H-1‟), 1.86 (3H, s, H-4‟), 1.63
(3H, s, H-5‟), and the existence of a dimethylchromene ring was indicated by the
resonances of a pair of cis-olefinic protons at δH 6.68 and 5.72 (each J = 9.8 Hz)
and the germinal dimethyl group at δH 1.48. The remaining three relatively
deshielded proton signals at δH 7.54 (1H, d, J = 3.0 Hz), 7.50 (1H, d, J = 9.2 Hz)
and 7.36 (1H, dd, J = 9.2, 3.0 Hz) were assigned to the three aromatic protons H-8,
H-5 and H-6 in the ring B of xanthone.

55
The 13
C-NMR spectrum (Figure 4.6) revealed a total of 23 carbon signals
assignable to a keto carbon, five oxygenated aromatic carbons, three protonated
aromatic carbons, four substituted aromatic carbons, two pairs of olefinic carbons,
one sp3 quaternary carbon, one sp
3 methylene carbon and four methyl carbons.
Carbon resonances in the region δC 100.0 to 200.0 were assigned to the sp2
hybridized carbons in the proposed structure. Meanwhile, carbon signals in the
region below δC 80.0 were due to the presence of sp3 hybridized carbons. The most
deshielded resonance at δC 180.9 was attributed to the keto carbon, C-9. Besides,
the oxygenated aromatic carbons C-1, C-3, C-4a, C-7 and C-10a gave relatively
more deshielded signals at δC 155.7, 158.0, 154.4, 154.1 and 150.0, respectively,
then non-oxygenated aromatic carbons C-2, C-4, C-5, C-6, C-8, C-8a and C-9a
gave signals at δC 104.0, 107.2, 119.1, 124.4, 108.4, 120.8 and 103.0, respectively.
The sp3 hybridized carbons C-13, C-14 & 15, C-1‟, C-4‟ and C-5‟ gave signals in
the upfield region at δC 78.2, 27.6, 21.1, 17.3, 25.1 respectively.
The HMQC spectrum (Figure 4.7) provided details about 1JCH coupling between
protons and their respective carbons revealing that all protonated carbons were
found to give correlations in this spectrum. On the basis of integration of proton
signals and their correlations to carbon signals in HMQC spectrum, compound 67
was established to have twelve quaternary, six methine, one methylene and four
methyl carbons which were in agreement with the proposed structure.

56
In the HMBC spectrum (Figures 4.8 to 4.11), the chelated hydroxyl proton, 1-OH
gave cross-peaks to an oxygenated carbon C-1 (δC 155.7) and two substituted
aromatic carbons, C-2 (δC 104.0) and C-9a (δC 103.0); free hydroxyl proton, 7-OH
was correlated to two protonated aromatic carbons, C-6 (δC 124.4) and C-8 (δC
108.4), revealing the two hydroxyl groups were linked to carbons C-1 and C-7,
respectively. The presence of 3-methylbut-2-enyl group with its characteristic
methylene protons H-1‟ showed correlations with carbons, C-3 (δC 158.0), C-4 (δC
107.2) and C-4a (δC 154.4) indicating the prenyl group to be attached to carbon C-
4. Besides, the dimethylchromene ring was found to linearly fused to the ring A of
xanthone at carbon positions C-2 and C-3, and this was evident from the
correlations shown by the cis-olefinic proton, H-11 (δH 6.68) with carbon C-3 (δC
158.0), and proton H-12 (δH 5.72) with the carbon C-2 (δC 104.0). Based on the all
the spectral evidence, compound 67 was deduced to be brasixanthone B and the
spectral data are summarized in Table 4.1.

57
Table 4.1: Summary of NMR spectral data for brasixanthone B [67]
Position δH (ppm) δC (ppm) HMBC
1 - 155.7 -
2 - 104.0 -
3 - 158.0 -
4 - 107.2 -
4a - 154.4 -
5 7.50 (1H, d, J = 9.2 Hz) 119.1 C-7, 8a
6 7.36 (1H, dd, J = 9.2, 3.0 Hz) 124.4 C-8, 10a
7 - 154.1 -
8 7.54 (1H, d, J = 3.0 Hz) 108.4 C-6, 10a
8a - 120.8 -
9 - 180.9 -
9a - 103.0 -
10a - 150.0 -
11 6.68 (1H, d, J = 9.8 Hz) 115.3 C-3, 13
12 5.72 (1H, d, J = 9.8 Hz) 127.8 C-2, 13
13 - 78.2 -
14 1.48 (3H, s) 27.6 C-12, 13, 15
15 1.48 (3H, s) 27.6 C-12, 13, 14
1‟ 3.46 (2H, d, J = 7.3 Hz) 21.1 C-2‟, 3, 3‟, 4, 4a
2‟ 5.23 (1H, t, J = 7.3 Hz) 122.3 -
3‟ - 131.0 -
4‟ 1.86 (3H, s) 17.3 C-2‟, 3‟, 5‟
5‟ 1.63 (3H, s) 25.1 C-2‟, 3‟, 4‟
1 - OH 13.28 (1H, s) - C-1, 2, 9a
7 - OH 8.95 (1H, s) - C-6, 8
1 2
3 4 5
6
7
8
9 8a 9a
4a 10a
14
13
12
15
11
1‟
3‟
4‟ 5‟
2‟
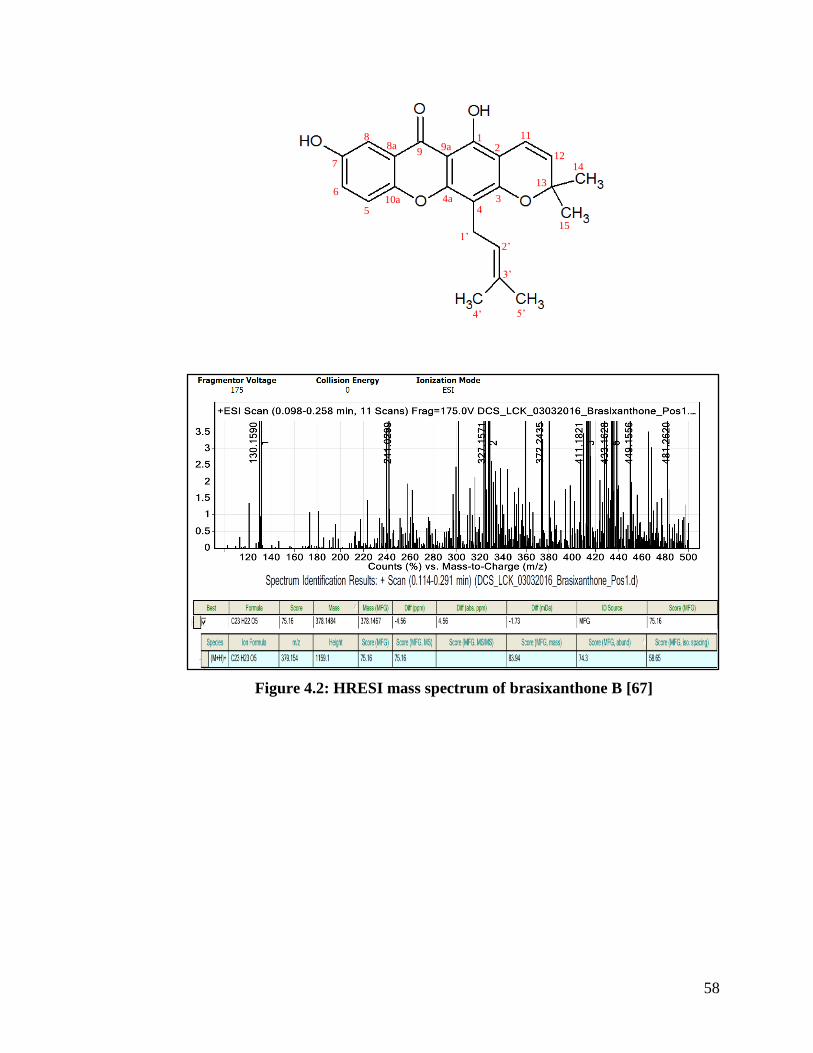
58
Figure 4.2: HRESI mass spectrum of brasixanthone B [67]
1 2
3 4 5
6
7
8
9 8a 9a
4a 10a
14
13
12
15
11
1‟
3‟
4‟ 5‟
2‟

59
200.0 220 240 260 280 300 320 340 360 380 400.0
0.00
0.1
0.2
0.3
0.4
0.5
0.6
0.7
0.8
0.9
1.0
1.1
1.2
1.3
1.4
1.5
1.6
1.7
1.8
1.9
2.00
nm
A
294.52,1.5207
245.55,1.0497
λmax = 245, 294 nm
Figure 4.3: UV-Vis spectrum of brasixanthone B [67]
OH stretch
C-H stretch
C=O stretch Aromatic C=C stretch
C-O stretch
C-H bend
Figure 4.4: IR spectrum of brasixanthone B [67]

60
1 2
3 4 5
6
7
8
9 8a 9a
4a 10a
14
13
12
15
11
1‟
3‟
4‟ 5‟
2‟
1-OH
7-OH
Figure 4.5: 1H NMR spectrum of brasixanthone B [67] (400 MHz, acetone-d6)
H-6
H-5 H-8
H-11
H-12 H-2‟
H-1‟
H-4‟
Solvent-Peak
(acetone-d6)
H-5‟
H-14, 15

61
1 2
3 4 5
6
7
8
9 8a 9a
4a 10a
14
13
12
15
11
1‟
3‟
4‟ 5‟
2‟
Solvent-Peak
(acetone-d6)
C-9
C-3
C-4a, 7
C-1
C-10a
C-3‟
C-12
C-6
C-2‟
C-8a
C-5
C-11
C-8
C-4 C-2
C-9a
C-13
Solvent-Peak
(acetone-d6)
C-14, 15
C-5‟
C-1‟
C-4‟
Figure 4.6: 13
C NMR spectrum of brasixanthone B [67] (100 MHz, acetone-d6)

62
1 2
3 4 5
6
7
8
9 8a 9a
4a 10a
14
13
12
15
11
1‟
3‟
4‟ 5‟
2‟
H-8
H-5
H-6
H-11
H-12
H-1‟ H-2‟
H-5‟ H-14, 15
S
H-4‟
C-5
C-8
C-2‟
C-11
C-12
C-4‟ C-1‟ C-5‟
C-14, 15
S
C-6
Figure 4.7: HMQC spectrum of brasixanthone B [67]

63
1 2
3
4 5
6
7
8
9 8a 9a
4a 10a
14
13
12
15
11
1‟
3‟
4‟ 5‟
2‟
1-OH H-8 H-5 H-6
H-11 H-1‟
C-3
C-7
C-4a
C-1
C-10a
Figure 4.8: HMBC spectrum of brasixanthone B [67] (expanded)

64
1 2
3
4 5
6
7
8
9 8a 9a
4a 10a
14
13
12
15
11
1‟
3‟
4‟ 5‟
2‟
1-OH
H-5
H-6 H-11 H-12
7-OH H-8
C-9a
C-2
C-6
C-8
C-8a
C-13
H
Figure 4.9: HMBC spectrum of brasixanthone B [67] (expanded)

65
1 2
3
4 5
6
7
8
9 8a 9a
4a 10a
14
13
12
15
11
1‟
3‟
4‟ 5‟
2‟
H-1‟
H-5‟
H-14, 15
H-4‟
C-2‟
C-3‟
C-4
C-12
C-13
Figure 4.10: HMBC spectrum of brasixanthone B [67] (expanded)
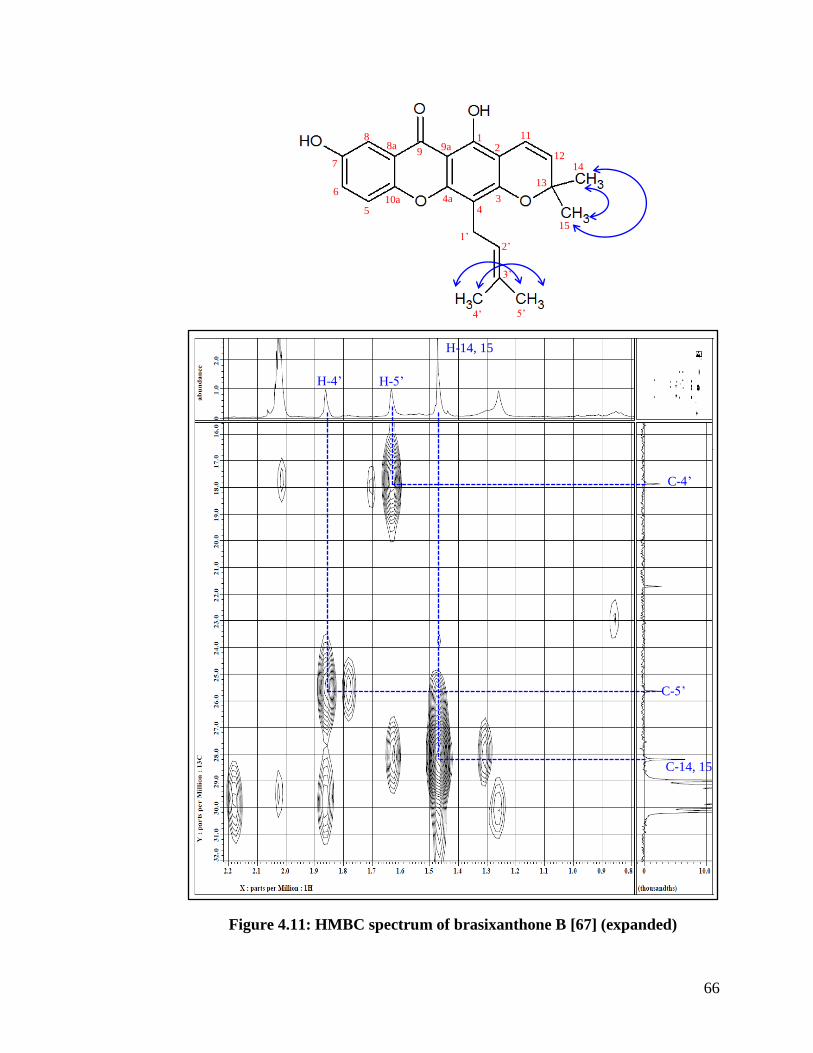
66
1 2
3 4 5
6
7
8
9 8a 9a
4a 10a
14
13
12
15
11
1‟
3‟
4‟ 5‟
2‟
H-5‟
H-14, 15
H-4‟
C-5‟
C-4‟
C-14, 15
Figure 4.11: HMBC spectrum of brasixanthone B [67] (expanded)

67
4.3 Characterization and Structural Elucidation of 1,3,7-
Trihydroxy-2,4-bis(3-methylbut-2-enyl)xanthone [68]
Figure 4.12: Chemical Structure of compound 68
Compound 68 was obtained as pale yellow crystals from crude ethyl acetate
extract, mp 127 -130 oC (Lit. 128 – 129
oC, Ee, Lim and Rahmat, 2005). It gave a
single spot on TLC with an Rf value of 0.65 when developed using the solvent
system of dichloromethane and acetone in the ratio of 8:2. Compound 68 appeared
as reddish-brown spot under 254 nm wavelength UV light, and as stained brown
spot when placed in iodine chamber. It reacted positively to ferric chloride reagent
to yield greenish-black spot indicating the compound to have a phenolic nature.
The HRESI mass spectrum (Figure 4.13) indicated a pseudomolecular ion peak,
[M+H]+ at m/z 381.1697. The calculated accurate mass of compound 68 was
380.1633 g/mol which is in correspondence with the measured molecular weight,
380.1624 g/mol. Thus, compound 68 was deduced to have a molecular formula of
C23H24O5.

68
In the UV-Vis spectrum (Figure 4.14), compound 68 gave absorption maxima
(λmax) at wavelength of 243, 266 and 298 nm. The results of spectrum indicating
the presence of highly conjugated double bonds in the xanthone chromophores.
The UV absorption bands was deduced to be the π π* transitions.
The proposed structure was further characterized by FTIR analysis revealing the
presence of OH stretch (3389 cm-1
), C-H stretch (2927 cm-1
), C=O (1630 cm-1
),
sp2 C=C stretch (1472 cm
-1), C-O stretch (1231 cm
-1) and C-H bends (803 cm
-1)
functionalities in 1,3,7-trihydroxy-2,4-bis(3-methyl-but-2-enyl)xanthone [68].
Figure 4.15 illustrated the IR spectrum of compound 68.
The 1H NMR spectrum (Figure 4.16) revealed resonances indicating a
diprenylated xanthone. The chelated hydroxy proton, 1-OH gave the most
deshielded signal at δH 13.25 (s, 1-OH). The presence of two 3-methylbut-2-enyl
groups in the proposed structure was evidenced by the signals δH 5.21 (2H, t, J =
6.7 Hz, H-12, H-17), 3.55 (2H, d, J = 6.7 Hz, H-16), 3.41 (2H, d, J = 6.7 Hz, H-
11), 1.86 (3H, s, H-19), 1.76 (3H, s, H-14) and 1.63 (6H, s, H-15, H-20).
Meanwhile, the free hydroxyl groups (7-OH / 3-OH) displayed a broad singlet at
δH 8.68. The remaining three relatively deshielded proton signals at δH 7.54 (1H, d,
J = 3.1 Hz), 7.44 (1H, d, J = 9.2 Hz), 7.31 (1H, dd, J = 9.2, 3.1 Hz) were assigned
to the three aromatic protons, H-8, H-5 and H-6 in the ring B.

69
The 13
C-NMR spectrum (Figure 4.17) revealed a total of 23 carbon signals
assignable to a keto carbon, five oxygenated aromatic carbons, three protonated
aromatic carbons, four substituted aromatic carbons, two pairs of olefinic carbons,
two sp3 hybridized methylene carbons and four methyl carbons. The most
deshielded resonance at δC 180.8 was attributed to the keto carbon, C-9. Besides,
the oxygenated aromatic carbons C-1, C-3, C-4a, C-7 and C-10a gave relatively
more deshielded signals at δC 158.4, 160.4, 153.1, 153.9 and 150.0, respectively.
On the other hand, non-oxygenated aromatic carbons C-2, C-4, C-5, C-6, C-8, C-
8a and C-9a exhibited signals at δC 110.0, 105.9, 119.0, 124.2, 108.4, 120.8 and
102.8, respectively. The sp3 hybridized carbons C-11, C-14, C-15, C-16, C-19 and
C-20 gave signals in the upfield region at δC 21.3, 17.2, 25.1, 21.6, 17.3 and 25.1,
respectively. Besides, two pairs of olefinic carbons C-12 & 13 and C-17 & 18
showed carbon signals at δC 122.3, 131.7, 122.3 and 131.5, respectively.
The proposed structure was further confirmed by DEPT (Figure 4.18) revealing
the presence of twelve quaternary carbons (C), five methine groups (CH), two
methylene groups (CH2) and four methyl groups (CH3). The DEPT-90 spectrum
showed only the methine carbon signals. Meanwhile, in the DEPT-135 spectrum,
the upper trace signals were assigned either to methine or methyl carbons whereas
lower trace signals (negative peaks) indicated the presence of methylene carbons.
The result obtained was in agreement with the proposed structure.

70
The HMQC spectrum (Figure 4.19) provided information about 1JCH coupling
between protons and their respective carbons. All the protonated carbons in the
proposed structure gave correlations in this spectrum. For instance, the proton
signal at δH 7.54 (1H, d, J = 3.1 Hz) was correlated to carbon signal at δC 108.4 (C-
8) through 1JCH coupling.
In the HMBC spectrum (Figure 4.20), the presence of two 3-methylbut-2-enyl
groups with their characteristic methylene protons, H-11 (δH 3.41) showed
correlation with carbon, C-2 (δC 110.0), and H-16 (δH 3.55) gave cross peaks to
carbons C-3 (δC 160.4), C-4 (δC 115.9) and C-4a (δC 153.1) indicating the two
prenyl groups to be attached to carbons C-2 and C-4 in the ring B of xanthone.
Compound 68 was thus established to be 1,3,7-trihydroxy-2,4-bis(3-methylbut-2-
enyl)xanthone. The NMR spectral data of compound 68 are summarized in Table
4.2.

71
Table 4.2: Summary of NMR spectral data for compound 68
Position δH (ppm δC (ppm) HMBC DEPT
1 - 158.4 - C
2 - 110.0 - C
3 - 160.4 - C
4 - 105.9 - C
4a - 153.1 - C
5 7.44 (1H, d, J = 9.2 Hz) 119.0 C-7, 8a, 10a CH
6 7.31 (1H, dd, J = 9.2, 3.1 Hz) 124.2 C-7, 8, 10a CH
7 - 153.9 - C
8 7.54 (1H, d, J = 3.1 Hz) 108.4 C-6, 7, 10a CH
8a - 120.8 - C
9 - 180.8 - C
9a - 102.8 - C
10a - 150.0 - C
11 3.41 (2H, d, J = 6.7 Hz) 21.3 C-2, 12, 13 CH2
12 5.21 (1H, t, J = 6.7 Hz ) 122.3 C-11, 14, 15 CH
13 - 131.7 - C
14 1.76 (3H, s) 17.2 C-12, 13, 15 CH3
15 1.63 (3H, s) 25.1 C-12, 13, 14 CH3
16 3.55 (2H, d, J = 6.7 Hz) 21.6 C-3, 4, 4a, 17, 18 CH2
17 5.21 (1H, t, J = 6.7 Hz) 122.3 C-16, 19, 20 CH
18 - 131.5 - C
19 1.86 (3H, s) 17.3 C-17, 18, 20 CH3
20 1.63 (3H, s) 25.1 C-17, 18, 19 CH3
1 - OH 13.24 (1H, s) - C-1, 2, 9a -
3 - OH 8.68 (1H, brs) - - -
7 - OH 8.68 (1H, brs) - - -
1 2
3
4
6
5
7
8
9 9a 8a
10a 4a
11
12 13
14
15
20 19
18
17
16

72
Fragmentor Voltage
175
Collision Energy
0
Ionization Mode
ESI
.
1 2
3
4
6
5
7
8
9 9a 8a
10a 4a
11
12 13
14
15
20 19
18
17
16
Figure 4.13: HRESI mass spectrum of compound 68

73
200.0 220 240 260 280 300 320 340 360 380 400.0
0.000
0.02
0.04
0.06
0.08
0.10
0.12
0.14
0.16
0.18
0.20
0.22
0.24
0.26
0.28
0.30
0.32
0.34
0.36
0.38
0.40
0.42
0.44
0.46
0.48
0.500
nm
A
298.25,0.28134
266.01,0.40700
243.42,0.41456
λmax = 243, 266, 298 nm
OH stretch
C-H stretch
C=O stretch aromatic C=C stretch
C-O stretch
C-H bend
Figure 4.14: UV-Vis spectrum of compound 68
Figure 4.15: IR spectrum of compound 68

74
1 2
3
4
6
5
7
8
9 9a 8a
10a 4a
11
12 13
14
15
20 19
18
17
16
1-OH
7-OH / 3-OH
H-8 H-5
H-6 H-12, 17
H-16 H-11
H-19 H-14
H-15, 20
Solvent-Peak
(acetone-d6)
Figure 4.16: 1H NMR spectrum of compound 68 (400 MHz, acetone-d6)

75
1 2
3
4
6
5
7
8
9 9a 8a
10a 4a
11
12 13
14
15
20 19
18
17
16
Figure 4.17: 13
C NMR spectrum of compound 68 (100 MHz, acetone-d6)
Solvent-Peak
(acetone-d6)
Solvent-Peak
(acetone-d6)
C-9
C-3
C-1
C-13, 18
C-10a
C-6
C-17, 8a C-7
C-4a
C-12
C-5
C-2 C-8
C-4 C-9a
C-15, 20
C-16, 11
C-19, 14

76
1 2
3
4
6
5
7
8
9 9a 8a
10a 4a
11
12 13
14
15
20 19
18
17
16
Figure 4.18: DEPT spectrum of compound 68
C-6
(CH)
C-12, 17
(CH)
C-5
(CH)
C-8
(CH)
C-15, 20
(CH3)
C-16, 11
(CH2)
C-19, 14
(CH3)
5 CH group
12 Quaternary C
C-6
(CH)
C-12, 17
(CH)
C-5
(CH)
C-8
(CH)
4 CH3 group
2 CH2 group
C-6
(CH)
C-12, 17
(CH)
C-5
(CH)
C-8
(CH)
C-15, 20
(CH3) C-19, 14
(CH3)
C-16, 11
(CH2)

77
1 2
3
4
6
5
7
8
9 9a 8a
10a 4a
11
12 13
14
15
20 19
18
17
16
H-8
H-5
H-6
H-12, 17
H-16 H-11
H-19 H-15, 20
H-14
S
C-19, 14
C-15, 20
C-8
C-12, 17 C-6
C-16, 11
C-5
S
Figure 4.19: HMQC spectrum of compound 68

78
1
2
3
4
6
5
7
8
9 9a 8a
10a 4a
11
12 13
14
15
20 19
18
17
16
1-OH H-8
H-6
H-12, 17
H-16
H-11
H-19 H-15, 20
H-5
H-14
C-3
C-10a
C-12, 17
C-4 C-9a
C-15, 20 C-16, 11 C-19, 14
C-8 C-2
C-6 C-13, 18
C-1 C-7, 4a
H
Figure 4.20: HMBC spectrum of compound 68

79
4.4 Characterization and Structural Elucidation of Rubraxanthone
(69)
Figure 4.21: Chemical structure of compound 69
Rubraxanthone [69] was isolated from stem bark of G. parvifolia as orange solid,
mp 199 – 201 oC (Lit. 201 – 203
oC, Fatma, et al., 2015b). This compound
displayed a single spot on TLC with an Rf value of 0.85 when developed using the
solvent system of 80 % dichloromethane and 20 % acetone. It appeared as
reddish-brown spot under 254 nm wavelength UV light, and as stained single
brown spot when placed in iodine chamber. Compound 69 reacted positively with
FeCl3 reagent indicating it to be a phenolic compound.
The HRESI mass spectrum (Figure 4.22) showed a pseudomolecular ion peak,
[M+H]+ at m/z 411.1802. The calculated accurate mass of rubraxanthone [69] was
410.1744 g/mol which is in agreement with the measured molecular weight,
410.1729 g/mol and suggested compound 69 to have a molecular formula of
C24H26O6.

80
In UV-Vis spectrum (Figure 4.23), compound 69 was found to exhibit absorption
maxima at wavelengths of 248, 299 and 344 nm indicating the presence of
chromophores group with extended conjugation in benzene and pyrone moieties.
Absorption peaks present in the range of 150 -250 nm are corresponding to n σ*
transitions, whereas π π* transitions are revealed by absorption bands in the
range of 270 -350 nm.
The proposed structure was further supported by FTIR (Figure 4.24) analysis
showing the presence of different chemical groups in this compound including
hydroxyl (3424 cm-1
), C-H stretch (2922 cm-1
), carbonyl (1612 cm-1
), C=C stretch
(1457 cm-1
) and C-O stretch (1274 cm-1
).
The 1H NMR spectrum (Figure 4.25) exhibited signals revealing a geranylated
xanthone structure. The chelated hydroxyl proton, 1-OH displayed at the most
deshielded signal at δH 13.45 (s, 1-OH). The presence of geranyl moiety in the
structure was indicated by the characteristic proton signals at δH 5.25 (1H, t, J =
6.1 Hz, H-2‟), 4.99 (1H, d, J = 6.1 Hz, H-6‟), 4.07 (2H, d, J = 6.1 Hz, H-1‟), 2.02
(3H, m, H-5‟), 1.94 (2H, t, J = 6.7 Hz, H-4‟), 1.79 (3H, s), 1.52 (3H, s) and 1.48
(3H, s). Meanwhile, both the free hydroxyl groups 7-OH and 3-OH gave a broad
singlet at δH 9.55. The remaining three aromatic protons H-5, H-4 and H-2 gave
signals at δH 6.77 (1H, s), 6.25 (1H, d, J = 1.8 Hz), 6.15 (1H, d, J = 1.8 Hz),
respectively. Lastly, the methoxy protons, 7-OCH3 revealed signal at δH 3.76 (3H,
s).
81
The 13
C-NMR spectrum (Figure 4.26) showed a total of 24 carbon signals
assignable to a keto carbon, six oxygenated aromatic carbons, three protonated
aromatic carbons, three substituted aromatic carbons, two pairs of olefinic carbons,
three sp3 hybridized methylene carbons and four methyl carbons. The most
deshielded resonance at δC 180.8 was attributed to the keto carbon, C-9.
Meanwhile, the relatively deshielded signals at δC 164.5, 164.0, 157.2, 156.6,
155.4 and 143.7 were assigned to the six oxygenated aromatic carbons C-3, C-1,
C-6, C-10a, C-4a and C-7, respectively. On the other hand, six non-oxygenated
aromatic carbons C-4, C-2, C-5, C-9a, C-8a and C-8 gave resonances at δC 93.0,
97.9, 102.0, 102.9, 111.1 and 137.4, respectively. The six sp3 hybridized carbons
C-4‟, C-5‟, C-1‟, C-9‟, C-8‟ and C-10‟ gave signals in the upfield region at δC 39.6,
26.5, 26.0, 25.0, 16.9 and 15.8, respectively. The presence of methoxy carbon, 7-
OCH3 gave signal at δC 60.6, and two pairs of olefinic carbons, C-2‟ & 3‟ and C-6‟
& 7‟ in the geranyl moiety displayed signals at δC 124.0, 134.2, 124.4 and 130.7.
The proposed structure was confirmed by DEPT (Figure 4.27) analysis to have
twelve quaternary carbons (C), five methine (CH), three methylene (CH2) and four
methyl (CH3) groups. In the HMBC spectrum (Figure 4.29), the chelated hydroxyl
proton, 1-OH showed correlations to an oxygenated carbon C-1 (δC 164.0), and
two aromatic carbons, C-2 (δC 97.9) and C-9a (δC 102.9). Meanwhile, the presence
of geranyl moiety with its characteristic methylene protons H-1‟ (δH 4.07) gave
cross-peaks to three quaternary carbon C-7 (δC 143.7), C-8 (δC 137.4) and C-8a (δC
111.1), revealing the geranyl group to be linked to carbon C-8. The NMR spectral
data are summarized in Table 4.3.

82
Table 4.3: Summary of NMR spectral data for compound 69
Position δH (ppm) δC (ppm) HMBC DEPT
1 - 164.0 - C
2 6.15 (1H, d, J = 1.8 Hz) 97.9 C-3, 4, 9a CH
3 - 164.5 - C
4 6.25 (1H, d, J = 1.8 Hz) 93.0 C-2, 9a CH
4a - 155.4 - C
5 6.77 (1H, s) 102.0 C-7, 8a, 10a CH
6 - 157.1 - C
7 - 143.7 - C
8 - 137.4 - C
8a - 111.1 - C
9 - 180.8 - C
9a - 102.9 - C
10a - 156.6 - C
1‟ 4.07 (2H, d, J = 6.1 Hz) 26.0 C-3‟, 7, 8, 8a CH2
2‟ 5.25 (1H, t, J = 6.1 Hz) 124.0 C-4‟, 8 CH
3‟ - 134.2 - C
4‟ 1.94 (2H, t, J = 6.7 Hz) 39.6 C-3‟, 5‟, 6‟, 10‟ CH2
5‟ 2.02 (3H, m) 26.5 C-3‟, 4‟, 7‟ CH2
6‟ 4.99 (1H, t, J = 6.1 Hz) 124.4 C-4‟, 8‟, 9‟ CH
7‟ - 130.7 - C
8‟ 1.48 (3H, s) 16.9 C-9‟ CH3
9‟ 1.52 (3H, s) 25.0 C-7‟, 8‟ CH3
10‟ 1.79 (3H, s) 15.8 C-3‟, 4‟ CH3
1 - OH 13.45 (1H, s) - C-1, 2, 9a -
3 – OH 9.55 (1H, s) - - -
6 – OH 9.55 (1H, s) - - -
7 – OCH3 3.76 (3H, s) 60.6 C-7 CH3
10a
8a 8
7
6
4a 5 4
3
2
1
9‟
2‟ 1‟
9a 9
4‟ 3‟
8‟
7‟
6‟ 5‟
10‟

83
10a
8a 8
7
6
4a 5 4
3
2
1
9‟
2‟ 1‟
9a 9
4‟ 3‟
8‟
7‟
6‟ 5‟
10‟
Figure 4.22: HRESI mass spectrum of compound 69

84
200.0 220 240 260 280 300 320 340 360 380 400.0
0.00
0.2
0.4
0.6
0.8
1.0
1.2
1.4
1.6
1.8
2.0
2.2
2.4
2.6
2.8
3.00
nm
A
344.43,0.62553
299.61,1.8420
248.43,2.1604
λmax = 248, 299, 344 nm
OH stretch
C-H stretch
C=O stretch
Aromatic C=C stretch
C-O stretch
C-H bend
Figure 4.24: IR spectrum of compound 69
Figure 4.23: UV-Vis spectrum of compound 69

85
10a
8a 8
7
6
4a 5 4
3
2
1
9‟
2‟ 1‟
9a 9
4‟ 3‟
8‟
7‟
6‟ 5‟
10‟
Figure 4.25: 1H NMR spectrum of compound 69 (400 MHz, acetone-d6)
1-OH
6-OH / 3-OH
H-5
H-4 H-2
H-2‟ H-6‟
H-1‟
7-OCH3
Solvent-Peak
(acetone-d6)
H-5‟, 4‟
H-9‟, 8‟
H-10‟

86
10a
8a 8
7
6
4a 5 4
3
2
1
9‟
2‟ 1‟
9a 9
4‟ 3‟
8‟
7‟
6‟ 5‟
10‟
Figure 4.26: 13
C NMR spectrum of compound 69 (100 MHz, acetone-d6)
C-9
C-3, 1
Solvent-Peak
(acetone-d6)
C-6, 10a
C-7 C-7‟
C-6‟, 2‟
C-8a
C-5
C-2
C-4 7-OCH3
C-4‟
C-5‟, 1‟, 9‟
C-8‟, 10‟ C-4a
C-3‟
C-8
C-9a
Solvent-Peak
(acetone-d6)

87
10a
8a 8
7
6
4a 5 4
3
2
1
9‟
2‟ 1‟
9a 9
4‟ 3‟
8‟
7‟
6‟ 5‟
10‟
Figure 4.27: DEPT spectrum of compound 69
C-6‟, 2‟
(CH)
5 CH group
12 Quaternary C
4 CH3 group
3 CH2 group
C-5
(CH)
C-2
(CH)
7-OCH3
(CH3)
C-5‟, 1‟
(CH2)
C-4‟
(CH2)
C-10‟, 9‟, 8‟
(CH3)
C-4
(CH)
C-6‟, 2‟
(CH)
C-2
(CH)
C-4
(CH)
C-5
(CH)
C-2
(CH) C-5
(CH) C-6‟, 2‟
(CH) C-4
(CH)
7-OCH3
(CH3) C-10‟, 9‟, 8‟
(CH3)
C-4‟
(CH2) C-5‟, 1‟
(CH2)

88
10a
8a 8
7
6
4a 5 4
3
2
1
9‟
2‟ 1‟
9a 9
4‟ 3‟
8‟
7‟
6‟ 5‟
10‟
Figure 4.28: HMQC spectrum of compound 69
H-5
H-4 H-2 H-1‟
H-6‟ H-2‟
7-OCH3
s H-5‟, 4‟
H-9‟, 8‟ H-10‟
C-5
C-4 C-2
C-6‟, 2‟
C-1‟
C-7
C-5‟
C-4‟
C-9‟
C-10‟
C-8‟
s

89
10a
8a 8
7
6
4a 5 4
3
2
1
9‟
2‟ 1‟
9a 9
4‟ 3‟
8‟
7‟
6‟ 5‟
10‟
Figure 4.29: HMBC spectrum of compound 69
1-OH
H-5
H-4 H-2
H-6‟ H-2‟
H-1‟
7-OCH3
H-5‟, 4‟
H-10‟
s
H-9‟, 8‟
C-10‟
C-5‟
C-4‟
C-8‟ C-9‟
C-4
C-2 C-9a C-8a
C-6‟, 2‟
C-3, 1
C-10a
C-7
C-7‟, 3‟, 8
C-7
s

90
4.5 Characterization and Structural Elucidation of
Tetraprenyltoluquinone (TPTQ) [70]
Figure 4.30: Chemical structure of compound 70
Compound 70 was identified as [2E,6E,10E]-(+)-4β-hydroxy-3-methyl-5β-
(3,7,11,15-tetramethyl-2,6-10,14-hexadecatetraenyl-2-cyclohexen-1-one (TPTQ).
It was isolated from the crude ethyl acetate extract as dark brown viscous liquid.
This compound showed a single spot on TLC with an Rf value of 0.55 when
developed using the solvent system of 90 % dichloromethane and 10 % acetone. It
appeared as reddish-brown spot under 254 nm wavelength UV light, and as stained
single brown spot when placed in iodine chamber.
The HRESI mass spectrum (Figure 4.31) reported a pseudomolecular ion peak,
[M+H]+ at m/z 399.3258. The calculated accurate mass of compound 70 was
398.3187 g/mol which is in agreement with the measured molecular weight,
398.3185 g/mol. Hence, the spectral data proposed compound 70 to have a
molecular formula of C27H42O2. In the UV-Vis spectrum (Figure 4.32), compound

91
70 showed absorption maxima at wavelengths of 204, 251 and 313 nm indicating
the presence of chromophores with highly conjugated system in the compound.
The suggested structure was further confirmed by FTIR analysis revealing the
presence of hydroxyl (3424 cm-1
), C-H stretch (2924 cm-1), α, β-unsaturated
ketone (1662 cm-1
), C=C (1439 cm-1
) and C-O stretch (1289 cm-1
) functionalities
in compound 70. The IR spectrum of compound 70 is shown in Figure 4.33.
The 1H NMR spectrum (Figure 4.34) displayed resonances suggesting the
presence of a cyclohex-2-enone ring and a geranyl-geranyl side chain in the
proposed structure. The ring moiety gave signals at δH 5.82 (1H, s, H-2), 4.12 (1H,
d, J = 6.1 Hz, H-4), 2.11 (1H, m, H-5), 2.51 (1H, d, J = 12.2 Hz, H-6), 2.08 (1H, m,
H-6) and 2.02 (3H, s, 3-CH3). On the other hand, the geranyl-geranyl moiety
showed characteristic olefinic, methylene and methyl proton signals at δH 5.18 (1H,
t, J = 7.0 Hz, H-2‟), 5.07 (3H, d, J = 5.5 Hz, H-6‟, 10‟, 14‟), 2.34 (1H, m, H-1‟),
2.15 (1H, d, J = 1.2 Hz, H-1‟), 2.05 (6H, m, H-5‟, 9‟, 13‟), 1.96 (6H, m, H-4‟, 8‟,
12‟), 1.66 (3H, s, 15‟-CH3), 1.61 (3H, s, H-16‟) and 1.58 (9H, s, 3‟-CH3, 7‟-CH3,
11‟-CH3).
A total of 27 carbon signals were observed in the 13
C NMR spectrum (Figure 4.35)
revealing compound 70 to consist of 27 carbons. The most deshielded resonance at
δC 198.9 was attributed to the keto carbon, C-1. Besides, the presence of five pairs
of olefinic carbons C-2/C-3, C-2‟/C-3‟, C6‟/C-7‟, C-10‟/C-11‟ and C-14‟/C-15‟
gave proton signals at δC 126.8/163.6, 120.8/138.5, 124.5/135.5, 124.2/135.0 and

92
123.9/131.4, respectively. Meanwhile, the oxygenated sp3 hybridized carbon C-4
gave relatively a more deshielded resonance at δC 73.6 as compared to other sp3
hybridized carbon. The remaining carbon signals at δC 43.6, 41.4, 39.9, 39.8, 39.8,
30.9, 26.8, 26.7, 26.6, 25.8, 20.5, 17.8, 16.4, 16.1, 16.1 were assigned to the sp3
hybridized methylene and methyl carbons, C-5, C-6, C-4‟, C-8‟, C-12‟, C-1‟, C-9‟,
C-5‟, C-13‟, 15‟-CH3, 3-CH3, C-16‟, 3‟-CH3, 7‟-CH3 and 11‟-CH3, respectively.
The assignment of carbon signals was in agreement with the literature values
reported by Fatma, et al., in year 2014.
In the DEPT spectrum (Figure 4.36), compound 70 was established to have six
quaternary, seven methine, eight methylene and six methyl carbons which were in
consistent with the proposed structure. On the basis of HMQC spectrum (Figure
4.37), the direct coupling between protons and their respective carbon signals were
assigned. In the HMBC spectrum (Figure 4.38), the geranyl-geranyl group with its
characteristic methylene protons, H-1‟ showed correlations with carbons C-5 (δC
43.7) and C-6 (δC 41.5) indicating the geranyl-geranyl group was attached to the
cyclohex-2-enone ring at carbon C-5. The remaining assignment and NMR
spectral data were summarized in Table 4.4.
1‟
2‟
3‟
4‟
5‟
6‟
7‟
8‟
9‟
10‟
11‟ 12‟
13‟
14‟ 15‟
16‟
1 2
3 4
5
6

93
Table 4.4: Summary of NMR spectral data for compound 70 in comparison
with literature values
(*Literature source: Fatma, et al., 2014)
Position δH (ppm), Integration
and Multiplicity
*δH (ppm)
Integration and
Multiplicity
δC
(ppm)
*δC
(ppm) HMBC DEPT
1 - - 198.9 199.0 - C
2 5.82 (1H, s) 5.80 (1H, s) 126.8 126.4 C-4, 6, 3-CH3 CH
3 - - 163.6 164.1 - C
4 4.12
(1H, d, J = 6.1 Hz)
4.09
(1H, d, J = 6.0 Hz) 73.6 73.1 C-3, 5 CH
5 2.11 (1H, m) 2.10 (1H, m) 43.7 43.5 C-1 CH
6
2.51
(1H, d, J = 12.2 Hz) 2.51 (2H, m) 41.4 41.1 C-1, 2, 4, 5 CH2
2.08 (1H, m)
3-CH3 2.02 (3H, s) 2.03 (3H,s) 20.5 20.4 C-2, 3 ,4 CH3
1‟
2.34 (1H, m) 2.35
(1H, d, J = 8.0 Hz) 30.9 30.5 C-2‟, 5, 6 CH2
2.15 (1H, d, J = 1.2 Hz)
2.1 (1H, d, J = 8.0 Hz)
2‟ 5.16
(1H, t, J = 7.0 Hz)
5.2
(1H, t, J = 6.0 Hz) 120.8 120.5 C-1‟, 4‟, 3-CH3 CH
3‟ - - 138.5 138.2 - C
4‟ 1.96 (2H, m) 1.96 (2H, m) 39.9 39.8 C-5‟, 6‟, 3-CH3 CH2
5‟ 2.05 (2H, m) 2.14 (2H, m) 26.7 39.6 C-3‟, 4‟, 6‟, 7‟ CH2
6‟ 5.07
(1H, d, J = 5.5 Hz) 5.09
(1H, d, J = 6.0 Hz) 124.5 124.3
C-4‟, 5‟, 7‟-CH3
CH
7‟ - - 135.5 135.1 - C
8‟ 1.96 (2H, m) 1.96 (2H, m) 39.8 39.6 C-9‟, 10‟, 7‟-
CH3 CH2
9‟ 2.05 (2H, m) 2.14 (2H, m) 26.8 26.6 C-7‟, 8‟, 10‟,
11‟ CH2
10‟ 5.07
(1H, d, J = 5.5 Hz)
5.09
(1H, d, J = 6.0 Hz) 124.2 124.1
C-8‟, 9‟, 11‟-
CH3 CH
11‟ - - 135.0 134.8 - C
12‟ 1.96 (2H, m) 1.96 (2H, m) 39.8 26.5 C-13‟, 14‟, CH2
13‟ 2.05 (2H, m) 2.14 (2H, m) 26.6 26.4 C-11‟, 12‟, 14‟,
15‟ CH2
14‟ 5.07
(1H, d, J = 5.5 Hz)
5.09
(1H, d, J = 6.0 Hz) 123.9 123.8 C-12‟, 13‟ CH
15‟ - - 131.4 131.1 - C
16‟ 1.61 (3H, s) 1.61 (3H, s) 17.8 17.5 C-15‟-CH3 CH3
3‟-CH3 1.58 (3H, s) 1.58 (3H, s) 16.4 16.1 C-4‟ CH3
7‟-CH3 1.58 (3H, s) 1.58 (3H, s) 16.1 15.8 C-6‟, 7‟ CH3
11‟-CH3 1.58 (3H, s) 1.58 (3H, s) 16.1 15.8 C-10‟ CH3
15‟-CH3 1.66 (3H, s) 1.66 (3H, s) 25.8 25.5 C-14‟, 15‟, 16‟ CH3

94
200.0 220 240 260 280 300 320 340 360 380 400.0
0.00
0.2
0.4
0.6
0.8
1.0
1.2
1.4
1.6
1.8
2.0
2.2
2.4
2.6
2.8
3.0
3.2
3.4
3.6
3.8
4.00
nm
A
313.08,0.26277
251.58,3.0578
204.16,0.37852
Figure 4.31: HRESI Mass Spectrum of compound 70
λmax = 204, 251, 313 nm
Figure 4.32: UV-Vis spectrum of compound 70
Figure 4.33: IR spectrum of compound 70
OH stretch
C-H stretch
C=O stretch Aromatic C=C stretch
C-O stretch
C-H bend

95
1‟
2‟
3‟
4‟
5‟
6‟
7‟
8‟
9‟
10‟
11‟ 12‟
13‟
14‟ 15‟
16‟
1 2
3 4
5
6
Figure 4.34: 1H NMR spectrum of compound 70 (400 MHz, CDCl3-d6)
H-2
H-2‟
H-6‟, 10‟, 14‟
H-4 H-6
H-1‟
H-1‟, 5, 6
3-CH3, H-5‟, 9‟, 13‟
H-4‟, 8‟, 12‟
15‟-CH3, H-16‟
Solvent-Peak
(CDCl3-d6)
3‟-CH3, 7‟-CH3, 11‟-CH3

96
1‟
2‟
3‟
4‟
5‟
6‟
7‟
8‟
9‟
10‟
11‟ 12‟
13‟
14‟ 15‟
16‟
1 2
3 4
5
6
Figure 4.35: 13
C NMR spectrum of compound 70 (100 MHz, CDCl3-d6)
C-1
C-3
C-3‟
C-7‟, 11‟
C-15‟
C-2
C-6‟, 10‟, 14‟
C-2‟
C-4
Solvent-Peak
(CDCl3-d6)
C-5 C-6
C-4‟, 8‟, 12‟
C-1‟
C-9‟, 5‟, 13‟, 15‟-CH3
3-CH3
C-16’
11’-CH3
3’-CH3
7’-CH3
3-CH3
C-16‟
11‟-CH3
3‟-CH3
7‟-CH3

97
1‟
2‟
3‟
4‟
5‟
6‟
7‟
8‟
9‟
10‟
11‟ 12‟
13‟
14‟ 15‟
16‟
1 2
3 4
5
6
Figure 4.36: DEPT spectrum of compound 70
7 CH group
6 Quaternary C
6 CH3 group
8 CH2 group
C-6‟, 10‟, 14‟
(CH) C-2
(CH) C-2‟
(CH)
C-4
(CH)
C-5
(CH)
C-4
(CH) C-5
(CH)
C-2
(CH) C-2‟
(CH)
C-6‟, 10‟, 14‟
(CH)
C-2
(CH) C-2‟
(CH)
C-6‟, 10‟, 14‟
(CH)
C-4
(CH) C-5
(CH)
15‟-CH3, 3-CH3, C-16‟, 3‟-
CH3, 7‟-CH3, 11‟-CH3
(CH3)
C-6, C-4’, C-8’, C-12’,
C-1’, C-9’, C-5’, C-13’
(CH)

98
1‟
2‟
3‟
4‟
5‟
6‟
7‟
8‟
9‟
10‟
11‟ 12‟
13‟
14‟ 15‟
16‟
1 2
3 4
5
6
Figure 4.37: HMQC spectrum of compound 70
H-2 H-2‟
H-6‟, 10‟, 14‟
H-4
C-5, 6
H-4‟, 8‟, 12‟
15‟-CH3, H-16‟
3‟-CH3, 7‟-CH3, 11‟-CH3
C-2
C-2‟
C-6‟, 10‟, 14‟
C-4
H-5, 6
C-4‟, 8‟, 12‟
15‟-CH3, C-16‟
3‟-CH3, 7‟-CH3,
11‟-CH3

99
1‟
2‟
3‟
4‟
5‟
6‟
7‟
8‟
9‟
10‟
11‟ 12‟
13‟
14‟ 15‟
16‟
1 2
3 4
5
6
Figure 4.38: HMBC spectrum of compound 70
H-2
C-4
C-6
3-CH3
H
H-4
C-5
C-3

100
4.6 Antioxidant Assay
Oxidation reactions are known to produce free radicals, known as reactive oxygen
species (ROS), such as superoxide (O2.-), hydroxyl (HO
.), peroxyl (ROO
.), alkoxyl
(RO.). However, a high concentration of free radicals can cause oxidative cell
damage, neurological disorder such as Parkinson‟s dementia and Alzheimer
disease, and cancer (Ames, Shigeneaga and Hagen, 1993). Antioxidant is a
compound which inhibits oxidation by either reacting with reactive oxygen species
(ROS) to form harmless product or by disrupting free radical chain reaction. It
reacts with these free radicals and terminates the chain reaction by removing free
radical intermediates and inhibits other oxidation reactions by oxidizing
themselves. Generally, polyphenolic or phenolic compounds are served as
antioxidant in biological system.
In this study, crude dichloromethane, ethyl acetate extracts, as well as the four
isolated compounds, namely brasixanthone B [67], 1,3,7-trihydroxy-2,4-bis(3-
methylbut-2-enyl)xanthone [68], rubraxanthone [69] and TPTQ [70] were
subjected to DPPH radical scavenging capacity assay in order to evaluate for their
antioxidant activities.
DPPH radical is a stable organic nitrogen centered free radical, present in a dark
purple colour that when it is reduced to its non-radical form by antioxidants, it
becomes colourless or pale yellow. This assay measured the radical scavenging
capacity of the samples at different solution concentrations, and then the sample

101
concentration required to reduce the initial DPPH concentration by 50% (IC50) at
steady state was obtained from the plotted graph of inhibition rate of DPPH radical
against concentration of sample. A lower IC50 value indicates a stronger DPPH
radical scavenging capacity, which means more potent antioxidant effect. Table
4.5 shows the summary of the antioxidant results (IC50) of the test samples.
Table 4.5: Antioxidant results of test samples in DPPH assay
Test samples IC50 (µg/mL)
Positive controls:
Ascorbic acid
Kaempferol
5.0
7.0
Crude extracts:
Dichloromethane
Ethyl acetate
44.0
44.5
Isolated compounds:
Brasixanthone B [67]
1,3,7-Trihydroxy-2,4-bis(3-methylbut-2-enyl)xanthone [68]
Rubraxanthone [69]
Tetraprenyltoluquinone (TPTQ) [70]
>240
185
195
>240
From the results obtained from the graph of percent inhibition rate versus
concentration of sample (Figures 4.39 and 4.40), crude dichloromethane and ethyl
acetate extracts showed relatively weaker antioxidant activities with IC50 values of
44.0 and 44.5 µg/mL, respectively as compared to the positive controls ascorbic
acid (IC50 of 5.0 µg/mL) and kaempferol (IC50 of 7.0 µg/mL). However, both of
the crude extracts exhibited much stronger antioxidant activity as compared to all

102
the four isolated compounds. This might due to the reason that crude extracts
contained more variety of phenolic compounds which were potential antioxidants.
Meanwhile, compounds 67 and 70 were found to be inactive with both the
compounds gave IC50 values more than 240 µg/mL. On the other hand,
compounds 68 and 69 showed significant but weak activity with IC50 of 185 and
195 µg/mL, respectively in DPPH assay. The antioxidant activity exhibited by
compounds 68 and 69 may be attributed to the presence of free hydroxyl groups in
both the compounds. Compound 68 was found to have two free hydroxyl groups at
carbon C-2 and C-7, while compound 69 bearing the two hydroxyl groups at
carbon C-2 and C-6. These free hydroxyl groups can act as proton donor to
deactivate the DPPH free radicals.

103
Figure 4.39: Graph of inhibition rate (%) against concentration of crude extracts
Figure 4.40: Graph of inhibition rate (%) against concentration of isolated compounds

104
CHAPTER 5
CONCLUSION
5.1 Conclusion
In this project, a total of four chemical compound were isolated from the crude
ethyl acetate extract of Garcinia parvifolia. The structures of isolated compounds
were elucidated and characterized via various modern spectroscopic techniques
including 1D- and 2D-NMR, LC-MS, UV-Vis and IR analyses. They were
identified as brasixanthone B [67], 1,3,6-trihydroxy-2,4-bis(3-methylbut-2-
enyl)xanthone [68], rubraxanthone [69] and tetraprenyltoluquinone (TPTQ) [70].
The crude dichloromethane and ethyl acetate extracts along with four isolated
compounds were evaluated for their antioxidant activity via DPPH assay. In this
assay, dichloromethane and ethyl acetate extracts were found to exhibit relatively
weak antioxidant activity with IC50 values of 40.0 and 44.5 µg/ml, respectively as
compared to positive controls of ascorbic acid (IC50 = 5.0 µg/ml) and kaempferol
(IC50 = 7.0 µg/ml). On the other hand, isolated compounds 67 and 70 were inactive
showing IC50 values of more than 240 µg/ml, whereas compounds 68 and 69 were
found to exhibit weak antioxidant activities with their IC50 values of 185 and 195
µg/ml, respectively.

105
5.2 Future Perspectives
For future studies, it is recommended that more advance instrumental techniques
including high performance liquid chromatography (HPLC) and ultra-performance
liquid chromatography (UPLC) should be used to increase the separation
efficiency for isolation of minor compounds from the stem bark of Garcinia
parvifolia. Furthermore, it was suggested the crude extracts and isolated
compounds in this to be subjected to further investigation for other biological
activities. Apart from antioxidant property, such as cytotoxic and antimicrobial
activities. In addition, the potential pure compounds discovered in this study could
be investigated for their chemical derivatives via organic synthesis.

106
REFERENCES
Agrawal, A. D., 2011. Pharmacological Activities of Flavonoids: A Review.
International Journal of Pharmaceutical Sciences and Nanotechnology, 4(2), pp.
1394-1398.
Ames, B. N., Shigenaga, M. K. And Hagen, T. M., 1993. Oxidants, antioxidants,
and the degenerative diseases of aging. Proceedings of the National Academy of
Sciences of the United States of America, 90(17), pp. 7915-7922.
Ana, Z., 2012. Marine natural products isolation, screening and analogue
synthesis. PhD. University of Wollongong Thesis Collections.
Anne, M. N., Theophile, N. M., Joseph, D. C. and David, S. R., 1990. Cycloartane
derivatives from Garcinia lucida. Phytochemistry, 29(3), pp. 994-997.
Ari, K., 1993. Asymmetric Synthesis of Natural Products. England: John Wiley &
Sons Ltd.
Arwa, S., Zeraik, M. L., Ximenes, V. F., Fonseca, L. M., Bolzani, V. and Siqueira,
S., 2015. Redox-active biflavonoids from Garcinia brasiliensis as inhibitors of
neutrophil oxidative burst and human erythrocyte membrane damage. Journal of
Ethnopharmacology, pp. 410-418.
Bala, Y. M. and Ahmed, A., 2008. The need for enhancement of research
development, and commercialization of natural medicinal products in Nigeria:
Lessons from the Malaysian Experience. African Journal of Traditional,
Complementary and Alternative medicine, 5(2), pp. 120-130.
Benetode, K., 2015. Protective activity of biflavanones from Garcinia kola against
Plasmodium infection. Journal of Ethnopharmacology, 172, pp. 214-218.

107
Binh, T. D., Trinh, N. T., Nguyen, N., Ngo, P., Tran, L. and Nguyen, L. H., 2013.
Polyisoprenylated benzophenone and xanthone constituents of the bark of
Garcinia cochinchinensis. Phytochemistry Letters, 6(2), pp. 224-227.
Bonnie, T. Y. P., 1996. Chemical Constituents of Garcinia Mangostana, G.
parvifolia, G. Griffitti and G. Diversifolia (Guttiferae) and their Biological
Activities. PhD. University Putra Malaysia.
Chien, S. C., Chyu, C. F., Chang, I. S., Chiu, H. L. and Kuo, Y. H., 2008. A novel
polyprenylated phloroglucinol, garcinialone, from the roots of Garcinia multiflora.
Tetrahedron Letters, 49(36), pp. 5276-5278.
Chihiro, I., Masataka, I., Yoshitaka, M., Valdir, C. F., Teruo, M., Harukuni, T.,
Hoyoku, N. and Hiroshi, F., 2002. Chemical Constituents of Calophyllum
brasiliensis. Structure Elucidation of Seven New Xanthones and Their Cancer
Chemopreventive Activity. Journal of Natural Product, 65(1), pp. 267-272.
Dias, D. A., Urban, S. and Roessner, U., 2012. A Historical Overview of Natural
Products in Drug Discovery. Journal of Metabolites, 2, pp. 303-336.
Dmitrily, O., Ivo, P., Nisarat, S. and Michael, H., 2009. Garcinia mangostana: a
phytochemical and pharmacological review. Phytotherapy Research, 23(8), pp.
1047-1065.
Dyary, H., Arifah, A. K., Sharma, R. S., Rasedee, A., Mohd, A., Zakaria, Z. A.,
Zuraini, A. and Somchit, M. N. 2015. In vivo antitrypanosomal activity of
Garcinia hombroniana aqueous extract. Reseach in Veterinary Science, pp. 226-
231.
Ee, G. C. L. and Cheow, Y. L., 2007. Chemical Constituents from Garcinia
maingayi and Garcinia parvifolia (Guttiferae) and their biological activities.
Pertanika Journal Science and Technology, 15(2), pp. 95-102
Ee, G. C. L., Lim, C. K. and Rahmat, A., 2005. Structure-Activity Relationship of
xanthones from Mesua daphnifolia and Garcinia nitida towards Human Estrogen

108
Receptor Negative Breast Cancer Cell Line. Natural Product Sciences. 11(4), pp.
220-224.
Fatma, S. W., Shaari, K., Johnson, S., Nordin, L. and Dachriyanus H., 2014.
Cytotoxicity studies of tetraprenyltoluquinone, a prenylated hydroquinone from
Garcinia cowa Roxb on H-460, MCF-7 and DU-145. International Journal of
Pharmacy and Pharmaceutical Science, 7(3), pp. 0975-1491.
Fatma, S. W., Shaari, K., Johnson, S., Nordin, L. and Dachriyanus H., 2015a.
Cytotoxic compounds from the leaves of Garcinia cowa Roxb. Journal of Applied
Pharmaceutical Science, 5(1), pp. 006-011.
Fatma, S. W., Shaari, K., Johnson, S., Nordin, L. and Dachriyanus H., 2015b.
Cytotoxic compounds from the stem bark of Garcinia cowa Roxb. Journal of
Chemical and Pharmaceutical Research, 7, pp. 227-236.
Fereidoon, S., Janitha, P. K. and Wanasundara, P. D., 1992. Phenolic Antioxidants.
Critical Reviews in Food Science and Nutrition, 32(1), pp. 67-103.
Gabin, N. L., Alain, M. L., Celine, D. M., Jean, G. T., Justin, K., Paula, C.,
Fernande, N. N., Naz, Q., David, L., Muhammad, I. C. and Beiban, L. S., 2008.
Polyxanthone A, B and C, three xanthones from the wood trunk of Garcinia
polyantha Oliv. Phytochemistry, 69(4), pp. 1013-1017.
Goutam, B., 2009. Natural Products: Chemistry, Biochemistry, and Pharmacology.
U. K: Alpha Science International Ltd.
Goutam, B., 2012. Natural Products in Drug Discovery: Impacts and
Opportunities-An Assessment. Bioactive Natural Products: Opportunities and
Challenges in Medicinal Chemistry, 1(1), pp. 1-199.
Hailemichael, T., 2005. Isolation and Structure Elucidation of Natural Products
from Plants. PhD. University of Hamburg.

109
Hamdoon, M., 2009. Natural and Synthetic Flavonoid Derivatieves with Potential
Antioxidant and Anticancer Activities. PhD. Universitat des Saarlandes.
Hiroyuki, M., Kumiko, H., Miwa, K. and Yoshiyasu, F., 1998. A benzophenone
and a xanthone from Garcinia Subelliptica. Phytochemistry, 49(6), pp. 1783-1785.
Hyun, A. J., Su, B. N., Willian, J. K., Mehta, R. and Kinghorn, A. D., 2006.
Antioxidant Xanthones from the Pericarp of Garcinia mangostana (Mangosteen).
Journal Agriculture Food Chemistry, 54, pp. 2077-2082.
Ibrahim, J. and Fadlina, C. S., 2012. Benzophenones and xanthones from Garcinia
cantleyana var. cantleyana and their inhibitory activities on human low density
lipoprotein oxidation and platelet aggregation. Phytochemistry, 80, pp. 58-63.
Ito, C., Matsui, T., Noda, E., Ruangrungsi, N. and Itoigawa, M., 2013. Biphenyl
derivatives from Garcinia schomburgkiana and the cytotoxicity of the isolated
compounds. Nat Prod Communication, 8(9), pp. 1265-1267.
Ittipon, S., Wisanu, M., Tawanun, S., Thunwadee, R., Sarot, C. and Surat, L., 2014.
Biphenyl and xanthone derivatives from the twigs of a Garcinia sp. (Clusiaceae).
Phytochemistry Letters, 8, pp. 77-80.
James, H. D., 2012. Phytochemicals, Extraction Methods, Basic structures and
Mode of Action as Potential Chemotherapeutic Agents. PhD. Federal University of
Technology.
James, R. H., 2003. Natural Products: the Secondary Metabolites. United
Kingdom: Royal Society of Chemistry
Jamila, N., Khairuddean, M., Yeong, K. K., Osman, H. and Murugaiyah, V., 2015.
Cholinesterase inhibitory triterpenoids from the bark of Garcinia hombroniana.
Journal Enzyme Inhibition Medical Chemistry. 30(1), pp. 133-139.

110
Jannarin, N., 2011. Chemical Constituents of Garcinia Fusca Pierre. Master.
Srinakharinwirot University.
Jannarin, N., Charoenram, N., Upamai, W. and Suksamrarn, S., 2013. Anti-
Helicobacter pylori xanthones of Garcinia fusca. Master. Srinakharinwirot
University.
Justin, K., Meli, A. L., Manfouo, R. N., David, L., Ngounou, F. N., Kuete, V.,
Hippolyte, V. K., Pierre, T., Bonaventure, T. N., Beiban, L.S. and Joseph, D. C.,
2005. Xanthones from Garcinia smeathmannii (Oliver) and their antimicrobial
activity. Phytochemistry, 66(14), pp. 1713-1717.
Khaled, A. A. A., Adam, A., Taha, M., Hasan, M. H. And Shah, S. A. A., 2013.
Prenylated Xanthone and Rubraxanthone with Antiplatelet Aggregation Activity in
Human Whole Blood Isolated from Garcinia griffithii. Oriental Journal of
Chemistry, 29(4), pp. 1291-1295.
Khalid, A. S., Khozirah, S., Faridah, A., Daud, A. I., Ahmad, S. H., Normawati, S.,
Khoushik, S. and Nordin, L., 2007. Cytotoxic caged-polyprenylated xanthonoids
and a xanthone from Garcinia cantleyana. Phytochemistry, 68(20), pp. 2537-2544.
Kohsuke, H., Hironori, T., Izuru, K., Manzhen, S., Madhu, G. and Soni, G. Y.,
2008. Effects of Garcinia cambogia extract on serum sex hormones in overweight
subjects. Fitoterapia, 79(4), pp. 255-261.
Kong, J. M., Goh, N. K., Chia, L. S. and Chia, T. F., 2003. Recent advances in
traditional plant drugs and orchids. Acta Pharmacologica Sinica, 24, pp. 7−21.
Kongkiat, T., Vatcharin, R., Souwalak, P. and Nongporn, H. T., 2013.
Tetraoxygenated xanthones and biflavonoids from the twigs of Garcinia
merguensis. Phytochemistry Letters, 6(4), pp. 511-513.
Kuete, V., Komguem, J., Beng, P. V., Meli, L. A., Tangmouo, G. J., Etoa, X. F.
and Lontsi, D., 2007. Antimicrobial components of the methanolic extract from

111
the stem bark of Garcinia smeathmannii Oliver (Clusiaceae). South African
Journal of Botany, 73(2), pp. 347-354.
Lannang, A. M., Komguem, J., Ngninzeko, F. N., Gustave, J., Lontsi, D., Asma,
A., Choudhary, M. I., Rosa, R., Krishna, P. D. and Luc, S., 2005.
Bangangxanthone A and B, two xanthones from the stem bark of Garcinia
polyantha Oliv. Phytochemistry, 66(19), pp. 2351-2355.
Lathifah, U. Z., Rahim, R. A., Sudrajat, H. and Khairi, S., 2010. Antiplasmodial
activity of alkaloids from Garcinia Parvifolia Miq. Stem Bark. Journal Iranian
Chemical Research, 3(2), pp. 59-63.
Lee, L. T., Tsai, H. P., Wang, C. C., Chang, C. N., Liu, W. C., Hsu, H. C., Hsieh,
C. T., Chen, Y. C., Tseng, H. W., Gau, R. J., Liu, S. H., Chen, I. S. and Munekazu,
L., 2013. Guttiferone F from the fruit of Garcinia multiflora and its
antihepatocellular carcinoma activity. Biomedicine & Preventive Nutrition, 3(3),
pp. 247-252.
Leonardus, B. S. K., Muhammad, H., Gatot, S., Soleh, K. and Leslie, J. H. 2006.
Bioactive Constituents of Garcinia porrecta and Garcinia parvifolia Grown in
Indonesia. Pakistan Journal of Biological Science, 9(3), pp. 483-486.
Lim, T. K., 2012. Edible Medicinal and Non-Medicinal Plants. 2nd
Edition. New
York; Springer.
Lin, K. W., Huang, A. M., Yang, S. C., Weng, J. R., Hour, T. C., Pu., Y. S. and
Lin, C. N., 2012. Cytotoxic and antioxidant constituents from Garcinia
subelliptica. Food Chemistry, 135(2), pp. 851-859.
Luo, L., Qin, J. K., Dai, Z. K. and Gao, S. H., 2013. Synthesis and biological
evaluation of novel benzo[b]xanthone derivatives as potential antitumor agents.
Journal of the Serbian Chemical Society, 78(9), pp. 1301-1308.
Ma, W. S., 2011. Natural Product Drug Discovery against Tropical Diseases.
PhD. University of South Florida.

112
Mah, S. H., Gwendoline, C. L. E., Teh, S. S., Mawardi, R., Lim, Y. M. and Rusea,
G., 2012. Phylattrin, a new cytotoxic xanthone from Calophyllum soulattri.
Molecules, 17, pp. 8303-8311.
Mahabusarakam, W., Chairerk, P. and Taylor, W. C., 2005. Xanthones from
Garcinia cowa Roxb. latex. Phytochemistry, 66, pp. 1148-1153.
Manohar, S. H., Poornananda, M. N., Patil, L.M., Karikatti, S. I. and Niranjana, M.
H., 2014. Chemical Composition of Garcinia xanthochymus Seeds, Seed Oil, and
Evaluation of its Antimicrobial and Antioxidant Activity. Journal of Herbs Spices
& Medicinal Plants, 20(2), pp. 148-155.
Miguel, L. L., 2009. Distribution and Biological Activities of the Flavonoid
Luteolin. Medicinal Chemistry, 9(1), pp. 31-59.
Mohd, F. A. B., Nor, E. A., Monica, S., Asmah, R. and Azizul, I., 2015. Garcinia
dulcis Fruit Extract Induced Cytotoxicity and Apoptosis in HepG2 Liver Cancer
Cell Line. BioMedical Research International, pp. 1-10.
Munekazu, I., Hideki, T., Toshiyuki, T. and Soedarsono, R., 1995. Three New
Xanthones from the Bark of Garcinia dioica. Chemistry Pharmacological Bulletin,
44(1), pp. 232-234.
Negi, J. S., Bisht, V. K., Singh, P., Rawat, M. S. M. and Joshi, G. P., 2013.
Naturally Occurring Xanthones: Chemistry and Biology. Journal of Applied
Chemistry, 7(3), pp. 1-9.
Nethravathi, P. C., Shruthi, G.S., Suresh, D., Udayabhanu, Nagabhushana, H. and
Sharma, S. C., 2015. Garcinia xanthochymus mediated green synthesis of ZnO
nanoparticles: Photoluminescence, photocatalytic and antioxidant activity studies.
Ceramics International, 41(7), pp. 8680-8687.
Newman, D. J. and Cragg, G. M., 2007. Natural products as sources of new drugs
over the last 25 years. Journal of Natural Product, 70(3), pp. 461−477.

113
Nguyen, H. D., Binh, T. D. and Nguyen, L. H., 2011. Guttiferones Q-S, cytotoxic
polyisoprenylated benzophenones from the pericarp of Garcinia cochinchinensis.
Phytochemistry Letters, 4(2), pp. 129-133.
Nguyen, L. H. D., Hau, T. V., Pham, H. D., Joseph, D. C., Leslie, J. H., 2003.
Xanthones from the bark of Garcinia merguensis. Phytochemistry, 63(4), pp. 467-
470.
Nguyen, T. H., 2015. Phytochemical and biological investigation of the bark of
Garcinia fusca Pierre. Degree. University of Science.
Nicole, M. G., Jean, L., Bernard, A. N., Wyb, B. J. J., 2003. Population dynamics
of Garcinia lucida (Clusiaceae) in Cameroonian Atlantic forests. Forest Ecology
and Management, 177 (1-3), pp. 231-241.
Nita, Y., Rajesh, Y. and Anju, G., 2014. Chemistry of Terpenoids. International
Journal of Pharmaceutical Sciences Review and Research, 27(2), pp. 272-278.
Nursakinah, I., Zulkhari, H. A., Norhafizah, M., Hasnah, B., Zamree, M. S., Farrah,
S. I., Razif, D. and Hamzah, F. H., 2012. Nutritional content and in vitro
antioxidant potential of Garcinia atroviridis (Asam gelugor) leaves and fruits.
Malaysia Journal Nutrition, 18(3), pp. 363-371.
Odile, T., Fahy, J., Vincent, D., Angele, C., Claude, R., Mai, V. T. and Thierry, S.,
2000. Cytotoxic Prenylated xanthones from Garcinia bracteata. Journal of
Natural Product, 63(4), pp. 441-446.
Parayil, K. A., Keith, T., Simon, C., Oliver, M., Phon, T. H. and Gregory, S., 2008.
Terpenoids: Opportunities for Biosynthesis of Natural Product Drugs Using
Engineered Microorganisms. Molecular Pharmaceutics. 5(2), pp. 167-190.
Permana, D., Lajis, N., Shaari, K., Ali, A. M., Mackeen, M., Mariko, K.,
Hiromitsu, T. and Norio, A., 2002. A New prenylated Hydroquinone from the
roots of Garcinia atroviridis Griff ex T. Anders (Guttiferae). Zeitschrift fur
Naturforshung, 58, pp. 332-335.

114
Peter, G. W. and Elizabeth, G. C., 1980. Pyrones from the bark of Garcinia
courauna: Conrauanalactone, a novel of C20 derived α-pyrone. Phytochemistry,
19(6), pp. 1187-1189.
Phillipson, J. D., 2001. Phytochemistry and medicinal plants. Phytochemistry,
56(3), pp. 237-243.
Pier, G.P., 2000. Flavonoids as Antioxidants. Journal of Natural Product. 63(7),
pp. 1035-1042.
Prajakta, J., Kiran, B. and Vijayalakshmi, P., 2015. A Phytopharmacological
Review on Garcinia indica. International Journal of Herbal Medicine, 3(4), pp.
02-07.
Raouf, A. H. and Peter, G. W., 1982. Lactone, flavonoids and benzophenones
from Garcinia conrauana and Garcinia mannii. Phytochemistry, 21(6), pp. 1393-
1396.
Rashmi, V., 2011. A Review of the Physiological Implications of Antioxidants in
Food. Degree. Worcester Polytechnic Institute.
Rates, S. M. K., 2001. Plant as source of drugs. Toxicon, 39(2001), pp. 603-613.
Raymond, C. and George, N., 2015. Natural Products Chemistry. New York: CRC
Press.
Ruma, K., Sunil, K. and Prakash, H. S., 2013. Antioxidant, Anti-inflammatory,
Antimicrobial and Cytotoxic properties of Fungal Endophytes from Garcinia
species. International Journal of Pharmacy and Pharmaceutical Sciences. 5(3), pp.
0975-1491.
Sahu, K., Siddiqui, S., Iram, F. and Siddiqui, A. A., 2014. Role of Natural
Products in Drug Discovery Process. International Journal of Drug Developement
and Research, 6(2), pp. 172 -204.

115
Sam, R. Z., 2008. Plant Terpenoids: Application and future potentials.
Biotechnology and Molecular Biology Reviews. 3(1), pp. 1-7
Sarawut, J., 2014. Xanthones from Mangosteen (Garcinia mangostana): Multi-
targeting Pharmacological properties. PhD. Phramongkutklao College of
Medicine.
Sarker, S. and Nahar, L. eds., 2012. Natural Products Isolation. 3rd
. New York:
Humana Press.
Satyanshu, K., Shelly, S. and Sunil, K. C., 2013. The potential health benefit of
polyisoprenylated benzophenones from Garcinia and related genera:
Ethnobotanical and therapeutic importance. Fitoterapia, 89, pp. 86-125.
Scott, B., Petr, P., Ugene, P. M., Hui, Y., Elizabeth, T. R., Marharet, J. B.,
Weinstein, I. B. and Edward, J. K., 2004. Bioactive Benzophenones from
Garcinia xanthochymus Fruits. Journal of Natural Product, 68(3), pp. 354-360.
Scott, F., Allen, M. D., Robert, W., Godley, M. D., Joshua, M., Evron, M. D.,
Amer, H. and Thomas, M. D., 2014. Acute Necrotizing Eosinophilic Myocarditis
is a Patient Taking Garcinia Cambogia Extract Successfully Treated with High-
Dose Corticosteroids. Canadian Journal of Cardiology, 30(12), pp. 1732-1733.
Siridechakorn, I., Phakhodee, W., Ritthiwigrom, T., Promgool, T., Deachathai, S.,
Cheenpracha, S., Prawat, U. and Laphookhieom, S., 2012. Antibacterial
dihydrobenzopyran and xanthone derivatives from Garcinia cowa stem barks.
Fitoterapia, 83(8), pp. 1430-1434.
Siti, H. A. H., Jeffrey, R. F. and Mohd, F. A. B., 2013. Phytochemicals Content,
Antioxidant Activity and Acetylcholinesteras Inhibition Properties of Indigenous
Garcinia parvifolia Fruit. Egypt: Hindawi Publishing Corporation.
Sonia, V. D. S., 2006. Studies in the Chemistry of Fungal Natural Products. PhD.
University of Canterbury.

116
Stephen, A. A. and Peter, G. W., 1986. Xanthones from three Garcinia species.
Phytochemistry, 25(10), pp. 2351-2355.
Stoia, M. and Oancea, S., 2011. Natural vs. Synthetic Antioxidants in Digesting
Healthy Edible Oils. Romania: Department of Agricultural Sciences.
Su, X., Zhang, M., Li, L., Huo, C., Gu, Y. and Shi, Q., 2008. Chemical
constituents of the plants of the genus Calophyllum. Chemistry and Biodiversity,
5(12), pp. 2579-2608.
Subhash, P., Aamir, A., Nikhil, O. and Fazlul, H. S. 2009. Emerging role of
Garcinol, the antioxidant chalcone from the Garcinia indica Choisy and its
synthetic analogs. Journal of Hematology and Oncology, 38, pp. 2-38.
Sunit, S., Narisara, S., Wong, P., Janthana, T., Piniti, R., Nitirat, C. and Apichart,
S., 2003. Antimycobacterial Activity of Prenylated Xanthones from the Fruits of
Garcinia Mangostana. Chemical and Pharmaceutical Bulletin, 51(2), pp. 857-859.
Surat, L., John, K.S., Rattana, K. and Kan, C., 2006. Cytotoxic and Antimalarial
Prenylated Xanthones from Cratoxylum cochinchinese. Chemical and
Pharmaceutical Bulletin, 52(5), pp. 745-747.
Taher, M., Idris, M. S. and Arbain, D., 2007. Antimicrobial, antioxidant and
cytotoxicity activities of Garcinia eugenifolia and Calophyllum enervosum.
Iranian Journal of Pharmacology & Therapeutics, 6(1), pp. 93-98.
Tang, W. P., Pan, M. H., Sang, S. M., Li, S. M. and Ho, C. T., 2013. Garcinol
from Garcinia indica: Chemistry and Health Beneficial Effects. Tropical and
Subtropical Fruits: Flavours, Color and Health Benefits, 8, pp. 133-145.
Tao, S., Li, W., Wang, Y. Y. and Lou, H. X., 2013. Antiproliferative activities of
Garcinia bracteata extract and its active ingredients, isobractatin, against human
tumor cell lines. Pharmacal Research, 37(3), pp, 013-196.

117
Traditional medicine strategy launched. (WHO News). 2002, 80, pp.610-611
Tsuda, Y., 2004. Isolation of Natural Products. PhD. University of Karachi.
Vanessa, S. G., Thiago, C. S., Isael, A. R., Marisi, G. S. and Wagner, V., 2011.
Isolation and evaluation of the antioxidant activity of phenolic constituents of the
Garcinia brasiliensis epicarp. Food chemistry, 132(3), pp. 1230-1235.
Vatcharin, R., Wanpen, N., Soulwalak, P., Nongporn, H. T. and Katesarin, M.,
2006. Phloroglucinols, depsidones and xanthones from the twigs of Garcinia
parvifolia. Tetrahedron, 62(6), pp. 8578 – 8585.
William, P. J. and Douglas, K. A., 2012. Extraction of Plant Secondary
Metabolites. Natural Product Isolation. London: Humana Press.
Wong, K. M., Lee, L.W., Sugumaran, M. and Samy, J., 2009. Herbs of Malaysia:
an introduction to the medicinal, culinary, aromatic and cosmetic use of herbs.
Malaysia: Marshall Cavendish Editions.
Xia, Z. X., Zhang, H., Xu, D. Q., Lao, Y. Z., Fu, W. W., Tan, H. S., Cao, P., Yang,
L. and Xu, H. X., 2015. Xanthones form the leaves of Garcinia cowa induce cell
cycle arrest, apoptosis, and autophagy in cancer cells. Molecules, 20, pp. 11387-
11399.
Xu, J. Y., Chiang, Y. P., Lai, H. Y., Vittal, J. J., Wu, H. X., Tan, H. K. B.,
Imiyabir, Z. and Goh, H. S., 2000. Cytotoxic Prenylated Depsidones from
Garcinia parvifolia. Journal of Natural Product, 63, pp. 1361 – 1363.
Zhang, H., Zheng, D., Li, H. H., Wang, H., Tan, H. S. and Xu, H. X., 2016.
Diagnostic filtering to screen polycyclic polyprenylated acylphloroglucinols from
Garcinia oblongifolia by ultrahigh performance liquid chromatography coupled
with ion mobility quadrupole time-of-flight mass spectrometry. Analytica Chimica
Acta, 912, pp. 85-96.