
Gandra_2010
152
Departamento de Engenharia Mecânica e Industrial Preliminary Study on the Production of Functionally Graded Materials by Friction Stir Processing Por João Pedro Machado da Gandra Dissertação apresentada na Faculdade de Ciências e Tecnologia da Universidade Nova de Lisboa para obtenção do grau de Mestre em Engenharia Mecânica Orientador: Professora Doutora Rosa Maria Mendes Miranda Co-orientador: Professor Doutor Pedro Miguel dos Santos Vilaça da Silva Lisboa 2010
-
Upload
nilanjan-chaudhuri -
Category
Documents
-
view
188 -
download
1
Transcript of Gandra_2010

Departamento de Engenharia Mecânica e Industrial
Preliminary Study on the Production of Functionally Graded Materials by Friction Stir Processing
Por
João Pedro Machado da Gandra
Dissertação apresentada na Faculdade de Ciências e
Tecnologia da Universidade Nova de Lisboa para obtenção do
grau de Mestre em Engenharia Mecânica
Orientador: Professora Doutora Rosa Maria Mendes Miranda
Co-orientador: Professor Doutor Pedro Miguel dos Santos Vilaça da Silva
Lisboa
2010


Dedico este trabalho aos meus pais João e Rosário, à minha irmã Marta
e à minha querida Andreia.

i
Sumário
A presente investigação teve como objectivo avaliar a potencial aplicação da
tecnologia de processamento por fricção linear (PFL) para fabricar materiais com
gradiente de funcionalidade (FGM‟s).
Materiais processados superficialmente por fricção linear apresentam uma
mudança gradual de microestrutura e de propriedades mecânicas, podendo ser
considerados materiais com gradiente de funcionalidade. Com o objectivo de
manipular a dureza e ductilidade numa camada superficial geraram-se áreas
sobrepondo cordões sucessivos de material processado. Variou-se o sentido de
sobreposição de modo a estudar potenciais diferenças no comportamento mecânico
das superfícies produzidas. A topografia da superfície processada depende da
direcção de sobreposição, tendo-se observado que sobrepondo pelo lado em avanço,
gera-se uma superfície com um perfil ondulado.
Os mecanismos envolvidos no processamento por fricção linear levaram ao
seu recente desenvolvimento na área da produção de compósitos de matriz metálica,
já que o fluxo visco-plástico característico deste processo promove a dispersão e
distribuição de partículas de reforço. Investigou-se a produção de materiais com
gradiente de funcionalidade através do reforço de uma liga de alumínio AA5083 (H111
e parcialmente recozida) com partículas cerâmicas de carboneto de silício de
diferentes granulometrias. Testaram-se diversos métodos de reforço e a sua influência
na distribuição das partículas, estando os melhores resultados associados ao
processamento directo do canal pelo pino. Observaram-se dois gradientes ortogonais
com base na análise de fracção de área de SiC. Tendo em conta que se efectuou um
processamento superficial, a magnitude das transformações microestruturais irá
decrescer ao longo da espessura. Foi descoberto um segundo gradiente paralelo à
superfície do cordão derivado à natureza assimétrica do escoamento de material em
torno da ferramenta. A utilização de reforços de granulometria mais fina leva à geração
de camadas mais homogéneas e gradientes mais suaves. O acentuado desgaste da
ferramenta provou que a utilização de partículas de SiC como reforços não é a forma
mais eficiente para a produção de compósitos com gradiente de funcionalidade,
considerando os materiais de ferramenta usados.

ii
Abstract
An investigation was carried out to evaluate the potential application of Friction
Stir Processing (FSP) to produce Functionally Graded Materials (FGM‟s).
Friction stir processed materials can be considered as FGM‟s since the
localized microstructural modification results in a gradual property modification.
Therefore, to enhance hardness and ductility at specific superficial levels, surface
layers of processed material were produced by multiple-pass FSP with an overlap ratio
of 0.5. Overlapping was done on the advancing (AS) and retreating sides (RS) to study
potential differences on the resulting mechanical properties. It was observed that
processing in these two conditions led to different surface topography, since
overlapping by the advancing side resulted in a wave-like surface profile.
The mechanisms involved in FSP also led to its exploitation for the production
of particle-reinforced Metal Matrix Composite (MMC) materials, as the severe plastic
deformation produced during the process promotes the dispersion of the particles
within the matrix. An investigation was conducted in order to produce aluminium based
functionally graded MMCs reinforced by SiC ceramic particles with median size of
118.8, 37.4 and 12.3 micron. AA5083 aluminium alloy plates in the H111 and partially
annealed conditions were processed. Several strategies for reinforcement were
investigated and its influence on the particle distribution and homogeneity. The most
promising results were achieved when the pin fully overlapped the groove. SiC fraction
area analysis revealed two orthogonal gradients. Since FSP was used as a surface
processing technique, the magnitude of the microstructural effects generated by the
tool gradually decreases along the depth of the processed material. A second gradient
was generated parallel to the bead surface due to the asymmetric nature of material
flow around the tool. The use of smaller sized particles led to more homogeneous
composite layers and smother gradients. Tool wear was very significant, proving that
SiC reinforcement is not the most suitable method to produce FGM‟s.

iii
Palavras-chave
Processamento por fricção linear
Materiais com gradiente de funcionalidade
Compósitos de matriz metálica
AA5083-H111
Carboneto de silício
Keywords
Friction stir processing
Functionally graded materials
Metal matrix composites
AA5083-H111
Silicon carbide

iv
Agradecimentos
Venho por este meio expressar a minha profunda gratidão à minha orientadora,
Professora Rosa Maria Mendes Miranda, por me ter convidado para integrar um
projecto tão desafiante e pioneiro no seio de um grupo tão experiente. Agradeço
também todo o seu empenho e interesse.
Um sincero obrigado ao meu co-orientador, Professor Pedro Miguel dos Santos
Vilaça pelo seu apoio a nível técnico e pessoal, tempo investido e equipamento. Não
posso deixar de agradecer a forma calorosa como fui recebido e integrado no seu
grupo de trabalho iStir, bem como toda a confiança que depositou em mim.
Agradeço ao Professor Alexandre José da Costa Velhinho por ter cedido
materiais, consumíveis, equipamento e ajuda fundamental para o desenvolvimento
deste trabalho. Não posso esquecer o seu apoio durante a minha prestação no 11th
International Symposium on Multiscale, Multifunctional and Functionaly Graded
Materials, 26-29 Setembro de 2010, Guimarães, Portugal.
O autor reconhece a imensa importância do financiamento garantido pela
Fundação para a Ciência e Tecnologia para o projecto “Desenvolvimento da tecnologia
de processamento por fricção linear para produzir materiais com gradiente de
funcionalidade e melhoria de superfícies para aplicações avançadas de engenharia –
FRISURF” (PTDC/EME-TME/103543/2008).
O especial agradecimento aos Srs. António Guinapo Campos e Paulo M. G.
Magalhães por toda a sua assistência a preciosa amizade.
Gostaria de agradecer ao Mestre Valentino Cristino por toda a sua ajuda
prestada durante o trabalho experimental decorrido na STM-IST.
O meu profundo obrigado à Mestre Catarina Vidal pela ajuda prestada durante
a fase de concepção de ferramentas, mas especialmente por todo o seu apoio e
amizade.
Expresso também o meu apreço pelo Sr. João Luís por um excelente trabalho
de produção das ferramentas e de outros componentes projectados.
Aos meus colegas e futuros Mestres Rúben Ramalhais, Luís Santos, Luís
Alberty Vieira, João Faria, César Soares e Paulo Teixeira, entre muitos outros,
expresso a minha profunda consideração pela forte amizade que se desenvolveu ao
longo destes 5 anos e todo o apoio sistemático durante a realização deste trabalho.

v
Acknowledgements
I would like to express deep gratification to my supervisor, Professor Rosa
Maria Mendes Miranda, for inviting me to join such a challenging project, giving me the
opportunity to work in the development of a state of the art technology with such a
talented group of people. Honest thanks for all the commitment and personal interest.
A sincerely thanks to Professor Pedro Miguel dos Santos Vilaça da Silva for
providing equipment, crucial technical support and time invested, but also for his warm
welcome within the iStir work group and for all his confidence.
The author would also like to express his gratitude to Professor Alexandre José
da Costa Velhinho for materials, equipment, valuable assistance in result discussion
and especially for his support during the 11th International Symposium on Multiscale,
Multifunctional and Functionaly Graded Materials, 26-29 September 2010, Guimarães,
Portugal.
The author acknowledges FCT/MCTES funding for the project „Technology
developments of Friction stir processing to produce functionally graded materials and
improve surfaces for advanced engineering applications - FRISURF‟ (PTDC/EME-
TME/103543/2008).
Thanks to Mr. António Guinapo Campos and Mr. Paulo M. G. Magalhães for
their assistance and close friendship.
My sincere appreciation to MSc. Valentino Cristino for all his help concerning
the experimental work performed at Secção de Tecnologia Mecânica, Instituto Superior
Técnico.
Honest thanks to MSc. Catarina Vidal for the help regarding tool design and
especially for her friendship.
The author expresses his appreciation to Mr. João Luís for an excellent job in
tool manufacturing.
To future MSc. Rúben Ramalhais, Luís Santos, Luís Alberty Vieira, João Faria,
César Soares, Paulo Teixeira and many others colleagues, the author expresses deep
appreciation for the strong friendship and support provided during this work.

vi
Contents
Sumário ........................................................................................................................ i
Abstract ....................................................................................................................... ii
Palavras-chave ........................................................................................................... iii
Keywords ................................................................................................................... iii
Agradecimentos ......................................................................................................... iv
Acknowledgements .................................................................................................... v
Contents ..................................................................................................................... vi
Table Index ............................................................................................................... viii
Figure Index ............................................................................................................... ix
Abbreviations and Symbols .................................................................................... xiv
1. Introduction .......................................................................................................... 1
1.1. Motivation ...................................................................................................................... 1
1.2. Objectives ...................................................................................................................... 2
1.3. Structure ........................................................................................................................ 3
2. State of the art...................................................................................................... 4
2.1. Friction stir processing .................................................................................................. 4
2.1.1. Processed zone ..................................................................................................... 6
2.1.2. Property enhancement .......................................................................................... 8
2.1.3. Process parameters ............................................................................................ 12
2.1.4. Multiple-pass friction stir processing ................................................................... 15
2.1.5. Composite manufacturing ................................................................................... 17
2.2. Functionally graded materials ..................................................................................... 19
2.3. Conclusion ................................................................................................................... 22
3. Experimental set-up........................................................................................... 23
3.1. Materials characterization ........................................................................................... 23
3.2. Equipment ................................................................................................................... 24
3.3. Tool design .................................................................................................................. 26
3.4. Fixturing system .......................................................................................................... 28
3.5. Testing description ...................................................................................................... 29
3.5.1. Surface modification by multiple-pass friction stir processing ............................. 29
3.5.2. SiC reinforced surface composite ....................................................................... 31
3.6. Characterization techniques ........................................................................................ 36
3.6.1. Metallography ...................................................................................................... 36
3.6.2. SEM/EDS ............................................................................................................ 37
3.6.3. Image processing ................................................................................................ 37

vii
3.6.4. Hardness testing .................................................................................................. 39
3.6.5. Bend testing ......................................................................................................... 40
4. Results and discussion ..................................................................................... 43
4.1. Base material ............................................................................................................... 43
4.2. Silicon carbide reinforcement particles........................................................................ 48
4.3. Surface modification by multi-step friction stir processing .......................................... 50
4.3.1. Macroscopic characterization .............................................................................. 50
4.3.2. Microscopic characterization ............................................................................... 52
4.3.3. Hardness testing .................................................................................................. 61
4.3.4. Bend testing ......................................................................................................... 62
4.3.5. Conclusions ......................................................................................................... 66
4.4. SiC reinforced surface composites .............................................................................. 67
4.4.1. Macroscopic characterization .............................................................................. 67
4.4.2. Microscopic characterization ............................................................................... 75
4.4.3. SEM and EDS ..................................................................................................... 96
4.4.4. Image processing .............................................................................................. 101
4.4.5. Hardness testing ................................................................................................ 103
4.4.6. Conclusions ....................................................................................................... 108
5. Final conclusions and suggestions for future work ...................................... 110
6. References ....................................................................................................... 112
Annexes ........................................................................................................................ i
A1 – Technical drawing of FSP tool assembly with cylindrical pin ......................................... ii
A2 – Technical drawing of the tool Body ............................................................................... iii
A3 – Technical drawing of Ø7 shoulders .............................................................................. iv
A4 – Technical drawing of Ø7 threaded cylindrical pin ......................................................... v
A5 – Technical drawing of Ø9 shoulders .............................................................................. vi
A6 – Technical drawing of Ø9 conical pins .......................................................................... vii
B – Tool nomenclature ........................................................................................................ viii
C – Sample extraction ........................................................................................................... x
D1 – Technical drawing of bend testing experimental set-up ............................................... xi
D2 – Technical drawing of the former base ......................................................................... xii
D3 – Technical drawing of the shaft .................................................................................... xiii
D4 – Technical drawing of the former ................................................................................. xiv
E1 – Multiple-pass FSP surfacing procedure ....................................................................... xv
E2 – SiC reinforcement by FSP procedure ......................................................................... xvi
E3 – Metallography samples preparation procedure ......................................................... xvii
E4 – Three point bend testing procedure .......................................................................... xviii

viii
Table Index
Table 2.1 - Key benefits of friction stir welding and friction stir processing [2, 3, 7]. ...... 5
Table 3.1 - AA5083 aluminium alloy chemical composition [72]. ................................. 23
Table 3.2 - AA5083 aluminium alloy physical properties [72]. ..................................... 23
Table 3.3 - AA5083-H111 alloy mechanical properties [72]. ........................................ 23
Table 3.4 - SiC particles granulometry analysis results by LALLS [75]. ....................... 24
Table 3.5 – Trial group I description. Influence of overlapping mode in multiple-pass
FSP. ........................................................................................................................... 29
Table 3.6 – Process parameters used for multiple-pass FSP in AA5083-H111. .......... 30
Table 3.7 - Trial group II description. Positioning of the groove relatively to pin center.
Dimensions (mm). ....................................................................................................... 32
Table 3.8 - Trial group III description. Study of channel closing by FSP. ..................... 32
Table 3.9 - Trial group IV description. Effect of material condition and SiC particle size
on reinforcement distribution. ...................................................................................... 33
Table 3.10 - Trial group V description. Bead on plate test samples. ............................ 33
Table 3.11 - Process parameters used for SiC reinforced surface composite production
in commercial 5083-H111 and partially annealed 5083. .............................................. 34
Table 4.1 - Micrographs of AA5083-H111 base material along all rolling directions. (A)
Section perpendicular to rolling direction..................................................................... 44
Table 4.2 - Micrographs of partially annealed AA5083-H111 along all rolling directions.
(A) Section perpendicular to rolling direction ............................................................... 45
Table 4.3 - Base material hardness measurements. ................................................... 46
Table 4.4 - Scanning electron microscopy analysis (SEM) of SiC particles used. Small
and large magnification [69] ........................................................................................ 49
Table 4.5 - Silicon carbide particles chemical analysis by X-ray fluorescence (XRF). . 49
Table 4.6 – Cross views of processed surface when overlapping by the advancing side
(a) and by the retreating side (b). ................................................................................ 51
Table 4.7 - Macrographs of bead cross section of trial group II ................................... 69
Table 4.8 - Macrographs of bead cross section of trial group III .................................. 70
Table 4.9 - Macrographs of bead cross section of trial group V ................................... 71
Table 4.10 – Macrographs of bead cross section of trial group IV. .............................. 72
Table 4.11 - Illustration of channel deformation........................................................... 85
Table 4.12 – Comparison between several SiC reinforced surface layers on the
retreating side for trial group IV. .................................................................................. 93
Table 4.13 - SiC particle distribution within the nugget region for trial group IV ........... 94
Table 4.14 - SiC fraction area results along bead cross-section ................................ 102

ix
Figure Index
Figure 2.1 - Schematic representation of friction stir welding [7].................................... 4
Figure 2.2 - A typical macrograph showing various microstructural zones in FSP
AA7975-T651 [7]. .......................................................................................................... 6
Figure 2.3 - Grain size distribution chart of the ultrafine grained microstructure in FSP
AZ31 alloys [10]. ........................................................................................................... 6
Figure 2.4 - Microstructure of thermo-mechanically affected zone in FSP 7075Al [7]. ... 7
Figure 2.5 - Tensile properties of AZ19D magnesium alloy [15]. ................................... 9
Figure 2.6 – Micro-hardness profile of nugget section in as-received AZ61 alloy [17]. .. 9
Figure 2.7 - Variation of (a) elongation and (b) flow stress with initial strain rate for
extruded and FSP Al-Mg-Sc alloys [19]....................................................................... 10
Figure 2.8 - Longitudinal cross-sectional views of fatigue failed sample near to fracture
tip: (a) as-cast (40 MPa) and (c) FSP (95 MPa). FSP processing of cast Mg-9Al-1Zn
alloy [23]. .................................................................................................................... 11
Figure 2.9 - Interface between as-cast (left) and processed zone (right) for the FSP of
cast Al-7Si-0.6Mg alloy [24]. ....................................................................................... 11
Figure 2.10 - Cause and effect diagram [27]. .............................................................. 13
Figure 2.11 - Threaded tool pin shaped as a frustum. WhorlTM [7]. .............................. 14
Figure 2.12 - Tool geometries patented by TWI [41-42]. ............................................. 14
Figure 2.13 - Examples on shoulder geometries [44]. ................................................. 15
Figure 2.14 - (a) Macro image of FS processed 7075 Al after 4 passes. (b)–(d) TEM
micrographs showing grain structures in the middle layer of pass „1‟ (b), overlap
between pass „1‟ and pass „2‟ (c) and pass „2‟ (d) of the processing nugget as indicated
by the regions 1–3 in (a) [46]. ..................................................................................... 15
Figure 2.15 - Tensile properties of various microstructural zones in 5-pass FSP A356
sample as a function of distance from the 5th pass center [48]. .................................. 16
Figure 2.16 - Hardness profile of cross-section in the multi-pass FSP sample [49]. .... 16
Figure 2.17 - (a) Schematic of fabricated SMMNC, (b) cross-sectional microstructure
(OM), (c) interface microstructure (OM), (d) surface nanocomposite microstructure
(SEM) and (e) Al2O3 clusters within nanocomposite layer [51]. .................................. 17
Figure 2.18 – Macrographs of FSP zones fabricated with circular probe tools at 1500
rev min-1 rotational speed. (a) top view of surface for pin 3 mm in diameter, (b) top view
of surface for pin 7 mm in diameter pin, (c) cross section view [53]. ........................... 18
Figure 2.19 - Change in the rate of wear with sliding distance for as-received Al and
surface nano-composite layer produced by four FSP passes [60]. .............................. 19
Figure 2.20 - Continuously graded structure [63]. ....................................................... 20
Figure 2.21 - Microstructures of Al(356)-SiC FGMCC hollow cylinder fabricated by
horizontal centrifugal casting for several distances from the outer to inner periphery in
mm. ............................................................................................................................ 21
Figure 3.1 – Macroscopic appearance of silicon carbine particles used. 118.8 (A), 37.4
(B) and 12.3 μm (C) median sized. ............................................................................. 24
Figure 3.2 – ESAB LEGIOTM 3UL friction stir welding machine. Degrees of freedom
representation [76]. ..................................................................................................... 25
Figure 3.3 - iSTIRtool_v3 model views. (A) Model views and (B) section view.
1 – Tool body; 2 – Pin; 3 – Shoulder; 4 – Pin fixation screw; 5 – Shoulder fixation screw
................................................................................................................................... 26

x
Figure 3.4 - iSTIRtool_v3 tool version assembly. Pin and shoulder fastening (A) and
several tool geometry combinations (B-E). .................................................................. 27
Figure 3.5 - Cross section view of tool assembly with pin adjustment system. ............ 27
Figure 3.6 - Tool geometry used featuring a concave shoulder and a threaded
cylindrical pin. ............................................................................................................. 28
Figure 3.7 - Fixturing system. ...................................................................................... 28
Figure 3.8 – Variation of overlapping direction. A) Overlapping by the advancing side.
................................................................................................................................... 29
Figure 3.9 - Experimental setup for surface modification by multiple-pass friction stir
processing .................................................................................................................. 30
Figure 3.10 – Schematic representation of the grooves in A12-H composite production.
A) Overall view; B) Longitudinal side view; C) Transverse section. ............................. 31
Figure 3.11 - Test sample identification for the study of FGM'S by FSP. ..................... 34
Figure 3.12 – Step sequence in the production of aluminium surface composites by
friction stir processing of grooves packed with SiC. A) Channel milling; B) Tool path
alignment with groove direction; C) Tool positioning for test D12-H; D) Tool penetration
and dwell time for test D118-H; e) Experiment S12-H. ................................................ 35
Figure 3.13 - Leica DWI 5000 M inverted geometry microscope used for both
macroscopic and microscopic analysis. ...................................................................... 36
Figure 3.14 - Image processing vertical mapping. ....................................................... 37
Figure 3.15 - Example of 2048x1536 pixel resolution picture and particle identification.
................................................................................................................................... 38
Figure 3.16 - Image processing techniques. ............................................................... 38
Figure 3.17 - Mitutoyo HM-112 Vickers micro-hardness testing machine. ................... 39
Figure 3.18 - Vickers hardness profiles for multiple-pass friction stir processed
surfaces. ..................................................................................................................... 39
Figure 3.19 - Vickers hardness profiles for SiC reinforced surface composites. .......... 40
Figure 3.20 - Bend testing sample dimensions (mm). ................................................. 40
Figure 3.21 – Bending test representation (mm). ........................................................ 41
Figure 3.22 - Bending test experimental set-up. .......................................................... 41
Figure 3.23 – Designed components designed. .......................................................... 42
Figure 3.24 - Former base section view assembly. ..................................................... 42
Figure 4.1 – Energy dispersive x-ray spectroscopy (EDS) measurement location for
5083-H111 base material. ........................................................................................... 46
Figure 4.2 - EDS spectrum for position #1, as marked in Figure 4.1. .......................... 47
Figure 4.3 - EDS spectrum for position #2, as marked in Figure 4.1. .......................... 47
Figure 4.4 - EDS spectrum for position 3, as marked in Figure 4.1. ............................ 47
Figure 4.5 - Al-Mg phase diagram [80]. ....................................................................... 48
Figure 4.6 – Samples produced by multi-pass FSP. Trial group I. Overlapping by the
AS (A) and the RS (B). ................................................................................................ 50
Figure 4.7 – Detail of surfaces. Overlapping by the AS (A) and the RS (B). ................ 50
Figure 4.8 - Initial shear lip formation. (A) Tool plunge and (B) Shear lip..................... 51
Figure 4.9 – Microscopic detail of bead surface waviness. Overlap by the advancing
side (A) and by the retreating side (B). ........................................................................ 52
Figure 4.10 - Micrographs of several friction stir processed areas from the last
processed bead of sample OAS-H. (A) Homogenized nugget zone, (B) Thermo-
mechanically affected zone, (C) Heat affected zone, (D) Base material. ..................... 53

xi
Figure 4.11 – Not homogenized nugget. Detail from the last processed bead of sample
OAS-H. ....................................................................................................................... 54
Figure 4.12 - Nugget interface TMAZ in sample ORS-H. ............................................ 54
Figure 4.13 – Cross section micrographs of sample OAS-H last tracks. Trial group I. (A)
TMAZ, (B) not homogenised nugget, (C,E) nugget upper details, (D) overlapped nugget
interface, (F) Poor consolidation defects, (G) overlapped nugget, (H) TMAZ at the
nugget bottom. ............................................................................................................ 56
Figure 4.14 - Cross section micrographs of sample OAS-H middle tracks. Trial group I.
(A,D) Overlapped nugget upper detail, (B) overlapped nugget interface, (C) base
material, (E) TMAZ at the nugget bottom, (F,H) Poor consolidation defects, (G)
overlapped nugget. ..................................................................................................... 57
Figure 4.15 - Cross section micrographs of sample OAS-H first tracks. Trial group I.
(A) Overlapped nugget interface, (B) second nugget upper detail, (C) poor
consolidation cracks on the second overlapped nugget, (D,E) overlapped first nugget,
(F) base material, (G,H) TMAZ of the first nugget. ...................................................... 58
Figure 4.16 - Cross section micrographs of sample ORS-H first tracks. Trial group I.
(A) Base material, (B) HAZ, (C) TMAZ, (D) surface flashes, (E) TMAZ in nugget
bottom, (F,H) nugget interface, (G) second nugget. ................................................... 59
Figure 4.17 - Cross section micrographs of sample ORS-H last tracks. Trial group I.
(A) Not homogenised nugget, (B,C) Last nugget upper detail, (D) bead surface
striations, (G,E) TMAZ, (F,H) poor consolidation cracks. ............................................ 60
Figure 4.18 - Hardness profiles for sample OAS-H. Trial group I. ............................... 61
Figure 4.19 - Hardness profiles for sample ORS-H. Trial group I. ............................... 62
Figure 4.20 - Bend testing samples. Base material (BM); Processed surface tensile
solicitation (OAS1, ORS1) and compression (OAS2, ORS2). ..................................... 62
Figure 4.21 - Bend testing of sample OAS-H. Load vs. displacement plot. .................. 63
Figure 4.22 - Bend testing of sample OAS-H. Load vs. displacement plot. .................. 63
Figure 4.23 - Fracture surfaces of samples OAS1 and ORS1 (FSP surface tensile
solicitation). Overlapping by the AS (A) and RS (B). ................................................... 64
Figure 4.24 - Maximum force attained by FSP samples. Base material (BM); Processed
surface tensile solicitation (OAS1, ORS1) and compression (OAS2, ORS2). .............. 64
Figure 4.25 - Bending angle for maximum force. Base material (BM); Processed
surface tensile solicitation (OAS1, ORS1) and compression (OAS2, ORS2). .............. 65
Figure 4.26 - Fracture energy. Base material (BM); Processed surface tensile
solicitation (OAS1, ORS1) and compression (OAS2, ORS2). ..................................... 65
Figure 4.27 - Bead surface aspect of samples B-H (A), D12-H immediately after testing
(B), D12-H after cleaning (C). ..................................................................................... 67
Figure 4.28 – Top view of processed sample S12-H. .................................................. 67
Figure 4.29 - Shoulder wear. As received from manufacture (A) an after trials (B). ..... 68
Figure 4.30 - Bead surface aspect of samples D12-O (A), D35-O (B) and D120-O (C).
................................................................................................................................... 68
Figure 4.31 - Volume defects due to insufficient material flow for sample D118-O. Bead
surface view (A) and macrograph detail (B). ............................................................... 73
Figure 4.32 - Groove defect formation. Interrupted D12-H test. ................................... 74
Figure 4.33 - Interrupted D12-H test bead top view. .................................................... 74
Figure 4.34 – Cross section micrographs of sample D12-H. Trial group II. (A-D) Details
from superficial SiC reinforced layer produced at the retreating side, at bead center and

xii
at the advancing side. (E, G) Particle distribution within the nugget. (F) Detail of
rounded particles. (H) Cavity defects due to poor material flow consolidation. ............ 76
Figure 4.35 - SiC surface reinforcing process. Interrupted test sample similar to D12-H.
................................................................................................................................... 77
Figure 4.36 - SiC compact layer on the retreating side of sample D12-H. Trial group II.
(A) Micrograph of layer on the retreating side and (B) Bead top view. ......................... 77
Figure 4.37 - Particle agglomeration in pocket form in sample D12-H. Trial group II.
Large (A) and small (B) pockets. ................................................................................. 78
Figure 4.38 - Comet-like particle distribution in sample D12-H. Trial group II. (A) Overall
view, (B,D) material down flow, (C) surface reinforced layer. ...................................... 79
Figure 4.39 - Longitudinal micrographs of sample D12-H. Trial group II. (A,B)
Reinforced surface, (C,D) cavities, (E) Deepest particle concentration. ...................... 80
Figure 4.40 - Cross section macrograph of bead produced through the processing of a
channel packed with median size 12.3 µm SiC particles on the AS. Sample A12-H.
Trial group II. (A) Empty groove (dark-filter microscopy). ............................................ 81
Figure 4.41 - Cross section dark-filter macrograph of bead produced through the
processing of a channel packed with median size 12.3 µm SiC particles on the RS.
Sample R12-H. Trial group II. (A) SiC reinforced layer. ............................................... 81
Figure 4.42 - Longitudinal micrographs of sample A12-H. (A-C) Composite layer. Trial
group II. ...................................................................................................................... 82
Figure 4.43 - Longitudinal micrographs of sample R12-H. (A,B) Composite layer. Trial
group II. ...................................................................................................................... 83
Figure 4.44 - Cross section micrographs for sample A00-H. Trial group III. (A) Filled
groove. ....................................................................................................................... 83
Figure 4.45 – Cross section micrographs of sample R00-H. Trial sample III. (A) Groove
overall view, (B-C) groove surfaces, (D) diffusion bonding. ......................................... 84
Figure 4.46 – Cross section micrographs of sample S12-H. Trial group II. (A) Pockets
on the RS, (B) shear lip, (C) pocket of unmixed material, (D) Embedded particle
agglomeration. ............................................................................................................ 86
Figure 4.47 - Cross section micrographs of sample D37-H. Trial group IV. (A-D) Details
from superficial SiC reinforced layer produced at the retreating side, at bead center and
at the advancing side. (E-G) Particle distribution within the nugget. (H) Channel defect.
................................................................................................................................... 87
Figure 4.48 - Cross section micrographs of sample D118-H. Trial group IV. (A-E)
Details from superficial SiC reinforced layer produced at the retreating side, at bead
center and at the advancing side. (F,G) Particle distribution within the nugget. (H)
Channel defect. ........................................................................................................... 88
Figure 4.49 - Cross section micrographs of sample D12-O. Trial group IV. (A-E) Details
from superficial SiC reinforced layer produced at the retreating side, at bead center and
at the advancing side. (F-H) Particle distribution within the nugget. ............................ 89
Figure 4.50 - Cross section micrographs of sample D37-O. Trial group IV. (A-E) Details
from superficial SiC reinforced layer produced at the retreating side, at bead center and
at the advancing side. (F,G) Particle distribution within the nugget. (H) SiC particle
logged inside channel. ................................................................................................ 90
Figure 4.51 - Cross section micrographs of sample D118-O. Trial group IV. (A-D)
Details from superficial SiC reinforced layer produced at the retreating side, at bead
center and at the advancing side. (E-H) Particle distribution within the nugget............ 91
Figure 4.52- Tool steel inclusions along bead surface at the RS of sample D118-O. .. 92
xiii
Figure 4.53 - Cross section micrographs of sample B-H. Trial group V. (A) Not
homogenised nugget region, (B) homogenised nugget region, (C) surface striations,
(D,E) TMAZ, (F) base material. ................................................................................... 95
Figure 4.54 - Cross section micrographs of sample B-O. Trial group V. (A) Not
homogenised nugget region, (B) nugget centre, (C) surface striations, (D) TMAZ, (E)
poor consolidation, (F) base material. ......................................................................... 96
Figure 4.55 - SEM/EDS analysis to bead surface layer produced by the processing of
118.8 μm median size particles in AA5083-H111 aluminium substrate. ...................... 97
Figure 4.56 - EDS spectrum for position #1, as marked in Figure 4.55. ...................... 97
Figure 4.57 - EDS spectrum for position #2, as marked in Figure 4.55. ...................... 97
Figure 4.58 - SEM image of bead surface for sample D120-H at the RS (A) and AS (B).
................................................................................................................................... 98
Figure 4.59 - SEM image of nugget for sample D37-O. ............................................... 98
Figure 4.60 - SEM image of particle dispersion within the nugget of sample D12-H. ... 99
Figure 4.61 – SEM image of reinforced surface layer at bead center of sample D12-O.
Small (A) and big magnification (B). ............................................................................ 99
Figure 4.62 – SEM image of SiC particle agglomeration in pocket form. (A,B) Pocket
contents. ................................................................................................................... 100
Figure 4.63 – SEM image of Worm hole detail. Sample D118-H (A) and D118-O (B).
................................................................................................................................. 100
Figure 4.64 - Shear lip on de AS. Sample D37-H. ..................................................... 100
Figure 4.65 - Example of SiC composition gradients in MMC‟s produced with 12.3 µm
median size particles and H111 material condition. (A) Gradient directions and (B)
quantification. ........................................................................................................... 101
Figure 4.66 - Harness profile for test sample D12-H. ................................................ 103
Figure 4.67 – Superficial hardness measurements for test sample D12-H. A) x=-4
hardness profile on the retreating side. B) x=0 hardness profile on bead center. C) x=4
hardness profile on the advancing side. .................................................................... 104
Figure 4.68 - Surface x=4 Vickers hardness profile measurements for test sample .. 104
Figure 4.69 - Hardness profile for test sample D37-H. .............................................. 105
Figure 4.70 - Hardness profile for test sample D118-H. ............................................ 105
Figure 4.71 - Hardness profile for test sample B-H. .................................................. 106
Figure 4.72 - Hardness profile for test sample D12-O. .............................................. 106
Figure 4.73 - Hardness profile for test sample D37-O. .............................................. 107
Figure 4.74 - Hardness profile for test sample O118-O. ............................................ 107
Figure 4.75 - Hardness profile for test sample B-O. .................................................. 108

xiv
Abbreviations and Symbols
A Bend testing sample thickness
AS Advancing side
b Bend testing sample width
BM Base material
BSE Back-scattered electrons
dpin Pin Diameter
DR Dynamic recrystallization
EDS Energy dispersive X-ray spectroscopy
FGM Functionally graded material
FSP Friction stir processing
FSW Friction stir welding
HAZ Heat affected zone
HSS High speed steel
l Distance between pin centres
Lt Bend testing sample length
MMC Metal matrix composite
OR Overlap ratio
RS Retreating side
SE Secondary electrons
SEM Scanning electron microscopy
SiC Silicon carbide
SMMNC Surface metal matrix nano-composite
Tm Melting temperature
TMAZ Thermo-mechanically affected zone
TWI The welding institute

1
1. Introduction
1.1. Motivation
Most of the engineering applications subject structural components to service
conditions where mechanical loading may vary within the part. Therefore, component
optimization frequently requires the modification of the material‟s structure and
properties in order to increase its performance.
Functionally graded materials (FGM‟s) are a class of composite materials,
consisting of two or more phases, featuring a controlled spatial variation of its
composition and microstructure along at least one direction. The industrial interest in
FGM‟s is mainly related to the possibility of controlling the gradation of the physical
and/or chemical properties, through microstructural manipulation. Aluminium matrix
composites, for example, are advanced engineering materials developed for weight
critical application such as aerospace and automotive industries.
Powder metallurgy, sheet lamination and chemical vapour deposition are some
of the most common technologies used to manufacture functionally graded materials.
However, these processes are time consuming and expensive, precluding a
widespread use of such materials in mainstream engineering applications.
Friction stir processing is an emerging metal-working technique based on the
same fundaments as friction stir welding that allows local modification and control of
microstructures in near-surface layers, for the purpose of improving surface or in-
volume mechanical properties. Recently, FSP has been studied as a less expensive
and versatile process to produce surface composites, using its intense material stirring
to disperse reinforcements into a metal matrix. On the other hand, the intense and
relatively unpredictable nature of the visco-plastic material flow in the presence of
these dissimilar reinforcements, leads to irregular results and erratic distributions.
New reinforcing methods should be experimented to enable future applications
of functionally graded materials produced by friction stir processing.

2
1.2. Objectives
This thesis was conducted in the framework of a research project entitled
“Technology developments of friction stir processing to produce functionally graded
materials and improve surfaces for advanced engineering applications – FRISURF”
(PTDC/EME-TME/103543/2008) and founded by FCT/MCTES.
This study aimed at conducting a first research approach with the following
objectives:
1. Exploit the potential of FSP to produce functionally graded materials
either by multi-step friction stir processing surfacing or based on
aluminium composites reinforced by silicon carbide ceramic particles.
2. Modify material mechanical behaviour in a superficial layer.
3. Test several SiC reinforcement methods and their feasibility.
4. Investigate the effect of material condition and reinforcement size upon
the dispersions produced.
5. Assess material flow disturbance induced by the presence of
reinforcements.
6. Characterize mechanically and structurally the composites produced.
7. Develop the knowledge on material flow involved in FSP.
Due to timeline constraints inherent to an MSc thesis, the present work consists
of a preliminary investigation, as these ambitious objectives ultimately raised further
research work for future investigations.

3
1.3. Structure
The present work is structured to address two separate approaches to produce
FGM‟s.
Chapter 2 describes the current state of the art, addressing basic subject
definitions and establishing a theoretical framework for the subsequent result
interpretation. This section was divided in two main sections: Friction stir processing -
in which the basic concepts and physical principles of this process are described, as
well as, process parameters and some of the most important investigations concerning
property enhancement via conventional FSP; Functionally graded materials -
describing this class of materials, its conventional production methods and composite
manufacturing using FSP.
Chapter 3 depicts the experimental set-up and test planning. A brief description
of the base material and reinforcements is performed, as well as, the characterization
of the FSW equipment, tool design and fixture system used. Trial groups are listed.
Finally, the techniques and procedures used for surface characterization are
established.
Chapter 4 reports the results and discussion for all processing tests. This
section was divided in four main subjects, concerning the characterization of base
material, reinforcement particles, FSP surfacing and SiC reinforced surface
composites. Results obtained by metallography, SEM/EDS, image processing,
hardness and bend testing are presented, when applicable.
Main conclusions and proposals for future work developments and presented in
Chapter 5.

4
2. State of the art
2.1. Friction stir processing
Friction stir processing is a recently developed metalworking technology based
on the same basic principles as friction stir welding.
FSW was invented and patented by The Welding Institute in 1991 [1] and
represents an important breakthrough in the field of metal joining technology since it
allows to weld alloys that could not be easily welded by conventional fusion methods.
In some cases, friction stir welded joints have shown improved mechanical properties
in comparison with base material, leading to the development of friction stir processing
as an attempt to convert FSW into a new surface modification technique.
Friction stir processing is used for localized modification and control of
microstructures in near-surface layers of processed metallic components for specific
property enhancement [2]. It has proven to be an effective treatment to achieve major
microstructural refinement, densification and homogeneity at the processed zone, as
well as elimination of defects from the manufacturing process. Processed surfaces
have shown an improvement of mechanical properties, such as hardness and tensile
strength, better fatigue, corrosion and wear resistance [3]. On the other hand, fine
microstructures with equiaxed recrystallized grains improve superplasticity behaviour
[4-6].
A non-consumable rotating tool divided into a pin and a larger cylindrical body
or shoulder plunges into material until the shoulder presses the workpiece surface.
When the proper thermo-mechanical conditions (required for good material
consolidation) are achieved, the tool initiates its translation movement.
Figure 2.1 - Schematic representation of friction stir welding [7].

5
Plastic deformation imposed by tool pin and shoulder rotation, generates heat
which softens the material without reaching its melting point, making it possible to
move the pin along travel direction and the material around the pin. As it travels
forward, the workpiece material is moved from the front to the back of the pin, where it
is forged under shoulder pressure and consolidates into a processed bead, as seen in
Figure 2.1 [8].
Both FSW and FSP are considered to be environmentally friendly technologies
due to their energy efficiency and absence of shielding gas or filler material. Further
advantages of are summarized in Table 2.1.
Table 2.1 - Key benefits of friction stir welding and friction stir processing [2, 3, 7].
Metallurgical
benefits Technical benefits
Environmental
benefits Energy benefits
Solid state
process
Low distortion of
workpiece
No loss of
alloying elements
Excellent
metallurgical
properties at the
joint area
Fine
microstructure
Absence of
cracking
Depth of the
processed zone can
be adjusted simply
by changing the
length of the pin
Processing results
can be accurately
controlled by
optimizing tool
design and process
parameters
One-step technique
Replace multiple
parts joined by
fasteners
Good dimensional
stability and
repeatability
regardless of
atmospheric
conditions, worker‟s
experience and
number of parts to
produce
Automated process
No shielding gas
required
Eliminate
grinding wastes
Eliminate
solvents required
for surface
degreasing and
cleaning
Reduced noise
Consumable
materials saving,
such as rugs,
wire or other
gases
Low energy
consumption since
heat input comes
from friction and
plastic deformation
Improved
materials use
(e.g.. joining
different thickness)
allows reduction in
weight
Only 2.5% of the
energy needed for
a laser weld
FSW replaces
fastener use in the
joining of “non-
weldable” alloys
thereby reducing
the weight of
aircraft,
automotive or
ship, which leads
to a lower fuel
consumption

6
2.1.1. Processed zone
Through the analysis of macrographs and micrographs, it is possible to divide
the processed zone in aluminium alloys into three distinct zones (Figure 2.2), based in
microstructural characterization [2, 7, 9]. Process parameters and tool geometry have a
significant influence on microstructural evolution, thus determining post-processing
mechanical properties.
Figure 2.2 - A typical macrograph showing various microstructural zones in FSP AA7975-T651 [7].
The nugget or dynamically recrystallized zone is generated due to intense
plastic deformation at elevated temperatures (around 80% of melting temperature) able
to cause dynamic recrystallization, resulting in the generation of fine equiaxed grains of
0.1-12 µm at the stirred zone.
Chang et al. [10] succeed to produce ultrafine-grained microstructures with an
average grain size of 100-300 nm by processing an Mg-Al-Zn alloy with just a single
pass under effective cooling (Figure 2.3). The authors used a tool comprising a 10 mm
shoulder diameter and a pin with 3 mm diameter and 3 mm length at a transverse
speed of 28-33 mm/min, 1.5° tilt angle and 1200 rpm.
Figure 2.3 - Grain size distribution chart of the ultrafine grained microstructure in FSP AZ31 alloys [10].

7
There are some differences between the retreating and advancing side of the
tool, as seen in Figure 2.2. On the advancing side of the tool, the recrystallized zone
extends and the nugget presents a sharp appearance. In this region, the relative
velocity between tool and base material is higher due to the combination of tool rotation
and translation movement, leading to a more intense plastic deformation. According to
the general principles for dynamic recrystallization (DR), the increase in the degree of
deformation during FSW/FSP, results in a reduction of recrystallized grain size,
extending the fine-grain nugget region to the advancing side. Hardness is generally
higher than the area of thermo-mechanically affected zone, but typically lower than the
base material, whenever it is hardened by aging.
In the thermo-mechanically affected zone (TMAZ), the grain structure is
severely deformed at elevated temperatures, but the magnitude of strain deformation is
insufficient to cause full recrystallization. Studies show that although some new grain
nucleation is observed, microstructure remains elongated and deformed. This area is
characterized by elongated grains due to the generated flow around the nugget and a
precipitate dissolution caused by temperature exposure (Figure 2.4). The hardness of
thermo-mechanically affected zone is higher than the minimum measured for the heat-
affected zone. This may be due to the high density of dislocations and sub-boundaries
found in the grains caused by plastic deformation [11].
Figure 2.4 - Microstructure of thermo-mechanically affected zone in FSP 7075Al [7].
In the heat-affected zone (HAZ) grain structure remains unaltered. Although no
plastic deformation is experienced, this zone undergoes thermal exposure that exerts a

8
significant effect on precipitate structure. Precipitate coarsening and the increase of
precipitate-free zone in the heat-affected zone can be observed. Heat generation
during FSP causes some localized aging or annealing of the material. There is no
significant hardness variation from base material [12].
2.1.2. Property enhancement
Friction stir processing can be used to locally refine microstructures and
eliminate casting defects at selected locations, where property improvements could
enhance part performance or service life. Aluminium castings contain porosities,
segregated chemical compounds and inhomogeneous microstructures, which
contribute to property degradation.
Microstructural casting defects such as coarse precipitates and porosities
increase the likelihood of rupture due to the intragranular nucleation of micro-cracks
during material deformation. Precipitates are less capable of plastic deformation than
the matrix, so cavity nucleation is very frequent, whether caused by a disconnection
from the matrix or the rupture of precipitates. Friction stir processing allows the
breakage of large precipitates and their dispersion on a homogeneous matrix,
increasing material “tolerance” to withstand deformation. Mechanical properties such
as ductility, fatigue strength and formability, are enhanced. On the other hand, the large
number of small precipitates will increase the material‟s resistance to deformation and
hence its strength, as they will act as barriers to the movement of dislocations. A
uniform equiaxial fine grain structure is also essential to enhance material superplastic
behaviour. Friction stir processing generates fine microstructure and equiaxed
recrystallized grains which leads either to an increase in strain rate or a decrease in the
temperature at which superplasticity is achieved. Grain refinement induced by dynamic
recrystallization within the nugget contributes to the increase of hardness according to
the Hall-Petch equation.
In a study to examine the improvement of mechanical properties of aluminium
alloy castings by multi-pass FSP, Nakata et al. [13] accomplished to increase ADC12
die cast aluminium tensile strength by a factor of 1.7. Hardness of the processed
material was 20 HV higher than that of the base material. This increase in tensile
strength was attributed to the elimination of the casting defects such as porosity, a
homogeneous redistribution of finer Si particles and a significant grain refinement to 2–
3 µm. Santella et al. [14] investigated the use of friction stir processing to homogenise
hardness distributions in A319 and A356 cast aluminium alloys. Hardness and tensile
strength were increased relatively to base material.

9
Similar results were also reported in the friction stir processing of magnesium
based alloys. A.H. Feng and Z.Y. Ma et al. [15] combined FSP with subsequent aging
to enhance mechanical properties of Mg-Al-Zn castings Figure 2.5.
Figure 2.5 - Tensile properties of AZ19D magnesium alloy [15].
Chang et al. [10] obtained a significant improvement of mechanical properties
as the mean hardness measured at the ultrafine-grained zone reached approximately
120Hv (more than twice as high as base material). Rao et al. [16] observed that
processed zone hardness increased from 75 HV to 85 HV with a second pass fully
overlapping the first, due to the significant breakup and subsequent dispersion of
coarse eutectic silicon particles observed in a hypereutectic Al-30Si alloy. Xing-Hao et
al. [17] conducted a study in which a magnesium AZ61 alloy was friction stir processed
with a tool rotation speed of 1200 rpm, advancing speed from 25 to 30 mm/min and a
tilt angle of 1.5°, in combination with rapid heat sink. The recrystallized ultrafine grained
microstructure generated, led to a consequent increase in the mean micro hardness to
120-130 HV, almost three times higher than the base material, as shown in Figure 2.6.
Figure 2.6 – Micro-hardness profile of nugget section in as-received AZ61 alloy [17].
Several investigations have been conducted to study the enhancement of
superplasticity behaviour in friction stir processed alloys. In the FSP of Al-8.9Zn-2.6Mg-
0.09Sc, Charit and Mishra et al. [18] reported a maximum superplasticity of 1165% at a

10
strain rate of 3x10⁻² s-1 and 310°C with a grain size of 0.68 µm. More recently, F.C. Liu
and Z.Y. Ma et al. [19] produced a fine-grain microstructure of 2.6 µm sized grains by
applying FSP to extruded samples of an Al-Mg-Sc alloy, achieving a maximum
elongation of 2150% at a high strain rate of 1x10⁻¹ s-1 and a temperature of 450ºC
(Figure 2.7).
Figure 2.7 - Variation of (a) elongation and (b) flow stress with initial strain rate for extruded and FSP Al-
Mg-Sc alloys [19].
On another study [20], the same authors showed that a ultrafine-grained FSP
Al-Mg-Sc alloy with a grain size of 0.7 µm exhibited high strain rate superplasticity, for
a low temperature range of 200 to 300 °C with a single pass. For a strain rate of 3x10⁻²
s-1 at a temperature of 300 °C, a maximum ductility of 620% was achieved. However,
for a temperature of 350 °C, abnormal grain growth was observed, as grain size
increased and the samples no longer presented the existence of superplasticity, thus
confirming that grain size is essential for the existence of a superplastic behaviour.
García-Bernal et al. [21] conducted a study to evaluate the high strain rate
superplasticity behaviour during the high-temperature deformation of a continuous cast
Al-Mg alloy, having reported that the generation of a fine grain structure and the
breaking of cast structure led to a significant improvement in its ductility up to 800% at
530 ºC and a strain rate of 3x10⁻² s-1. More recently, Xiao et al. [22] managed to
produce fine-grained processed zones AA2219 with a grain size of 1 and 2.1 µm,
exhibiting a maximum ductility at 3 x 10⁻⁴ s-1 of 450% at 400 ºC and 400% at 425 ºC,
respectively, proving that finer grain structures result in enhanced superplastic
characteristics.
Several studies compared fracture mechanisms of fatigue-failed specimens for
both FSP and as-cast alloys. For example, Ni et al. [23] observed that crack nucleation
occurred preferentially within the coarse Mg17Al12 precipitates in the base material of a
cast Mg-Al-Zn alloy. Crack propagation stopped at the interface between precipitate

11
particles and base material, as shown by Figure 2.8. For the FSP sample, there were
no cracks observed near the failure site.
Figure 2.8 - Longitudinal cross-sectional views of fatigue failed sample near to fracture tip: (a) as-cast (40
MPa) and (c) FSP (95 MPa). FSP processing of cast Mg-9Al-1Zn alloy [23].
The fine-grained microstructure generated by FSP can also prevent fatigue
cracks initiation and propagation due to the barrier effect of grain boundaries. For
example, Jana et al. [24] friction stir processed a cast Al-7Si-0.6 Mg alloy, widely used
for its good castability, mechanical properties and corrosion resistance, but
characterized by poor fatigue properties. The authors managed to improve fatigue
resistance by a factor of 15 at a stress ratio of R min/ max 0 due to a significant
enhancement of ductility and a homogeneous redistribution of refined Si particles, as
seen in Figure 2.9.
Figure 2.9 - Interface between as-cast (left) and processed zone (right) for the FSP of cast Al-7Si-0.6Mg
alloy [24].
On another study, Sharma and Ma et al. [25] found that the intense plastic
deformation and material mixing featured in the FSP of A356 aluminium casting,
resulted in the significant breakage of primary aluminium dendrites and coarse Si
particles, creating a homogenous distribution of Si particles in the aluminium matrix and
eliminating casting porosity. This led to a significant improvement of ductility and

12
fatigue strength in 80%, proving that FSP can be used as a tool to locally modify the
microstructures in regions experimenting high fatigue loading.
2.1.3. Process parameters
As in friction stir welding, FSP parameters determine the amount of temperature
generation and plastic deformation, affecting the material flow around the non-
consumable tool, thus determining the results obtained. It is fundamental to know the
effect of each parameter in order to have a better control over the process. The most
important process parameters are:
Tool rotation rate:
As spindle speed rises, material plastic deformation becomes more intense,
increasing heat generation which enables more material mixing. Therefore it is
possible to achieve a greater grain size refinement, equiaxial grains, material
homogeneity and precipitate solution.
Traverse velocity:
Traverse velocity affects mainly the time of exposure to higher temperature
and material viscosity. Low welding speeds result in a large exposure time at
higher process temperatures.
Tool vertical force:
Apart from affecting process stability and weld surface finishing and
appearance, the axial force applied by tool shoulder to the workpiece is
essential to achieve a proper material consolidation and amount of plasticized
material. High axial force causes excessive heat generation and forging
pressure, obtaining grain growth and coarsening during cooling, while low axial
forces aren‟t able to achieve good material consolidation, due to insufficient
forging pressure and friction heating. Excessive force may also result in shear
lips or flashes with excessive height of the weld line on both the advancing and
retreating sides, causing metal thinning at the processed area and poor yield
and tensile properties.
Tilt angle:
This parameter defines the angle between the tool‟s axis and workpiece
surface. Used for smooth concave geometry shoulders, the setting of a suitable
tilting angle towards welding direction assures that the tool shoulder
mechanically entraps material more efficiently [26].

13
By using the Taguchi approach method, Lakshminarayanan et al. [27] evaluated
the mean percentage of contribution of FSW most influential process parameters on
the tensile strength of RDE-40 aluminium welded joints. This research determined a
41% contribution for rotational speed, 33% for traverse speed and 21% for axial force,
with a 5% error percentage. However, this statistical design does not take into
consideration the interaction amongst process parameters. A cause and effect diagram
was constructed to identify relevant process FSW process parameters (Figure 2.10).
Figure 2.10 - Cause and effect diagram [27].
The effect of the different process parameters has been widely documented by
several authors [28-35], but it is unanimous that plastic deformation and consequent
heat generation are essential to establish material flow and to achieve good
consolidation. Insufficient heating, caused by poor stirring (low tool rotational rates), a
high traverse speed or insufficient axial force, results in improper material consolidation
with consequent low strength and ductility. Raising heat generation will cause a greater
grain refinement, improving material properties. However, a very significant increase in
tool rotation rate, axial force or a very low transverse speed may result in a higher
temperature than desired, slower cooling rate or excessive release of stirred material,
resulting in property degradation.
Tool geometry, however, is the most important factor in FSP, as it determines
material flow. Geometrical features such as pin height and shape, thread shape and
direction, shoulder surface pattern and diameter, have a great influence on material
flow, heat generation and swept volume, determining final microstructure and
properties of the processed bead [36-40].

14
Figure 2.11 - Threaded tool pin shaped as a frustum. WhorlTM
[7].
The pin can be cylindrical or conical, flat faced, threaded or fluted to increase
the interface between the probe and plasticized material, thus intensifying plastic
deformation and heat generation (Figure 2.11 and 2.12).
Figure 2.12 - Tool geometries patented by TWI [41-42].
Shoulder profiles can be designed to improve the coupling between tool
shoulder and workpiece surface by using its texture to entrap plasticized material. This
way, the amount of plastic deformation produced by the shoulder is increased, resulting
in enhanced material mixing and higher quality welds [43]. Tool shoulders can be
concave, flat, convex, featuring grooves, ridges, scrolls or concentric circles as
depicted by Figure 2.13.

15
Figure 2.13 - Examples on shoulder geometries [44].
In friction stir processing, pin insertion depth becomes less relevant, as the goal
is to produce a thin fine-grained layer across a larger surface area. Pinless tools with
larger shoulder diameters are more adequate for friction stir processing, requiring less
passes and resulting in lower transverse forces. This enables faster travel speeds over
pin featured tools [44]. For example, Kang et al. [45] friction stir processed thin sheets
of AA5052-H32, with a tool comprising just a shoulder, producing microstructural
modifications at chosen locations that resulted in improved formability. The authors
also concluded that as tool diameter increased, formability was improved.
2.1.4. Multiple-pass friction stir processing
Multiple-pass FSP is required for the processing of large surface areas
composed by several overlapped beads. Full nugget interpenetration and similar test
conditions for each track are crucial to assure property homogenization and uniform
thickness layers.
To produce volume friction stir processed AA7075 thin plates, Jian-Qing Su et
al. [46] concluded that it was possible to process any desired size thin sheets by
running multiple overlapping passes, to a uniform ultrafine grained microstructure,
because grain size was found to be similar for various regions, as portrayed by Figure
2.14.
Figure 2.14 - (a) Macro image of FS processed 7075 Al after 4 passes. (b)–(d) TEM micrographs
showing grain structures in the middle layer of pass „1‟ (b), overlap between pass „1‟ and pass „2‟ (c) and
pass „2‟ (d) of the processing nugget as indicated by the regions 1–3 in (a) [46].

16
Johannes et al. [47] investigated the influence of multiple-pass in the FSP of
AA7075 alloy using a 42 % overlapping between consecutive beads. The authors
concluded that hardness and grain size remained approximately constant, not varying
between steps. However, multi-pass surfaces often presented a slightly lower ductility
than single pass samples. On another study, Ma et al. [48] used a 50 % overlapping in
a five pass FSP A356, observing a regular distribution of mechanical properties.
Multiple-pass FSP did not affect the dispersion of Si precipitates, which were uniformly
distributed in the entire processed zones. Nugget interface regions presented lower
strengths and ductility than the nuggets. The strength of the previous beads was lower
than that of the subsequent ones, as seen in Figure 2.15.
Figure 2.15 - Tensile properties of various microstructural zones in 5-pass FSP A356 sample as
a function of distance from the 5th pass center [48].
In the FSP of an aluminium die casting alloy, Nakata et al. [49] applied multiple-
pass to increase tensile strength to about 1.7 times that of the base material.
Processed layer hardness profile was uniform and about 20 Hv higher than that of base
material, as depicted in Figure 2.16.
Figure 2.16 - Hardness profile of cross-section in the multi-pass FSP sample [49].

17
2.1.5. Composite manufacturing
FSP has been recently investigated for composite manufacturing and there are
various reinforcing methods described in literature. Mishra et al. [50] were the first to
use FSP to manufacture SiC surface aluminium based composites. The SiC
reinforcements were mixed with a volatile solvent such as methanol and then applied to
plate surface. This coating was subsequently subjected to FSP, producing thin
composite layer with thickness between 50 to 200 µm with 13-27vol.-% of SiC.
However this pre-placed non-uniform thin layer seriously limited the reinforcement
quantity used. An innovative reinforcing technique was developed by B. Zahmatkesh et
al. [51] in the production of Al2O3 surface nanocomposite on AA2024 substrate.
Workpiece surface was coated with an Al-10% Al2O3 powder by air plasma spraying
and then subjected to FSP to disperse the reinforcements. The authors documented an
excellent bonding with the substrate and reinforcement penetration depth of about 600
µm (Figure 2.17). Micro-hardness increased from about 90 to 230 HV, while surface
friction coefficient and wear rate dropped.
Figure 2.17 - (a) Schematic of fabricated SMMNC, (b) cross-sectional microstructure (OM), (c) interface
microstructure (OM), (d) surface nanocomposite microstructure (SEM) and (e) Al2O3 clusters within
nanocomposite layer [51].

18
Apart from workpiece surface coating, other approaches feature the packing of
reinforcing materials in grooves along FSP direction to produce thick surface
composites. Lee et al. [52] produced Mg-SiO2 surface metal matrix nanocomposites
using a particle pre-placed method and observed particle clustering despite a
macroscopically uniform particle distribution. In a recent publication Mahmoud et al.
[53] succeeded to produce AA1050 aluminium alloy-based MMCs reinforced with SiC
particles using FSP. Particles were packed in 3 x 1.5 mm section machined grooves
covered by 2 mm thick aluminium sheet metal. The study was focused on the effect of
tool geometry and processing parameters such as: tool rotation and travel speeds.
Modified surfaces were obtained, however, there were significant channel like defects,
which deteriorate the surfaces and preclude its industrial use (Figure 2.18).
Figure 2.18 – Macrographs of FSP zones fabricated with circular probe tools at 1500 rev min-1
rotational
speed. (a) top view of surface for pin 3 mm in diameter, (b) top view of surface for pin 7 mm in diameter
pin, (c) cross section view [53].
Morisada et al. [54-55], reported the separate use of both multi-walled carbon
nanotubes and SiC particles as reinforcements in an AZ31 matrix by FSP, using a 1 x 2
mm section machined groove method. Friction stir processing produced a thick surface
composite layer of fine grained structure. Hardness measurements show an increase
to almost the double of base material due to both grain refinement and the
reinforcements. The effect of tool travelling speed on nanotubes distribution was
addressed.
Nitinol particles were used as reinforcements by Dixit et al. [56] in AA1100
based composites. Instead of grooves, the particles were loaded in four small 1.6 mm
diameter holes with 76 mm length, drilled 0.9 mm bellow the plate surface.
NiTi/AA1100 composites presented improved mechanical properties. Intermetallic-

19
reinforced aluminium matrix composite manufactured via FSP was investigated by
C.J.Hsu et al. [57-59], using powder mixtures of Al-Cu and Al-Ti. FSP generated Al2Cu
and Al3Ti intermetallic phases that enhanced material compressive strength, hardness
and Young‟s modulus. The volume fraction of the intermetallic phases reached as high
as 50% and their distribution in the matrix was homogenous. More recently, Shafei-
Zarghani et al. [60] used multiple-pass FSP to produce a superficial layer of uniformly
distributed nano-sized Al2O3 particles into an AA6082 substrate. Hardness was
increased three times over that of the base material. Wear testing revealed a significant
resistance improvement. Researchers also found that the increase of the number of
passes leads to more uniform alumina particle distributions. The nano-size Al2O3
powder was inserted inside a groove with 4 mm depth and 1 mm width, which was
closed by a tool with a shoulder and no pin.
Figure 2.19 - Change in the rate of wear with sliding distance for as-received Al and surface nano-
composite layer produced by four FSP passes [60].
2.2. Functionally graded materials
Functional Graded Materials (FGM‟s) are heterogeneous materials exhibiting a
controlled spatial variation of its chemical and/or structural features along at least one
direction. The property gradient in the material is caused by a position dependence of
the chemical composition, the microstructure or the atomic order [61]. FGM‟s are
distinguished from conventional composite materials by this characteristic continuous
change.
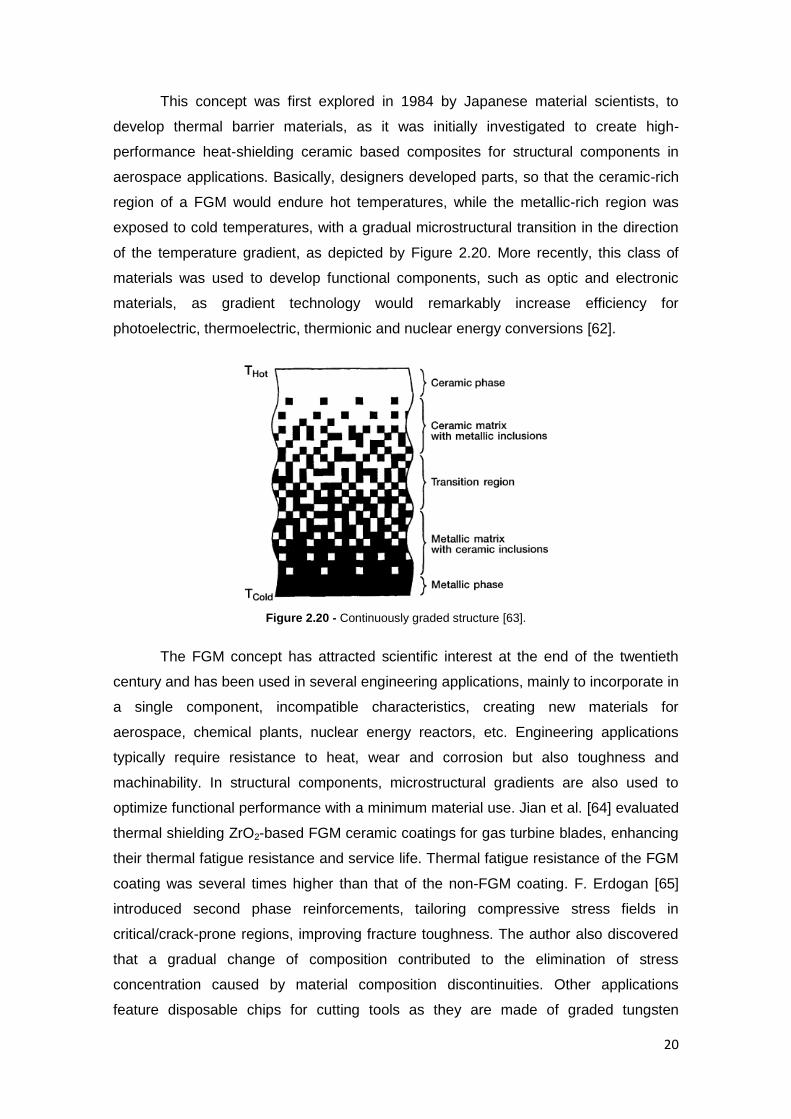
20
This concept was first explored in 1984 by Japanese material scientists, to
develop thermal barrier materials, as it was initially investigated to create high-
performance heat-shielding ceramic based composites for structural components in
aerospace applications. Basically, designers developed parts, so that the ceramic-rich
region of a FGM would endure hot temperatures, while the metallic-rich region was
exposed to cold temperatures, with a gradual microstructural transition in the direction
of the temperature gradient, as depicted by Figure 2.20. More recently, this class of
materials was used to develop functional components, such as optic and electronic
materials, as gradient technology would remarkably increase efficiency for
photoelectric, thermoelectric, thermionic and nuclear energy conversions [62].
Figure 2.20 - Continuously graded structure [63].
The FGM concept has attracted scientific interest at the end of the twentieth
century and has been used in several engineering applications, mainly to incorporate in
a single component, incompatible characteristics, creating new materials for
aerospace, chemical plants, nuclear energy reactors, etc. Engineering applications
typically require resistance to heat, wear and corrosion but also toughness and
machinability. In structural components, microstructural gradients are also used to
optimize functional performance with a minimum material use. Jian et al. [64] evaluated
thermal shielding ZrO2-based FGM ceramic coatings for gas turbine blades, enhancing
their thermal fatigue resistance and service life. Thermal fatigue resistance of the FGM
coating was several times higher than that of the non-FGM coating. F. Erdogan [65]
introduced second phase reinforcements, tailoring compressive stress fields in
critical/crack-prone regions, improving fracture toughness. The author also discovered
that a gradual change of composition contributed to the elimination of stress
concentration caused by material composition discontinuities. Other applications
feature disposable chips for cutting tools as they are made of graded tungsten

21
carbide/cobalt and titanium carbonitride to combine the desirable properties of high
machining speed, high feed rates and long service life. In civil engineering, structural
walls are being developed to combine both thermal and sound insulation with specific
strength, by grading material porosity and composition [66]. FGM‟s have also been
applied in the field of biomaterials, as graded hip prostheses and dental implants have
been successfully preformed [67].
A large variety of production methods has been developed such as: powder
metallurgy, sheet lamination, laser cladding, and chemical vapour deposition, to name
a few [68]. Among these methods, powder metallurgy is widely used to fabricate
metallic, as well as, ceramic FGMs. The critical problem in the processing of FGMs is
cracking and/or camber in the samples, which is due to the residual stresses caused by
mismatches in thermal expansion and sintering between the matrix and the
reinforcement in successive layers.
SiC reinforced aluminium based functionally graded materials are typically
produced by centrifugal casting. A. Velhinho et al. [69] describes centrifugal casting as
one of the most effective methods to produce SiC-Al FGM‟s. In this case, reinforcement
spatial distribution depends upon the momentum induced to each particle by the
centrifugal force applied during mould spinning. However, casting defects such as
voids and porosities often result in microstructural and composition discontinuities.
Figure 2.21 shows a SiC composition gradient produced by centrifugal casting of 356
cast aluminium alloys, as documented by Rajan et al. [70]. A maximum of 40-45% SiC
was observed in the periphery of the castings, reflecting in a hardness and wear
resistance increase. Dry sliding wear of aluminium alloys reinforced by SiC have also
been addressed by Vieira et al. [71].
Figure 2.21 - Microstructures of Al(356)-SiC FGMCC hollow cylinder fabricated by horizontal centrifugal
casting for several distances from the outer to inner periphery in mm.
(a) 1.5 mm; (b) 3.5 mm; (c) 5.5 mm [70].

22
2.3. Conclusion
Friction stir processing is a very promising metalworking technique with some
interesting capabilities, since it allows to local tailoring of mechanical properties by
microstructural modification. Though several authors have proven that it is possible to
manufacture metal matrix composites by friction stir processing, none have
documented a gradual or continuous distribution of mechanical properties or
composition, therefore never claiming the manufacturing of functionally graded
materials by friction stir processing.
FGM‟s are a new emerging class of advanced materials, very attractive for a
extensive range of engineering applications because they enable the design of different
functional performances within a part. Although this concept is in its early stage of
evolution, it has captured the interest of the scientific community, resulting into several
investigations and technology applications. However, the technologies used for FGM‟s
manufacturing are very expensive and time-consuming, limiting the use of such
materials to very selective engineering applications.

23
3. Experimental set-up
3.1. Materials characterization
In this investigation, a commercial AA5083 (AlMg 4.5 Mn 0.7) alloy was used as
base material, both cold hardened (H111) and partially annealed.
AA5083-H111 aluminium 1500x1000x8 mm plates were supplied by LANEMA,
who also provided mechanical, physical and chemical properties information for AA
5083-H111 in its technical catalogue [72], as summarized in Table 3.1 to 3.
Table 3.1 - AA5083 aluminium alloy chemical composition [72].
Chemical composition (weight %)
Si Fe Cu Mn Mg Cr Zn Ti+Zr Al
Min. 0.4 4 0.05
Max 0.4 0.4 0.1 1 4.9 0.025 0.25 0.15
Table 3.2 - AA5083 aluminium alloy physical properties [72].
Physical properties
Density 2.66 g/cm3
Modulus of elasticity 71000 MPa
Linear thermal expansion coef. (20°-100°C) 23.8x10⁻⁶
K-1
Thermal conductivity (20°C) 105-120 W/mK
Electric conductivity (20°C) 15-17 mS/m
Table 3.3 - AA5083-H111 alloy mechanical properties [72].
Mechanical properties
Ultimate tensile strength, UTS (MPa)
UTS0.2 (MPa) Brinell Hardness
min. max. min. 73
275 285 125
In order to stabilize the work hardened material, a partially annealing treatment
at 400ºC for 3.5h, followed by rapid quenching in water [73-74], was performed at
Secção de Tecnologia Mecânica, Instituto Superior Técnico, Universidade Técnica de
Lisboa.
Silicon carbide (SiC) exists in about 250 crystalline forms that can all be
described as diamond-type tetrahedral stacks of C-Si4 or Si-C4. Three different size
batches of β-SiC particles were used. This particular type of silicon carbide particles is
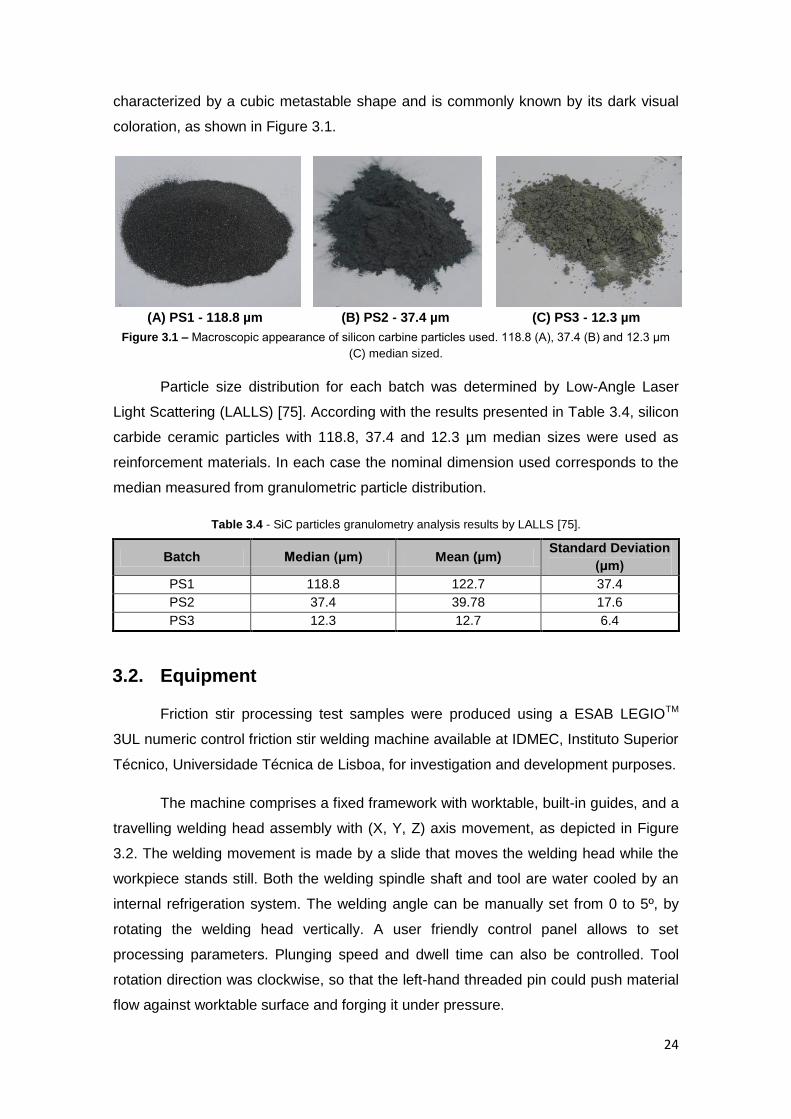
24
characterized by a cubic metastable shape and is commonly known by its dark visual
coloration, as shown in Figure 3.1.
(A) PS1 - 118.8 µm (B) PS2 - 37.4 µm (C) PS3 - 12.3 µm
Figure 3.1 – Macroscopic appearance of silicon carbine particles used. 118.8 (A), 37.4 (B) and 12.3 μm
(C) median sized.
Particle size distribution for each batch was determined by Low-Angle Laser
Light Scattering (LALLS) [75]. According with the results presented in Table 3.4, silicon
carbide ceramic particles with 118.8, 37.4 and 12.3 µm median sizes were used as
reinforcement materials. In each case the nominal dimension used corresponds to the
median measured from granulometric particle distribution.
Table 3.4 - SiC particles granulometry analysis results by LALLS [75].
Batch Median (μm) Mean (µm) Standard Deviation
(μm)
PS1 118.8 122.7 37.4
PS2 37.4 39.78 17.6
PS3 12.3 12.7 6.4
3.2. Equipment
Friction stir processing test samples were produced using a ESAB LEGIOTM
3UL numeric control friction stir welding machine available at IDMEC, Instituto Superior
Técnico, Universidade Técnica de Lisboa, for investigation and development purposes.
The machine comprises a fixed framework with worktable, built-in guides, and a
travelling welding head assembly with (X, Y, Z) axis movement, as depicted in Figure
3.2. The welding movement is made by a slide that moves the welding head while the
workpiece stands still. Both the welding spindle shaft and tool are water cooled by an
internal refrigeration system. The welding angle can be manually set from 0 to 5º, by
rotating the welding head vertically. A user friendly control panel allows to set
processing parameters. Plunging speed and dwell time can also be controlled. Tool
rotation direction was clockwise, so that the left-hand threaded pin could push material
flow against worktable surface and forging it under pressure.

25
Figure 3.2 – ESAB LEGIOTM
3UL friction stir welding machine. Degrees of freedom representation [76].
This equipment allows to control the FSP cycle by tool vertical position control
or by tool force control:
Upper tool position control – tool vertical position remains approximately
constant throughout the cycle, given the tool penetration set in the
welding parameters menu.
Upper tool force control – tool vertical position may vary as the tool force
set in the welding parameters remains constant.
To achieve the proper thermo-mechanical conditions for processing and tool
penetration depth, tool plunge and dwell time can be determined by position or tool
force control. Since tool plunge causes plate temperature to rise, the material becomes
softer and a deeper penetration is needed to reach the vertical force required to start
the cycle. A tool position control dwell time is more suitable because tool penetration
matches the proper depth at processing start and plunge force will be closer to the
force applied during processing. After dwell time, it is more advantageous to use a tool
force control in order to assure process parameter consistency between all trials.
Process parameters such as force, torque, tool position (X,Y,Z) and velocity can
be monitored in real time and recorded thanks to a data acquisition system installed.

26
3.3. Tool design
Tool geometry is a vital parameter for FSP. Although pin and shoulder
geometrical features define material flow, the tool body plays a very important role as
this component must bear the mechanical stress involved and dissipates heat
generated during the process.
A third version of the modular FSW welding tool developed at IST-UTL [77],
called iSTIRtool_v3, was used in this work (Figure 3.3).
Figure 3.3 - iSTIRtool_v3 model views. (A) Model views and (B) section view.
1 – Tool body; 2 – Pin; 3 – Shoulder; 4 – Pin fixation screw; 5 – Shoulder fixation screw
The pin and shoulder are fastened to the tool body, as depicted in Figure 3.4A.
By independently joining the shoulder and pin to the same tool body, this 3 module
assembly design allows to easily adjust pin length to the friction stir processing depth
desired, quick part replacement and several tool geometry combinations (Figure 3.4B-
E). Pin and shoulder rotation is locked by a set of screws.

27
Figure 3.4 - iSTIRtool_v3 tool version assembly. Pin and shoulder fastening (A) and several tool geometry
combinations (B-E).
The protruding pin length can be adjusted without disassembling the tool from
the FSW machine clamping system, simply by screwing or unscrewing the shoulder in
the body, between several multiple coincident positions between the holes of the
shoulder and the machined slots of the body (Figure 3.5). A rotation between two
consecutive positions leads to ±0.0833 mm increments of pin length. Thus, it is
possible to preserve the distance between the end of the pin and the worktable.
Figure 3.5 - Cross section view of tool assembly with pin adjustment system.
As shown in Figure 3.3B, the body and pin are hollow so that the cooling fluid
from the equipment refrigeration system can more effectively dissipate heat, thus
safeguarding its structural integrity.
The tool body was machined from DIN Ck45 steel, while the shoulder and pin
used a AISI H13 tool steel appropriate for high temperature application.
Several tools were designed and manufactured for FSP. However, due to the
limited time for this thesis, just some parts were used and the others are kept for further
developments within the research project. Annex A presents technical drawings of
several parts developed and manufactured during the current work. The same tool

28
combination was used in all test trials, comprising a Ø7 mm threaded cylindrical pin
and a Ø18 mm concave shoulder, as depicted in Figure 3.6 and in annex A3-4.
Figure 3.6 - Tool geometry used featuring a concave shoulder and a threaded cylindrical pin.
A 3 digit code system was created to more easily identify each component and
is presented in annex B.
3.4. Fixturing system
Since friction stir processing is essentially a mechanical process, the workpiece
plate must be strongly constricted to avoid plate warping. The fixturing system used
allows the processing of plates with a maximum width of 200 mm and a 350 mm
length. Two steel bars were bolted to a machined base plate by 2 screws each.
Constriction is given by 2 smaller screws that press down a group of plates, granting an
evenly distributed pressure along the workpiece. The base plate is bolted to the
worktable of the FSW equipment. Since there is no joint between plates, a vertical
fixture system is enough to constrict all degrees of freedom, producing quality
processed beads. All system elements were machined from DIN Ck45 steel.
Figure 3.7 - Fixturing system.

29
3.5. Testing description
3.5.1. Surface modification by multiple-pass friction stir processing
In order to produce a thin layer with distinct mechanical properties, surfaces
were generated by overlaying multiple consecutive beads of friction stir processed
beads. Two overlapping methods were used to investigate potential differences in the
outcome results in the processing of commercial AA5083-H111 plates with 200x200x8
mm. This particular investigation involved the tests described in Table 3.5.
Table 3.5 – Trial group I description. Influence of overlapping mode in multiple-pass FSP.
Main investigation:
I – Influence of overlapping mode in FSP surfacing
Test name Description Material
OAS-H Overlapping on the advancing side
AA 5083-H111
ORS-H Overlapping on the retreating side
Figure 3.8 – Variation of overlapping direction. A) Overlapping by the advancing side.
B) Overlapping by the retreating side.
The overlap ratio (OR) is a constant designed for the study of multiple-pass
FSP which characterizes the overlap between two consecutive passes and is defined
by [78]:
Where: is the pin diameter and is the distance between pin centers in two
successive passes. For example, for a full overlap, =0 and OR =1. Based on previous
experience conducted within the research group iSTIR [12], an overlap ratio of 0.5 was

30
used as an attempt to achieve full nugget interpenetration and generate a uniform
thickness layer of processed material.
The number of FSP tracks was set to achieve a processed surface width of 45
mm. This distance matches the distance between the two rollers for the bending test
machine. Ten parallel passes were performed in the same direction with a gap of 3.5
mm between each one (since OR =0.5 and dpin=7 mm). Processing was conducted
along the plate rolling direction.
A new FSP bead just started after finishing the previous bead cooling cycle. To
monitor the temperature, a thermocouple was fixed to the surface of the bead near the
hole left by the pin extraction, according to the experimental setup presented in Figure
3.9.
Figure 3.9 - Experimental setup for surface modification by multiple-pass friction stir processing
a) Equipment and experimental setup. b) Thermocouple insertion. c) Tool positioning
After preliminary tests the following optimized parameter list (Table 3.6) was set
based on visual inspection of bead surface. Tests 1A e 1B were conducted with tool
force control. Multiple-pass friction stir processing test method is described in annex
E1.
Table 3.6 – Process parameters used for multiple-pass FSP in AA5083-H111.
Penetration depth (mm)
Tool vertical force (Kgf)
Tool rotation speed (rpm)
Plunge speed (mm/s)
Dwell time (s)
Travel speed (mm/s)
Tilt angle (°)
2 1000 1000 0.1 7 25 2

31
This group of tests aimed at investigating the effect of overlapping mode on the
mechanical properties and micro-structure of produced layer by FSP.
3.5.2. SiC reinforced surface composite
The other attempt to produce functionally graded materials, consisted in mixing
particles of a different material in an aluminium substrate. The concept of combining a
thin layer of high hardness silicon carbide with the FSP induced microstructural
modification, aims to a localized change of mechanical properties as well as potential
gradients in its distribution.
The particles were placed in a previously machined channel, followed by friction
stir processing. Channel deposition was defined aiming to achieve a steady condition
phenomenon. Given the stationary nature of the FSP process, it was expected that the
mixture retained this condition.
To evaluate the feasibility of the FSP tool induced material flow to fully mixture
the SiC packed groove into the 5083-H111 base material, the grooves packed with SiC
were placed in different positions facing the tool, that is, centred with the pin and
outside it, within the shoulder in the advancing and retreating side, as shown in Table
3.7, which depicts a schematic top view of these test methods. Finer sized particles
were used in this trial group as they would induce less disturbance in the material flow.
Figure 3.10 and Table 3.7 show a schematic description of the process and the
position of the grooves relative to the pin center.
Figure 3.10 – Schematic representation of the grooves in A12-H composite production. A) Overall view; B)
Longitudinal side view; C) Transverse section.

32
Table 3.7 - Trial group II description. Positioning of the groove relatively to pin center. Dimensions (mm).
Main investigation:
II – Variation of distance between groove and tool path
(only for 5083-H111)
A12-H
D12-H
R12-H
S12-H
FSP of a surface
covered by SiC
particles. No
groove required.
Label: Tool movements; SiC channel; Pin area; Shoulder area
In test D12-H, the tool was not fully aligned with the groove as it is partially
located under the advancing side. This detail was set to increase the distance travelled
by the particles, since the material is sheared in the advancing side and flowed around
the pin to the retreating side.
To understand how the presence of SiC would influence channel deformation,
two tests were conducted with empty grooves in a similar procedure as A12-H and
R12-H (Table 3.8).
Table 3.8 - Trial group III description. Study of channel closing by FSP.
Considering the results of trials groups II and III, test D12-H was the most
effective method to manufacture these composites, and as such, this was the method
used throughout the next groups of trials. The investigation of the effect of material
condition vs. SiC particle size was suggested as the next step to gain further
understanding of the mixture process and mechanisms. Trial group IV described in
Table 3.9 provided the tests samples to study these effects.
Main investigation:
III – FSP of empty channels
Test name Description Material
A00-H Friction stir processing of an empty groove on
the advancing side AA 5083-H111
R00-H Friction stir processing of an empty groove on
the retreating side

33
Table 3.9 - Trial group IV description. Effect of material condition and SiC particle size on reinforcement
distribution.
Main investigation:
IV – Effect of material condition vs. SiC particle size
Material condition
5083-H111 5083-O
Avera
ge
part
icle
siz
e
(µm
)
12.3 D12-H D12-O E
ffect
of p
art
icle
siz
e
37.4 D37-H D37-O
118.8 D118-H D118-O
Effect of material condition
It must be noticed that in trial group IV, the pin path always overlaps the groove
like in test D12-H (direct overlap using 12.3 µm SiC particles for 5083-H111) and as
such, this particular test is common to both II and IV trial groups.
Finally, the two friction stir processed samples presented in Table 3.10 feature
the separate study of the joined contribution of FSP microstructural modification and
the presence of SiC particles to the alteration of mechanical properties.
Table 3.10 - Trial group V description. Bead on plate test samples.
Main investigation:
V – FSP samples
Test name Description Material
B-H Friction stir processed
bead
AA 5083-H111
B-O AA5083 annealed at 400°C for 3,5h
The procedure for conducting trial groups II to V is presented in annex E2. Test
names were given according to the following directives in Figure 3.11.
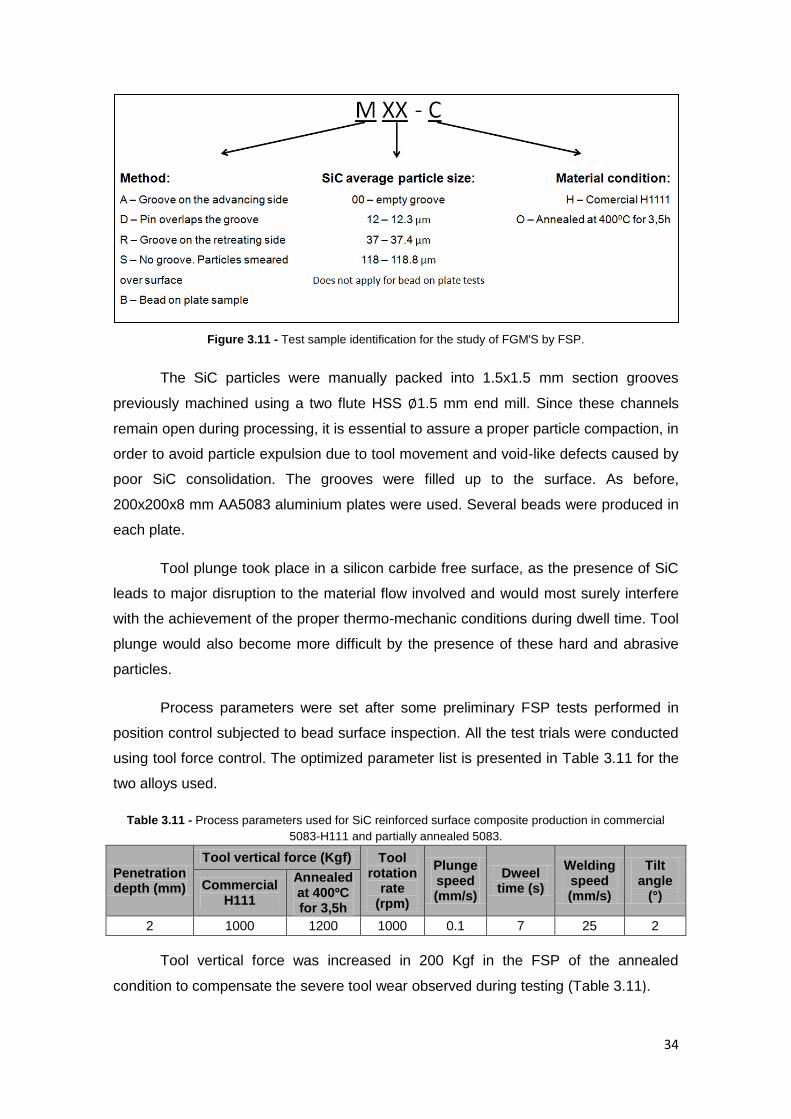
34
Figure 3.11 - Test sample identification for the study of FGM'S by FSP.
The SiC particles were manually packed into 1.5x1.5 mm section grooves
previously machined using a two flute HSS 1.5 mm end mill. Since these channels
remain open during processing, it is essential to assure a proper particle compaction, in
order to avoid particle expulsion due to tool movement and void-like defects caused by
poor SiC consolidation. The grooves were filled up to the surface. As before,
200x200x8 mm AA5083 aluminium plates were used. Several beads were produced in
each plate.
Tool plunge took place in a silicon carbide free surface, as the presence of SiC
leads to major disruption to the material flow involved and would most surely interfere
with the achievement of the proper thermo-mechanic conditions during dwell time. Tool
plunge would also become more difficult by the presence of these hard and abrasive
particles.
Process parameters were set after some preliminary FSP tests performed in
position control subjected to bead surface inspection. All the test trials were conducted
using tool force control. The optimized parameter list is presented in Table 3.11 for the
two alloys used.
Table 3.11 - Process parameters used for SiC reinforced surface composite production in commercial
5083-H111 and partially annealed 5083.
Penetration depth (mm)
Tool vertical force (Kgf) Tool rotation
rate (rpm)
Plunge speed (mm/s)
Dweel time (s)
Welding speed (mm/s)
Tilt angle
(°) Commercial
H111
Annealed at 400ºC for 3,5h
2 1000 1200 1000 0.1 7 25 2
Tool vertical force was increased in 200 Kgf in the FSP of the annealed
condition to compensate the severe tool wear observed during testing (Table 3.11).

35
Some steps for each test preparation are presented in Figure 3.12.
Figure 3.12 – Step sequence in the production of aluminium surface composites by friction stir processing
of grooves packed with SiC. A) Channel milling; B) Tool path alignment with groove direction; C) Tool
positioning for test D12-H; D) Tool penetration and dwell time for test D118-H; e) Experiment S12-H.

36
3.6. Characterization techniques
The surfaces produced by multi-step friction stir processing (trial group I) were
characterized through bending and hardness tests. Macroscopic and microscopic
analyses were performed on the processed layer cross section, aiming at
understanding the thermo-mechanical phenomena involved in the process. Sample
extraction planning is displayed in annex C.
SiC reinforced surface composites produced (trial groups II to V) were
characterized through hardness tests, macro and microscopic analysis, as well as,
SEM/EDS. Image processing techniques allowed to determine the SiC area fraction
along bead cross section. Additional longitudinal samples were mounted for trial groups
II to evaluate the stationary nature of SiC particle mixing. Sample extraction scheme is
given in annex C.
3.6.1. Metallography
Macro and microscopic analysis of the surfaces produced were performed to
investigate potential composition or microstructural gradients, as well as, to identify
possible defects.
Both analysis were performed using a Leica DMI 5000 M inverted geometry
optical microscope available at CENIMAT/i3N, Materials Science Department of
Faculdade de Ciências e Tecnologia, Universidade Nova de Lisboa. A dedicated
software allowed to generate multi-step composition images and the mapping of large
samples.
Figure 3.13 - Leica DWI 5000 M inverted geometry microscope used for both macroscopic and
microscopic analysis.
The reinforced samples were not etched, because this process would reveal
grain boundaries and accentuate second phase particles, making it more difficult to
identify the SiC particles. Only samples sectioned from trial groups that didn‟t use any

37
SiC where etched with Keller modified reagent, namely trial groups I, III and V. Taking
in account the macroscopic results and conclusions, a microscopic analysis will
guarantee a more precise characterization of the surfaces produced, through the study
of both microstructural features and SiC particle distribution.
Samples were polished and etched according to metallographic sample
preparation procedure presented in annex E3.
3.6.2. SEM/EDS
Surface analysis under scanning electron microscopy equipped with energy
dispersive spectroscopy was used to study bead cross section surface topography and
composition in some areas of interest. The large depth of field characteristic of SEM
yields three-dimensional appearance that will be very useful to explore channel defects
and surface structure. Metallography samples were mounted in groups of 3 on the
equipment‟s sample holder. To grant electric conductivity to sample surface, a gold
coating was created via 3 Å/s rate sputtering for 45 seconds. Carbon tape was used to
allow electron flow. Both SE (secondary electrons) and BSE (back-scattered electrons)
scanning modes were used. Observations were conducted in a SEM equipment
available at CENIMAT/i3N, Material Science Department of Faculdade de Ciências e
Tecnologia, Universidade Nova de Lisboa.
3.6.3. Image processing
Image processing techniques featuring image segmentation based on selected
threshold levels in the image histogram, allowed to determine SiC area fraction in the
aluminium matrix and quantify possible composition gradients for trial group IV
samples. Several 45x60 µm microscopic digital .tiff format images were taken with a
2048 x 1536 pixel resolution, along 13 vertical parallel lines, 1.5 mm apart, mapping
bead cross sections up to a 2.5 mm depth along the thickness direction, as illustrated
in Figure 3.14. The center mapping line was aligned with bead geometrical center.
Figure 3.14 - Image processing vertical mapping.
As it can be seen in Figure 3.15, the SiC particles have a much darker
colouration than the other phases, which allows its segmentation based on the

38
selection of the darker threshold levels of the image histogram. Image processing
method is illustrated in Figure 3.16.
Figure 3.15 - Example of 2048x1536 pixel resolution picture and particle identification.
Figure 3.16 - Image processing techniques.
Binary conversion converts the images to black and white based on the
threshold level chosen. Amongst other features, the software ImageJTM determines the
fraction filled by the black area.
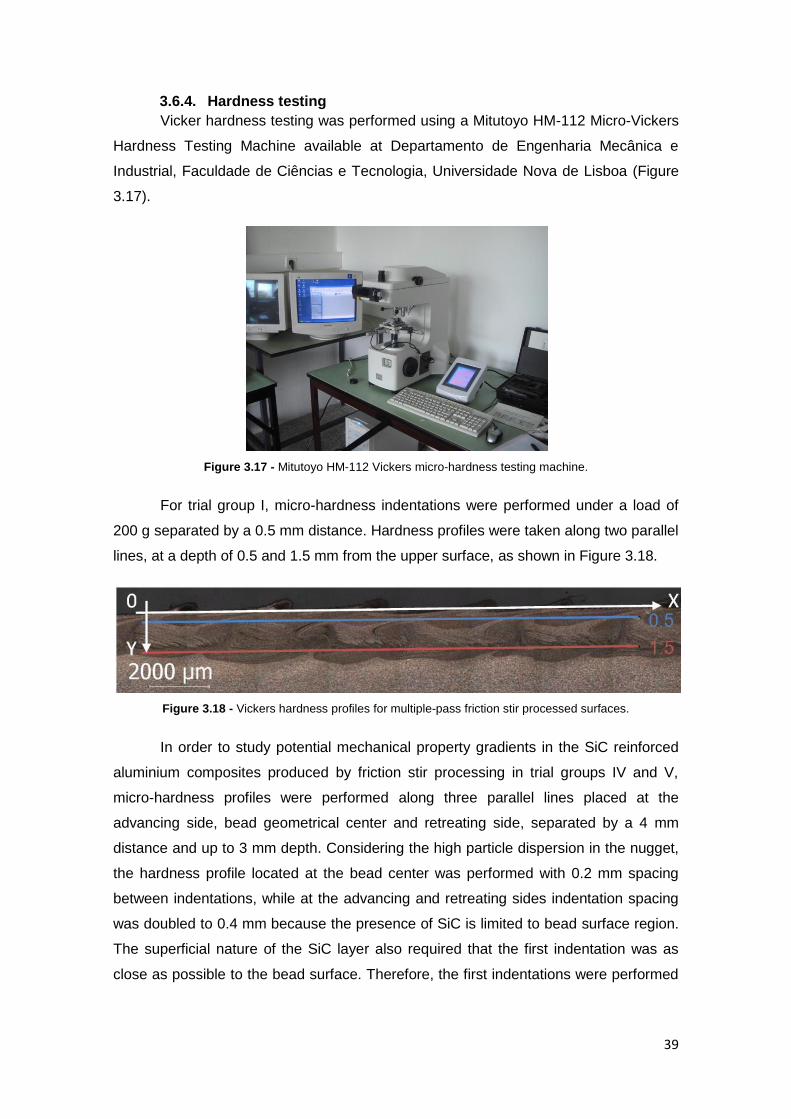
39
3.6.4. Hardness testing
Vicker hardness testing was performed using a Mitutoyo HM-112 Micro-Vickers
Hardness Testing Machine available at Departamento de Engenharia Mecânica e
Industrial, Faculdade de Ciências e Tecnologia, Universidade Nova de Lisboa (Figure
3.17).
Figure 3.17 - Mitutoyo HM-112 Vickers micro-hardness testing machine.
For trial group I, micro-hardness indentations were performed under a load of
200 g separated by a 0.5 mm distance. Hardness profiles were taken along two parallel
lines, at a depth of 0.5 and 1.5 mm from the upper surface, as shown in Figure 3.18.
Figure 3.18 - Vickers hardness profiles for multiple-pass friction stir processed surfaces.
In order to study potential mechanical property gradients in the SiC reinforced
aluminium composites produced by friction stir processing in trial groups IV and V,
micro-hardness profiles were performed along three parallel lines placed at the
advancing side, bead geometrical center and retreating side, separated by a 4 mm
distance and up to 3 mm depth. Considering the high particle dispersion in the nugget,
the hardness profile located at the bead center was performed with 0.2 mm spacing
between indentations, while at the advancing and retreating sides indentation spacing
was doubled to 0.4 mm because the presence of SiC is limited to bead surface region.
The superficial nature of the SiC layer also required that the first indentation was as
close as possible to the bead surface. Therefore, the first indentations were performed

40
with a load of 100 g, while 200 g were used for the following ones. In order to maintain
consistency between measurements, the results are presented in Pascal.
Figure 3.19 - Vickers hardness profiles for SiC reinforced surface composites.
3.6.5. Bend testing
Three point bending tests were conducted to investigate potential differences in
mechanical strength resulting from the multi-step overlapping method. According to the
sample extraction plan, two samples from each processed surface were sectioned for
tensile and compression tests. The processed surface was placed transversely and in
the middle of the test sample. Tests were performed according to NP EN 910 (1999)
[79] standard and sample dimensions are presented in Figure 3.20.
Figure 3.20 - Bend testing sample dimensions (mm).
The former had a 10 mm diameter. The 10 mm rollers were spaced of 30 mm
(Figure 3.21). Mechanical abrasion was used to eliminate stress concentration points
due to surface roughness and to round sample edges to an approximate radius of 0.8
mm.

41
Figure 3.21 – Bending test representation (mm).
Tests were performed using a specially adapted press available at STM-IST
(Figure 3.22). A dedicated device was designed to clutch the former into position, while
the rollers were supported by an existing structure. Instruments were installed in order
to measure the force vs the displacement and have this information available to plot the
test curves. A 20 kN load cell was used and the test velocity was 50 mm/min, since this
was the minimum press velocity.
Figure 3.22 - Bending test experimental set-up.

42
Annex D presents technical drawings of components designed. The test
procedure is presented in annex E4
Figure 3.23 – Designed components.
Figure 3.24 - Former base section view assembly.
1-base, 2-shaft, 3-former, 4-load cell, 5-M5x8 screw.

43
4. Results and discussion
4.1. Base material Base material microscopic analysis was performed in order to confirm its
properties and observe microstructure features. Samples from both material conditions
(cold hardened and partially annealed) were sectioned from the three orthogonal
planes relative to the rolling direction, in order to observe microstructural differences
between sections. Together with Vickers micro-hardness testing, this study is of
particular interest because it determines the microstructural changes induced by the
stabilization treatment, in terms of grain size/shape in different section directions, as
well as, precipitate size and dispersion.
Through the micrographs of the AA5083-H111 (Table 4.1) it is observed that
this material presents an anisotropic structure with a variation of microstructure along
the three directions. In particular, in planes parallel to the rolling direction, grains are
more elongated (Table 4.1B-C). The section parallel to plate surface (Table 4.1C)
shows predominance of transgranular precipitates, while in the section perpendicular to
rolling direction a higher density of grain boundaries can be observed (Table 4.1A).
Grain deformation increases in regions closer to the surface as expected.
During the partial annealing treatment, diffusion triggered by increased
temperature led to second-phase particle migration, resulting in precipitate growth and
coalescence. Precipitates are more homogeneously dispersed, instead of being
distributed along the lamination bands. This is more evident comparing the section
parallel to plate surface for both material conditions (Table 4.1C and Table 4.2C).
Lamination bands appear to be softened and are less marked, but rolling deformation
can still be observed. Heat treatment resulted in few microstructural transformations in
the longitudinal section views.
Failing to observe grain boundaries in the partially annealed samples, it is not
possible to evaluate grain recrystallization. The Keller‟s reagent etched preferentially
the second phase particles and not the grain boundaries. In the AA5083-H111 samples
depicted in Table 4.1, grain boundaries are observed because there are precipitates
located in the intergranular regions which were highlighted by etching. Samples of the
partially annealed material (Table 4.2) do not evidence grain boundaries, since heat
treatment temperature triggered recrystallization mechanisms and migration by
diffusion.

44
Poulton‟s reagent may be a more effective solution to reveal grain boundaries
and distinguish recrystallized grains.
Table 4.1 - Micrographs of AA5083-H111 base material along all rolling directions. (A) Section
perpendicular to rolling direction. (B) Section parallel to rolling direction. (C) Section parallel to plate
surface.
(A) Section perpendicular to rolling direction.
(B) Section parallel to rolling direction.
(C) Section parallel to plate surface.

45
Table 4.2 - Micrographs of partially annealed AA5083-H111 along all rolling directions. (A) Section
perpendicular to rolling direction. (B) Section parallel to rolling direction. (C) Section parallel to plate
surface.
(A) Section perpendicular to rolling direction.
(B) Section parallel to rolling direction.
(C) Section parallel to plate surface.
Vickers micro-hardness measurements were performed under a load of 500 g
along each rolling direction, to confirm the mechanical property information on AA5083-
H111, provided by the base material supplier, and to evaluate isotropy in the partially
annealed material. The mean values and standard deviation for hardness

46
measurements are presented in Table 4.3, showing that heat treatment contributed to a
more homogeneous hardness distribution. A 1.3% material softening is observed.
Table 4.3 - Base material hardness measurements.
Rolling direction AA 5083 material condition
H111 Partially annealed
Section perpendicular to rolling direction
72.6 ± 1.23 HV0.5 71.54 ± 2.14 HV0.5
Section parallel to rolling direction
72.1 ± 0.68 HV0.5 71.98 ± 1.72 HV0.5
Section parallel to plate surface
74.0 ± 1.34 HV0.5 72.32 ± 1.04 HV0.5
To indentify the precipitates observed in the microscopic analysis, energy
dispersive X-ray spectroscopy (EDS) was used. Figure 4.1 shows a SEM image of
base material AA5083-H111, depicting the phases that correspond to the EDS spectra
displayed in Figure 4.2.
Figure 4.1 – Energy dispersive x-ray spectroscopy (EDS) measurement location for 5083-H111 base
material.
By observing the EDS spectra in Figure 4.2 and Figure 4.3, it can be concluded
that the white phases observed in Figure 4.1, correspond to iron inclusions, while the
dark and round particles are likely to be β(Al3Mg2) precipitates according to the Al-Mg
phase diagram depicted in Figure 4.5. Although the spectrum depicted in Figure 4.3
shows a high percentage of Si, this can be explained by its atomic number, which is
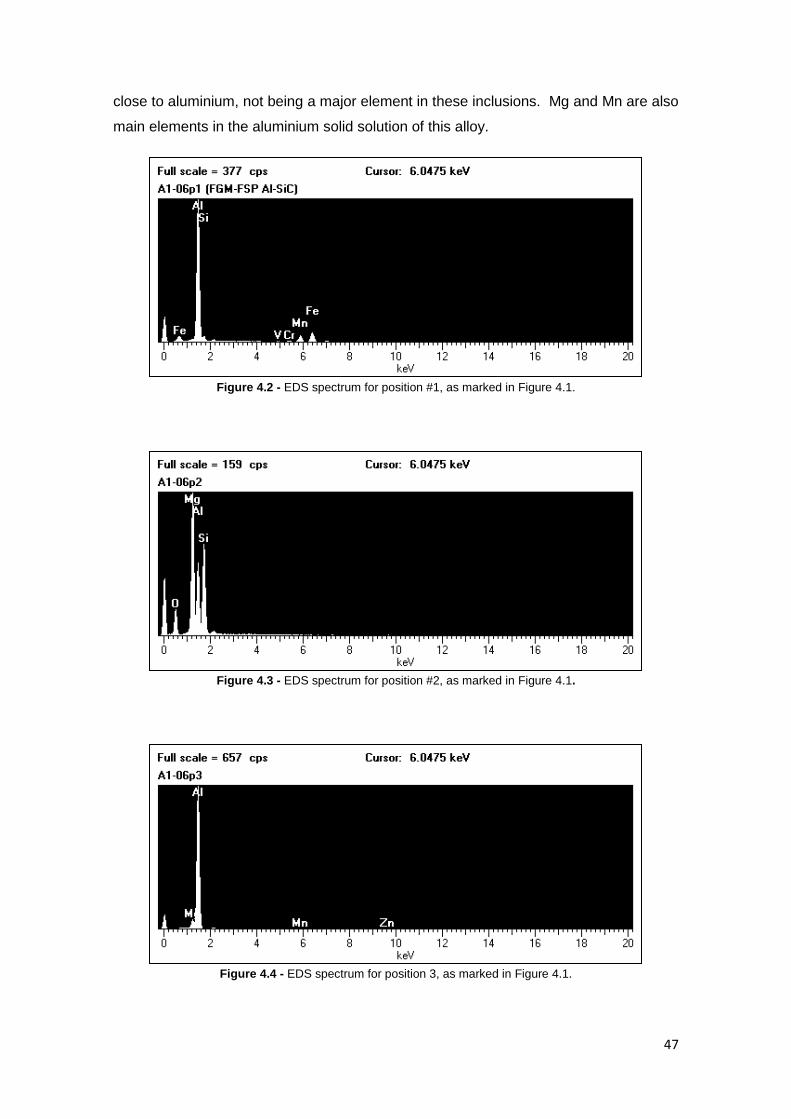
47
close to aluminium, not being a major element in these inclusions. Mg and Mn are also
main elements in the aluminium solid solution of this alloy.
Figure 4.2 - EDS spectrum for position #1, as marked in Figure 4.1.
Figure 4.3 - EDS spectrum for position #2, as marked in Figure 4.1.
Figure 4.4 - EDS spectrum for position 3, as marked in Figure 4.1.
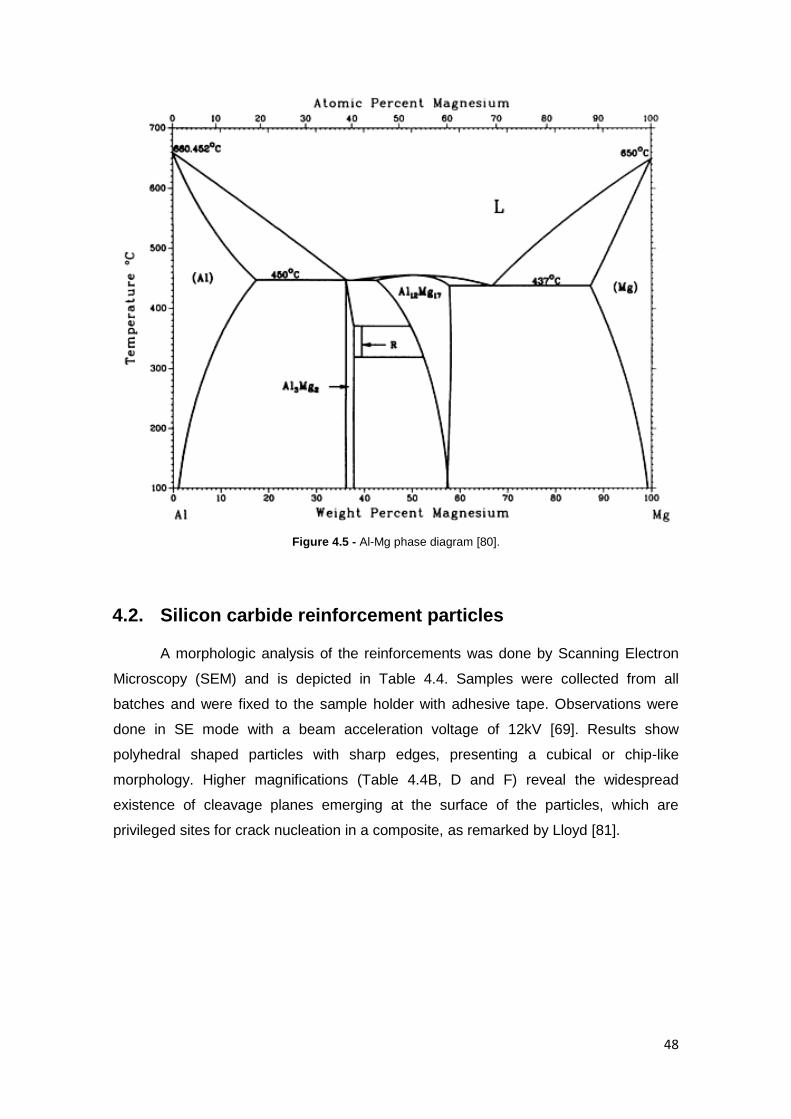
48
Figure 4.5 - Al-Mg phase diagram [80].
4.2. Silicon carbide reinforcement particles
A morphologic analysis of the reinforcements was done by Scanning Electron
Microscopy (SEM) and is depicted in Table 4.4. Samples were collected from all
batches and were fixed to the sample holder with adhesive tape. Observations were
done in SE mode with a beam acceleration voltage of 12kV [69]. Results show
polyhedral shaped particles with sharp edges, presenting a cubical or chip-like
morphology. Higher magnifications (Table 4.4B, D and F) reveal the widespread
existence of cleavage planes emerging at the surface of the particles, which are
privileged sites for crack nucleation in a composite, as remarked by Lloyd [81].

49
Table 4.4 - Scanning electron microscopy analysis (SEM) of SiC particles used. Small and large
magnification [69]. (A,B) 118.8; (C,D) 37.4; (E,F) 12.3; S
ilic
on
part
icle
me
dia
n s
ize (
µm
)
118
.8
(A)
(B)
37.4
(C)
(D)
12.3
(E)
(F)
Chemical analysis via X-ray fluorescence presented in Table 4.5, shows that
there is no significant foreign contamination of the particles batches.
Table 4.5 - Silicon carbide particles chemical analysis by X-ray fluorescence (XRF).
Compound (%)
Median SiC particle size batch
PS1 (118.8 μm) PS2 (37.4 μm) PS3 (12.3 μm) Al 0.07 0.05 0.07
Si 100. 100. 100.
Ti 0.04 0.09 0.1
V 0.05 0.03 0.03
Cr - - 0.01
Fe 0.04 0.09 0.07
Ni 0.010 0.01 0.02
Zr 0.006 0.01 0.04

50
4.3. Surface modification by multi-step friction stir processing
4.3.1. Macroscopic characterization
Figure 4.6 shows the samples produced when overlapping by the AS (A) and
the RS (B). Overlapping direction clearly leads to very distinct surface roughness, as
can be seen in Figure 4.7. Overlapping by the advancing side produced a somewhat
pronounced waved surface, while overlapping by the RS resulted in a smoother
surface finish.
Figure 4.6 – Samples produced by multi-pass FSP. Trial group I. Overlapping by the AS (A) and the RS
(B).
Figure 4.7 – Detail of surfaces. Overlapping by the AS (A) and the RS (B).
Initial shear lip formation during tool dwell time was observed. During some
tests, the FSW machine “struggled” to reach the tool penetration set for dwell time
controlled by position control, which resulted in longer periods for this stage. Since the
tool remained rotating in the same position, temperature raised and material viscosity
decreased, forming plastic rings around the shoulder (Figure 4.8A). When the tool
movement started a shear lip was formed (Figure 4.8B).

51
Figure 4.8 - Initial shear lip formation. (A) Tool plunge and (B) Shear lip.
Cross section views of the two processed surfaces are compared in Table 4.6.
The most striking difference continues to be surface finishing.
Table 4.6 – Cross views of processed surface when overlapping by the advancing side (a) and by the
retreating side (b).
Main investigation:
I – Influence of overlay mode in FSP surfacing
(A) OAS-H: Overlap by the advancing side. Base material: AA 5083-H111
(B) ORS-H: Overlap by the retreating side. Base material: AA 5083-H111
On sample OAS-H, the shear lips on the advancing side are actually curling
over the previous bead, giving this wavelike finishing to the surface. On sample ORS-H
overlapping is done on the retreating side which implies the successive destruction of
the shear lip on the advancing side by plastic deformation imposed by the shoulder.
The formation of a more defined shear lip on the advancing side is related to velocity
resultant between tool rotation and linear motion. Since the material is transported at a
higher velocity on this particular side, the shoulder imposes a stronger shearing action
on material surface resulting in higher temperatures, which increases shear lip flow and
curling.
RS AS
RS AS
Overlapping direction
Overlapping direction

52
By comparing the FSP layer lower limit, overlapping by the retreating side
produces strongly marked interface regions between adjacent nuggets. Since an
overlap ratio of 0.5 assures nugget interpenetration, it can be concluded that the
nugget interface region is generated by material shearing around the pin. For sample
ORS-H there is no homogenization in the region between the nuggets, while in OAS-H
a processed layer with a more uniform thickness can be observed.
No macroscopic scale defects, such as voids and channels, were observed.
4.3.2. Microscopic characterization
Surface finish changes with the direction of overlapping, resulting into a waved
surface in sample OAS-H, which becomes smoother in ORS-H, as depicted in Figure
4.9. Waviness differences due to overlapping were previously explained.
Figure 4.9 – Microscopic detail of bead surface waviness. Overlap by the advancing side (A) and by the
retreating side (B).
Figure 4.10 depicts four distinct regions frequently observed in friction stir
processed bead cross section. A cold-rolled anisotropic structure in the base material
can be observed in detail A of Figure 4.10. Within the nugget, in Figure 4.10B, a fine
equiaxial grain structure can be observed, due to dynamic recrystallization caused by
intense plastic deformation and temperature raise. Oriented structure was destroyed
and precipitates are homogeneously distributed throughout the nugget region. Figure

53
4.10C displays highly deformed grains with elongated shapes, where plastic
deformation and temperature generation was not enough to induce dynamic
recrystallization, producing instead this transition between refined grain and cold-rolled
structure, known as thermo-mechanically affected zone. In the vicinity of the TMAZ,
precipitate coarsening and grain growth triggered by temperature increase can be
observed, as this is the heat affected zone, depicted in Figure 4.10D.
The nugget region presents both homogenised and non-homogenised
structures as shown in Figure 4.11. In these particular regions, the refined grain
structure appears to be arranged along banded extrusion flow lines, concentric with the
nugget center, that are commonly referred as onion rings or Swiss roll.
Figure 4.10 - Micrographs of several friction stir processed areas from the last processed bead of sample
OAS-H. (A) Base material, (B) Homogenized nugget zone, (C) Thermo-mechanically affected zone, (D) Heat affected zone.
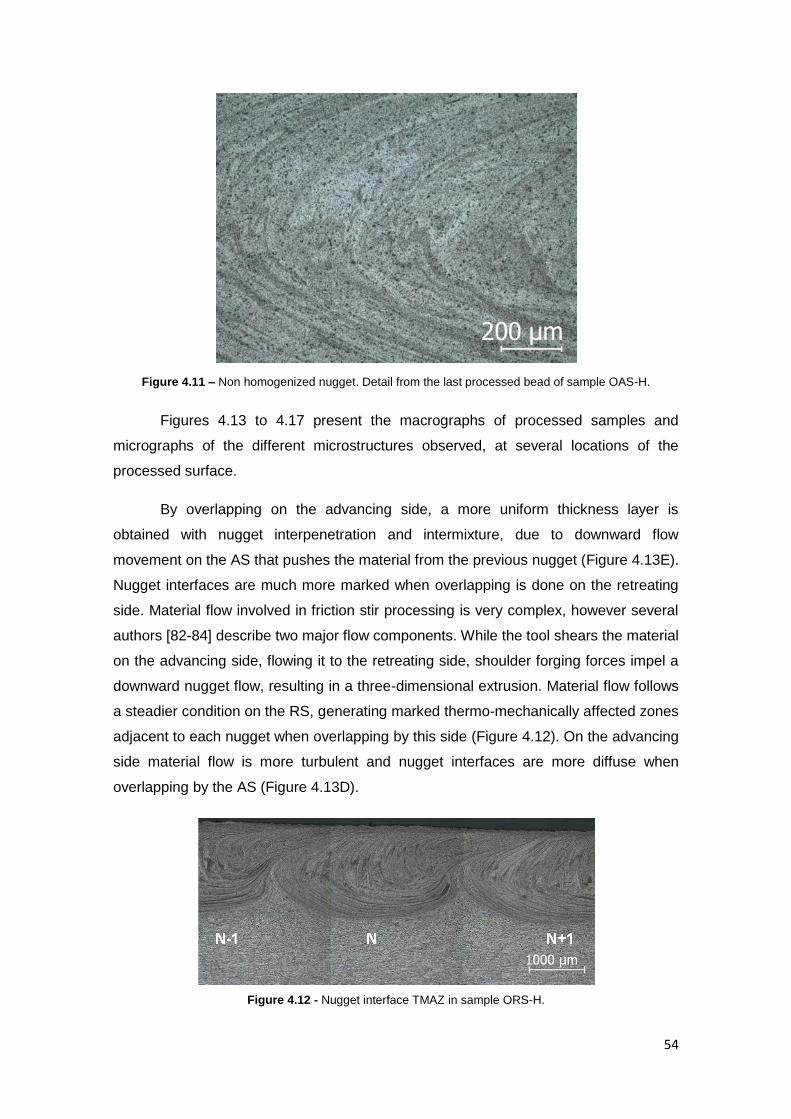
54
Figure 4.11 – Non homogenized nugget. Detail from the last processed bead of sample OAS-H.
Figures 4.13 to 4.17 present the macrographs of processed samples and
micrographs of the different microstructures observed, at several locations of the
processed surface.
By overlapping on the advancing side, a more uniform thickness layer is
obtained with nugget interpenetration and intermixture, due to downward flow
movement on the AS that pushes the material from the previous nugget (Figure 4.13E).
Nugget interfaces are much more marked when overlapping is done on the retreating
side. Material flow involved in friction stir processing is very complex, however several
authors [82-84] describe two major flow components. While the tool shears the material
on the advancing side, flowing it to the retreating side, shoulder forging forces impel a
downward nugget flow, resulting in a three-dimensional extrusion. Material flow follows
a steadier condition on the RS, generating marked thermo-mechanically affected zones
adjacent to each nugget when overlapping by this side (Figure 4.12). On the advancing
side material flow is more turbulent and nugget interfaces are more diffuse when
overlapping by the AS (Figure 4.13D).
Figure 4.12 - Nugget interface TMAZ in sample ORS-H.

55
Note that the OR of 0.5 used guarantees full nugget interpenetration and there
are not unprocessed regions. These interfacial TMAZs are seen in samples OAS-H but
on a smaller scale (Figure 4.13F).
It is concluded that the dynamic recrystallized zone is more homogeneous at a
superficial level, due to a more intense stirring as material movement is greatly
influenced by the shoulder. For example, comparing Figure 4.17A, B and C it is
possible to observe greater homogeneity as we move to the surface.
In sample OAS-H, defects are observed at the bottom of the advancing side in
each nugget, as seen in Figure 4.13F, Figure 4.14H, F and Figure 4.15C. These
defects are due to poor material consolidation. This indicates that the processing
parameters lacked to generate sufficient temperature to establish proper material flow.
These defects do not appear as channels, but as small dimension cracks. These
cracks were only observed in sample OSR-H on the last nugget (Figure 4.17F), since
tool overlapping by the retreating side continuously processed this region, resulting into
defect consolidation.
By observing the bead surface, it is concluded that the circular striations that
characterize the upper surface present a wavy behaviour, as seen in Figure 4.17D,
including the formation of curls, which is an indicator of the viscous nature of the plastic
deformation.

56
Figure 4.13 – Cross section micrographs of sample OAS-H last tracks. Trial group I. (A) TMAZ, (B) non homogenised nugget, (C,E) nugget upper details, (D) overlapped
nugget interface, (F) Poor consolidation defects, (G) overlapped nugget, (H) TMAZ at the nugget bottom.
a) b) c) d)
e) f) g) h)
b)

57
Figure 4.14 - Cross section micrographs of sample OAS-H middle tracks. Trial group I. (A,D) Overlapped nugget upper detail, (B) overlapped nugget interface, (C) base
material, (E) TMAZ at the nugget bottom, (F,H) Poor consolidation defects, (G) overlapped nugget.
g)
a)
h)
b)
c) d) e) f)

58
Figure 4.15 - Cross section micrographs of sample OAS-H first tracks. Trial group I. (A) Overlapped nugget interface, (B) second nugget upper detail, (C) poor consolidation
cracks on the second overlapped nugget, (D,E) overlapped first nugget, (F) base material, (G,H) TMAZ of the first nugget.
a) b) c) d)
e) f) g)
f
h)

59
Figure 4.16 - Cross section micrographs of sample ORS-H first tracks. Trial group I. (A) Base material, (B) HAZ, (C) TMAZ, (D) surface flashes, (E) TMAZ in nugget bottom,
(F,H) nugget interface, (G) second nugget.
a) b) c) d)
e) f) g) h)

60
Figure 4.17 - Cross section micrographs of sample ORS-H last tracks. Trial group I. (A) Not homogenised nugget, (B,C) Last nugget upper detail, (D) bead surface striations,
(G,E) TMAZ, (F,H) poor consolidation cracks.
a) b) c) d)
g)
e)
f) h)

61
4.3.3. Hardness testing
Fine grain structure within nugget region resulted in a hardness increase for
both samples, according to Hall-Petch equation. For sample OAS-H, the
microstructural homogeneity observed on surface level is reflected in the approximately
constant hardness profile along the 0.5 mm depth line in Figure 4.18, while the
formation of thermo-affected zones adjacent to each nugget in sample ORS-H resulted
in a more unstable profile along the same depth line (Figure 4.19). At the deeper level,
y=1.5 mm, hardness values tend to be more unstable for both samples, as the profile
intersects several thermo mechanically affected zones.
Overall inspection suggests that overlapping on the advancing side produces a
more stable and higher hardness enhancement associated with a more uniform
thickness friction stir processed layer. Hardness profiles are presented bellow.
Figure 4.18 - Hardness profiles for sample OAS-H. Trial group I.
0,65
0,67
0,69
0,71
0,73
0,75
0,77
0,79
0,81
0,83
0,85
0 2 4 6 8 10 12 14 16
Du
reza
(G
Pa)
X (mm)y=0.5 y=1.5 BM
BM=0.71 ± 0.012 GPa

62
Figure 4.19 - Hardness profiles for sample ORS-H. Trial group I.
4.3.4. Bend testing
Test samples are displayed in Figure 4.20, while bend testing curves are
presented in Figure 4.21 and Figure 4.22. OAS1 and ORS1 test curves refer to
processed surface tensile solicitation, while in OAS2 and ORS2 the processed surface
was at compression.
Figure 4.20 - Bend testing samples. Base material (BM); Processed surface tensile loading (OAS1, ORS1)
and compression (OAS2, ORS2).
0,65
0,67
0,69
0,71
0,73
0,75
0,77
0,79
0,81
0,83
0,85
0 2 4 6 8 10 12 14 16
Du
reza
(G
Pa)
X (mm)y=0.5 y=1.5 BM
BM=0.71 ± 0.012 GPa

63
Figure 4.21 - Bend testing of sample OAS-H. Load vs. displacement plot.
Figure 4.22 - Bend testing of sample OAS-H. Load vs. displacement plot.
Different behaviours are observed for each bending specimen. Surface
modification by multi-pass FSP resulted in an increase of the maximum load supported
for all samples, as shown in Figure 4.24. FSP produced a thin layer of a fine equiaxial
recrystallized grain structure and homogeneous precipitation dispersion, enhancing
material strength, as documented by previous hardness testing.
There are some differences associated with the type of overlapping performed.
Processed surface under tensile condition in OAS1 and ORS1 resulted in sample
0
2
4
6
8
10
12
14
16
18
0 5 10 15 20 25 30 35 40
Fo
rce
(k
N)
Displacement (mm)
Base material OAS1 OAS2
0
2
4
6
8
10
12
14
16
18
0 5 10 15 20 25 30 35 40
Fo
rce
(k
N)
Displacement (mm)
Base material ORS1 ORS2
Compression
Compression
Tension
Tension

64
collapse (Figure 4.20), as the poor consolidation defects observed during microscopic
analysis are crack initiation sites (Figure 4.23). OAS1 and ORS1 curves depict a
catastrophic ductile fracture immediately after crack propagation into base material.
Figure 4.23 - Fracture surfaces of samples OAS1 and ORS1 (FSP surface tensile loading). Overlapping
by the AS (A) and RS (B).
Test samples OAS2 and ORS2 supported higher loads as crack propagation is
more difficult under compressive stresses. Since the number of cavity defects was
seen to be higher when overlapping by the advancing side, the maximum load is lower
than the one observed in ORS-H samples (Figure 4.24).
Figure 4.24 - Maximum force attained by FSP samples. Base material (BM); Processed surface tensile
solicitation (OAS1, ORS1) and compression (OAS2, ORS2).
14,16
15,67
16,11 16,04
16,76
12,5
13
13,5
14
14,5
15
15,5
16
16,5
17
BM OAS1 OAS2 ORS1 ORS2
Lo
ad
(kN
)

65
Except for sample OAS1, there are no significant ductility variations, based on
the bending angle at maximum load (Figure 4.25). However, by comparing fracture
energy, a 19% ductility enhancement is observed for sample OAS2.
Figure 4.25 - Bending angle for maximum force. Base material (BM); Processed surface tensile solicitation
(OAS1, ORS1) and compression (OAS2, ORS2).
Figure 4.26 - Fracture energy. Base material (BM); Processed surface tensile solicitation (OAS1, ORS1)
and compression (OAS2, ORS2).
However it must be noticed that these results require a larger number of test
samples to get consistent statistical data in order to draw further conclusions.
84,65
54,26
84,6581,28
71,75
0
10
20
30
40
50
60
70
80
90
BM OAS1 OAS2 ORS1 ORS2
Ben
din
g a
ng
le (
º)
1,00
0,32
1,03
0,46
1,19
0
0,2
0,4
0,6
0,8
1
1,2
1,4
BM OAS1 OAS2 ORS1 ORS2
E/EB
M

66
4.3.5. Conclusions
From this study the following can be concluded:
1. Surface generation by multi-step friction stir processing is an effective
technology to locally enhance material mechanical properties, such as
hardness and bending toughness.
2. Dynamic recrystallization induces grain refinement, thereby producing a
variation of microstructural features along the thickness direction which
results in a mechanical property continuous evolution. Therefore,
materials processed by FSP can be classified as functionally graded
materials.
3. Microscopic characterization supports a microstructural gradient along
the plate depth, since grain size in the nugget is lower than in base
material.
4. Overlapping method highly influences the processed surface
characteristics due to the asymmetric nature of material flow. Although
overlapping by the advancing side produces a more irregular surface
finish, a more uniform and homogeneous microstructure is observed
with a regular hardness distribution.
5. Tests performed showed that hardness within the processed layer is
higher than in the base material and it decreases along the thickness
direction, thereby revealing a mechanical property gradient.
6. The presence of defects on sample OAS-H, due to insufficient material
consolidation, led to a ductility decrease in the tensile side of the
processed surfaces.
7. The maximum load required for bending increased for all FSP
processed samples.

67
4.4. SiC reinforced surface composites
4.4.1. Macroscopic characterization
Visual inspection of bead surfaces revealed that SiC reinforced beads have a
darker coloration than simple FSP, as seen by comparing Figure 4.27 A and C. All
reinforced beads feature a grey coloured stripe along processing direction on the
retreating side. During testing, some particles were seen to exit the groove, being
swept by the shoulder to the retreating side. Fewer particles were transported around
the tool to the AS (Figure 4.27B).
Figure 4.27 - Bead surface aspect of samples B-H (A), D12-H immediately after testing (B), D12-H after
cleaning (C).
Sample S12-H was seen to produce larger shear lips than the other samples,
as depicted by Figure 4.28.
Figure 4.28 – Top view of processed sample S12-H.

68
Silicon carbide reinforcing via FSP resulted in a rapid and intense wear of the
shoulder‟s outer surface, caused by direct abrasion between the particles stirred
between plate surface and the tool. As the shoulder geometry changed from concave
to flat or even slightly convex (Figure 4.29), channel defects appeared, increasing in
magnitude as tool wear progressed. For the same conditions, flat shoulders generate
less superficial plastic deformation, thereby producing a deficient material flow at lower
temperatures. Shoulder manufacturing featured a surface hardening treatment by ion
nitriding up a 30 µm depth to increase surface hardness, but as shown by Figure 4.29,
the serious abrasion removed this superficial layer.
Figure 4.29 - Shoulder wear. As received from manufacture (A) an after trials (B).
Figure 4.30 depicts channel defect escalation from A to C, as tool wear
progresses.
Figure 4.30 - Bead surface aspect of samples D12-O (A), D35-O (B) and D120-O (C).
In order to evaluate the effect of reinforcement method on the quality of the
surfaces produced, tests were performed with different relative positions of the tool and
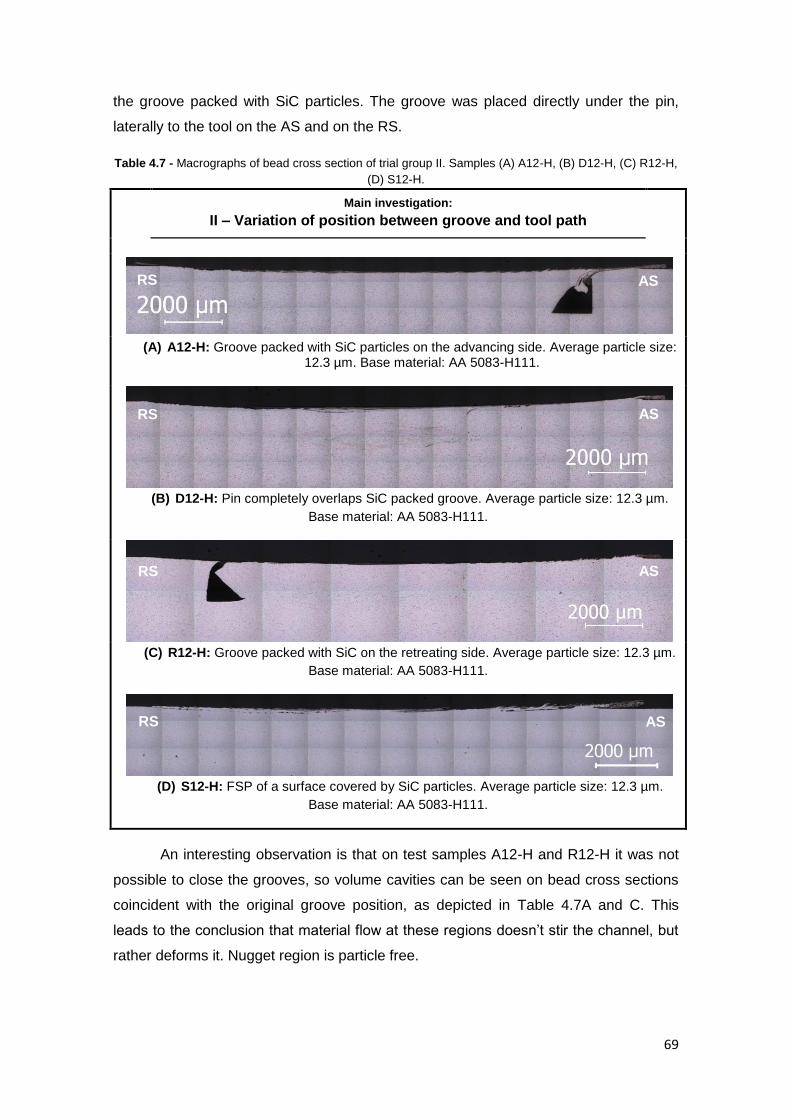
69
the groove packed with SiC particles. The groove was placed directly under the pin,
laterally to the tool on the AS and on the RS.
Table 4.7 - Macrographs of bead cross section of trial group II. Samples (A) A12-H, (B) D12-H, (C) R12-H,
(D) S12-H.
Main investigation:
II – Variation of position between groove and tool path
(A) A12-H: Groove packed with SiC particles on the advancing side. Average particle size: 12.3 µm. Base material: AA 5083-H111.
(B) D12-H: Pin completely overlaps SiC packed groove. Average particle size: 12.3 µm.
Base material: AA 5083-H111.
(C) R12-H: Groove packed with SiC on the retreating side. Average particle size: 12.3 µm.
Base material: AA 5083-H111.
(D) S12-H: FSP of a surface covered by SiC particles. Average particle size: 12.3 µm.
Base material: AA 5083-H111.
An interesting observation is that on test samples A12-H and R12-H it was not
possible to close the grooves, so volume cavities can be seen on bead cross sections
coincident with the original groove position, as depicted in Table 4.7A and C. This
leads to the conclusion that material flow at these regions doesn‟t stir the channel, but
rather deforms it. Nugget region is particle free.
RS AS
RS AS
RS AS
AS RS

70
In sample D12-H (Table 4.7B), the groove was directly centred with pin
trajectory, resulting in a SiC particle distribution on the nugget region.
Processing of SiC particles over plate surface in test S12-H produced a rougher
bead surface, with bigger shear lips, as depicted in Table 4.7D. Although no particles
are observed within the nugget region, material flow was able to implant some silicon
carbides in a thin layer, generating some particle agglomerations in the AS and RS.
Major particle distribution is due to material stirring produced by the shoulder.
By processing empty grooves in test samples in the advancing and retreating
sides, it is possible to understand how FSP material flow processes this square section
voids. As can be observed in Table 4.8, though empty grooves offer less resistance to
the forces generated during FSP, none of the channels are completely closed due to
the weaker nature of material flow at these locations. The channel on the advancing
side (Table 4.8A) appears to be filled with recrystallized material from bead surface, as
the shoulder forged the material, forcing it to fill the channel. On the retreating side,
channel compression occurred, as observed in Table 4.8B. The differences observed
will be explained based on microscopic analysis in the next section.
Table 4.8 - Macrographs of bead cross section of trial group III. Samples (A) A00-H, (B) R00-H.
Main investigation:
III – FSP of empty channels
(A) A00-H: Empty groove on the advancing side. Base material: AA 5083-H111
(B) R00-H: Empty groove on the retreating side. Base material: AA 5083-H111
The friction stir processed beads are observed in Table 4.9, depicting elliptical
shaped nuggets with an onion ring structure characterized by concentric flow lines.
According to Rhodes et al. [85], these flow lines possibly represent plastic deformation
increments produced as the pin extrudes the material. Z.Y. Ma et al. [86] concluded
that this particular nugget shape is usually associated to high tool rotations. However,
AS RS
RS AS

71
the banded/swirl structures observed indicate poor material stirring. By increasing tool
force, a more uniform microstructure within the nugget can be generated.
Table 4.9 - Macrographs of bead cross section of trial group V. Samples (A) B-H, (B) B-O.
Main investigation:
V – FSP samples
(A) B-H: Friction stir processed bead. Base material: AA 5083-H111.
(B) B-O: Friction stir processed bead. Base material: AA 5083 partially annealed at 400 °C for 3.5 h.
Table 4.10 presents the results produced by varying particle size and material
condition. As particle size increases, distribution becomes more scattered, as shown in
Table 4.10A-C and D-F, leading to the conclusion that smaller particles are more easily
embedded in the matrix. For the partially annealed material, the particle distribution
was found to follow a more regular alignment as seen in Table 4.10D and E.
AS RS
AS RS

72
Table 4.10 – Macrographs of bead cross section of trial group IV. Samples (A) D12-H, (B) D37-H, (C)
D118-H, (D) D12-O, (E) D37-O, (F) D118-O.
Main investigation:
IV – Effect of material condition versus SiC particle size
(A) D12-H: Pin completely overlaps SiC packed groove. Average particle size: 12.3 µm.
Material: AA 5083-H111.
(B) D37-H: Pin completely overlaps SiC packed groove. Average particle size: 37.4 µm. Material: AA 5083-H111.
(C) D118-H: Pin completely overlaps SiC packed groove. Average particle size: 118.8 µm.
Material: AA 5083-H111.
(D) D12-O: Pin completely overlaps SiC packed groove. Average particle size: 12.3 µm.
Material: AA 5083 partially annealed at 400°C for 3.5h.
(E) D37-O: Pin completely overlaps SiC packed groove. Average particle size: 37.4 µm.
Material: AA 5083 partially annealed at 400°C for 3.5h.
(F) D118-O: Pin completely overlaps SiC packed groove. Average particle size: 118.8 µm.
Material: AA 5083 partially annealed at 400°C for 3.5h.
AS RS
AS RS
RS AS
RS AS
RS AS
RS AS

73
As the shoulder undergoes wear, the channel-like defects increase to larger
proportions as shown in Table 4.10F. Ceramic particle abrasion, resulted in the severe
wear of the shoulder‟s concave geometry. The temperature was insufficient to achieve
a proper viscoplastic flow which led to poor material consolidation. This type of defect
is usually described as the joint effect of insufficient tool pressure and inadequate pin
geometry, for a certain process parameter group, and appears as a longitudinal void
channel tangential to the pin on the shear side [87-88]. In Table 4.10D and F also
revealed a lack of surface fill, which is also related to insufficient flowing of material.
These defects were also observed by Mahmoud et al. [53], though in a larger and
much more catastrophic scale. Figure 4.31 relates a bead cross section detail with the
correspondent bead top view.
Figure 4.31 - Volume defects due to insufficient material flow for sample D118-O. Bead surface view (A)
and macrograph detail (B).
Due to tool rotation and linear movement combination, the pin shears the
material from the advancing side (AS) and flows it to the retreating one (RS), forging it
under shoulder pressure in a movable “extrusion chamber” bounded by cold material
surroundings and the tool. When the material flowing from the region ahead of the pin
tool is not balanced with that flowing back into the vacant region behind the tool, mainly
due to insufficient temperature generation, flow-related defects occur. To better
illustrate this process, a test similar to D12-H was interrupted by switching off the FSW
machine, thereby freezing the moment. The wear flattened shoulder was used to show
the progressive degeneration of material flow.

74
Figure 4.32 - Groove defect formation. Interrupted D12-H test.
Note that the “waves” observed inside the wormhole in Figure 4.31B are also
visible at the bead top view Figure 4.33.
Figure 4.33 - Interrupted D12-H test bead top view.

75
4.4.2. Microscopic characterization
Figure 4.34 shows several micrographs of sample D12-H cross section,
showing a homogeneous thin layer of dispersed particles on the bead surface.
Different features can be observed along the bead surface due to the
asymmetric material flow imposed by the combination of tool rotation and travelling
movement. The advancing side suffers higher levels of material stirring and
deformation leading to a more intense mixing of reinforcement particles and larger
dispersion throughout the matrix. Figure 4.34C shows the SiC distribution in an
affected layer of about 70 µm thick in the advancing side. In the retreating side, a
higher concentration of particles is observed since the tool tends to sweep the
particles, accumulating them in very compact layers, as depicted in Figure 4.34B. It can
also be seen that the percentage of particles transported all the way to the advancing
side is also lower than the one retained in the retreating side, which results into more
scattered distributions as the tool moves from the RS to the AS. This fact can be
observed by comparing Figure 4.34B to D.
At the center of the nugget zone, particle alignments (Figure 4.34G) and
triangular cavities (Figure 4.34H) are observed, the latter being due to a poor
consolidation of the material flow. Most of these cavities are free of SiC particles and
are related to the stationary nature of the process. In the nugget zone, a highly
dispersed distribution of fragmented particles is observed as shown in Figure 4.34F.
These particles exhibit a more roundish shape resulting from the intense deformation
and material extrusion caused by the pin that contributed to their fragmentation and
round shape, when compared with their original polyhedral shape [75].

76
Figure 4.34 – Cross section micrographs of sample D12-H. Trial group II. (A-D) Details from superficial SiC reinforced layer produced at the retreating side, at bead center and
at the advancing side. (E, G) Particle distribution within the nugget. (F) Detail of rounded particles. (H) Cavity defects due to poor material flow consolidation.
a
a)
b
b)
c
c) d)
d
e f
g
h
e) f) g) h)
RS AS

77
Figure 4.35 illustrates this particle accumulation on the RS, depicting an
interrupted test similar to D12-H.
Figure 4.35 - SiC surface reinforcing process. Interrupted test sample similar to D12-H.
Top view inspection revealed a grey stripe along the bead direction.
Micrographs (Figure 4.36A) suggest that this region is associated to a large quantity of
SiC compressed under the shoulder on the retreating side. As seen in Figure 4.35, the
aluminium material flow was not able to agglutinate such a great density of silicon
carbides, resulting into a mass of loose debris on the RS. Surface cleaning revealed
this grey stripe (Figure 4.36B) with a superficial small amount of particles (Figure
4.34A).
Figure 4.36 - SiC compact layer on the retreating side of sample D12-H. Trial group II. (A) Micrograph of
layer on the retreating side and (B) Bead top view.

78
Particle agglomeration can also be observed in the form of cavities as shown in
Figure 4.37. Though these cavities appear to be empty, SEM observations presented
in the next section, reveal a high concentration of silicon carbide particles. In fact, these
cavities act as pockets of unmixed free particles, as shown in Figure 4.37. During the
polishing procedure, these pockets were sectioned and their content of loose SiC
particles was released, creating the cavities observed. These features can be found
both in the AS or the RS and they are associated with regions of high SiC
concentration.
Figure 4.37 - Particle agglomeration in pocket form in sample D12-H. Trial group II. Large (A) and small
(B) pockets.
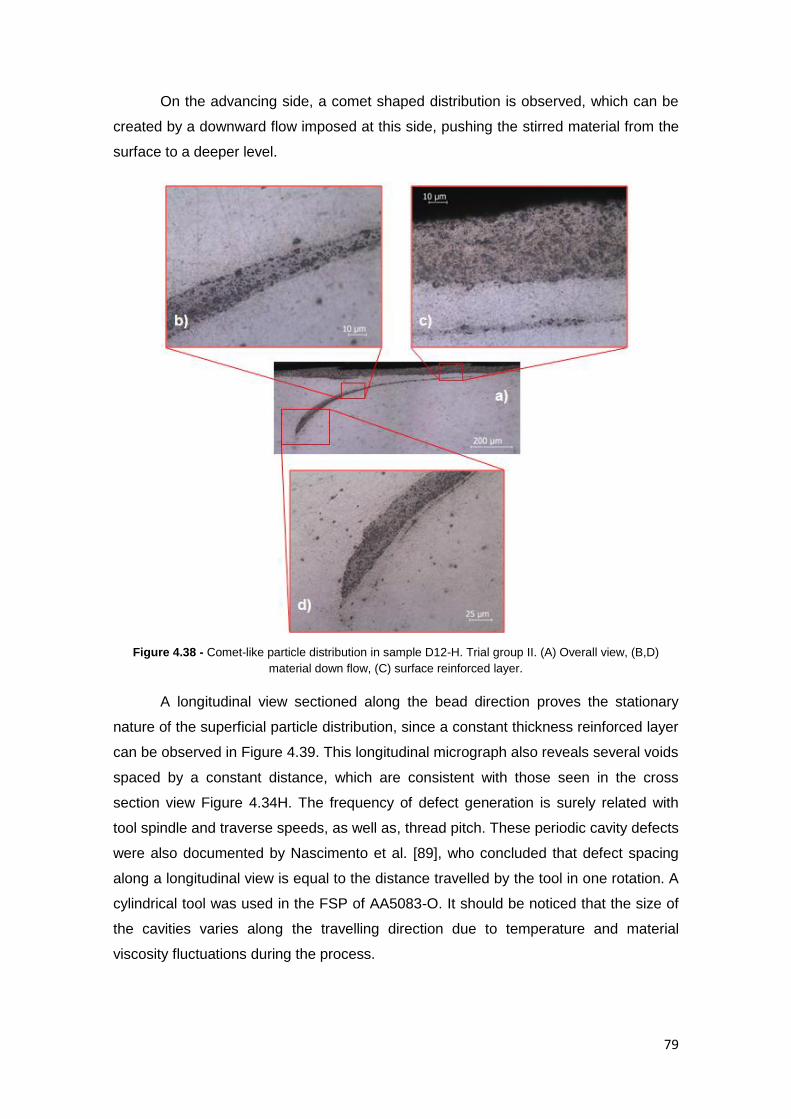
79
On the advancing side, a comet shaped distribution is observed, which can be
created by a downward flow imposed at this side, pushing the stirred material from the
surface to a deeper level.
Figure 4.38 - Comet-like particle distribution in sample D12-H. Trial group II. (A) Overall view, (B,D)
material down flow, (C) surface reinforced layer.
A longitudinal view sectioned along the bead direction proves the stationary
nature of the superficial particle distribution, since a constant thickness reinforced layer
can be observed in Figure 4.39. This longitudinal micrograph also reveals several voids
spaced by a constant distance, which are consistent with those seen in the cross
section view Figure 4.34H. The frequency of defect generation is surely related with
tool spindle and traverse speeds, as well as, thread pitch. These periodic cavity defects
were also documented by Nascimento et al. [89], who concluded that defect spacing
along a longitudinal view is equal to the distance travelled by the tool in one rotation. A
cylindrical tool was used in the FSP of AA5083-O. It should be noticed that the size of
the cavities varies along the travelling direction due to temperature and material
viscosity fluctuations during the process.

80
Figure 4.39 - Longitudinal micrographs of sample D12-H. Trial group II. (A,B) Reinforced surface, (C,D)
cavities, (E) Deepest particle concentration.
In order to evaluate the effect of reinforcement method on the quality of the
surfaces produced, tests were performed with different relative positions of the tool and
the groove packed with SiC particles. The groove was placed laterally to the tool on the
advancing and retreating sides. An interesting observation is that in these test samples
it was not possible to close the grooves, so volume cavities can be seen on bead cross
sections as depicted in Figure 4.40 and Figure 4.41, coincident with the original groove
position.

81
Figure 4.40 - Cross section macrograph of bead produced through the processing of a channel packed
with median size 12.3 µm SiC particles on the AS. Sample A12-H. Trial group II. (A) Empty groove (dark-
filter microscopy).
Figure 4.41 - Cross section dark-filter macrograph of bead produced through the processing of a channel
packed with median size 12.3 µm SiC particles on the RS. Sample R12-H. Trial group II. (A) SiC reinforced
layer.
The cavity on the advancing side is empty (Figure 4.40); while the one on the
retreating side is filled with compacted particles by the compression forces exerted by
the material flow as described previously (Figure 4.41). A particular feature of the
groove in the retreating side is shown in Figure 4.41A. This groove was subjected to
intense compressive force exerted by the material flow that was responsible for the
mixing with the base material in the upper part of the groove, while in the medium to
lower part, simply compression is exerted on particles. The channel on sample A12-H
RS AS

82
is empty because less compression occurred and the particles were washed away
during polishing. Longitudinal views illustrated by Figure 4.42 and Figure 4.43 depict
uniform thickness layers of SiC reinforced aluminium, proving that this processing
technique is capable to generate continuous SiC distributions. As the SiC packed
groove is deformed, some of the particles are expelled to the plate surface, being
stirred by the shoulder along the surface. This is why thin superficial reinforced layers
were found at test samples A12-H and R12-H, despite the fact that the channels
remain unmixed. Surface waves are seen the curl in the opposite direction of tool
movement.
Figure 4.42 - Longitudinal micrographs of sample A12-H. (A-C) Composite layer. Trial group II.

83
Figure 4.43 - Longitudinal micrographs of sample R12-H. (A,B) Composite layer. Trial group II.
Test samples A00-H and R00-H, performed with empty channels, provide
further illustration on how material flow is affected. Figure 4.44A shows the empty
groove being filled with plastic material descendent from the shoulder affected zone.
The fact that the limits of the groove are disappearing at specific locations suggests
that temperature generation allowed some diffusion bonding.
Figure 4.44 - Cross section micrographs for sample A00-H. Trial group III. (A) Filled groove.

84
Figure 4.45 depicts a large material flow to the retreating side, in accordance
with flow side definition, pushing the wall of the groove and resulting in its partial
abatement. A triangular cavity coincident with the channel edge is observed as
shoulder and pin influence is smaller at this location. Figure 4.45D shows additional
diffusion bonding between the two previously orthogonal groove surfaces. As the
distance to the pin increases, temperature decreases and material flow is more difficult,
resulting in what appears to be cracks, since there was no mixture between the
surfaces.
Figure 4.45 – Cross section micrographs of sample R00-H. Trial sample III. (A) Groove overall view, (B-C)
groove surfaces, (D) diffusion bonding.
Channel deformation is illustrated in Table 4.11. By comparing the original
section area of the groove with that of the processed ones, it is possible to understand
how channel deformation occurred. Clearly the presence of SiC particles creates major
opposition to compression exerted by material flow. In detail D of Table 4.11, material
flow forces on the RS led to a rotation of the groove wall, which is highlighted by a
yellow dotted line, compressing the particles inside. Minor compression forces on the
AS caused groove partial collapse, but although some particle compression occurred,
this was smaller than on the RS. Bead surface depression caused a decrease of

85
groove height as can be observed in details B, C and D of Table 4.11. While
micrographs of the channel on the RS reveal mostly compression, details C and D of
Table 4.11 suggest a material downward flow imposed by shoulder forging force, which
tends to fill the grooves with stirred material from the surface.
Table 4.11 - Illustration of channel deformation. (A) Groove square section, (B) R00-H, (C) A00-H, (D)
R12-H, (E) A12-H.
Before processing
(A) Groove original section
After processing
(B) Empty groove on the RS, R00-H
(C) Empty groove on the AS, A00-H
(D) SiC packed groove on the RS, R12-H
(E) SiC packed groove on the AS, A12-H

86
Cross section micrographs of sample S12-H are displayed in Figure 4.46. In this
test, a large quantity of SiC was spread along plate surface, following its friction stir
processing. The superficial stirring of this large mass of SiC resulted in the formation of
several pocket agglomerations connected by a thin layer of silicon carbide (Figure
4.46A), which is assumed to mark the boundary layer of the material dragged by
shoulder influence. Particles inside these pockets are not embedded in an aluminium
matrix and since there is not any bonding between them, these pockets tend to
collapse Figure 4.46C. Note that these agglomerations are not found on the bead
center, as the predominance of a downward flow imposed by the threaded pin caused
greater vertical stirring, thus eliminating high density SiC concentrations.
Figure 4.46 – Cross section micrographs of sample S12-H. Trial group II. (A) Pockets on the RS, (B) shear
lip, (C) pocket of unmixed material, (D) Embedded particle agglomeration.
No reinforcements were found on the nugget region. By comparing samples
S12-H and D12-H it shows that the particles found on the nugget region come,
exclusively, from the mass extruded by the pin during channel destruction and not from
the shoulder stirred layer.
Figures 4.47 to 4.51 depict several cross section micrographs addressing the
effect of material condition and SiC particle size.
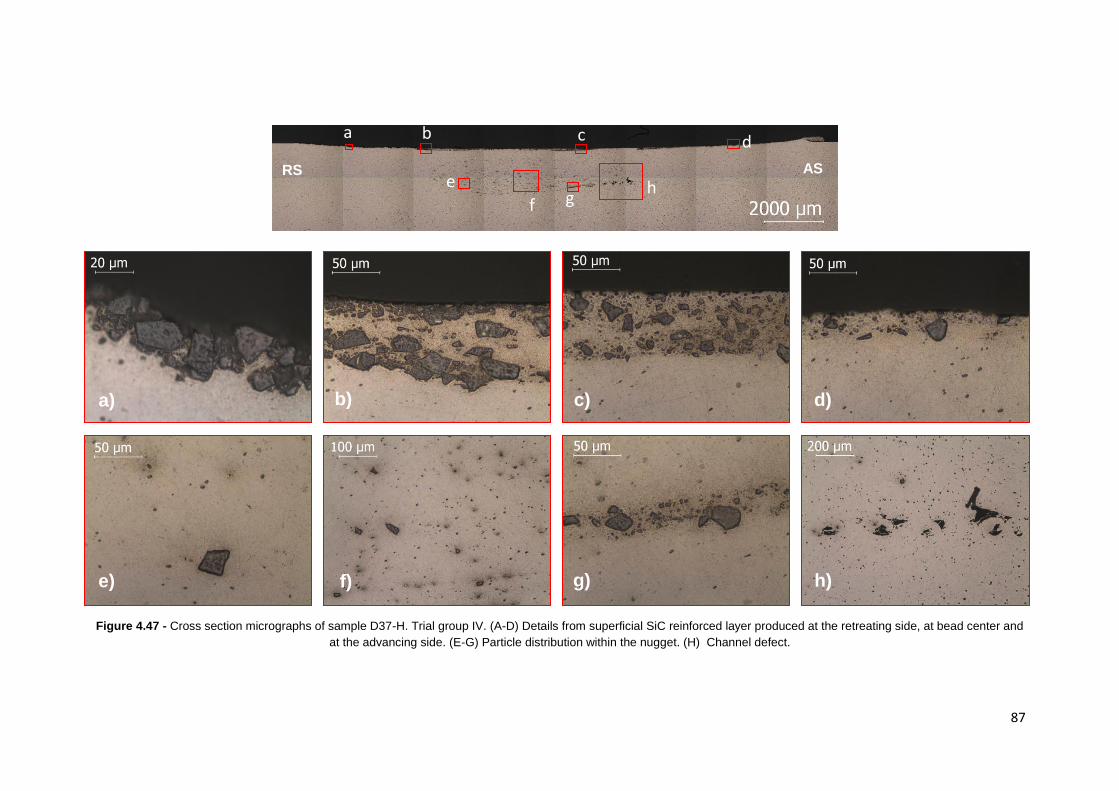
87
Figure 4.47 - Cross section micrographs of sample D37-H. Trial group IV. (A-D) Details from superficial SiC reinforced layer produced at the retreating side, at bead center and
at the advancing side. (E-G) Particle distribution within the nugget. (H) Channel defect.
a
a)
b
b)
c
c) d)
d
e
f g h
e) f) g) h)
RS AS

88
Figure 4.48 - Cross section micrographs of sample D118-H. Trial group IV. (A-E) Details from superficial SiC reinforced layer produced at the retreating side, at bead center
and at the advancing side. (F,G) Particle distribution within the nugget. (H) Channel defect.
a
a)
b
b)
d
c) d)
e
f
g
h
e)
f) g)
h)
c RS AS

89
Figure 4.49 - Cross section micrographs of sample D12-O. Trial group IV. (A-E) Details from superficial SiC reinforced layer produced at the retreating side, at bead center and
at the advancing side. (F-H) Particle distribution within the nugget.
a
a)
b
b)
d
c) d)
f g
h
e
e) f) g) h)
c
AS RS

90
Figure 4.50 - Cross section micrographs of sample D37-O. Trial group IV. (A-E) Details from superficial SiC reinforced layer produced at the retreating side, at bead center and
at the advancing side. (F,G) Particle distribution within the nugget. (H) SiC particle logged inside channel.
a
a)
b
b)
d
c) d)
f g
h
e
e) f) g) h)
c
AS RS

91
Figure 4.51 - Cross section micrographs of sample D118-O. Trial group IV. (A-D) Details from superficial SiC reinforced layer produced at the retreating side, at bead center
and at the advancing side. (E-H) Particle distribution within the nugget.
a
a)
b
b)
d
c) d)
f
g
h e
e) f) g) h)
c
AS RS

92
From the tests conducted, it was seen it is easier to reinforce aluminium alloy
using the smaller size particles, as they are more easily dispersed and embedded in
the matrix. For larger sized particles, it was seen these are more difficult to disperse
and tend to be retained on the surface, increasing the roughness. Bonding to substrate
is weak. Particles tend to aggregate preferably on the retreating side, instead of
creating a homogeneous layer. Table 4.12 compares bead surface on the retreating
side for trial group IV, depicting an increase of roughness with particle size for both
material conditions. Figure 4.50D shows a particle fragmented in 3 pieces, showing
reinforcement fragmentation under tool frictional forces.
For the annealed material, the particle distribution was found to follow a more
regular alignment in the nugget as seen in Table 4.13. The number of particles for the
partially annealed condition test samples also appears to be more elevated.
The use of 37.4 and 118.8 µm median size particles led to a tool wear increase
with the incorporation of debris from the shoulder tool steel. EDS performed detected
iron, as well as, other alloying elements as Cr and Mo from the shoulder. These
constitute major inclusions on the processed surface and are more common on the RS,
due to SiC particle accumulation on this side, as shown in Figure 4.52. Figure 4.51D
shows SiC particles embedded inside tool steel inclusions, proving the intense wear
experienced by the shoulder, because temperature generation was capable to provide
the necessary viscosity for the steel to be mixed with the SiC. Wear is more intense in
the shoulder base that in the pin since none tool steel inclusions were found within the
nugget.
Figure 4.52- Tool steel inclusions along bead surface at the RS of sample D118-O.

93
Table 4.12 – Comparison between several SiC reinforced surface layers on the retreating side for trial
group IV. Samples D12-H (A), D37-H (B), D118-H (C), D12-O (D), D37-O (E) and D118-O.
(A) D12-H: Pin completely overlaps SiC packed groove. Average particle size: 12.3 µm.
Material: AA 5083-H111.
(B) D37-H: Pin completely overlaps SiC packed groove. Average particle size: 37.4 µm.
Material: AA 5083-H111.
(C) D118-H: Pin completely overlaps SiC packed groove. Average particle size: 118.8 µm.
Material: AA 5083-H111.
(D) D12-O: Pin completely overlaps SiC packed groove. Average particle size: 12.3 µm.
Material: AA 5083 partially annealed at 400°C for 3.5h.
(E) D37-O: Pin completely overlaps SiC packed groove. Average particle size: 37.4 µm.
Material: AA 5083 partially annealed at 400°C for 3.5h.
(F) D118-O: Pin completely overlaps SiC packed groove. Average particle size: 118.8 µm.
Material: AA 5083 partially annealed at 400°C for 3.5h.

94
Table 4.13 - SiC particle distribution within the nugget region for trial group IV. Samples D12-H (A), D37-H (B), D118-H (C), D12-O (D), D37-O (E), D118-O (F).
Base material condition
H111 Partially annealed
SiC
ave
rge
part
icle
siz
e (
µm
)
12.3
(A)
(D)
37.4
(B)
(E)
118
.8
(C)
(F)

95
FSP bead test samples for both material conditions show that the presence of
reinforcements is a major disruption to the viscoplastic flow, since poor consolidation
defect magnitude increase for the processing of SiC packed grooves. Beads presented
in Figure 4.53 and Figure 4.54 are similar to the beads of trial group I, except for the
vortex feature found adjacent to the nugget on the advancing side. By observing the
elliptical shape nugget and the particle distribution within this region (Table 4.13), it is
possible to assume that the particles are distributed along the onion rings.
Figure 4.53 - Cross section micrographs of sample B-H. Trial group V. (A) Not homogenised nugget
region, (B) homogenised nugget region, (C) surface striations, (D,E) TMAZ, (F) base material.

96
Figure 4.54 - Cross section micrographs of sample B-O. Trial group V. (A) Not homogenised nugget
region, (B) nugget centre, (C) surface striations, (D) TMAZ, (E) poor consolidation, (F) base material.
4.4.3. Scanning electron microscopy (SEM) and Energy dispersive x-ray
spectroscopy (EDS)
As seen in microscopic observation, tool wear led to the incorporation of several
tool steel inclusions along the bead surface. Through surface analysis under scanning
electron microscopy equipped with energy dispersed spectroscopy, iron was detected,
as well as, other alloying elements as Cr and Mo from the shoulder (Figure 4.56). The
EDS spectrum in Figure 4.57, concerning the silicon particles, presents a high level of
Si and traces of C. The bright white inclusions correspond to the tool material, while
SiC appears as grey coloured particles, as observed by Figure 4.55.

97
Figure 4.55 - SEM/EDS analysis to bead surface layer produced by the processing of 118.8 μm median
size particles in AA5083-H111 aluminium substrate.
Figure 4.56 - EDS spectrum for position #1, as marked in Figure 4.55.
Figure 4.57 - EDS spectrum for position #2, as marked in Figure 4.55.

98
These tool steal inclusions are more common in the RS, as seen in Figure 4.58,
as in the advancing side particle distribution is more scattered. Minor tool debris are
found at nugget region, as shown in highlighted in Figure 4.59, proving that wear is
more severe at the shoulder‟s concave surface and less on the pin. Small size iron
inclusions are frequent as they are related to material composition, not being due to
tool wear.
Figure 4.58 - SEM image of bead surface for sample D120-H at the RS (A) and AS (B).
Figure 4.59 - SEM image of nugget for sample D37-O.
SEM analysis also allows to study surface topography thanks to the large depth
of field featured in its images. Small particles are more easily distributed within the
nugget, creating scattered and relatively homogeneous distributions, such as the one
depicted by Figure 4.60.
(A) (B)
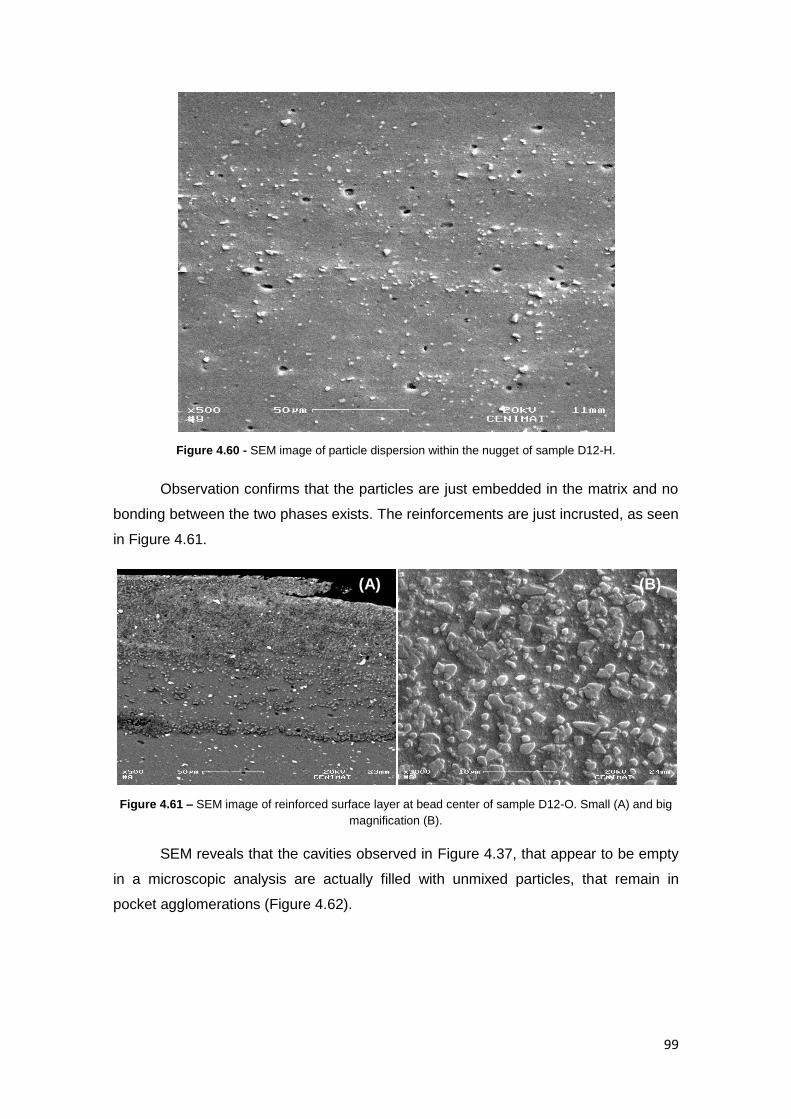
99
Figure 4.60 - SEM image of particle dispersion within the nugget of sample D12-H.
Observation confirms that the particles are just embedded in the matrix and no
bonding between the two phases exists. The reinforcements are just incrusted, as seen
in Figure 4.61.
Figure 4.61 – SEM image of reinforced surface layer at bead center of sample D12-O. Small (A) and big
magnification (B).
SEM reveals that the cavities observed in Figure 4.37, that appear to be empty
in a microscopic analysis are actually filled with unmixed particles, that remain in
pocket agglomerations (Figure 4.62).
(A) (B)

100
Figure 4.62 – SEM image of SiC particle agglomeration in pocket form. (A,B) Pocket contents.
Large field of view allows to explore the worm holes produced by insufficient
material flow. These channels are deep as they exist along bead direction, due to the
stationary nature of FSP.
Figure 4.63 – SEM image of Worm hole detail. Sample D118-H (A) and D118-O (B).
Shear lips present a mixture of several debris (SiC particles and tool steel
inclusions), as depicted in Figure 4.64.
Figure 4.64 - Shear lip on de AS. Sample D37-H.
(A) (B)
(A) (B)

101
4.4.4. Image processing
Analysing the percentage of SiC fraction area determined by image processing
techniques along the cross section of the processed layer, it can be observed that
there is a higher concentration in the retreating side than in the advancing side, leading
to a concentration gradient along this direction. A second concentration gradient is
measured along the depth of the processed layer as shown in Table 4.14. This table
summarizes the SiC fraction area for different reinforcement particle sizes and it is
noticed that for small particle sizes a higher concentration is obtained in a smooth
gradient along the depth. Additionally, this reinforced depth is larger when larger
particles are used, that is, the number of particles embedded in depth decreases for
larger particles. The concentration gradient parallel to the bead surface also becomes
sharper with particle size.
Figure 4.65 exhibits a more clear description of the two orthogonal gradients
found. There is no significant difference for the two conditions of base material tested.
Figure 4.65 - Example of SiC composition gradients in MMC‟s produced with 12.3 µm median size
particles and H111 material condition. (A) Gradient directions and (B) quantification.

102
Table 4.14 - SiC fraction area results along bead cross-section. Samples D12-H (A), D37-H (B), D118-H (C), D12-O (D), D37-O (E) and D118-O (F).
SiC median particle size (μm)
12.3 37.4 118.8
H111
(A)
(B)
(C)
Part
ially a
nn
eale
d
(D)
(E)
(F)

103
4.4.5. Hardness testing
Figure 4.66 shows the hardness profile in depth. It can be observed that the
surface zones have a hardness value similar to the SiC as the fraction area of
reinforcement is large. The hardness profile exhibits a sharp decrease to the average
aluminium volume. Within the nugget small variations are observed due to the
metallurgical transformation existing in this zone, as grain recrystallization and not due
to reinforcing effects of SiC particles.
Figure 4.66 - Harness profile for test sample D12-H.
Another observation consistent with microscopic observation, is that the
hardness is higher in the retreating side (5.15 GPa) and lower in the advancing side
(1.05 GPa) corresponding to higher and lower fraction areas of silicon carbides
observed in each zone, respectively. Hardness in bead surface center is within the
previous referred values (1.45 GPa). Therefore, the fraction area gradients observed,
resulted in hardness variations, as shown in Figure 4.67. However, hardness is
increased on very specific locations coincident with the SiC layers.

104
Figure 4.67 – Superficial hardness measurements for test sample D12-H. A) x=-4 hardness profile on the
retreating side. B) x=0 hardness profile on bead center. C) x=4 hardness profile on the advancing side.
For reinforcements with large particles this trend is not so smooth, since the
particles are dispersed and hardness results follow this dispersion.
Figure 4.68 - Surface x=4 Vickers hardness profile measurements for test sample
D122-H (A) and D122-O (B).
Hardness at nugget center is very similar for all test samples, which leads to the
conclusion that although material flow is strongly disturbed by the presence of the
larger dimension SiC particles (resulting in channel-like defects), plastic deformation
and heat generation is equivalent, because mechanical properties within the
dynamically recrystallized zone are very similar for test samples of same base material.
Figure 4.69 and 4.70 depict the hardness profiles for samples D37-H and D118-
H respectively, while Figure 4.71 illustrates the FSP bead for the AA5083-H111 base
material.
Figure 4.72 to 4.74 depict the hardness profiles for samples D12-O, D37-H and
D118-H respectively. Hardness profile for FSP bead in the partially annealed condition
is illustrated by Figure 4.75.

105
Figure 4.69 - Hardness profile for test sample D37-H.
Figure 4.70 - Hardness profile for test sample D118-H.
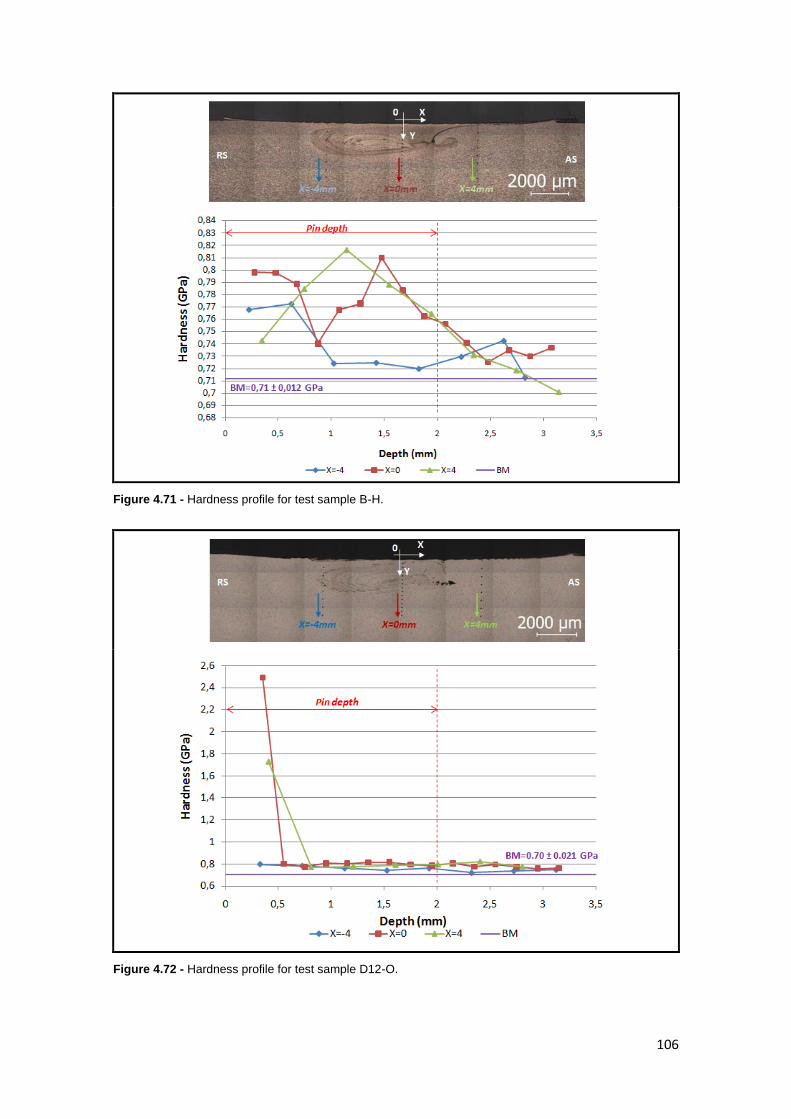
106
Figure 4.71 - Hardness profile for test sample B-H.
Figure 4.72 - Hardness profile for test sample D12-O.

107
Figure 4.73 - Hardness profile for test sample D37-O.
Figure 4.74 - Hardness profile for test sample O118-O.

108
Figure 4.75 - Hardness profile for test sample B-O.
4.4.6. Conclusions
From this study the following can be concluded:
1. It is possible to produce composite of hard materials by FSP in aluminium
based alloys with orthogonal gradients of composition and thus mechanical
behaviour.
2. The reinforcement method studied showed that the process is more
effective when the particles are compacted in a groove placed under the
pin.
3. If the groove is placed outside the pin interaction area, but within the
shoulder influence area, there is insufficient dispersion of particles. The
groove in the advancing side was seen to be free of particles, while the
groove in the retreating side was full of compacted particles.
4. For small size particles, the reinforced superficial layer coincides with
boundary layer dragged by the shoulder.
5. A weak bonding between the particles and the aluminium matrix is
observed. The reinforcements are just incrusted/embedded.

109
6. Small particles lead to higher SiC fraction areas along bead surface and to
smooth fraction gradients both in depth and along the direction parallel to
the surface.
7. The thickness of the reinforced layer is thin (between 50 and 70 µm) and
depends of the particle size within the parametric conditions and the tool
used in this investigation.
8. Hardness profiles evidence the thin reinforced layer.
9. Tool wear was very significant and could modify the initial shoulder concave
geometry. Considering that tool geometry determines material flow, this led
to poor material consolidation and channel-like defects that became larger
as tool wear progressed. Thus SiC particles are not technologically
compatible with tool material select for these FSP trials.

110
5. Final conclusions and suggestions for future work
The following overall conclusions result from the present study:
Surfaces produced by multiple-pass friction stir processing can be classified as
functionally graded materials as they present a microstructural variation along
thickness direction which results in a mechanical property continuous evolution.
The thin processed layer presents a finer grain structure and homogeneous
precipitate distribution responsible for mechanical property enhancement, namely
hardness, bending toughness.
Overlapping method determines mechanical property and surface finish.
Overlapping by the advancing side results in a more regular processed layer and
stable hardness profile, while the opposite leads to a smother surface finishing.
Surface composites produced by dispersing SiC reinforcements thru FSP material
flow present two orthogonal composition gradients, which are reflected in hardness
measurements.
Comparing tested reinforcing methods it is seen that the best results were
achieved when the pin fully overlapped the groove. Material flow is unable to close
grooves positioned on the advancing and retreating sides.
Finer reinforcements are more easily distributed throughout base material.
Material condition was seen to influence particle distribution, as softer materials
retain a larger quantity of particles.
Hardness measurements are consistent with image processing results, as high
SiC fraction areas present the most elevated hardness values.
Tool wear is very significant for tool steel materials used. Tool geometry was
modified during testing, resulting in channel defects and surface degeneration.
Future work proposals
Considering the intensive wear of the processes involved, consumable tool
concepts could be explored. Surfaces coatings created by shoulder material
adherence or deep reinforcing by continuous pin feeding may be possible
solutions.
Testing of the newly designed and manufactured tools (annex A) to assess the
influence of tool geometry on reinforcement distribution.
Future investigations should address new reinforcement strategies and process
parameters influence.

111
To increase particle distribution homogeneity, multiple-pass with full overlapping
should be investigated.
Since the SiC/aluminium bonding obtained by FSP is weak, reinforcements with
better base material affinity should be used.
Open channel packing proved to be inefficient, because SiC particles often were
expelled during processing. Reinforcement packing using slots or other covered
groove designs will increase reinforcement efficiency.
An interesting technology development would be the combination of both
approaches addressed by the present work. Surface generation through the
overlapping of SiC reinforced beads may be an effective way to reinforce wider
surfaces.
SiC reinforced composites wear testing should be addressed in future
investigations to develop wear resistant light weighted aluminium composites.

112
6. References
[1]. W. Thomas, “Friction Stir But Welding, International Patent Application Nº
PCT/GB92/02203 and GB Patent Application Nº 9125978.8”, US Patent
Nº5,460,317.
[2]. Z.Y. MA, “Friction stir processing technology: a review”, Metallurgical and
Materials Transactions A, 39A, (2008).
[3]. L. Karthikeyan, V.S. Senthilkumar, V. Balasubramanian, S. Natarajan,
“Mechanical property and microstructural changes during friction stir processing
of cast aluminum 2285 alloy”, Materials and design, 30, (2009), pp. 2237-2242.
[4]. R.S. Mishra, M.W. Mahoney, S.X. McFadden, N.A. Mara, A.K. Mukherjee, “High
strain rate superplasticity in a friction stir processed 7075 Al alloy”, Scripta
Materialia, 42, (2000), pp. 163-168.
[5]. Z.Y.Ma, R.S.Mishra, M.W.Mahoney, “Superplasticity in cast A356 induced via
friction stir processing”, Scripta Materialia, 50, (2004), pp. 931-935.
[6]. Z.Y.Ma, F.C. Liu, R.S. Mishra, “Superplastic deformation mechanism of an
ultrafine-grained aluminium alloy produced by friction stir processing”, Acta
Materialia, 58, (2010), pp. 4693-4704.
[7]. R.S. Mishra, Z.Y. Ma, “Friction stir welding and processing”, Materials Science
and Engineering R, 50, (2005), pp. 1-78.
[8]. B.C. Liechty, B.W. Webb, “Flow field characterization of friction stir processing
using a particle-grid method”, Journal of Materials Processing Technology, 208,
(2008), pp. 431-443.
[9]. R. Nandan, T. DebRoy, H.K.D.H. Bhadeshia, “Recent advances in friction-stir
welding –Process, weldment structure and properties”, Progress in Materials
Science, 53, (2008), pp. 980-1023.
[10]. A. Chang, X.H. Du, J. C. Huang, “Achieving ultrafine grain size in Mg-Al-Zn
alloy by friction stir processing”, Scripta Materiallia, 57, (2007), pp. 209-212.
[11]. Y.S. Sato, H. Kokawa, M. Enmoto, S. Jogan, Metallurgical and Materials
Transactions A, 30, (1999), pp. 2429.
[12]. F. M. Nascimento. “Processamento por fricção linear – Caracterização e
análise de ligas de alumínio processadas”. Lisboa, 2007. Dissertação
(Mestrado em Engenharia de Materiais) – Instituto superior técnico,
Universidade técnica de Lisboa.
[13]. K. Nakata, Y.G. Kim, H. Fujii, T. Tsumura, T. Komazaki, “Improvement of
mechanical properties of aluminum die casting alloy by multi-pass friction stir
processing”, Materials Science and Engineering A, 437, (2006), pp. 274-280.
[14]. M.L. Santella, T. Engstrom, D. Storjohann, T.-Y. Pan, “Effects of friction stir
processing on mechanical properties of the cast aluminum alloys A319 and
A356”, Scripta Materialia, 53, (2005), pp. 201-206;
[15]. A.H. Feng, Z.Y. Ma, “Enhanced mechanical properties of Mg-Al-Zn cast alloy
via friction stir processing”, Scripta Materiallia, 56, (2007), pp. 397-400.
[16]. A.G.Rao, B.R.K.Rao, V.P.Desmukh, A.K. Shah, B.P.Kashyap, “Microstructural
refinement of a cast hypereutectic Al–30Si alloy by friction stir processing”,
Materials Letters, 63, (2009), pp. 2628-2630.

113
[17]. DU Xing-hao, WU Bao-lin, “Using friction stir processing to produce ultrafine-
grained microstructure in AZ61 magnesium alloy”, Trans. Nonferrous Met. Soc.
China, 18, (2008), pp. 562-565.
[18]. Charit, R.S. Mishra, “Low temperature superplasticity in a friction-stir-processed
ultrafine grained Al-Zn-Mg-Sc alloy”, Acta Materialia, 53, (2005), pp. 4211-4223.
[19]. F.C. Liu, Z.Y. Ma, “Achieving exceptionally high superplasticity at high strain
rates in a micrograined Al-Mg-Sc alloy produced by friction stir processing”,
Scripta Materialia, 59, (2008), pp.882-885.
[20]. F.C. Liu, Z.Y. Ma, L.Q. Chen, “Low-temperature superplasticity of Al-Mg-Sc
alloy produced by friction stir processing”, Scripta Materialia, 60, (2009) 968-
971.
[21]. M.A. García-Bernal, R.S. Mishra, R. Verma, D. Hernández-Silva, “High strain
rate superplasticity in continuous cast Al-Mg alloys prepared via friction stir
processing”, Scripta Materialia, 60, (2009), pp. 850-853.
[22]. F.C.Liu, B.L.Xiao, K.Wang, Z.Y.Ma, “Investigation of superplasticity in friction
stir processed 2219Al alloy”, Materials Science and Engineering: A, 527,
(2010), pp. 4191-4196.
[23]. D.R. Ni, D. Wang, A.H. Feng, G. Yao, Z.Y. Ma, “Enhancing the high-cycle
fatigue strength of Mg-9Al-1Zn casting by friction stir processing”, Scripta
Materialia, 61, (2009), pp. 568-571.
[24]. S. Jana, R.S. Mishra, J.B. Baumannn, G. Grant, “Effect of stress ratio on the
fatigue behavior of a friction stir processed cast Al-Si-Mg alloy”, Scripta
Materialia 61 (2009) 992-995.
[25]. S.R. Sharma, Z.Y. Ma, R.S. Mishra, “Effect of friction stir processing on fatigue
behavior of A356 alloy”, Scripta Materialia, 51, (2004), pp. 237-241;
[26]. Shinoda T., “Effect of Tool Angle on Metal Phenomenon in Friction Stir Welds”,
3rd International Symposium on Friction Stir Welding, Port Island, Kobe, Japan,
2001;
[27]. A.K. Lakshminarayanan, V. Balasubramanian, “Process parameters
optimization for friction stir welding of RDE-40 aluminium alloy using Taguchi
technique”, Transactions of Nonferrous Metals Society of China, 18, (2008), pp.
548-554.
[28]. S. Babu, K. Elangovan, V. Balasubramanian, and M. Balasubramanian,
“Optimizing friction stir welding parameters to maximize tensile strength of
AA2219 aluminum alloy joints”, Metals and Materials International, Vol. 15,
2009, pp. 321-330;
[29]. Y.J. Kwon, I. Shigematsu, N. Saito, "Mechanical properties of fine-grained
aluminum alloy produced by friction stir process", Scripta Materialia, Vol. 49,
2003, pp. 785-789.
[30]. K. Elangovan, V. Balasubramanian, S. Badu, “Predicting tensile strength of
friction stir welded AA6061 aluminium alloy joints by a mathematical model”,
Materials and Design, Vol. 30, 2009, pp. 188-193;
[31]. L. Karthikeyan, V.S. Senthilkumar, K.A. Padmanabhan, “On the role of process
variables in the friction stir processing of cast aluminium A319 alloy”, Materials
and Design, Vol. 31, 2010, pp. 761-771.
[32]. K. Surekha, B.S. Murty, K.Prasad Rao, “Effect of processing parameters on the
corrosion behaviour of friction stir processed AA 2219 aluminum alloy”, Solid
State Sciences, Vol. 11, 2009, pp. 907-917.

114
[33]. K.Elangovan, V. Balasubramanian, “Influences of tool pin profile and welding
speed on the formation of friction stir processing zone in AA2219 aluminum
alloy”, Journal of Materials Processing Technology, Vol. 200, 2008, pp. 163-
175.
[34]. M.Ericsson, R. Sandström, “Influence of welding speed on the fatigue of friction
stir welds and comparison with MIG and TIG”, International Journal of Fatigue,
Vol. 25, 2003, pp. 1379-1387.
[35]. O. Lorrain, V. Favier, H. Zahrouni, D. Lawrjaniec, “Understanding the material
flow path of friction stir welding process using unthreaded tools”, Journal of
Materials Processing Technology, Vol. 210, 2010, pp.603-609.
[36]. D.G. Hattingh, C. Blignault, T.I. van Niekerk, M.N. James, “Characterization of
the influences of FSW tool geometry on welding forces and weld tensile
strength using an instrumented tool”, Journal of materials processing
technology, Vol. 203, 2008, pp. 46-57.
[37]. G. Padmanaban, V. Balasubramanian, “Selection of FSW tool pin profile,
shoulder diameter and material for joining AZ31B magnesium alloy – An
experimental approach”, Materials and Design, Vol. 30, 2009, pp. 2647-2656;
[38]. Yan-hua Zhao, San-bao Lin Wu, Fu-xing Qu, “The influence of pin geometry on
bounding and mechanical properties in friction stir weld 2014 Al alloy”, Materials
Letters, Vol. 59, 2005, pp. 2948-2952.
[39]. Z.Y. Ma, R.S. Mishra, “Development of ultrafine-grained microstructure and low
temperature (0.48 Tm) superplasticity in friction stir processed Al-Mg-Zr”, Scripta
Materialia, Vol. 53, 2005, pp.75-80.
[40]. K. Elangovan, V. Balasubramanian, “Influences of tool pin profile and tool
shoulder diameter on the formation of friction stir processing zone in AA6061
aluminium alloy”, Materials and Design, Vol. 29, 2008, pp. 362-373;
[41]. W. Thomas, P. Threadgill, D. Nicholas, “Tool technology – the heart of friction
stir welding”, TWI Ltd, 2000, pp. 3;
[42]. Paul A. Colegrove and Philip L. Threadgill, “Development of Trivex TM friction
stir welding Tool”, TWI Ltd, 2003;
[43]. Scialpi, L.A.C. De Filippis, P. Cavaliere, “Influence of shoulder geometry on
microstructure and mechanical properties of friction stir welded 6082 aluminium
alloy”, Materials and Design, Vol. 28, 2007, pp. 1124-1129.
[44]. Rajiv S. Mishra, Murray W. Mahoney, “Friction stir welding and processing”.
Ohio: ASM International, 2007, 1º Edition, ISBN-10: 087170840X
[45]. S.H.Kang, H.Chung, H.N. Han, K.H. Oh, C.G.Lee, S.Kim, “Relationship
between formability and microstructure of Al alloy sheet locally modified by
friction stir processing”, Scripta Materialia, 57, (2007), pp.17-20.
[46]. J.Sun, T. Nelson, C.Sterling, “Friction stir processing of large-area bulk UFG
aluminum alloys”, Scripta Materialia, 52, (2005), pp. 135-140.
[47]. L.B. Johannes, R.S. Mishra, “Multiple passes of friction stir processing for the
creation of superplastic 7075 aluminum”, Materials Science and Engineering A,
464, (2007), pp. 255–260;
[48]. Z.Y. Ma, S.R. Sharma, R.S. Mishra, “Effect of multiple-pass friction stir
processing on microstructure and tensile properties of a cast aluminum–silicon
alloy”, Scripta Materialia, 54, (2006), pp. 1623–1626;

115
[49]. K. Nakata, Y.G.Kim, H.Fujii, T.Tusumura, T.Komazaki, “Improvement of
mechanical properties of aluminium die casting alloy by multi-pass friction stir
processing”, Materials Science and Engineering A, 437, (2006), pp. 274-280.
[50]. Mishra, R.S., Ma, Z.Y., Charit, I., “Friction stir processing: a novel technique for
fabrication of surface composite”, Materials Science and Engineering A., 341,
2003, pp. 307-310.
[51]. B.Zahmatkesh, M.H.Enayati, “A novel approach for development of surface
nanocomposite by friction stir processing”, Materials Science and Engineering
A, 527, (2010), pp.6734-6740.
[52]. C.J.Lee, J.C.Huang, P.J.Hsieh, “Mg based nano-composites fabricated by
friction stir processing”, Scripta Materialia, 54, (2006), pp. 1415-1420.
[53]. E. R. I. Mahmoud, M. Takahashi, T. Shibayanagi and K. Ikeuchi, “Effect of
friction stir processing tool probe on fabrication of SiC particle reinforced
composite on aluminium surface”, Science and Technology of Welding and
Joining, 14, 5, (2009), pp. 413-425.
[54]. Y.Morisada, H.Fujii, T.Nagaoka, M.Fukusumi, “MWCNTs/AZ31 surface
composites fabricated by friction stir processing”, Materials Science and
Engineering A, 419, (2006), pp. 344-348.
[55]. Y.Morisada, H.Fujii, T.Nagaoka, M.Fukusumi, “Effect of friction stir processing
with SiC particles on microstructure and hardness of AZ31”, Materials Science
and Engineering A, 433, (2006), pp. 50-54.
[56]. M.Dixit, J.W. Newkirk, R. Mishra, “Properties of friction stir-processed Al 1100–
NiTi composite”, Scripta Materialia, 56, (2007), pp. 541-544.
[57]. C.J.Hsu, P.W. Kao, N.J. Ho, “Intermetallic-reinforced aluminum matrix
composites produced in situ by friction stir processing”, Materials Letters, 61,
(2007), pp. 1315-1318.
[58]. C.J.Hsu, C.Y.Chang, P.W. Kao, N.J. Ho, C.P.Chang, “Al–Al3Ti nanocomposites
produced in situ by friction stir processing”, Acta Materialia, 54, (2006), pp.
5241-5249.
[59]. C.J.Hsu, P.W. Kao, N.J. Ho, “Ultrafine-grained Al–Al2Cu composite produced in
situ by friction stir processing”, Scripta Materialia, 53, (2005), pp. 341-345.
[60]. Shafei-Zarghani, A., Kashani-Bozorg, S.F., Zarei-Hanzaki, “Microstructures and
mechanical properties of Al/Al2O3 surface nano-composite layer by friction stir
processing”, Materials Sci. and Engineering A, 500, (2009), pp. 84-91.
[61]. Neubrad, “Encyclopedia of Materials: Science and Tecnhology”, Elsevier,
(2001), ISBN: 978-0-08-043152-9, pp. 3407-3413.
[62]. M. Koizumi, “FGM activities in Japan”, Composites Part B 28B, (1997), pp. 1-4.
[63]. J.Aboudi, M-J. Pindera, S.M. Arnold, “Higher-order theory for functionally
graded materials”, Composites: part B, 30, (1999), pp. 777-832.
[64]. C.Y. Jian, T. Hashida, H. Takahashi, “Thermal shock and fatigue resistance
evaluation of functionally graded coating for gas turbine blades by laser heating
method”, Composites Engineering, 5, (1995).
[65]. F. Erdogan, “Fracture mechanics of functionally graded materials”, Composites
Engineering, 5, (1995), pp. 753-770.
[66]. Y. Miyamoto, W.A. Kaysser, B.H. Rabin, A. Kawasaki, R.G. Ford, “Functionally
graded materials: design, processing and applications”, Kluwer Academic
Publishers, Massachusetts, 1999, ISBN: 0-412-60760-3.

116
[67]. F. Watari, A. Yokoyama, F. Saso, T. Kawasaki, “Fabrication and properties of
functionally graded dental implant”, Composites part B, 28, (1997), pp. 5-11.
[68]. Y. Watanabe, N. Yamanaka, Y. Fukui, “Control of composition gradient in a
metal-ceramic functionally graded material manufactured by the centrifugal
method”, Composites Part A, 29A (1998), pp. 595-601
[69]. A. Velhinho, P.D. Sequeira, R. Martins, G. Vignoles, F.B. Fernandes, J.D.
Botas, L.A. Rocha, “X-ray tomographic imaging of Al/SiCp functionally graded
composites fabricated by centrifugal casting”, Nuclear Instruments and Methods
in Physics Research B, 200, (2003), pp. 295–302.
[70]. T.P.D. Rajan, R.M. Pillai, B.C. Pai, “Characterization of centrifugal cast
functionally graded aluminum-silicon carbide metal matrix composites”,
Materials characterization, 61, (2010), pp. 923-928.
[71]. A.C.Vieira, P.D. Sequeira, J.R. Gomes, L.A. Rocha, “Dry sliding wear of Al
alloy/SiCp functionally graded composites: Influence of processing conditions”,
Wear, 267, (2009), pp. 585-592.
[72]. Alcan technical catalogue for aluminium plates
[73]. Jean Barralis, Gérard Maeder, “Prontuário de metalurgia”, First Edition,
Fundação Calouste Gulbenkian (Lisbon, Portugal), ISBN 972-31-1106-3,
(2005), pp. 130.
[74]. Metals Handbook, Tenth Edition, Volume 4, ASM Metals Park (Ohio, USA).
[75]. A. Velhinho, PhD. Thesis, Universidade Nova de Lisboa.
[76]. LEGIO TM FSW 3U Friction Stir Welding Machine – Technical description
manual, pp. 9
[77]. Patente de Invenção Nacional PT N.º 104072, “Ferramenta Não Consumível
Modular Ajustável e Refrigerável para Soldadura e Processamento por Fricção
Linear”, data de prioridade 26/05/2008. Inventores: Telmo Santos, Pedro
Vilaça. Requerente: IST. Fase actual: vigente – concessão publicada.
[78]. P. Vilaça, “Fundamentos do Processo de Soldadura por Fricção Linear: Análise
Experimental e Modelação Analítica”, PhD Thesis, IST, 2003.
[79]. NP EN 910, “Ensaios Destrutivos de Soldaduras em Materiais Metálicos:
Ensaio de Dobragem”, 1999.
[80]. Metals Handbook, Tenth Edition, Volume 3, ASM Metals Park (Ohio, USA).
[81]. D.J. Lloyd, “Particle Reinforced Aluminium and Magnesium Matrix Composites”,
International Materials Reviews, 39, 1, (1994) pp. 1-23.
[82]. A.P. Reynolds, “Visualization of Material Flow in an Autogenous Friction Stir
Weld”, Science and Technology of Welding and Joining, 5, 2000, pp. 120-124.
[83]. T.U. Seidel, A.P. Reynolds, “Visualization of the material flow in AA2195
friction-stir welds using a marker insert technique”, Metallurgical and Materials
Transactions, A 32, 2001, pp. 2879-2884.
[84]. K. Colligan, “Material flow behaviour during friction stir welding of aluminum”,
Welding journal, 78, (1999), pp. 229-237.
[85]. C.G. Rhodes, M.W. Mahoney, W.H. Bingel, R.A. Spurling, C.C. Bampton,
“Effects of Friction Stir welding on microstructure of 7075 Aluminum”, Scripta
Materialia, 36, (1997), pp. 69-75.
[86]. Z.Y.Ma, S.R. Sharma, R.S. Mishra, “Effect of friction stir processing on the
microstructure of cast A356 aluminum”, Materials Science and Engineering A,
433, (2006), pp. 269-278.

117
[87]. W.J. Arbegast, “A flow-partitioned deformation zone model for defect formation
during friction stir welding”, Scripta Materialia 58, (2008), 372-376.
[88]. H. Chen, K. Yan, T. Lin, S. Chen, C. Jiang, Y. Zhao, “The investigation of
typical welding defects for 5456 aluminum alloy friction stir welds”, Materials
Science and Engineering A, 433, (2006), 64-69.
[89]. F. Nascimento, T. Santos, P. Vilaça, R.M. Miranda, L. Quintino, “Microstructural
modification and ductility enhancement of surfaces modified by FSP in
aluminium alloys”, Materials Science and Engineering A 506, (2009), pp. 16-22.

i
Annexes

ii
A1 – Technical drawing of FSP tool assembly with cylindrical pin

iii
A2 – Technical drawing of the tool body

iv
A3 – Technical drawing of the Ø7 shoulders

v
A4 – Technical drawing of the Ø7 threaded cylindrical pin

vi
A5 – Technical drawing of the Ø9 shoulders

vii
A6 – Technical drawing of the Ø9 conical pins
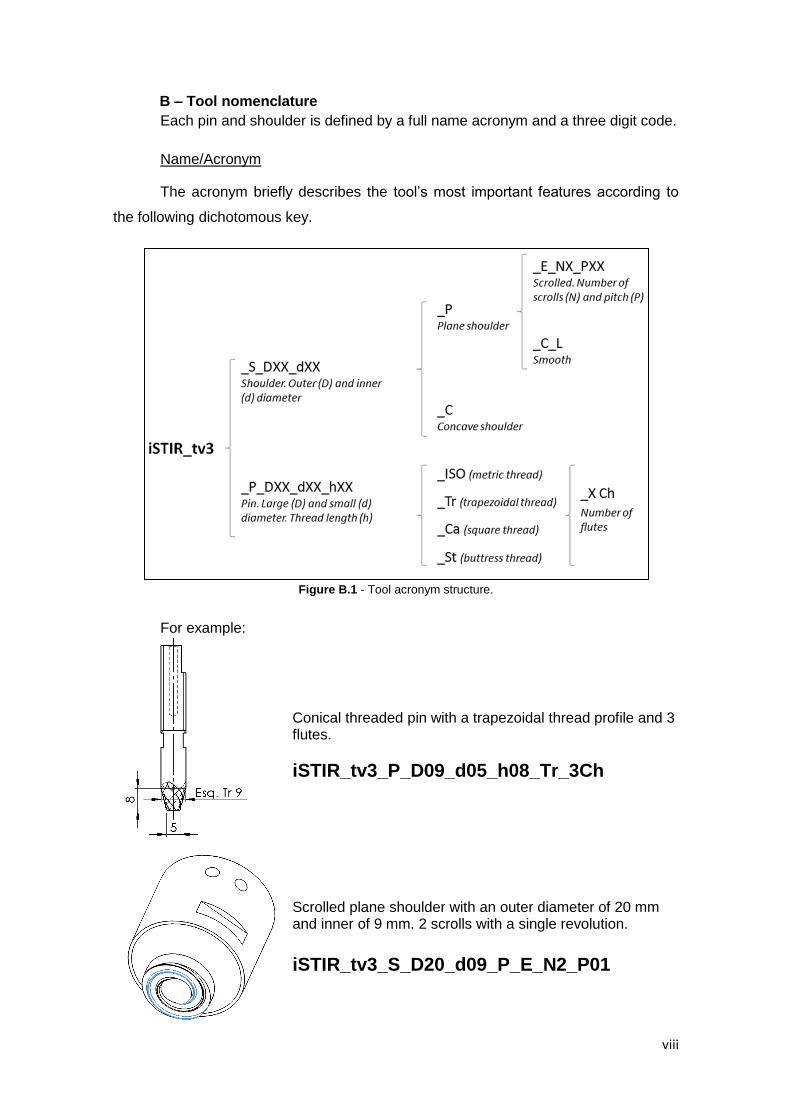
viii
B – Tool nomenclature
Each pin and shoulder is defined by a full name acronym and a three digit code.
Name/Acronym
The acronym briefly describes the tool‟s most important features according to
the following dichotomous key.
Figure B.1 - Tool acronym structure.
For example:
Conical threaded pin with a trapezoidal thread profile and 3 flutes.
iSTIR_tv3_P_D09_d05_h08_Tr_3Ch
Scrolled plane shoulder with an outer diameter of 20 mm and inner of 9 mm. 2 scrolls with a single revolution.
iSTIR_tv3_S_D20_d09_P_E_N2_P01

ix
Tool marking
A 3-digit code is engraved on each tool:
In which,
N1 – Shoulder/Pin diameter (Figure B.2).
L – Letter that allows tool identification within tool batch production.
N2 – Serial number.
Figure B.2 – Shoulder/Pin adjustment diameter.
A “Y” letter is also engraved to locate the face that prevents pin rotation.
Figure B.3 – “Y” mark.
N1 L N2

x
C – Sample extraction
Sample extraction for trial group I.
Sample extraction for trial group II-V.
M – Metallography sample; B – Bending test sample

xi
D1 – Technical drawing of bend testing experimental set-up

xii
D2 – Technical drawing of the former base
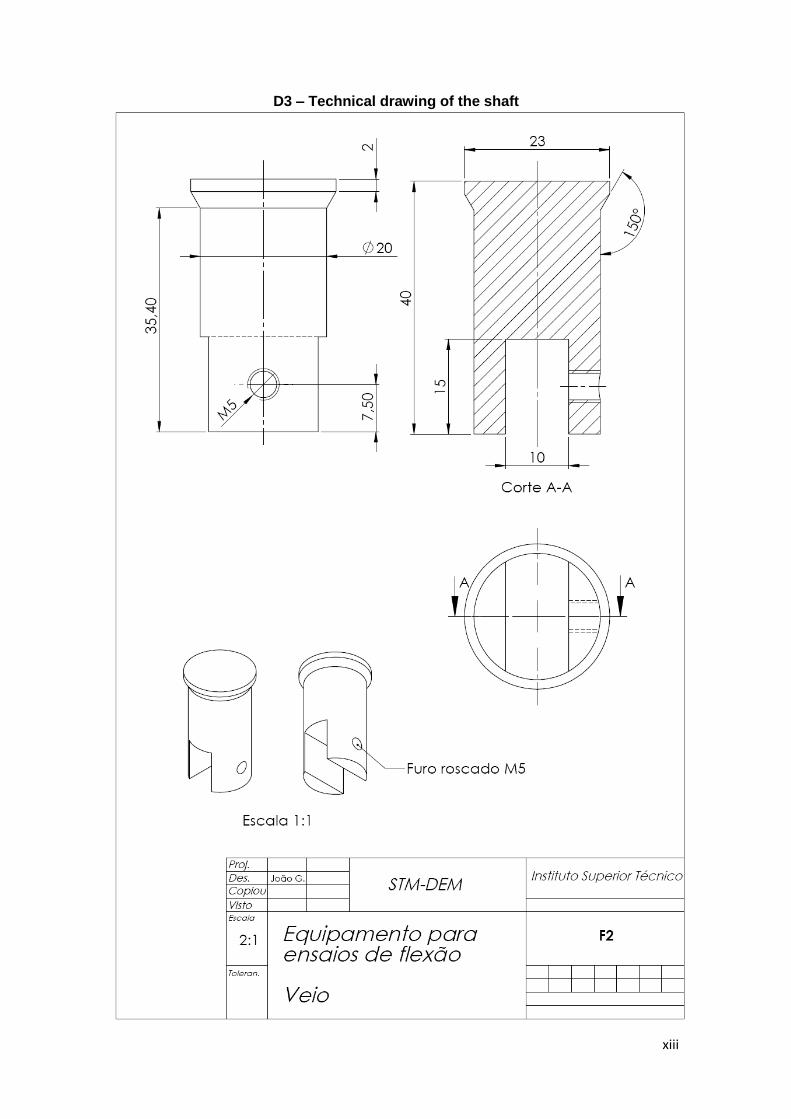
xiii
D3 – Technical drawing of the shaft

xiv
D4 – Technical drawing of the former

xv
E1 – Multiple-pass FSP surfacing procedure
These tests require an initial preparation phase involving the following steps:
i. Material acquisition from the same supplier and simultaneously.
ii. Plate sectioning into 200 x 200 mm samples
iii. Equipment and worktable cleaning.
iv. Fixturing system cleaning and assembly.
v. Determine process parameters.
vi. Shoulder and pin cleaning.
vii. Coat the assembly screws with Teflon; assemble the modular tool setting
the pin length.
viii. Tool‟s tilt angle setting.
ix. Tool assembly in the machine.
x. Enable equipment‟s water cooling.
xi. Adjust the z-axis bottom reference in the machine coordinate system.
This preparation steps that are followed by the systematic experimental work:
1. Plate fixturing.
2. Process parameters setting in the machine‟s control panel.
3. Process cycle start.
4. After cycle end, set new x-plunge position in the control panel according
to the OR and the direction of overlapping.
5. Repeat step 4 and 5 until the full area processing
6. Remove plate.
7. Photograph the surface and visual inspection.
8. For further FSP surfacing sample production repeat steps 1-7.

xvi
E2 – SiC reinforcement by FSP procedure
These tests require an initial equipment preparation phase involving the
following steps:
i. Material acquisition from the same supplier and simultaneously.
ii. Plate sectioning into 200 x 200 mm samples.
iii. Milling of 1.5 mm square section grooves.
iv. Cleaning of milling machine.
v. Cleaning of FSW equipment and worktable.
vi. Fixturing system cleaning and assembly.
vii. Determine process parameters.
viii. Shoulder and pin cleaning.
ix. Coat the assembly screws with Teflon; assemble the modular tool setting
the pin length.
xii. Tool‟s tilt angle setting.
x. Tool assembly in the machine.
xi. Enable equipment‟s water cooling.
xii. Adjust the z-axis bottom reference in the machine coordinate system.
This preparation steps that are followed by the systematic experimental work:
1. Plate fixturing.
2. Groove packing with SiC particles, removing eventual excesses from the
workpiece surface.
3. Set process parameters in the machine‟s control panel.
4. Process cycle start.
5. After cycle end, set new plunge position in the control panel.
6. Repeat step 2 and 5 for further FSP beads.
7. Remove plate.
8. Photograph the reinforced beads.
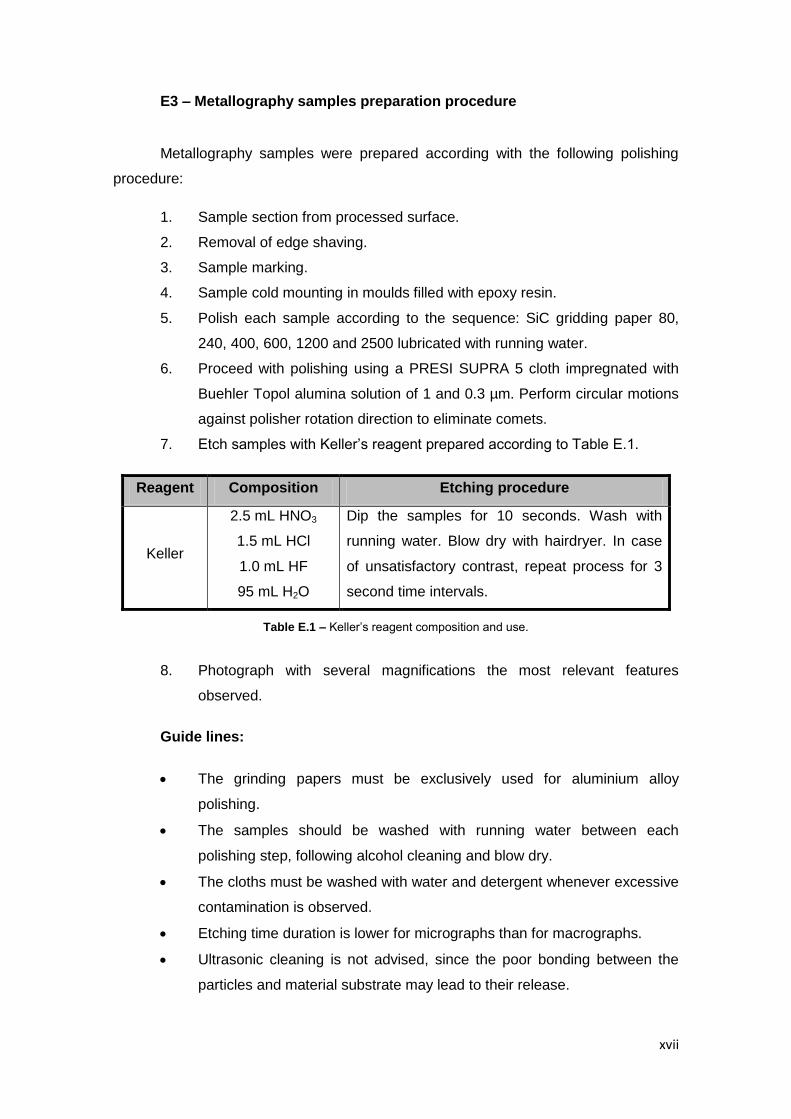
xvii
E3 – Metallography samples preparation procedure
Metallography samples were prepared according with the following polishing
procedure:
1. Sample section from processed surface.
2. Removal of edge shaving.
3. Sample marking.
4. Sample cold mounting in moulds filled with epoxy resin.
5. Polish each sample according to the sequence: SiC gridding paper 80,
240, 400, 600, 1200 and 2500 lubricated with running water.
6. Proceed with polishing using a PRESI SUPRA 5 cloth impregnated with
Buehler Topol alumina solution of 1 and 0.3 µm. Perform circular motions
against polisher rotation direction to eliminate comets.
7. Etch samples with Keller‟s reagent prepared according to Table E.1.
Reagent Composition Etching procedure
Keller
2.5 mL HNO3
1.5 mL HCl
1.0 mL HF
95 mL H2O
Dip the samples for 10 seconds. Wash with
running water. Blow dry with hairdryer. In case
of unsatisfactory contrast, repeat process for 3
second time intervals.
Table E.1 – Keller‟s reagent composition and use.
8. Photograph with several magnifications the most relevant features
observed.
Guide lines:
The grinding papers must be exclusively used for aluminium alloy
polishing.
The samples should be washed with running water between each
polishing step, following alcohol cleaning and blow dry.
The cloths must be washed with water and detergent whenever excessive
contamination is observed.
Etching time duration is lower for micrographs than for macrographs.
Ultrasonic cleaning is not advised, since the poor bonding between the
particles and material substrate may lead to their release.

xviii
E4 – Three point bend testing procedure
1. Sample section and machining according to the standard dimensions.
2. Edge rounding to a 0.8 mm radius by mechanical abrasion using a 100
gridding paper.
3. Set the distance between the rollers.
4. Place the sample on the rollers, aligning bead center with former.
5. Initialize data acquisition software.
6. Start testing at constant velocity.
7. The test was stopped when bending force decreased to a null value or
with sample collapse.
8. Remove the sample.
9. Save data.
10. For further testing repeat steps 4-9.


