Gamma Ho lding NV Annua l Report 2001
72
Gamma Holding Annual Report 2001 Gamma Holding NV Annual Report 2001 Gamma Holding NV Hoogeindsestraat 47 P.O. Box 80 5700 AB Helmond The Netherlands Tel. 31 492 570933 Fax 31 492 529445 Internet: www.gammaholding.com E-mail: [email protected] Brought to you by Global Reports
Transcript of Gamma Ho lding NV Annua l Report 2001

Gamma Holding Annual Report 2001
Gamma Holding NV Annual Report 2001
Gamma Holding NVHoogeindsestraat 47P.O. Box 805700 AB HelmondThe NetherlandsTel. 31 492 570933 Fax 31 492 529445Internet: www.gammaholding.comE-mail: [email protected]
Brought to you by Global Reports

Brought to you by Global Reports

Gamma Holding Annual Report 2001
Contents
Profile of Gamma HoldingDear shareholder: foreword by J.G.M. van Oijen, chairman of the Board of Managing DirectorsKey figures/Gamma Holding, a five-year summaryInformation about the Gamma Holding shareThe BoardsCorporate staff management/Members of the European Works Council Report of the Supervisory Board
Report of the Board of Managing Directors
GeneralMarket leadersStrategyResultsCurrency managementInvestments and financingOrganisation and personnelCorporate social responsibilityGamma TechnologiesProcess and Conveyor Belts Specialties
Screen and Filter Technology Coated Fabrics/Composite Materials Sailcloth Industrial Fabrics
Gamma Industrial Textiles Automotive Industrial Applications Gamma Exotic Fabrics Outlook
Location of operations
Annual accounts
Accounting policies Consolidated balance sheet Consolidated profit and loss account Consolidated statement of cash flows Notes to the consolidated balance sheet Notes to the consolidated profit and loss account Corporate balance sheet Corporate profit and loss account Notes to the corporate balance sheet Investments
Other information
Profit appropriation Stichting Preferente Aandelen Gamma Holding Auditor’s report
4567101112
14
1414141415161617202021242525282929323637
38
41
42454647485862626368
70
707171
Brought to you by Global Reports

4
Gamma Holding Annual Report 2001
Profile of Gamma Holding
Gamma Holding develops, manufactures and sells high-quality, innovative, textile-based productsthroughout the world. It has 98 companies in 36 countries, with a total of 9,612 employees. Its head-quarters are based in Helmond, the Netherlands. Gamma Holding’s shares are listed on the EuronextAmsterdam stock exchange.
Gamma Holding is structured in three sectors comprising five core activities, which are leaders in theirglobal markets:
Gamma Technologies
The Gamma Technologies sector, which accounts for 44% of Gamma Holding’s turnover, comprisesoperating companies that deliver quality products for technical applications in industry. The core activitiesare:• Process and Conveyor Belts. In this segment, Ammeraal Beltech is one of the world market leaders
in ultra-durable process and conveyor belts for e.g. the food and drinks industry, agriculture andhorticulture, and business services and logistics, for instance for airports and mail sorting systems.
• Specialties. This segment comprises various companies that are active in the fields of screen and filtertechnology, coating and composites technology, sailcloth technology and industrial woven and knittedfabrics.
Gamma Industrial Textiles
The Gamma Industrial Textiles sector generates 37% of Gamma Holding’s turnover with high-qualitypatterned fabrics for industrial customers. The core activities are:• Automotive. This segment supplies fabrics for car upholstery. The companies De Witte Lietaer and
Delcar are among Europe’s largest manufacturers in this field. • Industrial Applications. This segment is engaged, via the company Bekaert, in the manufacture of
high-quality mattress ticking and buggy and garden furniture fabrics.
Gamma Exotic Fabrics
The Gamma Exotic Fabrics sector accounts for 19% of Gamma Holding’s turnover. Through thecompanies of the Vlisco Group, Exotic Fabrics is active in the design, manufacture and distribution ofhigh-quality dyed and printed exotic fabrics – based on the batik process – for the top and mid segmentsof the West African market.
Growth and return
Gamma Holding strives for quantitative and qualitative growth, both organic and through acquisitions.Acquisitions are intended to expand the existing activities and to increase market share. Further opportunities for growth are sought in attractive new – possibly related – markets.
Activities that show a structural lack of profitability or no longer fit in with the strategy are divested. Risk is limited by spreading the activities over various regions and market segments.
Gamma Holding strives for an average annual growth of earnings per share of 10% and a return on capitalemployed (including goodwill) of 15%.
Brought to you by Global Reports

5
Gamma Holding Annual Report 2001
Dear shareholder,
As this annual report shows, 2001 was a difficult year for Gamma Holding NV, with our financial resultsturning out lower than was expected at the time of publication of the half-yearly figures. With turnoverdown, the net profit from normal business operations decreased by 36% compared with 2000.
In particular, the continuing global economic downturn and the strong price pressure in a number ofsegments had a negative financial impact on our company. As an industrial supplier, Gamma Holding’sbusiness performance is closely bound up with the general state of the economy.
This does not alter the fact that Gamma Holding is on course with its strategy. The market positions in the various sectors and segments in which we are active are outstanding. These positions were furtherstrengthened in the year under review, particularly through the acquisition of the Madison Filter Group at the end of the year.
In 2001 the discontinuation of the interior-decoration products activities was completed and theintegration of Ammeraal and Beltech took further shape, improving the cohesion and profile ofGamma Holding. In addition, initiatives were taken throughout the group to refine the distributionnetwork and to manufacture more efficiently and at lower cost. Moreover, by spreading the activities over various regions and market segments, the risks are limited.
In these and other ways, the transformation initiated several years ago from a traditional textile companyto a company that excels – with high-quality technical textiles – in niche markets throughout the world,was given fresh impetus in the year under review. The innovations in all segments, to which specialattention is devoted in this annual report, are also part of that strategy.
It is indicative of the development of our group that the proportion of turnover generated by the GammaTechnologies sector has risen from just 18% in 1997 to 44% in 2001. The Specialties segment, in whichGamma Holding is pursuing further growth in various niche markets, has more than quadrupled in thatperiod, while the proportion accounted for by the Process and Conveyor Belts core activity more thandoubled. It is expected that the technology sector will continue to grow in importance in the coming years.
We believe that this strategy can create lasting value for our shareholders. Due to the poorer results,Gamma Holding was unable to maintain the average annual increase in earnings per share of 10% in2001. However, once the economy recovers, we will again be able to achieve this target in the comingyears.
Our confidence is founded upon the quality and professionalism of the employees in all of the company’sactivities. Their considerable efforts and commitment, also in these difficult times, have contributed to thecontinuity of Gamma Holding.
J.G.M. van OijenChairman of the Board of Managing Directors
Brought to you by Global Reports

6
Gamma Holding Annual Report 2001
Key figures/Gamma Holding, a five-year summary
(6 x 1,000,000) 2001 2000 1999 1998 1997
Net turnover 906.0 938.4 866.6 799.3 763.8 Amortisation of intangible fixed assets 0.1Depreciation of tangible fixed assets 45.4 41.8 38.8 28.9 28.7 Operating result 70.2 104.7 100.0 70.4 64.4 Group result from normal business operations after taxation 30.4 48.1 44.5 39.1 36.6 Result from normal business operations after taxation 30.4 47.6 43.3 37.3 34.2 Result after taxation 30.4 17.6 43.3 37.3 34.2 Cash flow 1,7 75.9 89.4 82.1 66.2 62.9 Dividend 12.1 19.2 17.4 15.7 13.7 Investments in intangible fixed assets 13.3Investments in tangible fixed assets 55.4 61.4 57.0 45.9 28.8 Shareholders’ funds at year-end 182.6 164.9 174.6 230.9 206.7 Average shareholders’ funds 178.5 175.7 158.6 221.0 201.0 Group equity at year-end 185.9 168.8 178.6 242.9 219.3 Guarantee capital at year-end 206.2 198.1 216.9 242.9 219.3 Capital employed 2 at year-end 543.0 460.1 437.4 362.0 286.1 Average capital employed 2 505.1 470.1 429.8 312.1 296.2 Balance sheet total at year-end 766.8 743.7 709.4 555.6 495.6 Personnel costs 254.3 250.0 228.8 208.2 202.4
Number of employees at year-end 9,612 8,793 8,202 8,370 8,882Average number of issued ordinary shares 7,518,535 7,455,784 7,251,407 6,738,943 6,680,935
Amounts in 6 per ordinary share of 6 2.50
Cash flow 3,7 10.08 11.99 11.31 9.81 9.40 Result from normal business operations after taxation 3 4.03 6.38 5.95 5.52 5.10 Result after taxation 3 4.03 2.35 5.95 5.52 5.10 Dividend 1.60 2.54 2.36 2.18 2.04 Shareholders’ funds 4 at year-end 24.16 21.81 23.61 33.94 30.81 Price of ordinary share at year-end 33.38 40.00 38.20 39.48 46.74
Ratios
Operating result as a % of net turnover 7.8 11.2 11.5 8.8 8.4 Group result after taxation 7 as a % of net turnover 3.4 5.1 5.1 4.9 4.8 Return on average capital employed (as a %) 5,7 13.9 19.6 19.2 22.6 22.0 Result after taxation 7 as a % of average shareholders’ funds 17.0 27.1 27.3 16.9 17.0 Interest coverage ratio 6 3.4 5.8 7.6 10.5 9.0 Shareholders’ funds as a % of the balance sheet total 23.8 22.2 24.6 41.5 41.7 Group equity as a % of the balance sheet total 24.2 22.7 25.2 43.7 44.3 Guarantee capital as a % of the balance sheet total 26.9 26.6 30.6 43.7 44.3 Current assets/current liabilities 1.0 1.1 1.3 1.4 1.6 Share price/cash flow 3,7 3.3 3.3 3.4 4.0 5.0 Share price/result after taxation 3,7 8.3 6.3 6.4 7.2 9.2
1 Result after taxation plus depreciation (amortisation) of (in)tangible fixed assets2 Group equity plus balance of interest-bearing funds3 Excluding dividend on preference shares4 Excluding preference share capital5 Result before taxation and interest from normal business operations6 Result before taxation and interest from normal business operations divided by interest7 Excluding extraordinary result
Brought to you by Global Reports

7
Gamma Holding Annual Report 2001
Information about the Gamma Holding share
Listing of the Gamma Holding share
The Gamma Holding share is listed on the Official Market of Euronext Amsterdam and is included in theNext Prime and the Next 150.
With the introduction of the FTSE classification on Euronext, the Gamma Holding share has beenclassified in the Engineering General subsector within the General Industries economic group.
The number of issued shares of 5 2.50 was:
14-03-2002 31-12-2001 31-12-2000Ordinary shares 7,518,535 7,518,535 7,518,535Ordinary participating preference shares 400,000 400,000 400,000
As of 14 March 2002 the market capitalisation of the shares was 5 262 million, compared with5 347 million as of 15 March 2001.
Option rights
In the year under review the company granted 33,100 option rights to the members of the Board ofManaging Directors, corporate staff management and the directors of its operating companies. These are outlined on pages 65 and 66 of the annual accounts.
Performance of the Gamma Holding share
The price of the share fluctuated between a low of 5 29.95 on 30 November 2001 and a high of 5 50.00on 3 March 2001. The closing price on 28 December 2001 was 5 33.38.
Performance of the share, trend in earnings per share 1 and dividend per share (in 5)
7
6
5
4
3
2
1
0
70
60
50
40
30
20
10
01997 1998 1999 2000 2001
Earnings per share Dividend per share Share price at year-end
1 From normal business operations
Brought to you by Global Reports
8
Gamma Holding Annual Report 2001
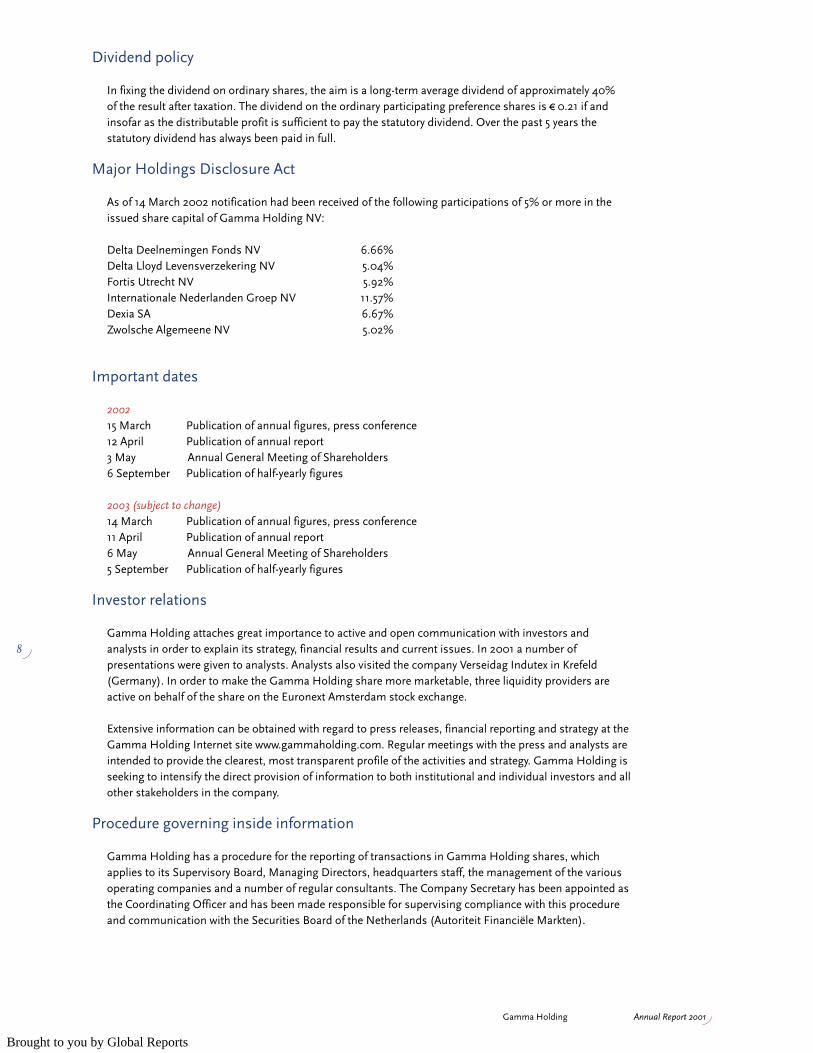
Dividend policy
In fixing the dividend on ordinary shares, the aim is a long-term average dividend of approximately 40% of the result after taxation. The dividend on the ordinary participating preference shares is 5 0.21 if andinsofar as the distributable profit is sufficient to pay the statutory dividend. Over the past 5 years thestatutory dividend has always been paid in full.
Major Holdings Disclosure Act
As of 14 March 2002 notification had been received of the following participations of 5% or more in theissued share capital of Gamma Holding NV:
Delta Deelnemingen Fonds NV 6.66%Delta Lloyd Levensverzekering NV 5.04%Fortis Utrecht NV 5.92%Internationale Nederlanden Groep NV 11.57%Dexia SA 6.67%Zwolsche Algemeene NV 5.02%
Important dates
200215 March Publication of annual figures, press conference12 April Publication of annual report3 May Annual General Meeting of Shareholders6 September Publication of half-yearly figures
2003 (subject to change)14 March Publication of annual figures, press conference11 April Publication of annual report6 May Annual General Meeting of Shareholders5 September Publication of half-yearly figures
Investor relations
Gamma Holding attaches great importance to active and open communication with investors andanalysts in order to explain its strategy, financial results and current issues. In 2001 a number ofpresentations were given to analysts. Analysts also visited the company Verseidag Indutex in Krefeld(Germany). In order to make the Gamma Holding share more marketable, three liquidity providers areactive on behalf of the share on the Euronext Amsterdam stock exchange.
Extensive information can be obtained with regard to press releases, financial reporting and strategy at theGamma Holding Internet site www.gammaholding.com. Regular meetings with the press and analysts areintended to provide the clearest, most transparent profile of the activities and strategy. Gamma Holding isseeking to intensify the direct provision of information to both institutional and individual investors and allother stakeholders in the company.
Procedure governing inside information
Gamma Holding has a procedure for the reporting of transactions in Gamma Holding shares, whichapplies to its Supervisory Board, Managing Directors, headquarters staff, the management of the variousoperating companies and a number of regular consultants. The Company Secretary has been appointed asthe Coordinating Officer and has been made responsible for supervising compliance with this procedureand communication with the Securities Board of the Netherlands (Autoriteit Financiële Markten).
Brought to you by Global Reports

9
Gamma Holding Annual Report 2001
Further information
For further financial information about the company, please contact:Gamma Holding NVA.G.J. Groote Schaarsberg, Head of Investor RelationsHoogeindsestraat 47P.O. Box 805700 AB HelmondThe NetherlandsTel. 31 492 570544 Fax 31 492 529445E-mail: [email protected] Internet: www.gammaholding.com
Brought to you by Global Reports

10
Gamma Holding Annual Report 2001
The Boards (as of the date of the report)
Supervisory Board
H.B. van Liemt, chairman (68)Appointed on 6 May 1992, term of office ends in 2004 (retiring in 2002), Dutch nationalityFormer chairman Board of Management DSM NVVice-chairman Supervisory Board ABN AMRO Holding NVChairman Supervisory Board Stienstra Holding BV and Sara Lee/DE NVMember Board of Directors Sara Lee Corp.
J.A. Dekker (62)Appointed on 6 May 1993, term of office ends in 2005 (available for reappointment), Dutch nationalityChairman Board of Management TNOMember Supervisory Board ASML NV and Koninklijke BAM-NBM NVChairman EARTO
J.F. van Duyne (60)Appointed on 3 May 2001, term of office ends in 2005 (available for reappointment), Dutch nationalityFormer chairman (joint) Board of Directors Corus Group PlcMember Supervisory Board De Nederlandsche Bank NV, OPG Groep NV, Samas Groep NV, Verkade NVand Tennet BVBoard member Stichting Preferente Aandelen Buhrmann NV and Stichting Continuïteit BoskalisWestminster NVChairman Stichting Administratiekantoor VediorCrown-appointed member Sociaal-Economische Raad
R. Hazelhoff (71)Appointed on 6 May 1992, term of office ends in 2002, Dutch nationalityFormer chairman Board of Management ABN AMRO Holding NVChairman Supervisory Board Heineken NV, Twentsche Kabel NV and Nederlandse Waterschapsbank NVMember Supervisory Board Koninklijke Nedlloyd NV
R.K.T. Oetker (52)Appointed on 7 September 1999, term of office ends in 2003 (available for reappointment), German nationalityPresident Deutsche Schutzvereinigung für WertpapierbesitzChairman Supervisory Board Mulligan BioCapital AGMember Supervisory Board IKB Deutsche Industriebank AG, Volkswagen AG and Degussa AGMember Administrative Board Scottish Widows Pan European Smaller Companies OEICChairman Advisory Board Falke Bank AGMember Advisory Board Dr. August Oetker-Gruppe and E.ON Venture Partners GmbH
P.A.W. Roef (69)Appointed on 1 May 1995, term of office ends in 2003 (available for reappointment), Dutch nationalityFormer chairman Board of Managing Directors Gamma Holding NVChairman Supervisory Board VNU NV and Parcom NVMember Supervisory Board Koninklijke Numico NV and Robeco NV
J.W.B. Westerburgen (59)Appointed on 7 May 1991, term of office ends in 2003 (available for reappointment), Dutch nationalityFormer company secretary UnileverMember Supervisory Board Unilever Nederland BVMember Vereniging AEGON
Brought to you by Global Reports

Gamma Holding Annual Report 2001
J.G.M. van Oijen, chairman (59)M. Veninga (51)
T.G.L.M. Meevis, Company Secretary
F. Keun Director of Human ResourcesW.R. van der Willigen Director of Finance & AdministrationA.G.J. Groote Schaarsberg Head of Investor Relations
G.A. Gout Ames Europe EnschedeF. de Almeida Ames Europe FranceF.J. van der Heide Ammeraal Beltech Netherlands M. Sanz Sanz Ammeraal Beltech SpainMs S. Farley Ammeraal Beltech UKJ. De Turck Bekaert Decoration TextilesJ. Anraed Bekaert Mattress TickingI. Dewever Bekaert Mattress TickingP. Loncke Bekaert Mattress Ticking C. Pollart Delcar Ph. Noppe De Witte LietaerMs K. Bonnet De Witte LietaerW. Grudfeld Dimension-PolyantS. Koch Schoedel Ms S. Schmitz Verseidag-IndutexJ. Dix Verseidag-TechfabJ.A.G. van der Heijden Vlisco Helmond N.J. Loendersloot Vlisco Helmond
Corporate staff management
Members of the European Works Council
Board of Managing Directors
Brought to you by Global Reports
12
Gamma Holding Annual Report 2001
Report of the Supervisory Board
To the shareholders of Gamma Holding NV
We hereby present to you the annual accounts for 2001 drawn up by the Board of Managing Directors.
These annual accounts comprise:• the consolidated balance sheet as of 31 December 2001;• the consolidated profit and loss account for 2001;• the consolidated statement of cash flows for 2001;• the corporate balance sheet as of 31 December 2001;• the corporate profit and loss account for 2001;• the explanatory notes thereto.
The annual accounts have been examined by PricewaterhouseCoopers NV, independent publicaccountants, as witnessed by their report, which is to be found under ‘Other information’ on page 71.
We endorse these accounts and ask you to:
1. approve the annual accounts for 2001;2. declare a dividend of 5 0.21 per share of 5 2.50 on the ordinary participating preference shares;3. declare a dividend of 5 1.60 per share of 5 2.50 on the ordinary shares.
Composition of Supervisory Board
At the annual General Meeting of Shareholders, which was held on 3 May 2001, the Supervisory Board wasenlarged with the appointment of Mr J.F. van Duyne. This appointment was made in the light of the statedintention of our chairman, Mr H.B. van Liemt, to retire from the Supervisory Board at the annual GeneralMeeting of Shareholders in 2002.
The Supervisory Board intends to appoint Mr Van Duyne as chairman. The Supervisory Board also intendsto appoint Mr J. Zuidam as a new member of the Supervisory Board.
In the year under review we were saddened to learn of the death of Prof. F. Koning. Following hisappointment to the Supervisory Board on 6 May 1992, Mr Koning, emeritus professor of social law atErasmus University Rotterdam, devoted his best endeavours to Gamma Holding. In so doing, hedemonstrated considerable social involvement, as reflected in, for instance, his contacts with theCentral Works Council. The Supervisory Board owes him a special debt of gratitude for his invaluablecontribution.
Supervision
In view of the size of the Supervisory Board, no committees have been set up; instead, all subjects arediscussed by the full Supervisory Board. On a number of subjects there is regular consultation betweenthe chairman of the Supervisory Board and the chairman of the Board of Managing Directors. There is astanding order for the Supervisory Board, which defines, among other things, the allocation of tasks andthe procedures of the Board.
In the year under review the Supervisory Board met nine times with the Board of Managing Directors.Besides periodic discussion of the course of business, the company’s performance and the operatingcompanies, particular attention was devoted to the company’s strategy and risk profile, the divestmentand acquisition policy (e.g. the divestment of the Interior-Decoration Products sector and the acquisitionof the Madison Filter Group) and the possibilities for cooperation with other parties.
The discussion of the annual report and annual accounts took place in the presence of the auditor.
The composition and procedures of our Board and the Board of Managing Directors were discussed at a meeting at which the Board of Managing Directors was not present. On three occasions in 2001 theSupervisory Board was represented at a consultative meeting of the Central Works Council.
Brought to you by Global Reports

13
Gamma Holding Annual Report 2001
With regard to Corporate Governance, the company, as stated in the appendix to the annual report for1997, still complies with virtually all the recommendations of the Corporate Governance Commission.
Developments
The adverse economic developments in 2001 impacted Gamma Holding’s results, leading to theimplementation of measures to control costs. In addition, further steps were taken – in the form ofacquisitions and divestments – to improve the profile of the company. The Supervisory Board is convincedthat this policy will bear fruit in the coming years.
We wish to express our gratitude to the Board of Managing Directors and all employees for theconsiderable effort and commitment they have shown over the past year and for their contribution to the further development of the company.
Helmond, 14 March 2002
Supervisory Board
H.B. van Liemt, chairmanJ.A. DekkerJ.F. van DuyneR. HazelhoffR.K.T. OetkerP.A.W. RoefJ.W.B. Westerburgen
Brought to you by Global Reports
14
Gamma Holding Annual Report 2001
Gamma Holding NV continues to develop into a company where the emphasis is on technology. In somesectors, design plays an important role and traditional techniques such as knitting and weaving often formthe basis for innovative new processes. Increasingly, however, Gamma Holding’s success is based onprocessing and coating techniques and synthetic wovens intended for technological applications.
In 2001 this strategy took on a new dimension. For example, the divestment programme for the interior-decoration products activities, which had been initiated in 1999, was completed. The following companieswere sold in 2001: Léo Schellens, Sanderson, Eijffinger, Hatéma Contract, E&S Home of Color and Dawes.Because an adequate provision had been taken for this divestment in 2000, the interior-decorationproducts activities no longer had an impact on the operating result in 2001.
The strategic choice to put technology at the heart of the company was given a substantial boost at theend of 2001 with the takeover of the Madison Filter Group. This acquisition significantly expanded thefilter activities of the Gamma Technologies sector, most importantly with the addition of new applications.This sector had already received a boost with the integration of Ammeraal Conveyor Belting and VerseidagBeltech. Since 1 January 2001 these companies have been operating under one name: Ammeraal Beltech.
Market leaders
Gamma Holding has become a company of international renown whose innovative, high-quality productsare increasingly being delivered on a business-to-business basis. Our companies are among the marketleaders in all sectors and segments in which they are active.
For instance, Process and Conveyor Belts and Industrial Applications have made it into the global topthree, Specialties is the leading player in various niche markets, Automotive is one of the front runners in Europe, and Exotic Fabrics, with its unique position in West Africa, is the market leader.
Strategy
Healthy, organic growth is being pursued in the existing (core) activities, where product innovation isconstant and ongoing. Further opportunities for growth will be created by acquisitions in existing andattractive new – possibly related – markets. Activities that show a structural lack of profitability or nolonger fit in with the strategy are divested, as was done with the interior-decoration products companies.
The strategy of the group is further shaped by measures to improve efficiency and thus control costs.Because of the increasing price pressure in various segments, it is a strategic necessity to continuallyreview how a structural reduction in the level of costs can be achieved. The scope for such a reduction isbeing explored in the Gamma Industrial Textiles sector (with the Automotive and Industrial Applicationssegments) in particular, because of growing price pressure from increasingly large industrial alliances.
Results
2001 was a difficult year for Gamma Holding. Turnover decreased by 3% compared with the year before,and the net result from normal business operations declined by a substantial 36%. The weak economicclimate particularly impacted turnover and results in the Process and Conveyor Belts, Automotive andIndustrial Applications segments. As a result of the sharp downturn of the American economy, a numberof companies with a strong focus on the United States, mainly in the Specialties segment, were unable tosustain the positive trend of the first half of the year. The performance of Exotic Fabrics was satisfactory.
Report of the Board of Managing Directors
General
Brought to you by Global Reports

15
Gamma Holding Annual Report 2001
The turnover of Gamma Holding fell by 3% to 5 906 million in 2001. The net profit from normal businessoperations totalled 5 30.4 million, compared with 5 47.6 million in 2000 (after extraordinary expense:5 17.6 million), a decline of 36%. The profit per share from normal business operations fell by 37% to5 4.03 (2000: 5 6.38). The operating result fell by 33%, from 5 104.7 million in 2000 to 5 70.2 million in 2001. The operating result as a percentage of turnover amounted to 7.8% (2000: 11.2%).
The deficit on the balance of financial income and expense decreased to 5 20.5 million in 2001 from5 28.6 million in 2000, due in part to the 5 7.7 million positive effect of the absence of the negativeoperating result of the deconsolidated Interior-Decoration Products sector.
The effective tax rate rose by 2.1% from 36.8% to 38.9%, mainly due to non-offset losses.
The net result after extraordinary expenses increased from 5 17.6 million to 5 30.4 million.
Currency management
The currency risk policy is formulated centrally; implementation takes place both centrally and locally. A distinction is made between risks related to operational transactions (transaction risk) and risksresulting from the conversion of assets and liabilities into foreign currency (translation risk). The policy, aswell as the ensuing financial transactions, is aimed at reducing the group’s currency risk. Internaldirectives emphasise the importance of this.
Quantification of transaction risks is the responsibility of the operationally independent operatingcompanies. Wherever possible, authority is delegated to where the corresponding accountability lies andwhere transfer of the risk in the operational sphere is possible. In practice, this means that transactionrisks are hedged up to around 1 year in advance, insofar as the specific market position of the operatingcompany allows this. Forward exchange contracts, which are concluded at aggregate level with financialinstitutions by Gamma Holding’s central treasury department, are mainly used for this.
Taking fiscal conditions into account, foreign operating companies are financed with debt in the localcurrency so that the translation risk on the shareholders’ funds is kept as low as possible. As part of thefinancing policy, this reconciliation of assets and liabilities in foreign currency is carried out centrally. Thislocal currency financing also ensures that the result is less exposed to exchange rate fluctuations. Theremaining translation risk on the shareholders’ funds and risk resulting from reported results are, inprinciple, not hedged.
Assets and liabilities in the annual accounts of foreign group companies are converted at the ratesprevailing on the balance sheet date. Income and expenses in the annual accounts of foreign groupcompanies are converted at the average rate for the year.
The conversion rates applied for the principal currencies in 2001 and 2000 are as follows (5 1 =):
31-12-2001 31-12-2000 average 2001 average 2000AUD 1.73 1.68 1.74 1.58CHF 1.48 1.52 1.51 1.56GBP 0.61 0.62 0.62 0.61GHC 6,471 6,641 6,462 4,806USD 0.88 0.93 0.90 0.93
At year-end 2001, exchange rate differences arising from the translation risk had a net negative effect of5 0.4 million on the financial position, mainly due to a year-on-year decrease in the year-end rate of theeuro against the US dollar, the Swiss franc and the Ghanian cedi and a year-on-year increase in the year-end rate of the euro against the Australian dollar.
Brought to you by Global Reports

Gamma Holding Annual Report 2001
In 2001, exchange rate movements had virtually no effect on turnover and a positive effect of 1% on theoperating result, mainly due to a decrease in the average rate of euro against the US dollar and the Swissfranc and an increase in the average rate of the euro against the Ghanian cedi and the Australian dollar.
Investments and financing
Investments in tangible fixed assets in 2001 totalled 5 55.4 million, 10% lower than in 2000(5 61.4 million). Depreciation amounted to 5 45.4 million, compared with 5 41.8 million in 2000.Investments in group companies totalled 5 28.3 million in 2001, compared with 5 7.4 million in 2000.Stocks and trade debtors increased to 5 364.4 million (2000: 5 362.8 million).
The cash flow – the result from normal business operations after taxation plus depreciation andamortisation – amounted to 5 75.9 million, compared with 5 89.4 million in 2000.
In net terms, interest-bearing funds totalled 5 357.1 million at year-end 2001 (2000: 5 291.3 million). This increase is mainly attributable to the acquisition of the Madison Filter Group. A loan of 5 55 millionwas taken out to finance this takeover. This loan will, in combination with other credit facilities, berefinanced in 2002.
Based on the dividend proposal, group equity after profit appropriation amounted to 5 185.9 million atyear-end 2001 (2000: 5 168.8 million). Group equity amounted to 24.2% of the balance sheet total at year-end 2001 (2000: 22.7%). The guarantee capital amounted to 26.9% of the balance sheet total at year-end2001 (2000: 26.6%).
Organisation and personnel
Gamma Holding has a decentralised organisation. The companies have a large degree of autonomy andresult focus within agreed and clearly defined financial parameters. Tax planning, treasury, insurance andinvestor relations are carried out centrally. Strategic investments and acquisitions are also coordinatedcentrally.
The lines of reporting to the Board of Managing Directors are short, enabling the latter to monitor thecourse of business continuously, to measure performance against the internal profitability targets and,where necessary, to make adjustments at an early stage. The Board of Managing Directors has closecontact with the management teams of all the core activities. Reporting to headquarters takes placemonthly.
Synergy within the group is achieved by promoting cooperation and exchange of know-how in importantfields such as technology, product development and purchasing. Headquarters identifies, initiates, guides,checks and approves strategic company activities within the various segments.
Human resource policy within the group is shaped locally. This approach reflects the fact thatGamma Holding is active in many countries, each with its own laws and culture in the field of working and employment conditions.
Accordingly, the operating companies pursue their own human resource policy, tailored to the localsituation, within parameters set by the group. For example, in 2001 Gamma Holding Nederland signed a covenant with the Ministry of Social Affairs and Employment and the Ministry of Large Cities andIntegration Policy regarding the employment and integration of people from ethnic minorities.
At year-end 2001 the total number of employees of Gamma Holding was 9,612, an increase of 9% on2000. This increase was mainly due to the takeover of the Madison Filter Group and expansion ofproduction in Africa, at JTL (spinning and weaving works in Ghana). 54% of the workforce was employedin Europe, of whom 11% in the Netherlands. 46% of the workforce was employed outside Europe.
16
Brought to you by Global Reports

17
Gamma Holding Annual Report 2001
As well as works councils and other forms of employee participation in the various companies,Gamma Holding has a European Works Council. At the latter’s annual meeting, the developments and prospects for the group, as well as strategic choices, were discussed.
Corporate social responsibility
Gamma Holding prides itself on being a good corporate citizen. As such, it develops wide-ranginginitiatives in the fields of, for instance, social and environmental policy. We see it as our task to formulatepolicies that enable us to fulfil our social responsibility even more effectively.
The companies of Gamma Holding strive for quality and continuity by means of a focused managementdevelopment and human resources policy that is designed to offer the employees maximum scope fordevelopment. The provisions we have made for medical care for our employees in West Africa are anexample of how we address our social responsibility.
A responsible and sustainable environmental policy is part of the overall business operations. Because ofthe international spread of the group’s activities, the operating companies of Gamma Holding are subjectto divergent environmental legislation. The frequently specific and complex environmental issues are,where necessary and possible, coordinated centrally and addressed locally.
A considerable amount of time and energy is invested in continuous education and training of ouremployees in the field of environmental care. The policy is implemented at the level of the operatingcompanies, which put the general principles into practice. In the year under review, particular emphasiswas again placed on issues such as energy, water purification, minimising the use of pigments andchemicals, and emission of CO2.
Brought to you by Global Reports

process and conveyor belts
Gamma Holding Annual Report 2001
Brought to you by Global Reports

Gamma Holding Annual Report 2001
Rolling road for Formula 1
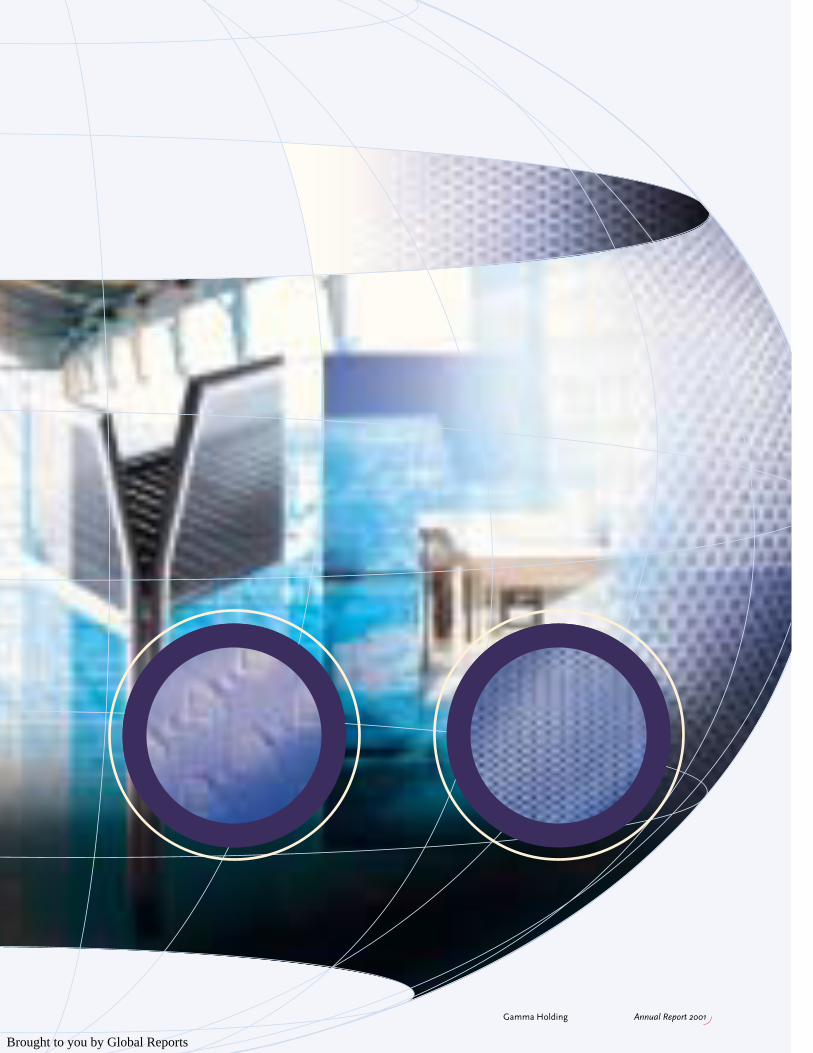
With its durable conveyor belts, Ammeraal Beltech is helpingFormula 1 racing cars to find a new balance. The aerodynamicproperties of the cars are tested on these belts in speciallyconstructed wind tunnels.
These tests make it possible to further perfect the technical featuresof the racing cars. They also contribute greatly to improving safetythroughout the entire automobile industry. In both Italy and Englandnew developments in technology and materials are tested regularly by a number of racing teams.
The ‘rolling road’ is just one of the innovations that make Ammeraal Beltechstand out in the world of process and conveyor belts. This special applicationsimulates the road under the racing cars that are used in the tests.
The wind tunnel belts are 2 to 2.5 m in width and 6 m in length. They run at highspeed – some 80 m per second, more than 260 km per hour – in the windtunnels, whilst the pressure and air resistance of the materials, amongst otherthings, are measured.
The special quality of the fabric (left-hand circle), the coating (centre circle) and thetread (right-hand circle) of the conveyor belts are of paramount importance in theseapplications. The thickness tolerance of the entire belt, including the join, is alsoextremely important because any bulges could have fatal consequences. Furthermore,if the racing car loses its equilibrium, this will also affect the speed and greatly reducethe life of the belt.
The belts developed by Ammeraal Beltech for the wind tunnels are not only used in the racing world, they are also used by universities and other organisations.
Brought to you by Global Reports

20
Gamma Holding Annual Report 2001
Gamma Technologies
Gamma Technologies is the sector that is expected to generate the strategic growth of Gamma Holding.The ongoing transformation from a traditional textile company to a company employing highly advancedprocesses to manufacture products for technological applications is most apparent in this sector.
The sector comprises two segments, Process and Conveyor Belts and Specialties, which togetheraccounted for approximately 44% of the total turnover of Gamma Holding in 2001. The operatingcompanies in the sector develop, manufacture and deliver quality products for technical applications inindustry.
In the year under review, the turnover and operating result of the Process and Conveyor Belts segmentwere under pressure. The Specialties segment was affected – through the companies Ames Europe and, toa limited extent, Techfab/IFC – by lower demand from the automobile industry. The other activities ofTechfab/IFC and Dimension-Polyant delivered a positive performance. The company Indutex managed tofurther increase sales and income in all three of its product groups, leading to a sharp rise in turnover andoperating result.
The net turnover of the sector as a whole fell by 2%, from 5 406 million in 2000 to 5 398 million in 2001.The operating result of the sector as a whole decreased by 22%, from 5 40.2 million in 2000 to5 31.4 million in 2001.
Process and Conveyor Belts
(6 x 1,000,000) 2001 2000 index
Net turnover 217 234 93Operating result 14.0 21.4 66Operating result as a % of turnover 6.5 9.2
Investments 11.3 9.0 125Depreciation 10.3 11.8 87
EBITA1 14.1 21.3 66Average capital employed2 186 181 103Return on capital employed as a % 7.6 11.8
Number of employees at year-end 1,681 1,717 98
In the Process and Conveyor Belts segment, ultra-durable process and conveyor belts are manufacturedand supplied to e.g. the food and drinks industry, agriculture and horticulture, and business services andlogistics, for instance for airports and mail sorting systems. In this segment, Ammeraal Beltech is one ofthe global market leaders with a market share of more than 20%.
More and more, process and conveyor belts are made of synthetic materials. The material is often textile-based, but the specific characteristics are increasingly determined by coating techniques. The segmentsupplies a wide range of products.
Ammeraal Beltech was created by the merger of Ammeraal Conveyor Belting and Verseidag Beltech. The acquisition of Verseidag in 1999 doubled Gamma Holding’s volume of business in this segment.Since 1 January 2001 the two companies have been operating under one name. Synergy benefits andeconomies of scale can be achieved by merging distribution channels and optimising the product range.
1 Result before taxation and interest from normal business operations plus amortisation of goodwill2 Including goodwill
Brought to you by Global Reports

Gamma Holding Annual Report 2001
The efficiency of the production facilities is increasing as a result of further specialisation. The integrationalso offers a broader basis for the development of new products.Innovation and service are key in this segment. New belts are constantly being developed andmanufactured in close consultation with the customer. Thanks to an extensive service network, customerservice can be provided locally. This is extremely important for, among other things, the replacementmarket. When large Western European and American multinationals started operations in Russia, forexample, Gamma Holding also opened a sales and service office there. This strategy means that thecompanies in this segment have to operate globally.
The main production facilities are in the Netherlands, Spain, Switzerland and the United States.Ammeraal Beltech also has sales and service offices in 24 countries and an extensive network ofdistributors in more than 120 countries. The sales personnel in these countries have a technicalbackground, so that they can identify any technical problems quickly and provide solutions.
Ammeraal Beltech is responding to the trend whereby major global customers want to be supplied bysuppliers that are of a similar size and have a global presence. Gamma Holding intends to boost itsmarket leadership in this segment through acquisitions and expansion of the product range.
The Process and Conveyor Belts segment was impacted by the unfavourable economic climate in 2001. In the United States this led to a decline in the operating result. In Europe, on the other hand, theoperating result remained at virtually the same level as in 2000. The integration process at AmmeraalBeltech temporarily put pressure on sales. Due to these factors, the net turnover fell by 7%, from5 234 million in 2000 to 5 217 million in 2001. The operating result declined by 34%, from 5 21.4 million to 5 14.0 million.
Specialties
(6 x 1,000,000)1 2001 2000 index
Net turnover 181 172 105Operating result 17.4 18.8 93Operating result as a % of turnover 9.6 10.9
Investments 16.2 9.0 180Depreciation 10.2 8.3 123
EBITA 17.4 18.5 94Average capital employed2 196 191 103Return on capital employed as a % 8.9 9.7
Number of employees at year-end 1,625 881 184
The Specialties segment comprises a number of companies that are active in a variety of specialist fieldssuch as screen and filter technology, coating and composites technology, sailcloth technology and wovenand knitted industrial products. Outstanding results have been achieved with high-tech products over aperiod of many years.
Specialties is a core activity on which Gamma Holding is focusing strongly. Expansion will come fromorganic growth in the existing markets and complementary acquisitions. At the end of the year thisstrategy was underlined by the acquisition of the Madison Filter Group, giving added impetus to ourscreen and filter technology. Throughout the segment, opportunities for synergy are being explored inresearch and development programmes. Consideration is being given to expanding the activities in relatedmarkets.
1 Including Madison Filter Group from 1 December 20012 Including goodwill
21
Brought to you by Global Reports

screen and filter technology
Gamma Holding Annual Report 2001
The intellectual assets of Madison Filter
With the takeover of the Madison Filter Group, Gamma Holding has acquired a world leader in filter technology. Madison Filter consistently distinguishes itself
with innovations for the filtration of solids from liquids and dust from gases.
Madison Filter’s intellectual property has grown over the years and now boasts morethan seventy patents and trademarks. This illustrates the strong scientific dimension
that Madison Filter always adds to its activities.
Madison Filter has a global network of laboratories and applied research centreswhere – often in close cooperation with universities – innovative solutions are found
for industrial partners. At these centres of innovation, researchers from a variety ofscientific backgrounds share their knowledge via the Intranet as they work on thedevelopment of new products and technologies.
The permanent staff of these establishments includes chemists, material scientists,process engineers and textile specialists. They have established an outstandingreputation for the development of quality products that help to solve customers’problems. Augmenting the group’s central laboratories in Haslingden in the UnitedKingdom, more specialists are employed at research centres in Australia, Swedenand the United States. Thanks to this approach, not only does development from idea to product takeplace close to the point of use, communication with the customer is faster. It alsomakes it easier to tailor innovations to specific regional needs and requirements.
Madison Filter is renowned throughout the world for its innovative solutions tocomplex problems. The group uses its extensive expertise in raw materials to
develop advanced filters and is able to separate very small particles.Examples of innovations include the improvement of wear-resistant
materials (left-hand circle), micro-porous coatings and fine filtrationtechnology (centre circle), and highly efficient ceramic technology
(right-hand circle).
The substantial investments in research and developmentreflect Madison Filter’s commitment to the filter industry.
They also provide fresh impetus to the search forinnovative solutions for the customer.
Brought to you by Global Reports

Gamma Holding Annual Report 2001
Brought to you by Global Reports

24
Gamma Holding Annual Report 2001
The Specialties segment was affected – through the companies Ames Europe and, to a limited extent,Techfab/IFC – by lower demand from the automobile industry. The other activities of Techfab/IFC andDimension-Polyant delivered a positive performance. The company Indutex managed to further increasesales and income in all three of its product groups, leading to a sharp rise in turnover and operating result.In the segment as a whole, turnover increased by 5%, from 5 172 million in 2000 to 5 181 million in 2001.The operating result fell by 7%, from 5 18.8 million to 5 17.4 million.
Screen and Filter Technology
In Techfab/IFC, Gamma Holding has one of the world’s largest manufacturers of screen and filterproducts. With its leading-edge technology and fine-mesh products, which are deployed in end-userapplications, Techfab/IFC is one of the world’s top three companies in this niche market. Manufacturing is concentrated in Germany and the United States, but the products are sold throughout the world, partlybecause the sales and service departments are able to deliver custom solutions.
Techfab/IFC’s advanced, innovative products play a leading role in the graphics industry, where they areused e.g. for displays and for printing on CDs. Other filter products from Techfab/IFC are used in thepetrochemicals industry, in mining, for medical and environmental applications and for microfiltration.
At the end of 2001 the filter activities of Gamma Holding were significantly expanded. Agreement wasreached with Madison Filtration SA regarding the acquisition of the Madison Filter Group based inHaslingden, United Kingdom. This acquisition is in line with Gamma Holding’s strategy of expansion andbroadening of this segment. Gamma Holding had been seeking to expand its filter activities for sometime. The acquisition of Madison Filter will strengthen market leadership.
Madison Filter is active in the field of wet and dry filtration with products based on media such assynthetic wovens, metal wovens and ceramics. These products are used in process engineeringapplications in the food, chemicals and pharmaceuticals industries. In addition, Madison Filter sells itsproducts to companies engaged in the production of paper, wood and mineral fibre boards and in thefields of metallurgy, non-wovens and air and wastewater purification.
Research and innovation are central to Madison Filter’s strategy. The company has an extensive laboratory,where new filter media are developed and end-use applications for filters are tested. This has enabledMadison Filter to develop considerable know-how in the field of filter technology, and the company holdsmany patents.
Madison Filter’s manufacturing facilities are located in the United Kingdom, the United States, Swedenand Australia. In addition, it has its own sales and service offices in Canada, Germany, France, Finland,South Africa, New Zealand, Singapore and Brazil. In most markets, Madison Filter is one of the marketleaders. In 2001 the group generated a turnover of approximately 5 75 million; it has some 750 employees.
Madison Filter has been included in the consolidated accounts of Gamma Holding with effect from1 December 2001. The results of Madison Filter had virtually no effect on the consolidated results for theyear under review.
Excluding acquisitions, Screen and Filter Technology achieved a significantly lower operating result than in 2000. Excluding acquisitions, turnover fell by 4%, from 5 53 million in 2000 to 5 51 million in 2001. The acquisition of Madison Filter added 5 5 million to the turnover of the filter activity. The operating result as a percentage of turnover was still above the group level. In the first half of the yearthis group managed to compensate for the disappointing turnover in the United States with an increase inturnover in Asia and Europe. The group was unable, in the short term, to compensate fully for the furtherdecline in turnover in the United States with growth in other geographical markets.
Brought to you by Global Reports

Gamma Holding Annual Report 2001
Coated Fabrics/Composite Materials
Indutex is a leading developer and manufacturer of a wide range of highly diverse products based oncoating and composites technology. The company has modern production facilities in Germany and salesoffices in the United Kingdom and the United States. With its production facilities, it is able to respondflexibly to the rapidly changing demands of customers.
The products are marketed under their own brand name. For instance, products that form the basis forluxury VIP tents, containers and large membrane constructions are sold under the brand name Duraskin.Striking examples of these constructions are to be found throughout the world. They are, for example, anintegral part of the exterior of the HSV football stadium in Hamburg and the Olympic Stadium in Munich,the Dresdner Bahnhof, the Burj al Arab Hotel in Dubai, the Forum in Luxembourg, the KeysboroughGolfclub in Victoria and the Sony Center on the Potzdammerplatz in Berlin. More and more modernarchitects who are working with steel and glass and using light creatively, apply these materials in theirdesigns, e.g. as the world-famous architect Sir Norman Foster did in Dresden. This is conclusive evidenceof the value of these materials, which are being further perfected through this interaction.
The brand Seemee relates to products for media applications. Indutex is one of the few suppliers that canseamlessly manufacture billboards 5 m wide. These billboards are being used, for instance, to encase theBrandenburg Gate during its restoration. This specialisation, which also includes flatscreens of the samewidth and light-emitting bus shelters, is a booming business. These techniques are increasingly beingapplied to buildings and lorries. The 5 m-wide coating machine purchased during the year under reviewimmediately went into full use.
Another fast-growing product of Indutex is Ultrax, a hyper-modern bullet-proof material that, thanks to itsfeatherweight structure, is widely applied in special clothing, military vehicles and armoured cars from e.g.Mercedes, BMW and Audi. Ultrax is eminently suitable for custom solutions. At the end of 2001 Indutexwas also asked to develop this material for aircraft cockpit doors.
These positive developments, in all three of Indutex’s product groups, were reflected in an increase inturnover and operating result. Turnover rose by 22% from 5 46 million in 2000 to 5 56 million in 2001. The operating result as a percentage of turnover also increased and is now above the group level.
Sailcloth
In Dimension-Polyant, Gamma Holding has a world market leader in the field of sailcloth technology. The company develops and manufactures high-tech sails for very large sailing ships, racing yachts,catamarans and trimarans, but also for surfboards, hang-gliders and balloons. Dimension-Polyant servesthe top and mid segments of the market.
Dimension-Polyant’s high-quality sailcloths are used by, for instance, Olympic champions and participantsin the Admiral’s Cup. The sailcloths are supplied to sailmakers and are manufactured according to exactcomputer calculations.
The company has its own development and manufacturing centres in Germany and the United States,which have produced many innovative products. Besides sailcloth, these centres develop high-qualityproducts for sportswear, footwear, rucksacks and balloons. The fact that NASA is one of the company’scustomers speaks volumes. Dimension-Polyant has its own sales organisations in France, the UnitedKingdom, Denmark and Australia.
The turnover of Dimension-Polyant increased by 3%, from 5 39 million in 2000 to 5 40 million in 2001. The operating result was virtually unchanged from the year before and, as a percentage of turnover,remained above the group level. The facility in the United States in particular had to contend with a lowerturnover in the second half of the year, which meant that it was unable to maintain the outstandingperformance of the first half of the year.
25
Brought to you by Global Reports

automotive
Gamma Holding Annual Report 2001
Social trends form basis for new designs
De Witte Lietaer, Gamma Holding’s Belgian company in the Automotive segment, has started a new trend in car upholstery. Its latest tasteful designs have been
developed in response to, and in anticipation of, social developments in the fields of design and architecture.
Innovative forms and refined textiles add a newdimension – in terms of safety, comfort and durability
– to the car interior of the future. Working in conjunctionwith large car manufacturers, the company has developed
upholstery fabrics that appeal to the tastes andrequirements of modern users.
De Witte Lietaer pioneered new applications because it hadbecome apparent that the traditional velours, which had
dominated the field of car upholstery fabrics until recently,was becoming less popular. Since then, the search has beenon to find an aesthetic, more modern replacement and to give velours a whole new look.
That process has now resulted in a diversification of threadsand yarns, with the development of an upholstery fabric thatincorporates elastic thread to provide greater comfort andreduced wear (left-hand circle). A fabric with three texturelevels has also been developed (centre circle). A furtherexample is the creation of a three-dimensional upholsteryfabric (right-hand circle).
After an extensive period of testing, the innovations wereintroduced onto the market in 2001. They are soon tobe used by a number of car manufacturers withwhich De Witte Lietaer has a long history ofbusiness relations. In this way, De Witte Lietaeris meeting the tough price targets in the car
industry and providing products that satisfyconsumer tastes.
Brought to you by Global Reports
Gamma Holding Annual Report 2001
Brought to you by Global Reports

Gamma Holding Annual Report 2001
Industrial Fabrics
In the field of industrial woven and knitted fabrics, Gamma Holding has two small specialist companies,Ames Europe and Parabeam.
Ames Europe develops circular-knitting products for various industrial applications, such as base cloth forthe automotive industry, roof covering and sportswear.
Parabeam develops, manufactures and distributes three-dimensional glass-fibre woven products for thecomposites market. These are used in, among other things, underground fuel storage installations withleakage detection systems and in panels for lorries and ships.
The results of Industrial Fabrics were disappointing. As a supplier of base cloth to the automotive industry,Ames Europe was severely impacted by the price pressure in the automobile industry. A significant declinein turnover led to a substantially lower operating result. Parabeam posted an improved operating result onthe back of a rise in turnover.
28
Brought to you by Global Reports

29
Gamma Holding Annual Report 2001
Gamma Industrial Textiles
The Gamma Industrial Textiles sector accounted for 37% of Gamma Holding’s turnover in 2001. This sector comprises two core activities: Automotive and Industrial Applications.
The various operating companies in these segments manufacture and sell high-quality patterned fabricsfor industrial customers. The Automotive companies have specialised in fabrics for the automobile sector.Industrial Applications is engaged in the development, manufacture and sale of mattress ticking andfabrics for garden furniture and buggies.
Both segments had to contend with increasing price pressure and decreasing volumes in 2001.The process of consolidation and concentration that is taking place within the customer base is increasing the pressure in the rest of the supply chain to deliver more cheaply.
These developments had an impact on the results of Gamma Industrial Textiles in 2001. While the netturnover of the sector as a whole fell by 8%, from 5 369 million in 2000 to 5 339 million in 2001, theoperating result decreased by 53%, from 5 42.9 million to 5 20.3 million.
Automotive
(6 x 1,000,000) 2001 2000 index
Net turnover 150 165 91Operating result 1.5 11.2 14Operating result as a % of turnover 1.0 6.8
Investments 4.7 6.0 79Depreciation 4.3 4.7 92
EBITA 1.5 11.1 14Average capital employed1 80 75 107Return on capital employed as a % 1.9 14.9
Number of employees at year-end 829 856 97
The Automotive segment delivers high-quality fabrics for car upholstery and is one of the market leaders inEurope. The customers include renowned car manufacturers such as Ford, Mitsubishi, Opel, PSA (Citroënand Peugeot), Renault and Toyota. Automotive also supplies fabrics for the upholstery of e.g. train andcinema seats and office chairs.
Production mainly takes place at the companies De Witte Lietaer in Belgium and Delcar in France, whichare specialised in fabrics for the complete upholstery of cars. The group also has smaller plants inArgentina, Brazil, India, Portugal and Spain.
In the automotive industry, purchasing is increasingly conducted on a global scale. De Witte Lietaer hasresponded to this trend by entering into strategic alliances, for instance in Japan, the United States andAustralia, where its partners are among the top three in their respective countries. In this way, De WitteLietaer has a presence in the world’s main industrialised regions.
As preferred suppliers of many car manufacturers in Europe, De Witte Lietaer and Delcar are closelyinvolved in the development of interior designs for new models and thus determine to a large degree thelook of the interior of the various models. Advanced knitting and weaving techniques are applied, anddesigns and colour schemes are developed using modern CAD equipment.
1 Including goodwill
Brought to you by Global Reports

industrial applications
Gamma Holding Annual Report 2001
Fresh, fire-retardant and anti-stress: a new generation of mattress ticking
Bekaert Textiles has added to its extensive range of innovations a new generationof mattress ticking, which not only smells fresh, but also has a calming effect on
people.
After intensive research, this Belgium-based Gamma Holding subsidiary, incooperation with its German sister company Schoedel, is introducing mattress
ticking that combines three characteristics: it is aromatic (left-hand circle), fire-retardant (centre circle) and anti-stress (right-hand circle). The ticking can be
supplied with one or a combination of these characteristics.
The freshness is achieved by incorporating into the covers millions of mini capsulesthat measure 3 to 8 microns in diameter and contain a fragrance (lavender in theprototype). When the person lying on the mattress moves, the capsules burst openand release the fragrance of freshly laundered bed linen into the air.Because of the massive quantity of capsules incorporated into the fabric, thefragrance lasts a long time. The development of the capsules has also made itpossible to incorporate not only other fragrances, but also anti-perspirant, anti-mosquito and anti-smoke components as well.
Another of the innovations from Bekaert Textiles and Schoedel is the fire-retardantyarn that is woven into the mattress ticking, resulting in enhanced fire safety forthe end user. The effectiveness of this invention has been tested in thelaboratories by means of flame tests. In this way, Bekaert Textiles and Schoedel are responding to the trend in anumber of countries, such as the UK, where these materials are subject tomore stringent requirements in terms of their fire-retardant properties. The
outstanding quality of the yarns and fibres used means that the covers canbe washed without losing their effect.
To achieve the anti-stress effect, a highly conductive carbon thread isincorporated into the mattress fabric. This allows any charge generated
by friction to be neutralised immediately. The body is thus freed ofstatic electricity. Furthermore, the dust-repellent ticking
reduces the likelihood of allergic reactions.
Tests have shown that this combination of featureshelps people to relax so they can enjoy a better
quality of sleep.
Brought to you by Global Reports

Gamma Holding Annual Report 2001
Brought to you by Global Reports

The Automotive segment is having to contend with consolidation in the global car manufacturing industry.The combined – and increased – purchasing power that this consolidation creates is not only increasingprice pressure in the rest of the supply chain, it is also forcing the suppliers themselves to enter into largeralliances. The automobile industry demands suppliers that operate globally.
Reflecting this strategic trend, Gamma Holding is constantly globalising its activities in pursuit of furtherimprovements in efficiency and quality. In this respect, the strategic level of costs has our attention at alltimes.
As a result of the substantial price pressure, combined with lower sales, the operating result fell sharply in2001. This was compounded by the fact that start-up problems with the introduction of a new generationof machines, combined with new yarns, led to a temporary increase in costs.
The net turnover fell by 9%, from 5 165 million in 2000 to 5 150 million in 2001. The operating resultdecreased by 86%, from 5 11.2 million to 5 1.5 million.
Industrial Applications
(6 x 1,000,000) 2001 2000 index
Net turnover 189 204 93Operating result 18.8 31.7 59Operating result as a % of turnover 9.9 15.6
Investments 15.8 28.6 55Depreciation 11.8 10.4 113
EBITA 18.7 31.7 59Average capital employed1 164 144 114Return on capital employed as a % 11.4 22.0
Number of employees at year-end 1,768 1,875 94
The core activity Industrial Applications is engaged, via the Belgium-based company Bekaert Textiles, inthe manufacture of durable upholstery fabrics, with the main emphasis on mattress ticking. With itsjacquard woven mattress ticking and, increasingly – due in part to the growing demand for adjustable bedbases – knitted stretch mattress ticking, Bekaert Textiles is one of the three leading players on the worldmattress ticking market. In addition, high-quality fabrics for buggies and garden furniture are developedand manufactured.
The companies in this segment increasingly have an industrial image. They operate on a business-to-business basis for manufacturers or for chains of department stores that use these manufacturers.
There are production facilities in three regions – Europe (Belgium and Germany), the United States andAustralia – and sales and service offices in Brazil and China. Gamma Holding is seeking to further expandits distribution and sales in the various regions.
For example, capacity at the factory in Winston Salem in the United States was expanded in 2000 in orderto increase the scope for sales in the NAFTA zone (Canada, the United States and Mexico). South Americais also a growth market for Gamma Holding’s products. In the United States, further expansion is beingpursued in the mid segment of the market.
32
Gamma Holding Annual Report 2001
1 Including goodwill
Brought to you by Global Reports

In Europe, the sales potential in Central Europe has been further increased, e.g. through the acquisition of Schoedel in Germany in 2000. Eastern Europe is also seen as a promising growth market.
The recent opening of a sales and distribution office in China provides a platform to increase sales in thispart of the world. The Far East offers commercial opportunities for the group’s products.
In 2001 this segment had to contend with the problem that sales declined for the first time in years,following a period of strong growth and expansion of capacity. The strategy was to free up capacity inBelgium – e.g. by expanding capacity in the United States – in preparation for global expansion. Now,however, there is under-utilisation of capacity in Belgium, which, due to the poor economic climate in theyear under review, could not be fully compensated by growth.
This segment has also witnessed a process of concentration and consolidation within the customer base,leading to the formation of increasingly large market players. This has also put pressure on prices. Withinthe segment, measures are being taken to bring costs into line with current market conditions.
For Industrial Applications, in 2001 market demand fell for the first time in many years. The net turnoverdeclined by 7% compared with 2000, falling from 5 204 million to 5 189 million. The operating resultdecreased by 41%, from 5 31.7 million to 5 18.8 million. At 10%, the operating result as a percentage ofturnover remained above the group average.
Gamma Holding Annual Report 2001
33
Brought to you by Global Reports

Gamma Holding Annual Report 2001
Brought to you by Global Reports

exotic fabrics
Gamma Holding Annual Report 2001
Vlisco: new image in Burkina Faso
On 17 November 2001 the Vlisco Group held a spectacularfashion show and started a high-profile advertising campaign to mark the opening of its own sales office in Ouagadougou, thecapital of Burkina Faso. This added a new support centre to theconstantly expanding network of production and distribution centresin the countries of West Africa.
A proud director, Kouenon Kamidjigha, who himself originated from theIvory Coast and worked there for many years for a large customer of thefashionable Vlisco products, welcomed an unexpectedly large group of over a thousand guests. They included the Dutch ambassador as well as a numberof government representatives. The wife of the president of Burkina Fasoperformed the official opening. The exclusive nature of the products was shownclearly in the fashion show, which was broadcast live on television.
The new office fulfils the growing need to provide a service locally for the traderswho purchase the exotic printed fabrics from Vlisco and to establish a distributionpoint in the country itself. Previously the customers of the Vlisco Group in BurkinaFaso had to import the trend-setting products from countries such as the IvoryCoast and Togo, which was sometimes difficult due to travel and transportrestrictions.
These circumstances meant that it was not possible to take full advantage of thegrowing commercial opportunities that exist for the products in Burkina Faso.Vlisco’s physical presence in the country has not only given a new boost to the image
of the company, it has also increased its selling power considerably. Vlisco AfricanCompany Burkina now plays the pivotal role in the distribution of exotic fabrics to the
local traders.
The opening of the office immediately created a new atmosphere in Burkina Faso.The erection of large billboards marked the start of an advertising campaignthat was then continued in TV commercials throughout West Africa.
Brought to you by Global Reports

36
Gamma Holding Annual Report 2001
Gamma Exotic Fabrics
(6 x 1,000,000) 2001 2000 index
Net turnover 169 163 104Operating result 18.5 21.6 86Operating result as a % of turnover 10.9 13.2
Investments 7.4 8.8 84Depreciation 8.8 6.6 132
EBITA 18.5 21.6 86Average capital employed1 107 98 109Return on capital employed as a % 17.4 22.1
Number of employees at year-end 3,709 3,464 107
Since 1846 the companies of the Vlisco Group, part of Gamma Holding, have been shaping the face offashion for each successive generation in West Africa with trend-setting designs that are based on – butalso form part of – the local culture.
The companies in the Gamma Exotic Fabrics sector are specialised in the design, production anddistribution of high-quality dyed and printed fabrics – based on the batik process – in particular for the topand mid segments of the market. With thousands of designs and four brands, the Vlisco Group is themarket leader in the countries of West Africa. New collections are constantly being launched. The AfricanPrints, which are manufactured on the basis of creative designs, are considered by the consumer to beexclusive, trend-setting and status-enhancing.
The prints are produced in plants in the Netherlands, Ghana and the Ivory Coast. Distribution takes placevia the Vlisco Group’s own offices in Benin, Burkina Faso, Ghana, Niger, Togo, the Ivory Coast,South Africa and France; all of the Group’s products are also sold in fourteen shops in variousWest African countries under the name ‘Woodin, le créateur’. In Africa, Guaranteed Dutch Wax\Vlisco,Real Dutch Java Prints, Uniwax, GTP and Woodin are household names.
Gamma Exotic Fabrics has thus become an integral part of life in West Africa, a region that treasures itscultural heritage. There is a modern organisation in place in this region, and it is expanding thanks to afocused marketing and sales policy. For instance, the brands are supported and strengthened by e.g. TVadvertising.
Although there has been political and economic instability and unrest in various countries over the years,the Vlisco Group has repeatedly demonstrated that it is generally able to continue to achieve healthygrowth. For instance, in 2001 the negative effects of the situation in the Ivory Coast, where supply routeswere cut off for a long time, were partly compensated in other countries.
This favourable course of events also has a lot to do with the strategy of spreading risks. Whereasmanufacturing was initially restricted to the Netherlands, it has for some time now also been carried out inWest Africa itself. Moreover, the distribution network is continually refined and expanded. This strategytook further shape in 2001 with the opening of a new sales office in Burkina Faso. Expanding thedistribution network makes it possible to improve the local support for sales.
The companies in the Gamma Exotic Fabrics sector accounted for 19% of Gamma Holding’s total turnoverin 2001. The sector employs some 3,700 people, the majority in West Africa.
Gamma Holding’s strategy in this sector is aimed at further strengthening the market position in theexisting sales regions by means of continued efficiency, improved quality, expansion of the distributionnetwork and optimisation of a balanced cash flow.
1 Including goodwill
Brought to you by Global Reports
37
Gamma Holding Annual Report 2001
The net turnover of Gamma Exotic Fabrics rose by 4% in 2001, from 5 163 million in 2000 to 5 169 million.The operating result decreased by 14% compared with 2000, falling from 5 21.6 million to 5 18.5 million. The sector had to contend with higher energy and maintenance costs and a decline in turnover andoperating result in Ghana. Turnover and operating result were positively impacted by the expansion of theAfrican distribution network.
Outlook
For the Gamma Technologies sector, the operating result is expected to improve, partly due to theacquisition of the Madison Filter Group at the end of 2001. The integration of Ammeraal Beltech, whichwas completed in 2001, will also have a positive effect on turnover and operating result.
The cost control programmes initiated in the Gamma Industrial Textiles sector in 2001 will improve theefficiency of the existing activities. On the other hand, there is uncertainty surrounding developments onthe Automotive market.
The operating result of the Gamma Exotic Fabrics sector is expected to remain stable.
The level of investments will not exceed depreciation.
The improvement of our strategic portfolio and market positions in recent years, as well as the efficiencymeasures that have been taken, have laid the foundations for further growth of the company.
In view of the uncertainty surrounding the global economy, it is difficult, at this stage, to make specificforecasts regarding Gamma Holding’s results in 2002.
Helmond, 14 March 2002
Board of Managing Directors
J.G.M. van Oijen, chairmanM. Veninga
Brought to you by Global Reports

Gamma Holding Annual Report 2001
Net turnover per segment
Exotic Fabrics 19%
Industrial Applications 21%
Automotive 16%
Process andConveyor Belts 24%
Specialties 20%
Production/Sales
Gamma Technologies
Process and Conveyor Belts
Specialties
Gamma Industrial Textiles
Automotive
Industrial Applications
Gamma Exotic fabrics
Exotic Fabrics
Sales/Service
Gamma Technologies
Process and Conveyor Belts
Specialties
Gamma Industrial Textiles
Automotive
Industrial Applications
Gamma Exotic fabrics
Exotic Fabrics
Location of operations
Brought to you by Global Reports

Gamma Holding Annual Report 2001
Net turnover per geographical area
Rest of world 10%
United States 18%
Rest of Europe 12%
The Netherlands 4% Belgium/Luxembourg 4%
Germany 10%
France 9%
United Kingdom 7%
Italy/Spain/Portugal 9%
Africa 17%
Brought to you by Global Reports

Brought to you by Global Reports

Annual accounts
Brought to you by Global Reports

42
Gamma Holding Annual Report 2001
Accounting policies
Introduction
The accounting policies followed relate to both the corporate annual accounts and the consolidatedannual accounts.With effect from 1 January 2001, goodwill paid in connection with acquisitions is no longer charged to theshareholders’ funds (other reserves), but is capitalised as intangible fixed assets and systematicallyamortised in the profit and loss account.
Basis of consolidation
The consolidated annual accounts incorporate the accounts of Gamma Holding NV and its groupcompanies on the basis of uniform accounting policies in accordance with the full consolidation method.As a result, the accounts of all group companies are included in full in the consolidated accounts, wherebyintercompany accounts and transactions are eliminated. The share of third parties in shareholders’ fundsand the result after taxation of group companies are presented separately.
Group companies are those companies that are part of the economic entity Gamma Holding NV, in whichthe latter exerts a controlling influence through its control of business and financial policy. The principalinvestments are listed on pages 68 and 69.If a company joins the group, its accounts are included in the consolidated accounts effective from thedate on which its results are for the account and at the risk of the group. If the acquisition price is higherthan the net asset value – based on fair value – as of the date of acquisition, then the difference (reflectinggoodwill) is, as of 1 January 2001, capitalised as intangible fixed assets and systematically amortised in theprofit and loss account.
If a company leaves the group, its accounts are included in the consolidated accounts until the date fromwhich its results are no longer for the account and at the risk of the group. The difference between the saleprice and the net asset value plus the book value of the goodwill as of the date of sale (book result) isincluded in the profit and loss account.
In preparing the corporate annual accounts, the facility under section 402, Book 2 of the Dutch Civil Codeof drafting a condensed profit and loss account is used.
Policies followed in the conversion of foreign currencies
Transactions in foreign currenciesAssets, liabilities and obligations expressed in foreign currencies are converted at the rate prevailing onthe balance sheet date, except where the foreign exchange rate risk has been hedged. In those cases,valuation takes place at the agreed forward rates. The resulting exchange rate differences are included in the profit and loss account, except those on intra-group loans of a permanent or long-term nature. The exchange rate differences on these loans are included in shareholders’ funds (other reserves).Transactions in foreign currencies during the financial year are included in the annual accounts at the rateprevailing at the time of the transaction.
Annual accounts of foreign group companiesAssets and liabilities in the annual accounts of foreign group companies are converted at the ratesprevailing on the balance sheet date. The resulting exchange rate differences are included in shareholders’funds (other reserves).Income and expenses in the annual accounts of foreign group companies are converted at the average ratefor the year. The differences between the results calculated on the basis of the average rate for the year andthe results calculated on the basis of the rates prevailing at the balance sheet date are also included inshareholders’ funds (other reserves).
Brought to you by Global Reports

43
Gamma Holding Annual Report 2001
Policies followed in valuation
GeneralUnless stated otherwise, assets and liabilities are included at nominal value.
Intangible fixed assetsIntangible fixed assets are valued at cost less amortisation.
Tangible fixed assetsTangible fixed assets are valued at cost less depreciation. Cost of tangible fixed assets includes thepurchase price and additional costs, less investment grants. Assets not employed in the productionprocess are included at the lower of book value at the time of transfer to this category or market value.
Financial fixed assetsInvestments in group companies are valued collectively at net asset value in the corporate balance sheet. Other investments are valued at net asset value or the lower of cost or market value. Other securities arestated at the lower of cost or market value.
StocksRaw materials and consumables are valued at the lower of cost less adequate provision for obsolescenceor market value. Cost includes the purchase price, freight costs and import duties. Work in progress andfinished products are valued at the lower of cost of raw materials and consumables plus directlyattributable manufacturing costs less adequate provision for obsolescence or market value.Manufacturing costs included in the valuation of stocks only represent personnel costs, depreciation andother costs which are directly attributable to production.
DebtorsDebtors are stated at nominal value less adequate provision for the risk of doubtful debts.
ProvisionsThe provision for pensions is stated at net present value, based on actuarial principles. This provisionrelates to the uninsured post-employment payments to former employees and their surviving relatives, aswell as to the commitments resulting from the plans relating to supplementary payments in the event ofdisability. The provision for deferred tax liabilities is determined on the basis of the tax rates in the relevantcountries effective for the temporary difference between the valuation of group companies' assets andliabilities for tax purposes and annual accounts purposes, to the extent it is probable that this can lead to a real liability. Deferred tax assets are recognised if it is probable that future fiscal profit will be available tocompensate losses.
Brought to you by Global Reports

44
Gamma Holding Annual Report 2001
Policies followed in the calculation of result
GeneralResult is calculated as the difference between the realisable value of the goods and services delivered andthe costs and expenses for the year. Profits on transactions are attributed to the year in which they arerealised; losses as soon as they are foreseeable. Amortisation of intangible fixed assets and depreciation of tangible fixed assets are based on cost and are calculated using the straight-line method on the basis ofthe estimated useful life.
Net turnoverNet turnover is defined as the amounts charged to third parties for goods and services delivered in theyear under review, less discounts and excluding value-added tax.
CostsCosts are attributed to the year to which they relate.
TaxationTaxation on result is calculated by applying the tax rates prevailing in the respective countries to the resultfor the financial year, taking into account permanent differences between the profit calculated for theannual accounts and tax purposes. The tax effect on temporary differences is included in the provision fordeferred tax liabilities.
Brought to you by Global Reports

(3 x 1,000) 31-12-2001 31-12-2000(After profit appropriation)
Assets
Fixed assetsIntangible fixed assets 13,260Tangible fixed assets 313,797 292,867Financial fixed assets 5,464 10,653
Total fixed assets 332,521 303,520
Current assetsStocks 225,752 216,625Debtors 191,355 207,826Cash and banks 17,217 15,731
Total current assets 434,324 440,182
TOTAL ASSETS 766,845 743,702
Liabilities
Shareholders’ funds 182,638 164,902Minority interests 3,298 3,915
Group equity 185,936 168,817
Provisions 47,008 46,589Long-term liabilities 118,039 141,890Current liabilities 415,862 386,406
TOTAL LIABILITIES 766,845 743,702
Guarantee capital1 206,186 198,067
1 Group equity plus subordinated loan
Consolidated balance sheet
45
Gamma Holding Annual Report 2001
Brought to you by Global Reports

(3 x 1,000) 2001 2000
Net turnover 905,986 938,409
Changes in finished products and work in progress (4,474) 16,411
Total operating income 901,512 954,820
Costs of raw materials and consumables 357,716 376,763 Personnel costs 254,292 250,021 Amortisation of intangible fixed assets 59 Depreciation of tangible fixed assets 45,392 41,839 Other operating costs 173,826 181,467
Total operating expenses 831,285 850,090
OPERATING RESULT 70,227 104,730
Financial income and expense (20,512) (28,572)
Group result from normal business operations before taxation 49,715 76,158
Taxation on group result from normal business operations (19,360) (28,026)
Group result from normal business operations after taxation 30,355 48,132
Share of third parties in group result after taxation 42 (512)
RESULT FROM NORMAL BUSINESS OPERATIONS AFTER TAXATION 30,397 47,620
Extraordinary result after taxation (30,000)
RESULT AFTER TAXATION 30,397 17,620
(3 x 1)
Earnings per share from normal business operations 4.03 6.38 Diluted earnings per share from normal business operations 4.03 6.37 Earnings per share 4.03 2.35 Diluted earnings per share 4.03 2.35
Consolidated profit and loss account
46
Gamma Holding Annual Report 2001
Brought to you by Global Reports

(3 x 1,000) 2001 2000
Result from normal business operations after taxation 30,397 47,620
Amortisation of intangible fixed assets 59 Depreciation of tangible fixed assets 45,392 41,839 Change in provisions 4,316 (6,612)Change in working capital (11,082) (14,011)Share of third parties in group result after taxation (42) 512
NET CASH FLOW FROM OPERATIONAL ACTIVITIES 69,040 69,348
Investments in group companies (28,313) (7,400)Investments in tangible fixed assets (55,407) (61,437)Disposals of tangible fixed assets 1,936 7,160 Net disposals of financial fixed assets 23,071 3,318
NET CASH FLOW FROM INVESTMENT ACTIVITIES (58,713) (58,359)
Dividend paid by Gamma Holding NV (19,187) (10,430)Dividend paid by group companies to third parties (405) (694)Proceeds from long-term loans 5,000 20,000 Repayments on long-term loans (22,781) (53,482)Change in loans to interior-decoration products activities (8,222)Change in current interest-bearing liabilities 28,354 44,788
NET CASH FLOW FROMFINANCING ACTIVITIES (9,019) (8,040)
Exchange rate differences on cash and banks 178 85
NET CASH FLOW 1,486 3,034
The statement of cash flows has been prepared based on the indirect method. The net cash flow relates to the change in cash and banks. Investments in group companies comprise the purchase price paid less cash and bank balances at these companies at the time of acquisition.
Consolidated statement of cash flows
47
Gamma Holding Annual Report 2001
Brought to you by Global Reports

48
Gamma Holding Annual Report 2001
(3 x 1,000)
Intangible fixed assets
The composition and changes were as follows:
GoodwillBalance at 31-12-2000CostAmortisation
BOOK VALUE AT 31-12-2000 0
Changes in 2001:Investments 13,319Amortisation (59)
Balance at 31-12-2001Cost 13,319Amortisation (59)
BOOK VALUE AT 31-12-2001 13,260
The rate of amortisation of goodwill is 5%.
The investments in and amortisation of intangible fixed assets relate entirely to the Specialties segment and, in geographic terms, to Europe.
Notes to the consolidated balance sheet
Brought to you by Global Reports

49
Gamma Holding Annual Report 2001
(3 x 1,000)
Tangible fixed assets
The composition and changes were as follows:
Land and Plant and Other Under Assets not Totalbuildings machinery tangible construction employed in
fixed assets and prepaid the produc-tion process
Balance at 31-12-2000Cost 180,001 564,840 82,739 5,042 9,725 842,347 Depreciation (62,934) (414,391) (63,034) (9,121) (549,480)
BOOK VALUE AT 31-12-2000 117,067 150,449 19,705 5,042 604 292,867
Changes in 2001:Investments 7,021 33,383 7,379 7,606 18 55,407 New consolidations 6,771 4,486 837 417 3,568 16,079 Depreciation (4,840) (31,124) (9,411) (17) (45,392)Disposals (872) (467) (540) (57) (1,936)Exchange rate differences 1,461 1,623 42 (75) 3,051 Other changes (4,705) 1,831 (313) (3,463) 371 (6,279)
Balance at 31-12-2001Cost 197,760 610,409 80,531 9,470 17,977 916,147 Depreciation (75,857) (450,228) (62,832) (13,433) (602,350)
BOOK VALUE AT 31-12-2001 121,903 160,181 17,699 9,470 4,544 313,797
Land is not depreciated. The rate of depreciation of buildings is 3%, of most plant and machinery 10%, and of other tangiblefixed assets 25% or 33%. The current value of the tangible fixed assets is estimated at more than 5 500 million.The balance of the other changes – (6,279) – is the result of reclassification in line with changes to the rules for financialreporting.
Brought to you by Global Reports

(3 x 1,000) 2001 2000
The investments were distributed per segment as follows:
Process and Conveyor Belts 11,300 9,040Specialties 16,223 9,002
GAMMA TECHNOLOGIES 27,523 18,042
Automotive 4,737 6,033Industrial Applications 15,743 28,548
GAMMA INDUSTRIAL TEXTILES 20,480 34,581
GAMMA EXOTIC FABRICS 7,404 8,814
TOTAL 55,407 61,437
The investments were distributed geographically as follows:
Europe 43,013 40,009United States 4,684 11,949Rest of world 7,710 9,479
TOTAL 55,407 61,437
Depreciation was distributed per segment as follows:
Process and Conveyor Belts 10,251 11,741Specialties 10,244 8,336
GAMMA TECHNOLOGIES 20,495 20,077
Automotive 4,316 4,699Industrial Applications 11,809 10,433
GAMMA INDUSTRIAL TEXTILES 16,125 15,132
GAMMA EXOTIC FABRICS 8,772 6,630
TOTAL 45,392 41,839
50
Gamma Holding Annual Report 2001
Brought to you by Global Reports

51
Gamma Holding Annual Report 2001
(3 x 1,000)
Financial fixed assets
The composition and changes were as follows:
Investments in Other Other Totalinterior-decoration investments securitiesproducts activities
Balance at 31-12-2000Net asset value/cost 696 14,175 921 15,792 Valuation adjustments (696) (4,168) (275) (5,139)
BOOK VALUE AT 31-12-2000 0 10,007 646 10,653
Changes in 2001:Investments 178 1,065 1,243 Disposals 0 0 Result after taxation 65 65 Dividend 4 25 29 Valuation adjustments (65) (65)Exchange rate differences 199 (262) (63)Other changes (5,989) (409) (6,398)
Balance at 31-12-2001Net asset value/cost 14,445 1,749 16,194 Valuation adjustments (10,046) (684) (10,730)
BOOK VALUE AT 31-12-2001 0 4,399 1,065 5,464
The other changes – (6,398) – were the result of reclassification in line with changes to the rules for financial reporting. The principal other investments are listed on page 69.
Brought to you by Global Reports

Gamma Holding Annual Report 2001
(3 x 1,000) 31-12-2001 31-12-2000
Stocks
Raw materials and consumables 72,558 76,087Work in progress 46,375 37,784Finished products and goods for resale 104,693 97,906Prepaid stocks 2,126 4,848
TOTAL 225,752 216,625
As a result of new consolidations, stocks increased by 21,810.The difference between the current value of the stocks and their book value is not significant.
Debtors
Trade debtors 138,614 146,177Interior-decoration products activities 31,633Taxation and social security 22,874 6,948Other debtors 18,385 12,031Prepaid expenses and accrued income 11,482 11,037
TOTAL 191,355 207,826
Due to the distribution of the activities over segments, the credit risk of the debtors is spread.As a result of new consolidations, trade debtors increased by 10,879.Of the other debtors, a total of 2,372 (2000: 2,036) is due after one year.
Cash and banks
Cash and banks 16,099 15,129Current deposits 1,118 602
TOTAL 17,217 15,731
In principle, bank balances and deposits are held by financial institutions with strong credit ratings.
52
Brought to you by Global Reports
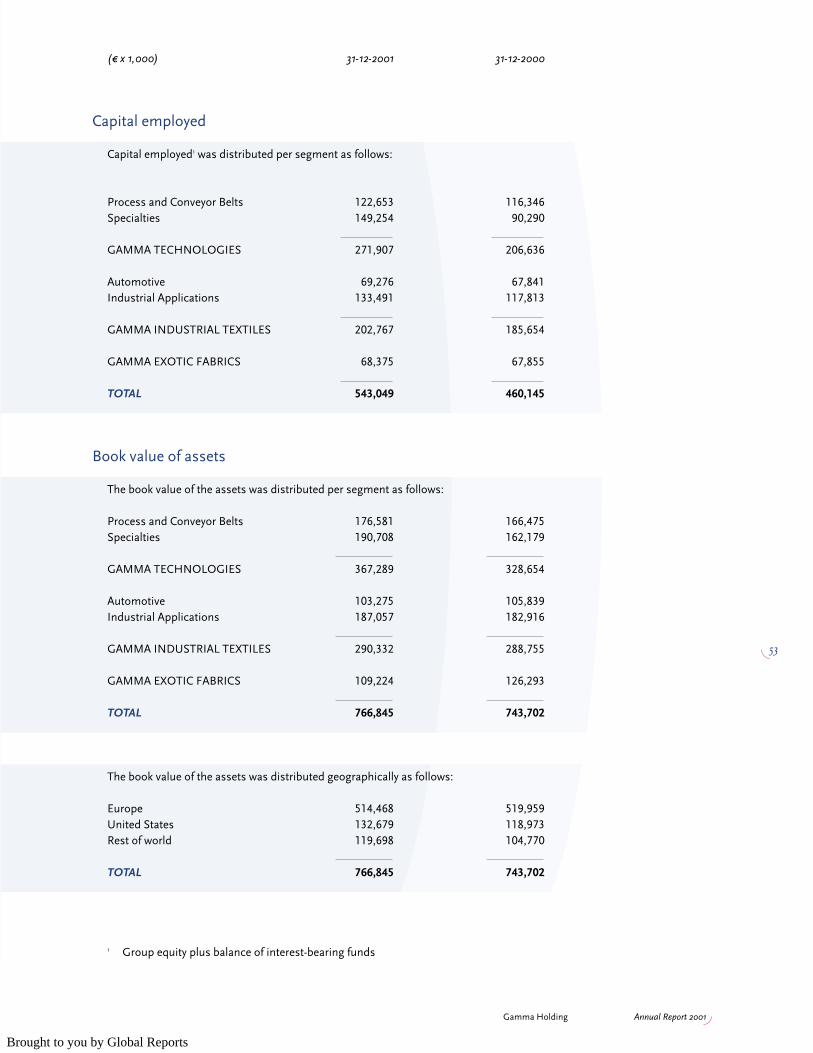
53
Gamma Holding Annual Report 2001
(3 x 1,000) 31-12-2001 31-12-2000
Capital employed
Capital employed1 was distributed per segment as follows:
Process and Conveyor Belts 122,653 116,346Specialties 149,254 90,290
GAMMA TECHNOLOGIES 271,907 206,636
Automotive 69,276 67,841Industrial Applications 133,491 117,813
GAMMA INDUSTRIAL TEXTILES 202,767 185,654
GAMMA EXOTIC FABRICS 68,375 67,855
TOTAL 543,049 460,145
Book value of assets
The book value of the assets was distributed per segment as follows:
Process and Conveyor Belts 176,581 166,475Specialties 190,708 162,179
GAMMA TECHNOLOGIES 367,289 328,654
Automotive 103,275 105,839Industrial Applications 187,057 182,916
GAMMA INDUSTRIAL TEXTILES 290,332 288,755
GAMMA EXOTIC FABRICS 109,224 126,293
TOTAL 766,845 743,702
The book value of the assets was distributed geographically as follows:
Europe 514,468 519,959United States 132,679 118,973Rest of world 119,698 104,770
TOTAL 766,845 743,702
1 Group equity plus balance of interest-bearing funds
Brought to you by Global Reports

54
Gamma Holding Annual Report 2001
(3 x 1,000)
Shareholders’ funds
The composition and changes over the years 2000 and 2001 were as follows:
Balance at 31-12-1999 174,557
Changes in 2000:Excess on estimated dividend for 1999 (2,956)Profit appropriation (1,567)Goodwill (10,406)Exchange rate differences 6,182Other changes (908)
Balance at 31-12-2000 164,902
Changes in 2001:Profit appropriation 18,283Exchange rate differences (444)Other changes (103)
Balance at 31-12-2001 182,638
Shareholders’ funds is explained in further detail in the explanatory notes to the corporate balance sheet.
Minority interests
Minority interests in consolidated companies changed as follows:
Balance at 31-12-2000 3,915
Changes in 2001:Investments (57)Share of third parties in group result after taxation (42)Exchange rate differences (660)Dividend paid by group companies to third parties (396)Other changes 538
Balance at 31-12-2001 3,298
Brought to you by Global Reports

(3 x 1,000)
Provisions
The composition and changes were as follows:
Pensions Deferred Totaltax
liabilities
Balance at 31-12-2000 21,454 25,135 46,589
Changes in 2001:New consolidations 203 (4,112) (3,909)Payments/transfers from/tocurrent liabilities (422) 3,485 3,063 Additions charged to the result 990 990 Exchange rate differences 12 263 275
Balance at 31-12-2001 22,237 24,771 47,008
The provisions are of a long-term nature. Most of the provisions relate to periods longer than 5 years.
Long-term liabilities
The long-term liabilities changed as follows:
Balance at 31-12-2000 141,890
Changes in 2001:New loans 5,000 Exchange rate differences 1,387 Transfers to current liabilities (30,238)
Balance at 31-12-2001 118,039
The balance consists of loans from financial institutions. The company intends to enter into a predominantly long-term refinancing of the interest-bearing liabilities in 2002. The average rate of interest on the long-term loans was 4.9% (2000: 5.0%). Instalments falling due in 2002 – disregarding the intended refinancing – are included in the current liabilities and total 27,051 (previous year: 19,594). For a total of 3,125 (2000: 4,368), the long-term liabilities will mature after 5 years.For loans up to an amount of 112,018 (2000: 134,351), a negative pledge clause and/or a cross default clause apply, largely in combination with a pari passu clause.
55
Gamma Holding Annual Report 2001
Brought to you by Global Reports

56
Gamma Holding Annual Report 2001
(3 x 1,000)
A balance of 11,250 (2000: 20,250) is included in the form of a subordinated loan. For an amount of 28,125 (2000: 44,625) the conditions apply that the guarantee capital must not be less than 25% of the balance sheet total and that the ratio of interest-bearing funds divided by EBITDA1 must be less than 3.
For 43% of the total interest-bearing funds, the interest has been fixed for more than a year at an average rate of 4.4%. For 9% of the total interest-bearing funds, the interest has been fixed for more than five years.
Current liabilities
31-12-2001 31-12-2000
Financial institutions 256,291 196,023Trade creditors 53,920 55,489Taxation and social security 19,600 16,305Dividend 12,117 19,190Other liabilities 35,094 53,518Deferred income and accrued expenses 38,840 45,881
TOTAL 415,862 386,406
Financial institutions includes an amount of 55,000 (2000: nil) for which the conditions apply that EBITDA1 divided by interest expense must be greater than 4 and that the ratio of interest-bearing funds divided by EBITDA must be less than 3.
As a result of new consolidations, current liabilities increased by 35,269.
1 Operating result plus or less results of financial fixed assets and plus depreciation (amortisation) of (in)tangible fixed assets
Brought to you by Global Reports

57
Gamma Holding Annual Report 2001
(3 x 1,000)
Total liabilities
The total liabilities (provisions and long and short-term liabilities) were distributed per segment as follows:
31-12-2001 31-12-2000
Process and Conveyor Belts 137,123 167,832Specialties 126,889 113,090
GAMMA TECHNOLOGIES 264,012 280,922
Automotive 85,479 73,151Industrial Applications 124,980 112,926
GAMMA INDUSTRIAL TEXTILES 210,459 186,077
GAMMA EXOTIC FABRICS 106,438 107,886
TOTAL 580,909 574,885
Financial instruments
Financial instruments are used to limit interest and currency risks. Financial instruments are not used for speculative purposes. Currency instruments are used to limit the currency risks ensuing from operational activities in foreign currencies. The effect of this is included in the valuation of the respective activity.
Currency swap contracts have been entered into in order to finance the group and serve to match the currency of financing to the desired currency. The effect of this is included in the valuation of the underlying positions. The interest policy is intended to stabilise and limit financing expense. Interest instruments are used to fix the interest rate of variable-interest financing.
Commitments and contingencies
As of the balance sheet date the group has issued guarantees and sureties amounting to 16,045 (2000: 24,373). Financial institutions have also issued guarantees and sureties on behalf of the group amounting to 16,496 (2000: 10,962). The contingent liability for recourse arising from bills discounted by the group amounts to 1,469 (2000: 709). The commitments of the group arising from long-term agreements amount to 16,104 (2000: 6,593).
Brought to you by Global Reports

(3 x 1,000) 2001 2000
Net turnover
The net turnover was realised per segment as follows:
Process and Conveyor Belts 216,701 234,077Specialties 181,167 171,941
GAMMA TECHNOLOGIES 397,868 406,018
Automotive 149,669 164,870Industrial Applications 188,973 204,000
GAMMA INDUSTRIAL TEXTILES 338,642 368,870
GAMMA EXOTIC FABRICS 169,476 163,521
TOTAL 905,986 938,409
In percentage terms the net turnover was realised per geographical area as follows:
The Netherlands 3.9 4.2Belgium and Luxembourg 4.4 4.4
Sub-total Benelux 8.3 8.6
Germany 10.1 10.2France 8.7 8.9United Kingdom 6.7 7.7Italy/Spain/Portugal 9.4 9.5Scandinavia 3.5 2.8Rest of EU 1.0 2.3Switzerland 0.9 0.6Rest of Europe 6.3 5.0
Sub-total Europe 54.9 55.6
Africa 17.0 15.4United States 17.9 19.5Canada 1.3 1.1South America 1.5 1.0Asia 4.5 3.9New Zealand/Australia 2.4 2.5Rest of world 0.5 1.0
TOTAL 100.0 100.0
The net turnover of the remaining interior-decoration products activities sold in 2001, which is not included in the consolidated accounts, amounts to 40,703 (2000: 138,662).
58
Gamma Holding Annual Report 2001
Notes to the consolidated profit and loss account
Brought to you by Global Reports

59
Gamma Holding Annual Report 2001
(3 x 1,000) 2001 2000
Personnel costs
Wages and salaries 202,902 199,715Social-security charges 46,475 44,873Pension charges 4,915 5,433
TOTAL 254,292 250,021
The personnel costs of the remaining interior-decoration products activities sold in 2001, which are not included in the consolidated accounts, amounts to 10,994 (2000: 38,755).
The average number of employees in the year under review was 8,982 (2000: 8,592), divided over the segments as follows:
Process and Conveyor Belts 1,696 1,707Specialties 933 867
GAMMA TECHNOLOGIES 2,629 2,574
Automotive 851 848Industrial Applications 1,836 1,802
GAMMA INDUSTRIAL TEXTILES 2,687 2,650
GAMMA EXOTIC FABRICS 3,666 3,368
TOTAL 8,982 8,592
The average number of employees of the remaining interior-decoration products activities sold in 2001 was 287 (2000: 1,100).
Remuneration of the Managing Directors and Supervisory Directors
During the year under review the remuneration of the Managing Directors and former Managing Directors amounted to 1,244 (2000: 1,104). Included as remuneration are salary, profit-related bonuses and social-security and pension contributions.
During the financial year the Supervisory Directors received remuneration of 126 (2000: 133).
Brought to you by Global Reports

60
Gamma Holding Annual Report 2001
(3 x 1,000) 2001 2000
Other operating costs
Operating expense 99,596 102,857Selling expense 42,473 46,874General expense 31,757 31,736
TOTAL 173,826 181,467
Operating expense includes 26,309 (2000: 24,472) for energy, 22,317 (2000: 17,163) for maintenance and 20,509 (2000: 20,767) for outsourced work and temporary personnel. Selling expense includes 14,332 (2000: 16,501) for freight (including insurance).
Operating result
The operating result was realised per segment as follows:
Process and Conveyor Belts 14,050 21,434 Specialties 17,387 18,756
GAMMA TECHNOLOGIES 31,437 40,190
Automotive 1,544 11,164 Industrial Applications 18,759 31,755
GAMMA INDUSTRIAL TEXTILES 20,303 42,919
GAMMA EXOTIC FABRICS 18,487 21,621
TOTAL 70,227 104,730
The operating result of the remaining interior-decoration products activities sold in 2001 was nil (2000: 7,701 negative).
Financial income and expense
Result of interior-decoration products activities (11,966)Results from other investments 4 (692)Results from other securities 25 10Interest income 1,003 888 Interest expense (21,544) (16,812)
TOTAL (20,512) (28,572)
Brought to you by Global Reports

61
Gamma Holding Annual Report 2001
(3 x 1,000) 2001 2000
Taxation on result from normal business operations
The taxation on the result from normal business operations is distributed as follows:
Group companies (19,360) (31,802)Interior-decoration products activities 3,776
TOTAL (19,360) (28,026)
The effective tax rate rose from 36.8% to 38.9%. This figure is made up as follows:
Natural tax rate 1 36.9 Non-offset losses 4.2 Structural benefits (2.9)Non-recurring items 0.7
38.9
The non-offset losses mainly relate to the United Kingdom, Ghana, the Ivory Coast and Austria. The structural benefits are due to the fiscal facility of the Group Financing Centre in the Netherlands.
Result after taxation from normal business operations
The result after taxation from normal business operations was realised as follows:
Group companies 30,397 55,810 Interior-decoration products activities (8,190)
30,397 47,620
Extraordinary result
Extraordinary expense before taxation (40,479)Taxation on extraordinary result 10,479
Extraordinary result after taxation (30,000)
1 Weighted average of the statutory rates applied in the countries in which Gamma Holding operates, weighted on the basis of the result before taxation in each of these countries
Brought to you by Global Reports

62
Gamma Holding Annual Report 2001
(3 x 1,000) 31-12-2001 31-12-2000(After profit appropriation)
Assets
Fixed assetsTangible fixed assets 160Financial fixed assets 341,614 304,098
Total fixed assets 341,774 304,098
Current assetsDebtors 232,705 234,762Cash and banks 708 33,519
Total current assets 233,413 268,281
TOTAL ASSETS 575,187 572,379
Liabilities
Issued share capital 19,796 17,966Share premium reserve 38,841 40,671Statutory reserve 2,909 2,670Other reserves 121,092 103,595
Shareholders’ funds 182,638 164,902
Provisions 3,278
Long-term liabilities 100,611 111,604Current liabilities 288,660 295,873
TOTAL LIABILITIES 575,187 572,379
(3 x 1,000) 2001 2000
Result from investments after taxation 29,273 15,219Other income and expense after taxation 1,124 2,401
RESULT AFTER TAXATION 30,397 17,620
Corporate profit and loss account
Corporate balance sheet
Brought to you by Global Reports

63
Gamma Holding Annual Report 2001
(3 x 1,000)
General
The consolidated annual accounts incorporate the annual accounts of Gamma Holding NV.The accounting policies are the same for both the corporate and the consolidated annual accounts.
Tangible fixed assets
The composition and changes were as follows:
Other tangiblefixed assets
Balance at 31-12-2000CostDepreciation
BOOK VALUE AT 31-12-2000 0
Changes in 2001:Investments 160
Balance at 31-12-2001Cost 961 Depreciation (801)
BOOK VALUE AT 31-12-2001 160
Notes to the corporate balance sheet
Brought to you by Global Reports

64
Gamma Holding Annual Report 2001
(3 x 1,000)
Financial fixed assets
The composition and changes were as follows:
Investments Investments Loans Other Totalin group in interior- to group investments
companies decoration companiesproductsactivities
Balance at 31-12-2000 186,594 0 117,116 388 304,098
Changes in 2001:Capital changes 52,000 52,000 Disposals 0 0 Result from investments 29,273 29,273 Exchange rate differences (695) 1,387 692 Dividend (35,000) (35,000)Valuation adjustments (65) (65)Balance of issued and repaid loans (11,480) (11,480)Other changes 2,096 2,096
Balance at 31-12-2001 234,268 0 107,023 323 341,614
The principal investments are listed on pages 68 and 69.
Debtors
31-12-2001 31-12-2000
Group companies 219,156 200,631Interior-decoration products activities 30,875Taxation and social security 2,848Other debtors 6,091 1,356Prepaid expenses and accrued income 4,610 1,900
TOTAL 232,705 234,762
Brought to you by Global Reports

(3 x 1,000)
Shareholders’ funds
The composition and changes were as follows:
Issued Share Statutory Other Totalshare premium reserve reserves
capital reserve
Balance at 31-12-2000 17,966 40,671 2,670 103,595 164,902
Changes in 2001:Redenomination 1,830 (1,830) 0 Profit appropriation 18,283 18,283 Exchange rate differences (444) (444)Other changes 239 (342) (103)
Balance at 31-12-2001 19,796 38,841 2,909 121,092 182,638
The changes in 2000 are included in the explanatory notes to the consolidated balance sheet.
The issued share capital consists of: 31-12-2001 31-12-2000
Ordinary share capital 18,796 17,059Ordinary participating preference share capital 1,000 907
TOTAL 19,796 17,966
The Managing Directors’ total shareholding in the company comprises nil ordinary shares (2000: nil).The Supervisory Directors’ total shareholding in the company comprises 279,476 ordinary shares (2000: 279,476).
In 1997 the Supervisory Board approved a stock option plan for the members of the Board of Managing Directors and otherexecutives. Under this plan, options will only be granted after approval by the Supervisory Board up to a maximum of 1% of thenumber of outstanding shares per year. When exercised, these options will entitle the holder to one ordinary share per option. The options may be exercised during a period of 5 years after the date on which they are granted. The exercise price of the options will be the same as the closing price on the date on which they are granted.
In 2001, 33,100 options with an exercise price of 5 40.00 were granted. Of these options, which are valid until the year 2006, 12,000 were granted to the Managing Directors and 21,100 to other executives.
65
Gamma Holding Annual Report 2001
Brought to you by Global Reports

66
Gamma Holding Annual Report 2001
(3 x 1,000)
The number of options at year-end 2001 is:
Granted Valid Exercise Number granted to: Outstanding Cancelled Exercised Still outstandingin until price in 3 Managing other at 31-12-2000 in 2001 in 2001 at 31-12-2001
Directors executives
1997 2002 49.64 8,000 40,350 44,500 16,550 27,9501998 2003 54.18 8,000 38,850 42,250 17,700 24,5501999 2004 41.20 12,000 34,350 41,250 12,700 28,5502000 2005 37.40 12,000 28,800 35,700 6,650 29,0502001 2006 40.00 12,000 21,100 33,100
143,200
The statutory reserve consists of the reserve for retained profit from investments of 2,909 (2000: 2,670).
Long-term liabilities
The balance consists of loans from financial institutions. The average rate of interest on the long-term loans was 5.0% (2000: 5.1%). The instalments falling due in 2002 are 16,500 (previous year: 16,500). For a total of nil (2000: nil) the long-term liabilities willmature after 5 years. For loans up to an amount of 100,611 (2000: 111,604), a negative pledge clause, a pari passu clause and/or a cross default clause apply. A balance of 11,250 (2000: 20,250) is included in the form of a subordinated loan. For an amount of 28,125 (2000: 44,625), the conditions apply that at group level the guarantee capital must not be less than 25% ofthe balance sheet total and that the ratio of interest-bearing funds divided by EBITDA1 must be less than 3.
Current liabilities
31-12-2001 31-12-2000
Financial institutions 254,334 227,911Trade creditors 17 28Taxation and social security 1,231 699Group companies 8,777 44,419Dividend 12,117 19,190Other liabilities 3,328Deferred income and accrued expenses 8,856 3,626
TOTAL 288,660 295,873
Financial institutions includes an amount of 55,000 (2000: nil) for which the conditions apply that EBITDA1 divided by interest expense must be greater than 4 and that the ratio of interest-bearing funds divided by EBITDA must be less than 3.
1 Operating result plus or less results of financial fixed assets and plus depreciation (amortisation) of (in)tangible fixed assets
Brought to you by Global Reports

67
Gamma Holding Annual Report 2001
Commitments and contingencies
For the Dutch group companies, declarations of assumption of liability have been issued as referred to in section 403, Book 2 of the Dutch Civil Code. Under the terms of credit agreements, the company is also severally liable for group companies’ debts to financial institutions.
Helmond, 14 March 2002
Supervisory Board Board of Managing Directors
H.B. VAN LIEMT J.G.M. VAN OIJEN
J.A. DEKKER M. VENINGA
J.F. VAN DUYNE
R. HAZELHOFF
R.K.T. OETKER
P.A.W. ROEF
J.W.B. WESTERBURGEN
Brought to you by Global Reports

Principal group companies
(100% interest, unless stated otherwise)
Australia Bekaert (Australia) Pty. Ltd. LyndhurstMadison Filter Pty. Ltd. Victoria
Belgium Bekaert Textiles NV WaregemBekaert Decoration Textiles NV WaregemTextiles de Witte-Lietaer NV LauweDe Witte-Lietaer Industries NV Wervik
Benin John Walkden et Compagnie SA Cotonou
Burkina Faso VAC Burkina Faso SA Ouagadougou
Germany Deutsche Gamma GmbH KrefeldDimension-Polyant GmbH Kempen (98.8%)Gamma Grundstücksverwaltungsgesellschaft mbH KrefeldSchoedel GmbH MünchbergVerseidag AG Krefeld (98.8%)Verseidag-Indutex GmbH Krefeld (98.8%)Verseidag-Techfab GmbH Geldern (98.8%)
France Ames Europe SA FallièresDelcar SA St. QuentinDistriwax SA ParisNiger France SA Paris
Ghana Ghana Textile Printing Company Ltd. Tema (71.0%)Juapong Textiles Ltd. Tema (62.8%)Premium African Textiles Company Ltd. Tema
Ivory Coast CFCI SA Abidjan (99.6%)Uniwax SA Abidjan (84.8%)
The Netherlands Ames Europe BV EnschedeAmes Europe Enschede BV EnschedeAmmeraal Beltech Holding BV HeerhugowaardGamma Holding Nederland NV HelmondHTM Onroerend Goed BV HelmondParabeam Industrie- en Handelsonderneming BV HelmondVlisco BV HelmondVlisco Helmond BV Helmond
Niger Niger-Afrique SA Niamey
Spain Ammeraal Beltech SA Barberà del Vallés (98.8%)
Togo VAC-Togo SA Lomé (67.0%)
Gamma Holding Annual Report 2001
Investments
68
Brought to you by Global Reports

69
Gamma Holding Annual Report 2001
United States Ammeraal Beltech Inc. Skokie (99.7%)Bekaert Textiles USA Inc. Winston-SalemChemprene Inc. Beacon (99.7%)Dimension-Polyant Sailcloth Inc. Putnam (98.8%)Industrial Fabrics Corp. Minneapolis (98.8%)Madison Filter Inc. New YorkNational Wire Fabric Inc. Arkansas
United Kingdom Ames Europe Ltd. WesthoughtonGamma Holding (UK) Ltd. UxbridgeMadison Filter Ltd. HaslingdenMadison Filter Group Ltd. Haslingden
South Africa Vlisco (South Africa) (Proprietary) Ltd. Johannesburg
Sweden Madison Scandiafelt AB Högsjö
Switzerland Ammeraal Beltech AG Jona
Principal other investments
Canada Western Belting & Hose Ltd. Vancouver (24.7%)ZCL Composites Inc. Edmonton (9.7%)
Germany Devetex Delius-Verseidag Textil GmbH & Co. KG Krefeld (49.4%)Grundstücksgesellschaft Girmesgath GmbH & Co. KG Krefeld (49.4%)Voss-Biermann, Lawaczeck GmbH & Co. KG Krefeld (40.5%)
Ivory Coast Cotivo SA Agboville (16.2%)
In accordance with the provisions of section 379, Book 2 of the Dutch Civil Code, a list of investments isavailable at the Trade Register Office in Eindhoven, the Netherlands.
Brought to you by Global Reports

Other information
Profit appropriation
(3 x 1,000) 2001 2000
Proposed profit appropriation
Profit after taxation 30,397 17,620Added to/withdrawn from other reserves under art. 26, section 1 of the articles of association 18,283 (1,567)
Distributable profit 12,114 19,187
5 0.12 (2000: 5 0.11) primary dividend per share of 5 2.50 on ordinary participating preference shares 48 45
5 0.10 (2000: 5 0.09) primary dividend per share of 5 2.50 on ordinary shares 752 682
5 0.09 (2000: 5 0.09) extra dividend per share of 5 2.50 on ordinary participating preference shares 36 36
Surplus profit 11,278 18,424
5 1.50 (2000: 5 2.45) extra dividend per share of 5 2.50 on ordinary shares 11,278 18,424
Statutory profit appropriation
Pursuant to article 26, section 1 of the articles of association, the Supervisory Board may decide that allor part of the profit, up to a specified amount, is to be retained by way of reserve. Pursuant to article 26,section 2, the company may only make payments on the distributable profit insofar as shareholders’funds exceed the sum of the capital plus the reserves which must, by law, be retained.Of the distributable profit that then remains, up to 5 0.12 is paid on the ordinary participatingpreference shares, then up to 4% on the ordinary shares, whereafter an extra dividend of maximum5 0.09 is paid on the ordinary participating preference shares.The remaining profit is then at the disposal of the General Meeting of Shareholders to be added to the aforementioned dividend on the ordinary shares or to be used for other purposes that are in theinterests of the company.
70
Gamma Holding Annual Report 2001
Brought to you by Global Reports

71
Gamma Holding Annual Report 2001
Stichting Preferente Aandelen Gamma Holding
On 18 February 1987 the current Stichting Preferente Aandelen Gamma Holding (‘the Foundation’) was founded. The Foundation’s object is to protect the interests of the parent company Gamma Holding NV and all its stakeholders. Put and call option agreements have been concluded between the Foundation and Gamma Holding NV. On the basis of these agreements the Foundation is obliged/entitled to take 4% participating preferenceshares in the capital of Gamma Holding NV up to half the – following the issue, expanded – issuedcapital.The Foundation did not acquire any 4% participating preference shares during the year under review.
The Board of the Foundation is made up as follows: A.G. Jacobs, chairmanJ.L. BrentjensP.J. DortmondH.B. van LiemtJ.V.H. Pennings
The Board of Managing Directors of Gamma Holding NV and the Board of the Foundation are jointly ofthe opinion that the Board of the Foundation meets the requirements regarding independence set out inExhibit X of the Euronext Amsterdam Manual.
Auditor’s report
IntroductionWe have audited the annual accounts of Gamma Holding NV in Helmond for the year 2001. These annual accounts are the responsibility of the company’s management. Our responsibility is to express an opinion on these annual accounts based on our audit.
ScopeWe conducted our audit in accordance with auditing standards generally accepted in the Netherlands.Those standards require that we plan and perform the audit to obtain reasonable assurance aboutwhether the annual accounts are free of material misstatement. An audit includes examining, on a testbasis, evidence supporting the amounts and disclosures in the annual accounts. An audit also includesassessing the accounting principles used and significant estimates made by management, as well asevaluating the overall annual account presentation. We believe that our audit provides a reasonablebasis for our opinion.
OpinionIn our opinion, the annual accounts give a true and fair view of the financial position of the company asat 31 December 2001 and of the result for the year then ended in accordance with accounting principlesgenerally accepted in the Netherlands and comply with the financial reporting requirements included inPart 9, Book 2 of the Netherlands Civil Code.
Eindhoven, 14 March 2002
PricewaterhouseCoopers NV
Brought to you by Global Reports

Gamma Holding Annual Report 2001
Colophon
Design and productionTotal Design Maastricht, The Netherlands
PrintingDrukkerij Maetch, Weert, The Netherlands
PhotographySjaak Ramakers, Utrecht, The Netherlands (page 11)Gregor Ramaekers fotografie, Maastricht, The Netherlands (pages 18/19, 22/23, 26/27, 30/31, 34/35)
Brought to you by Global Reports