G e o Journal of D Geography Natural Disasters · J Geography Natural Disasters o u r n a l o f G e...
8
Open Access Research Article Journal of Geography & Natural Disasters J o u r n a l o f G e o g r a p h y & N a t u r a l D i s a s t e r s ISSN: 2167-0587 Das et al., J Geogr Nat Disast 2017, 7:3 DOI: 10.4172/2167-0587.1000210 Volume 7 • Issue 3 • 1000210 J Geogr Nat Disast, an open access journal ISSN: 2167-0587 Keywords: Assessment; Probability; Danger level; Exposure indicator; Flood potential Introduction Flood in any particular area can be predicted by the flood probability analysis. e probability of flood event has analysed through the nature of flood level cross by the river. e nature of the river can be determined by the intensity of the Flood Level or Danger Level reached by that particular river. Like the probability analysis of the river flood the analysis of the exposure indicators of the adjacent area is equally important for flood event. An Exposure indicator explains how the place is physically exposed to flood hazard event. Exposure indicators include percentage of flood area in a particular place, flood frequency, flood water depth, flood water stagnant period, elevation of the place and velocity of the adjacent river. Both, the probability of flood event and the exposure indicator can express the future flood potential of the area concern. Moreover, in vast flood prone area flood potential analysis helps in proper flood management. Study Area Jalpaiguri district is one of the district of West Bengal, India. e district is geographically situated from 26°16'35'' North to 26°59'30'' North and from 88°04’59" East to 89°55'20'' East comprising an area of 6227 sqkm [Jalpaiguri’-District Gazetteer].In West Bengal Jalpaiguri district occupies the southern flanks of the foothills of the Himalaya. Jalpaiguri district is bounded on the north by Darjeeling district of West Bengal and Bhutan, on south by Uttar Dinajpur and Coochbehar districts of West Bengal, on the west by Uttar Dinajpur and Darjeeling districts of West Bengal and Purnea district of Bihar, while Assam occurs on the east. e river Sankosh separates Jalpaiguri from the Goalpara district of Assam. Administratively, as per the 2011 Census records, Jalpaiguri district consists of three sub-divisions, viz. Sadar, Mal and Alipurduar. ese sub divisions consist of 13 Community Development (CD Blocks), 17 police stations, 756 mouzas and 4 Municipalities (Census Report 2011). From 2014, the former Jalpaiguri district has been divided into – Jalpaiguri and Alipurduar districts (Figures 1 and 2). Flood in the district is an annual phenomenon. However, its *Corresponding author: Moitrayee Das, Assistant Professor, Post Graduate Department of Geography, Chandernagore College, Chandannagar, West Bengal, India, Tel: 9433459226; E-mail: [email protected] Received July 30, 2017; Accepted October 18, 2017; Published October 25, 2017 Citation: Das M, Chattopadhyay A, Basu R (2017) Spatial Flood Potential Mapping (SFPM) with Flood Probability and Exposure Indicators of Flood Vulnerability: Case Study Former Jalpaiguri District, West Bengal, India. J Geogr Nat Disast 7: 210. doi: 10.4172/2167-0587.1000210 Copyright: © 2017 Das M, et al. This is an open-access article distributed under the terms of the Creative Commons Attribution License, which permits unrestricted use, distribution, and reproduction in any medium, provided the original author and source are credited. Spatial Flood Potential Mapping (SFPM) with Flood Probability and Exposure Indicators of Flood Vulnerability: Case Study Former Jalpaiguri District, West Bengal, India Moitrayee Das 1 *, Anis Chattopadhyay 2 and Ranjan Basu 3 1 Department of Geography, Chandernagore College, Chandannagar, West Bengal, India 2 Department of Geography, Presidency College, Kolkata, India 3 Department of Geography, University of Calcutta, India Abstract Flood is an annual event in the district of Jalpaiguri. Almost all the administrative blocks of the district are more or less flood prone. Like the administrative blocks almost all the rivers in the district are also flood prone. Due to this every river has certain flood level as well as danger level to observed the flood situation in the area. Following the past observation of flood level crossed by the river the probability of current event can be obtained. In this paper the authors are tried to show the spatial distribution of flood potential in the district with the help of probability analysis of flood event of individual rivers and exposure indicator score of the adjacent area. Here probability explains number of chance of flood in Individual River and exposure indications explain how much the area is exposed to flooding. The mapping is based on spatial flood potential index (SFPI). intensities vary from year to year. ese intensities vary in term of area affected (in hectare), population affected, cropped area affected, hous- ing affected and infrastructure affected. Almost all the administrative blocks are more or less affected by the flood every year. e main rivers in this district which influenced flood are Teesta, Jaldhaka, Torsa, Kaljani, Raidak, Riti, Titi, Mujnai, Sankosh etc. River Teesta influence Mal, Jalpaiguri Sadar and western part of Maynaguri block; River Jaldhaka influence Nagrakata, eastern part of Maynaguri and western part of Dhupguri block; River Torsa influence some part of Kalchini, Madarihat and Alipurduar I block; Raidak (I and II) influence Kumargram block. River Kaljani influence Alipurduar I block. Madarihat block is actually influenced by Riti, Titi and Mujnai River. All the rivers have particular observation site established by CWC (Central Water Commission) and I and W (Irrigation and Waterways) Department, Jalpaiguri. I Gauge height have been observed in monsoon period (May to 15 th October) from these stations flood forecasting (Table 1). Objective of the Study Present paper has been high light on the following study. 1. To find out, if flood occurred in this year in the district then what will be the probability of flooding of each river. 2. To find out, how much the administrative blocks are exposed to flood.
Transcript of G e o Journal of D Geography Natural Disasters · J Geography Natural Disasters o u r n a l o f G e...
Research Article Open AccessOpen AccessResearch Article
Journal of Geography & Natural DisastersJo
urna
l of G
eography & Natural Disasters
ISSN: 2167-0587
Das et al., J Geogr Nat Disast 2017, 7:3DOI: 10.4172/2167-0587.1000210
Volume 7 • Issue 3 • 1000210J Geogr Nat Disast, an open access journalISSN: 2167-0587
Keywords: Assessment; Probability; Danger level; Exposure indicator; Flood potential
IntroductionFlood in any particular area can be predicted by the flood probability
analysis. The probability of flood event has analysed through the nature of flood level cross by the river. The nature of the river can be determined by the intensity of the Flood Level or Danger Level reached by that particular river. Like the probability analysis of the river flood the analysis of the exposure indicators of the adjacent area is equally important for flood event. An Exposure indicator explains how the place is physically exposed to flood hazard event. Exposure indicators include percentage of flood area in a particular place, flood frequency, flood water depth, flood water stagnant period, elevation of the place and velocity of the adjacent river. Both, the probability of flood event and the exposure indicator can express the future flood potential of the area concern. Moreover, in vast flood prone area flood potential analysis helps in proper flood management.
Study AreaJalpaiguri district is one of the district of West Bengal, India. The
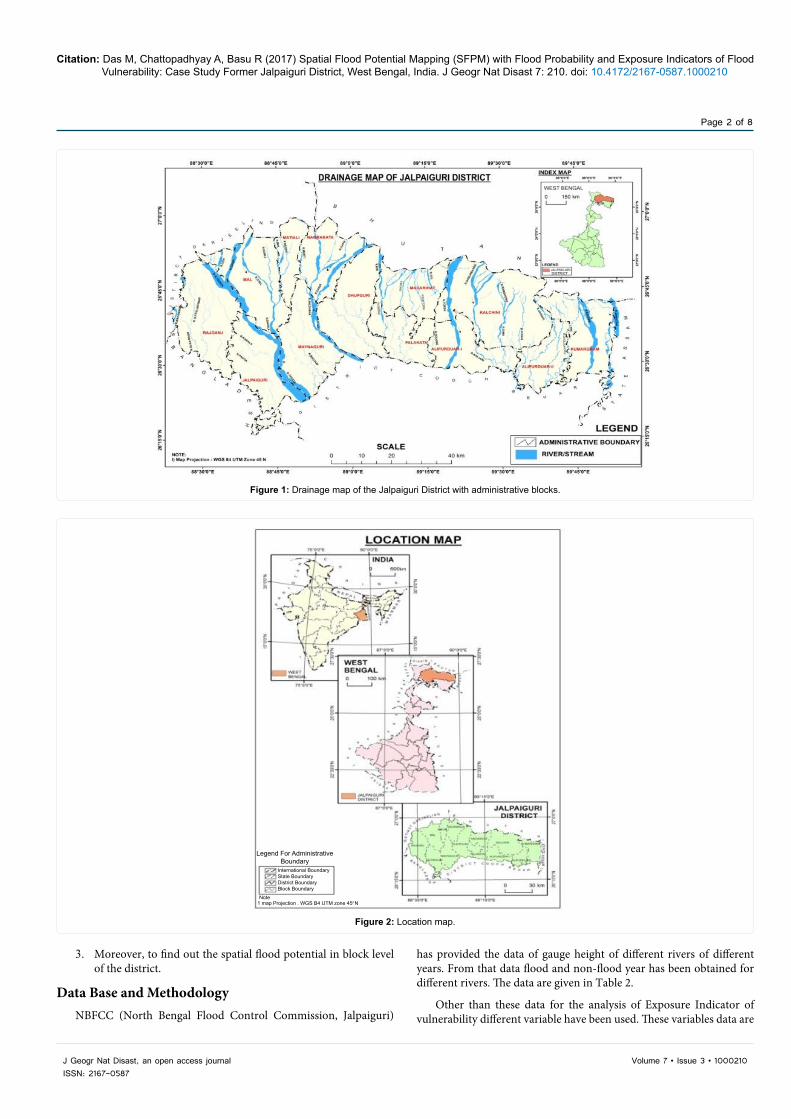
district is geographically situated from 26°16'35'' North to 26°59'30'' North and from 88°04’59" East to 89°55'20'' East comprising an area of 6227 sqkm [Jalpaiguri’-District Gazetteer].In West Bengal Jalpaiguri district occupies the southern flanks of the foothills of the Himalaya. Jalpaiguri district is bounded on the north by Darjeeling district of West Bengal and Bhutan, on south by Uttar Dinajpur and Coochbehar districts of West Bengal, on the west by Uttar Dinajpur and Darjeeling districts of West Bengal and Purnea district of Bihar, while Assam occurs on the east. The river Sankosh separates Jalpaiguri from the Goalpara district of Assam. Administratively, as per the 2011 Census records, Jalpaiguri district consists of three sub-divisions, viz. Sadar, Mal and Alipurduar. These sub divisions consist of 13 Community Development (CD Blocks), 17 police stations, 756 mouzas and 4 Municipalities (Census Report 2011). From 2014, the former Jalpaiguri district has been divided into – Jalpaiguri and Alipurduar districts (Figures 1 and 2).
Flood in the district is an annual phenomenon. However, its
*Corresponding author: Moitrayee Das, Assistant Professor, Post Graduate Department of Geography, Chandernagore College, Chandannagar, West Bengal, India, Tel: 9433459226; E-mail: [email protected]
Received July 30, 2017; Accepted October 18, 2017; Published October 25, 2017
Citation: Das M, Chattopadhyay A, Basu R (2017) Spatial Flood Potential Mapping (SFPM) with Flood Probability and Exposure Indicators of Flood Vulnerability: Case Study Former Jalpaiguri District, West Bengal, India. J Geogr Nat Disast 7: 210. doi: 10.4172/2167-0587.1000210
Copyright: © 2017 Das M, et al. This is an open-access article distributed under the terms of the Creative Commons Attribution License, which permits unrestricted use, distribution, and reproduction in any medium, provided the original author and source are credited.
Spatial Flood Potential Mapping (SFPM) with Flood Probability and Exposure Indicators of Flood Vulnerability: Case Study Former Jalpaiguri District, West Bengal, IndiaMoitrayee Das1*, Anis Chattopadhyay2 and Ranjan Basu3
1Department of Geography, Chandernagore College, Chandannagar, West Bengal, India2Department of Geography, Presidency College, Kolkata, India3Department of Geography, University of Calcutta, India
AbstractFlood is an annual event in the district of Jalpaiguri. Almost all the administrative blocks of the district are more
or less flood prone. Like the administrative blocks almost all the rivers in the district are also flood prone. Due to this every river has certain flood level as well as danger level to observed the flood situation in the area. Following the past observation of flood level crossed by the river the probability of current event can be obtained. In this paper the authors are tried to show the spatial distribution of flood potential in the district with the help of probability analysis of flood event of individual rivers and exposure indicator score of the adjacent area. Here probability explains number of chance of flood in Individual River and exposure indications explain how much the area is exposed to flooding. The mapping is based on spatial flood potential index (SFPI).
intensities vary from year to year. These intensities vary in term of area affected (in hectare), population affected, cropped area affected, hous-ing affected and infrastructure affected. Almost all the administrative blocks are more or less affected by the flood every year. The main rivers in this district which influenced flood are Teesta, Jaldhaka, Torsa, Kaljani, Raidak, Riti, Titi, Mujnai, Sankosh etc. River Teesta influence Mal, Jalpaiguri Sadar and western part of Maynaguri block; River Jaldhaka influence Nagrakata, eastern part of Maynaguri and western part of Dhupguri block; River Torsa influence some part of Kalchini, Madarihat and Alipurduar I block; Raidak (I and II) influence Kumargram block. River Kaljani influence Alipurduar I block. Madarihat block is actually influenced by Riti, Titi and Mujnai River.
All the rivers have particular observation site established by CWC (Central Water Commission) and I and W (Irrigation and Waterways) Department, Jalpaiguri. I Gauge height have been observed in monsoon period (May to 15th October) from these stations flood forecasting (Table 1).
Objective of the StudyPresent paper has been high light on the following study.
1. To find out, if flood occurred in this year in the district then what will be the probability of flooding of each river.
2. To find out, how much the administrative blocks are exposed to flood.
Citation: Das M, Chattopadhyay A, Basu R (2017) Spatial Flood Potential Mapping (SFPM) with Flood Probability and Exposure Indicators of Flood Vulnerability: Case Study Former Jalpaiguri District, West Bengal, India. J Geogr Nat Disast 7: 210. doi: 10.4172/2167-0587.1000210
Page 2 of 8
Volume 7 • Issue 3 • 1000210J Geogr Nat Disast, an open access journalISSN: 2167-0587
3. Moreover, to find out the spatial flood potential in block level of the district.
Data Base and MethodologyNBFCC (North Bengal Flood Control Commission, Jalpaiguri)
has provided the data of gauge height of different rivers of different years. From that data flood and non-flood year has been obtained for different rivers. The data are given in Table 2.
Other than these data for the analysis of Exposure Indicator of vulnerability different variable have been used. These variables data are
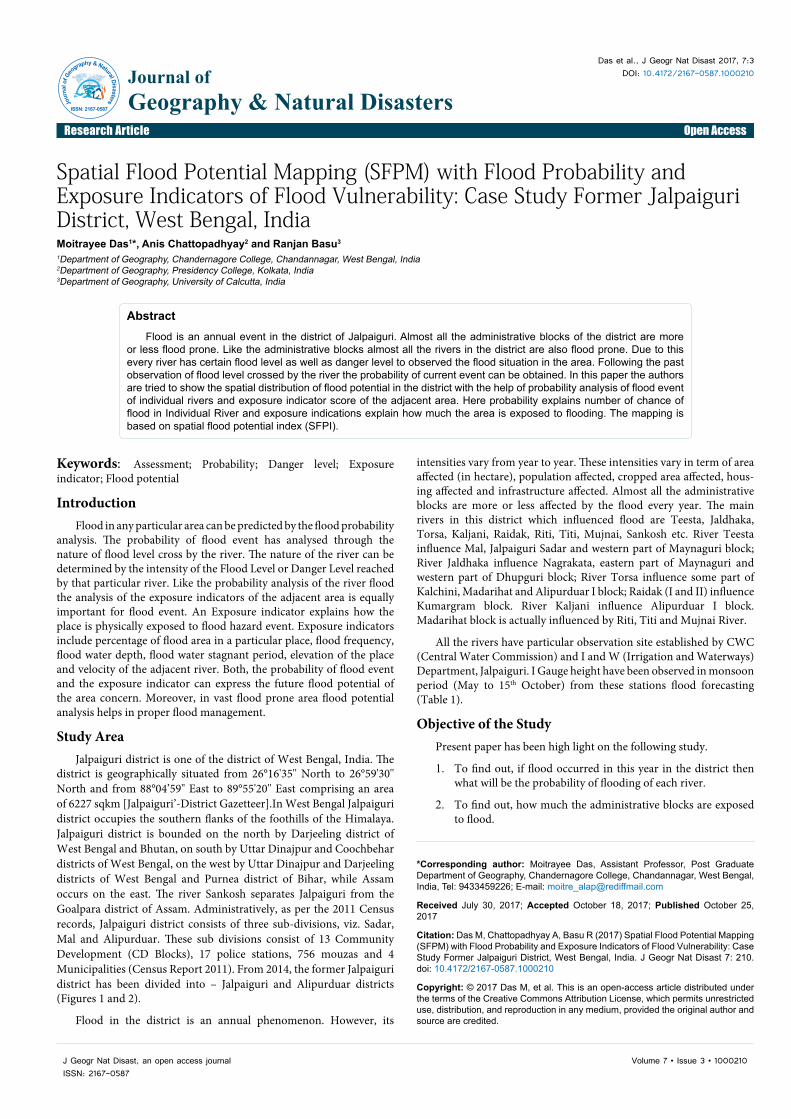
Figure 1: Drainage map of the Jalpaiguri District with administrative blocks.
Legend For AdministrativeBoundary
International Boundary State Boundary District Boundary Block Boundary
Note1 map Projection . WGS B4 UTM zone 45°N
Figure 2: Location map.
Citation: Das M, Chattopadhyay A, Basu R (2017) Spatial Flood Potential Mapping (SFPM) with Flood Probability and Exposure Indicators of Flood Vulnerability: Case Study Former Jalpaiguri District, West Bengal, India. J Geogr Nat Disast 7: 210. doi: 10.4172/2167-0587.1000210
Page 3 of 8
Volume 7 • Issue 3 • 1000210J Geogr Nat Disast, an open access journalISSN: 2167-0587
collected from various sources. Those are given in Table 3.
“Bayes” Theorem has been applied for probability analysis in different rivers [named after Thomas Bayes (1702-1761), an English theologian and mathematician.] It helps us determine posterior probabilities by ex-pressing them in term of prior probabilities. Here, B1, B2, B3…, …B12 are different rivers in different blocks which maximum affect the block in flood situation. Their flood data is given in the column based on the danger level crossed by that river. “A” here, is the flood event and “P” is the probability. An event “A” (flood event) can occur only if one of the mutually exclusive and exhaustive set of events B1, B2…, Bn occurs. Suppose that the unconditional probabilities P (B1), P (B2)… P (Bn) and the conditional probabilities P (A/B1.), P (A/B2)… P (A/Bn) is known. Then the conditional probability P (Bi/A) of a specified event Bi, when A is stated to be actually occurred.
Let, B1, B2,…, B7 represent mutually exclusive and exhaustive events with prior probabilities, P(B1), P(B2), P(B3),…, P(B7), then posterior probabilities of B1, B2,… B7, given A event , is given by conditional probabilities:
1
P(Bi)*P(A/ Bi)P(Bi)*P(A/ Bi)n
i=∑Other than the probability analysis for exposure indicator Principal
Component Analysis has been introduced. Principal Component Analysis is a statistical method - a branch of Factor Analysis - based on large number of variables statistically reduced to smaller number of general components. It also identifies components that account for the overall variability within the variables. The principal components are linear combinations of these variables accounting for the common and unique variability explained by them.
The steps involved in Principal Component Analysis are: i) extraction of initial components, ii) determination of significant component, retained in a model, iii) a Varimax rotation with Kaiser Normalisation applied for the component matrix based on factor loadings to obtain a solution, iv) interpretation of the solution, v) computation of score for each factor and of general score, vi) synthesis of results in Table 3. From the result of Probability Score (Px) and the Exposure Indicator Score (EIS) final Spatial Flood Potential Index
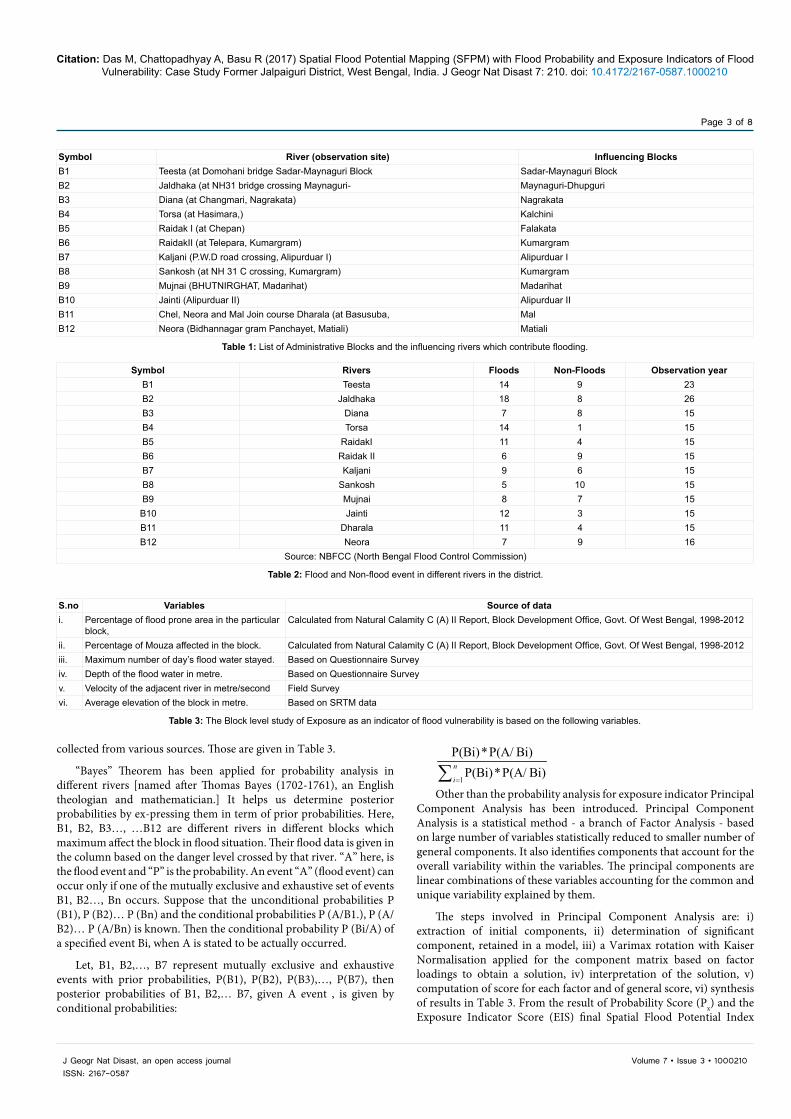
Symbol River (observation site) Influencing BlocksB1 Teesta (at Domohani bridge Sadar-Maynaguri Block Sadar-Maynaguri BlockB2 Jaldhaka (at NH31 bridge crossing Maynaguri- Maynaguri-DhupguriB3 Diana (at Changmari, Nagrakata) NagrakataB4 Torsa (at Hasimara,) KalchiniB5 Raidak I (at Chepan) FalakataB6 RaidakII (at Telepara, Kumargram) KumargramB7 Kaljani (P.W.D road crossing, Alipurduar I) Alipurduar IB8 Sankosh (at NH 31 C crossing, Kumargram) KumargramB9 Mujnai (BHUTNIRGHAT, Madarihat) MadarihatB10 Jainti (Alipurduar II) Alipurduar IIB11 Chel, Neora and Mal Join course Dharala (at Basusuba, MalB12 Neora (Bidhannagar gram Panchayet, Matiali) Matiali
Table 1: List of Administrative Blocks and the influencing rivers which contribute flooding.
Symbol Rivers Floods Non-Floods Observation yearB1 Teesta 14 9 23B2 Jaldhaka 18 8 26B3 Diana 7 8 15B4 Torsa 14 1 15B5 RaidakI 11 4 15B6 Raidak II 6 9 15B7 Kaljani 9 6 15B8 Sankosh 5 10 15B9 Mujnai 8 7 15B10 Jainti 12 3 15B11 Dharala 11 4 15B12 Neora 7 9 16
Source: NBFCC (North Bengal Flood Control Commission)
Table 2: Flood and Non-flood event in different rivers in the district.
S.no Variables Source of datai. Percentage of flood prone area in the particular
block,Calculated from Natural Calamity C (A) II Report, Block Development Office, Govt. Of West Bengal, 1998-2012
ii. Percentage of Mouza affected in the block. Calculated from Natural Calamity C (A) II Report, Block Development Office, Govt. Of West Bengal, 1998-2012iii. Maximum number of day’s flood water stayed. Based on Questionnaire Surveyiv. Depth of the flood water in metre. Based on Questionnaire Surveyv. Velocity of the adjacent river in metre/second Field Surveyvi. Average elevation of the block in metre. Based on SRTM data
Table 3: The Block level study of Exposure as an indicator of flood vulnerability is based on the following variables.
Citation: Das M, Chattopadhyay A, Basu R (2017) Spatial Flood Potential Mapping (SFPM) with Flood Probability and Exposure Indicators of Flood Vulnerability: Case Study Former Jalpaiguri District, West Bengal, India. J Geogr Nat Disast 7: 210. doi: 10.4172/2167-0587.1000210
Page 4 of 8
Volume 7 • Issue 3 • 1000210J Geogr Nat Disast, an open access journalISSN: 2167-0587
(SFPI) has been obtained. With that score the total mapping has been done.
The equation is=SFPI=Px * EIS.
Discussion and AnalysisProbability of flood in individual flood prone river have been
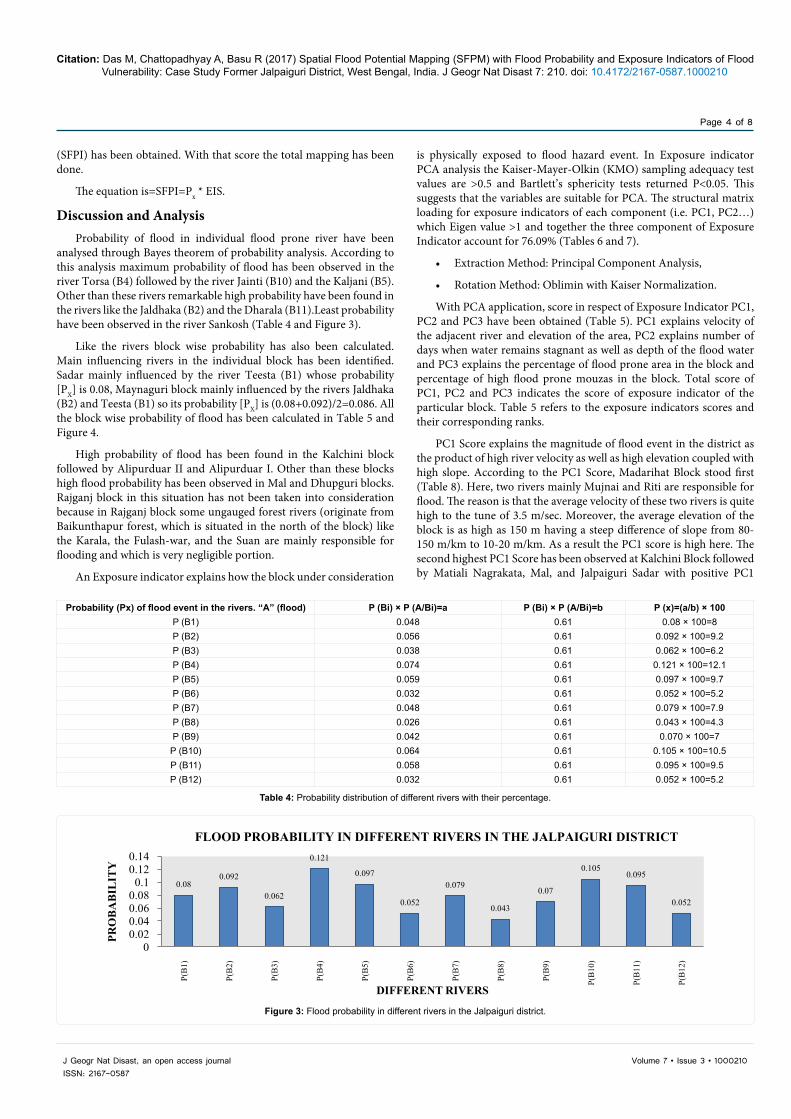
analysed through Bayes theorem of probability analysis. According to this analysis maximum probability of flood has been observed in the river Torsa (B4) followed by the river Jainti (B10) and the Kaljani (B5). Other than these rivers remarkable high probability have been found in the rivers like the Jaldhaka (B2) and the Dharala (B11).Least probability have been observed in the river Sankosh (Table 4 and Figure 3).
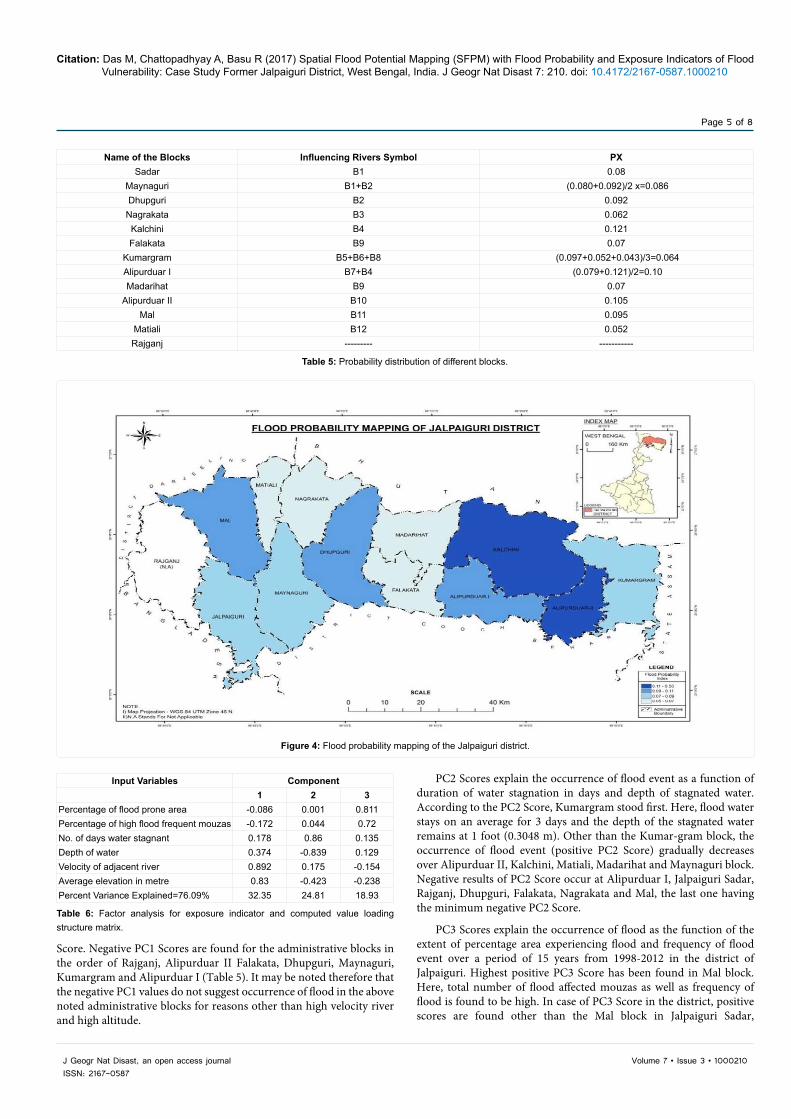
Like the rivers block wise probability has also been calculated. Main influencing rivers in the individual block has been identified. Sadar mainly influenced by the river Teesta (B1) whose probability [PX] is 0.08, Maynaguri block mainly influenced by the rivers Jaldhaka (B2) and Teesta (B1) so its probability [PX] is (0.08+0.092)/2=0.086. All the block wise probability of flood has been calculated in Table 5 and Figure 4.
High probability of flood has been found in the Kalchini block followed by Alipurduar II and Alipurduar I. Other than these blocks high flood probability has been observed in Mal and Dhupguri blocks. Rajganj block in this situation has not been taken into consideration because in Rajganj block some ungauged forest rivers (originate from Baikunthapur forest, which is situated in the north of the block) like the Karala, the Fulash-war, and the Suan are mainly responsible for flooding and which is very negligible portion.
An Exposure indicator explains how the block under consideration
is physically exposed to flood hazard event. In Exposure indicator PCA analysis the Kaiser-Mayer-Olkin (KMO) sampling adequacy test values are >0.5 and Bartlett’s sphericity tests returned P<0.05. This suggests that the variables are suitable for PCA. The structural matrix loading for exposure indicators of each component (i.e. PC1, PC2…) which Eigen value >1 and together the three component of Exposure Indicator account for 76.09% (Tables 6 and 7).
• Extraction Method: Principal Component Analysis,
• Rotation Method: Oblimin with Kaiser Normalization.
With PCA application, score in respect of Exposure Indicator PC1, PC2 and PC3 have been obtained (Table 5). PC1 explains velocity of the adjacent river and elevation of the area, PC2 explains number of days when water remains stagnant as well as depth of the flood water and PC3 explains the percentage of flood prone area in the block and percentage of high flood prone mouzas in the block. Total score of PC1, PC2 and PC3 indicates the score of exposure indicator of the particular block. Table 5 refers to the exposure indicators scores and their corresponding ranks.
PC1 Score explains the magnitude of flood event in the district as the product of high river velocity as well as high elevation coupled with high slope. According to the PC1 Score, Madarihat Block stood first (Table 8). Here, two rivers mainly Mujnai and Riti are responsible for flood. The reason is that the average velocity of these two rivers is quite high to the tune of 3.5 m/sec. Moreover, the average elevation of the block is as high as 150 m having a steep difference of slope from 80-150 m/km to 10-20 m/km. As a result the PC1 score is high here. The second highest PC1 Score has been observed at Kalchini Block followed by Matiali Nagrakata, Mal, and Jalpaiguri Sadar with positive PC1
0.080.092
0.062
0.121
0.097
0.052
0.079
0.043
0.07
0.1050.095
0.052
00.020.040.060.08
0.10.120.14
P(B
1)
P(B
2)
P(B
3)
P(B
4)
P(B
5)
P(B
6)
P(B
7)
P(B
8)
P(B
9)
P(B
10)
P(B
11)
P(B
12)
PRO
BA
BIL
ITY
DIFFERENT RIVERS
FLOOD PROBABILITY IN DIFFERENT RIVERS IN THE JALPAIGURI DISTRICT
Figure 3: Flood probability in different rivers in the Jalpaiguri district.
Probability (Px) of flood event in the rivers. “A” (flood) P (Bi) × P (A/Bi)=a P (Bi) × P (A/Bi)=b P (x)=(a/b) × 100P (B1) 0.048 0.61 0.08 × 100=8P (B2) 0.056 0.61 0.092 × 100=9.2P (B3) 0.038 0.61 0.062 × 100=6.2P (B4) 0.074 0.61 0.121 × 100=12.1P (B5) 0.059 0.61 0.097 × 100=9.7P (B6) 0.032 0.61 0.052 × 100=5.2P (B7) 0.048 0.61 0.079 × 100=7.9P (B8) 0.026 0.61 0.043 × 100=4.3P (B9) 0.042 0.61 0.070 × 100=7P (B10) 0.064 0.61 0.105 × 100=10.5P (B11) 0.058 0.61 0.095 × 100=9.5P (B12) 0.032 0.61 0.052 × 100=5.2
Table 4: Probability distribution of different rivers with their percentage.
Citation: Das M, Chattopadhyay A, Basu R (2017) Spatial Flood Potential Mapping (SFPM) with Flood Probability and Exposure Indicators of Flood Vulnerability: Case Study Former Jalpaiguri District, West Bengal, India. J Geogr Nat Disast 7: 210. doi: 10.4172/2167-0587.1000210
Page 5 of 8
Volume 7 • Issue 3 • 1000210J Geogr Nat Disast, an open access journalISSN: 2167-0587
PC2 Scores explain the occurrence of flood event as a function of duration of water stagnation in days and depth of stagnated water. According to the PC2 Score, Kumargram stood first. Here, flood water stays on an average for 3 days and the depth of the stagnated water remains at 1 foot (0.3048 m). Other than the Kumar-gram block, the occurrence of flood event (positive PC2 Score) gradually decreases over Alipurduar II, Kalchini, Matiali, Madarihat and Maynaguri block. Negative results of PC2 Score occur at Alipurduar I, Jalpaiguri Sadar, Rajganj, Dhupguri, Falakata, Nagrakata and Mal, the last one having the minimum negative PC2 Score.
PC3 Scores explain the occurrence of flood as the function of the extent of percentage area experiencing flood and frequency of flood event over a period of 15 years from 1998-2012 in the district of Jalpaiguri. Highest positive PC3 Score has been found in Mal block. Here, total number of flood affected mouzas as well as frequency of flood is found to be high. In case of PC3 Score in the district, positive scores are found other than the Mal block in Jalpaiguri Sadar,
Score. Negative PC1 Scores are found for the administrative blocks in the order of Rajganj, Alipurduar II Falakata, Dhupguri, Maynaguri, Kumargram and Alipurduar I (Table 5). It may be noted therefore that the negative PC1 values do not suggest occurrence of flood in the above noted administrative blocks for reasons other than high velocity river and high altitude.
Name of the Blocks Influencing Rivers Symbol PXSadar B1 0.08
Maynaguri B1+B2 (0.080+0.092)/2 x=0.086Dhupguri B2 0.092
Nagrakata B3 0.062Kalchini B4 0.121Falakata B9 0.07
Kumargram B5+B6+B8 (0.097+0.052+0.043)/3=0.064Alipurduar I B7+B4 (0.079+0.121)/2=0.10Madarihat B9 0.07
Alipurduar II B10 0.105Mal B11 0.095
Matiali B12 0.052Rajganj --------- -----------
Table 5: Probability distribution of different blocks.
Figure 4: Flood probability mapping of the Jalpaiguri district.
Input Variables Component1 2 3
Percentage of flood prone area -0.086 0.001 0.811Percentage of high flood frequent mouzas -0.172 0.044 0.72No. of days water stagnant 0.178 0.86 0.135Depth of water 0.374 -0.839 0.129Velocity of adjacent river 0.892 0.175 -0.154Average elevation in metre 0.83 -0.423 -0.238Percent Variance Explained=76.09% 32.35 24.81 18.93
Table 6: Factor analysis for exposure indicator and computed value loading structure matrix.
Citation: Das M, Chattopadhyay A, Basu R (2017) Spatial Flood Potential Mapping (SFPM) with Flood Probability and Exposure Indicators of Flood Vulnerability: Case Study Former Jalpaiguri District, West Bengal, India. J Geogr Nat Disast 7: 210. doi: 10.4172/2167-0587.1000210
Page 6 of 8
Volume 7 • Issue 3 • 1000210J Geogr Nat Disast, an open access journalISSN: 2167-0587
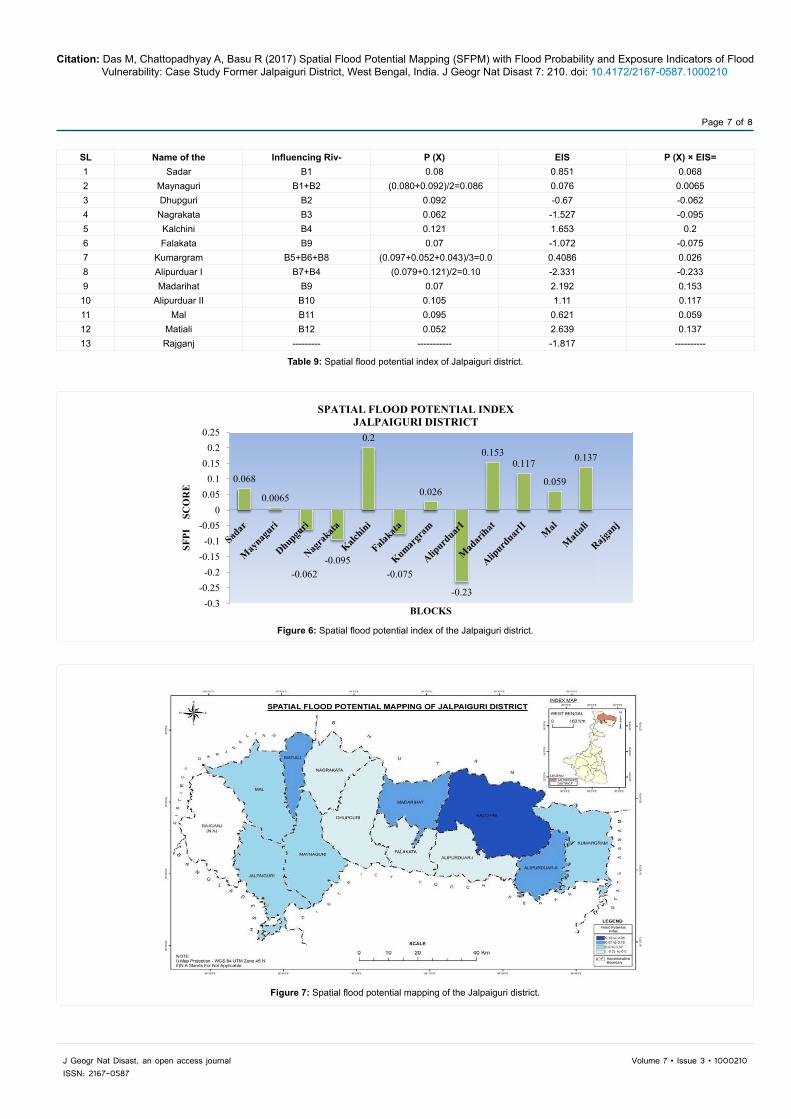
Spatial flood potential Index (SFPI) has been calculated with PX (Probability of individual block) and EIS (Exposure Indicator Score of individual blocks). SFPI of individual blocks has been identified which is given in Table 9. According to this calculation maximum SFPI has been observed in Kalchini block followed by Madarihat and Matiali block. The remarkable high SFPI are also observed in Alipurduar II and Sadar block. In spite of remarkable high probability in Dhupguri and Nagrakata block due to low score of EIS the SFPI of these block become very low. Again due to high EIS in Matiali and Madarihat block SFPI is high in spite of low Px. With the value of SFPI Spatial Flood Potential Mapping (SFPM) has been done for whole district (Figure 6).
ConclusionProper mapping of SFPI is the essential tool for the planner in flood
management because management implies not to protect from flood water but also identify high probable area which is exposed to flood and the high probable area which can be flooded in single flood event (Figure 7).
Maynaguri, Dhupguri, Matiali, Falakata, Madarihat, Alipurduar and Kumargram. It clearly speaks for the large areal extent and high flood frequency in the district. This is why in almost all the blocks PC3 Score is positive in nature. The negative PC3 Scores are found in Kalchini, Alipurduar I, Rajganj and Nagrakata block. In all of these four blocks, maximum portion of land is covered by forest.
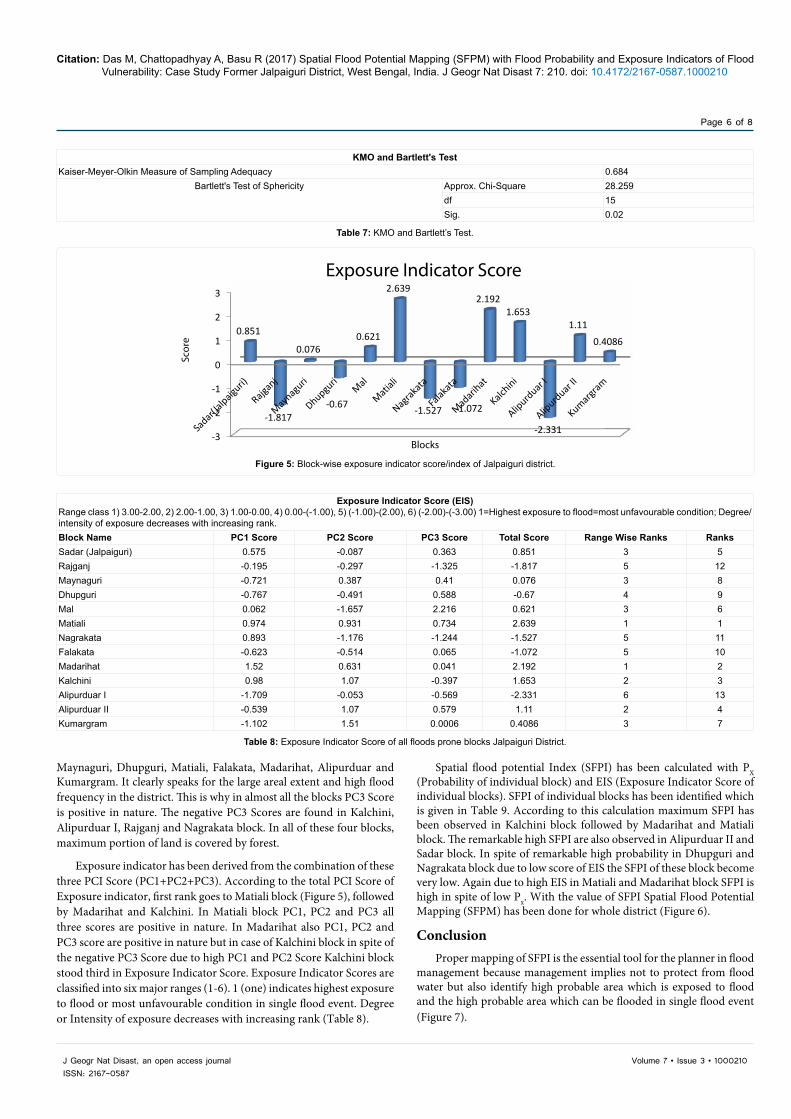
Exposure indicator has been derived from the combination of these three PCI Score (PC1+PC2+PC3). According to the total PCI Score of Exposure indicator, first rank goes to Matiali block (Figure 5), followed by Madarihat and Kalchini. In Matiali block PC1, PC2 and PC3 all three scores are positive in nature. In Madarihat also PC1, PC2 and PC3 score are positive in nature but in case of Kalchini block in spite of the negative PC3 Score due to high PC1 and PC2 Score Kalchini block stood third in Exposure Indicator Score. Exposure Indicator Scores are classified into six major ranges (1-6). 1 (one) indicates highest exposure to flood or most unfavourable condition in single flood event. Degree or Intensity of exposure decreases with increasing rank (Table 8).
KMO and Bartlett's TestKaiser-Meyer-Olkin Measure of Sampling Adequacy 0.684
Bartlett's Test of Sphericity Approx. Chi-Square 28.259df 15Sig. 0.02
Table 7: KMO and Bartlett’s Test.
-3
-2
-1
0
1
2
3
0.851
-1.817
0.076
-0.67
0.621
2.639
-1.527 -1.072
2.1921.653
-2.331
1.11
0.4086
Scor
e
Blocks
Exposure Indicator Score
Figure 5: Block-wise exposure indicator score/index of Jalpaiguri district.
Exposure Indicator Score (EIS)Range class 1) 3.00-2.00, 2) 2.00-1.00, 3) 1.00-0.00, 4) 0.00-(-1.00), 5) (-1.00)-(2.00), 6) (-2.00)-(-3.00) 1=Highest exposure to flood=most unfavourable condition; Degree/ intensity of exposure decreases with increasing rank.Block Name PC1 Score PC2 Score PC3 Score Total Score Range Wise Ranks RanksSadar (Jalpaiguri) 0.575 -0.087 0.363 0.851 3 5Rajganj -0.195 -0.297 -1.325 -1.817 5 12Maynaguri -0.721 0.387 0.41 0.076 3 8Dhupguri -0.767 -0.491 0.588 -0.67 4 9Mal 0.062 -1.657 2.216 0.621 3 6Matiali 0.974 0.931 0.734 2.639 1 1Nagrakata 0.893 -1.176 -1.244 -1.527 5 11Falakata -0.623 -0.514 0.065 -1.072 5 10Madarihat 1.52 0.631 0.041 2.192 1 2Kalchini 0.98 1.07 -0.397 1.653 2 3Alipurduar I -1.709 -0.053 -0.569 -2.331 6 13Alipurduar II -0.539 1.07 0.579 1.11 2 4Kumargram -1.102 1.51 0.0006 0.4086 3 7
Table 8: Exposure Indicator Score of all floods prone blocks Jalpaiguri District.
Citation: Das M, Chattopadhyay A, Basu R (2017) Spatial Flood Potential Mapping (SFPM) with Flood Probability and Exposure Indicators of Flood Vulnerability: Case Study Former Jalpaiguri District, West Bengal, India. J Geogr Nat Disast 7: 210. doi: 10.4172/2167-0587.1000210
Page 7 of 8
Volume 7 • Issue 3 • 1000210J Geogr Nat Disast, an open access journalISSN: 2167-0587
SL Name of the Influencing Riv- P (X) EIS P (X) × EIS=1 Sadar B1 0.08 0.851 0.0682 Maynaguri B1+B2 (0.080+0.092)/2=0.086 0.076 0.00653 Dhupguri B2 0.092 -0.67 -0.0624 Nagrakata B3 0.062 -1.527 -0.0955 Kalchini B4 0.121 1.653 0.26 Falakata B9 0.07 -1.072 -0.0757 Kumargram B5+B6+B8 (0.097+0.052+0.043)/3=0.0 0.4086 0.0268 Alipurduar I B7+B4 (0.079+0.121)/2=0.10 -2.331 -0.2339 Madarihat B9 0.07 2.192 0.153
10 Alipurduar II B10 0.105 1.11 0.11711 Mal B11 0.095 0.621 0.05912 Matiali B12 0.052 2.639 0.13713 Rajganj --------- ----------- -1.817 ----------
Table 9: Spatial flood potential index of Jalpaiguri district.
0.068
0.0065
-0.062-0.095
0.2
-0.075
0.026
-0.23
0.1530.117
0.059
0.137
-0.3-0.25
-0.2-0.15
-0.1-0.05
00.05
0.10.15
0.20.25
SFPI
S
CO
RE
BLOCKS
SPATIAL FLOOD POTENTIAL INDEXJALPAIGURI DISTRICT
Figure 6: Spatial flood potential index of the Jalpaiguri district.
Figure 7: Spatial flood potential mapping of the Jalpaiguri district.

Citation: Das M, Chattopadhyay A, Basu R (2017) Spatial Flood Potential Mapping (SFPM) with Flood Probability and Exposure Indicators of Flood Vulnerability: Case Study Former Jalpaiguri District, West Bengal, India. J Geogr Nat Disast 7: 210. doi: 10.4172/2167-0587.1000210
Page 8 of 8
Volume 7 • Issue 3 • 1000210J Geogr Nat Disast, an open access journalISSN: 2167-0587
References
1. Cutter SL (1996) Vulnerability to environmental hazards. Progress in Human Geography 20: 529-539.
2. Croxton FE, Cowden DJ, Klein S (1967) Applied General Statistics; Third Edition; Prentice-Hall of India Pvt. Ltd 63: 738.
3. David E (1977) Statistics in Geography; Second Edition; Blackwell Publishers, Oxford, UK, 1985.
4. Heyman BN, Davis C, Krumpe PF (1991) “An assessment of Worldwide disaster vulnerability”. Disaster Management 4: 3-36.
5. Messner F, Meyer V (2006). Flood damage, vulnerability and risk perception of challenges for food damage research. In: Schanze J, Zeman E, Marsalek J (eds.) Flood risk management of hazards, vul-nerability and mitigation measures. Springer, pp: 149-167.
6. Mollah S (2013) Regional Flood Hazard Mapping in Murshidabad, West Bengal, International Journal of Scientific Research 2(2).
7. Spiegel MR (1961) Theory and Problems of Statistics; Schaum’s Outline Series; McGraw-Hill Book Company.
8. Frank Messner, Volker Meyer (2005) UFZ Discussion papers, Department of Economics.
Citation: Das M, Chattopadhyay A, Basu R (2017) Spatial Flood Potential Mapping (SFPM) with Flood Probability and Exposure Indicators of Flood Vulnerability: Case Study Former Jalpaiguri District, West Bengal, India. J Geogr Nat Disast 7: 210. doi: 10.4172/2167-0587.1000210