Fundamental Infrared Spectroscopy by Hue Phan
8
1 T N-1 0 0 FUNDAMENTAL INFRARED SPEC TRO SCO PY by Hue Phan Principl e of InfraredS pe ctrosc opy Spectroscopy is the study of the interaction of electromagnetic radiation with a chemical subs t ance . The nature of the int era cti on d epe nds upon t he properties of the sub stance. W hen radiation passes through a sample (solid, liquid or gas), certain frequencies of the radiation are abs orbed by the m olecu les of t he s ubs t ance lea ding to the m olecu lar v ibrations. The f req uenc ies of absorbed radiation are unique for each molecule which provide the characteristics of a substance. T h e e le c tr oma g ne tic s p ec tr um co v e r s a n im mense r an g e o f w ave le n g th s. T h e in fr a r e d re g io ns a r e classified as follows: N e ar In f ra r e d 1 2 5 0 0 to 4 0 0 0 cm -1 (0.8 to 2.5um) M id In f rare d 4 0 0 0 to 2 0 0 cm-1 (2.5 to 50um) F ar In f rare d 2 0 0 to 1 2 .5 cm-1 (50 to 800um ) Figu re 1 . I ntera ction of ra diation w ith m a tte r.
-
Upload
ajanto-kumar-hazarika -
Category
Documents
-
view
21 -
download
0
Transcript of Fundamental Infrared Spectroscopy by Hue Phan
5/14/2018 Fundamental Infrared Spectroscopy by Hue Phan - slidepdf.com
http://slidepdf.com/reader/full/fundamental-infrared-spectroscopy-by-hue-phan 1/8
1
TN-100
FUNDAMENTAL INFRARED SPECTROSCOPY
by Hue Phan
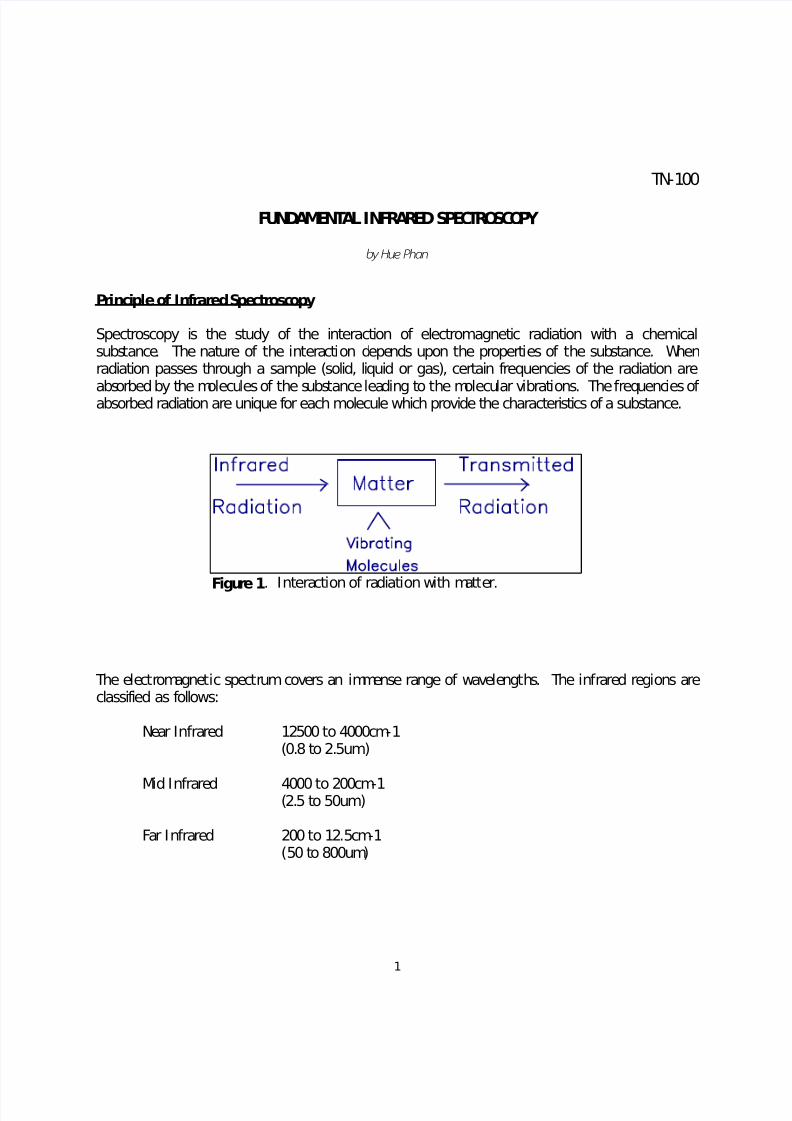
Principle of Infrared Spectroscopy
Spectroscopy is the study of the interaction of electromagnetic radiation with a chemicalsubstance. The nature of the int eract ion depends upon the propert ies of the substance. Whenradiation passes through a sample (solid, liquid or gas), certain frequencies of the radiation are
absorbed by the molecules of t he substance leading to the molecular vibrat ions. The frequencies ofabsorbed radiation are unique for each molecule which provide the characteristics of a substance.
The elect romagneti c spectrum covers an immense range of wavelengt hs. The infrared regions areclassified as follows:
Near I nfrared 12500 to 4000cm-1(0.8 to 2.5um)
Mid I nfrared 4000 to 200cm-1(2.5 to 50um)
Far I nfrared 200 to 12.5cm-1(50 t o 800um)
Figure 1. I nteracti on of radiati on wit h mat ter.

5/14/2018 Fundamental Infrared Spectroscopy by Hue Phan - slidepdf.com
http://slidepdf.com/reader/full/fundamental-infrared-spectroscopy-by-hue-phan 2/8
2
Either the wavelength (µm) or wavenumber (cm-1) is used to measure the position of an infrared
absorpti on. The absorpt ion bands for most organic and inorganic compounds are found i n theinfrared region. The table of characterist ic I R absorpti ons of funct ional groups can be found inmost chemistry text books. Any absorpt ion band can be characterized by two parameters: t hewavelength at which maximum absorption occurs and the intensity of absorption at this
wavelength. I n an absorpti on spect rum, the y-axis measures the int ensi t y of the band which isproporti onal to t he number of molecules observed. This principle consequent ly leads toquantitative analysis.
Intensity of IR Absorption
Transmit tance T = I/ Io
Absorbance A = log(1/ T) = log( Io/ I )= ecL
I o = Int ensit y of incident radiationI = I ntensit y of t ransmitt ed radiati on
e = molar extincti on coeff icientc = concent rat ion (mole/ l)L = sample pathlengt h (cm)
Figure 2. Schemat ic absorpt ion spectrum.
5/14/2018 Fundamental Infrared Spectroscopy by Hue Phan - slidepdf.com
http://slidepdf.com/reader/full/fundamental-infrared-spectroscopy-by-hue-phan 3/8
3
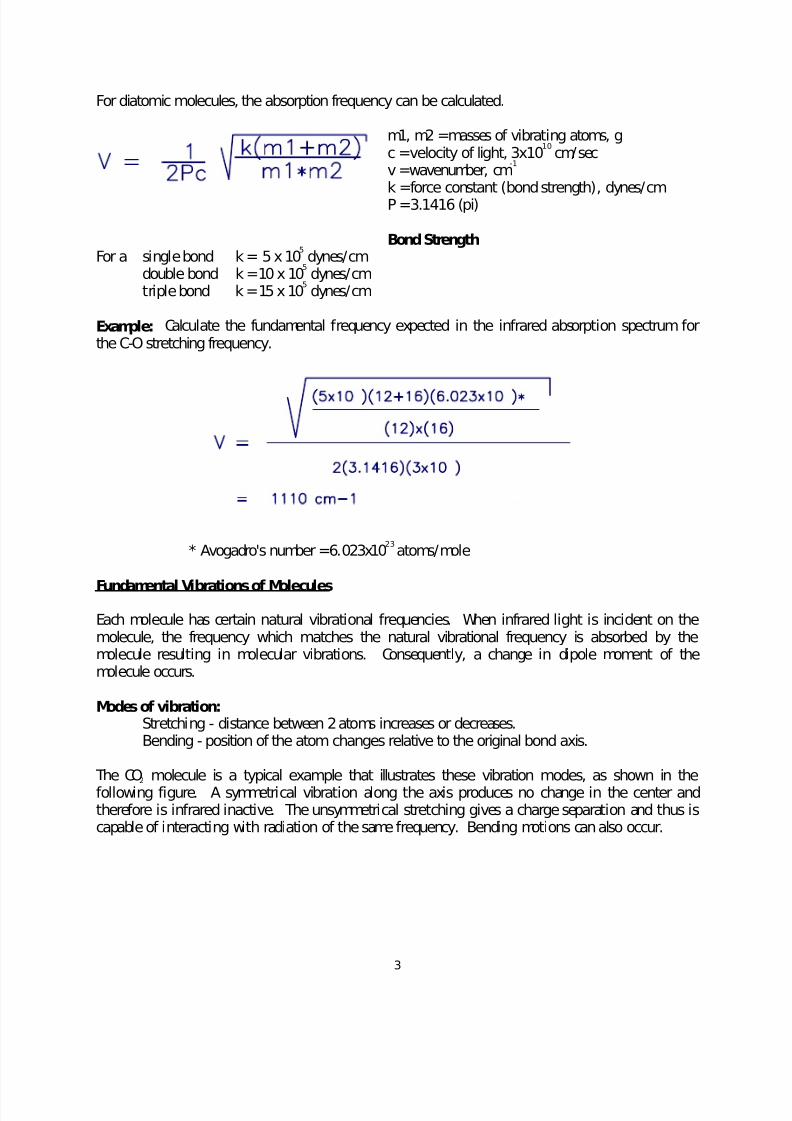
For diatomic molecules, the absorption frequency can be calculated.
m1, m2 = masses of vibrating atoms, gc = velocit y of li ght, 3x10
10cm/ sec
v = wavenumber, cm-1
k = force constant ( bond st rength) , dynes/ cmP = 3.1416 (pi)
Bond StrengthFor a si ngle bond k = 5 x 10
5dynes/ cm
double bond k = 10 x 105
dynes/ cmt ri ple bond k = 15 x 10
5dynes/ cm
Example: Calculate the fundamental frequency expected in the infrared absorption spectrum forthe C-O stretching frequency.
* Avogadro's number = 6.023x10²³
atoms/ mole
Fundamental Vibrations of Molecules
Each molecule has certain natural vibrational frequencies. When inf rared light is incident on themolecule, the frequency which matches the natural vibrational frequency is absorbed by themolecule result ing in molecular vibrati ons. Consequently, a change in di pole moment of themolecule occurs.
Modes of vibration:Stretching - distance between 2 atoms increases or decreases.Bending - position of the atom changes relative to the original bond axis.
The CO2 molecule is a typical example that illustrates these vibration modes, as shown in thefol lowing figure. A symmetri cal vibration along t he axis produces no change in t he center andtherefore is in frared inactive. The unsymmetri cal stret ching gi ves a charge separati on and thus iscapable of i nteracti ng wit h radiati on of t he same frequency. Bending motions can also occur.

5/14/2018 Fundamental Infrared Spectroscopy by Hue Phan - slidepdf.com
http://slidepdf.com/reader/full/fundamental-infrared-spectroscopy-by-hue-phan 4/8
4
Example: Carbon dioxide molecule depicted in vibrat ion modes.
(a) symmetrical stretching(b) asymmetrical stretching(c) bending
Factors Influencing Number of Absorpt ion Bands
Infrared absorption occurs as a result of vibrational and rotational transitions within the molecule.Because only a few compounds exhibit pure rotational bands, the vibrational absorption bands are
of more pract ical int erest . There are other factors in fluencing the number of absorpti on bands.
Factors limiting the number of absorption bands:* No change in di pole moment due to symmetry.* Degeneracy: Vibrat ional frequencies located too closely.* Weak absorpt ions.
Factors increasing the number of absorption bands:* Overtone bands: Absorpti on at frequencies representi ng the fundamental f requencies at t hemultiples of the fundamentals.* Combinat ion bands: Two fundamental vibrati ons interact and are in fluenced by radiat ion at t hecombined frequency.* Vibrational-Rotati onal bands: The single vibrati onal band is accompanied by a series ofsubsidiary bands both at lower and higher frequencies. Gas spectra are commonly characterized byvery complex vibration-rot ati on systems.* Harmonic coupli ng bands: I nteracti on from adjacent groups of nearly ident ical oscil lat ionfrequencies produces a series of bands quite apart f rom those normally expected. This phenomenonis relati vely uncommon.

5/14/2018 Fundamental Infrared Spectroscopy by Hue Phan - slidepdf.com
http://slidepdf.com/reader/full/fundamental-infrared-spectroscopy-by-hue-phan 5/8
5
Interferometry
The main component in the Fourier Transform Infrared (FTIR) spectrometer is an interferometer.This device splits and recombines a beam of light such that the recombined beam produces awavelength-dependent interference pattern or an interferogram. The Michelson in terferometer is
most commonly used.
A Michelson interferometer consists of two mirrors and a beamsplitter positioned at an angle of 45degrees to the mirrors. A KBr beamspli t t er coated wit h Germanium is typically used for mid I R
region. I ncident l ight st rikes the beamspli t t er so that half of t he li ght i s t ransmit ted through thebeamspli t t er and half is reflected to the mirrors. The two components are then reflected back andrecombined at the beamsplitter with half of the light passing on toward the sampling areas andhalf t ravell ing back toward the source. The signal at t he detector is a cosine wave.
In general, the function of the interferometer is to disperse the radiation provided by the IR sourceinto its component frequencies.
With polychromatic light (radiation with more than a single wavelength), the output signal is thesum of all the cosine waves which is the Fourier Transform of the spectrum or an interferogram.Figure 4 presents a simplified interferogram from an incident wave consisting of three discrete
frequencies. Thi s signal i s the sum of the three cosine wave signals from each frequencyseparately. The in terferogram contains the basic inf ormat ion on frequencies and in tensit iescharacteristi c of a spect rum but in a form that i s not di rect ly int erpretable. Thus, the in formationis converted to a more familiar form, a spectrum, using Fourier Transform methods.
Figure 3. Opt ical schemati c of a Michelson int erferometer.

5/14/2018 Fundamental Infrared Spectroscopy by Hue Phan - slidepdf.com
http://slidepdf.com/reader/full/fundamental-infrared-spectroscopy-by-hue-phan 6/8
6
The interferogram is a function of time domain and the spectrum is a function of frequencydomain. A spectrum is calculated from the interferogram by computing the cosine FourierTransform of the int erferogram.
===== FOURIER TRANSFORM =====>>
Figure 5. A simplified interferogram (offset by 2 units) from a light waveconsist ing of t hree discrete frequencies. This signal is the sum of the 3cosine waves separately.

5/14/2018 Fundamental Infrared Spectroscopy by Hue Phan - slidepdf.com
http://slidepdf.com/reader/full/fundamental-infrared-spectroscopy-by-hue-phan 7/8
7
Intermediate steps of data acquisit ion of the IR spectrum of polystyrene

5/14/2018 Fundamental Infrared Spectroscopy by Hue Phan - slidepdf.com
http://slidepdf.com/reader/full/fundamental-infrared-spectroscopy-by-hue-phan 8/8
8
Instrumentation
The basic components of an infrared spectrometer are shown in block diagram form on Figure 3.The system consists of an i nt erferometer, a computer, a data stati on, and a print er and/ or plot terfor data output.
With an infrared data station, the computer acquires, processes, stores and retrieves spectral data.
Many commercial software packages including spectral enhancement, quantitation and searchingare available for infrared spectroscopy.
Figure 4. Basic component s of a computerized spectrometer system.