Functional Question (and lesson) Foundation (Statistics 2)
20
Functional Question (and lesson) Foundation (Statistics 2) For the week beginning ….
-
Upload
eric-ramsey -
Category
Documents
-
view
36 -
download
0
description
Functional Question (and lesson) Foundation (Statistics 2). For the week beginning …. Lesson Plan – Finding the Mean, Median and Mode. Assessment Objective - AO3. Developing AO3 skills is a process that depends on giving learners confidence to: · Try different approaches - PowerPoint PPT Presentation
Transcript of Functional Question (and lesson) Foundation (Statistics 2)
Functional Question(and lesson)
Foundation(Statistics 2)
For the week beginning ….
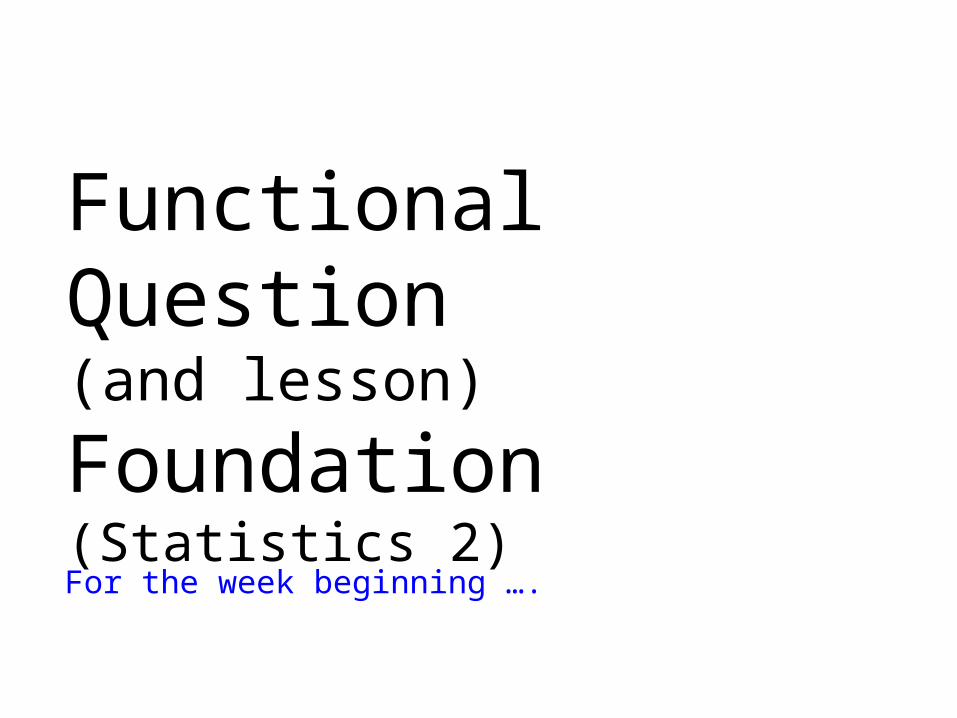
Lesson Plan – Finding the Mean, Median and Mode
Mental and Oral StarterExplain that you have rolled a dice 11 times and recorded the data in the raw scores table. Ask pupils to use the raw scores to complete the frequency table and bar graph.
Ask pupils to find the mean, median, mode and range of the raw data from the starter activity. Next, roll a dice 11 times and record the scores in the frequency table. Ask pupils how they can use the frequency table to find the mean, median, mode and range, ask pupils why you cannot find the mean by adding up the values and dividing by 6. Roll the dice another 11 times and record the scores in a bar graph. Ask the pupils how they can find the mean, median and mode from the bar graph. Explain that they may not be able to go straight from the bar graph to the mean and median without writing some information down first.Main Activity Pupils to match each bar graph to a set of data.Support - Pupils to concentrate on matching the modal values.Main - Pupils to find the mean by listing all the values.Extension - Pupils to use more efficient techniques to find the mean.Mini -Plenary - Discussion about strategies used to match the cards and how pupils found the missing data and bar graph.
PlenaryHand out the functional question. Allow pupils 10 minutes to discuss with their partner and answer the question as fully as possible. Allow a further 5 minutes to show the mark scheme on the board. Explain how each mark is awarded and what is meant by a B1, A1, M1 and Q1. Finally ask pupils to decide whether they answer they have given would gain them the mark.
Reflection Green Amber Red
ObjectivesTo understand how to find the mode, median, mean and range from raw data, a frequency table and a bar graph.
Keywords Mean, Median, Mode and Range

Developing AO3 skills is a process that depends on giving learners confidence to:
· Try different approaches· Make mistakes and rectify them in a constructive environment· Justify decisions and explain consequences· Express ideas and communicate conclusions in a variety of ways and to different audiences.
Assessment Objective - AO3
AO3 seeks to assess a learner’s ability to:
· Process information· Pose problems and pursue them· Conjecture and investigate within mathematics· Reason concisely· Evaluate and check methods and results· Present solution(s) effectively
There is a link to the three strands in Functional Mathematics:
· Represent (strategy)· Analyse· Interpret
However, not all AO3 questions will be “functional”.
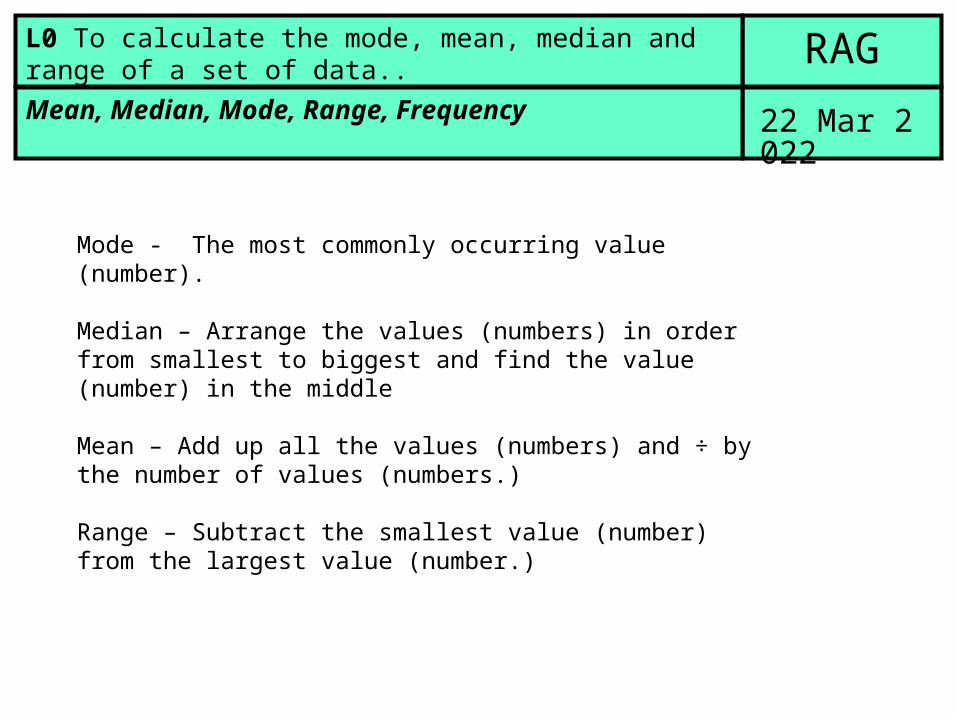
RAGMean, Median, Mode, Range, Frequency
L0 To calculate the mode, mean, median and range of a set of data..
20 Apr 2023
Mode - The most commonly occurring value (number).
Median – Arrange the values (numbers) in order from smallest to biggest and find the value (number) in the middle
Mean – Add up all the values (numbers) and ÷ by the number of values (numbers.)
Range – Subtract the smallest value (number) from the largest value (number.)

Starter Activity
Ms Hindle rolled a dice 11 times and recorded her scores in the table below.
Record the scores in the frequency table and present the raw scores as a bar chart.
Raw Scores

Starter Activity
Ms Hindle rolled a dice 11 times and recorded her scores in the table below.
Record the scores in the frequency table and present the raw scores as a bar chart.
Raw Scores
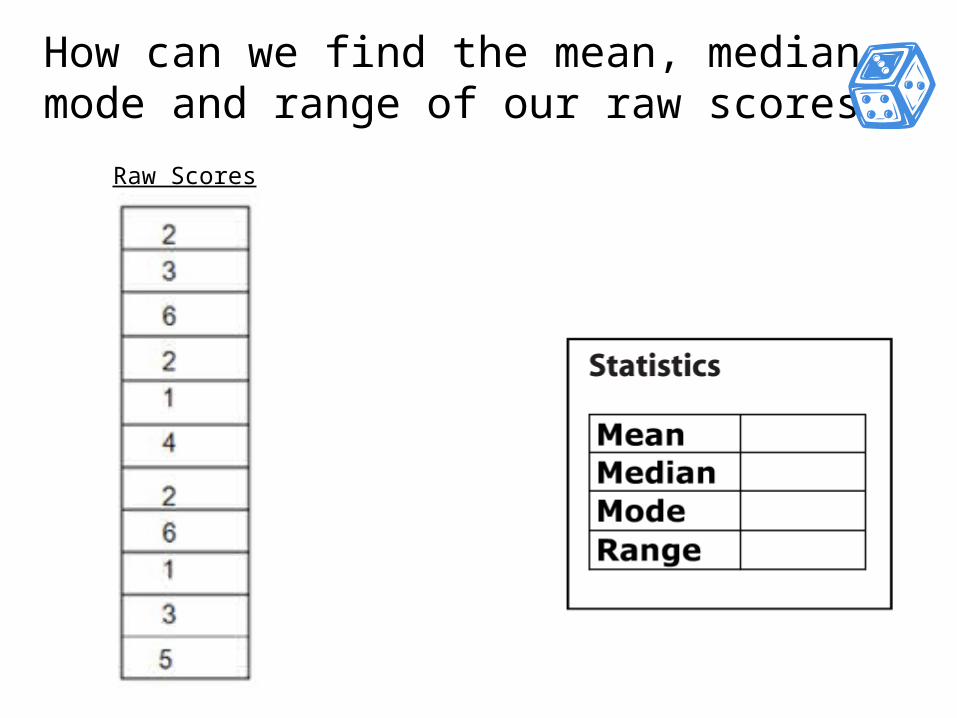
How can we find the mean, median, mode and range of our raw scores?
Raw Scores
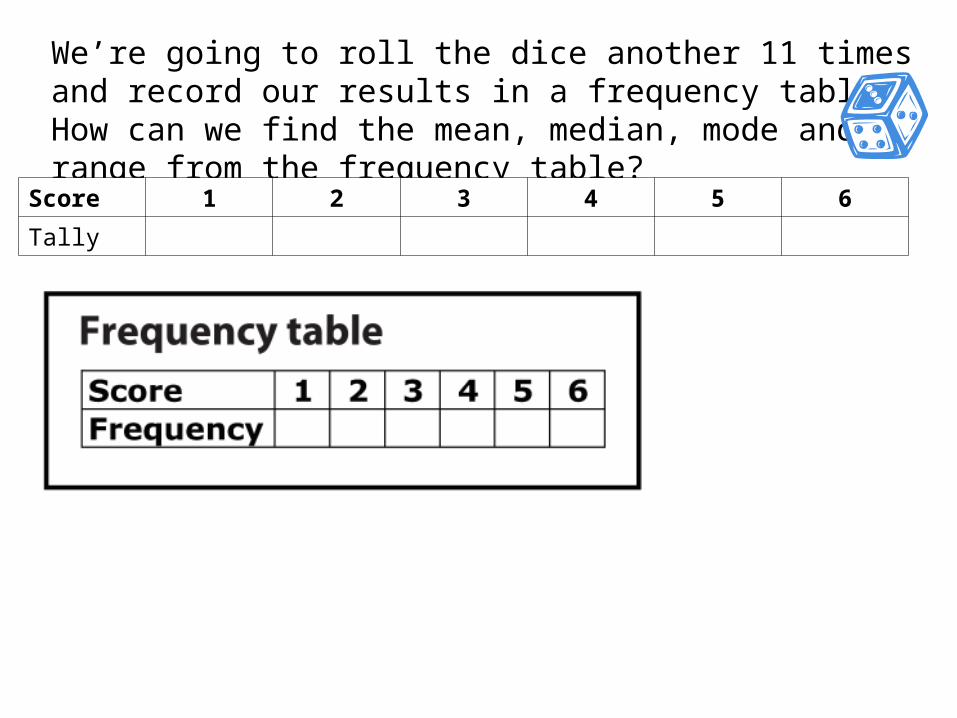
We’re going to roll the dice another 11 times and record our results in a frequency table. How can we find the mean, median, mode and range from the frequency table?
Score 1 2 3 4 5 6
Tally
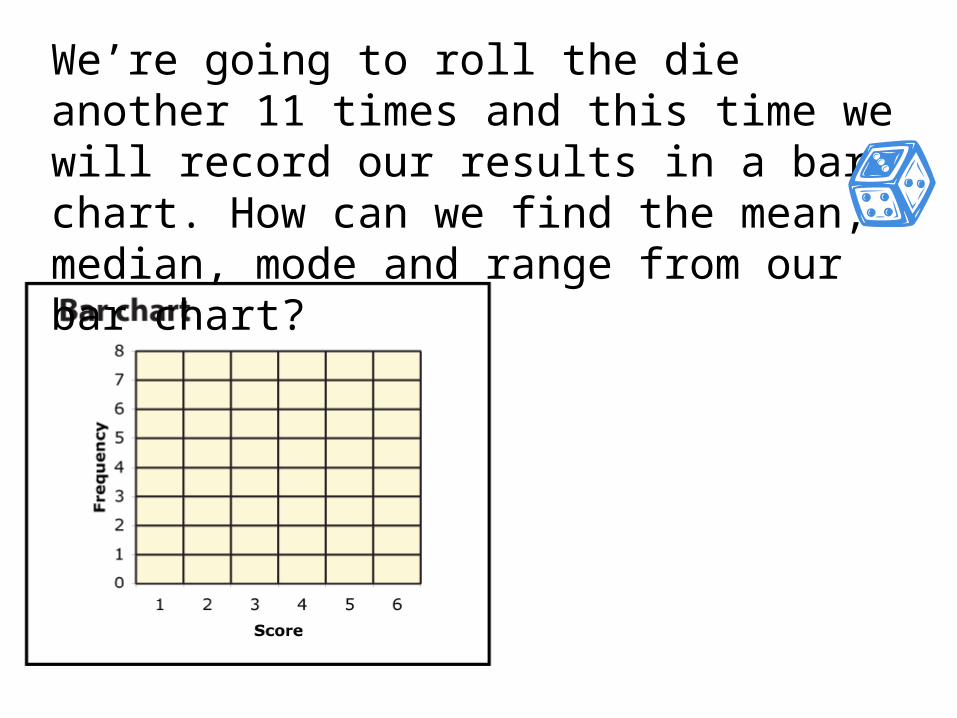
We’re going to roll the die another 11 times and this time we will record our results in a bar chart. How can we find the mean, median, mode and range from our bar chart?

Today’s Task
Match each bar graph to the correct statistics table.
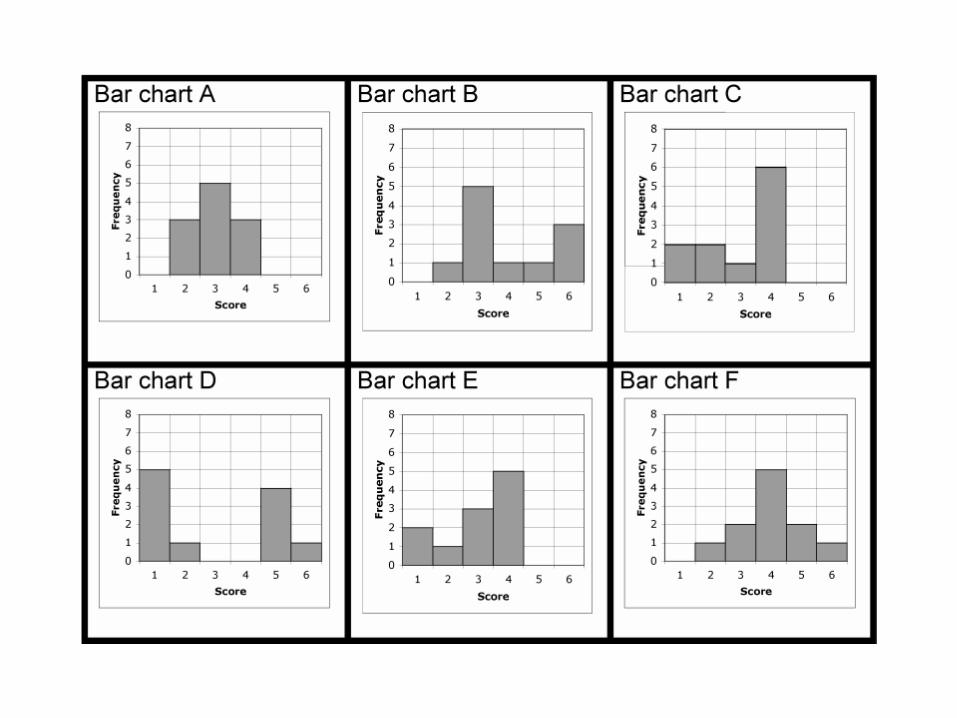
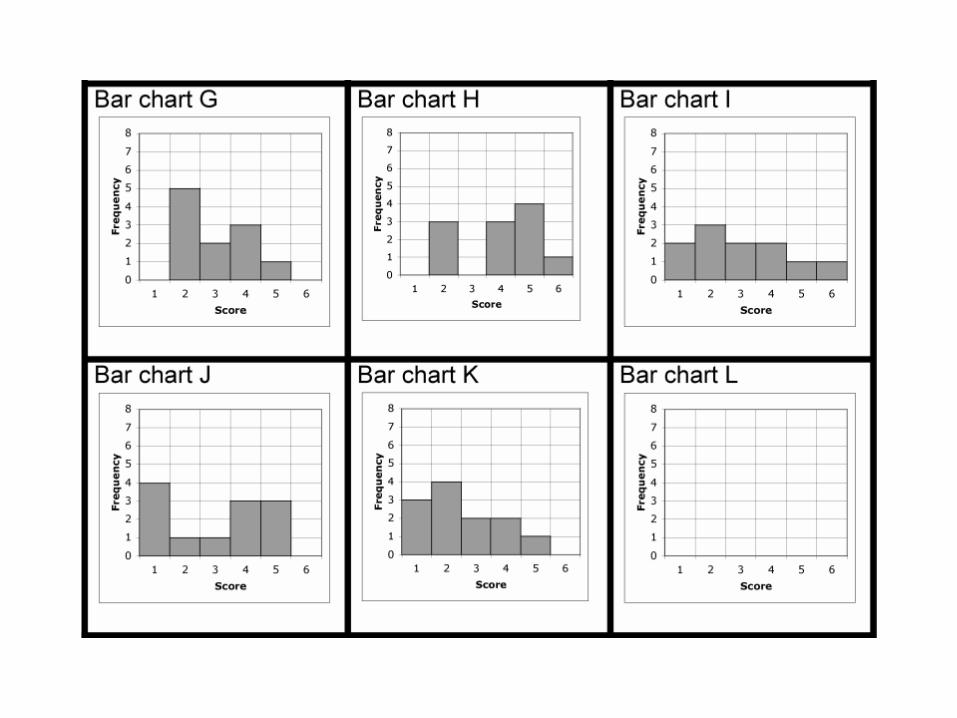
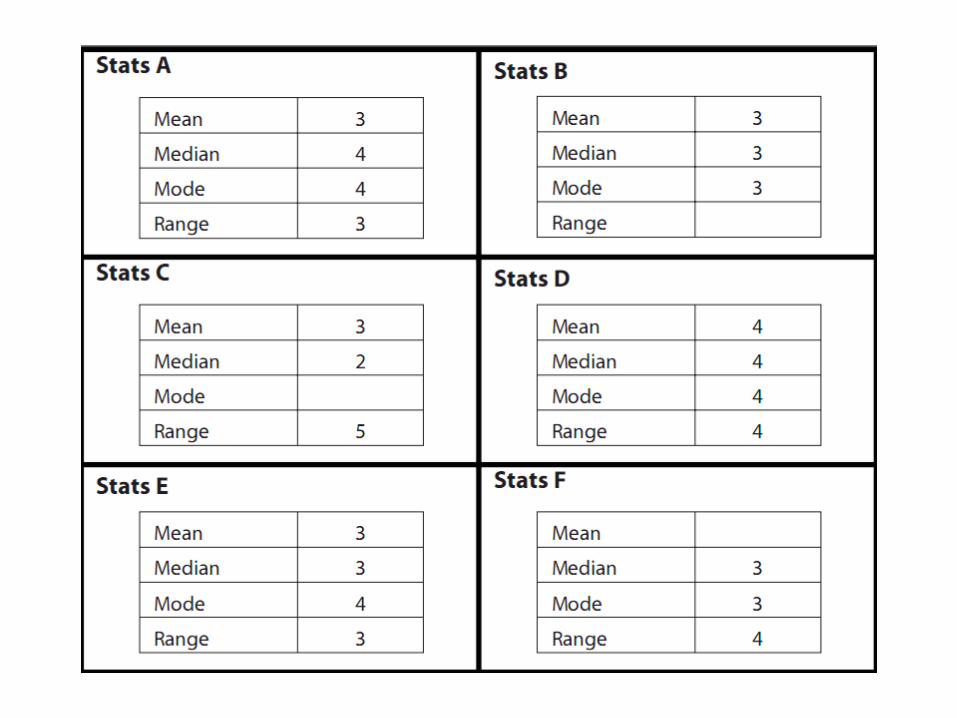
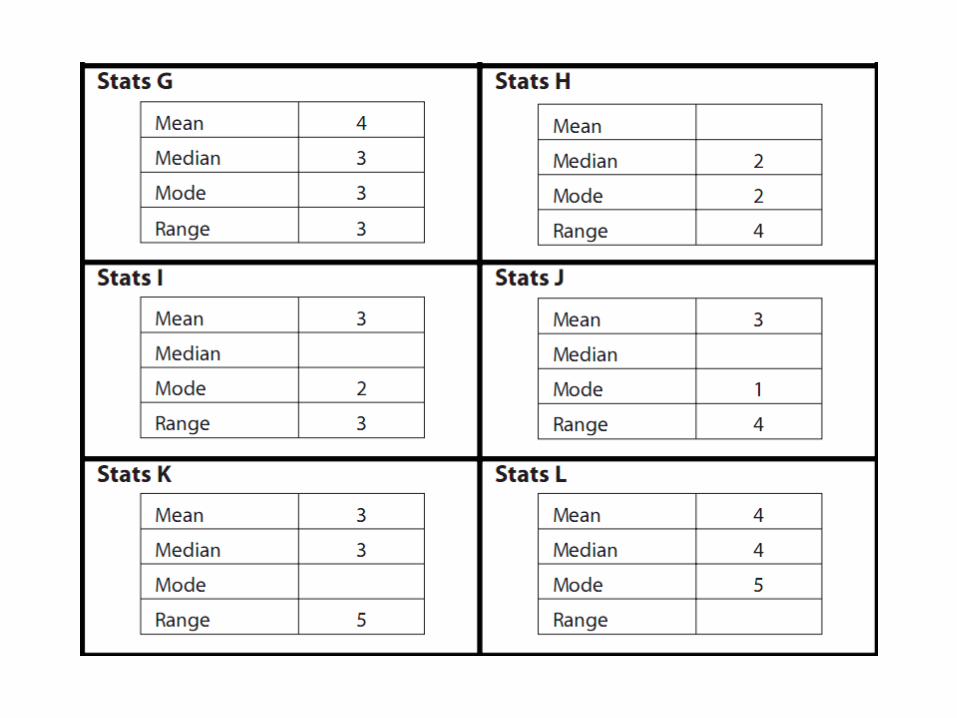

Mini - Plenary
What strategies did you use to match the cards?
How did you produce the missing graph to match the data?

These are the weekly wages, in pounds, paid to 11 workers.
275 160 842 275 420 359 315 275 740 280 195
James says the average wage is £280.
Jane says the average wage is £376.
Show how they can both be correct.
AO3 question (Foundation)
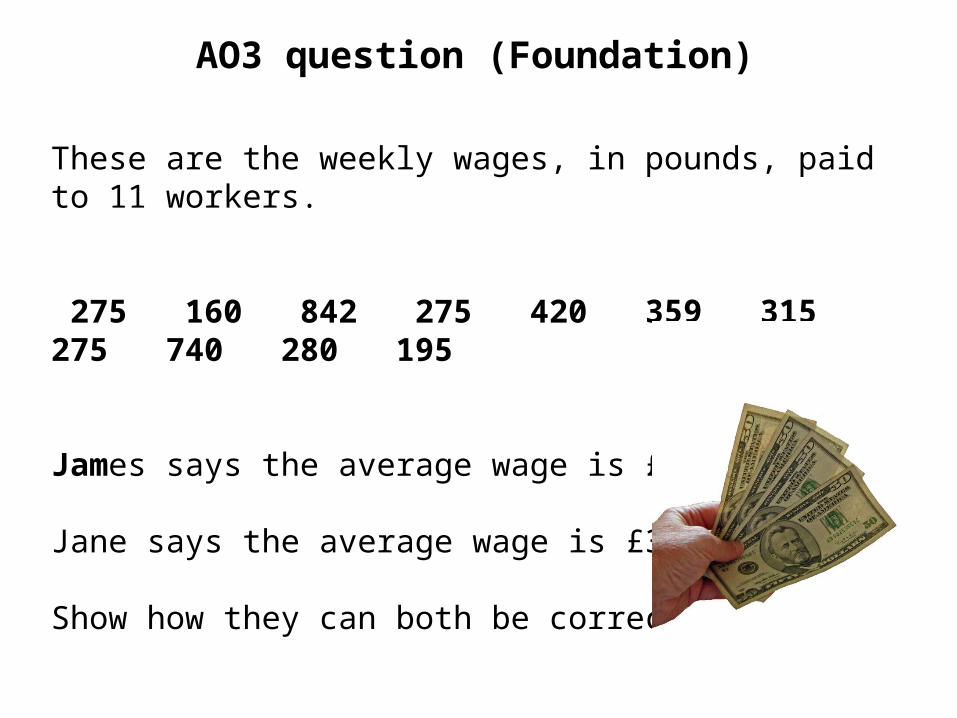
These are the weekly wages, in pounds, paid to 11 workers.
275 160 842 275 420 359 315 275 740 280 195
James says the average wage is £280.
Jane says the average wage is £376.
Show how they can both be correct.
AO3 question (Foundation)
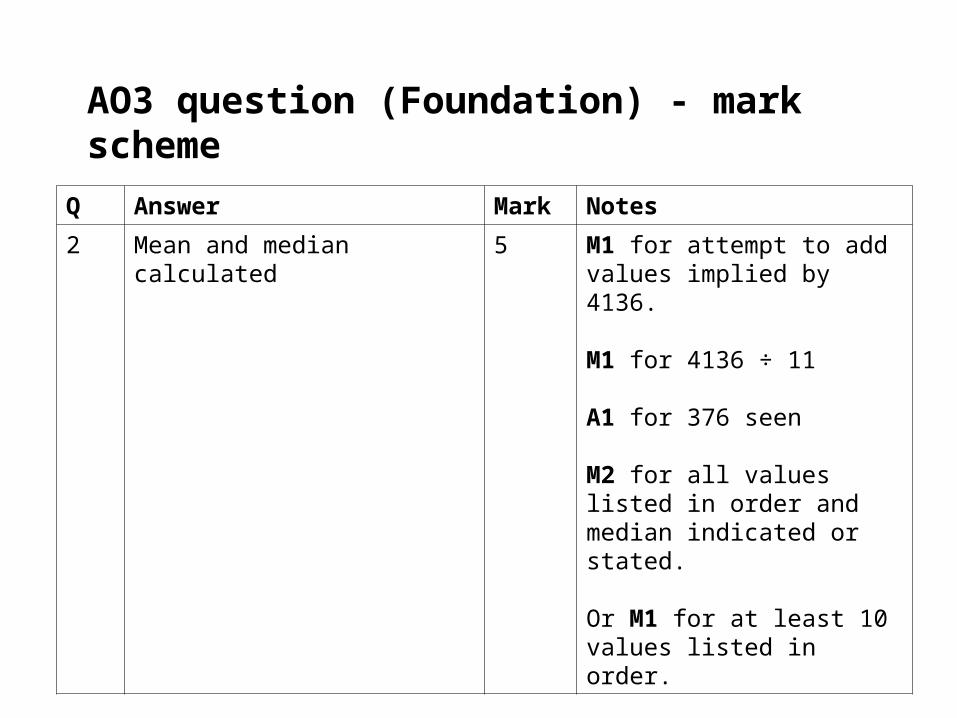
AO3 question (Foundation) - mark scheme
Q Answer Mark Notes
2 Mean and median calculated 5 M1 for attempt to add values implied by 4136.
M1 for 4136 ÷ 11
A1 for 376 seen
M2 for all values listed in order and median indicated or stated.
Or M1 for at least 10 values listed in order.