Fully integrated wearable sensor arrays for multiplexed in...
18
28 JANUARY 2016 | VOL 529 | NATURE | 509 LETTER doi:10.1038/nature16521 Fully integrated wearable sensor arrays for multiplexed in situ perspiration analysis Wei Gao 1,2,3 *, Sam Emaminejad 1,2,3,4 *, Hnin Yin Yin Nyein 1,2,3 , Samyuktha Challa 4 , Kevin Chen 1,2,3 , Austin Peck 5 , Hossain M. Fahad 1,2,3 , Hiroki Ota 1,2,3 , Hiroshi Shiraki 1,2,3 , Daisuke Kiriya 1,2,3 , Der-Hsien Lien 1,2,3 , George A. Brooks 5 , Ronald W. Davis 4 & Ali Javey 1,2,3 Wearable sensor technologies are essential to the realization of personalized medicine through continuously monitoring an individual’s state of health 1–12 . Sampling human sweat, which is rich in physiological information 13 , could enable non-invasive monitoring. Previously reported sweat-based and other non- invasive biosensors either can only monitor a single analyte at a time or lack on-site signal processing circuitry and sensor calibration mechanisms for accurate analysis of the physiological state 14–18 . Given the complexity of sweat secretion, simultaneous and multiplexed screening of target biomarkers is critical and requires full system integration to ensure the accuracy of measurements. Here we present a mechanically flexible and fully integrated (that is, no external analysis is needed) sensor array for multiplexed in situ perspiration analysis, which simultaneously and selectively measures sweat metabolites (such as glucose and lactate) and electrolytes (such as sodium and potassium ions), as well as the skin temperature (to calibrate the response of the sensors). Our work bridges the technological gap between signal transduction, conditioning (amplification and filtering), processing and wireless transmission in wearable biosensors by merging plastic- based sensors that interface with the skin with silicon integrated circuits consolidated on a flexible circuit board for complex signal processing. This application could not have been realized using either of these technologies alone owing to their respective inherent limitations. The wearable system is used to measure the detailed sweat profile of human subjects engaged in prolonged indoor and outdoor physical activities, and to make a real-time assessment of the physiological state of the subjects. This platform enables a wide range of personalized diagnostic and physiological monitoring applications. Wearable electronics are devices that can be worn or mated with human skin to continuously and closely monitor an individual’s activ- ities, without interrupting or limiting the user’s motions 1–9 . Thus wearable biosensors could enable real-time continuous monitoring of an individual’s physiological biomarkers 10–12 . At present, com- mercially available wearable sensors are only capable of tracking an individual’s physical activities and vital signs (such as heart rate), and fail to provide insight into the user’s health state at molecular levels. Measurements of human sweat could enable such insight, because it contains physiologically and metabolically rich information that can be retrieved non-invasively 13 . Sweat analysis is currently used for applications such as disease diagnosis, drug abuse detection, and ath- letic performance optimization 13 . For these applications, the sample collection and analysis are performed separately, failing to provide a real-time profile of sweat content secretion, while requiring extensive laboratory analysis using bulky instrumentation 19 . Recently, wearable sweat sensors have been developed, with which a variety of biosensors have been used to measure analytes of interest (Supplementary Table 1) 14–18 . Given the multivariate mechanisms that are involved in sweat secre- tion, an attractive strategy would be to devise a fully integrated mul- tiplexed sensing system to extract the complex information available from sweat. Here we present a wearable flexible integrated sensing array (FISA) for simultaneous and selective screening of a panel of biomark- ers in sweat (Fig. 1a). Our solution bridges the existing technological gap between signal transduction (electrical signal generation by sen- sors), conditioning (here, amplification and filtering), processing (here, calibration and compensation) and wireless transmission in wearable biosensors by merging commercially available integrated-circuit tech- nologies, consolidated on a flexible printed circuit board (FPCB), with flexible and conforming sensor technologies fabricated on plastic sub- strates. This approach decouples the stringent mechanical requirements at the sensor level and electrical requirements at the signal condition- ing, processing and transmission levels, and at the same time exploits the strengths of the underlying technologies. The independent and selective operation of individual sensors is preserved during multi- plexed measurements by employing highly specific surface chemistries and by electrically decoupling the operating points of each sensor’s interface. This platform is a powerful tool with which to advance large- scale and real-time physiological and clinical studies by facilitating the identification of informative biomarkers in sweat. As illustrated in Fig. 1a, the FISA allows simultaneous and selec- tive measurement of a panel of metabolites and electrolytes in human perspiration as well as skin temperature during prolonged indoor and outdoor physical activities. By fabricating the sensors on a mechanically flexible polyethylene terephthalate (PET) substrate, a stable sensor– skin contact is formed, while the FPCB technology is exploited to incorporate the critical signal conditioning, processing, and wireless transmission functionalities using readily available integrated-circuit components (Fig. 1b). The panel of target analytes and skin temperature was selected to facilitate an understanding of an individual’s physio- logical state (see Supplementary Information for selection of the tar- get analytes). For example, excessive loss of sodium and potassium in sweat could result in hyponatremia, hypokalemia, muscle cramps or dehydration 20 ; sweat glucose is reported to be metabolically related to blood glucose 21 ; sweat lactate can potentially serve as a sensitive marker of pressure ischaemia 22 ; and skin temperature is clinically informative of a variety of diseases and skin injuries such as pressure ulcers 23,24 . Additionally, skin temperature measurements are needed to compen- sate for and eliminate the influence of temperature variation in the readings of the chemical sensors through a built-in signal processor. Figure 1c illustrates the schematic of the multiplexed sensor array (each electrode is 3 mm in diameter) for sweat analysis; fabrication processes are detailed in Methods and Extended Data Fig. 1. Here, 1 Department of Electrical Engineering and Computer Sciences, University of California, Berkeley, California 94720, USA. 2 Berkeley Sensor and Actuator Center, University of California, Berkeley, California 94720, USA. 3 Materials Sciences Division, Lawrence Berkeley National Laboratory, Berkeley, California 94720, USA. 4 Stanford Genome Technology Center, Stanford School of Medicine, Palo Alto, California 94304, USA. 5 Integrative Biology, University of California, Berkeley, California 94720, USA. *These authors contributed equally to this work. © 2016 Macmillan Publishers Limited. All rights reserved
Transcript of Fully integrated wearable sensor arrays for multiplexed in...

2 8 J A N U A R Y 2 0 1 6 | V O L 5 2 9 | N A T U R E | 5 0 9
LETTERdoi:10.1038/nature16521
Fully integrated wearable sensor arrays for multiplexed in situ perspiration analysisWei Gao1,2,3*, Sam Emaminejad1,2,3,4*, Hnin Yin Yin Nyein1,2,3, Samyuktha Challa4, Kevin Chen1,2,3, Austin Peck5, Hossain M. Fahad1,2,3, Hiroki Ota1,2,3, Hiroshi Shiraki1,2,3, Daisuke Kiriya1,2,3, Der-Hsien Lien1,2,3, George A. Brooks5, Ronald W. Davis4 & Ali Javey1,2,3
Wearable sensor technologies are essential to the realization of personalized medicine through continuously monitoring an individual’s state of health1–12. Sampling human sweat, which is rich in physiological information13, could enable non-invasive monitoring. Previously reported sweat-based and other non-invasive biosensors either can only monitor a single analyte at a time or lack on-site signal processing circuitry and sensor calibration mechanisms for accurate analysis of the physiological state14–18. Given the complexity of sweat secretion, simultaneous and multiplexed screening of target biomarkers is critical and requires full system integration to ensure the accuracy of measurements. Here we present a mechanically flexible and fully integrated (that is, no external analysis is needed) sensor array for multiplexed in situ perspiration analysis, which simultaneously and selectively measures sweat metabolites (such as glucose and lactate) and electrolytes (such as sodium and potassium ions), as well as the skin temperature (to calibrate the response of the sensors). Our work bridges the technological gap between signal transduction, conditioning (amplification and filtering), processing and wireless transmission in wearable biosensors by merging plastic-based sensors that interface with the skin with silicon integrated circuits consolidated on a flexible circuit board for complex signal processing. This application could not have been realized using either of these technologies alone owing to their respective inherent limitations. The wearable system is used to measure the detailed sweat profile of human subjects engaged in prolonged indoor and outdoor physical activities, and to make a real-time assessment of the physiological state of the subjects. This platform enables a wide range of personalized diagnostic and physiological monitoring applications.
Wearable electronics are devices that can be worn or mated with human skin to continuously and closely monitor an individual’s activ-ities, without interrupting or limiting the user’s motions1–9. Thus wearable biosensors could enable real-time continuous monitoring of an individual’s physiological biomarkers10–12. At present, com-mercially available wearable sensors are only capable of tracking an individual’s physical activities and vital signs (such as heart rate), and fail to provide insight into the user’s health state at molecular levels. Measurements of human sweat could enable such insight, because it contains physiologically and metabolically rich information that can be retrieved non-invasively13. Sweat analysis is currently used for applications such as disease diagnosis, drug abuse detection, and ath-letic performance optimization13. For these applications, the sample collection and analysis are performed separately, failing to provide a real-time profile of sweat content secretion, while requiring extensive laboratory analysis using bulky instrumentation19. Recently, wearable sweat sensors have been developed, with which a variety of biosensors
have been used to measure analytes of interest (Supplementary Table 1)14–18.
Given the multivariate mechanisms that are involved in sweat secre-tion, an attractive strategy would be to devise a fully integrated mul-tiplexed sensing system to extract the complex information available from sweat. Here we present a wearable flexible integrated sensing array (FISA) for simultaneous and selective screening of a panel of biomark-ers in sweat (Fig. 1a). Our solution bridges the existing technological gap between signal transduction (electrical signal generation by sen-sors), conditioning (here, amplification and filtering), processing (here, calibration and compensation) and wireless transmission in wearable biosensors by merging commercially available integrated-circuit tech-nologies, consolidated on a flexible printed circuit board (FPCB), with flexible and conforming sensor technologies fabricated on plastic sub-strates. This approach decouples the stringent mechanical requirements at the sensor level and electrical requirements at the signal condition-ing, processing and transmission levels, and at the same time exploits the strengths of the underlying technologies. The independent and selective operation of individual sensors is preserved during multi-plexed measurements by employing highly specific surface chemistries and by electrically decoupling the operating points of each sensor’s interface. This platform is a powerful tool with which to advance large-scale and real-time physiological and clinical studies by facilitating the identification of informative biomarkers in sweat.
As illustrated in Fig. 1a, the FISA allows simultaneous and selec-tive measurement of a panel of metabolites and electrolytes in human perspiration as well as skin temperature during prolonged indoor and outdoor physical activities. By fabricating the sensors on a mechanically flexible polyethylene terephthalate (PET) substrate, a stable sensor– skin contact is formed, while the FPCB technology is exploited to incorporate the critical signal conditioning, processing, and wireless transmission functionalities using readily available integrated-circuit components (Fig. 1b). The panel of target analytes and skin temperature was selected to facilitate an understanding of an individual’s physio-logical state (see Supplementary Information for selection of the tar-get analytes). For example, excessive loss of sodium and potassium in sweat could result in hyponatremia, hypokalemia, muscle cramps or dehydration20; sweat glucose is reported to be metabolically related to blood glucose21; sweat lactate can potentially serve as a sensitive marker of pressure ischaemia22; and skin temperature is clinically informative of a variety of diseases and skin injuries such as pressure ulcers23,24. Additionally, skin temperature measurements are needed to compen-sate for and eliminate the influence of temperature variation in the readings of the chemical sensors through a built-in signal processor.
Figure 1c illustrates the schematic of the multiplexed sensor array (each electrode is 3 mm in diameter) for sweat analysis; fabrication processes are detailed in Methods and Extended Data Fig. 1. Here,
1Department of Electrical Engineering and Computer Sciences, University of California, Berkeley, California 94720, USA. 2Berkeley Sensor and Actuator Center, University of California, Berkeley, California 94720, USA. 3Materials Sciences Division, Lawrence Berkeley National Laboratory, Berkeley, California 94720, USA. 4Stanford Genome Technology Center, Stanford School of Medicine, Palo Alto, California 94304, USA. 5Integrative Biology, University of California, Berkeley, California 94720, USA.*These authors contributed equally to this work.
© 2016 Macmillan Publishers Limited. All rights reserved

5 1 0 | N A T U R E | V O L 5 2 9 | 2 8 J A N U A R Y 2 0 1 6
LETTERRESEARCH
amperometric glucose and lactate sensors (with current output) are based on glucose oxidase and lactate oxidase immobilized within a permeable film of the linear polysaccharide chitosan. A Ag/AgCl elec-trode serves as a shared reference electrode and counter electrode for both sensors. The use of Prussian blue dye as a mediator minimizes the reduction potentials to approximately 0 V (versus Ag/AgCl) (Extended Data Fig. 2a), and thus eliminates the need for an external power source to activate the sensors. These enzymatic sensors autonomously generate current signals proportional to the abundance of the corresponding metabolites between the working electrode and the Ag/AgCl electrode. The measurement of Na+ and K+ levels is facilitated through the use of ion-selective electrodes (ISEs), coupled with a polyvinyl butyral (PVB)-coated reference electrode to maintain a stable potential in solutions with different ionic strengths (Extended Data Fig. 2b–d). By using poly(3,4-ethylenedioxythiophene) polystyrene sulfonate (PEDOT:PSS) as an ion-to-electron transducer in the ISEs and carbon nanotubes in the PVB reference membrane25, robust potentiometric sensors (with voltage output) can be obtained for long-term continuous measure-ments with negligible voltage drift. A resistance-based temperature sen-sor is realized by fabricating Cr/Au metal microwires. Parylene is used as an insulating layer to ensure reliable sensor reading by preventing electrical contact of the metal lines with skin and sweat.
Figure 1d illustrates the system-level overview of the signal transduction, conditioning, processing, and wireless transmission paths to facilitate multiplexed on-body measurements. The signal- conditioning path for each sensor is implemented with analogue circuits and in relation to the corresponding transduced signal. The circuits are configured to ensure that the final analogue output of each
path is finely resolved while staying within the input voltage range of the analogue-to-digital converter. Furthermore, the microcontroller’s computational and serial communication capabilities are used to cal-ibrate, compensate, and relay the conditioned signals to an on-board wireless transceiver. The transceiver facilitates wireless data transmis-sion to a Bluetooth-enabled mobile handset with a custom-developed application (Extended Data Fig. 3), containing a user-friendly interface for sharing (through email, SMS, and so on) or uploading the data to cloud servers. The circuit design, calibration, and power delivery diagram of the FISA are described in Methods and Extended Data Figs 4 and 5.
The performance of each sensor was monitored separately with different analyte solutions. Figure 2a and b shows the representative current responses of the glucose and lactate sensors, measured chrono-amperometrically in 0–200-μM glucose solutions and 0–30-mM lactate solutions, respectively. A linear relationship between current and ana-lyte concentrations with sensitivities of 2.35 nA μM−1 for glucose sen-sors and 220 nA mM−1 for lactate sensors was observed. Figure 2c and d illustrates the open circuit potentials of Na+ and K+ sensors in the electrolyte solutions with physiologically relevant concentrations of 10–160-mM Na+ and 1–32-mM K+ respectively. Both ion-selective sensors show a near-Nerstian (according to the Nerstian equation, the theoretical sensitivity of the ISE-based sensors should be 59) behaviour with sensitivities of 64.2 mV and 61.3 mV per decade of concentration for Na+ and K+ sensors, respectively. Results of repeatability and long-term stability studies indicate that the sensitivities of the biosensors are consistent over a period of at least four weeks (Extended Data Fig. 6). Figure 2e displays the linear response of the resistive temperature
Figure 1 | Images and schematic illustrations of the FISA for multiplexed perspiration analysis. a, Photograph of a wearable FISA on a subject’s wrist, integrating the multiplexed sweat sensor array and the wireless FPCB. (All photographs in this paper were taken by the authors.) b, Photograph of a flattened FISA. The red dashed box indicates the location of the sensor array and the white dashed boxes indicate the locations of the integrated circuit components. c, Schematic of the sensor array (including glucose, lactate, sodium, potassium and temperature sensors) for multiplexed perspiration analysis. GOx and LOx, glucose
oxidase and lactate oxidase. d, System-level block diagram of the FISA showing the signal transduction (orange) (with potential V, current I and resistance R outputs), conditioning (green), processing (purple) and wireless transmission (blue) paths from sensors to the custom-developed mobile application (numbers in parentheses indicate the corresponding labelled components in b). ADC, analogue-to-digital converter. The inset images show the home page (left) and the real-time data display page (right) of the mobile application.
‘Smart wristband’
Wireless FPCB
Flexible sensor array
5 8 6 7
1 2
3 4 9
10 11
ADC (built-in)
Phone user interface
Differential amplier (6)
Voltage buffer (5)
Differential amplier (6)
Voltage buffer (8)
Low-pass lter (7)
Low-pass lter (9)
Microcontroller (10)
Cloud servers
Transimpedance amplier (1)
Transimpedance amplier (3)
Inverter (1) Inverter (3)
Low-pass lter (2)
Low-pass lter (4)
Voltage divider
Bluetooth transceiver (11)
Iglucose Ilactate Rtemperature Vsodium Vref VpotassiumAg/AgCl
Glucose
Ag/AgCl
GOx
Lactate Pyruvate
PVB
K+
Na+
Gluc
GOx
Sweat
LOx Ox
O
a
b
c
d
Tempera
ture
e–
e–
Gluconic acid
ISEs
© 2016 Macmillan Publishers Limited. All rights reserved

2 8 J A N U A R Y 2 0 1 6 | V O L 5 2 9 | N A T U R E | 5 1 1
LETTER RESEARCH
sensor in the physiological skin temperature range of 20–40 °C with a sensitivity of approximately 0.18% per degree Celsius (normalized to the resistance at 20 °C).
The selectivity of sweat sensors is crucial, because various electro-lytes and metabolites in sweat can influence the accuracy of the sensor readings. Extended Data Fig. 7a–d shows that the presence of non- target electrolytes and metabolites causes negligible interference to the response of each sensor. When all five sensors are integrated in the FISA, simultaneous system-level measurements maintain excellent selectivity upon varying concentrations of each analyte (Fig. 2f and Extended Data Fig. 7e–h). Although temperature has a minimal effect on the potentiometric sensors, it greatly influences the performance of the enzymatic sensors. Figure 2g shows that the responses of glu-cose and lactate sensors increase rapidly upon elevation of the solu-tion temperature from 22 °C to 40 °C, reflecting the effect of increased enzyme activities26. System integration allows for the implementation of real-time compensation to calibrate the sensor readings on the basis of temperature variations. Figure 2h illustrates that with the increase of temperature, the uncompensated sensor readouts can lead to sub-stantial overestimation of the actual concentration of the given glucose and lactate solutions; however, the temperature compensation allows for accurate and consistent readings.
It is essential for wearable devices to be able to withstand the stress of daily human wear and physical exercise. A study on mechanical deformation conducted by monitoring the performance of both the sensor array and the FPCB before, during and after bending (radii of curvature are 1.5 cm and 3 cm, respectively) (Extended Data Fig. 8) reveals minimal output changes in the FISA’s responses.
The FISAs can be comfortably worn on various body parts, includ-ing the forehead, wrists and arms. Figure 3a shows a human subject wearing two FISAs, packaged as a ‘smart wristband’ and a ‘smart headband’, allowing for real-time perspiration monitoring on the wrist and forehead simultaneously during stationary leg cycling. To ensure the fidelity of sensor readings, the data collection of each chan-nel took place when a sufficient sweat sample was present, as shown by stabilization of sensor readings within the physiologically relevant
range (see Methods). The accuracy of on-body measurements was verified through the comparison of on-body sensor readings from the forehead with ex situ (off-body) measurements from collected sweat samples (Fig. 3b).
Real-time physiological monitoring was performed on a subject during constant-load exercise on a cycle ergometer. The protocol involved a 3-min ramp-up, 20-min cycling at 150 W, and a 3-min cool-down. During the exercise, the heart rate, oxygen consumption (VO2), and pulmonary minute ventilation were measured using exter-nal monitoring instruments, and were found to increase proportion-ally with increasing power output as shown in Fig. 3c. Figure 3d illustrates the corresponding real-time measurements on the subject’s forehead using a FISA. The skin temperature remains constant at 34 °C up to perspiration initiation at about 320 s. The dip in temper-ature at this point indicates the beginning of perspiration and evap-orative cooling27. With continued perspiration, the skin temperature rises at about 400 s because of muscle heat conductance to skin and then remains stable, while the concentration of both lactate and glu-cose in sweat decrease gradually. The decreases in concentration of lactate and glucose in sweat are expected, owing to the dilution effect caused by an increase in sweat rate, which is visually observed as exercise continues13. However, lactate concentration becomes rela-tively stable after 1,100 s, indicating the stabilization of physiological responses to continuous, sub-maximal constant-exercise power out-put22. Sweat [Na+] increases and [K+] decreases in the beginning of perspiration, in line with the previous ex situ studies from the col-lected sweat samples28,29. Both [Na+] and [K+] stabilize as the cycling continues. By wearing a FISA on different parts of the body, the site-specific variations in electrolyte and metabolite levels29 can also be monitored and studied simultaneously. Sweat analyte levels on the wrist follow similar trends but with concentrations different from those obtained at the forehead (Extended Data Fig. 9). In this case, because the subject had a lower sweat rate at the wrist29, the sensors were activated at a later time.
The physiological response of the subjects to a sudden change in exer-cise intensity was also investigated, in a graded-load exercise which
Figure 2 | Experimental characterizations of the wearable sensors. a, b, The chronoamperometric responses of the glucose (a) and lactate (b) sensors to the respective analyte solutions in phosphate-buffered saline (PBS). c, d, The open circuit potential responses of the sodium (c) and potassium (d) sensors in NaCl and KCl solutions. e, The resistance response of the temperature sensor to temperature changes (20–40 °C) in
PBS. Insets in a–e show the corresponding calibration plots of the sensors. Data recording was paused for 30 s for each solution change in a–e. f, System-level interference studies of the sensor array. g, The influence of temperature on the responses of the glucose and lactate sensors. h, System-level real-time temperature T compensation for the glucose and lactate sensors in 100-μM glucose and 5-mM lactate solutions, respectively.
a c d b
e g h f
–600
–500
–400
–300
–200
–100
0
100
0 60 120 180 240 300
Cur
rent
(nA
)
Time (s)
–600 –400 –200
0
0 100 200 300 Cur
rent
(nA
)
[Glucose] (μM)
[Glucose]
100 μM
150 μM
200 μM
50 μM
0 μM
–6.0
–5.0
–4.0
–3.0
–2.0
–1.0
0 30 60 90 120 150
Cur
rent
(μA
) Time (s)
–6
–4
–2
0 10 20 30 Cur
rent
(μA
)
[Lactate] (mM)
[Lactate]
5 mM
10 mM
15 mM
20 mM
25 mM
1.90
1.92
1.94
1.96
1.98
2.00
2.02
0 60 120 180 240 300
Time (s)
1.90
1.95
2.00
2.05
20 30 40 50 Res
ista
nce
(kΩ
)
Res
ista
nce
(kΩ
)
Temperature
50
150
250
350
450
550
650
0 240 480 720 960 1,200
Out
put
of s
enso
rs (m
V)
Time (s)
Temperature
Lactate
5 mM
7.5 mM
10 mM
Na+ 20 mM 40 mM80 mM
K+ 4 mM 8 mM 16 mM
Glucose
40 μM60 μM
80 μM
1.5
1.9
2.3
2.7
20 24 28 32 36 40
Cur
rent
(μA
)
Temperature (°C)
Temperature (°C)
200
300
400
500
Cur
rent
(nA
) 100 μM glucose
5 mM lactate
50
100
150
200
[Glu
cose
] (μM
)
0
2.5
5
7.5
10
0 300 600 900 1,200
[Lac
tate
] (m
M)
Time (s)
No compensation
With T compensation
22 °C 27 °C 32 °C 37 °C
22 °C 27 °C 32 °C 37 °C
No compensation
With T compensation
0.24
0.26
0.28
0.30
0.32
0.34
0 15 30 45 60 75
Pot
entia
l (V
)
Time (s)
160 mM
80 mM
40 mM
20 mM
10 mM
[Na+]
210
260
310
360
1 1.5 2 2.5 Pot
entia
l(m
V)
210
260
310
360
Pot
entia
l(m
V)
0.21
0.26
0.31
0.36
Pot
entia
l (V
)
0.16
0.18
0.20
0.22
0.24
0.26
0.28
0 15 30 45 60 75 90
Pot
entia
l (V
)
Time (s)
32 mM
16 mM
8 mM
4 mM
2 mM
1 mM
150
200
250
300
0 0.5 1 1.5 2
Pot
entia
l(m
V)
log10[[K+] (mM)]
[K+]
150
200
250
300
Pot
entia
l(m
V)
0.15
0.2
0.25
0.3
Pot
entia
l(V
)
22 °C
20 °C
25 °C
30 °C
35 °C
40 °C
log10[[Na+] (mM)]
© 2016 Macmillan Publishers Limited. All rights reserved

5 1 2 | N A T U R E | V O L 5 2 9 | 2 8 J A N U A R Y 2 0 1 6
LETTERRESEARCH
involved a 5-min rest, 20-min cycling at 75 W followed by cycling at 200 W power output until volitional fatigue, and a 10-min recovery period (Fig. 3e and f). As demonstrated in Fig. 3e, the dramatic increase in the exercise power output from 75 W to 200 W immediately leads to abrupt elevations of heart rate, minute ventilation and VO2. Responses of the FISA during 75-W power output follow profiles similar to those observed during the constant-load study. After the power is raised, the sweat rate visibly increases, followed by a sharp increase in skin temper-ature and sweat [Na+] as well as a slight increase in [K+] (in three of the
seven subjects, [K+] remained stable). The relatively stable behaviour of [K+] is explained by its passive ion partitioning mechanism13. With the cessation of exercise, these physiological responses decrease and then remain stable. No apparent difference is observed for glucose concen-tration at different power output settings, a finding consistent with the response of blood glucose to graded, short-term exercise30. The change in lactate concentration, on the other hand, varies between subjects. This observation can be attributed to the increase in both lactate excretion rate and sweat rate upon the increase of the workload31.
Figure 3 | On-body real-time perspiration analysis during stationary cycling. a, Photographs of a subject wearing a ‘smart headband’ and a ‘smart wristband’ during stationary cycling. b, Comparison of ex situ calibration data of the sodium and glucose sensors from the collected sweat samples with the on-body readings of the FISA during the stationary cycling exercise detailed in f. c, d, Constant-load exercise at 150 W: power output, heart rate (in beats per minute, b.p.m.), oxygen consumption (VO2) and pulmonary minute ventilation, as measured by external monitoring
systems (c) and the real-time sweat analysis results of the FISA worn on a subject’s forehead (d). e, f, Graded-load exercise, involving a dramatic power increase from 75 W to 200 W: power output, heart rate, VO2 and pulmonary minute ventilation, as measured by external monitoring systems (e) and the real-time analysis results using the FISA worn on a different subject’s forehead (f). Data collection for each sensor took place when a sufficient sweat sample was present (see Methods).
d
c
a b
Ramp up Cycling at constant load Cool down Rest Cycling at graded load Cool down
Smart wristband Mobile phone
Smart headband
Ramp up Cycling at constant load Cool down
Battery
0 20 40 60
Min
ute
vent
ilatio
n(l
min
–1)
Time (s)
0 10 20 30
VO
2
(ml m
in–1
kg–1
) 60 90
120 150
Hea
rt r
ate
(b.p
.m.)
Min
ute
vent
ilatio
n(l
min
–1)
VO
2
(ml m
in–1
kg–1
) Hea
rt r
ate
(b.p
.m.)
0 50
100 150
200
Pow
er (W
)
0 400 800 1,200 1,600 0 1,200600 1,800 2,400
1,200 1,8001,500900 2,100 2,400
1,200 1,8001,500900 2,100 2,400
3,000
0 1,200600 1,800 2,400 3,000
d Perspiration starts
30
40
50
[Na+
] (m
M)
32 33 34 35 36
T (°
C)
2
4
6
8
[K+] (
mM
)
Time (s)
0
20
40
60
[Glu
cose
] (µ
M)
2 8
14 20
[Lac
tate
] (m
M)
0 400 800 1,200 1,600
e
Rest Cycling at graded load Cool down
0
100
200
300
Pow
er (W
)
60 100 140 180
0 15 30 45
0 30 60 90
Time (s)
f Perspiration starts
33 34 35 36 37
T (°
C)
2 5 8
11
[Lac
tate
] (m
M)
0 30 60 90
[Glu
cose
] (μ
M)
20
50
80
110
[Na+
] (m
M)
2 5 8
11 14
[K+] (
mM
)
Time (s)
0
30
60
90
120
[Glu
cose
] (μM
)
Time (s)
20
50
80
110
[Na+
] (m
M)
Time (s)
Ex situ On-body
Ex situ On-body
© 2016 Macmillan Publishers Limited. All rights reserved
2 8 J A N U A R Y 2 0 1 6 | V O L 5 2 9 | N A T U R E | 5 1 3
LETTER RESEARCH
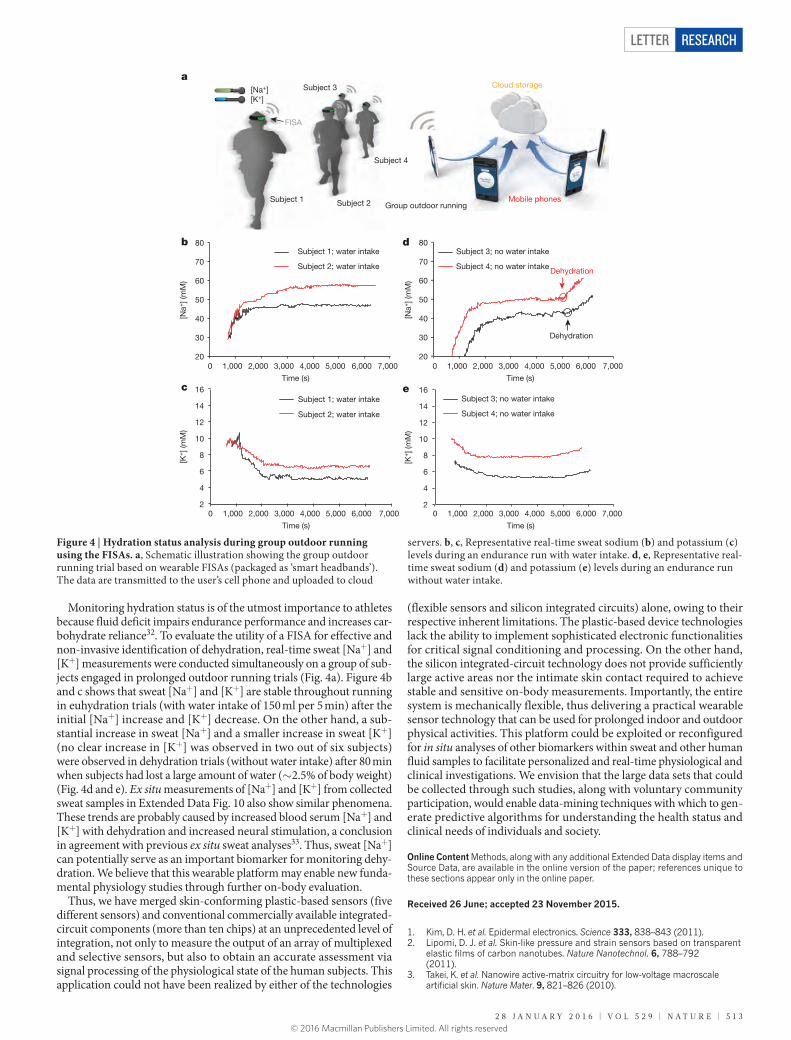
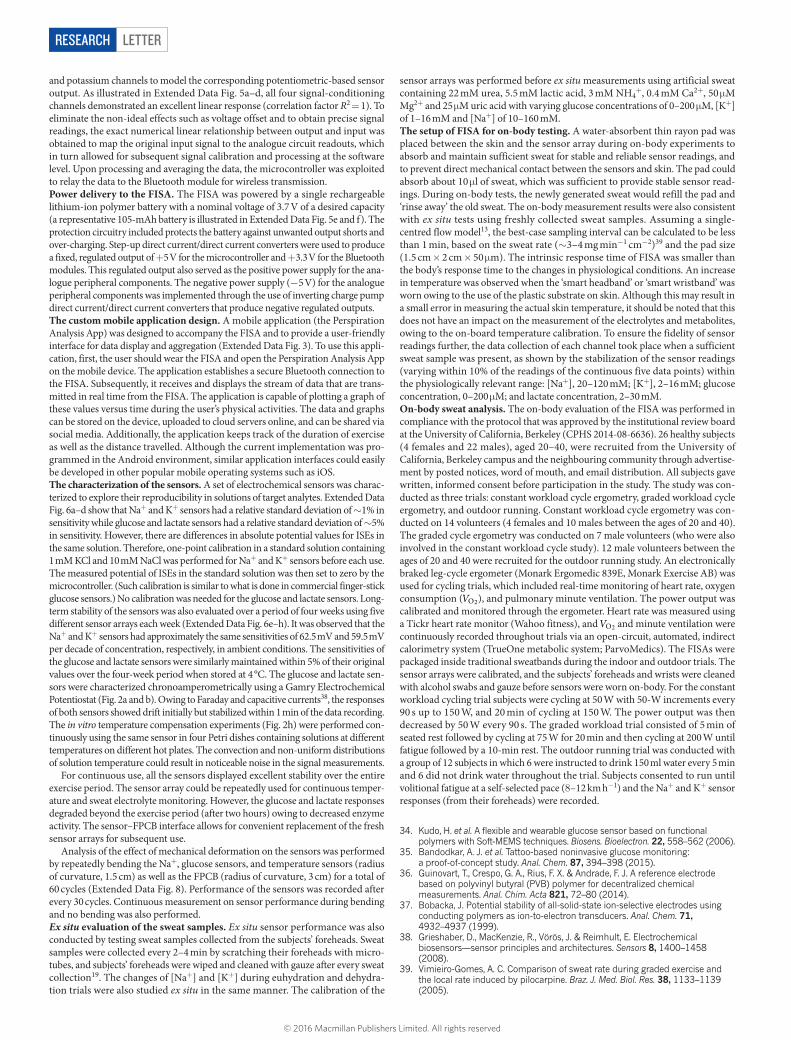
Monitoring hydration status is of the utmost importance to athletes because fluid deficit impairs endurance performance and increases car-bohydrate reliance32. To evaluate the utility of a FISA for effective and non-invasive identification of dehydration, real-time sweat [Na+] and [K+] measurements were conducted simultaneously on a group of sub-jects engaged in prolonged outdoor running trials (Fig. 4a). Figure 4b and c shows that sweat [Na+] and [K+] are stable throughout running in euhydration trials (with water intake of 150 ml per 5 min) after the initial [Na+] increase and [K+] decrease. On the other hand, a sub-stantial increase in sweat [Na+] and a smaller increase in sweat [K+] (no clear increase in [K+] was observed in two out of six subjects) were observed in dehydration trials (without water intake) after 80 min when subjects had lost a large amount of water (~2.5% of body weight) (Fig. 4d and e). Ex situ measurements of [Na+] and [K+] from collected sweat samples in Extended Data Fig. 10 also show similar phenomena. These trends are probably caused by increased blood serum [Na+] and [K+] with dehydration and increased neural stimulation, a conclusion in agreement with previous ex situ sweat analyses33. Thus, sweat [Na+] can potentially serve as an important biomarker for monitoring dehy-dration. We believe that this wearable platform may enable new funda-mental physiology studies through further on-body evaluation.
Thus, we have merged skin-conforming plastic-based sensors (five different sensors) and conventional commercially available integrated- circuit components (more than ten chips) at an unprecedented level of integration, not only to measure the output of an array of multiplexed and selective sensors, but also to obtain an accurate assessment via signal processing of the physiological state of the human subjects. This application could not have been realized by either of the technologies
(flexible sensors and silicon integrated circuits) alone, owing to their respective inherent limitations. The plastic-based device technologies lack the ability to implement sophisticated electronic functionalities for critical signal conditioning and processing. On the other hand, the silicon integrated-circuit technology does not provide sufficiently large active areas nor the intimate skin contact required to achieve stable and sensitive on-body measurements. Importantly, the entire system is mechanically flexible, thus delivering a practical wearable sensor technology that can be used for prolonged indoor and outdoor physical activities. This platform could be exploited or reconfigured for in situ analyses of other biomarkers within sweat and other human fluid samples to facilitate personalized and real-time physiological and clinical investigations. We envision that the large data sets that could be collected through such studies, along with voluntary community participation, would enable data-mining techniques with which to gen-erate predictive algorithms for understanding the health status and clinical needs of individuals and society.
Online Content Methods, along with any additional Extended Data display items and Source Data, are available in the online version of the paper; references unique to these sections appear only in the online paper.
Received 26 June; accepted 23 November 2015.
1. Kim, D. H. et al. Epidermal electronics. Science 333, 838–843 (2011).2. Lipomi, D. J. et al. Skin-like pressure and strain sensors based on transparent
elastic films of carbon nanotubes. Nature Nanotechnol. 6, 788–792 (2011).
3. Takei, K. et al. Nanowire active-matrix circuitry for low-voltage macroscale artificial skin. Nature Mater. 9, 821–826 (2010).
20
30
40
50
60
70
80
[Na+
] (m
M)
2
4
6
8
10
12
14
16
[K+] (
mM
)
20
30
40
50
60
70
80
0 1,000 2,000 3,000 4,000 5,000 6,000 7,000
[Na+
] (m
M)
Time (s)
0 1,000 2,000 3,000 4,000 5,000 6,000 7,000
Time (s)
0 1,000 2,000 3,000 4,000 5,000 6,000 7,000
Time (s)
0 1,000 2,000 3,000 4,000 5,000 6,000 7,000
Time (s)
2
4
6
8
10
12
14
16
[K+] (
mM
)Subject 3; no water intake
Subject 4; no water intake
Dehydration
Dehydration
Subject 1; water intake
Subject 2; water intake
Subject 3; no water intake
Subject 4; no water intake
Subject 1; water intake
Subject 2; water intake
FISA
Subject 1 Subject 2
Subject 3
Subject 4
[Na+][K+]
a
b
c
d
e
Group outdoor runningMobile phones
Cloud storage
Figure 4 | Hydration status analysis during group outdoor running using the FISAs. a, Schematic illustration showing the group outdoor running trial based on wearable FISAs (packaged as ‘smart headbands’). The data are transmitted to the user’s cell phone and uploaded to cloud
servers. b, c, Representative real-time sweat sodium (b) and potassium (c) levels during an endurance run with water intake. d, e, Representative real-time sweat sodium (d) and potassium (e) levels during an endurance run without water intake.
© 2016 Macmillan Publishers Limited. All rights reserved

5 1 4 | N A T U R E | V O L 5 2 9 | 2 8 J A N U A R Y 2 0 1 6
LETTERRESEARCH
4. Wu, W. et al. Piezoelectricity of single-atomic-layer MoS2 for energy conversion and piezotronics. Nature 514, 470–474 (2014).
5. McAlpine, M. C., Ahmad, H., Wang, D. & Heath, J. R. Highly ordered nanowire arrays on plastic substrates for ultrasensitive flexible chemical sensors. Nature Mater. 6, 379–384 (2007).
6. Kaltenbrunner, M. et al. An ultra-lightweight design for imperceptible plastic electronics. Nature 499, 458–463 (2013).
7. Xu, S. et al. Soft microfluidic assemblies of sensors, circuits, and radios for the skin. Science 344, 70–74 (2014).
8. Wang, C. et al. User-interactive electronic skin for instantaneous pressure visualization. Nature Mater. 12, 899–904 (2013).
9. Liang, J., Li, L., Niu, X., Yu, Z. & Pei, Q. Elastomeric polymer light-emitting devices and displays. Nature Photon. 7, 817–824 (2013).
10. Kim, D. H., Ghaffari, R. & Rogers, J. A. Flexible and stretchable electronics for biointegrated devices. Annu. Rev. Biomed. Eng. 14, 113–128 (2012).
11. Patel, S., Park, H., Bonato, P., Chan, L. & Rodgers, M. A review of wearable sensors and systems with application in rehabilitation. J. Neuroeng. Rehabil. 9, 21 (2012).
12. Bandodkar, A. J. & Wang, J. Non-invasive wearable electrochemical sensors: a review. Trends Biotechnol. 32, 363–371 (2014).
13. Sonner, Z. et al. The microfluidics of the eccrine sweat gland, including biomarker partitioning, transport, and biosensing implications. Biomicrofluidics 9, 031301 (2015).
14. Schazmann, B. et al. A wearable electrochemical sensor for the real-time measurement of sweat sodium concentration. Anal. Methods 2, 342–348 (2010).
15. Jia, W. et al. Electrochemical tattoo biosensors for real-time noninvasive lactate monitoring in human perspiration. Anal. Chem. 85, 6553–6560 (2013).
16. Coyle, S. et al. BIOTEX—biosensing textiles for personalised healthcare management. IEEE Trans. Inf. Technol. Biomed. 14, 364–370 (2010).
17. Bandodkar, A. J. et al. Epidermal tattoo potentiometric sodium sensors with wireless signal transduction for continuous non-invasive sweat monitoring. Biosens. Bioelectron. 54, 603–609 (2014).
18. Rose, D. P. et al. Adhesive RFID sensor patch for monitoring of sweat electrolytes. IEEE Trans. Biomed. Eng. 62, 1457–1465 (2015).
19. Boysen, T. C., Yanagawa, S., Sato, F. & Sato, K. A modified anaerobic method of sweat collection. J. Appl. Physiol. 56, 1302–1307 (1984).
20. Speedy, D. B., Noakes, T. D. & Schneider, C. Exercise-associated hyponatremia: a review. Emerg. Med. 13, 17–27 (2001).
21. Talary, M. S., Dewarrat, F., Huber, D. & Caduff, A. In vivo life sign application of dielectric spectroscopy and non-invasive glucose monitoring. J. Non-Cryst. Solids 353, 4515–4517 (2007).
22. Derbyshire, P. J., Barr, H., Davis, F. & Higson, S. P. Lactate in human sweat: a critical review of research to the present day. J. Physiol. Sci. 62, 429–440 (2012).
23. Webb, R. C. et al. Ultrathin conformal devices for precise and continuous thermal characterization of human skin. Nature Mater. 12, 938–944 (2013).
24. Sprigle, S., Linden, M., McKenna, D., Davis, K. & Riordan, B. Clinical skin temperature measurement to predict incipient pressure ulcers. Adv. Skin Wound Care 14, 133–137 (2001).
Supplementary Information is available in the online version of the paper.
Acknowledgements The sensor design, characterization and testing aspects of this work were supported by the Berkeley Sensor and Actuator Center, and National Institutes of Health grant number P01 HG000205. The sensor fabrication was performed in the Electronic Materials (E-MAT) laboratory funded by the Director, Office of Science, Office of Basic Energy Sciences, Material Sciences and Engineering Division of the US Department of Energy under contract number DE-AC02-05CH11231. K.C. acknowledges funding from the NSF Nanomanufacturing Systems for mobile Computing and Energy Technologies (NASCENT) Center. H.O. acknowledges support from a Japan Society for the Promotion of Science (JSPS) Fellowship. We thank J. Bullock, C. M. Sutter-Fella, H. W. W. Nyein, Z. Shahpar, M. Zhou, E. Wu and W. Chen for their help.
Author Contributions W.G., S.E. and A.J. conceived the idea and designed the experiments. W.G., S.E., H.Y.Y.N. and S.C. led the experiments (with assistance from K.C., A.P., H.M.F., H.O., H.S., H.O., D.K., D.-H.L.). W.G., S.E., A.P., G.A.B., R.W.D. and A.J. contributed to data analysis and interpretation. W.G., S.E., H.Y.Y.N., G.A.B. and A.J. wrote the paper and all authors provided feedback.
Author Information Reprints and permissions information is available at www.nature.com/reprints. The authors declare no competing financial interests. Readers are welcome to comment on the online version of the paper. Correspondence and requests for materials should be addressed to A.J. ([email protected]).
25. Zhu, J., Qin, Y. & Zhang, Y. Preparation of all solid-state potentiometric ion sensors with polymer-CNT composites. Electrochem. Commun. 11, 1684–1687 (2009).
26. Jobst, G. et al. Thin-film microbiosensors for glucose-lactate monitoring. Anal. Chem. 68, 3173–3179 (1996).
27. Nadel, E. R., Bullard, R. W. & Stolwijk, J. A. Importance of skin temperature in the regulation of sweating. J. Appl. Physiol. 31, 80–87 (1971).
28. Cage, G. W., Wolfe, S. M., Thompson, R. H. & Gordon, R. S. Jr. Effects of water intake on composition of thermal sweat in normal human volunteers. J. Appl. Physiol. 29, 687–690 (1970).
29. Patterson, M. J., Galloway, S. D. R. & Nimmo, M. A. Variations in regional sweat composition in normal human males. Exp. Physiol. 85, 869–875 (2000).
30. Messonnier, L. A. et al. Lactate kinetics at the lactate threshold in trained and untrained men. J. Appl. Physiol. 114, 1593–1602 (2013).
31. Buono, M. J., Lee, N. V. & Miller, P. W. The relationship between exercise intensity and the sweat lactate excretion rate. J. Physiol. Sci. 60, 103–107 (2010).
32. Barr, S. I. Effects of dehydration on exercise performance. Can. J. Appl. Physiol. 24, 164–172 (1999).
33. Morgan, R. M., Patterson, M. J. & Nimmo, M. A. Acute effects of dehydration on sweat composition in men during prolonged exercise in the heat. Acta Physiol. Scand. 182, 37–43 (2004).
© 2016 Macmillan Publishers Limited. All rights reserved
LETTER RESEARCH
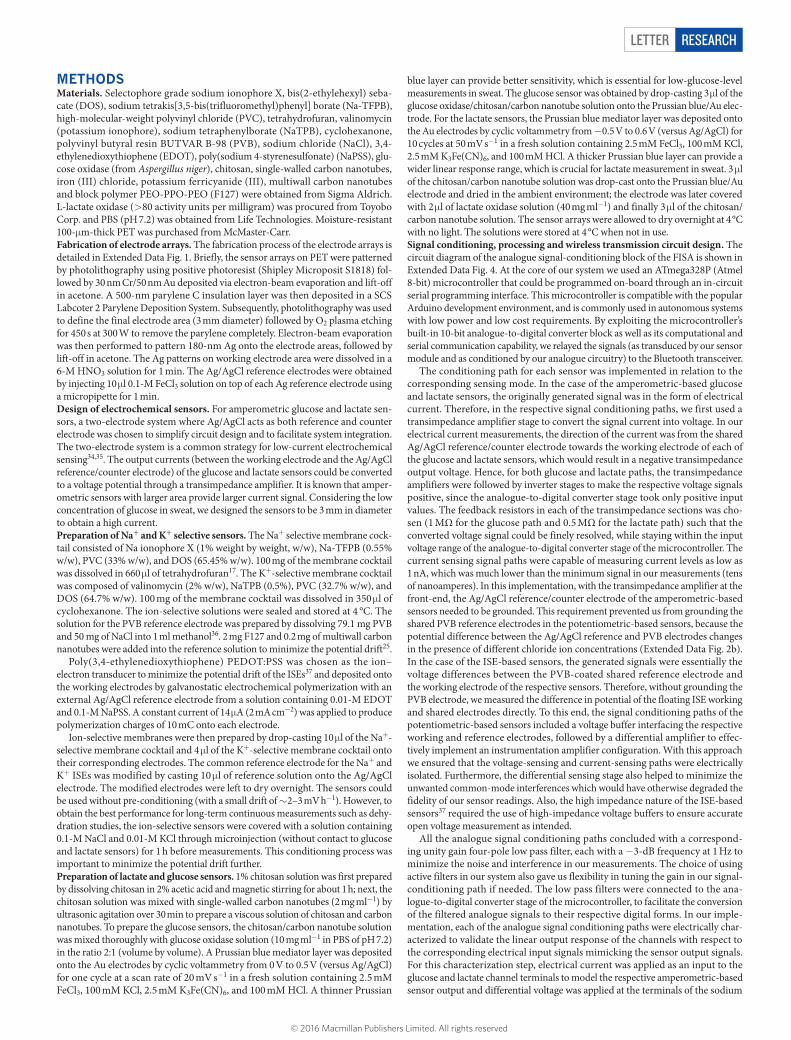
METHODSMaterials. Selectophore grade sodium ionophore X, bis(2-ethylehexyl) seba-cate (DOS), sodium tetrakis[3,5-bis(trifluoromethyl)phenyl] borate (Na-TFPB), high-molecular-weight polyvinyl chloride (PVC), tetrahydrofuran, valinomycin (potassium ionophore), sodium tetraphenylborate (NaTPB), cyclohexanone, polyvinyl butyral resin BUTVAR B-98 (PVB), sodium chloride (NaCl), 3,4- ethylenedioxythiophene (EDOT), poly(sodium 4-styrenesulfonate) (NaPSS), glu-cose oxidase (from Aspergillus niger), chitosan, single-walled carbon nanotubes, iron (III) chloride, potassium ferricyanide (III), multiwall carbon nanotubes and block polymer PEO-PPO-PEO (F127) were obtained from Sigma Aldrich. L-lactate oxidase (>80 activity units per milligram) was procured from Toyobo Corp. and PBS (pH 7.2) was obtained from Life Technologies. Moisture-resistant 100-μm-thick PET was purchased from McMaster-Carr.Fabrication of electrode arrays. The fabrication process of the electrode arrays is detailed in Extended Data Fig. 1. Briefly, the sensor arrays on PET were patterned by photolithography using positive photoresist (Shipley Microposit S1818) fol-lowed by 30 nm Cr/50 nm Au deposited via electron-beam evaporation and lift-off in acetone. A 500-nm parylene C insulation layer was then deposited in a SCS Labcoter 2 Parylene Deposition System. Subsequently, photolithography was used to define the final electrode area (3 mm diameter) followed by O2 plasma etching for 450 s at 300 W to remove the parylene completely. Electron-beam evaporation was then performed to pattern 180-nm Ag onto the electrode areas, followed by lift-off in acetone. The Ag patterns on working electrode area were dissolved in a 6-M HNO3 solution for 1 min. The Ag/AgCl reference electrodes were obtained by injecting 10 μl 0.1-M FeCl3 solution on top of each Ag reference electrode using a micropipette for 1 min.Design of electrochemical sensors. For amperometric glucose and lactate sen-sors, a two-electrode system where Ag/AgCl acts as both reference and counter electrode was chosen to simplify circuit design and to facilitate system integration. The two-electrode system is a common strategy for low-current electrochemical sensing34,35. The output currents (between the working electrode and the Ag/AgCl reference/counter electrode) of the glucose and lactate sensors could be converted to a voltage potential through a transimpedance amplifier. It is known that amper-ometric sensors with larger area provide larger current signal. Considering the low concentration of glucose in sweat, we designed the sensors to be 3 mm in diameter to obtain a high current.Preparation of Na+ and K+ selective sensors. The Na+ selective membrane cock-tail consisted of Na ionophore X (1% weight by weight, w/w), Na-TFPB (0.55% w/w), PVC (33% w/w), and DOS (65.45% w/w). 100 mg of the membrane cocktail was dissolved in 660 μl of tetrahydrofuran17. The K+-selective membrane cocktail was composed of valinomycin (2% w/w), NaTPB (0.5%), PVC (32.7% w/w), and DOS (64.7% w/w). 100 mg of the membrane cocktail was dissolved in 350 μl of cyclohexanone. The ion-selective solutions were sealed and stored at 4 °C. The solution for the PVB reference electrode was prepared by dissolving 79.1 mg PVB and 50 mg of NaCl into 1 ml methanol36. 2 mg F127 and 0.2 mg of multiwall carbon nanotubes were added into the reference solution to minimize the potential drift25.
Poly(3,4-ethylenedioxythiophene) PEDOT:PSS was chosen as the ion– electron transducer to minimize the potential drift of the ISEs37 and deposited onto the working electrodes by galvanostatic electrochemical polymerization with an external Ag/AgCl reference electrode from a solution containing 0.01-M EDOT and 0.1-M NaPSS. A constant current of 14 μA (2 mA cm−2) was applied to produce polymerization charges of 10 mC onto each electrode.
Ion-selective membranes were then prepared by drop-casting 10 μl of the Na+-selective membrane cocktail and 4 μl of the K+-selective membrane cocktail onto their corresponding electrodes. The common reference electrode for the Na+ and K+ ISEs was modified by casting 10 μl of reference solution onto the Ag/AgCl electrode. The modified electrodes were left to dry overnight. The sensors could be used without pre-conditioning (with a small drift of ~2–3 mV h−1). However, to obtain the best performance for long-term continuous measurements such as dehy-dration studies, the ion-selective sensors were covered with a solution containing 0.1-M NaCl and 0.01-M KCl through microinjection (without contact to glucose and lactate sensors) for 1 h before measurements. This conditioning process was important to minimize the potential drift further.Preparation of lactate and glucose sensors. 1% chitosan solution was first prepared by dissolving chitosan in 2% acetic acid and magnetic stirring for about 1 h; next, the chitosan solution was mixed with single-walled carbon nanotubes (2 mg ml−1) by ultrasonic agitation over 30 min to prepare a viscous solution of chitosan and carbon nanotubes. To prepare the glucose sensors, the chitosan/carbon nanotube solution was mixed thoroughly with glucose oxidase solution (10 mg ml−1 in PBS of pH 7.2) in the ratio 2:1 (volume by volume). A Prussian blue mediator layer was deposited onto the Au electrodes by cyclic voltammetry from 0 V to 0.5 V (versus Ag/AgCl) for one cycle at a scan rate of 20 mV s−1 in a fresh solution containing 2.5 mM FeCl3, 100 mM KCl, 2.5 mM K3Fe(CN)6, and 100 mM HCl. A thinner Prussian
blue layer can provide better sensitivity, which is essential for low-glucose-level measurements in sweat. The glucose sensor was obtained by drop-casting 3 μl of the glucose oxidase/chitosan/carbon nanotube solution onto the Prussian blue/Au elec-trode. For the lactate sensors, the Prussian blue mediator layer was deposited onto the Au electrodes by cyclic voltammetry from −0.5 V to 0.6 V (versus Ag/AgCl) for 10 cycles at 50 mV s−1 in a fresh solution containing 2.5 mM FeCl3, 100 mM KCl, 2.5 mM K3Fe(CN)6, and 100 mM HCl. A thicker Prussian blue layer can provide a wider linear response range, which is crucial for lactate measurement in sweat. 3 μl of the chitosan/carbon nanotube solution was drop-cast onto the Prussian blue/Au electrode and dried in the ambient environment; the electrode was later covered with 2 μl of lactate oxidase solution (40 mg ml−1) and finally 3 μl of the chitosan/carbon nanotube solution. The sensor arrays were allowed to dry overnight at 4 °C with no light. The solutions were stored at 4 °C when not in use.Signal conditioning, processing and wireless transmission circuit design. The circuit diagram of the analogue signal-conditioning block of the FISA is shown in Extended Data Fig. 4. At the core of our system we used an ATmega328P (Atmel 8-bit) microcontroller that could be programmed on-board through an in-circuit serial programming interface. This microcontroller is compatible with the popular Arduino development environment, and is commonly used in autonomous systems with low power and low cost requirements. By exploiting the microcontroller’s built-in 10-bit analogue-to-digital converter block as well as its computational and serial communication capability, we relayed the signals (as transduced by our sensor module and as conditioned by our analogue circuitry) to the Bluetooth transceiver.
The conditioning path for each sensor was implemented in relation to the corresponding sensing mode. In the case of the amperometric-based glucose and lactate sensors, the originally generated signal was in the form of electrical current. Therefore, in the respective signal conditioning paths, we first used a transimpedance amplifier stage to convert the signal current into voltage. In our electrical current measurements, the direction of the current was from the shared Ag/AgCl reference/counter electrode towards the working electrode of each of the glucose and lactate sensors, which would result in a negative transimpedance output voltage. Hence, for both glucose and lactate paths, the transimpedance amplifiers were followed by inverter stages to make the respective voltage signals positive, since the analogue-to-digital converter stage took only positive input values. The feedback resistors in each of the transimpedance sections was cho-sen (1 MΩ for the glucose path and 0.5 MΩ for the lactate path) such that the converted voltage signal could be finely resolved, while staying within the input voltage range of the analogue-to-digital converter stage of the microcontroller. The current sensing signal paths were capable of measuring current levels as low as 1 nA, which was much lower than the minimum signal in our measurements (tens of nanoamperes). In this implementation, with the transimpedance amplifier at the front-end, the Ag/AgCl reference/counter electrode of the amperometric-based sensors needed to be grounded. This requirement prevented us from grounding the shared PVB reference electrodes in the potentiometric-based sensors, because the potential difference between the Ag/AgCl reference and PVB electrodes changes in the presence of different chloride ion concentrations (Extended Data Fig. 2b). In the case of the ISE-based sensors, the generated signals were essentially the voltage differences between the PVB-coated shared reference electrode and the working electrode of the respective sensors. Therefore, without grounding the PVB electrode, we measured the difference in potential of the floating ISE working and shared electrodes directly. To this end, the signal conditioning paths of the potentiometric-based sensors included a voltage buffer interfacing the respective working and reference electrodes, followed by a differential amplifier to effec-tively implement an instrumentation amplifier configuration. With this approach we ensured that the voltage-sensing and current-sensing paths were electrically isolated. Furthermore, the differential sensing stage also helped to minimize the unwanted common-mode interferences which would have otherwise degraded the fidelity of our sensor readings. Also, the high impedance nature of the ISE-based sensors37 required the use of high-impedance voltage buffers to ensure accurate open voltage measurement as intended.
All the analogue signal conditioning paths concluded with a correspond-ing unity gain four-pole low pass filter, each with a −3-dB frequency at 1 Hz to minimize the noise and interference in our measurements. The choice of using active filters in our system also gave us flexibility in tuning the gain in our signal- conditioning path if needed. The low pass filters were connected to the ana-logue-to-digital converter stage of the microcontroller, to facilitate the conversion of the filtered analogue signals to their respective digital forms. In our imple-mentation, each of the analogue signal conditioning paths were electrically char-acterized to validate the linear output response of the channels with respect to the corresponding electrical input signals mimicking the sensor output signals. For this characterization step, electrical current was applied as an input to the glucose and lactate channel terminals to model the respective amperometric-based sensor output and differential voltage was applied at the terminals of the sodium
© 2016 Macmillan Publishers Limited. All rights reserved
LETTERRESEARCH
and potassium channels to model the corresponding potentiometric-based sensor output. As illustrated in Extended Data Fig. 5a–d, all four signal-conditioning channels demonstrated an excellent linear response (correlation factor R2 = 1). To eliminate the non-ideal effects such as voltage offset and to obtain precise signal readings, the exact numerical linear relationship between output and input was obtained to map the original input signal to the analogue circuit readouts, which in turn allowed for subsequent signal calibration and processing at the software level. Upon processing and averaging the data, the microcontroller was exploited to relay the data to the Bluetooth module for wireless transmission.Power delivery to the FISA. The FISA was powered by a single rechargeable lithium-ion polymer battery with a nominal voltage of 3.7 V of a desired capacity (a representative 105-mAh battery is illustrated in Extended Data Fig. 5e and f). The protection circuitry included protects the battery against unwanted output shorts and over-charging. Step-up direct current/direct current converters were used to produce a fixed, regulated output of +5 V for the microcontroller and +3.3 V for the Bluetooth modules. This regulated output also served as the positive power supply for the ana-logue peripheral components. The negative power supply (−5 V) for the analogue peripheral components was implemented through the use of inverting charge pump direct current/direct current converters that produce negative regulated outputs.The custom mobile application design. A mobile application (the Perspiration Analysis App) was designed to accompany the FISA and to provide a user-friendly interface for data display and aggregation (Extended Data Fig. 3). To use this appli-cation, first, the user should wear the FISA and open the Perspiration Analysis App on the mobile device. The application establishes a secure Bluetooth connection to the FISA. Subsequently, it receives and displays the stream of data that are trans-mitted in real time from the FISA. The application is capable of plotting a graph of these values versus time during the user’s physical activities. The data and graphs can be stored on the device, uploaded to cloud servers online, and can be shared via social media. Additionally, the application keeps track of the duration of exercise as well as the distance travelled. Although the current implementation was pro-grammed in the Android environment, similar application interfaces could easily be developed in other popular mobile operating systems such as iOS.The characterization of the sensors. A set of electrochemical sensors was charac-terized to explore their reproducibility in solutions of target analytes. Extended Data Fig. 6a–d show that Na+ and K+ sensors had a relative standard deviation of ~1% in sensitivity while glucose and lactate sensors had a relative standard deviation of ~5% in sensitivity. However, there are differences in absolute potential values for ISEs in the same solution. Therefore, one-point calibration in a standard solution containing 1 mM KCl and 10 mM NaCl was performed for Na+ and K+ sensors before each use. The measured potential of ISEs in the standard solution was then set to zero by the microcontroller. (Such calibration is similar to what is done in commercial finger-stick glucose sensors.) No calibration was needed for the glucose and lactate sensors. Long-term stability of the sensors was also evaluated over a period of four weeks using five different sensor arrays each week (Extended Data Fig. 6e–h). It was observed that the Na+ and K+ sensors had approximately the same sensitivities of 62.5 mV and 59.5 mV per decade of concentration, respectively, in ambient conditions. The sensitivities of the glucose and lactate sensors were similarly maintained within 5% of their original values over the four-week period when stored at 4 °C. The glucose and lactate sen-sors were characterized chronoamperometrically using a Gamry Electrochemical Potentiostat (Fig. 2a and b). Owing to Faraday and capacitive currents38, the responses of both sensors showed drift initially but stabilized within 1 min of the data recording. The in vitro temperature compensation experiments (Fig. 2h) were performed con-tinuously using the same sensor in four Petri dishes containing solutions at different temperatures on different hot plates. The convection and non-uniform distributions of solution temperature could result in noticeable noise in the signal measurements.
For continuous use, all the sensors displayed excellent stability over the entire exercise period. The sensor array could be repeatedly used for continuous temper-ature and sweat electrolyte monitoring. However, the glucose and lactate responses degraded beyond the exercise period (after two hours) owing to decreased enzyme activity. The sensor–FPCB interface allows for convenient replacement of the fresh sensor arrays for subsequent use.
Analysis of the effect of mechanical deformation on the sensors was performed by repeatedly bending the Na+, glucose sensors, and temperature sensors (radius of curvature, 1.5 cm) as well as the FPCB (radius of curvature, 3 cm) for a total of 60 cycles (Extended Data Fig. 8). Performance of the sensors was recorded after every 30 cycles. Continuous measurement on sensor performance during bending and no bending was also performed.Ex situ evaluation of the sweat samples. Ex situ sensor performance was also conducted by testing sweat samples collected from the subjects’ foreheads. Sweat samples were collected every 2–4 min by scratching their foreheads with micro-tubes, and subjects’ foreheads were wiped and cleaned with gauze after every sweat collection19. The changes of [Na+] and [K+] during euhydration and dehydra-tion trials were also studied ex situ in the same manner. The calibration of the
sensor arrays was performed before ex situ measurements using artificial sweat containing 22 mM urea, 5.5 mM lactic acid, 3 mM NH4
+, 0.4 mM Ca2+, 50 μM Mg2+ and 25 μM uric acid with varying glucose concentrations of 0–200 μM, [K+] of 1–16 mM and [Na+] of 10–160 mM.The setup of FISA for on-body testing. A water-absorbent thin rayon pad was placed between the skin and the sensor array during on-body experiments to absorb and maintain sufficient sweat for stable and reliable sensor readings, and to prevent direct mechanical contact between the sensors and skin. The pad could absorb about 10 μl of sweat, which was sufficient to provide stable sensor read-ings. During on-body tests, the newly generated sweat would refill the pad and ‘rinse away’ the old sweat. The on-body measurement results were also consistent with ex situ tests using freshly collected sweat samples. Assuming a single- centred flow model13, the best-case sampling interval can be calculated to be less than 1 min, based on the sweat rate (~3–4 mg min−1 cm−2)39 and the pad size (1.5 cm × 2 cm × 50 μm). The intrinsic response time of FISA was smaller than the body’s response time to the changes in physiological conditions. An increase in temperature was observed when the ‘smart headband’ or ‘smart wristband’ was worn owing to the use of the plastic substrate on skin. Although this may result in a small error in measuring the actual skin temperature, it should be noted that this does not have an impact on the measurement of the electrolytes and metabolites, owing to the on-board temperature calibration. To ensure the fidelity of sensor readings further, the data collection of each channel took place when a sufficient sweat sample was present, as shown by the stabilization of the sensor readings (varying within 10% of the readings of the continuous five data points) within the physiologically relevant range: [Na+], 20–120 mM; [K+], 2–16 mM; glucose concentration, 0–200 μM; and lactate concentration, 2–30 mM.On-body sweat analysis. The on-body evaluation of the FISA was performed in compliance with the protocol that was approved by the institutional review board at the University of California, Berkeley (CPHS 2014-08-6636). 26 healthy subjects (4 females and 22 males), aged 20–40, were recruited from the University of California, Berkeley campus and the neighbouring community through advertise-ment by posted notices, word of mouth, and email distribution. All subjects gave written, informed consent before participation in the study. The study was con-ducted as three trials: constant workload cycle ergometry, graded workload cycle ergometry, and outdoor running. Constant workload cycle ergometry was con-ducted on 14 volunteers (4 females and 10 males between the ages of 20 and 40). The graded cycle ergometry was conducted on 7 male volunteers (who were also involved in the constant workload cycle study). 12 male volunteers between the ages of 20 and 40 were recruited for the outdoor running study. An electronically braked leg-cycle ergometer (Monark Ergomedic 839E, Monark Exercise AB) was used for cycling trials, which included real-time monitoring of heart rate, oxygen consumption (VO2), and pulmonary minute ventilation. The power output was calibrated and monitored through the ergometer. Heart rate was measured using a Tickr heart rate monitor (Wahoo fitness), and VO2 and minute ventilation were continuously recorded throughout trials via an open-circuit, automated, indirect calorimetry system (TrueOne metabolic system; ParvoMedics). The FISAs were packaged inside traditional sweatbands during the indoor and outdoor trials. The sensor arrays were calibrated, and the subjects’ foreheads and wrists were cleaned with alcohol swabs and gauze before sensors were worn on-body. For the constant workload cycling trial subjects were cycling at 50 W with 50-W increments every 90 s up to 150 W, and 20 min of cycling at 150 W. The power output was then decreased by 50 W every 90 s. The graded workload trial consisted of 5 min of seated rest followed by cycling at 75 W for 20 min and then cycling at 200 W until fatigue followed by a 10-min rest. The outdoor running trial was conducted with a group of 12 subjects in which 6 were instructed to drink 150 ml water every 5 min and 6 did not drink water throughout the trial. Subjects consented to run until volitional fatigue at a self-selected pace (8–12 km h−1) and the Na+ and K+ sensor responses (from their foreheads) were recorded.
34. Kudo, H. et al. A flexible and wearable glucose sensor based on functional polymers with Soft-MEMS techniques. Biosens. Bioelectron. 22, 558–562 (2006).
35. Bandodkar, A. J. et al. Tattoo-based noninvasive glucose monitoring: a proof-of-concept study. Anal. Chem. 87, 394–398 (2015).
36. Guinovart, T., Crespo, G. A., Rius, F. X. & Andrade, F. J. A reference electrode based on polyvinyl butyral (PVB) polymer for decentralized chemical measurements. Anal. Chim. Acta 821, 72–80 (2014).
37. Bobacka, J. Potential stability of all-solid-state ion-selective electrodes using conducting polymers as ion-to-electron transducers. Anal. Chem. 71, 4932–4937 (1999).
38. Grieshaber, D., MacKenzie, R., Vörös, J. & Reimhult, E. Electrochemical biosensors—sensor principles and architectures. Sensors 8, 1400–1458 (2008).
39. Vimieiro-Gomes, A. C. Comparison of sweat rate during graded exercise and the local rate induced by pilocarpine. Braz. J. Med. Biol. Res. 38, 1133–1139 (2005).
© 2016 Macmillan Publishers Limited. All rights reserved
LETTER RESEARCH
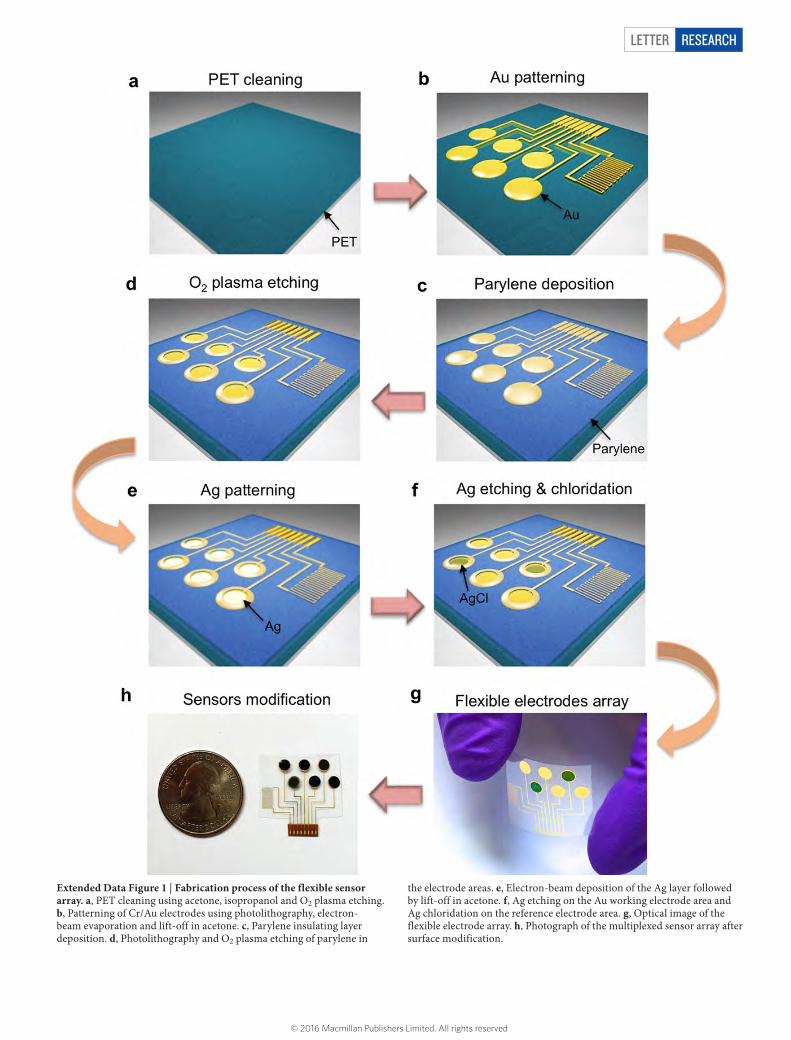
Extended Data Figure 1 | Fabrication process of the flexible sensor array. a, PET cleaning using acetone, isopropanol and O2 plasma etching. b, Patterning of Cr/Au electrodes using photolithography, electron-beam evaporation and lift-off in acetone. c, Parylene insulating layer deposition. d, Photolithography and O2 plasma etching of parylene in
the electrode areas. e, Electron-beam deposition of the Ag layer followed by lift-off in acetone. f, Ag etching on the Au working electrode area and Ag chloridation on the reference electrode area. g, Optical image of the flexible electrode array. h, Photograph of the multiplexed sensor array after surface modification.
© 2016 Macmillan Publishers Limited. All rights reserved

LETTERRESEARCH
Extended Data Figure 2 | The characterizations of the modified electrodes. a, Cyclic voltammetry of the amperometric glucose and lactate sensors using Prussian blue as a mediator in PBS (pH 7.2). Scan range, −0.2 V to 0.5 V; scan rate, 50 mV s−1. b, Potential stability of a PVB-coated Ag/AgCl electrode and a solid-state Ag/AgCl reference electrode (versus
commercial aqueous Ag/AgCl electrode) in different NaCl solutions. c, d, The stability of a PVB-coated reference electrode in solutions containing 50 mM NaCl and 10 mM of different anionic (c) and cationic (d) solutions. Data recording was paused for 30 s for each solution change in b–d.
© 2016 Macmillan Publishers Limited. All rights reserved

LETTER RESEARCH
Extended Data Figure 3 | The custom-developed mobile application for data display and aggregation. a, The home page of the application after Bluetooth pairing. b, Real-time data display of sweat analyte levels as well as skin temperature during exercise. c, Real-time data progression of individual sensor. d, Available data sharing and uploading options.
© 2016 Macmillan Publishers Limited. All rights reserved

LETTERRESEARCH
Extended Data Figure 4 | Schematic diagram of signal-conditioning circuit. a–d, Signal conditioning circuits for (a) glucose, (b) lactate, (c) sodium and (d) potassium channels. VDD and VSS represent the positive and negative power supplies, respectively. LT1462 is the integrated-circuit chip part.
© 2016 Macmillan Publishers Limited. All rights reserved

LETTER RESEARCH
Extended Data Figure 5 | The calibration and power delivery of the FISA. a–d, Flexible PCB calibration for glucose (a), lactate (b), sodium (c) and potassium (d) channels. e, Power delivery diagram of the system. f, Photograph of a small rechargeable battery module used in
the current work (placed next to a quarter-dollar coin for comparison). g, Representative photograph of the power delivery package inside a transparent wristband on a subject’s wrist.
© 2016 Macmillan Publishers Limited. All rights reserved
LETTERRESEARCH
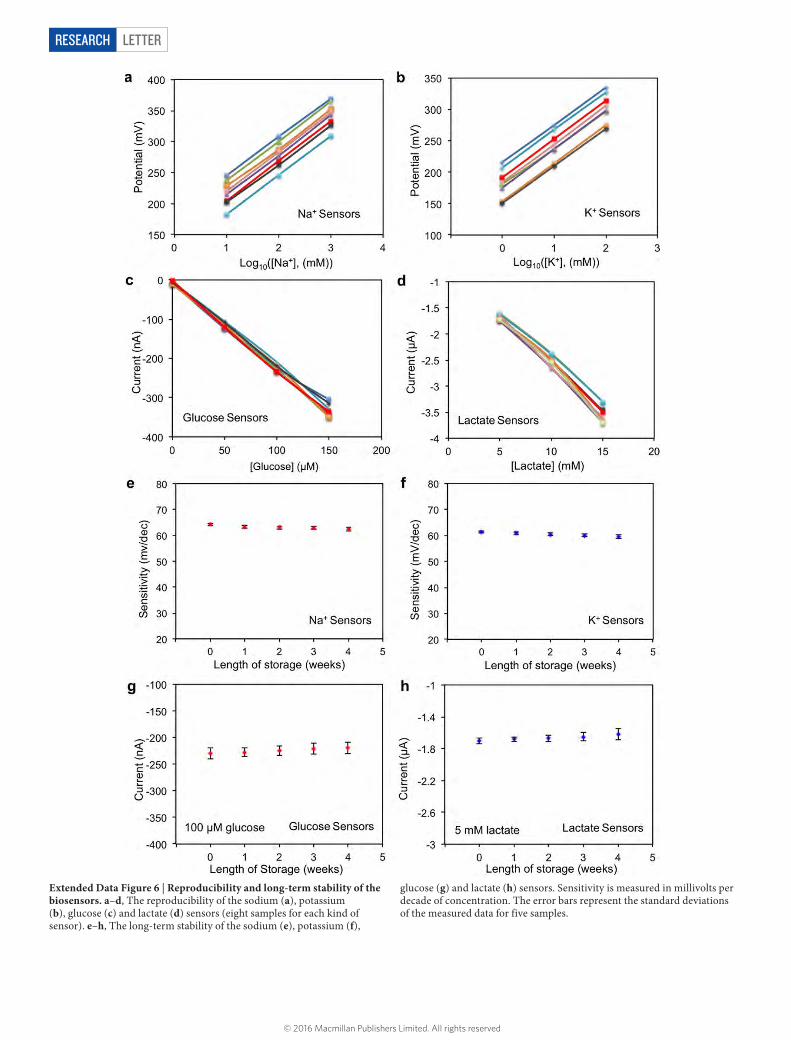
Extended Data Figure 6 | Reproducibility and long-term stability of the biosensors. a–d, The reproducibility of the sodium (a), potassium (b), glucose (c) and lactate (d) sensors (eight samples for each kind of sensor). e–h, The long-term stability of the sodium (e), potassium (f),
glucose (g) and lactate (h) sensors. Sensitivity is measured in millivolts per decade of concentration. The error bars represent the standard deviations of the measured data for five samples.
© 2016 Macmillan Publishers Limited. All rights reserved

LETTER RESEARCH
Extended Data Figure 7 | Selectivity study for electrochemical biosensors. a–d, The interference study for individual glucose (a), lactate (b), sodium (c) and potassium (d) sensors using an electrochemical working station. Data recording was paused for 30 s for the addition of each analyte in c and d. e, f, The real-time system-level interference study
(e) and calibration plot (f) of the amperometric glucose and lactate sensor array with a shared solid-state Ag/AgCl reference electrode. g, h, The real-time interference study (g) and calibration plot (h) of the potentiometric Na+ and K+ sensor array with a shared PVB-coated reference electrode. Data recording was paused for 30 s for each solution change in e and g.
© 2016 Macmillan Publishers Limited. All rights reserved

LETTERRESEARCH
Extended Data Figure 8 | Mechanical deformation study of the flexible sensors and the FPCB. a–f, The responses of the sodium (a), potassium (b), glucose (c), lactate (d), temperature (e) sensors and of the FPCB (f) after 0, 30 and 60 cycles of bending. g–l, The responses of the sodium (g),
potassium (h), glucose (i), lactate (j),and temperature (k) sensors and of the FPCB (l) during bending. The radii of curvature for the bending study of sensors and the FPCB were 1.5 cm and 3 cm, respectively. Data recording was paused for 30 s to change the conditions and settings.
© 2016 Macmillan Publishers Limited. All rights reserved
LETTER RESEARCH
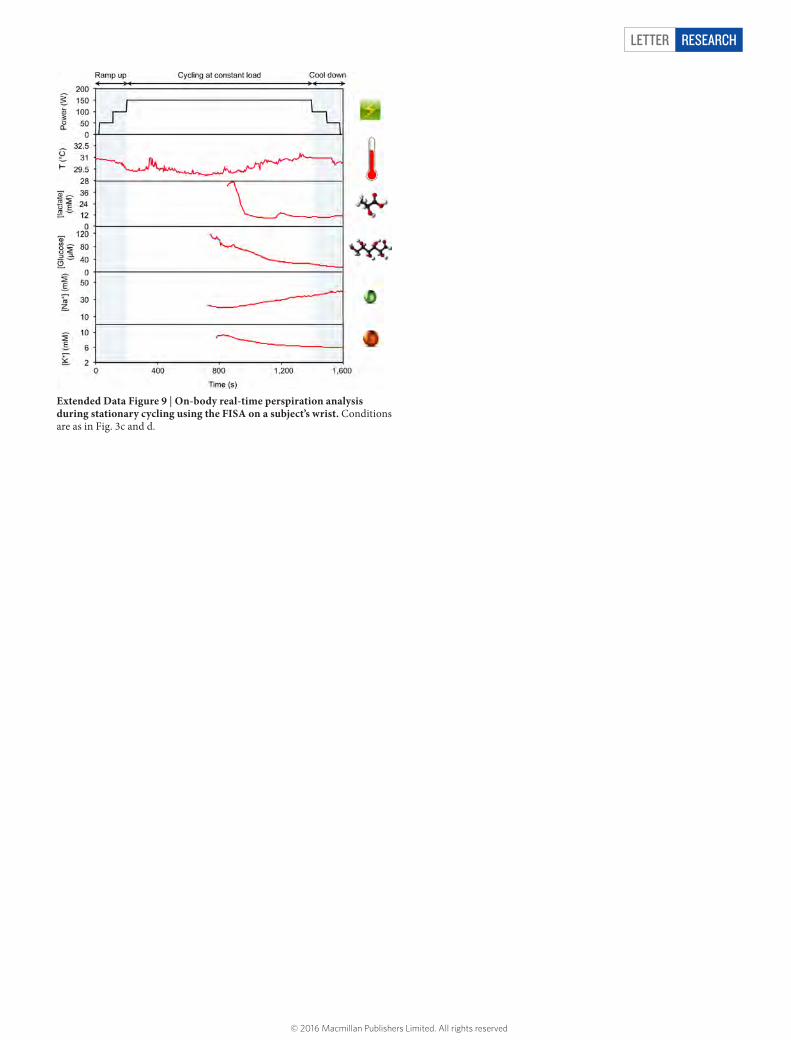
Extended Data Figure 9 | On-body real-time perspiration analysis during stationary cycling using the FISA on a subject’s wrist. Conditions are as in Fig. 3c and d.
© 2016 Macmillan Publishers Limited. All rights reserved

LETTERRESEARCH
Extended Data Figure 10 | Ex situ measurement of collected sweat samples using the FISA on a subject during stationary cycling at 150 W. a, c, The ex situ results of [Na+] (a) and [K+] (c) from the sweat samples collected from the subject’s forehead without water intake (~2.5% of body
weight dehydration). b, d, The ex situ results of [Na+] (b) and [K+] (d) from the sweat samples collected from the subject’s forehead with water intake (150 ml per 5 min).
© 2016 Macmillan Publishers Limited. All rights reserved