
Fully Integrated Complementary Metal Oxide Semiconductor (CMOS
103
Fully Integrated Complementary Metal Oxide Semiconductor (CMOS) Bio-Assay Platform Octavian Florescu Electrical Engineering and Computer Sciences University of California at Berkeley Technical Report No. UCB/EECS-2012-48 http://www.eecs.berkeley.edu/Pubs/TechRpts/2012/EECS-2012-48.html May 1, 2012
Transcript of Fully Integrated Complementary Metal Oxide Semiconductor (CMOS
Fully Integrated Complementary Metal Oxide
Semiconductor (CMOS) Bio-Assay Platform
Octavian Florescu
Electrical Engineering and Computer SciencesUniversity of California at Berkeley
Technical Report No. UCB/EECS-2012-48
http://www.eecs.berkeley.edu/Pubs/TechRpts/2012/EECS-2012-48.html
May 1, 2012

Copyright © 2012, by the author(s).All rights reserved.
Permission to make digital or hard copies of all or part of this work forpersonal or classroom use is granted without fee provided that copies arenot made or distributed for profit or commercial advantage and that copiesbear this notice and the full citation on the first page. To copy otherwise, torepublish, to post on servers or to redistribute to lists, requires prior specificpermission.
Fully Integrated Complementary Metal Oxide Semiconductor (CMOS)
Bio-Assay Platform
by
Octavian Florescu
A dissertation submitted in partial satisfaction of the
requirements for the degree of
Doctor of Philosophy
in
Engineering-Electrical Engineering and Computer Sciences
in the
Graduate Division
of the
University of California, Berkeley
Committee in charge:
Professor Bernhard E Boser, Chair
Professor Richard White
Professor Ali Javey
Professor Eva Harris
Spring 2010
Fully Integrated Complementary Metal Oxide Semiconductor (CMOS)
Bio-Assay Platform
© 2010
by
Octavian Florescu

1
Abstract
Fully Integrated Complementary Metal Oxide Semiconductor (CMOS)
Bio-Assay Platform
by
Octavian Florescu
Doctor of Philosophy in
Engineering-Electrical Engineering and Computer Sciences
University of California, Berkeley
Professor Bernhard Boser, Chair
We present a post-processed 6.25mm2 0.18μm Complementary Metal Oxide
Semiconductor (CMOS) platform that leverages the advantages of super-paramagnetic
bead labeling to integrate on-chip the label separation and detection functionalities
required for high sensitivity bio-assays. The surfaces of the CMOS chip and of the
magnetic beads are functionalized with bio-chemicals complementary to a target analyte.
In a sandwich capture format, the presence of the target analyte will strongly bind 4.5μm
magnetic bead labels to the surface of the chip. The undesired background signal is
minimized by the removal of the unbound magnetic beads from the detection array via
magnetic forces generated on-chip. The remaining strongly bound magnetic beads are
respectively magnetized and detected by an array of 128 stacked micro-coil/Hall sensor
elements. This single chip solution does not require any external components like pumps,
valves or electromagnets and is capable of detecting purified Human antibodies down to
concentrations of 100pg/ml as well as anti-Dengue antibodies in human serum samples.
A whole blood sample preparation system based on membrane filtration alleviates
the need for centrifugation and can be readily combined with the assay platform into a
high performance, Point-of-Need (PON) In-Vitro Diagnostic (IVD) device.
The present prototype relies on an electronic reader for controlling the assay and
reporting results. Implementing this function on the bio-sensor front-end enables a very
simple design consisting of only the bio-sensor and an attached results display. Such low-
cost, easy-to-use, high performance devices are needed for lowering health costs through
more decentralized distribution of medical care.

i
To my family, Eugen, Viorica, Valentin and Iky.

ii
Table of Contents
1 Point-of-Need In-vitro Diagnostics 1
1.1 Introduction 1
1.2 Immuno-Chromatographic Tests 2
1.3 Integrated Digital Assay Technologies 3
1.4 IC-Based Magnetic Bead Labeled Assays 3
1.5 Fully Integrated CMOS based bio-assay platform 6
2 On-chip magnetic bead separation 8
2.1 Introduction 8
2.2 System Overview 9
2.3 System Design 9
2.3.1 Post Processing and Assembly 9
2.3.2 On-Chip Magnetic Concentration 13
2.3.3 On-Chip Magnetic Separation 14
2.3.4 Joule Heating 16
2.3.5 Choice of Magnetic Beads 17
2.3.6 Chip and Bead Surface Bio-Functionalization 18
2.3.7 Control Assays 18
2.4 Assay Protocols 19
2.4.1 Polystyrene Control ELISA 19
2.4.2 Gold Surface Based Control Assay Preparation 20
2.4.3 Gold Surface Based ELISA Labeling and
Detection 20
2.4.4 Magnetic Bead Based Control Assay Labeling
and Detection 20
2.4.5 On–Chip Purified Human IgG Assay 21
2.5 Results 21
2.5.1 Control Assays 21
2.5.2 Magnetic Bead Sedimentation and Concentration 22
2.5.3 On-Chip Magnetic Bead Separation 23
2.5.4 On-Chip Human IgG Assay Results 25
2.6 Conclusion 27
3 On-Chip Detection of Magnetic Beads 28
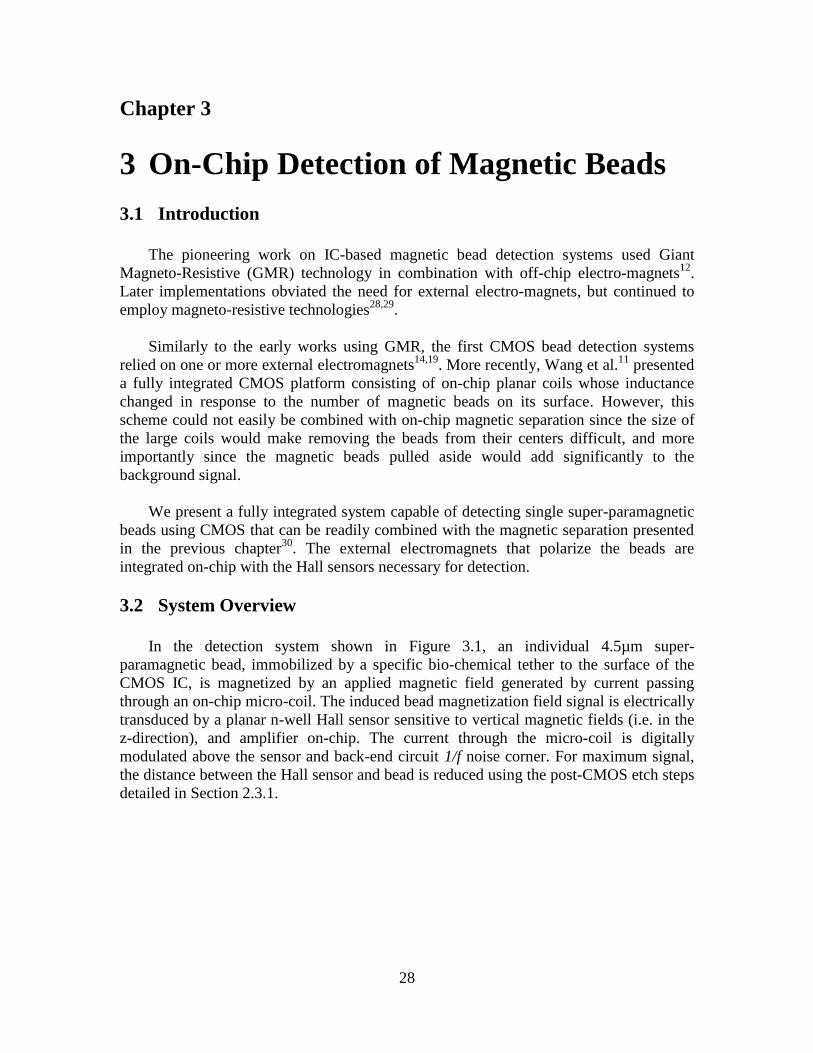
3.1 Introduction 28
3.2 System Overview 28
3.3 System Design 29
3.3.1 Bead Magnetization Calculations 29
3.3.2 Bead Detection 31
3.3.3 Back-End Electronics 32
3.4 Results 34
3.4.1 Single Bead Detection 34
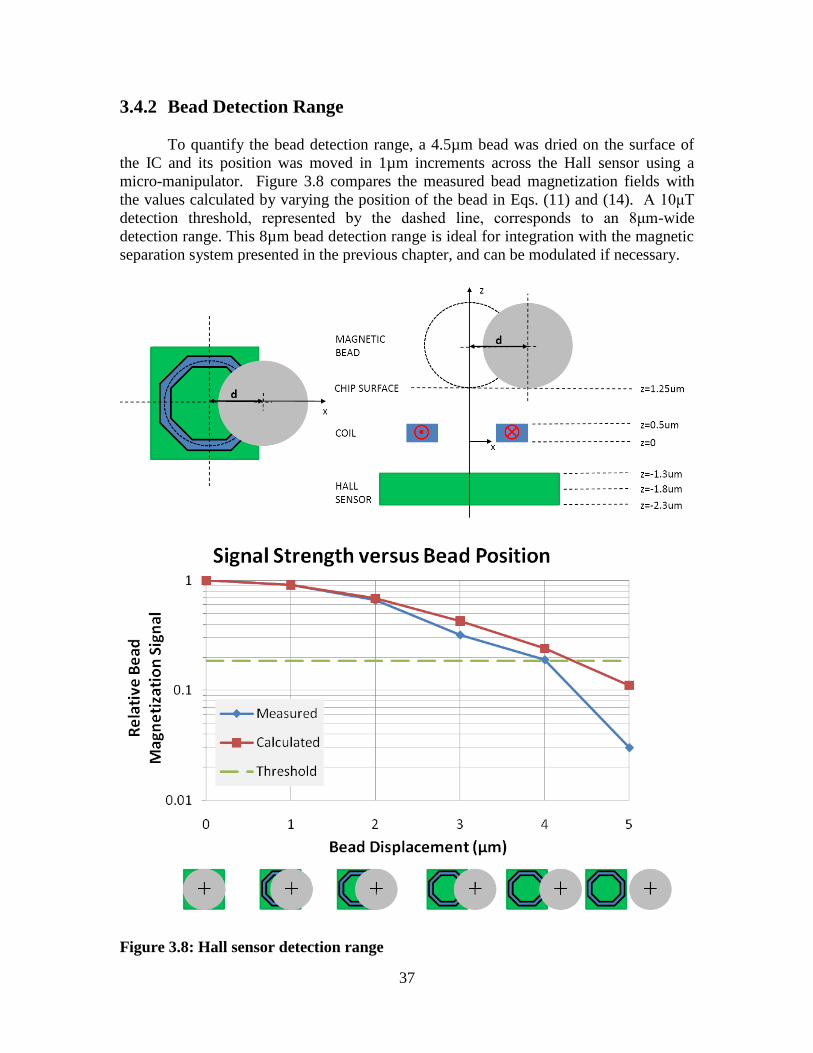
3.4.2 Bead Detection Range 37
3.5 Conclusion 38
iii
4 Fully Integrated CMOS Assay Platform 39
4.1 Introduction 39
4.2 System Integration 40
4.2.1 Integrated Circuit 40
4.2.2 Post Processing and Assembly 41
4.2.3 Integrated Assay Algorithm 42
4.3 Assay Protocols 45
4.3.1 On-Chip Purified Human IgG Assay 45
4.3.2 Dengue Control ELISAs 45
4.3.3 On-Chip Dengue Assay 46
4.4 Results 46
4.4.1 On-Chip Assay Algorithm 46
4.4.2 Magnetic Bead Detection 46
4.4.3 On-Chip Purified Human IgG Assay Results 48
4.4.4 On-Chip Dengue Assay Results 51
4.5 CMOS Assay Platform Characteristics 51
4.6 Conclusion 53
5 Sample Preparation and System Integration 55
5.1 Introduction 55
5.2 System Overview 55
5.3 System Design 56
5.4 Sample Preparation Protocols 57
5.4.1 Vial Assembly 57
5.4.2 Total Human IgG Filtration 57
5.4.3 Anti- Dengue IgG Filtration 57
5.4.4 Filtrate Assay Protocols 58
5.5 Results 58
5.5.1 Filter Selection 58
5.5.2 Total Human IgG Assays 60
5.5.3 Anti-Dengue IgG Assays 61
5.6 Discussion 63
5.6.1 Integration with the CMOS-based Bio-Assay
Platform 63
5.6.2 Stand-Alone Digital PON IVD Tester 64
5.6.3 Future Directions 65
5.7 Conclusion 65
iv
List of Figures
Figure 1.1: Immuno-chromatographic test operation (Courtesy of NASA)
Figure 1.2: Magnetic bead labels
Figure 1.3: Dynal M-450 magnetization measurements
Figure 1.4: Surface of CMOS IC capable of autonomously performing a bio-assay
Figure 1.5: Stand-alone digital PON IVD tester
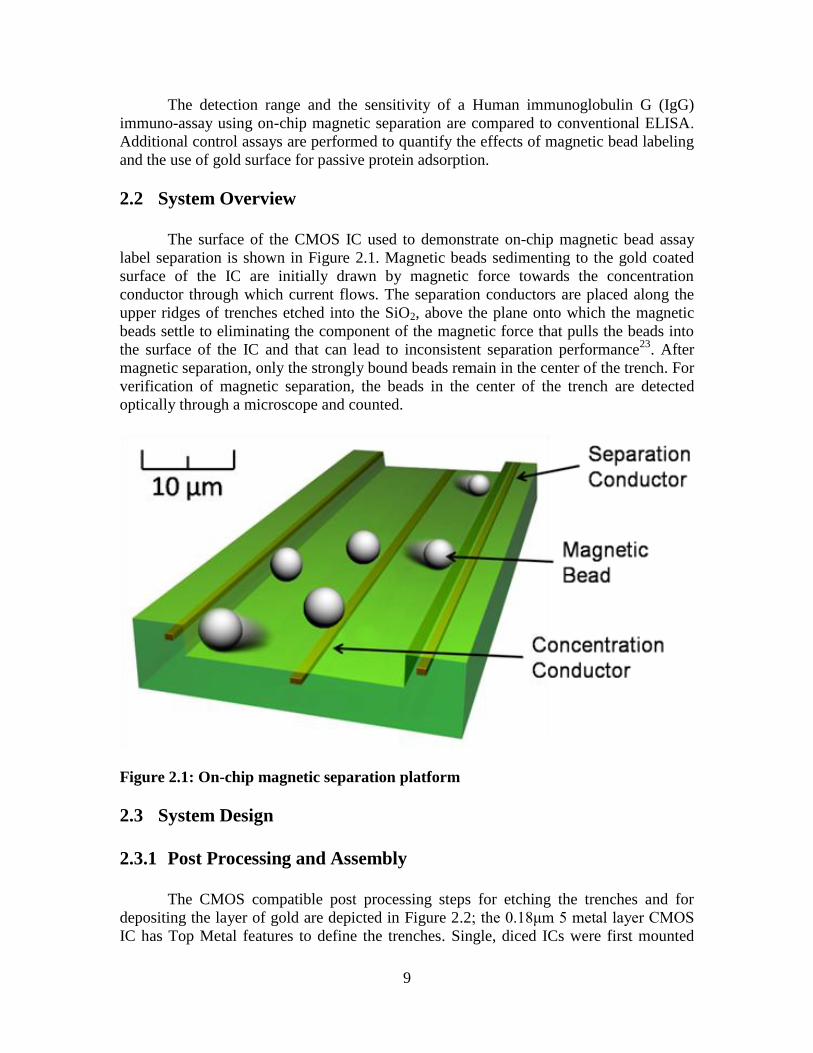
Figure 2.1: On-chip magnetic separation platform
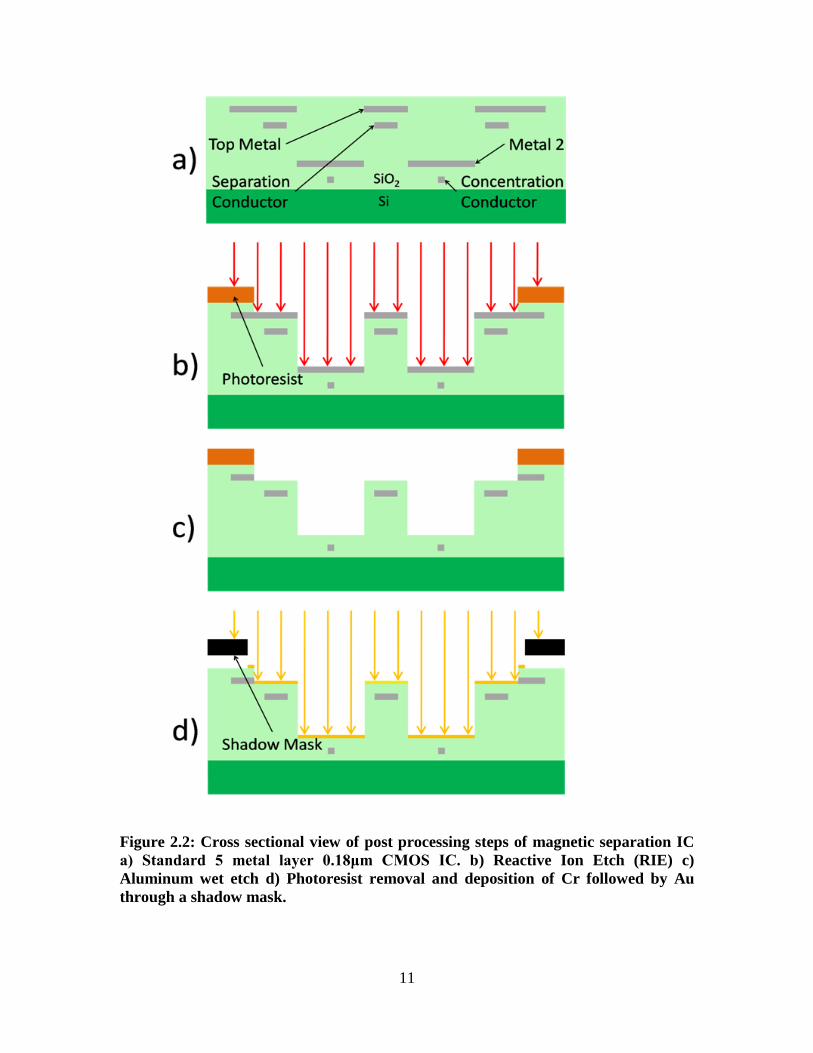
Figure 2.2: Cross sectional view of post processing steps of magnetic separation IC
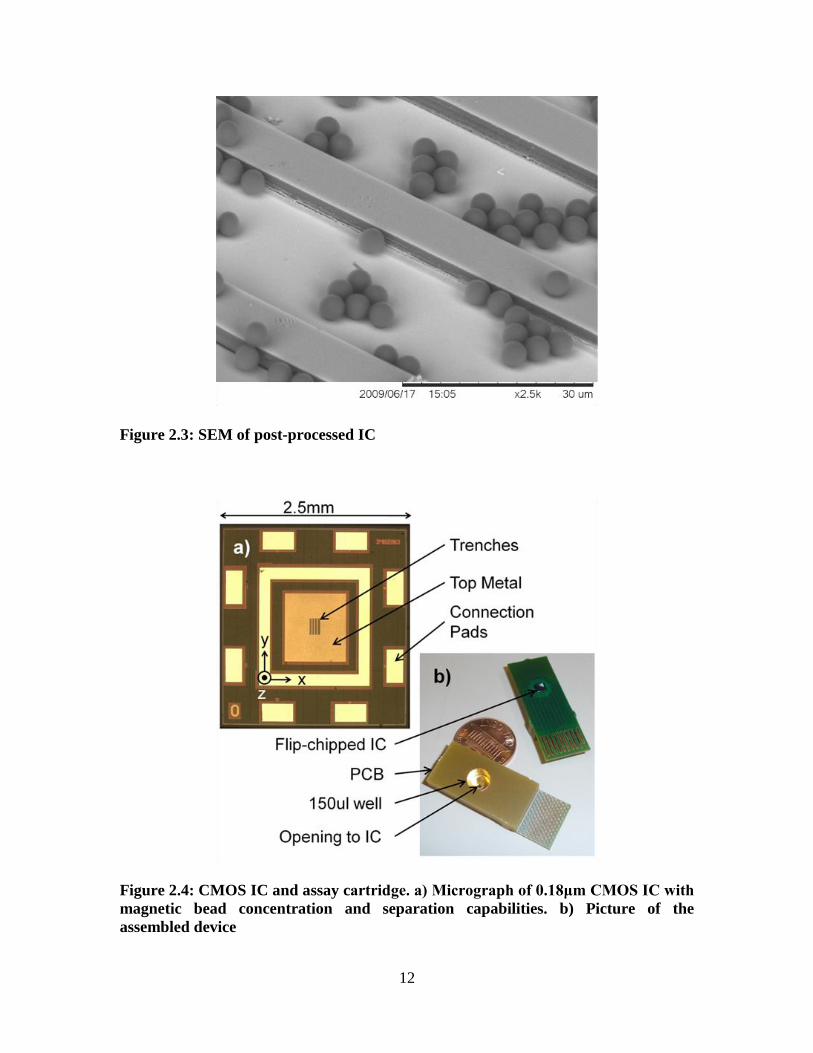
Figure 2.3: SEM of post-processed IC
Figure 2.4: CMOS IC and assay cartridge
Figure 2.5: Cross section of trench etched in SiO2
Figure 2.6: Mechanical leverage effect
Figure 2.7: Lumped equivalent thermal circuit
Figure 2.8: Surface bio-chemistry
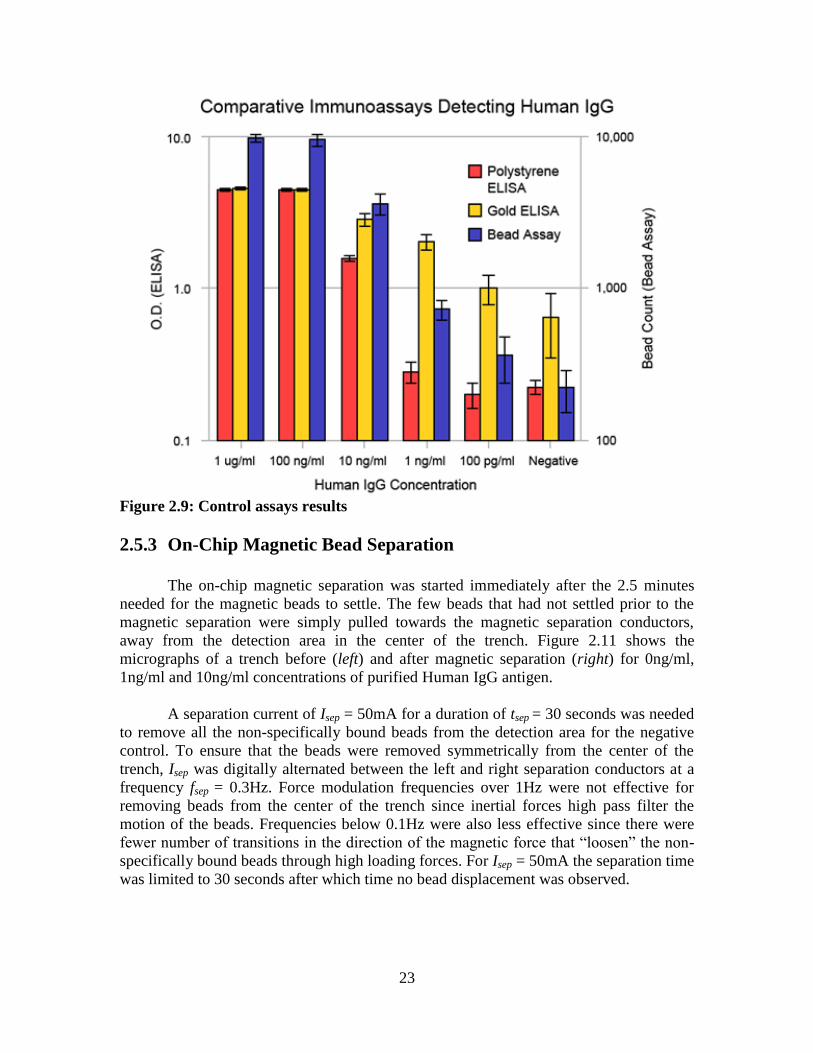
Figure 2.9: Control assays results
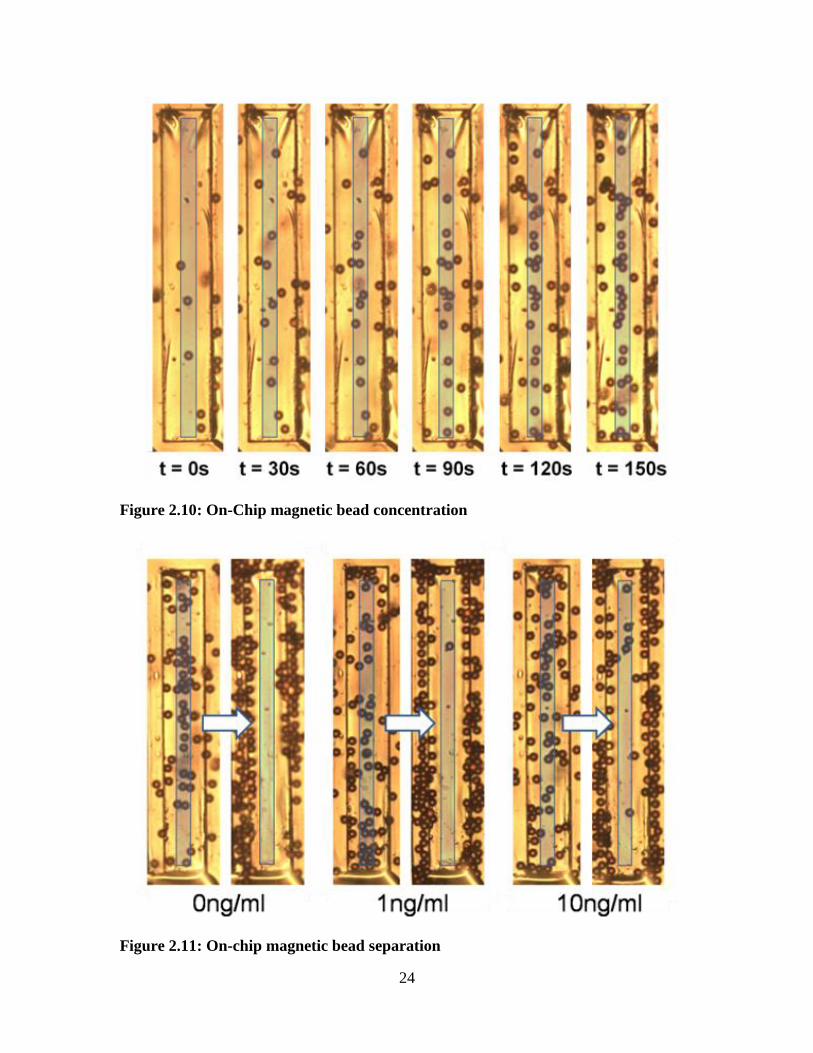
Figure 2.10: On-Chip magnetic bead concentration
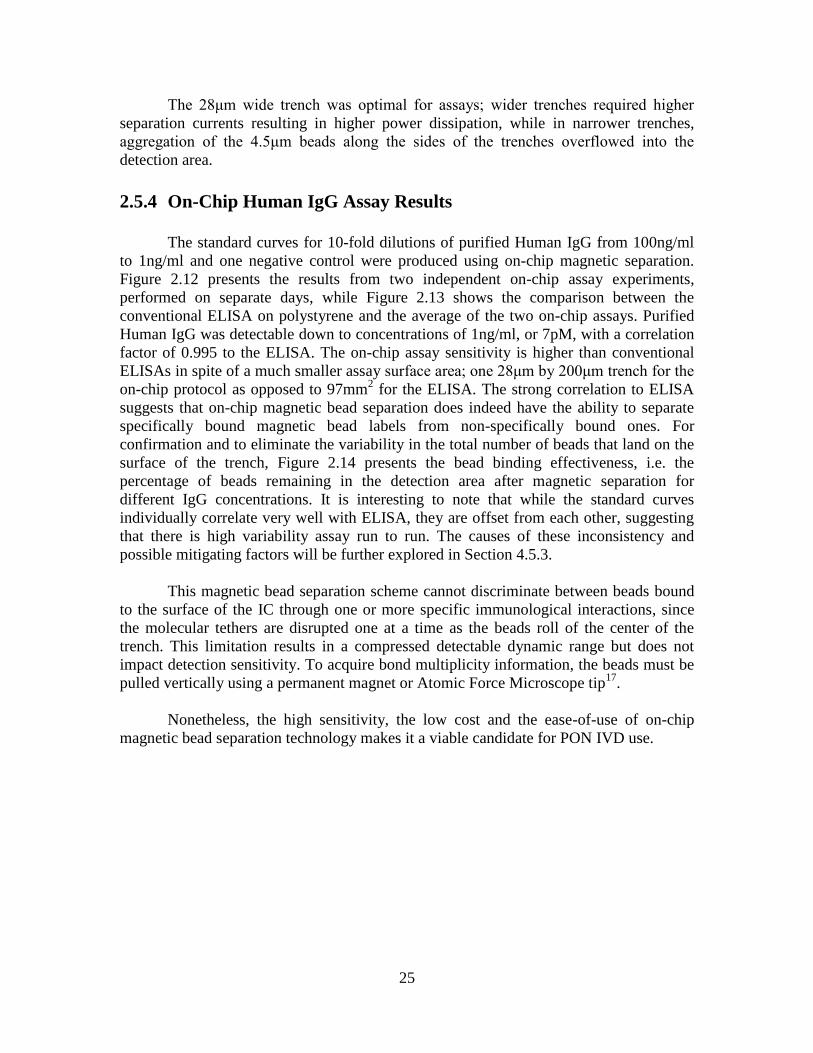
Figure 2.11: On-chip magnetic bead separation
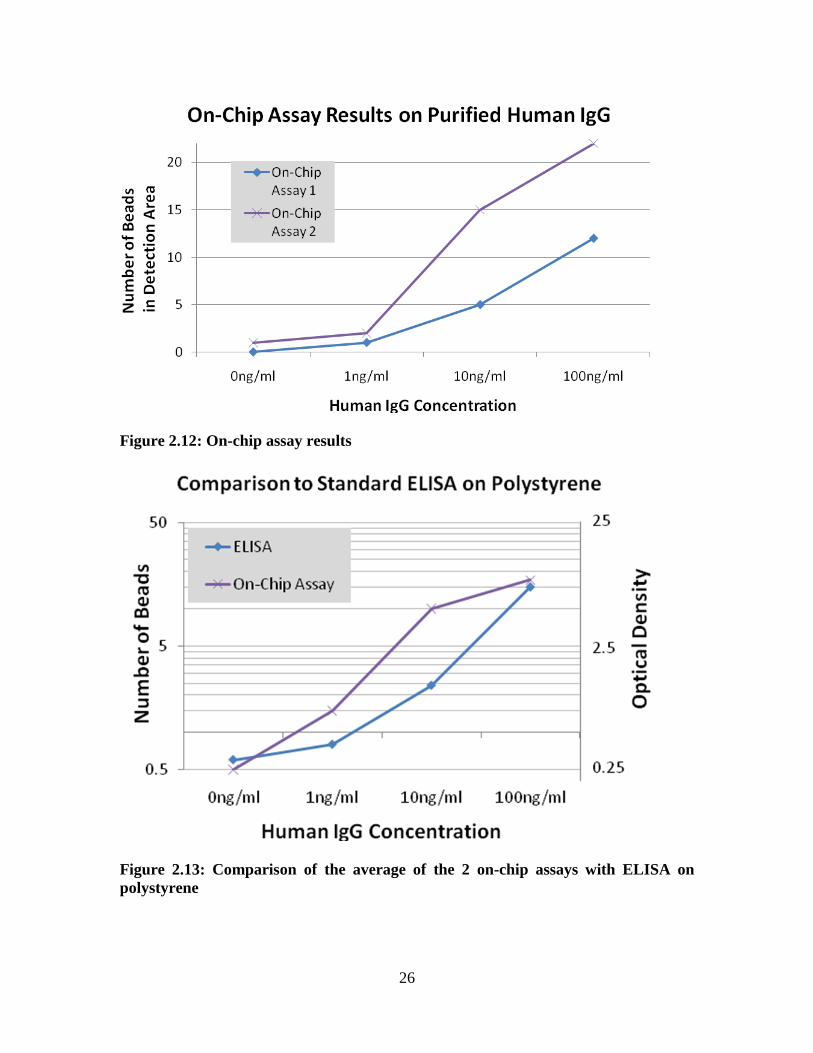
Figure 2.12: On-chip assay results
Figure 2.13: Comparison of the average of the 2 on-chip assays with ELISA on
polystyrene
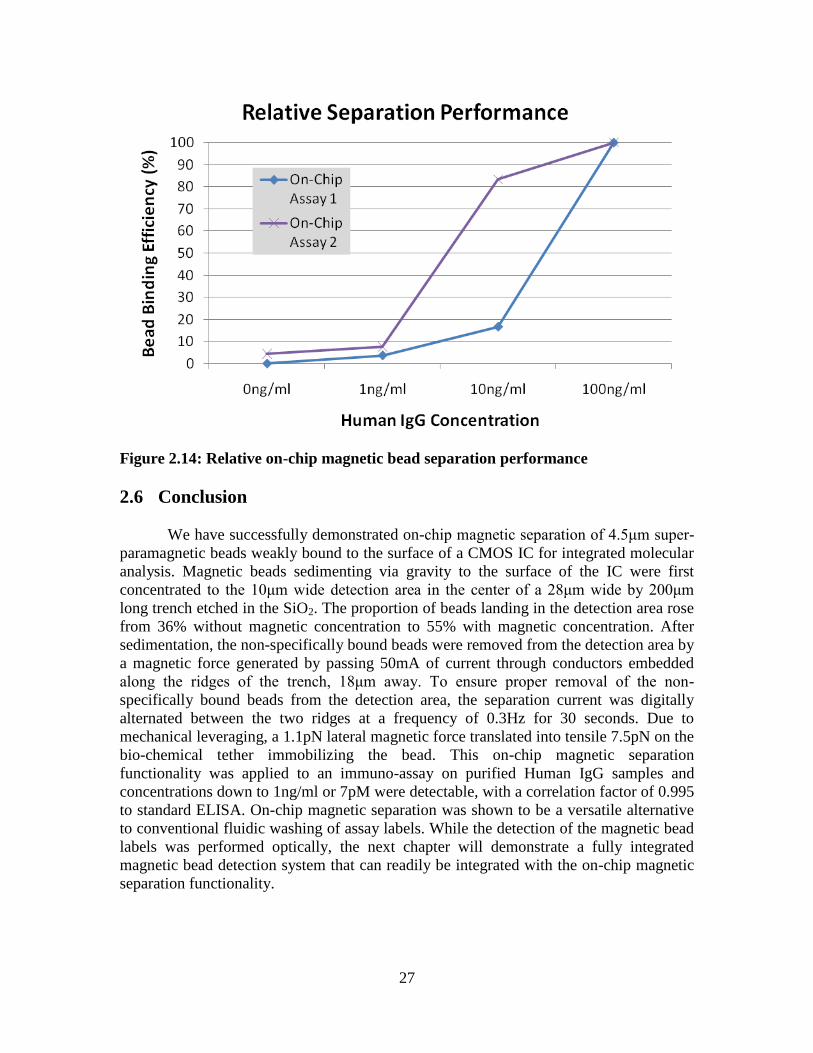
Figure 2.14: Relative on-chip magnetic bead separation performance
Figure 3.1: a) 3-Dimensional representation of a 4.5µm bead above a Hall sensor/micro-
coil pair, b) Micrograph top view of two Hall sensor/micro-coil pairs
Figure 3.2: Bead magnetization dipole
Figure 3.3: z-Component of the bead magnetization field at the Hall sensor plane
Figure 3.4: n-well Hall Sensor
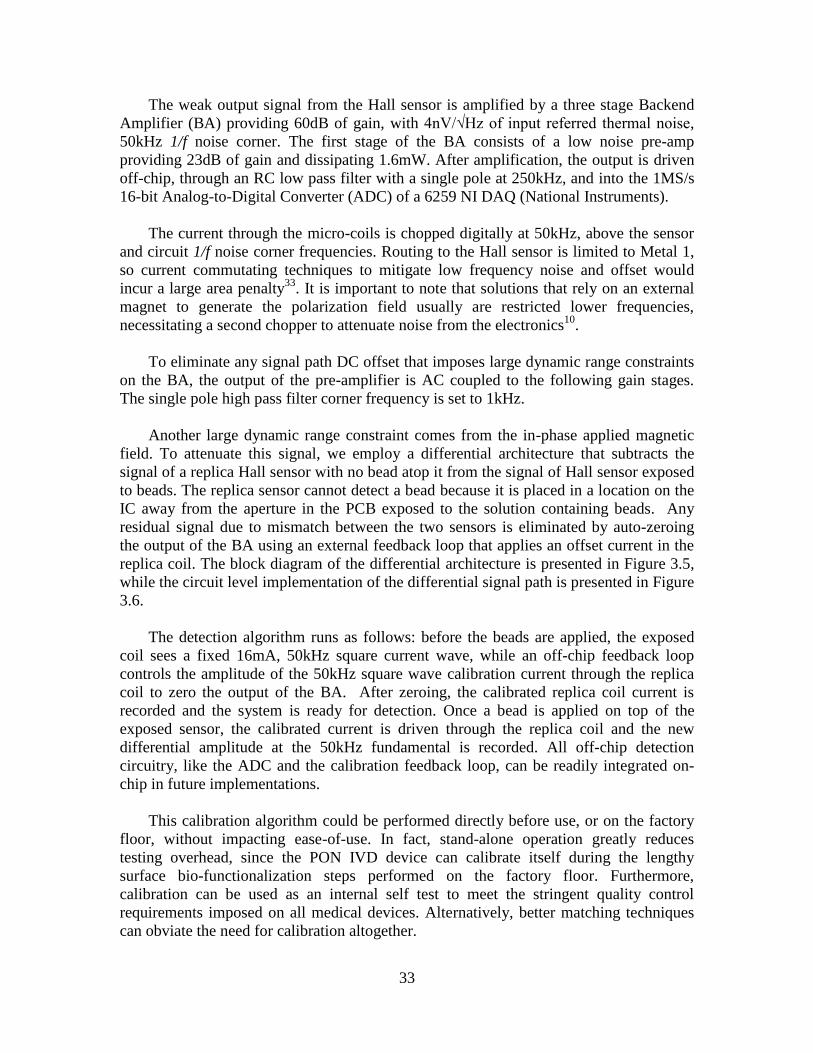
Figure 3.5: Differential architecture consisting of an exposed sensor (1), a replica sensor
(2), a three stage Backend Amplifier and an off-chip 16-Bit ADC
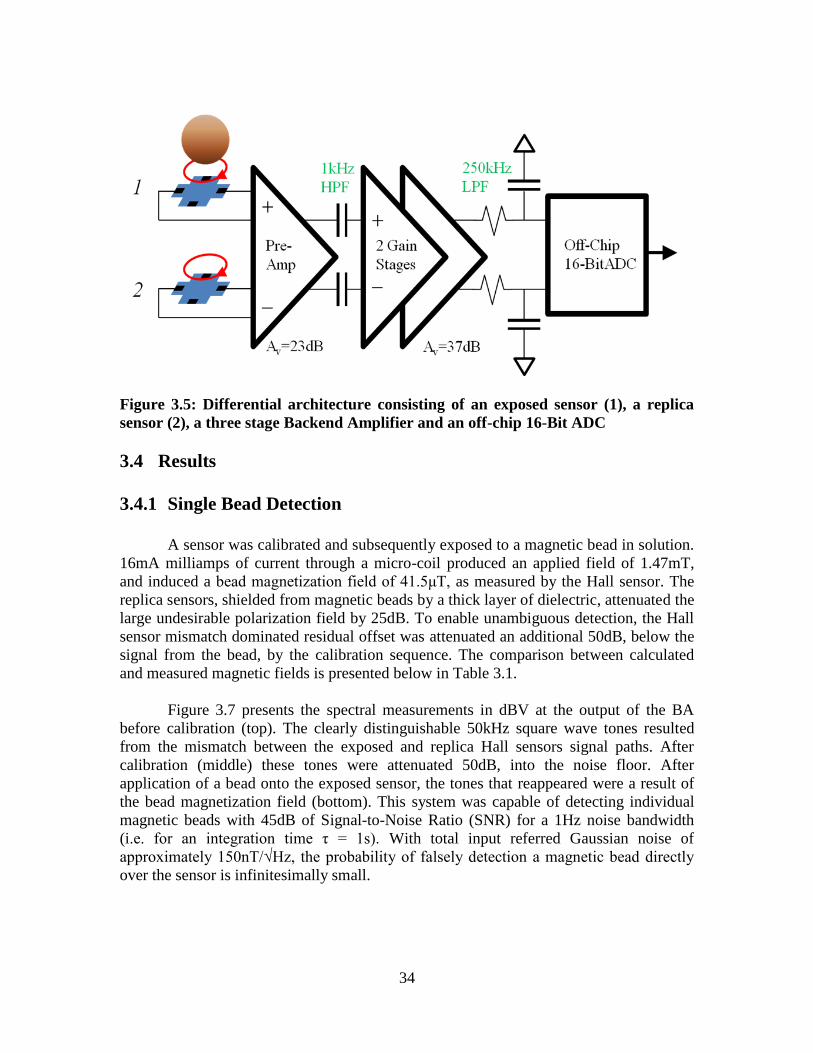
Figure 3.6: Circuit schematic of the differential sensing element signal path
Figure 3.7: Output of the ADC measured with a 1Hz noise bandwidth, before calibration
(top), after calibration (middle), and after application of a bead (bottom)
Figure 3.8: Hall sensor detection range
Figure 4.1: Block level description of integrated assay platform
Figure 4.2: Cross sectional view of the post processing steps of the fully integrated assay
platform
Figure 4.3: Functional timing diagram
Figure 4.4: Micrograph of 6.25mm2 0.18μm CMOS Assay platform with inlay of a
trench containing 8 inline Hall sensors
Figure 4.5: Photograph of test setup
Figure 4.6: On-chip assay procedure
Figure 4.7: Comparison between optical and on-chip magnetic bead detection
Figure 4.8: On-chip purified human IgG assays
Figure 4.9: Relative number of beads remaining in the detection area after magnetic
separation
Figure 4.10: Comparison of the on-chip assay with ELISA
v
Figure 4.11: On-chip assay on human sera samples
Figure 4.12: Digital display of on-chip assay results
Figure 5.1: Membrane filter sample preparation system
Figure 5.2: Whole blood wicking characteristics of the S/G, NX, X, C/Q, and C/S
PVP/PES membrane filters, from left to right
Figure 5.3: Human IgG assay performed on a) a centrifuged Human serum control, b) a
Millipore .22um filtrate (Millipore, MA, USA), c) a C/S PVP/PES membrane filtrate, d) a
C/Q PVP/PES membrane filtrate, e) a S/G PVP/PES membrane filtrate, and f) a negative
control.
Figure 5.4: Cross-sectional schematic of S/G PVP/PES membrane filter with graduated
pore size
Figure 5.5: Whole blood filtrate assay results using ELISA on polystyrene, ELISA on
gold and magnetic bead based assays
Figure 5.6: Assay on spiked whole blood filtrate with a 30 seconds wait time between
application of the blood and agitation
Figure 5.7: Assay on spiked whole blood filtrate with a 2 minutes wait time between
application of the blood and agitation
Figure 5.8: Integration of the membrane filtration with the CMOS bio-Assay platform
Figure 5.9: Cross-section of stand-alone digital PON IVD tester

vi
List of Tables
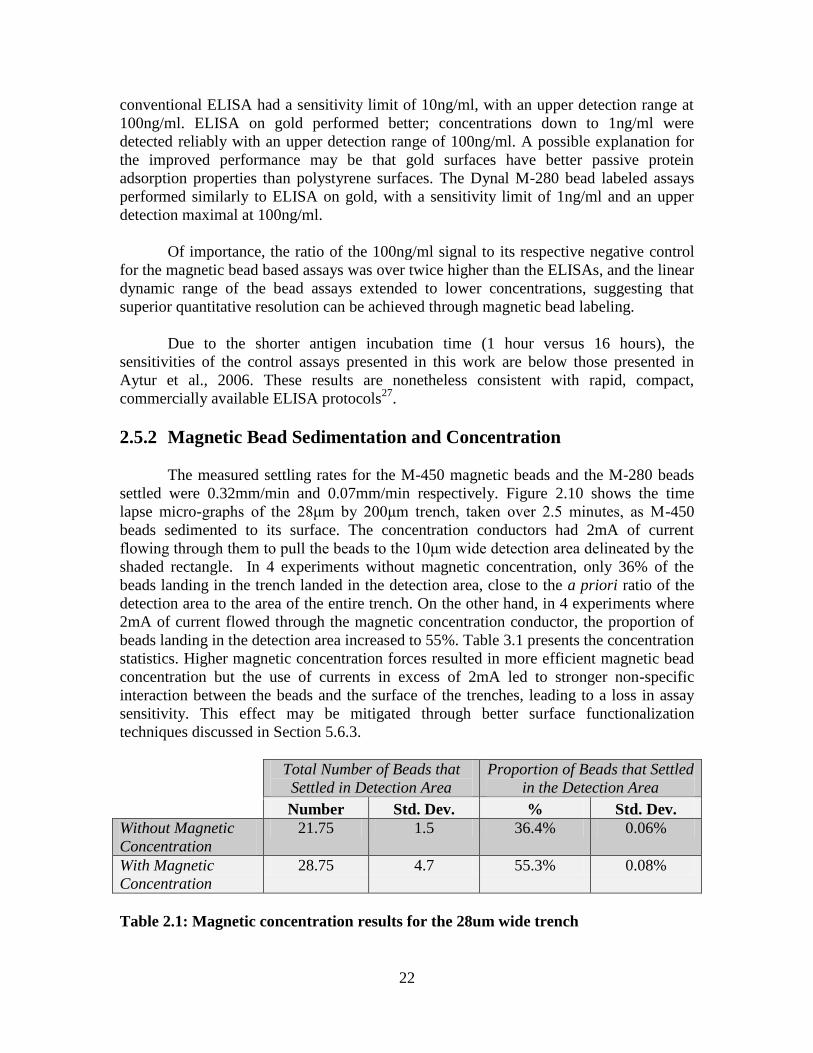
Table 2.1: Magnetic concentration results for the 28um wide trench
Table 3.1: Calculated, and measured z-component of the applied and bead magnetization
field
Table 5.1: PVP/PES membrane filter specifications according to International Point of
Care, Inc, Toronto, Canada

vii
Acknowledgements
I cannot appropriately express in words the gratitude I feel towards the family,
friends and colleagues in my life. I have been truly blessed by your company. On the
days filled with fear, you have pointed out the cracks in my philosophy that have let shine
through the light, and on the days filled with confidence, you have reminded me of the
pervasive uncertainty that undermines the best laid plans. For this, I am grateful, and
present you with this work, to which many have contributed.
Mine is but the most recent attempt to roll a rock up a hill, or in this case a bead
across the surface of a digital integrated circuit. Much credit must be given to the early
visionaries that were able to identify promising directions among all the noise and
confusion, namely Mekhail Anwar, Turgut Aytur, Jonathan Foley, Tomohiro Ishikawa,
Professor Bernhard Boser, Professor Eva Harris and Professor Robert Beatty.
This particular implementation was the work of many, under the co-ordination of
Professor Bernhard Boser, Professor Eva Harris and Professor Robert Beatty. Foremost, I
would like to thank Kevan Wang, who developed and performed the Human IgG assays
in Chapters 2 and 5, Paul Dier and Rajiv Sharma, who developed and performed the
dengue assays and the filtration protocols, and Moritz Mattmann and Paul Liu, who
performed the measurements of the on-chip detection. Patrick Au, Jimmy Tang, Nathan
Volman and Ali Abidi helped develop the electromagnetic models and the electronic
testbench setup. Brian Kawahara, Joanna Kam, and Gabrielle Liu set up the wet
laboratory and performed the initial test assays. It was an honor and a pleasure to have
worked with all of you.
I am grateful to my brother, Valentin Florescu, for his beautiful renderings in
Figures 1.4, 1.5, 2.1, 5.8 and 5.9 that perfectly crystallized our imagination and that gave
us a tangible goal to strive for. I would like to thank Karl Skucha for all his help with
processing and analyzing results, Gabe Lavella for his stunning insights spanning
everything from scientific approach to personal behavior, Steven Lanzisera for his aid
with the design flow, and Sam Kavusi for help understanding the market.
A special thanks goes to the wonderful staff at Cal and in particular in the BSAC
and the EECS graduate department. John Huggins has been a tremendous source of
invaluable information regarding technology, business and policy. Richard Lossing,
Helen Kim and Alain Kesseru are all tireless in their efforts to keep BSAC running as
smoothly as I have ever seen of an organization of such scope and complexity. Through
their self-effacing support, Ruth Gjerde, Mary Byrnes, Elisa Lewis and Patrick Hernan
made navigating the sometimes difficult waters of graduate life at Berkeley not just
manageable, but downright pleasant.
This work would not be possible without the generous financial and material
support from the UC Berkeley Microlab, the UC Berkeley Biomolecular Nanotechnology
Center, the Robert Bosch Corporation, the National Institute of Health Genes,

viii
Environment and Health Initiative, and the National Institute of Health Pacific
Southwest Regional Center for Excellence.
I would like to finish by expressing my sincere gratitude to Professor Bernhard
Boser, for giving me the opportunity to work on such a fascinating project and for
showing the kind of rigor and patience needed to successfully roll the most jagged of
rocks up the steepest of hills.
Thank you.
1
Chapter 1
1 Point-of-Need In-Vitro Diagnostics
Octavian Florescu
1.1 Introduction
The last two major technological revolutions, namely the automotive and the
Information Technology (IT) revolutions, made accessible directly at the Point-of-Need
(PON) products and services that were previously only available through centralized
distribution. In addition to significant reduction in the opportunity costs of transportation
and information, the added user flexibility in combination with the requisite individual
freedom led to the countless innovations that are now bedrocks of our modern industrial
societies and that contribute greatly to the general state of welfare.
The healthcare sector, on the other hand, has retained privately and publicly
accredited centralized sources of distribution. This structural rigidity manifests itself as
rising healthcare costs relative to general consumer costs, since the latter benefit from
more unfettered competition and fluid re-organization. Medical technologies targeted to
the PON have the potential to circumvent a number of market barriers, thereby releasing
economic efficiencies locked into the healthcare sector. Many medical diagnoses and
therapeutics could be delivered much like food, another vital necessity whose quality is
regulated by the federal government, but whose cost has been declining relative to wages.
To ensure widespread adoption, PON medical devices must be easy to use by the
general public and have a low total system cost, in addition to meeting the usual
standards of efficacy placed on all medical devices.
Soluble bio-marker detection is particularly well-suited for the PON since a wide
range of medical conditions from cardiac disease to cancer to communicable infections
can be identified using In-Vitro Diagnostics (IVD). Moreover, identification or
quantitation of bio-markers like anti-HIV antibodies can result in timely, actionable
information.
The identification of soluble bio-markers from raw samples often begins with
labeling the target molecule using fluorophores, enzymes or magnetic particles. For high
sensitivity applications like for the early detection of infectious diseases, the target
molecule bound labels must be discriminated from the unbound ones that contribute to
background noise. Finally, the bound labels are detected and quantified if necessary.
2
1.2 Immuno-Chromatographic Tests
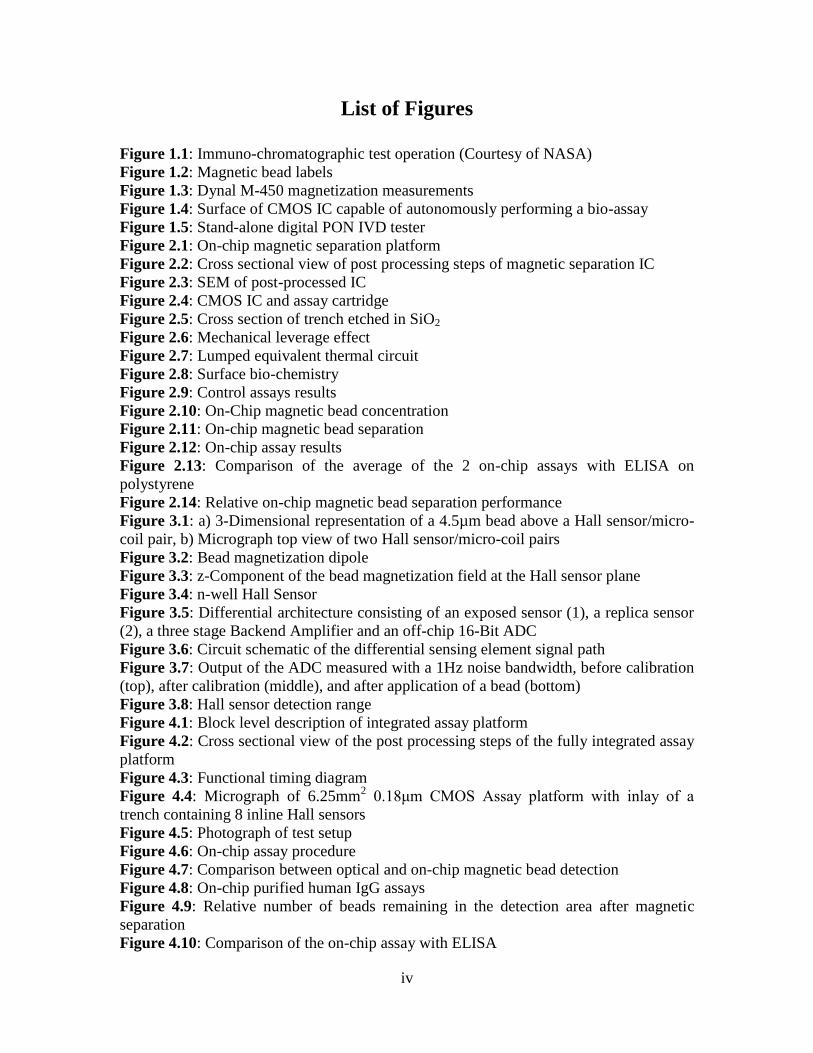
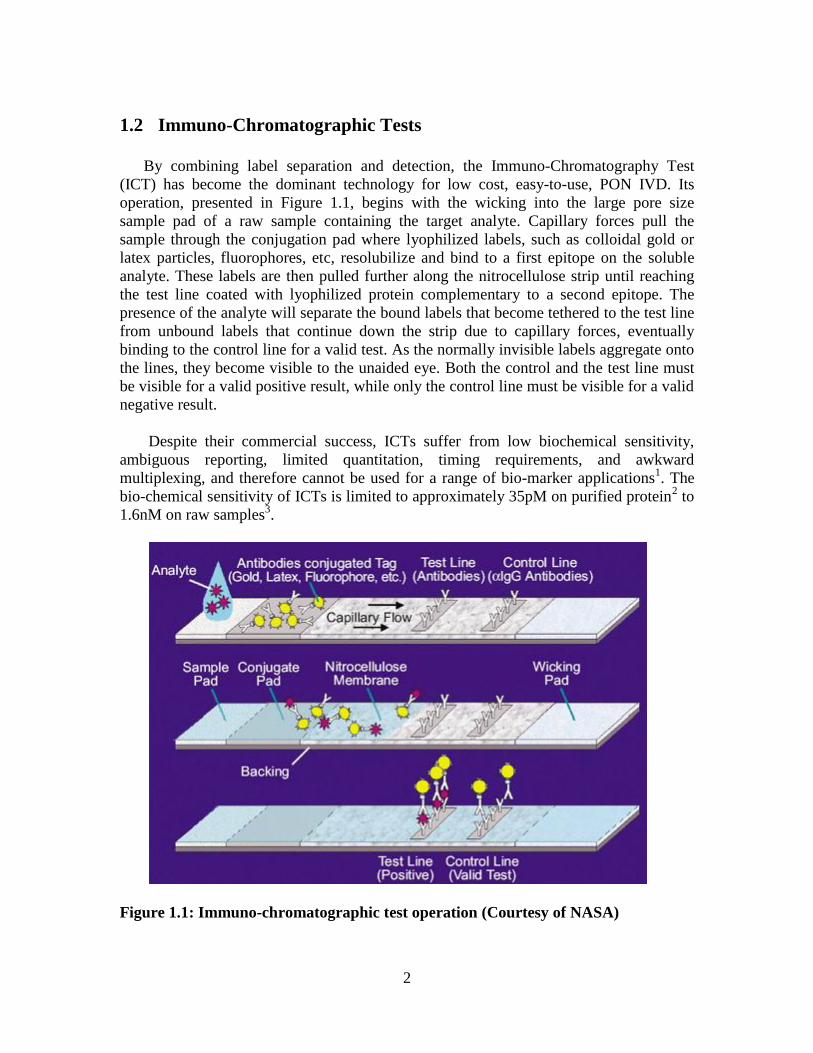
By combining label separation and detection, the Immuno-Chromatography Test
(ICT) has become the dominant technology for low cost, easy-to-use, PON IVD. Its
operation, presented in Figure 1.1, begins with the wicking into the large pore size
sample pad of a raw sample containing the target analyte. Capillary forces pull the
sample through the conjugation pad where lyophilized labels, such as colloidal gold or
latex particles, fluorophores, etc, resolubilize and bind to a first epitope on the soluble
analyte. These labels are then pulled further along the nitrocellulose strip until reaching
the test line coated with lyophilized protein complementary to a second epitope. The
presence of the analyte will separate the bound labels that become tethered to the test line
from unbound labels that continue down the strip due to capillary forces, eventually
binding to the control line for a valid test. As the normally invisible labels aggregate onto
the lines, they become visible to the unaided eye. Both the control and the test line must
be visible for a valid positive result, while only the control line must be visible for a valid
negative result.
Despite their commercial success, ICTs suffer from low biochemical sensitivity,
ambiguous reporting, limited quantitation, timing requirements, and awkward
multiplexing, and therefore cannot be used for a range of bio-marker applications1. The
bio-chemical sensitivity of ICTs is limited to approximately 35pM on purified protein2 to
1.6nM on raw samples3.
Figure 1.1: Immuno-chromatographic test operation (Courtesy of NASA)

3
1.3 Integrated Digital Assay Technologies
Modern “lab-on-a-chip” technologies have shown the potential to overcome some or
all of those drawbacks. In particular, micro-fluidic systems have been proposed as
candidate technologies for PON IVD4. They consist of micron-scale channels patterned in
plastic or glass that manipulate samples using automated protocols similar to the ones
currently used in diagnostic laboratories. Unfortunately, actuation of the pumps and
valves and the label detection often requires off-chip components, which makes the
systems expensive, difficult to use and preclude stand-alone operation.
Attempts at integrating or even eliminating the off-chip components have been
mixed. The Motorola effort saw a variety of electrochemical and thermopneumatic
pumps and valves integrated into a single DNA biochip5. This blunt, head-on approach
did not effectively collapse the protocol and as a results was plagued by prohibitive
manufacturing costs.
Others have used Printed Circuit Board technology to electronically control the
wetting characteristics of conductors used to guide and manipulate drops of fluid6. High
sensitivity applications using this approach have been stifled by the daunting sample
preparation hurdles associated with controlling the contact angle of complex
physiological fluids.
In an acknowledgement to the inherent cost of conventional micro-fluidics, Sia et al.
developed an automated immuno-assay using a single capillary that did not required any
valves or pumps7. However, the performance of this system showed no improvement
over conventional immuno-chromatographic tests, and cost significantly more due to the
multi-chip implementation.
Most recently, Proctor & Gamble Co. has released the Clearblue Easy Digital
Pregnancy Test onto the over-the-counter market8. This platform technology consists of
an immuno-chromatographic strip mated to an inexpensive optical detector and a digital
readout. While its commercial success is indicative of the demand for decentralized,
consumer-driven health, the Clearblue easy platform has failed to demonstrate non-
inferior performance over existing immuno-chromatographic tests; early reviews by
consumers suggests an alarming rate of false positives compared to existing at-home
pregnancy tests9. Moreover, the implementation consists of no less than 7 separate
Integrated Circuits (ICs).
1.4 IC-Based Magnetic Bead Labeled Assays
By combining high specificity label separation, high sensitivity label detection and
control electronics into an integrated system consisting solely of one chip, one battery
and one display, IC based implementations have the potential to produce digital PON
IVD platforms with low cost and high functionality,. In particular, single Complementary
Metal Oxide Semiconductor (CMOS) chip designs have the potential to achieve
4
generational low cost structure, i.e. until the next generation low cost digital technology
displaces CMOS.
The IC-based implementations proposed to date however require either off-chip
components for label detection10
, micro-fluidic actuation for label separation11
, or
nonstandard processes for manufacturing10,12
.
We propose a fully integrated CMOS-based platform that can perform both label
separation and detection without aid from off-chip components. The use of micron-sized
magnetic beads as assay labels greatly facilitates protocol integration since these beads
can be both detected and manipulated electromagnetically. Moreover, magnetic beads
have additional qualities that make them ideal for PON application; a) the signals from
magnetic beads are not affected by biological interactions and can be detected in opaque
solutions like whole blood, b) the biological magnetic background signal is very low, c)
the signals from magnetic beads are stable over time and insensitive to changes in
temperature or chemistries, d) incubation with magnetic beads permits quasi-solution
phase binding kinetics through their high surface area to volume ratio13
, e) rapid
sedimentation rates enables analyte concentration to the surface of the IC without relying
on slow diffusion processes, and finally f) the ability to detect individual assay labels
obviates the need for lengthy signal amplification.
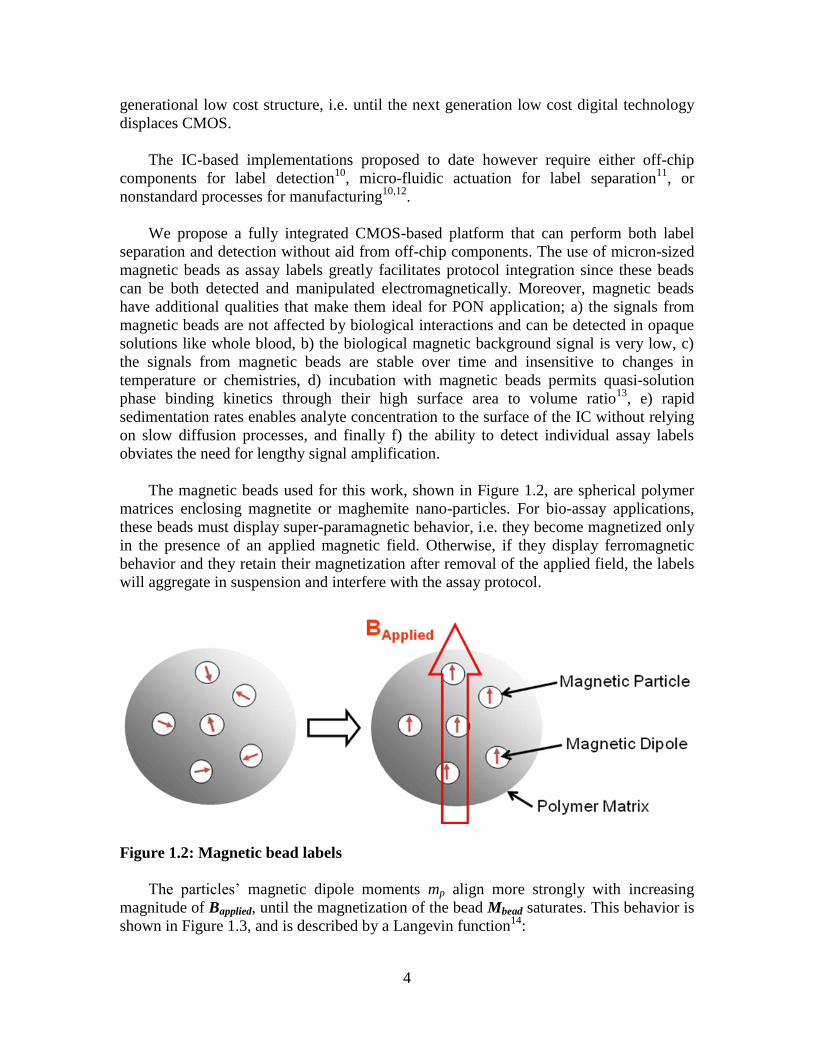
The magnetic beads used for this work, shown in Figure 1.2, are spherical polymer
matrices enclosing magnetite or maghemite nano-particles. For bio-assay applications,
these beads must display super-paramagnetic behavior, i.e. they become magnetized only
in the presence of an applied magnetic field. Otherwise, if they display ferromagnetic
behavior and they retain their magnetization after removal of the applied field, the labels
will aggregate in suspension and interfere with the assay protocol.
Figure 1.2: Magnetic bead labels
The particles’ magnetic dipole moments mp align more strongly with increasing
magnitude of Bapplied, until the magnetization of the bead Mbead saturates. This behavior is
shown in Figure 1.3, and is described by a Langevin function14
:

5
appliedappliedp
appliedp
satBBm
kT
kT
BmM
applied
appliedbead
BBM
coth)( (1)
Msat is the saturation magnetization of the bead, k is the Boltzmann constant, T is the
temperature, and µ0 is the permeability of free space. In Figure 1.3, the measured
magnetization per unit weight of a Dynal M-450 bead is plotted versus the applied
magnetic field15
. Note that the intersection of the curve with the origin implies super-
paramagnetic behavior. For small applied magnetic fields, such as those generated on-
chip, we can linearize about the origin and estimate:
0
)(
applied
appliedbead
BBM
bead (2)
χbead is the susceptibility of the bead medium, which is 1.75 for the M-450 beads for a
small applied magnetic field. This induced bead magnetization will be measured on-chip
and used to detect the presence of a bead.
Figure 1.3: Dynal M-450 magnetization measurements15
Magnetic beads are also effective labels for manipulating bio-chemicals, and have
long been used for separating and purifying target analytes from bulk mixtures. The
general equation of the magnetic force resulting from a magnetic field is given by16
:
appliedapplied BB
o
beadbeadmag
VF
(3)
6
As with all dipoles, the translational force is determined by the product of the applied
field and its gradient. While on-chip generated magnetic fields are limited to the mT
range, the field gradients at the micron scale are on the order of 100mT/m, resulting in
forces on the order of 1pN.
The stage is therefore set for an IC platform that can integrate both separation and
detection of magnetic beads in a fully integrated bio-assay platform.
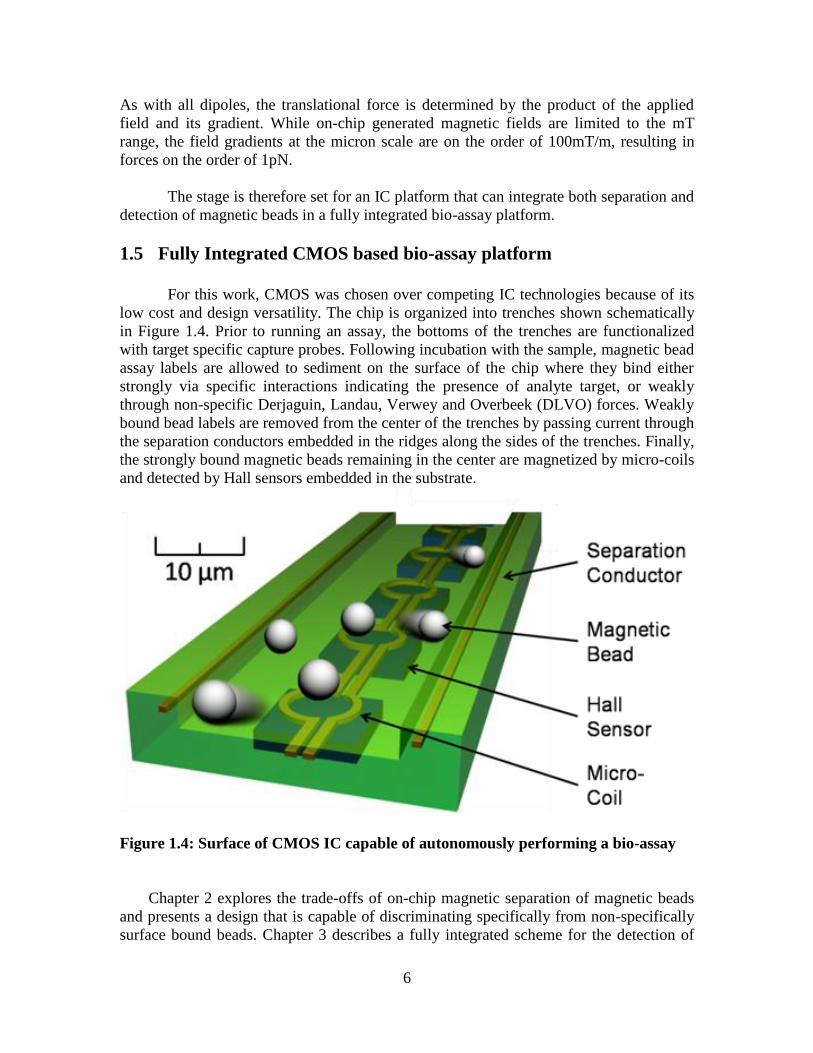
1.5 Fully Integrated CMOS based bio-assay platform
For this work, CMOS was chosen over competing IC technologies because of its
low cost and design versatility. The chip is organized into trenches shown schematically
in Figure 1.4. Prior to running an assay, the bottoms of the trenches are functionalized
with target specific capture probes. Following incubation with the sample, magnetic bead
assay labels are allowed to sediment on the surface of the chip where they bind either
strongly via specific interactions indicating the presence of analyte target, or weakly
through non-specific Derjaguin, Landau, Verwey and Overbeek (DLVO) forces. Weakly
bound bead labels are removed from the center of the trenches by passing current through
the separation conductors embedded in the ridges along the sides of the trenches. Finally,
the strongly bound magnetic beads remaining in the center are magnetized by micro-coils
and detected by Hall sensors embedded in the substrate.
Figure 1.4: Surface of CMOS IC capable of autonomously performing a bio-assay
Chapter 2 explores the trade-offs of on-chip magnetic separation of magnetic beads
and presents a design that is capable of discriminating specifically from non-specifically
surface bound beads. Chapter 3 describes a fully integrated scheme for the detection of
7
surface bound magnetic beads using CMOS. Chapter 4 demonstrates the design and
performance of the first integrated CMOS-based assay platform that combine the
functionalities of the previous two chapters. Chapter 5 will show initial work towards a
low cost, easy to use membrane filtration based sample preparation system that leverages
the functionality of the assay chip.
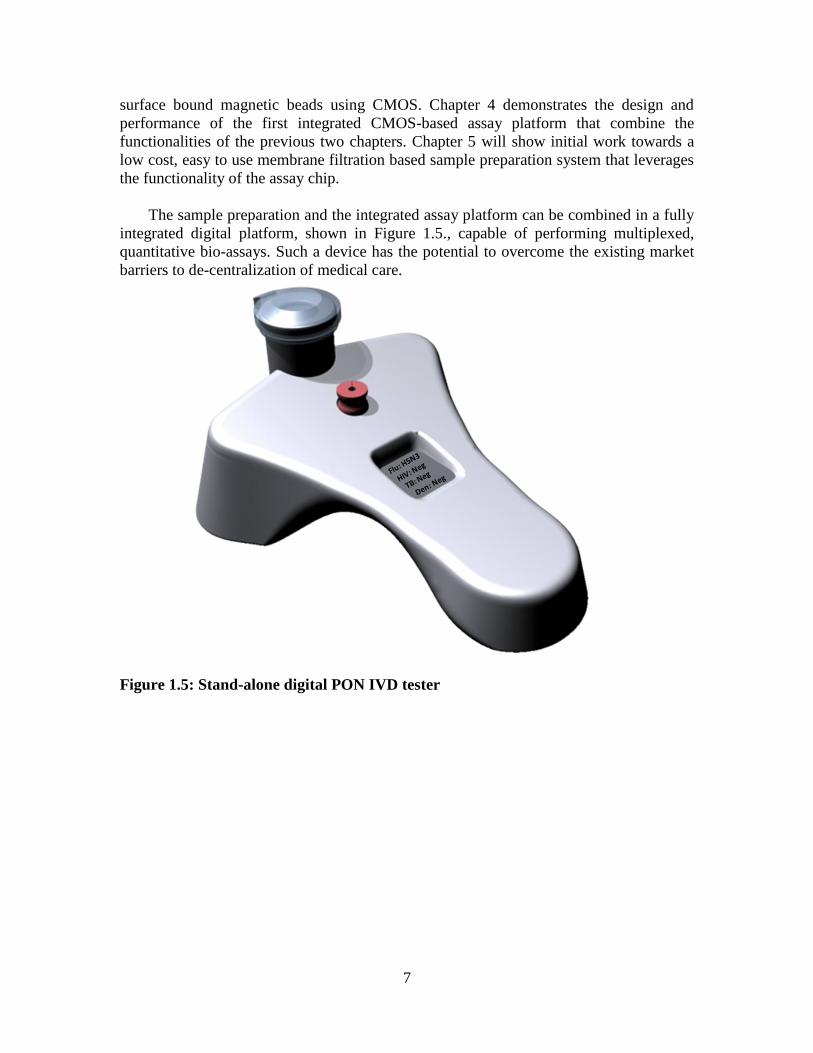
The sample preparation and the integrated assay platform can be combined in a fully
integrated digital platform, shown in Figure 1.5., capable of performing multiplexed,
quantitative bio-assays. Such a device has the potential to overcome the existing market
barriers to de-centralization of medical care.
Figure 1.5: Stand-alone digital PON IVD tester
8
Chapter 2
2 On-chip magnetic bead separation
2.1 Introduction
ICs have been proposed as candidate platforms with which to perform magnetic
bead labeled assays17
. In such assays, specific bio-molecular complexes strongly tether
magnetic beads to the surface of an IC that contains magnetic sensors. Before the
detection of the strongly bound beads can occur, the interfering signal from weakly non-
specifically bound ones must be eliminated. The problem of removing the weakly bound
magnetic particles remains a key hurdle to implementing effective PON IVD platforms.
One possibility consists of using hydrodynamic forces to wash away weakly
bound magnetic bead labels18
. To do so, the IC must be integrated into a micro-fluidic
cartridge, which limits the ease-of-use and adds significantly to the system complexity,
resulting in higher overall system cost.
Another alternative is to use magnetic forces to remove the non-specifically
bound beads from atop the magnetic sensors. Several groups have used external
permanent magnets to generate the magnetic forces to remove the non-specifically bound
beads from the surface of the IC17,19
. However, this off-chip magnetic separation requires
additional handling steps that can complicate the assay protocol and impact ease-of-use.
Lee et al.20
demonstrated a CMOS platform capable of electronically
manipulating individual magnetic beads, but this functionality was never applied to bio-
assay applications.
Osterfeld et al.21
separated magnetic particle labels thermodynamically. Small
50nm magnetic particles labels remained in aqueous suspension unless bound to the
surface of the chip through a complementary bio-chemical interaction. Unfortunately, this
method suffered from two major drawbacks; 1) the slow diffusion processes of the
magnetic particles can lengthen the assay times for high sensitivity applications, and 2)
the use of small particles greatly complicate on-chip detection. This limitation will be
expanded upon in the following chapter.
In this chapter we present an assay cartridge consisting of a gold coated 0.18μm
Complementary Metal Oxide Semiconductor (CMOS) IC capable of generating on-chip
magnetic forces that are used to a) concentrate sedimenting 4.5μm super-paramagnetic
beads over the detection area on the surface of the IC, and to b) remove non-specifically
bound magnetic beads from the detection area22
.
9
The detection range and the sensitivity of a Human immunoglobulin G (IgG)
immuno-assay using on-chip magnetic separation are compared to conventional ELISA.
Additional control assays are performed to quantify the effects of magnetic bead labeling
and the use of gold surface for passive protein adsorption.
2.2 System Overview
The surface of the CMOS IC used to demonstrate on-chip magnetic bead assay
label separation is shown in Figure 2.1. Magnetic beads sedimenting to the gold coated
surface of the IC are initially drawn by magnetic force towards the concentration
conductor through which current flows. The separation conductors are placed along the
upper ridges of trenches etched into the SiO2, above the plane onto which the magnetic
beads settle to eliminating the component of the magnetic force that pulls the beads into
the surface of the IC and that can lead to inconsistent separation performance23
. After
magnetic separation, only the strongly bound beads remain in the center of the trench. For
verification of magnetic separation, the beads in the center of the trench are detected
optically through a microscope and counted.
Figure 2.1: On-chip magnetic separation platform
2.3 System Design
2.3.1 Post Processing and Assembly
The CMOS compatible post processing steps for etching the trenches and for
depositing the layer of gold are depicted in Figure 2.2; the 0.18μm 5 metal layer CMOS
IC has Top Metal features to define the trenches. Single, diced ICs were first mounted

10
onto a 4” holding wafer using a drop of I-line photoresist applied manually with a thin
brush. The photoresist was hard-baked for 1 hour at 120oC. Photoresist from that same
pen was then applied to the areas of the IC that needed to be protected from the RIE
(pads, exposed circuits etc.). The newly applied photoresist was again hard-baked for 1
hour at 120oC. The wafer was placed in the RIE chamber (AutoEtch Plasma Etch System,
Lam Research) to remove the exposed SiO2. The plasma was fired for 20 seconds at a
time, 12 times, with 90 second intervals in between to allow the sample to cool. The Top
Metal features define the trenches while Metal 2 features were used as the etch-stop layer
at the bottom of the. The wafer with the mounted ICs was then dipped in an aluminum
etch for 2 minutes (80% H3PO4, 5% HNO3, 5% CH3COOH, 10% DI, Transene Company,
Inc). The photoresist was stripped using PRS-3000 (J.T. Baker) heated to 90oC. This step
removed the photoresist from the IC and also released the IC from the wafer. Individual
ICs were then rinsed in ethanol followed by DI water and dried. The ICs were then
placed upside down in a 4” machined aluminum wafer shadow mask that had slots for the
ICs on one side and holes exposing the trenches at the center of the IC. This wafer was
placed inside an evaporator (AUTO 306 Vacuum Chamber & EB3 Multi hearth Electron
Beam Source, BOC Edwards) which was pumped down to 10-5
Torr. Then 10nm of Cr
followed by 30nm of Au were deposited through the shadow mask. Figure 2.3 shows an
SEM of the IC after 4.5μm M-450 Dynal magnetic beads were applied in solution and
dried on the surface.
Four 200μm long trenches are etched into the surface of the IC, of 20μm, 24μm,
28μm and 32μm widths. The different widths were used to optimize the performance of
the magnetic separation and minimize the power consumption. The 28μm wide trench
proved most effective since the wider trench required more power to separate magnetic
beads, while the narrower trenches were less effective at magnetic separation; non-
specifically bound beads occasionally accumulated 2 wide along the sides of the narrower
trenches and infringed onto the detection area in the center.
Figure 2.4 shows a micrograph of the CMOS IC with which the on-chip magnetic
concentration and magnetic separation are performed. As in Aytur et al.19
, the ICs are
flip-chip bonded to the bottom of a Printed Circuit Board (PCB) after post processing.
The top of the PCB houses a 150μl well with an aperture at the bottom to allow fluids to
reach the trenches. Duralco 4525 epoxy is flowed via capillary force between the IC and
the PCB to isolate the electrical flip-chip connections from the conductive fluid in the
wells. The PCBs were manufactured by Hughes Electronics and the assembly was
performed at Aspen Technologies (Figure 2.4). After several iterations, a 94%
manufacturing yield was achieved (30 functional parts out of 32), including post-
processing and assembly.
In this work, Dynal M-450, 4.5μm in diameter, super-paramagnetic beads are
used19
. These beads, characterized in Fonnum et al.15
, are spherical polymer matrices
containing 20% maghemite by weight in the form of 8nm particles.
11
Figure 2.2: Cross sectional view of post processing steps of magnetic separation IC
a) Standard 5 metal layer 0.18μm CMOS IC. b) Reactive Ion Etch (RIE) c)
Aluminum wet etch d) Photoresist removal and deposition of Cr followed by Au
through a shadow mask.
12
Figure 2.3: SEM of post-processed IC
Figure 2.4: CMOS IC and assay cartridge. a) Micrograph of 0.18μm CMOS IC with
magnetic bead concentration and separation capabilities. b) Picture of the
assembled device

13
2.3.2 On-Chip Magnetic Concentration
Figure 2.5a shows a cross section of a trench with magnetic bead settling out of
solution due to gravitational forces. Current passing through a concentration conductor
embedded under the center of the trench generates a magnetic force that draws the bead
towards the center. The detection area where beads are optically counted is defined as the
10μm wide strip along the center of the trench. The concentration of magnetic beads to
the detection area confers several advantages: 1) control over the location where the
magnetic beads settle on the IC allows for the application of more precise magnetic
separation forces, to better discriminate between the weakly bound and strongly bound
magnetic beads, 2) by increasing the surface concentration of beads atop the magnetic
sensors, fewer beads can be used, and 3) on-chip magnetic concentration can be used to
pull the magnetic beads directly over magnetic bead sensing elements.
The acceleration of the beads sedimenting to the surface of the IC, asediment, as a
function of time t is given by:
b
draggravity
entsem
FFta
dim , (4)
where the effective mass of the bead in water, mbead = 29pg, and the gravitational force on
a Dynal M-450 bead, Fgravity=0.28pN. The viscous drag force, Fdrag, is expressed as a
function of the sedimentation speed, vsediment(t), by
tvrF entsebeaddrag dim6 , (5)
where the viscosity of water η = 0.89 g/m*s and the radius of the bead rbead = 2.25μm. By
combining Eqs. (4) and (5), we get the following expression for vsediment(t):
t
m
r
bead
gravityentse
bead
bead
er
Ftv
6
dim 16
(6)
The time constant of acceleration time constant τ = mbead/6·π·η·rbead is approximately
0.7μs, so we can approximate Eq. (6) by:
bead
gravityentse
r
Ftv
6dim (7)
According to Eq. (7), the 4.5μm beads settle out of solution to the surface of the IC at a
rate of approximately 0.4mm/min. It is important to note that the steady state
sedimentation rate is proportional to the square of the radius of the bead. Therefore, the
size of the magnetic beads is an important factor for application where long assay times
are unacceptable.
14
The magnetic beads approaching the surface of the IC are pulled towards the
concentration conductor embedded on-chip. The magnetic force, Fmag, on a super-
paramagnetic bead with susceptibility χbead and radius rbead from current Isep passing
through a straight conductor at a distance xbead is derived in Shevkoplyas et al.24
;
3
23
3 bead
sepbeadbeado
magx
IrF
. (8)
The concentration conductors are implemented in Metal 1 and placed 0.75μm underneath
the detection area in the center of the trenches. During the magnetic bead concentration
process, 2mA flowing through the 2μm wide concentration conductors pulls the beads
towards the detection area with a force of approximately 0.2pN from a distance of xbead =
4μm (Figure 2.5a). The magnetic force decays with the cube of the distance from the
bead to the concentration wire, so long range on-chip magnetic concentration is not
possible, i.e. for xbead >100µm. Rather, gravity is used to bring beads to the surface of the
IC and on-chip magnetic concentration is used to guide those beads to the detection area.
Stronger currents resulted in more non-specific interactions at the surface of the IC.
2.3.3 On-Chip Magnetic Separation
After concentration, the non-specifically or weakly bound beads in the detection
area are pulled aside by a magnetic force generated by current passing through a
separation conductor embedded along the upper ridges of the trenches, as shown in
Figure 2.5b. Note that the negative z-component of the magnetic force that would
normally pull the magnetic beads into the surface of the IC is eliminated. For the 28μm
wide trench, the distance between the center of the trench and the center of the separation
conductor is 18μm.
To perform an immuno-assay, the magnetic forces must be sufficiently strong to
pull the non-specifically bound beads to the side of the trench (i.e. > 0.1-10pN)18
, away
from the detection area, but not overly strong so as to remove the immunologically bound
ones (i.e. < 60pN)25
. According to Eq. (8), 50mA of current flowing through the
separation conductors pulls a magnetic bead resting in the center of the trench with 1.1pN
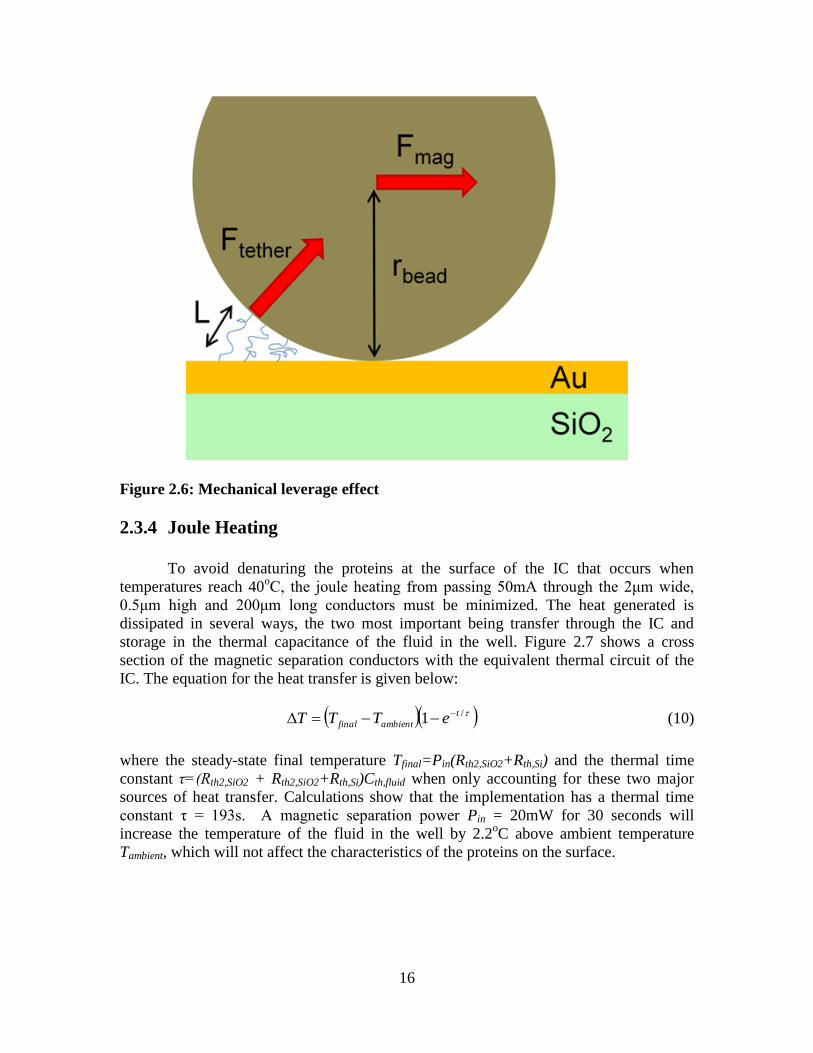
of force. However, since the beads are pivoting on the surface of the IC as they roll, the
magnetic separation force on the last molecular tether is amplified by the mechanical
leverage effect resulting from the difference in lengths of the moment arms of the
molecular tether and the separation force18
(Figure 2.6). The expression of Ftether the force
on the last molecular tether of length L is given by:
L
rFF bead
magtether2
, (9)
In this case, the longest possible non-specific tether consists of 3 cross-reactive
antibodies, which total 25.5nm in length26
. The 1.1pN lateral magnetic force translates
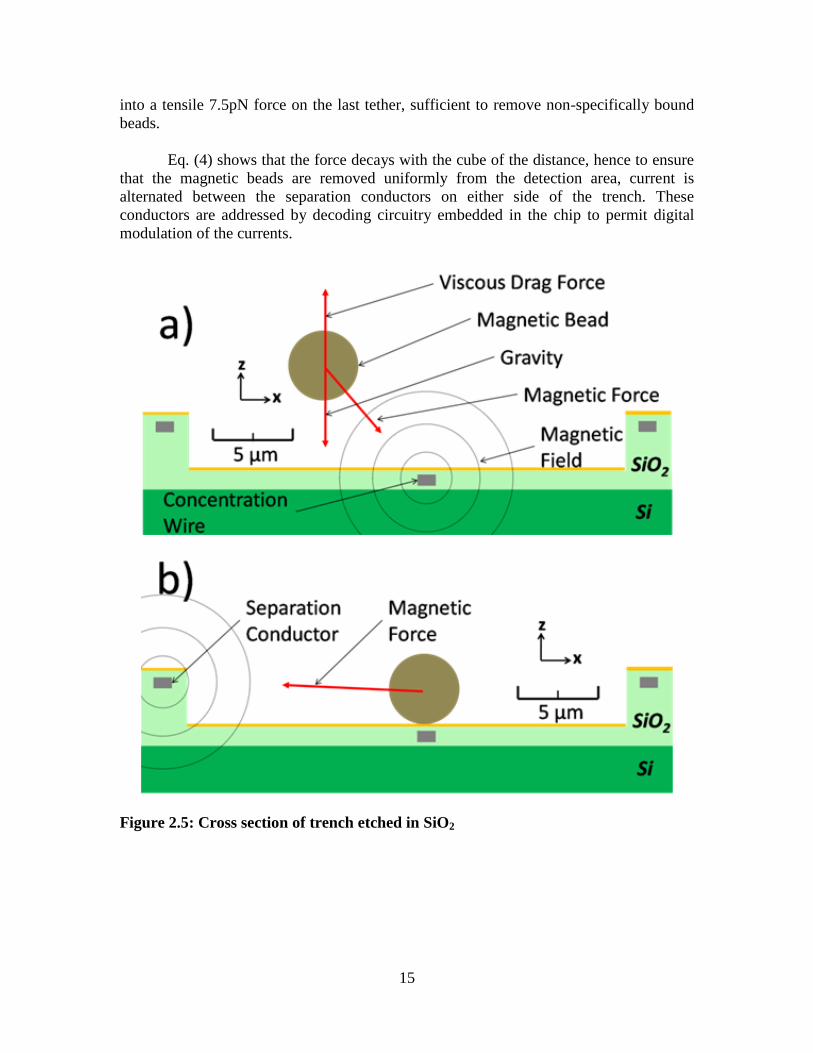
15
into a tensile 7.5pN force on the last tether, sufficient to remove non-specifically bound
beads.
Eq. (4) shows that the force decays with the cube of the distance, hence to ensure
that the magnetic beads are removed uniformly from the detection area, current is
alternated between the separation conductors on either side of the trench. These
conductors are addressed by decoding circuitry embedded in the chip to permit digital
modulation of the currents.
Figure 2.5: Cross section of trench etched in SiO2
16
Figure 2.6: Mechanical leverage effect
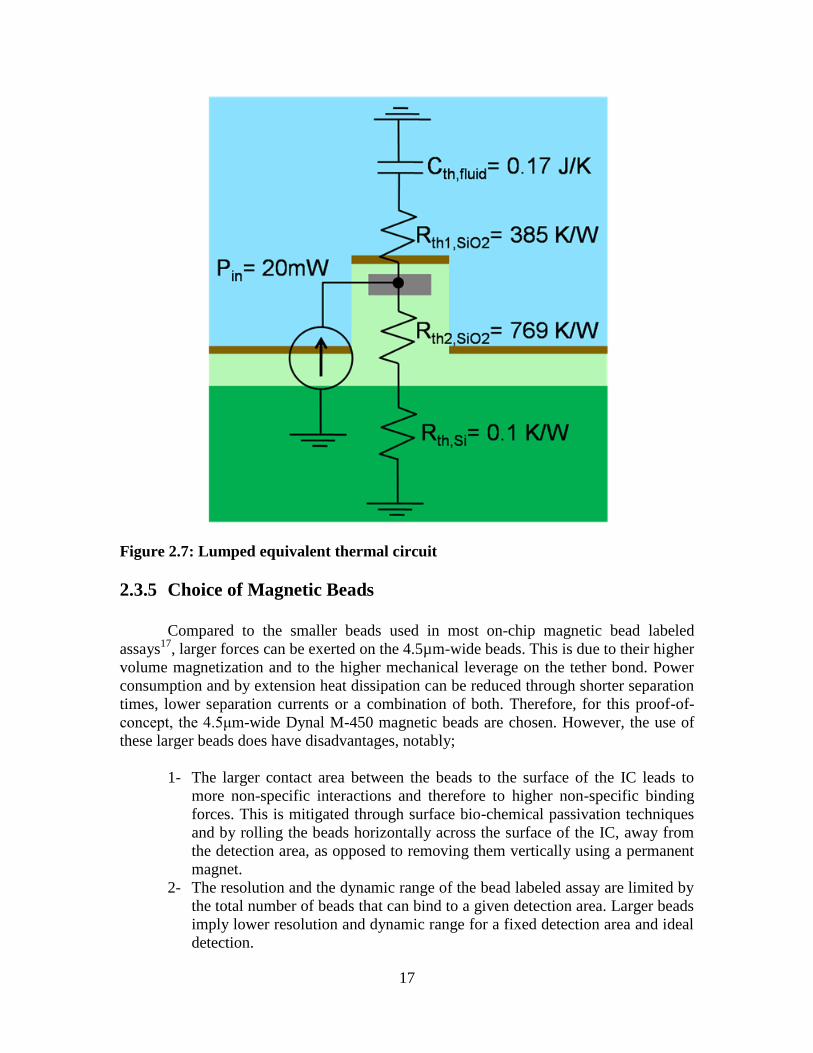
2.3.4 Joule Heating
To avoid denaturing the proteins at the surface of the IC that occurs when
temperatures reach 40oC, the joule heating from passing 50mA through the 2μm wide,
0.5μm high and 200μm long conductors must be minimized. The heat generated is
dissipated in several ways, the two most important being transfer through the IC and
storage in the thermal capacitance of the fluid in the well. Figure 2.7 shows a cross
section of the magnetic separation conductors with the equivalent thermal circuit of the
IC. The equation for the heat transfer is given below:
/1 t
ambientfinal eTTT (10)
where the steady-state final temperature Tfinal=Pin(Rth2,SiO2+Rth,Si) and the thermal time
constant τ=(Rth2,SiO2 + Rth2,SiO2+Rth,Si)Cth,fluid when only accounting for these two major
sources of heat transfer. Calculations show that the implementation has a thermal time
constant τ = 193s. A magnetic separation power Pin = 20mW for 30 seconds will
increase the temperature of the fluid in the well by 2.2oC above ambient temperature
Tambient, which will not affect the characteristics of the proteins on the surface.
17
Figure 2.7: Lumped equivalent thermal circuit
2.3.5 Choice of Magnetic Beads
Compared to the smaller beads used in most on-chip magnetic bead labeled
assays17
, larger forces can be exerted on the 4.5µm-wide beads. This is due to their higher
volume magnetization and to the higher mechanical leverage on the tether bond. Power
consumption and by extension heat dissipation can be reduced through shorter separation
times, lower separation currents or a combination of both. Therefore, for this proof-of-
concept, the 4.5μm-wide Dynal M-450 magnetic beads are chosen. However, the use of
these larger beads does have disadvantages, notably;
1- The larger contact area between the beads to the surface of the IC leads to
more non-specific interactions and therefore to higher non-specific binding
forces. This is mitigated through surface bio-chemical passivation techniques
and by rolling the beads horizontally across the surface of the IC, away from
the detection area, as opposed to removing them vertically using a permanent
magnet.
2- The resolution and the dynamic range of the bead labeled assay are limited by
the total number of beads that can bind to a given detection area. Larger beads
imply lower resolution and dynamic range for a fixed detection area and ideal
detection.
18
2.3.6 Chip and Bead Surface Bio-Functionalization
The bio-chemical sensitivity of the on-chip protocol is determined by assaying
known concentration of purified Human IgG. Figure 2.8 depicts the nature of the
immunological sandwich capture complex immobilizing the beads to the detection area.
The steps to coat the surface of the chips are enumerated below;
1. The gold surface is first coated with surface antibodies, polyclonal goat
IgG specific to the Fab region of Human IgG (Sigma Aldrich).
2. The surface is then bio-chemically passivated with non-fat dried milk
(NFDM).
3. Varying dilutions of the Human IgG (Sigma Aldrich) antigen are
introduced onto the chip.
4. The primary antibody, a biotinylated monoclonal goat IgG specific to Fc
region of Human IgG (Sigma Aldrich) is incubated.
Meanwhile, the surface of the streptavidin coated 4.5μm Dynal bead labels are
passivated by a solution of PBS with NFDM and Bovine Serum Albumin (BSA, Sigma
Aldrich).
Once both the bead and chip surface are bio-functionalized, the assay protocol
described in Section 2.2 can begin.
2.3.7 Control Assays
The on-chip assay conjugation immuno-chemistry presented in this work differs
from that of conventional ELISAs in two ways; 1) ELISAs use enzymatic labels that
catalyze a phosphorescent substrate while the on-chip assays use magnetic bead labels,
and 2) ELISAs are performed on polystyrene surfaces, while the on-chip assays are
performed on the gold coated IC. Several sets of control assays are performed to quantify
the effects of these variables;
1. Conventional ELISAs on polystyrene 96 well plates are used as the
baseline for evaluating the performance of all of the assays.
2. ELISAs on gold coated silicon slides are used to determine the
performance of assays run on gold surfaces versus assays run in
polystyrene wells.
3. A standard magnetic bead labeled assay is used to determine the
performance of magnetic bead labeling versus enzymatic labeling.
Nonspecifically bound beads are removed with a permanent magnet. In
this control, Dynal M-280 2.8μm-wide magnetic beads were used rather
than Dynal M-450 4.5μm-wide beads, since the latter aggregate when
magnetically separated using a permanent magnet due to the strong fringe
magnetic fields.

19
Figure 2.8: Surface bio-chemistry
2.4 Assay Protocols
2.4.1 Polystyrene Control ELISA
All proteins were diluted in PBS unless otherwise specified. Conventional
ELISAs on a polystyrene surface were performed in a 96-well polystyrene plate. Wells
were incubated with 100μl of anti-Human Fab-specific IgG manufactured in goat (Sigma
Aldrich) for 3 hours at room temperature, at a concentration of 5.3μg/ml. The solution
was then discarded, and the wells blocked with 120μl of 0.3% NFDM for 16 hours at
4C. Wells were then washed 3X in 200 μl of 0.50 PBS-Tween, and cleaned wells were
incubated with 100μl of purified Human IgG (Sigma Aldrich) for 1 hour at room
temperature. Ten-fold dilutions of purified Human IgG were tested ranging from 1mg/ml
down to 100pg/ml along with a no-IgG control. After incubation with Human IgG wells
were washed 4X in PBS-Tween, then incubated with 100μl of 500ng/ml biotinylated
anti-Human Fc-specific IgG manufactured in goat (Sigma Aldrich) for 1 hour at room
temperature. This was followed by another 4X wash in PBS-Tween. Wells were then
incubated with 100μl of 2.8 μg/ml streptavidin-linked alkaline phosphatase (Pierce
Biotech) diluted in PBS-Tween for 1 hour. After washing the wells 5X with PBS-Tween,
100μl of para-nitrophenyl phosphate (pNPP, Pierce Biotech) were added to each well in
quick succession, and the catalytic reaction was allowed to progress for 1 hour. At this
point the reaction was halted with 100μl of 3M NaOH, and the plates were read on a
BioTek EL808 ELISA reader at a wavelength of 405 nm.
20
2.4.2 Gold Surface Based Control Assay Preparation
Experiments performed on gold surfaces were performed by cutting gold-coated
silicon wafers into slides. The resulting slides were washed gently with 100% ethanol
and rinsed with DI water, then blown dry. Cleaned slides were affixed onto a 16-well
ProPlate Multi-Array Slide Module (Grace Bio-Labs). Wells were filled with 130μl of
anti-Human Fab-specific IgG manufactured in goat (Sigma Aldrich) for 3 hours at RT at
a concentration of 5.3μg/ml, then blocked with 150μl of 0.3% NFDM for 16 hours at
4C. The wells were then washed 3X in PBS-Tween and incubated with 130μl of
purified Human IgG (Sigma Aldrich). Eight separate wells were used for each serial 10-
fold dilution of Human IgG, ranging from 1μg/ml to 100pg/ml with a dilution factor of
1/10 for 5 aliquots total. After washing 4X in PBS-Tween, the wells were incubated with
100μl of 500 ng/ml biotinylated anti-Human Fc-specific IgG manufactured in goat
(Sigma Aldrich) for 1 hour at RT. A 4X PBS-Tween wash prepared the samples for
either a gold-surface ELISA or a bead-count assay.
2.4.3 Gold Surface Based ELISA Labeling and Detection
Samples were incubated with 130μl of 2.8μg/ml streptavidin-linked alkaline
phosphatase (Piece Biotech) diluted in PBS-Tween for 1 hour. After washing the wells
5X in PBS-Tween, 130μl of pNPP were added to each well in quick succession and the
catalytic reaction was allowed to progress for 1 hour. 100μl of the fluid was then pipetted
quickly to a 96-well polystyrene plate and the reaction was halted with 100μl of 3M of
NaOH so that it could be read in a BioTek EL808 ELISA reader at a wavelength of
405nm.
2.4.4 Magnetic Bead Based Control Assay Labeling and Detection
Streptavidin-coated paramagnetic 2.8μm (M-280 Dynabeads, Invitrogen) were
blocked at a 1:1:1:7 proportion of beads:0.5% NFDM:0.5% BSA:PBS for 3 hours on
slow rotation to keep the beads in continual suspension. The beads in blocking solution
were then diluted by a factor of 2/5, so that the final concentration of beads was 1/25 of
the original stock solution. 100 μl of this solution was pipetted into the wells in sets of 8,
and the beads were allowed to settle for 10 minutes before they were washed with a row
of 6/16-inch neodymium rare-earth block magnets (K&J Magnetics) attached side-to-
side, with magnetic poles directed up and down. The row of magnets was gently slid
back and forth over the tops of the wells 3 times, then allowed to rest for 2 minutes to
remove the nonspecifically-bound beads. The magnets were then moved aside to trap the
freshly washed to the side of the ProPlate well, and 3 non-overlapping pictures
corresponding to 1mm2 were taken in the centre of each well at 200X magnification using
a CCD camera (Micromanipulator Co. Inc., Moticam Inc.). The beads present in the 3
pictures from each well were counted and added together automatically using a MatLab
application.
21
It is important to note that the beads used in this control assay were 2.8μm Dynal
M-280 rather than the 4.5μm Dynal M-450 beads used for the on-chip assay. The 4.5μm
beads produce strong fringe force fields when exposed to the magnetic washing field
from a permanent magnet, resulting in aggregation of large numbers of beads and
invalidation of the assay. Nonetheless, the 2.8μm beads give a reasonable indication of
the performance of bead based assay labeling.
2.4.5 On–Chip Purified Human IgG Assay
Streptavidin-coated 4.5μm (M-450 Dynabeads Invtrogen) were blocked in a 1:1:8
solution of beads:5% NFDM:PBS for 3 hours on slow rotation. The PCB wells were
incubated with 100μl of anti-Human Fab-specific IgG manufactured in goat (Sigma
Aldrich) for 3 hours at room temperature, at a concentration of 5.3μg/ml. The solution
was then discarded, and the wells were blocked with 120μl of 0.3% NFDM for 16 hours
at 4C and then washed 3X with 200μl of 0.05% PBS-Tween. Experiments with different
aliquots of Human IgG and were performed serially on a single device, starting with the
negative control, to minimize the total number of devices needed. For the negative
control aliquot, 100μl of 0ng/ml of Human IgG was introduced into the well and
incubated for 1 hour at room temperature. After incubation, wells were washed 4X in
PBS-Tween, then incubated with 100μl of 500 ng/ml biotinylated anti-Human Fc-specific
IgG manufactured in goat (Sigma Aldrich) for 1 hour at room temperature. This was
followed by another 4X washing step in PBS-Tween. 40μl of a 1/50 dilution of blocked
streptavidin 4.5μm beads were added to the wells and let settle for 2.5 minutes with 2mA
of current flowing through the concentration line. Afterwards, the magnetic washing
conductors on alternating sides of each trench were pulsed with 50mA of current at 0.3Hz
for 30 seconds. A picture of the 28µm trench was taken and the number of beads left in
the detection area was visually counted.
After the negative control, the well was washed 3X with PBS-T to remove all the
beads from the surface of the IC. The next dilution of Human IgG was introduced into the
well in increasing order, from 1ng/ml to 100ng/ml in 10-fold increments, and the assay
protocol was resumed from the aliquot incubation step. This procedure was repeated
three times until all the aliquots were assayed. Saturation of the antibodies at the surface
of the IC was not observed since the number of beads remaining bound to the center of
the trench increased with Human IgG titer.
2.5 Results
2.5.1 Control Assays
Standard curves for serial 10-fold dilutions of purified Human IgG from 1μg/ml
to 100pg/ml were produced using conventional ELISA on polystyrene, ELISA on gold
and the off-chip magnetic bead labeled assay. The experiment at each dilution was
repeated 8 times and the error bars correspond to +/- 1SD. Figure 2.9 shows the
comparison of the biochemical sensitivity and dynamic range of the three protocols. The
22
conventional ELISA had a sensitivity limit of 10ng/ml, with an upper detection range at
100ng/ml. ELISA on gold performed better; concentrations down to 1ng/ml were
detected reliably with an upper detection range of 100ng/ml. A possible explanation for
the improved performance may be that gold surfaces have better passive protein
adsorption properties than polystyrene surfaces. The Dynal M-280 bead labeled assays
performed similarly to ELISA on gold, with a sensitivity limit of 1ng/ml and an upper
detection maximal at 100ng/ml.
Of importance, the ratio of the 100ng/ml signal to its respective negative control
for the magnetic bead based assays was over twice higher than the ELISAs, and the linear
dynamic range of the bead assays extended to lower concentrations, suggesting that
superior quantitative resolution can be achieved through magnetic bead labeling.
Due to the shorter antigen incubation time (1 hour versus 16 hours), the
sensitivities of the control assays presented in this work are below those presented in
Aytur et al., 2006. These results are nonetheless consistent with rapid, compact,
commercially available ELISA protocols27
.
2.5.2 Magnetic Bead Sedimentation and Concentration
The measured settling rates for the M-450 magnetic beads and the M-280 beads
settled were 0.32mm/min and 0.07mm/min respectively. Figure 2.10 shows the time
lapse micro-graphs of the 28μm by 200μm trench, taken over 2.5 minutes, as M-450
beads sedimented to its surface. The concentration conductors had 2mA of current
flowing through them to pull the beads to the 10μm wide detection area delineated by the
shaded rectangle. In 4 experiments without magnetic concentration, only 36% of the
beads landing in the trench landed in the detection area, close to the a priori ratio of the
detection area to the area of the entire trench. On the other hand, in 4 experiments where
2mA of current flowed through the magnetic concentration conductor, the proportion of
beads landing in the detection area increased to 55%. Table 3.1 presents the concentration
statistics. Higher magnetic concentration forces resulted in more efficient magnetic bead
concentration but the use of currents in excess of 2mA led to stronger non-specific
interaction between the beads and the surface of the trenches, leading to a loss in assay
sensitivity. This effect may be mitigated through better surface functionalization
techniques discussed in Section 5.6.3.
Total Number of Beads that
Settled in Detection Area
Proportion of Beads that Settled
in the Detection Area
Number Std. Dev. % Std. Dev.
Without Magnetic
Concentration
21.75 1.5 36.4% 0.06%
With Magnetic
Concentration
28.75 4.7 55.3% 0.08%
Table 2.1: Magnetic concentration results for the 28um wide trench
23
Figure 2.9: Control assays results
2.5.3 On-Chip Magnetic Bead Separation
The on-chip magnetic separation was started immediately after the 2.5 minutes
needed for the magnetic beads to settle. The few beads that had not settled prior to the
magnetic separation were simply pulled towards the magnetic separation conductors,
away from the detection area in the center of the trench. Figure 2.11 shows the
micrographs of a trench before (left) and after magnetic separation (right) for 0ng/ml,
1ng/ml and 10ng/ml concentrations of purified Human IgG antigen.
A separation current of Isep = 50mA for a duration of tsep = 30 seconds was needed
to remove all the non-specifically bound beads from the detection area for the negative
control. To ensure that the beads were removed symmetrically from the center of the
trench, Isep was digitally alternated between the left and right separation conductors at a
frequency fsep = 0.3Hz. Force modulation frequencies over 1Hz were not effective for
removing beads from the center of the trench since inertial forces high pass filter the
motion of the beads. Frequencies below 0.1Hz were also less effective since there were
fewer number of transitions in the direction of the magnetic force that “loosen” the non-
specifically bound beads through high loading forces. For Isep = 50mA the separation time
was limited to 30 seconds after which time no bead displacement was observed.
24
Figure 2.10: On-Chip magnetic bead concentration
Figure 2.11: On-chip magnetic bead separation
25
The 28μm wide trench was optimal for assays; wider trenches required higher
separation currents resulting in higher power dissipation, while in narrower trenches,
aggregation of the 4.5μm beads along the sides of the trenches overflowed into the
detection area.
2.5.4 On-Chip Human IgG Assay Results
The standard curves for 10-fold dilutions of purified Human IgG from 100ng/ml
to 1ng/ml and one negative control were produced using on-chip magnetic separation.
Figure 2.12 presents the results from two independent on-chip assay experiments,
performed on separate days, while Figure 2.13 shows the comparison between the
conventional ELISA on polystyrene and the average of the two on-chip assays. Purified
Human IgG was detectable down to concentrations of 1ng/ml, or 7pM, with a correlation
factor of 0.995 to the ELISA. The on-chip assay sensitivity is higher than conventional
ELISAs in spite of a much smaller assay surface area; one 28μm by 200μm trench for the
on-chip protocol as opposed to 97mm2 for the ELISA. The strong correlation to ELISA
suggests that on-chip magnetic bead separation does indeed have the ability to separate
specifically bound magnetic bead labels from non-specifically bound ones. For
confirmation and to eliminate the variability in the total number of beads that land on the
surface of the trench, Figure 2.14 presents the bead binding effectiveness, i.e. the
percentage of beads remaining in the detection area after magnetic separation for
different IgG concentrations. It is interesting to note that while the standard curves
individually correlate very well with ELISA, they are offset from each other, suggesting
that there is high variability assay run to run. The causes of these inconsistency and
possible mitigating factors will be further explored in Section 4.5.3.
This magnetic bead separation scheme cannot discriminate between beads bound
to the surface of the IC through one or more specific immunological interactions, since
the molecular tethers are disrupted one at a time as the beads roll of the center of the
trench. This limitation results in a compressed detectable dynamic range but does not
impact detection sensitivity. To acquire bond multiplicity information, the beads must be
pulled vertically using a permanent magnet or Atomic Force Microscope tip17
.
Nonetheless, the high sensitivity, the low cost and the ease-of-use of on-chip
magnetic bead separation technology makes it a viable candidate for PON IVD use.
26
Figure 2.12: On-chip assay results
Figure 2.13: Comparison of the average of the 2 on-chip assays with ELISA on
polystyrene
27
Figure 2.14: Relative on-chip magnetic bead separation performance
2.6 Conclusion
We have successfully demonstrated on-chip magnetic separation of 4.5μm super-
paramagnetic beads weakly bound to the surface of a CMOS IC for integrated molecular
analysis. Magnetic beads sedimenting via gravity to the surface of the IC were first
concentrated to the 10μm wide detection area in the center of a 28μm wide by 200μm
long trench etched in the SiO2. The proportion of beads landing in the detection area rose
from 36% without magnetic concentration to 55% with magnetic concentration. After
sedimentation, the non-specifically bound beads were removed from the detection area by
a magnetic force generated by passing 50mA of current through conductors embedded
along the ridges of the trench, 18μm away. To ensure proper removal of the non-
specifically bound beads from the detection area, the separation current was digitally
alternated between the two ridges at a frequency of 0.3Hz for 30 seconds. Due to
mechanical leveraging, a 1.1pN lateral magnetic force translated into tensile 7.5pN on the
bio-chemical tether immobilizing the bead. This on-chip magnetic separation
functionality was applied to an immuno-assay on purified Human IgG samples and
concentrations down to 1ng/ml or 7pM were detectable, with a correlation factor of 0.995
to standard ELISA. On-chip magnetic separation was shown to be a versatile alternative
to conventional fluidic washing of assay labels. While the detection of the magnetic bead
labels was performed optically, the next chapter will demonstrate a fully integrated
magnetic bead detection system that can readily be integrated with the on-chip magnetic
separation functionality.
28
Chapter 3
3 On-Chip Detection of Magnetic Beads
3.1 Introduction
The pioneering work on IC-based magnetic bead detection systems used Giant
Magneto-Resistive (GMR) technology in combination with off-chip electro-magnets12
.
Later implementations obviated the need for external electro-magnets, but continued to
employ magneto-resistive technologies28,29
.
Similarly to the early works using GMR, the first CMOS bead detection systems
relied on one or more external electromagnets14,19
. More recently, Wang et al.11
presented
a fully integrated CMOS platform consisting of on-chip planar coils whose inductance
changed in response to the number of magnetic beads on its surface. However, this
scheme could not easily be combined with on-chip magnetic separation since the size of
the large coils would make removing the beads from their centers difficult, and more
importantly since the magnetic beads pulled aside would add significantly to the
background signal.
We present a fully integrated system capable of detecting single super-paramagnetic
beads using CMOS that can be readily combined with the magnetic separation presented
in the previous chapter30
. The external electromagnets that polarize the beads are
integrated on-chip with the Hall sensors necessary for detection.
3.2 System Overview
In the detection system shown in Figure 3.1, an individual 4.5µm super-
paramagnetic bead, immobilized by a specific bio-chemical tether to the surface of the
CMOS IC, is magnetized by an applied magnetic field generated by current passing
through an on-chip micro-coil. The induced bead magnetization field signal is electrically
transduced by a planar n-well Hall sensor sensitive to vertical magnetic fields (i.e. in the
z-direction), and amplifier on-chip. The current through the micro-coil is digitally
modulated above the sensor and back-end circuit 1/f noise corner. For maximum signal,
the distance between the Hall sensor and bead is reduced using the post-CMOS etch steps
detailed in Section 2.3.1.
29
Figure 3.1: a) 3-Dimensional representation of a 4.5µm bead above a Hall
sensor/micro-coil pair, b) Micrograph top view of two Hall sensor/micro-coil pairs
3.3 System Design
3.3.1 Bead Magnetization Calculations
The integrated micro-coil that is used to magnetize the bead consists of a single
current loop of inner radius a = 2.1um and a line width w = 0.5um, implemented in the
lowest CMOS metallization layer. The z-component of the coil’s applied magnetic field,
Bapplied(z), can be described by the off-axis field of a current loop31
:
222
)(zra
IzB coilo
applied
kK
arzra
zrakE
422
222
(11)
where μo is the permeability of free space, Icoil is the current through the coil, r is the
distance from the center of the coil to the point of observation, E(k) and K(k) are the
complete elliptical integral functions of the 1st and 2
nd kind and k is given by:
30
22
4
zra
rak
(12)
According to Eqs. (11) and (12), 16mA of current through the micro-coil produces a
magnetic field Bapplied(bead) = 791µT at the center of the bead and a field Bapplied(Hall
sensor) = 1.7mT at the Hall sensor.
The bead magnetization vector field Bbead resulting from the applied magnetic field
Bapplied(z) is modeled by a perfect dipole moment14
:
5
3
4
1
r
beadbead
bead
mrrrmrB
(13)
r is the vector from the point of observation to the center of the bead, as shown in Figure
3.2. The bead’s volume magnetization is given by zmbead )(zBV appliedbeadbead . The z-
component of the applied magnetic field can be extracted from Eq. (13) and expressed as
a scalar:
222
2
222
2
2/3222
0, cossin2
)(4),,(
zyx
za
zyx
z
zyx
mzyxB bead
zbead
(14)
For Bapplied(zbead)=1.7mT, Eq. (14) estimates the z-component of the induced
magnetization field to be Bbead,z(Hall sensor)=54uT across the contacts of the Hall sensor.
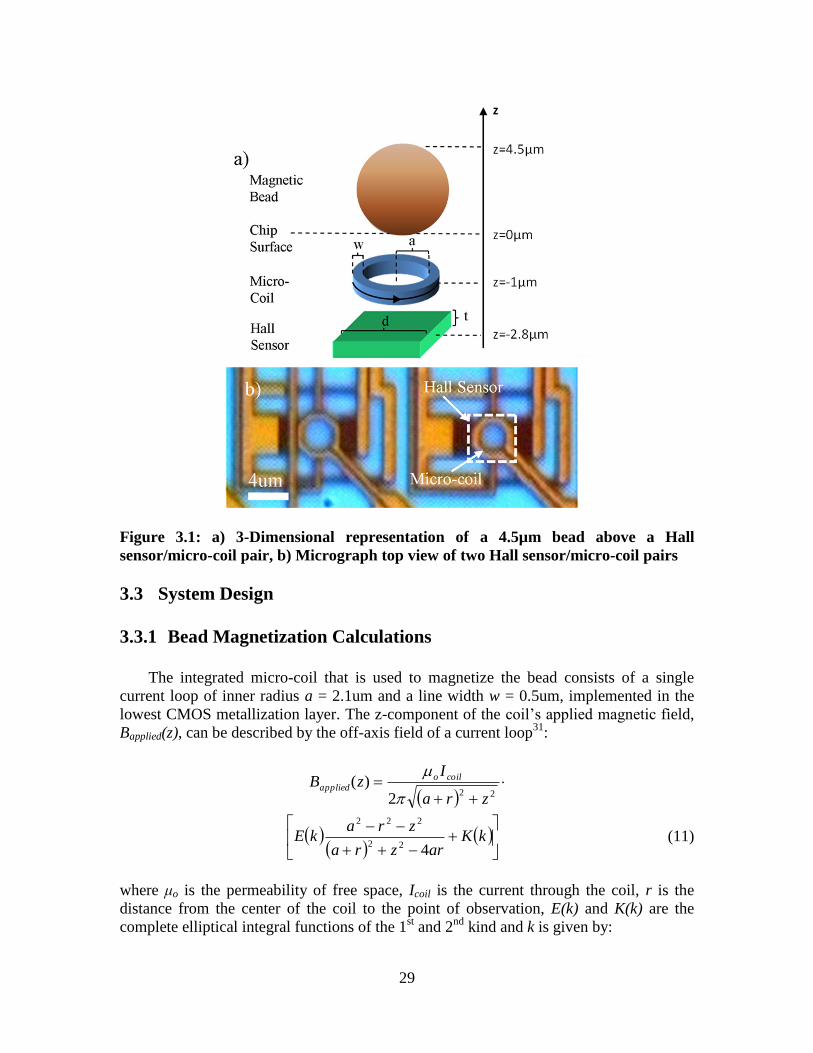
Figure 3.2: Bead magnetization dipole
31
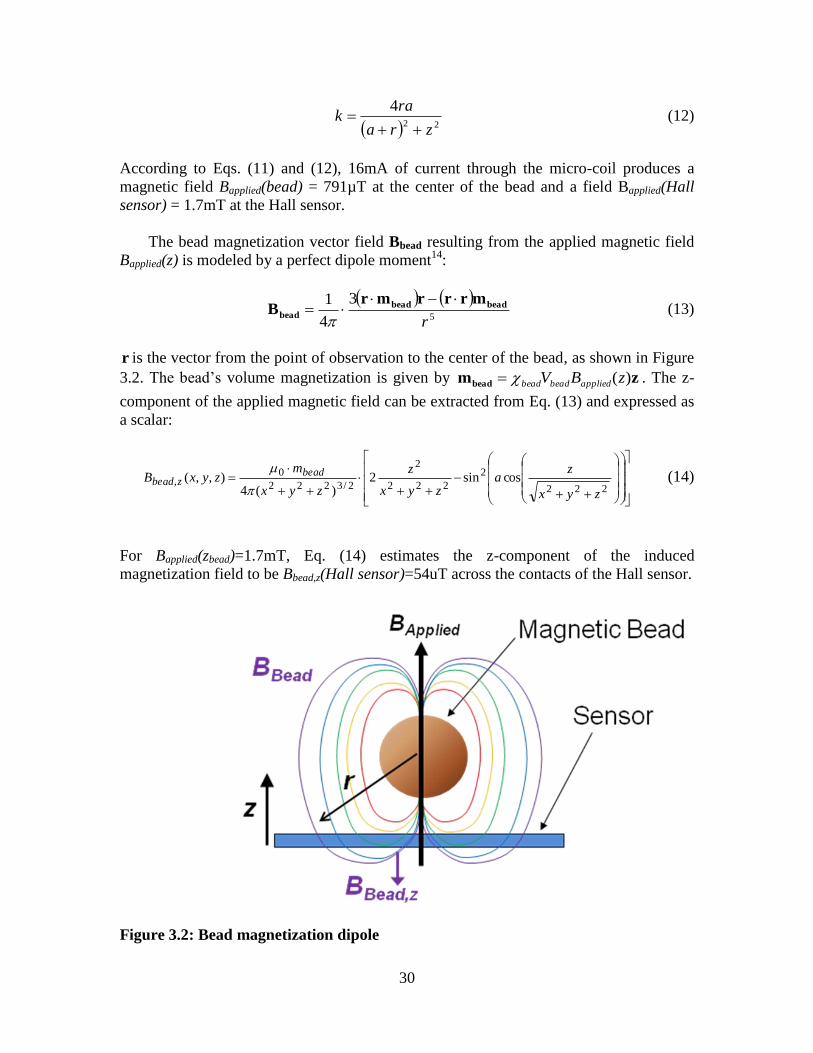
According to Eq. (14), the bead magnetization field decays with the cube of the
distance r, so the dielectric layer above the Hall sensor/micro-coil pair is etched back
using the same procedure described in the previous chapter. After post processing, the
distance is from the sensor plane to the center of the bead is reduce to 5.3µm.
The intensity of the z-component of Bbead versus lateral position in the plane of
the sensor is plotted in Figure 3.3 using Eq. (14). The highly localized nature of the bead
magnetization field implies that to obtain maximal Signal-to-Noise Ratio (SNR) the
magnetic field detector must be as small as possible.
Figure 3.3: z-Component of the bead magnetization field at the Hall sensor plane
3.3.2 Bead Detection
The bead magnetization field is transduced by a cross shaped Hall sensor, shown in
Figure 3.4, implemented in a 1µm-deep n-well diffusion with a sheet resistance of
800Ω/. Current flowing from VDD to ground in the presence of a magnetic field, results
in a Hall Effect voltage across contacts A and B. The equation for the Hall sensor voltage
VH as a function of the z-component of the magnetic field is given by:
z
Hall
HallDDHHH B
L
WVGV (15)
WHall and LHall are the width and length of the Hall plate, and the Hall mobility µH =
700cm2/V·s. GH is the geometric factor of the Hall sensor, and is dependent on the length,
Bz x y( )10000000 mbead
4 x2
y2
zHall_bead2
3
2
2zHall_bead
2
x2
y2
zHall_bead2
sin acoszHall_bead
x2
y2
zHall_bead2
2
B z
Bbead,z(zHall
)
(μTesla)
y-position (m)
x-position (m)

32
the width and the size of the contacts32
. GH decreases with the ratio of the length to the
size of the contacts and since the minimum contact size is limited by process constraints
to 0.18µm on a side, the Hall sensor cannot be made arbitrarily small. In this
implementation, the Hall sensor is 5.8µm long by 5µm wide with a geometric factor GH ~
0.8 and a calculated Hall sensitivity SV = 2.9%/T. The measured Hall sensor sensitivity is
2.7%/T for an input voltage of 2V and bias current of 2.2mA. The output impedance
between contacts A and B is approximately 800Ω, while the total output impedance is
1kΩ including NMOS addressing switches, which corresponds to a 4nV/√Hz output
thermal noise.
3.3.3 Back-End Electronics
The main difficulties with detecting the bead magnetization field are listed here; 1)
the small 54uT bead magnetization field corresponds to ~1uV at the output of the Hall
sensor, 2) the presence of low frequency 1/f noise, 3) the Hall sensor offset voltage
σos=5mV (sample size = 16), and 4) the applied magnetic field is 31 times larger than the
in-phase induced bead magnetization field.
Figure 3.4: n-well Hall Sensor
33
The weak output signal from the Hall sensor is amplified by a three stage Backend
Amplifier (BA) providing 60dB of gain, with 4nV/√Hz of input referred thermal noise,
50kHz 1/f noise corner. The first stage of the BA consists of a low noise pre-amp
providing 23dB of gain and dissipating 1.6mW. After amplification, the output is driven
off-chip, through an RC low pass filter with a single pole at 250kHz, and into the 1MS/s
16-bit Analog-to-Digital Converter (ADC) of a 6259 NI DAQ (National Instruments).
The current through the micro-coils is chopped digitally at 50kHz, above the sensor
and circuit 1/f noise corner frequencies. Routing to the Hall sensor is limited to Metal 1,
so current commutating techniques to mitigate low frequency noise and offset would
incur a large area penalty33
. It is important to note that solutions that rely on an external
magnet to generate the polarization field usually are restricted lower frequencies,
necessitating a second chopper to attenuate noise from the electronics10
.
To eliminate any signal path DC offset that imposes large dynamic range constraints
on the BA, the output of the pre-amplifier is AC coupled to the following gain stages.
The single pole high pass filter corner frequency is set to 1kHz.
Another large dynamic range constraint comes from the in-phase applied magnetic
field. To attenuate this signal, we employ a differential architecture that subtracts the
signal of a replica Hall sensor with no bead atop it from the signal of Hall sensor exposed
to beads. The replica sensor cannot detect a bead because it is placed in a location on the
IC away from the aperture in the PCB exposed to the solution containing beads. Any
residual signal due to mismatch between the two sensors is eliminated by auto-zeroing
the output of the BA using an external feedback loop that applies an offset current in the
replica coil. The block diagram of the differential architecture is presented in Figure 3.5,
while the circuit level implementation of the differential signal path is presented in Figure
3.6.
The detection algorithm runs as follows: before the beads are applied, the exposed
coil sees a fixed 16mA, 50kHz square current wave, while an off-chip feedback loop
controls the amplitude of the 50kHz square wave calibration current through the replica
coil to zero the output of the BA. After zeroing, the calibrated replica coil current is
recorded and the system is ready for detection. Once a bead is applied on top of the
exposed sensor, the calibrated current is driven through the replica coil and the new
differential amplitude at the 50kHz fundamental is recorded. All off-chip detection
circuitry, like the ADC and the calibration feedback loop, can be readily integrated on-
chip in future implementations.
This calibration algorithm could be performed directly before use, or on the factory
floor, without impacting ease-of-use. In fact, stand-alone operation greatly reduces
testing overhead, since the PON IVD device can calibrate itself during the lengthy
surface bio-functionalization steps performed on the factory floor. Furthermore,
calibration can be used as an internal self test to meet the stringent quality control
requirements imposed on all medical devices. Alternatively, better matching techniques
can obviate the need for calibration altogether.
34
Figure 3.5: Differential architecture consisting of an exposed sensor (1), a replica
sensor (2), a three stage Backend Amplifier and an off-chip 16-Bit ADC
3.4 Results
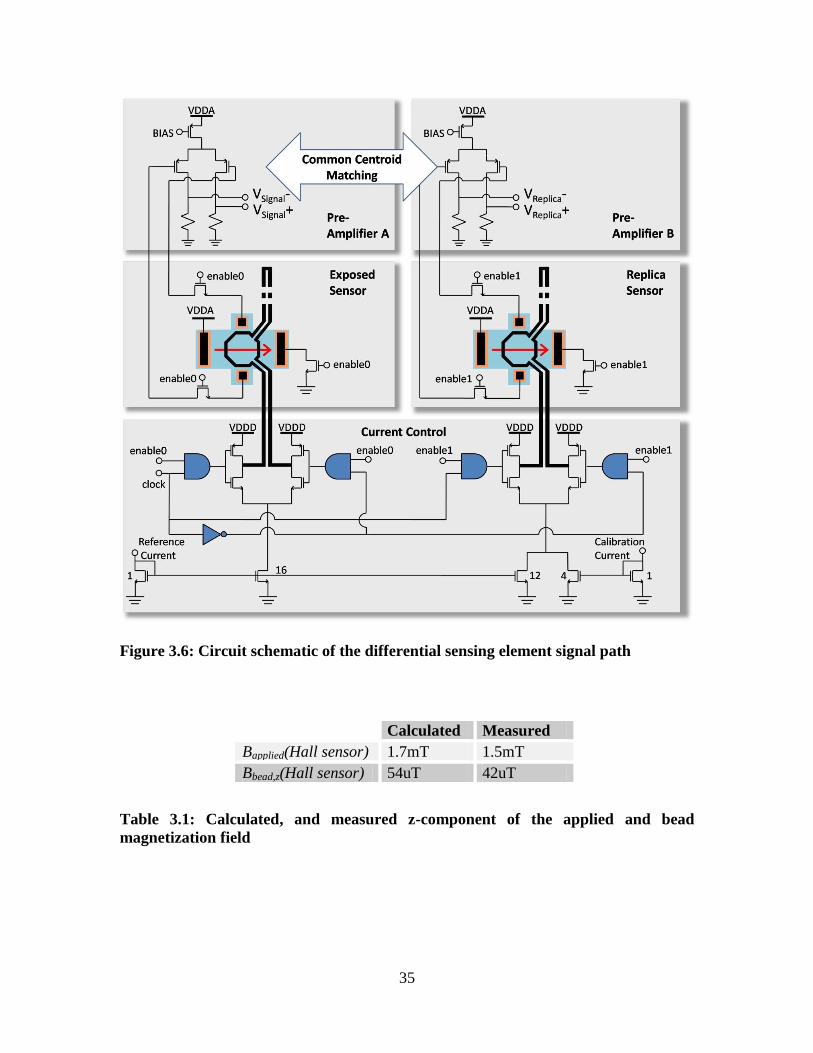
3.4.1 Single Bead Detection
A sensor was calibrated and subsequently exposed to a magnetic bead in solution.
16mA milliamps of current through a micro-coil produced an applied field of 1.47mT,
and induced a bead magnetization field of 41.5μT, as measured by the Hall sensor. The
replica sensors, shielded from magnetic beads by a thick layer of dielectric, attenuated the
large undesirable polarization field by 25dB. To enable unambiguous detection, the Hall
sensor mismatch dominated residual offset was attenuated an additional 50dB, below the
signal from the bead, by the calibration sequence. The comparison between calculated
and measured magnetic fields is presented below in Table 3.1.
Figure 3.7 presents the spectral measurements in dBV at the output of the BA
before calibration (top). The clearly distinguishable 50kHz square wave tones resulted
from the mismatch between the exposed and replica Hall sensors signal paths. After
calibration (middle) these tones were attenuated 50dB, into the noise floor. After
application of a bead onto the exposed sensor, the tones that reappeared were a result of
the bead magnetization field (bottom). This system was capable of detecting individual
magnetic beads with 45dB of Signal-to-Noise Ratio (SNR) for a 1Hz noise bandwidth
(i.e. for an integration time τ = 1s). With total input referred Gaussian noise of
approximately 150nT/√Hz, the probability of falsely detection a magnetic bead directly
over the sensor is infinitesimally small.
35
Figure 3.6: Circuit schematic of the differential sensing element signal path
Table 3.1: Calculated, and measured z-component of the applied and bead
magnetization field
Calculated Measured
Bapplied(Hall sensor) 1.7mT 1.5mT
Bbead,z(Hall sensor) 54uT 42uT
36
Figure 3.7: Output of the ADC measured with a 1Hz noise bandwidth, before
calibration (top), after calibration (middle), and after application of a bead (bottom)
1kHz HPF
50kHz 1/f corner
250kHz LPF
Tones from Hall
sensor mismatch
Tones from
bead signal
37
3.4.2 Bead Detection Range
To quantify the bead detection range, a 4.5µm bead was dried on the surface of
the IC and its position was moved in 1µm increments across the Hall sensor using a
micro-manipulator. Figure 3.8 compares the measured bead magnetization fields with
the values calculated by varying the position of the bead in Eqs. (11) and (14). A 10μT
detection threshold, represented by the dashed line, corresponds to an 8μm-wide
detection range. This 8µm bead detection range is ideal for integration with the magnetic
separation system presented in the previous chapter, and can be modulated if necessary.
Figure 3.8: Hall sensor detection range

38
3.5 Conclusion
We have presented a fully integrated magnetic bead detection system that relies on a
micro-coil and a Hall sensor that respectively magnetizes and detects a 4.5µm magnetic
bead at the surface of a CMOS IC. The micro-coil consist of a 4.2um wide, single turn
current loop implemented in the lowest metallization layer, generating fields of 1.5mT
with 16mA of current. The 5µm wide by 5.8µm long n-well Hall sensor, used to detect
the bead, has a sensitivity of 2.7%/T for an input voltage of 2V, and a bias current of
2.2mA. Using a differential amplifier with output auto-zeroing capability, single
magnetic beads were detected with 45dB of SNR for a 1Hz noise bandwidth. Moreover,
individual magnetic beads were detected at distances of up to 5µm from the center of the
Hall sensor. Since this on-chip detection architecture does not reply on any key external
components, it is well suited for integration with the on-chip separation presented in the
previous chapter. The first fully integrated CMOS assay platform that combines both the
on-chip magnetic bead detection and the on-chip magnetic separation will be presented in
the next chapter.
39
Chapter 4
4 Fully Integrated CMOS Assay Platform
4.1 Introduction
Previous attempts to integrate assay label separation and detection into a single IC
capable of autonomously performing an assay have necessitated either off-chip
components or external fluidic handling.
The combination of electromagnetic magnetic bead separation and detection was
first introduced by Baselt et al. in an assay platform that required external magnets to
generate the separation forces and to magnetize the beads for detection17
. Aytur et al.
applied this protocol to CMOS19
, but like Baselt et al.’s implementation, the need for
external magnets greatly impacted PON utility.
Lagae et al. was the first to combine on-chip manipulation and detection of super-
paramagnetic beads29
. However, this platform did not conclusively demonstrate the
ability to separate specifically from non-specifically bound magnetic beads. Instead, they
presented a GMR implementation that required fluidic washing steps to remove the
unbound magnetic particles.
Osterfeld et al. demonstrated a similar assay platform, but where the separation of
50nm magnetic particle labels was performed thermodynamically21
. However, this
system required a) an external electromagnet to strongly magnetize the small particles,
and b) the use of GMR technology to detect the weak volume magnetizations of the
particles bound to the surface of the chip.
Wang et al. presented a CMOS platform capable of detecting of magnetic beads
bound to its surface without off-chip electro-magnets11
. In the absence of an integrated
magnetic bead separation system, a micro-fluidic system with all its associated overhead
was required to remove unbound beads.
The system presented in this chapter combines the magnetic bead separation and
detection technologies of Chapters 2 and 3 in the first fully integrated assay platform. The
bio-chemical sensitivity of the on-chip protocol was characterized by assaying known
concentrations of purified Human IgG, a relevant target for a variety of infectious disease
applications. The bio-chemical selectivity was demonstrated via an anti-dengue assay on
dengue positive Human sera samples. Finally, a discussion will detail how this design
fundamentally meets the key criteria of an effective PON IVD platform, namely high bio-
chemical sensitivity and selectivity, low cost, ease of use and fast operation.
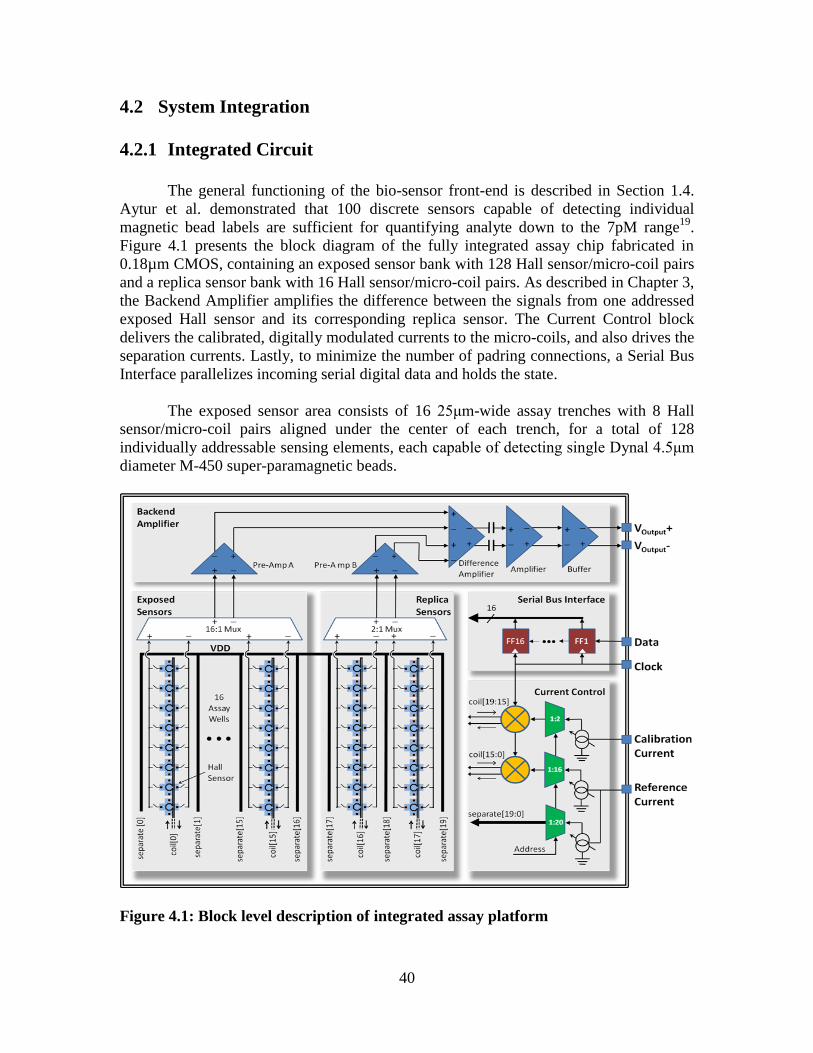
40
4.2 System Integration
4.2.1 Integrated Circuit
The general functioning of the bio-sensor front-end is described in Section 1.4.
Aytur et al. demonstrated that 100 discrete sensors capable of detecting individual
magnetic bead labels are sufficient for quantifying analyte down to the 7pM range19
.
Figure 4.1 presents the block diagram of the fully integrated assay chip fabricated in
0.18µm CMOS, containing an exposed sensor bank with 128 Hall sensor/micro-coil pairs
and a replica sensor bank with 16 Hall sensor/micro-coil pairs. As described in Chapter 3,
the Backend Amplifier amplifies the difference between the signals from one addressed
exposed Hall sensor and its corresponding replica sensor. The Current Control block
delivers the calibrated, digitally modulated currents to the micro-coils, and also drives the
separation currents. Lastly, to minimize the number of padring connections, a Serial Bus
Interface parallelizes incoming serial digital data and holds the state.
The exposed sensor area consists of 16 25μm-wide assay trenches with 8 Hall
sensor/micro-coil pairs aligned under the center of each trench, for a total of 128
individually addressable sensing elements, each capable of detecting single Dynal 4.5μm
diameter M-450 super-paramagnetic beads.
Figure 4.1: Block level description of integrated assay platform
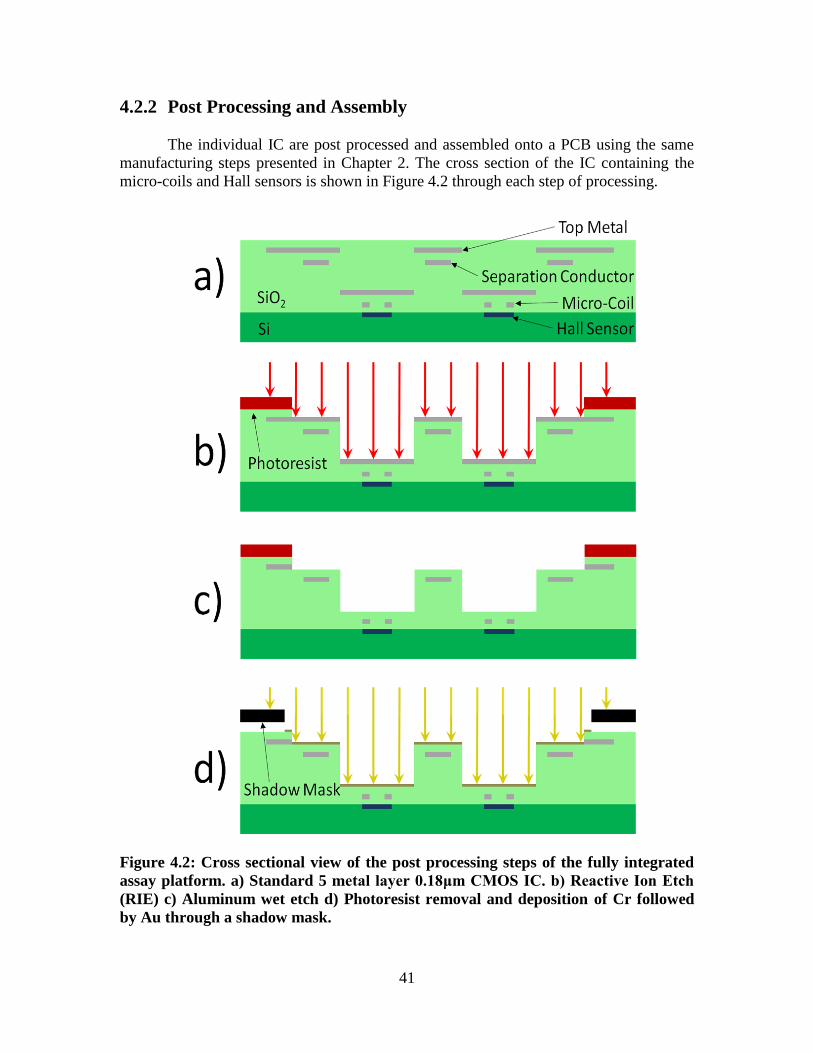
41
4.2.2 Post Processing and Assembly
The individual IC are post processed and assembled onto a PCB using the same
manufacturing steps presented in Chapter 2. The cross section of the IC containing the
micro-coils and Hall sensors is shown in Figure 4.2 through each step of processing.
Figure 4.2: Cross sectional view of the post processing steps of the fully integrated
assay platform. a) Standard 5 metal layer 0.18μm CMOS IC. b) Reactive Ion Etch
(RIE) c) Aluminum wet etch d) Photoresist removal and deposition of Cr followed
by Au through a shadow mask.

42
4.2.3 Integrated Assay Algorithm
After cartridge assembly, the mismatches between the 128 exposed sensors and
their corresponding replicas are attenuated sequentially by the detection calibration
algorithm presented in the previous chapter. Calibration can be performed directly before
use, or weeks in advance, since no appreciable drift was noted after 21 days.
The surface chip and bead bio-functionalization steps are enumerated in section
2.3.6. After surface preparation, the assay protocol is commenced; initially, each
separation conductor is sequentially pulsed with current for 0.4 seconds. This cycle is
repeated 10 times to ensure that all weakly bound beads are removed. Narrower 25μm
trenches are used in this implementation to reduce the heat dissipation and time needed to
perform magnetic separate on all 16 trenches. According to the detection range measured
in the Chapter 3, non-specifically bound beads can accumulate 2 wide along the side of
the 25μm trench without being detected. A 50mA current results in a 2pN lateral force on
a bead in the center of the trench, 15μm from the separation conductor. The mechanical
leveraging effect from the bead pivoting on the surface of the trench translates the lateral
force into a 13.2pN tensile force on the immobilizing molecular bond.
After on-chip magnetic separation, each Hall sensor is polled sequentially for 0.2
seconds. The amplitude of the 50kHz square wave resulting from the bead magnetization
field is recorded, and the bead count is incremented if this magnetic field exceeds the
threshold amplitude of 10µT.
Both magnetic separation conductors, on either side of the Hall sensor being
polled, have 25mA of current flowing through them during detection, to prevent unbound
magnetic beads from being pulled back over the Hall sensors by the detection current
flowing through the micro-coils.
The timing diagram for the calibration, separation and detection algorithms are
shown in Figure 4.3. To upload a new state into the SBI controller, the data pin must be
driven high for one clock cycle, indicating a framing bit. The following 16 bits of Data
flopped into the 16-bit serial to parallel shift register determine the Hall sensor address
and values of the currents.
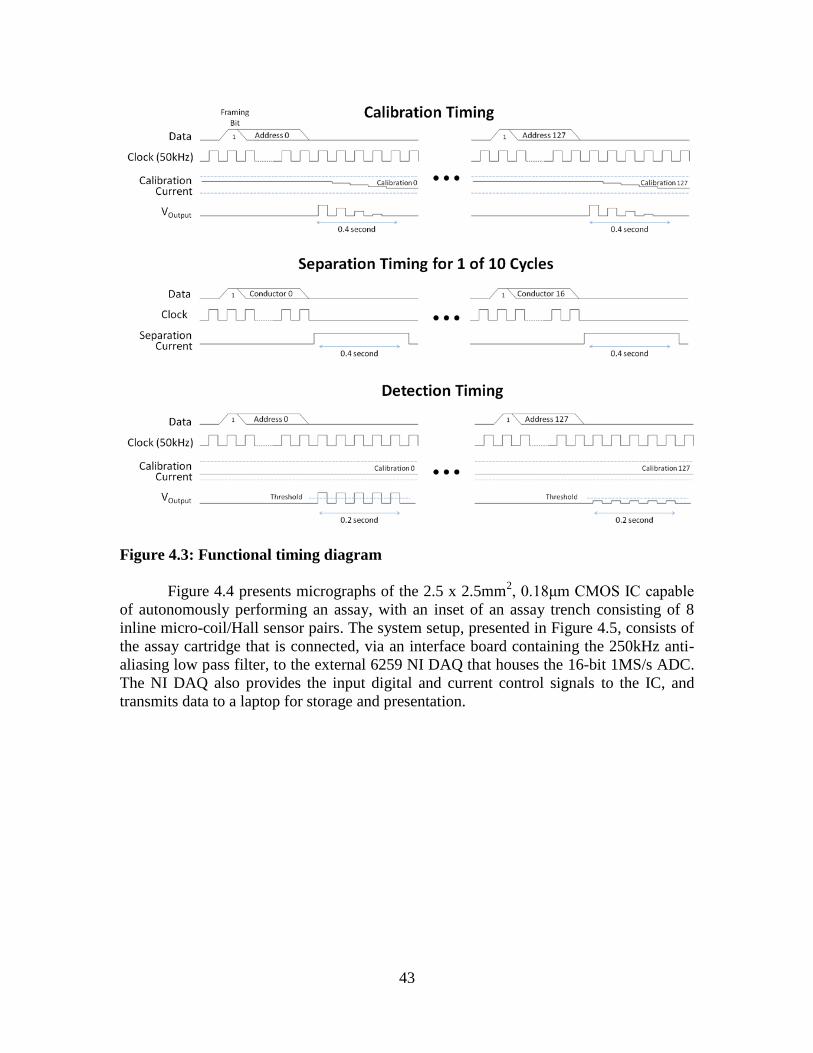
43
Figure 4.3: Functional timing diagram
Figure 4.4 presents micrographs of the 2.5 x 2.5mm2, 0.18μm CMOS IC capable
of autonomously performing an assay, with an inset of an assay trench consisting of 8
inline micro-coil/Hall sensor pairs. The system setup, presented in Figure 4.5, consists of
the assay cartridge that is connected, via an interface board containing the 250kHz anti-
aliasing low pass filter, to the external 6259 NI DAQ that houses the 16-bit 1MS/s ADC.
The NI DAQ also provides the input digital and current control signals to the IC, and
transmits data to a laptop for storage and presentation.
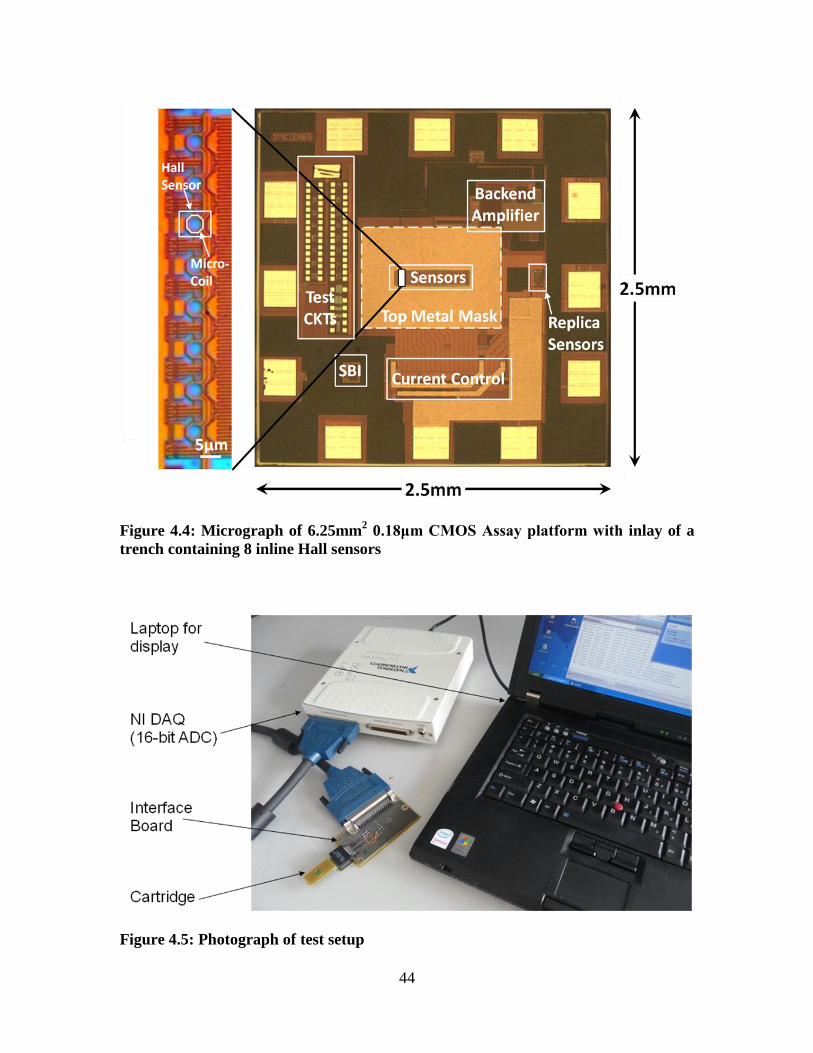
44
Figure 4.4: Micrograph of 6.25mm2 0.18μm CMOS Assay platform with inlay of a
trench containing 8 inline Hall sensors
Figure 4.5: Photograph of test setup
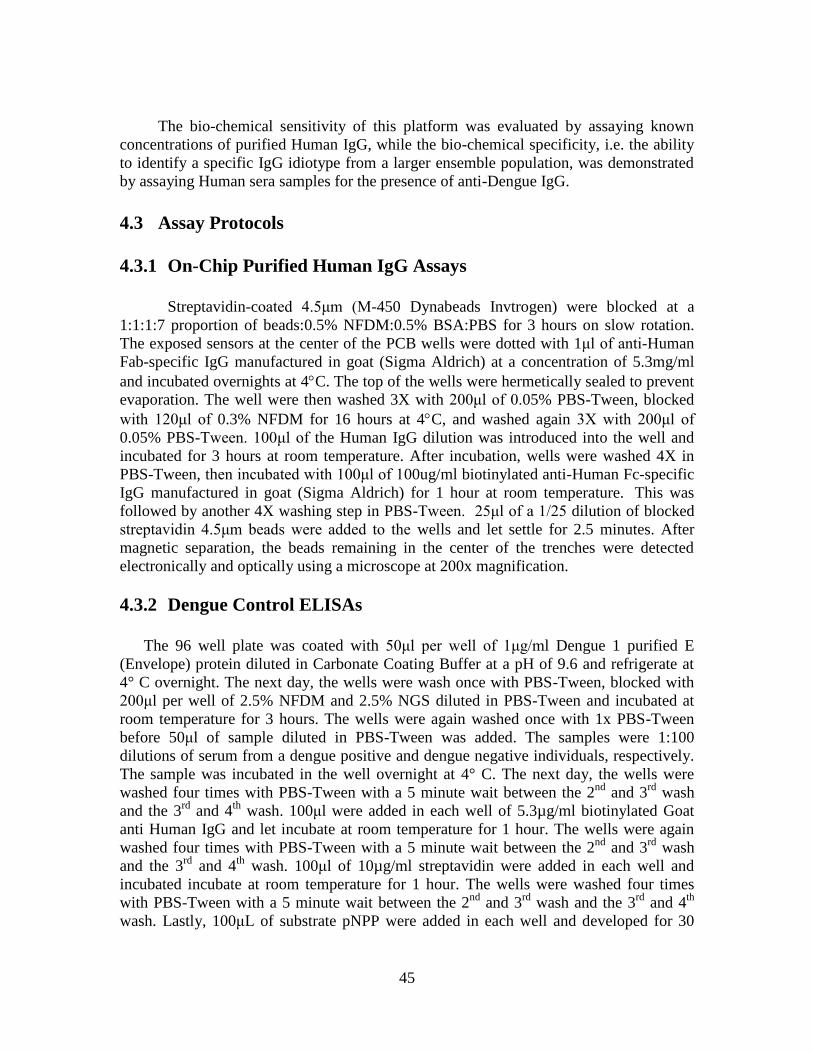
45
The bio-chemical sensitivity of this platform was evaluated by assaying known
concentrations of purified Human IgG, while the bio-chemical specificity, i.e. the ability
to identify a specific IgG idiotype from a larger ensemble population, was demonstrated
by assaying Human sera samples for the presence of anti-Dengue IgG.
4.3 Assay Protocols
4.3.1 On-Chip Purified Human IgG Assays
Streptavidin-coated 4.5μm (M-450 Dynabeads Invtrogen) were blocked at a
1:1:1:7 proportion of beads:0.5% NFDM:0.5% BSA:PBS for 3 hours on slow rotation.
The exposed sensors at the center of the PCB wells were dotted with 1μl of anti-Human
Fab-specific IgG manufactured in goat (Sigma Aldrich) at a concentration of 5.3mg/ml
and incubated overnights at 4C. The top of the wells were hermetically sealed to prevent
evaporation. The well were then washed 3X with 200μl of 0.05% PBS-Tween, blocked
with 120μl of 0.3% NFDM for 16 hours at 4C, and washed again 3X with 200μl of
0.05% PBS-Tween. 100μl of the Human IgG dilution was introduced into the well and
incubated for 3 hours at room temperature. After incubation, wells were washed 4X in
PBS-Tween, then incubated with 100μl of 100ug/ml biotinylated anti-Human Fc-specific
IgG manufactured in goat (Sigma Aldrich) for 1 hour at room temperature. This was
followed by another 4X washing step in PBS-Tween. 25μl of a 1/25 dilution of blocked
streptavidin 4.5μm beads were added to the wells and let settle for 2.5 minutes. After
magnetic separation, the beads remaining in the center of the trenches were detected
electronically and optically using a microscope at 200x magnification.
4.3.2 Dengue Control ELISAs
The 96 well plate was coated with 50μl per well of 1μg/ml Dengue 1 purified E
(Envelope) protein diluted in Carbonate Coating Buffer at a pH of 9.6 and refrigerate at
4° C overnight. The next day, the wells were wash once with PBS-Tween, blocked with
200μl per well of 2.5% NFDM and 2.5% NGS diluted in PBS-Tween and incubated at
room temperature for 3 hours. The wells were again washed once with 1x PBS-Tween
before 50μl of sample diluted in PBS-Tween was added. The samples were 1:100
dilutions of serum from a dengue positive and dengue negative individuals, respectively.
The sample was incubated in the well overnight at 4° C. The next day, the wells were
washed four times with PBS-Tween with a 5 minute wait between the 2nd
and 3rd
wash
and the 3rd
and 4th
wash. 100μl were added in each well of 5.3µg/ml biotinylated Goat
anti Human IgG and let incubate at room temperature for 1 hour. The wells were again
washed four times with PBS-Tween with a 5 minute wait between the 2nd
and 3rd
wash
and the 3rd
and 4th
wash. 100μl of 10µg/ml streptavidin were added in each well and
incubated incubate at room temperature for 1 hour. The wells were washed four times
with PBS-Tween with a 5 minute wait between the 2nd
and 3rd
wash and the 3rd
and 4th
wash. Lastly, 100μL of substrate pNPP were added in each well and developed for 30
46
minutes. The reaction was stopped with 50μl per well of 3M NaOH and the results were
read out on the spectrophotometer.
4.3.3 On-Chip Dengue Assays
Streptavidin-coated 4.5μm (M-450 Dynabeads Invtrogen) were blocked at a 1:1:1:7
proportion of beads:0.5% NFDM:0.5% BSA:PBS for 3 hours on slow rotation. Each
assay cartridge was coated with 50μl per well of 1μg/ml Dengue 1 purified E (Envelope)
protein diluted in Carbonate Coating Buffer at a pH of 9.6 and refrigerate at 4° C
overnight. The next day, the wells were wash once with PBS-Tween, blocked with 200μl
per well of 2.5% NFDM and 2.5% NGS diluted in PBS-Tween and incubated at room
temperature for 3 hours. The wells were again washed once with 1x PBS-Tween before
50μl of sample diluted in PBS-Tween was added. The samples were 1:100 dilutions of
serum from a dengue positive and dengue negative individuals, respectively. The sample
was incubated in the well overnight at 4° C. The next day, the wells were washed four
times with PBS-Tween with a 5 minute wait between the 2nd
and 3rd
wash and the 3rd
and
4th
wash. 100μl were added in each well of 5.3µg/ml biotinylated Goat anti Human IgG
and let incubate at room temperature for 1 hour. The wells were again washed four times
with PBS-Tween with a 5 minute wait between the 2nd
and 3rd
wash and the 3rd
and 4th
wash. 100μL of 10µg/ml streptavidin were added in each well and incubated incubate at
room temperature for 1 hour. The wells were washed four times with PBS-Tween with a
5 minute wait between the 2nd
and 3rd
wash and the 3rd
and 4th
wash. 25μl of a 1/25
dilution of blocked streptavidin 4.5μm beads were added to the wells and let settle for 1.5
minutes. After magnetic separation, the beads remaining bound to the center of the trench
were detected on-chip.
4.4 Results
4.4.1 On-Chip Assay Algorithm
Figure 4.6 presents the on-chip assay algorithm where magnetic beads first
sedimented to the surface of the IC over 1.5 minutes (top). Afterwards, 50mA of current
was passed sequentially through the magnetic separation conductors, one at a time
(middle). Lastly, the beads remaining in the center of the trench were detected (bottom).
4.4.2 Magnetic Bead Detection
Figure 4.7 compares the performance of the on-chip magnetic bead detection
versus optical detection of for a standard curve of serial 10X dilutions of Human IgG. In
total, the detection accuracy exceeded 95%.
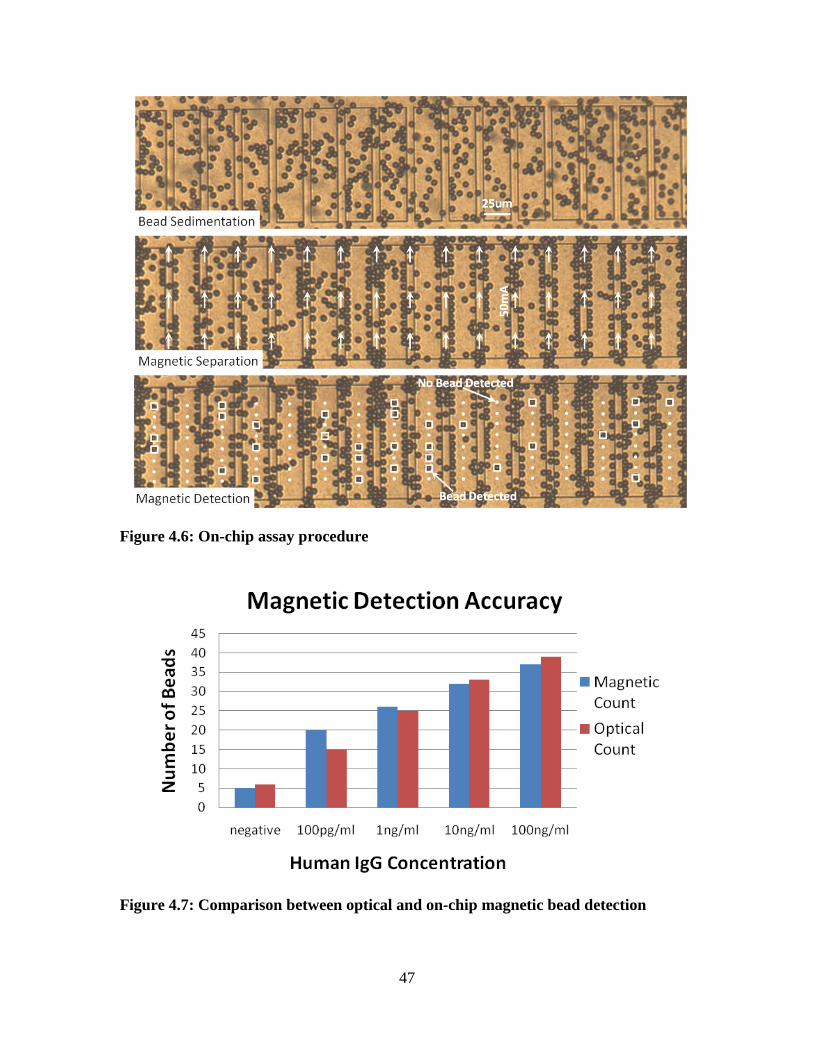
47
Figure 4.6: On-chip assay procedure
Figure 4.7: Comparison between optical and on-chip magnetic bead detection
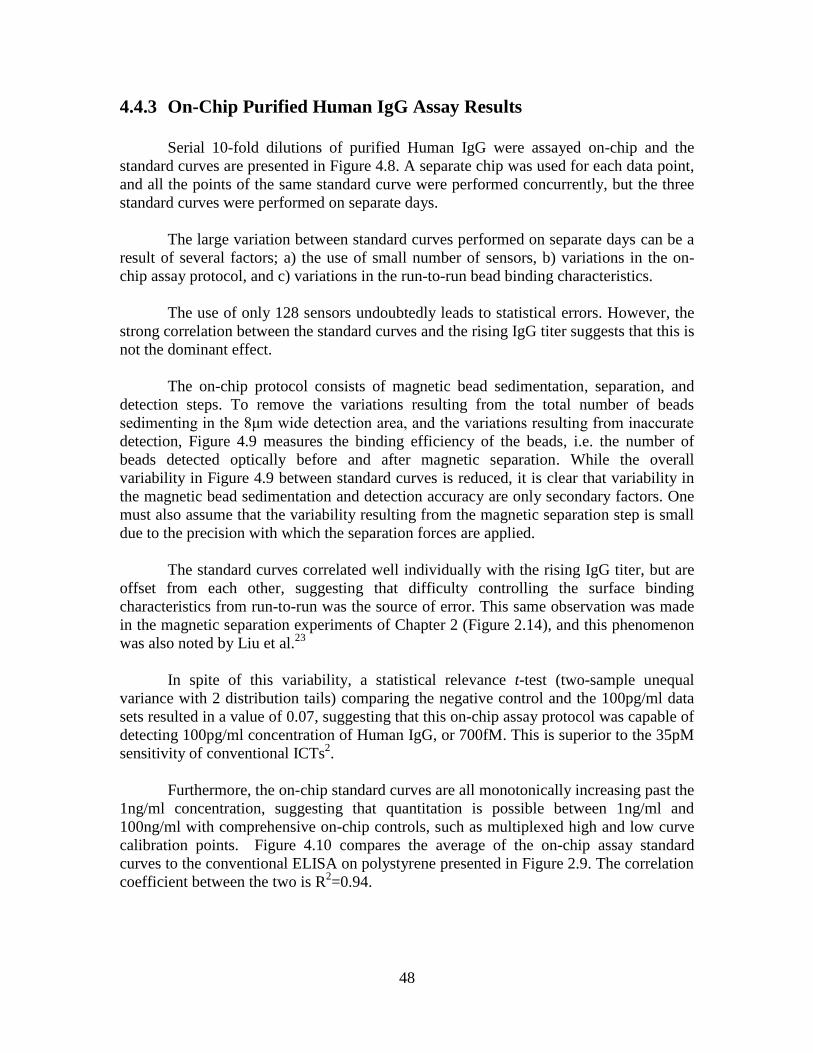
48
4.4.3 On-Chip Purified Human IgG Assay Results
Serial 10-fold dilutions of purified Human IgG were assayed on-chip and the
standard curves are presented in Figure 4.8. A separate chip was used for each data point,
and all the points of the same standard curve were performed concurrently, but the three
standard curves were performed on separate days.
The large variation between standard curves performed on separate days can be a
result of several factors; a) the use of small number of sensors, b) variations in the on-
chip assay protocol, and c) variations in the run-to-run bead binding characteristics.
The use of only 128 sensors undoubtedly leads to statistical errors. However, the
strong correlation between the standard curves and the rising IgG titer suggests that this is
not the dominant effect.
The on-chip protocol consists of magnetic bead sedimentation, separation, and
detection steps. To remove the variations resulting from the total number of beads
sedimenting in the 8μm wide detection area, and the variations resulting from inaccurate
detection, Figure 4.9 measures the binding efficiency of the beads, i.e. the number of
beads detected optically before and after magnetic separation. While the overall
variability in Figure 4.9 between standard curves is reduced, it is clear that variability in
the magnetic bead sedimentation and detection accuracy are only secondary factors. One
must also assume that the variability resulting from the magnetic separation step is small
due to the precision with which the separation forces are applied.
The standard curves correlated well individually with the rising IgG titer, but are
offset from each other, suggesting that difficulty controlling the surface binding
characteristics from run-to-run was the source of error. This same observation was made
in the magnetic separation experiments of Chapter 2 (Figure 2.14), and this phenomenon
was also noted by Liu et al.23
In spite of this variability, a statistical relevance t-test (two-sample unequal
variance with 2 distribution tails) comparing the negative control and the 100pg/ml data
sets resulted in a value of 0.07, suggesting that this on-chip assay protocol was capable of
detecting 100pg/ml concentration of Human IgG, or 700fM. This is superior to the 35pM
sensitivity of conventional ICTs2.
Furthermore, the on-chip standard curves are all monotonically increasing past the
1ng/ml concentration, suggesting that quantitation is possible between 1ng/ml and
100ng/ml with comprehensive on-chip controls, such as multiplexed high and low curve
calibration points. Figure 4.10 compares the average of the on-chip assay standard
curves to the conventional ELISA on polystyrene presented in Figure 2.9. The correlation
coefficient between the two is R2=0.94.
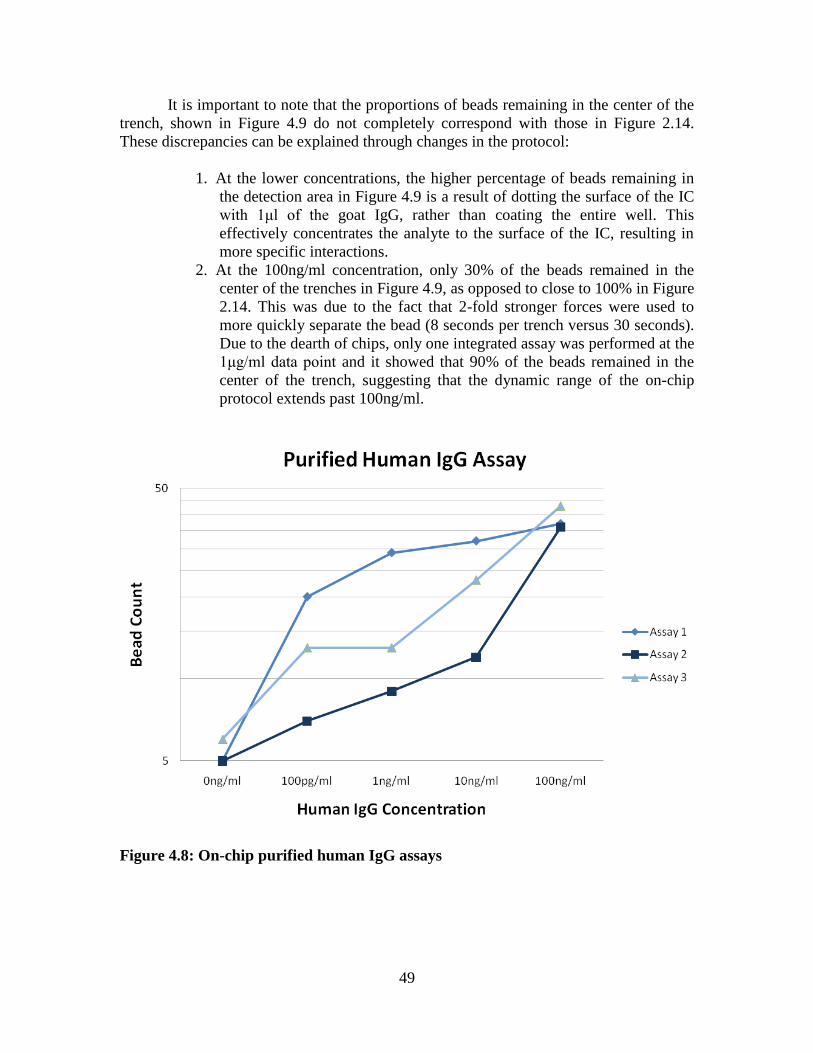
49
It is important to note that the proportions of beads remaining in the center of the
trench, shown in Figure 4.9 do not completely correspond with those in Figure 2.14.
These discrepancies can be explained through changes in the protocol:
1. At the lower concentrations, the higher percentage of beads remaining in
the detection area in Figure 4.9 is a result of dotting the surface of the IC
with 1μl of the goat IgG, rather than coating the entire well. This
effectively concentrates the analyte to the surface of the IC, resulting in
more specific interactions.
2. At the 100ng/ml concentration, only 30% of the beads remained in the
center of the trenches in Figure 4.9, as opposed to close to 100% in Figure
2.14. This was due to the fact that 2-fold stronger forces were used to
more quickly separate the bead (8 seconds per trench versus 30 seconds).
Due to the dearth of chips, only one integrated assay was performed at the
1μg/ml data point and it showed that 90% of the beads remained in the
center of the trench, suggesting that the dynamic range of the on-chip
protocol extends past 100ng/ml.
Figure 4.8: On-chip purified human IgG assays
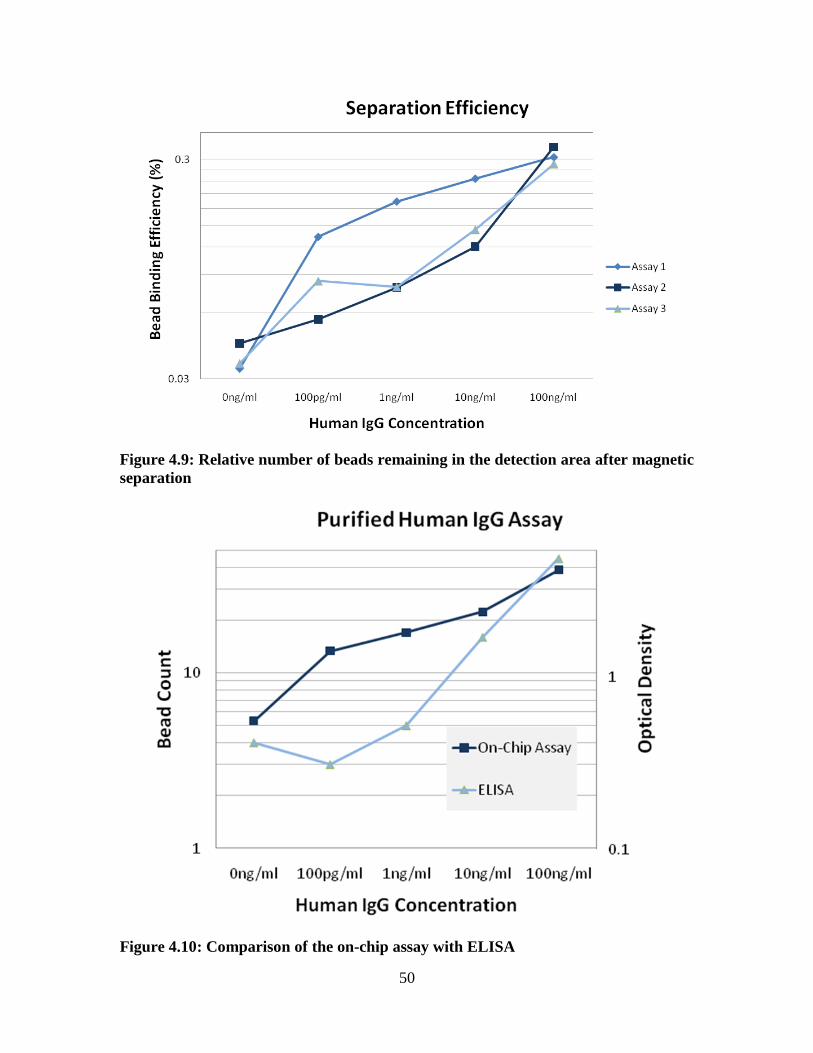
50
Figure 4.9: Relative number of beads remaining in the detection area after magnetic
separation
Figure 4.10: Comparison of the on-chip assay with ELISA
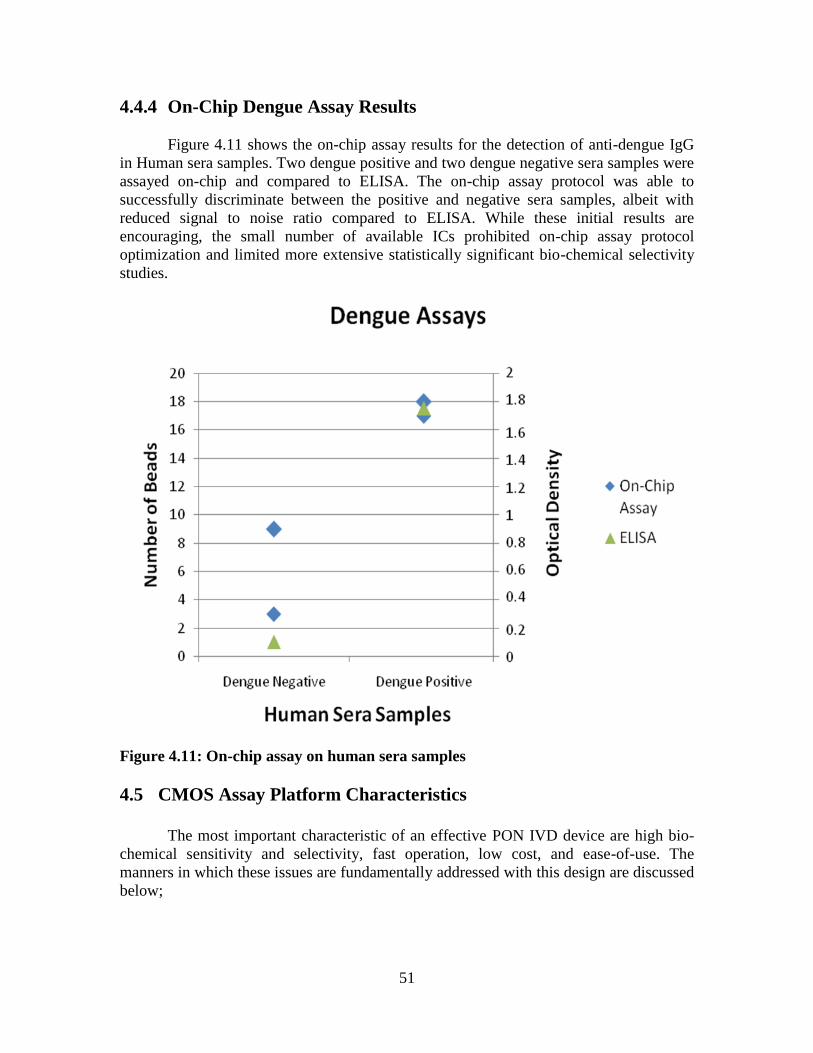
51
4.4.4 On-Chip Dengue Assay Results
Figure 4.11 shows the on-chip assay results for the detection of anti-dengue IgG
in Human sera samples. Two dengue positive and two dengue negative sera samples were
assayed on-chip and compared to ELISA. The on-chip assay protocol was able to
successfully discriminate between the positive and negative sera samples, albeit with
reduced signal to noise ratio compared to ELISA. While these initial results are
encouraging, the small number of available ICs prohibited on-chip assay protocol
optimization and limited more extensive statistically significant bio-chemical selectivity
studies.
Figure 4.11: On-chip assay on human sera samples
4.5 CMOS Assay Platform Characteristics
The most important characteristic of an effective PON IVD device are high bio-
chemical sensitivity and selectivity, fast operation, low cost, and ease-of-use. The
manners in which these issues are fundamentally addressed with this design are discussed
below;
52
Sensitivity – The high bio-chemical sensitivity displayed by this assay platform is
the result of several factors; a) magnetic bead labeling leads to assay sensitivities
equivalent to enzymatic labeling for compact, rapid protocols, b) the ability to precisely
adjust the separation forces applied on the assay labels results in lower background
signal, and c) the ability to detect numerous individual assay labels rather than aggregates
statistically reduces background noise. The 700fM detection limit of this platform is
superior to conventional ICT, which range from 35pM on purified protein2 to 1.6nM on
raw samples3, while 2 orders of dynamic range is useful for most applications.
Selectivity – Initial data suggests that the magnetic forces applied to the
molecular tethers enables the precise removal of magnetic beads non-specifically or
cross-reactively bound to the surface of the chip. In a manufacturing environment,
dynamic control of the forces, or the application of a range of forces is useful for
achieving a high level of bio-chemical specificity and to mitigate the natural variability in
Human sera.
Speed – The surface bio-functionalization can be performed on the factory floor
and shall not be accounted in the total PON assay time, which can be broken down into
analyte incubation, label incubation, and analyte separation and detection steps. The
lengthy analyte incubation step can be minimized by incubating the magnetic beads with
the soluble analyte, rather than having the soluble analyte diffuse to the binding sites on
the surface of the IC. In such a situation, quasi-solution phase kinetics can be achieved,
ideal for PON application. The remaining label incubation, separation and detection steps
take under 5 minutes using the on-chip assay protocol.
Ease-of-use – The burden on the user of a digital PON IVD device can be
minimized by integrating the assay protocol as much as possible. Ideally, a user would
simply present a sample and wait for the results. Stand-alone operation is also an
important factor to ensuring ease-of-use since a protocol involving multiple components
becomes daunting to the occasional untrained user. The main advantages that stand-alone
digital platform have over ICTs with respect to ease of use are a) results are displayed
digitally so there is no need for interpretation, b) there is no need for timing, c)
instructions can be delivered audio-visually, and d) post-analysis of the assay results can
be performed by the device. Figure 4.12 shows the digital display that breaks down final
bead tally according to the position in the array. Such a display is necessary for analyzing
multiplexed results.
Cost – The use of CMOS minimizes both the development and manufacturing
costs. A digital PON IVD tester must have at least one digital IC to drive the display.
This system can integrate the various assay components (label separation and detection)
on the same chip that is responsible for digitizing and displaying the results. Such a PON
IVD implementation would require only one chip, one battery and one display, and
therefore would offer a generational low manufacturing cost structure. In terms of
development costs, non-recurring costs can be contained by employing legacy technology
nodes with standard design flows. These overall cost advantages can be translated into
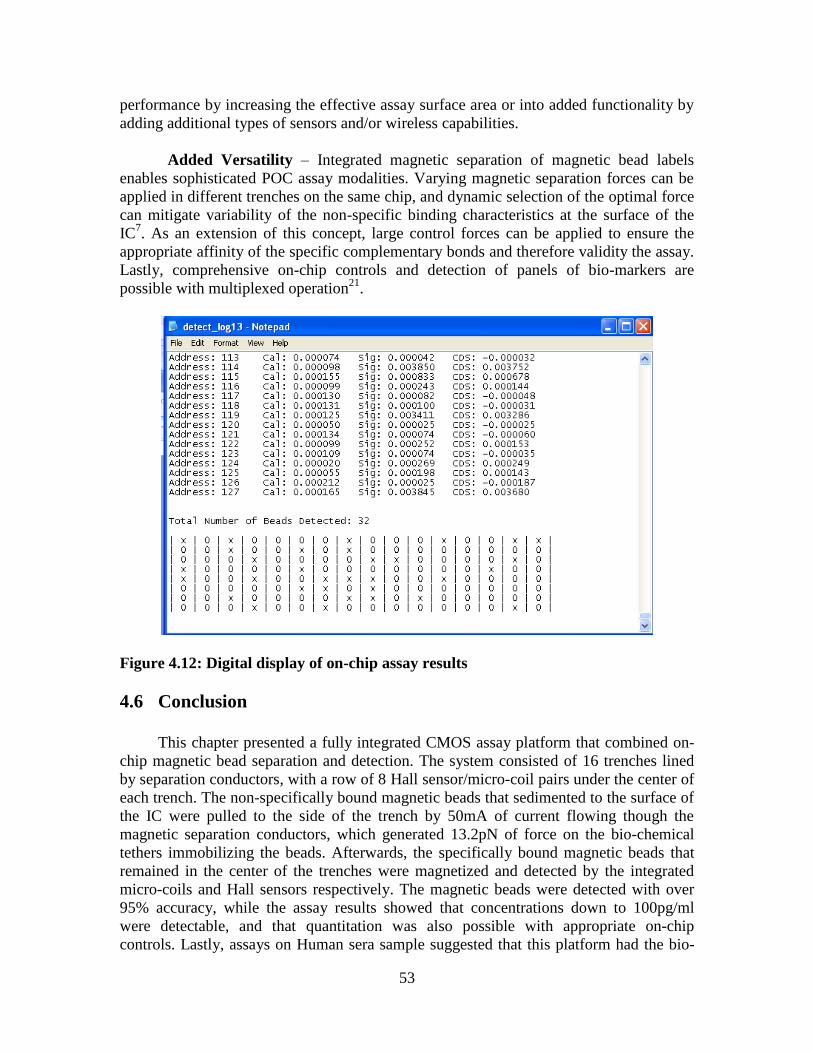
53
performance by increasing the effective assay surface area or into added functionality by
adding additional types of sensors and/or wireless capabilities.
Added Versatility – Integrated magnetic separation of magnetic bead labels
enables sophisticated POC assay modalities. Varying magnetic separation forces can be
applied in different trenches on the same chip, and dynamic selection of the optimal force
can mitigate variability of the non-specific binding characteristics at the surface of the
IC7. As an extension of this concept, large control forces can be applied to ensure the
appropriate affinity of the specific complementary bonds and therefore validity the assay.
Lastly, comprehensive on-chip controls and detection of panels of bio-markers are
possible with multiplexed operation21
.
Figure 4.12: Digital display of on-chip assay results
4.6 Conclusion
This chapter presented a fully integrated CMOS assay platform that combined on-
chip magnetic bead separation and detection. The system consisted of 16 trenches lined
by separation conductors, with a row of 8 Hall sensor/micro-coil pairs under the center of
each trench. The non-specifically bound magnetic beads that sedimented to the surface of
the IC were pulled to the side of the trench by 50mA of current flowing though the
magnetic separation conductors, which generated 13.2pN of force on the bio-chemical
tethers immobilizing the beads. Afterwards, the specifically bound magnetic beads that
remained in the center of the trenches were magnetized and detected by the integrated
micro-coils and Hall sensors respectively. The magnetic beads were detected with over
95% accuracy, while the assay results showed that concentrations down to 100pg/ml
were detectable, and that quantitation was also possible with appropriate on-chip
controls. Lastly, assays on Human sera sample suggested that this platform had the bio-
54
chemical selectivity necessary to distinguish one particular anti-dengue IgG idiotype,
although statistical significance was stifled by the limitation in the number of chips.
Through previously unachievable levels of integration, this bio-assay platform has the all
qualities of an effective PON IVD device, namely high biochemical sensitivity and
specificity, speed, ease-of-use, low cost and versatility. The next chapter will present a
low-cost easy-to-use membrane filter based sample preparation system that may be
combined with this assay platform into a stand-alone digital PON IVD tester.
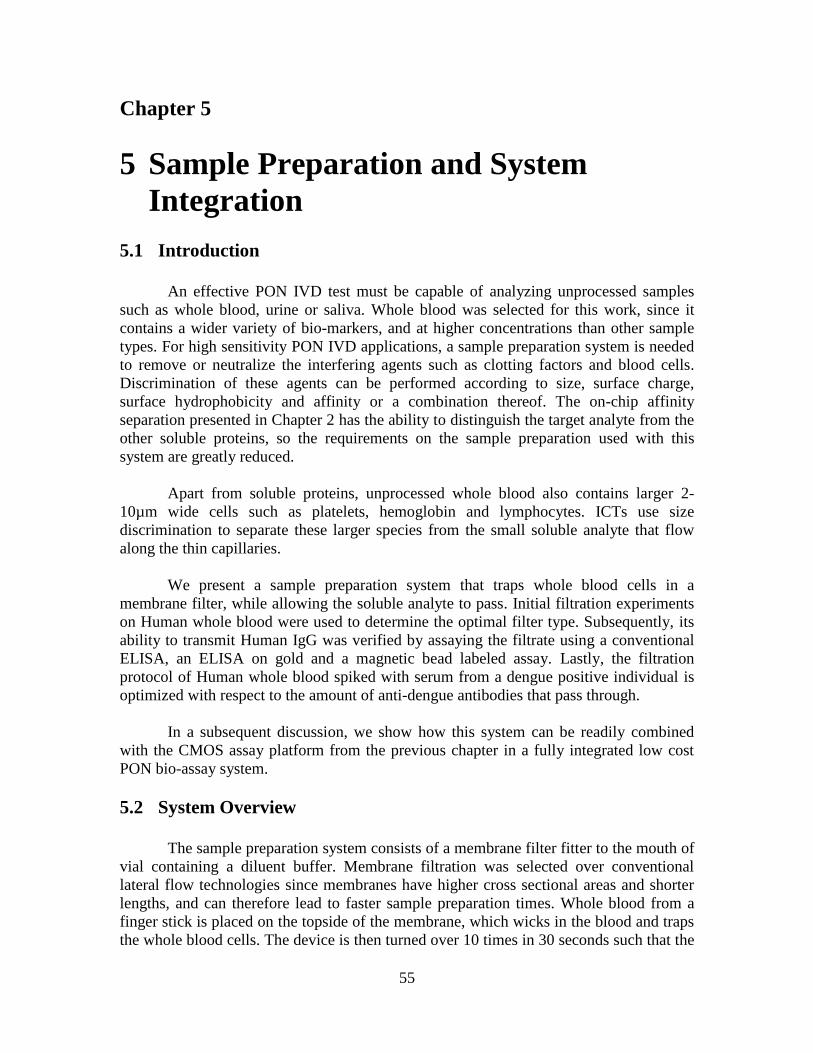
55
Chapter 5
5 Sample Preparation and System
Integration
5.1 Introduction
An effective PON IVD test must be capable of analyzing unprocessed samples
such as whole blood, urine or saliva. Whole blood was selected for this work, since it
contains a wider variety of bio-markers, and at higher concentrations than other sample
types. For high sensitivity PON IVD applications, a sample preparation system is needed
to remove or neutralize the interfering agents such as clotting factors and blood cells.
Discrimination of these agents can be performed according to size, surface charge,
surface hydrophobicity and affinity or a combination thereof. The on-chip affinity
separation presented in Chapter 2 has the ability to distinguish the target analyte from the
other soluble proteins, so the requirements on the sample preparation used with this
system are greatly reduced.
Apart from soluble proteins, unprocessed whole blood also contains larger 2-
10µm wide cells such as platelets, hemoglobin and lymphocytes. ICTs use size
discrimination to separate these larger species from the small soluble analyte that flow
along the thin capillaries.
We present a sample preparation system that traps whole blood cells in a
membrane filter, while allowing the soluble analyte to pass. Initial filtration experiments
on Human whole blood were used to determine the optimal filter type. Subsequently, its
ability to transmit Human IgG was verified by assaying the filtrate using a conventional
ELISA, an ELISA on gold and a magnetic bead labeled assay. Lastly, the filtration
protocol of Human whole blood spiked with serum from a dengue positive individual is
optimized with respect to the amount of anti-dengue antibodies that pass through.
In a subsequent discussion, we show how this system can be readily combined
with the CMOS assay platform from the previous chapter in a fully integrated low cost
PON bio-assay system.
5.2 System Overview
The sample preparation system consists of a membrane filter fitter to the mouth of
vial containing a diluent buffer. Membrane filtration was selected over conventional
lateral flow technologies since membranes have higher cross sectional areas and shorter
lengths, and can therefore lead to faster sample preparation times. Whole blood from a
finger stick is placed on the topside of the membrane, which wicks in the blood and traps
the whole blood cells. The device is then turned over 10 times in 30 seconds such that the
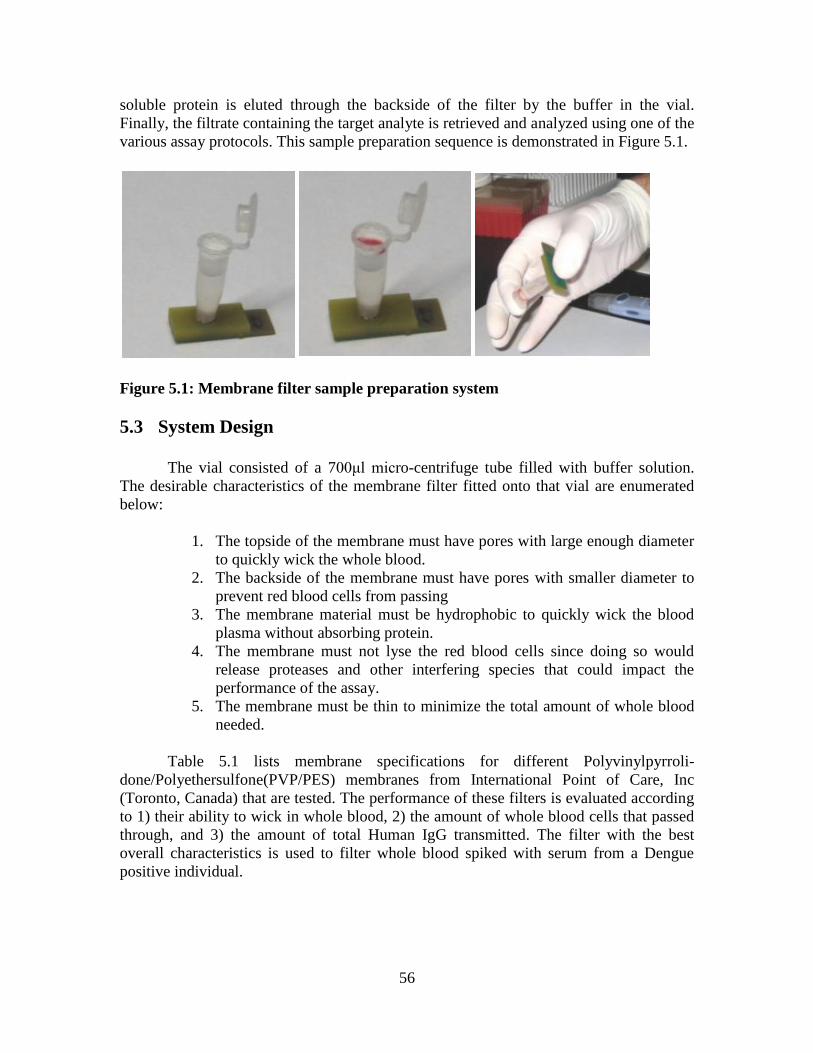
56
soluble protein is eluted through the backside of the filter by the buffer in the vial.
Finally, the filtrate containing the target analyte is retrieved and analyzed using one of the
various assay protocols. This sample preparation sequence is demonstrated in Figure 5.1.
Figure 5.1: Membrane filter sample preparation system
5.3 System Design
The vial consisted of a 700μl micro-centrifuge tube filled with buffer solution.
The desirable characteristics of the membrane filter fitted onto that vial are enumerated
below:
1. The topside of the membrane must have pores with large enough diameter
to quickly wick the whole blood.
2. The backside of the membrane must have pores with smaller diameter to
prevent red blood cells from passing
3. The membrane material must be hydrophobic to quickly wick the blood
plasma without absorbing protein.
4. The membrane must not lyse the red blood cells since doing so would
release proteases and other interfering species that could impact the
performance of the assay.
5. The membrane must be thin to minimize the total amount of whole blood
needed.
Table 5.1 lists membrane specifications for different Polyvinylpyrroli-
done/Polyethersulfone(PVP/PES) membranes from International Point of Care, Inc
(Toronto, Canada) that are tested. The performance of these filters is evaluated according
to 1) their ability to wick in whole blood, 2) the amount of whole blood cells that passed
through, and 3) the amount of total Human IgG transmitted. The filter with the best
overall characteristics is used to filter whole blood spiked with serum from a Dengue
positive individual.
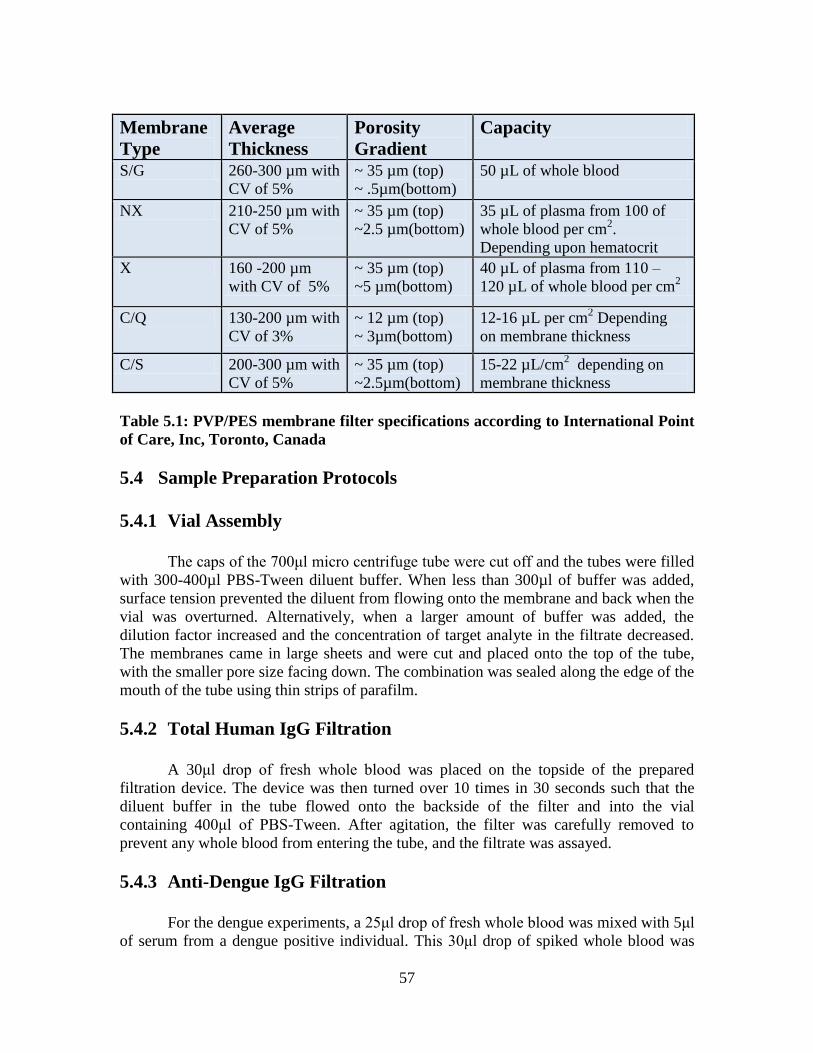
57
Membrane
Type
Average
Thickness
Porosity
Gradient
Capacity
S/G 260-300 µm with
CV of 5%
~ 35 µm (top)
~ .5µm(bottom)
50 µL of whole blood
NX 210-250 µm with
CV of 5%
~ 35 µm (top)
~2.5 µm(bottom)
35 µL of plasma from 100 of
whole blood per cm2.
Depending upon hematocrit
X 160 -200 µm
with CV of 5%
~ 35 µm (top)
~5 µm(bottom)
40 µL of plasma from 110 –
120 µL of whole blood per cm2
C/Q 130-200 µm with
CV of 3%
~ 12 µm (top)
~ 3µm(bottom)
12-16 µL per cm2 Depending
on membrane thickness
C/S 200-300 µm with
CV of 5%
~ 35 µm (top)
~2.5µm(bottom)
15-22 µL/cm2 depending on
membrane thickness
Table 5.1: PVP/PES membrane filter specifications according to International Point
of Care, Inc, Toronto, Canada
5.4 Sample Preparation Protocols
5.4.1 Vial Assembly
The caps of the 700μl micro centrifuge tube were cut off and the tubes were filled
with 300-400µl PBS-Tween diluent buffer. When less than 300µl of buffer was added,
surface tension prevented the diluent from flowing onto the membrane and back when the
vial was overturned. Alternatively, when a larger amount of buffer was added, the
dilution factor increased and the concentration of target analyte in the filtrate decreased.
The membranes came in large sheets and were cut and placed onto the top of the tube,
with the smaller pore size facing down. The combination was sealed along the edge of the
mouth of the tube using thin strips of parafilm.
5.4.2 Total Human IgG Filtration
A 30μl drop of fresh whole blood was placed on the topside of the prepared
filtration device. The device was then turned over 10 times in 30 seconds such that the
diluent buffer in the tube flowed onto the backside of the filter and into the vial
containing 400μl of PBS-Tween. After agitation, the filter was carefully removed to
prevent any whole blood from entering the tube, and the filtrate was assayed.
5.4.3 Anti-Dengue IgG Filtration
For the dengue experiments, a 25μl drop of fresh whole blood was mixed with 5μl
of serum from a dengue positive individual. This 30μl drop of spiked whole blood was
58
placed on the topside of the prepared filter device. To maximize the amount of anti-
dengue antibodies allowed through the membrane, the time the device was left to sit after
application of the blood was varied, as was the number of time the device was
overturned. For this experiment, the vial contained 300μl of PBS-Tween
5.4.4 Filtrate Assay Protocols The ELISA on polystyrene, ELISA on gold and M-280 bead assay on gold
protocols used for quantifying the amount of total Human IgG in the filtrate are described
in section 2.3, while the Dengue assay protocol used to verify that all the anti-dengue
antibodies transmitted through the filter is detailed in section 4.4.2.
5.5 Results
5.5.1 Filter Selection
Figure 5.2 shows the topsides of the S/G, NX, X, C/Q, and C/S PVP/PES
membrane filters that were compared for their ability to wick away 30µl of whole blood.
The S/G and the X PVP/PES filters performed best since they wicked in all the whole
blood. Furthermore, analysis of the centrifuged filtrate demonstrated that the PVP/PES
filters were able to block over 99% whole blood cells from passing.
The 30µl of whole blood placed onto the filter contained approximately equal
volumes of red blood cells and plasma. Of the 15µl of serum, 5µl were absorbed by the
filter as specified by the International Point of Care, Inc datasheet, and 10µl were eluted
into the 400µl of PBS-T in the vial, implying a 1:40 serum dilution in the filtrate. The
filtrate was further diluted 1:25, for a total serum dilution of 1:1000. ELISA standard
curves were produced from serial 4-fold dilutions starting with 1:1000 for a) a
centrifuged Human serum control, b) the filtrate from a small 0.22um pore size Millipore
filter (Millipore, Massachusetts, USA), c) the filtrate from a C/S PVP/PES filter, d) the
filtrate from a C/Q PVP/PES filter, e) the filtrate from a S/G PVP/PES filter, and f) a PBS
negative control. The results, shown in Figure 5.3 suggest that the S/G PVP/PES
membrane is best at transmitting IgG. However, the S/G aliquots loose more Human IgG
signal at higher dilutions than the unfiltered controls. While not altogether clear, this
effect might be due to a small number of interfering agents such as proteases from the
few lysed red blood cells that degrade protein at low levels. This hypothesis was
reinforced by the slight pink coloration of the filtrate. Less aggressive agitation protocols
may be needed to avoid cell lysis.
Overall, the optimal filter was the S/G PVP/PES filter (International Point of
Care, Inc); the 35µm topside pore size quickly wicked in the whole blood, while the
0.5µm backside pore size blocked the whole blood cells from passing. Moreover, assays
on the filtrates revealed that the S/G filter transmitted Human IgG most effectively.
Figure 5.4 shows a schematic of the cross section of this filter trapping red blood cells.
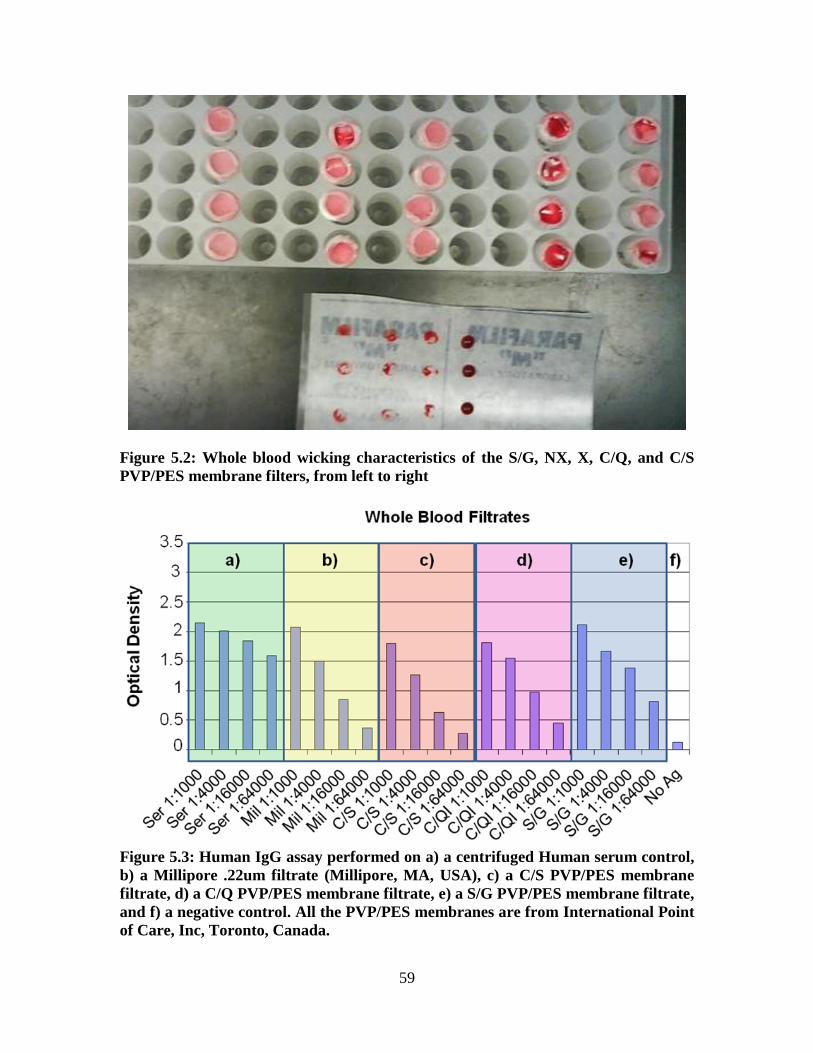
59
Figure 5.2: Whole blood wicking characteristics of the S/G, NX, X, C/Q, and C/S
PVP/PES membrane filters, from left to right
Figure 5.3: Human IgG assay performed on a) a centrifuged Human serum control,
b) a Millipore .22um filtrate (Millipore, MA, USA), c) a C/S PVP/PES membrane
filtrate, d) a C/Q PVP/PES membrane filtrate, e) a S/G PVP/PES membrane filtrate,
and f) a negative control. All the PVP/PES membranes are from International Point
of Care, Inc, Toronto, Canada.
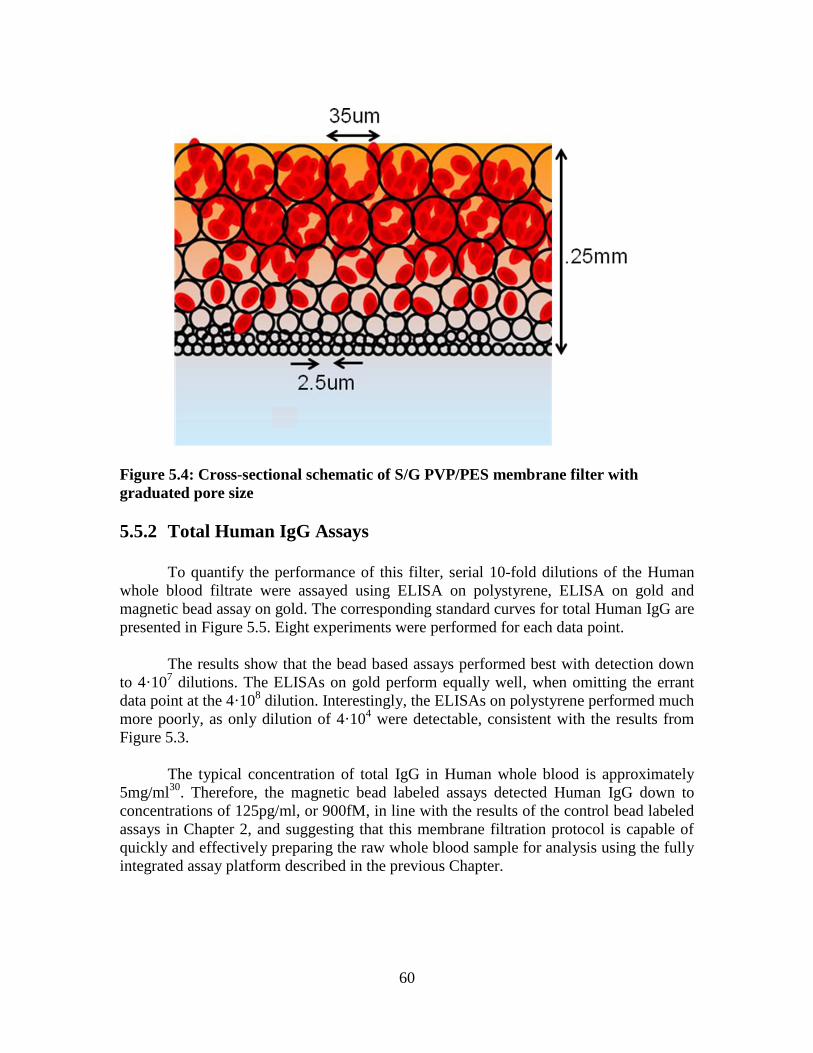
60
Figure 5.4: Cross-sectional schematic of S/G PVP/PES membrane filter with
graduated pore size
5.5.2 Total Human IgG Assays
To quantify the performance of this filter, serial 10-fold dilutions of the Human
whole blood filtrate were assayed using ELISA on polystyrene, ELISA on gold and
magnetic bead assay on gold. The corresponding standard curves for total Human IgG are
presented in Figure 5.5. Eight experiments were performed for each data point.
The results show that the bead based assays performed best with detection down
to 4·107 dilutions. The ELISAs on gold perform equally well, when omitting the errant
data point at the 4·108 dilution. Interestingly, the ELISAs on polystyrene performed much
more poorly, as only dilution of 4·104 were detectable, consistent with the results from
Figure 5.3.
The typical concentration of total IgG in Human whole blood is approximately
5mg/ml30
. Therefore, the magnetic bead labeled assays detected Human IgG down to
concentrations of 125pg/ml, or 900fM, in line with the results of the control bead labeled
assays in Chapter 2, and suggesting that this membrane filtration protocol is capable of
quickly and effectively preparing the raw whole blood sample for analysis using the fully
integrated assay platform described in the previous Chapter.
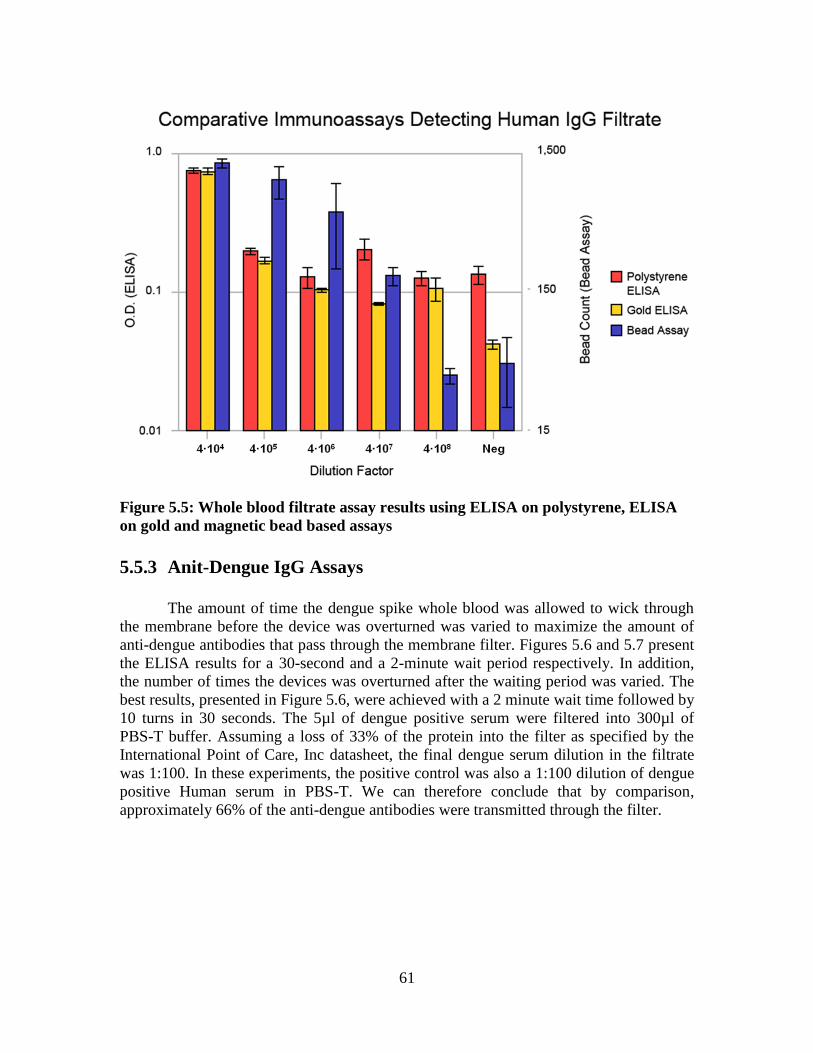
61
Figure 5.5: Whole blood filtrate assay results using ELISA on polystyrene, ELISA
on gold and magnetic bead based assays
5.5.3 Anit-Dengue IgG Assays
The amount of time the dengue spike whole blood was allowed to wick through
the membrane before the device was overturned was varied to maximize the amount of
anti-dengue antibodies that pass through the membrane filter. Figures 5.6 and 5.7 present
the ELISA results for a 30-second and a 2-minute wait period respectively. In addition,
the number of times the devices was overturned after the waiting period was varied. The
best results, presented in Figure 5.6, were achieved with a 2 minute wait time followed by
10 turns in 30 seconds. The 5µl of dengue positive serum were filtered into 300µl of
PBS-T buffer. Assuming a loss of 33% of the protein into the filter as specified by the
International Point of Care, Inc datasheet, the final dengue serum dilution in the filtrate
was 1:100. In these experiments, the positive control was also a 1:100 dilution of dengue
positive Human serum in PBS-T. We can therefore conclude that by comparison,
approximately 66% of the anti-dengue antibodies were transmitted through the filter.
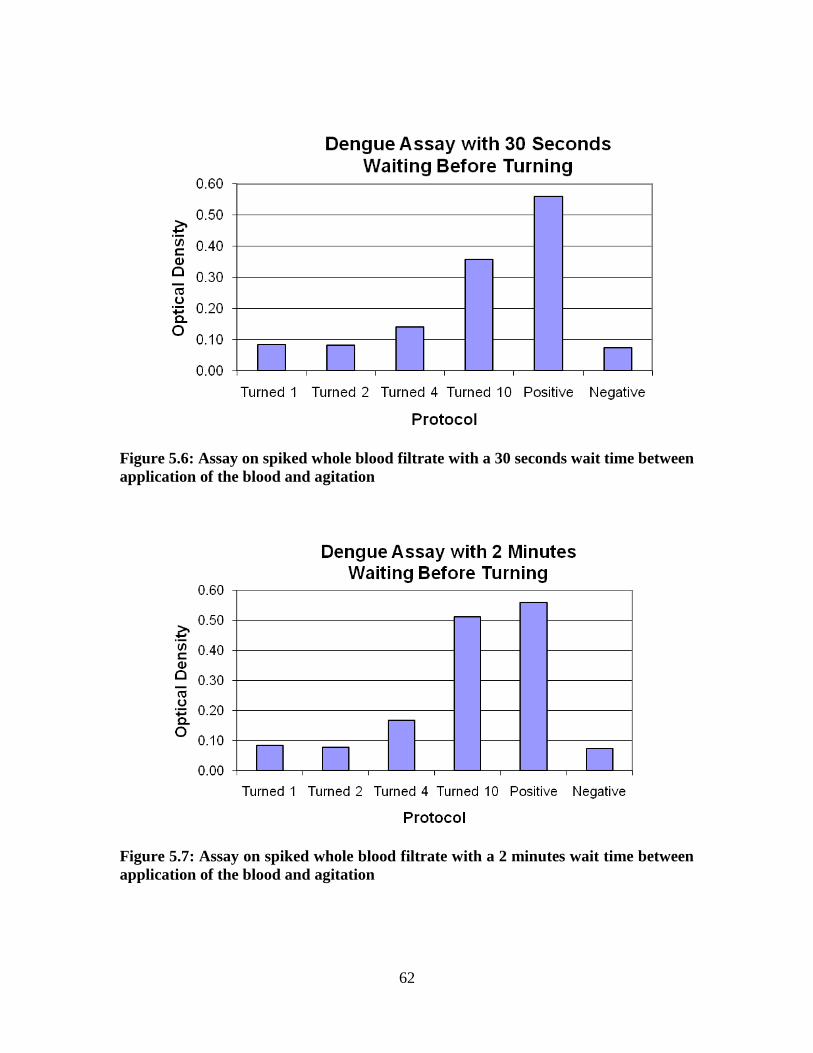
62
Figure 5.6: Assay on spiked whole blood filtrate with a 30 seconds wait time between
application of the blood and agitation
Figure 5.7: Assay on spiked whole blood filtrate with a 2 minutes wait time between
application of the blood and agitation
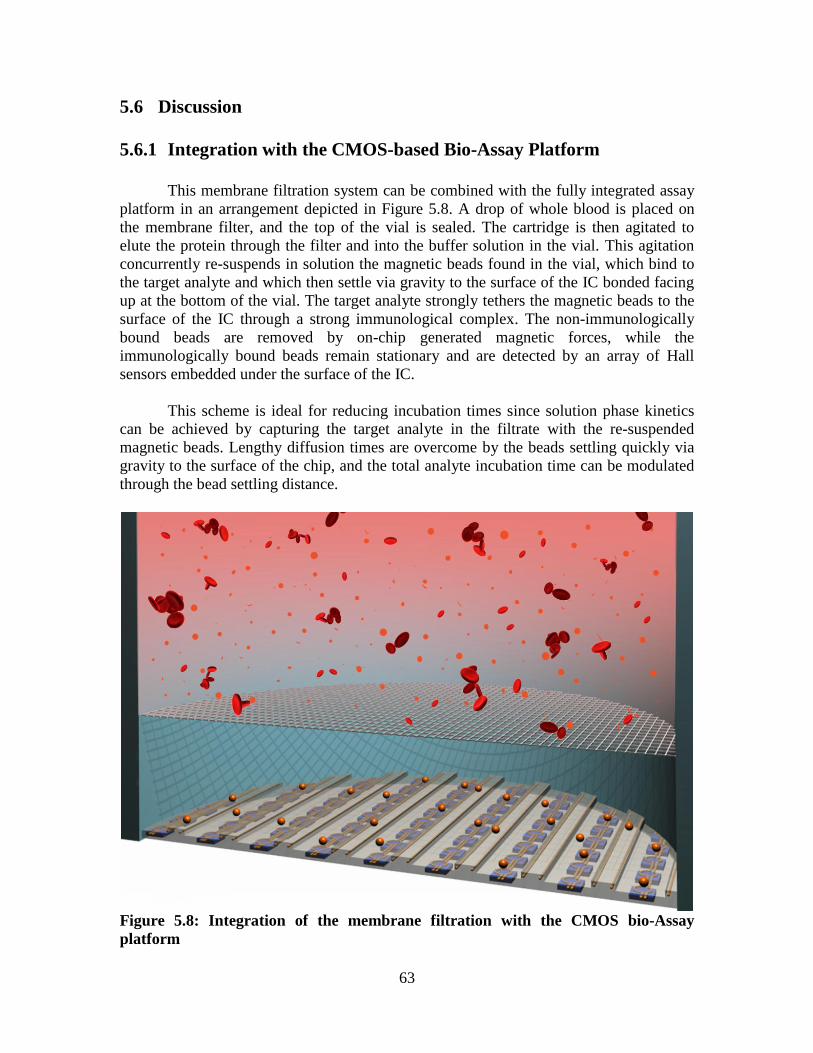
63
5.6 Discussion
5.6.1 Integration with the CMOS-based Bio-Assay Platform
This membrane filtration system can be combined with the fully integrated assay
platform in an arrangement depicted in Figure 5.8. A drop of whole blood is placed on
the membrane filter, and the top of the vial is sealed. The cartridge is then agitated to
elute the protein through the filter and into the buffer solution in the vial. This agitation
concurrently re-suspends in solution the magnetic beads found in the vial, which bind to
the target analyte and which then settle via gravity to the surface of the IC bonded facing
up at the bottom of the vial. The target analyte strongly tethers the magnetic beads to the
surface of the IC through a strong immunological complex. The non-immunologically
bound beads are removed by on-chip generated magnetic forces, while the
immunologically bound beads remain stationary and are detected by an array of Hall
sensors embedded under the surface of the IC.
This scheme is ideal for reducing incubation times since solution phase kinetics
can be achieved by capturing the target analyte in the filtrate with the re-suspended
magnetic beads. Lengthy diffusion times are overcome by the beads settling quickly via
gravity to the surface of the chip, and the total analyte incubation time can be modulated
through the bead settling distance.
Figure 5.8: Integration of the membrane filtration with the CMOS bio-Assay
platform
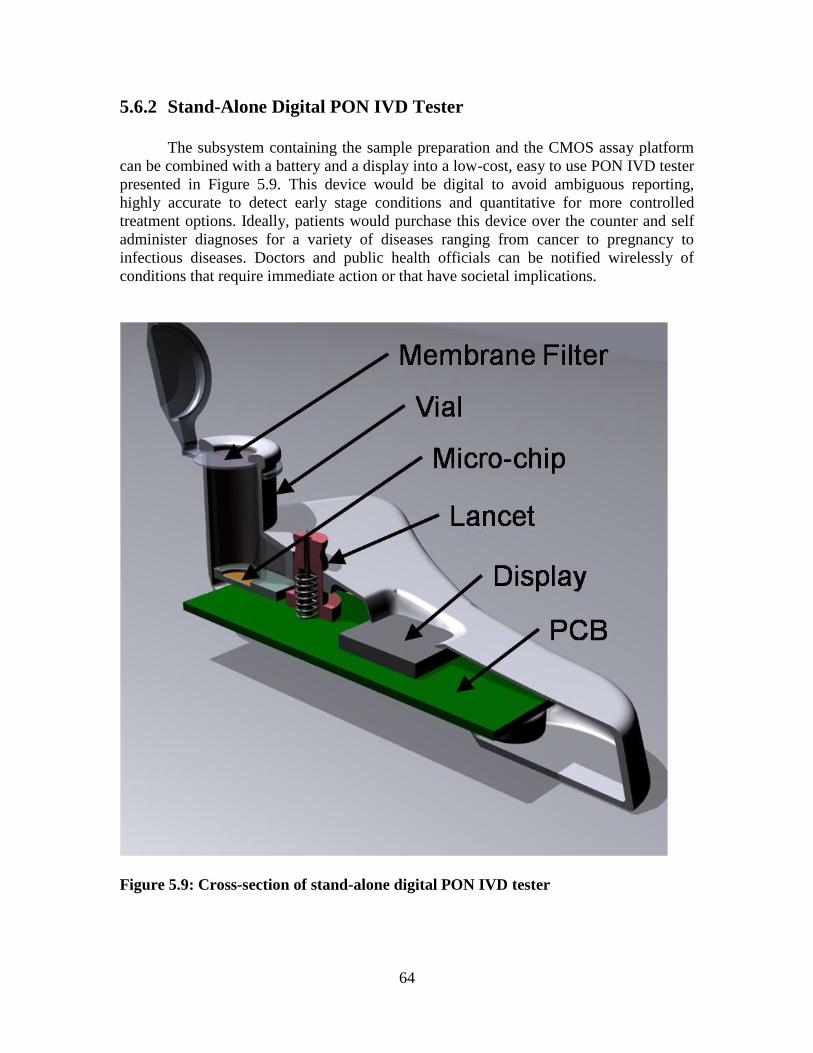
64
5.6.2 Stand-Alone Digital PON IVD Tester
The subsystem containing the sample preparation and the CMOS assay platform
can be combined with a battery and a display into a low-cost, easy to use PON IVD tester
presented in Figure 5.9. This device would be digital to avoid ambiguous reporting,
highly accurate to detect early stage conditions and quantitative for more controlled
treatment options. Ideally, patients would purchase this device over the counter and self
administer diagnoses for a variety of diseases ranging from cancer to pregnancy to
infectious diseases. Doctors and public health officials can be notified wirelessly of
conditions that require immediate action or that have societal implications.
Figure 5.9: Cross-section of stand-alone digital PON IVD tester
65
5.6.3 Future Directions
While the initial results are encouraging, statistical significance and repeatability
work were restricted due to the limited number of CMOS chips available for this work.
While the sensitivity displayed by this assay platform was high, the quantitative
resolution was lacking. To overcome the high variability that degraded quantitative
precision, the number of sensors can be increased to over 1000, on-chip concentration as
described in Chapter 2 can be implemented on the assay platform to further increase the
signal amplitude, and the surface functionalization can be improved through the use of
hetero-bifunctional cross-linkers that bind and orient the antibodies densely on the gold
surface32
.
Increasing the number of sensors is troublesome due to the increased power
dissipation as the magnetic separation conductors get longer. To mitigate this effect, the
trenches can be narrowed and the detection range of the Hall sensors modulated
accordingly. This way, less power is needed to remove the magnetic beads from atop the
Hall sensor.
The specificity of this assay platform has been only cursorily verified using
dengue positive Human serum samples. Historically however, as with Aytur et al.19
, high
bio-chemical sensitivity for the detection of purified samples has translated well for the
detection of highly diverse Human serum samples. The easy fine tuning of the magnetic
separation forces will be invaluable in developing a protocol appropriate for assaying
unprocessed Human samples.
Integration of the back-end electronics on-chip is essential for reducing the cost of
the stand-alone Digital PON IVD tester. This involves integrating the digitization and all
the corresponding external controls. Fortunately, the frequency of operation of the IC is
in the range of 50kHz-5MHz, which makes on-chip integration of all these components
relatively straight-forward.
Finally, much work remains on protocol integration; the filtration protocol must
be seamlessly combined in a robust repeatable manner with the on-chip assay protocol as
described in section 5.6.1.
5.7 Conclusion
In this chapter we have demonstrated a low cost, easy to use sample preparation
system that relies on membrane filtration to block agents such as red blood cells that may
interfere with a bio-chemical assay, and to allow the target analyte to pass. We have
tested a variety of filters concluded that the S/G PVP/PES filter (International Point of
Care, Inc) performed best due to its ability to wick blood, trap red blood cells and elute
the target protein. Magnetic bead labeled assays suggest that human IgG in the filtrate is
detectable down to 125pg/ml, or 900fM. Lastly, whole blood was spiked with serum
taken from a dengue positive individual, and the mixture was filtered. ELISAs used to
optimize the filtration protocol showed that approximately 66% of the anti-dengue
66
antibodies presented on the top of the filter were retrieved in the filtrate. This effective
sample preparation technology can be integrated with the fully integrated CMOS bio-
assay platform presented in the previous Chapter in a single-chip PON IVD tester
solution. Such a low cost, high functionality platform can enable a variety of new
applications in developing nations and in emerging fields like telemedicine. Even more
broadly however, this technology has the potential to decentralize medical care, and by so
doing release the creative energy that has been restrained by the structural rigidities of
that sector.
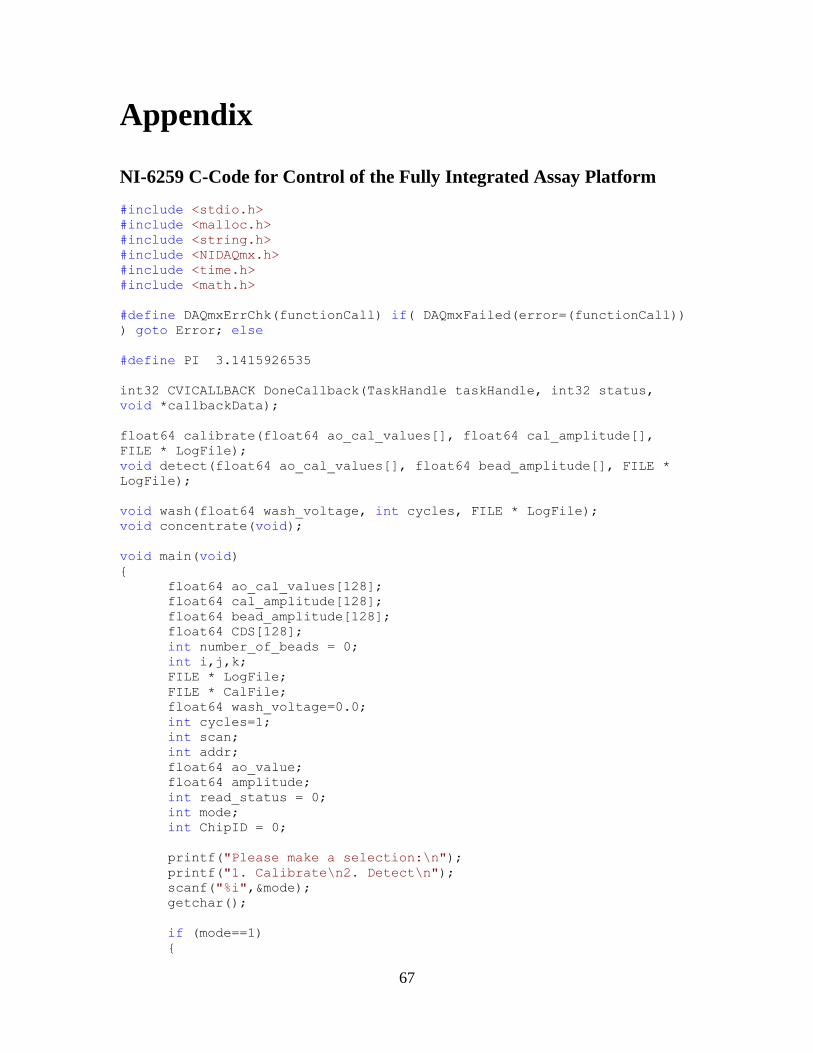
67
Appendix
NI-6259 C-Code for Control of the Fully Integrated Assay Platform
#include <stdio.h>
#include <malloc.h>
#include <string.h>
#include <NIDAQmx.h>
#include <time.h>
#include <math.h>
#define DAQmxErrChk(functionCall) if( DAQmxFailed(error=(functionCall))
) goto Error; else
#define PI 3.1415926535
int32 CVICALLBACK DoneCallback(TaskHandle taskHandle, int32 status,
void *callbackData);
float64 calibrate(float64 ao_cal_values[], float64 cal_amplitude[],
FILE * LogFile);
void detect(float64 ao_cal_values[], float64 bead_amplitude[], FILE *
LogFile);
void wash(float64 wash_voltage, int cycles, FILE * LogFile);
void concentrate(void);
void main(void)
float64 ao_cal_values[128];
float64 cal_amplitude[128];
float64 bead_amplitude[128];
float64 CDS[128];
int number_of_beads = 0;
int i,j,k;
FILE * LogFile;
FILE * CalFile;
float64 wash_voltage=0.0;
int cycles=1;
int scan;
int addr;
float64 ao_value;
float64 amplitude;
int read_status = 0;
int mode;
int ChipID = 0;
printf("Please make a selection:\n");
printf("1. Calibrate\n2. Detect\n");
scanf("%i",&mode);
getchar();
if (mode==1)
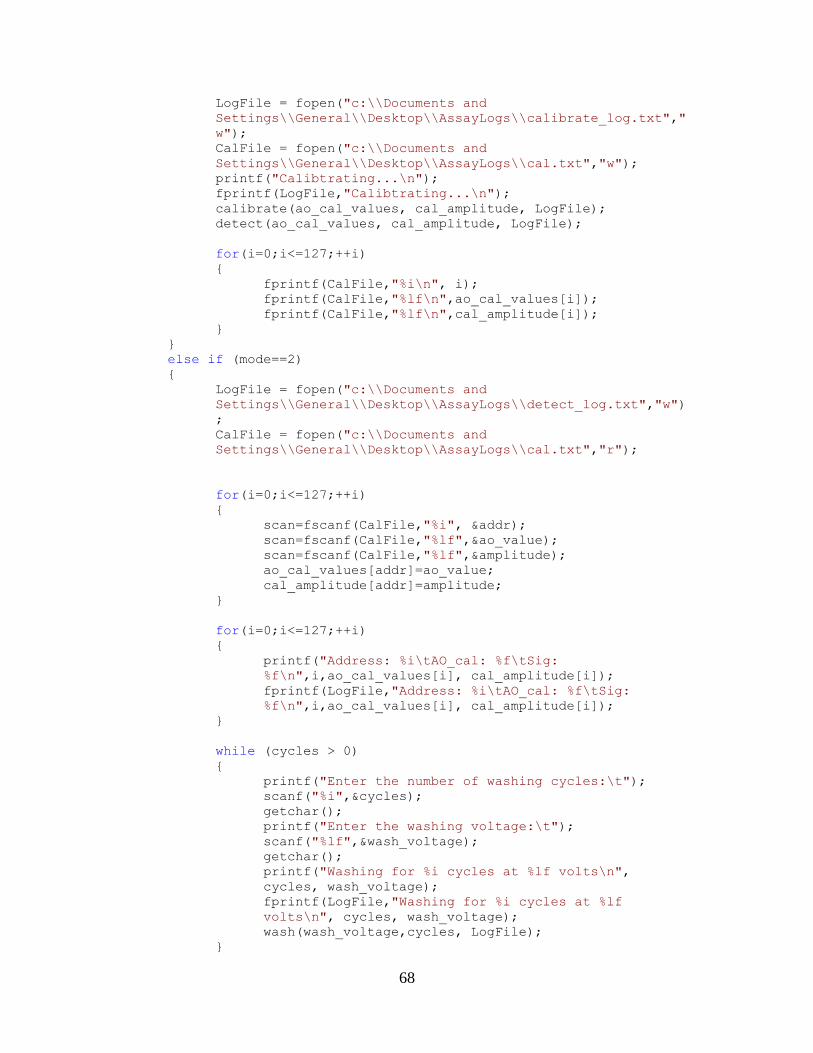
68
LogFile = fopen("c:\\Documents and
Settings\\General\\Desktop\\AssayLogs\\calibrate_log.txt","
w");
CalFile = fopen("c:\\Documents and
Settings\\General\\Desktop\\AssayLogs\\cal.txt","w");
printf("Calibtrating...\n");
fprintf(LogFile,"Calibtrating...\n");
calibrate(ao_cal_values, cal_amplitude, LogFile);
detect(ao_cal_values, cal_amplitude, LogFile);
for(i=0;i<=127;++i)
fprintf(CalFile,"%i\n", i);
fprintf(CalFile,"%lf\n",ao_cal_values[i]);
fprintf(CalFile,"%lf\n",cal_amplitude[i]);
else if (mode==2)
LogFile = fopen("c:\\Documents and
Settings\\General\\Desktop\\AssayLogs\\detect_log.txt","w")
;
CalFile = fopen("c:\\Documents and
Settings\\General\\Desktop\\AssayLogs\\cal.txt","r");
for(i=0;i<=127;++i)
scan=fscanf(CalFile,"%i", &addr);
scan=fscanf(CalFile,"%lf",&ao_value);
scan=fscanf(CalFile,"%lf",&litude);
ao_cal_values[addr]=ao_value;
cal_amplitude[addr]=amplitude;
for(i=0;i<=127;++i)
printf("Address: %i\tAO_cal: %f\tSig:
%f\n",i,ao_cal_values[i], cal_amplitude[i]);
fprintf(LogFile,"Address: %i\tAO_cal: %f\tSig:
%f\n",i,ao_cal_values[i], cal_amplitude[i]);
while (cycles > 0)
printf("Enter the number of washing cycles:\t");
scanf("%i",&cycles);
getchar();
printf("Enter the washing voltage:\t");
scanf("%lf",&wash_voltage);
getchar();
printf("Washing for %i cycles at %lf volts\n",
cycles, wash_voltage);
fprintf(LogFile,"Washing for %i cycles at %lf
volts\n", cycles, wash_voltage);
wash(wash_voltage,cycles, LogFile);
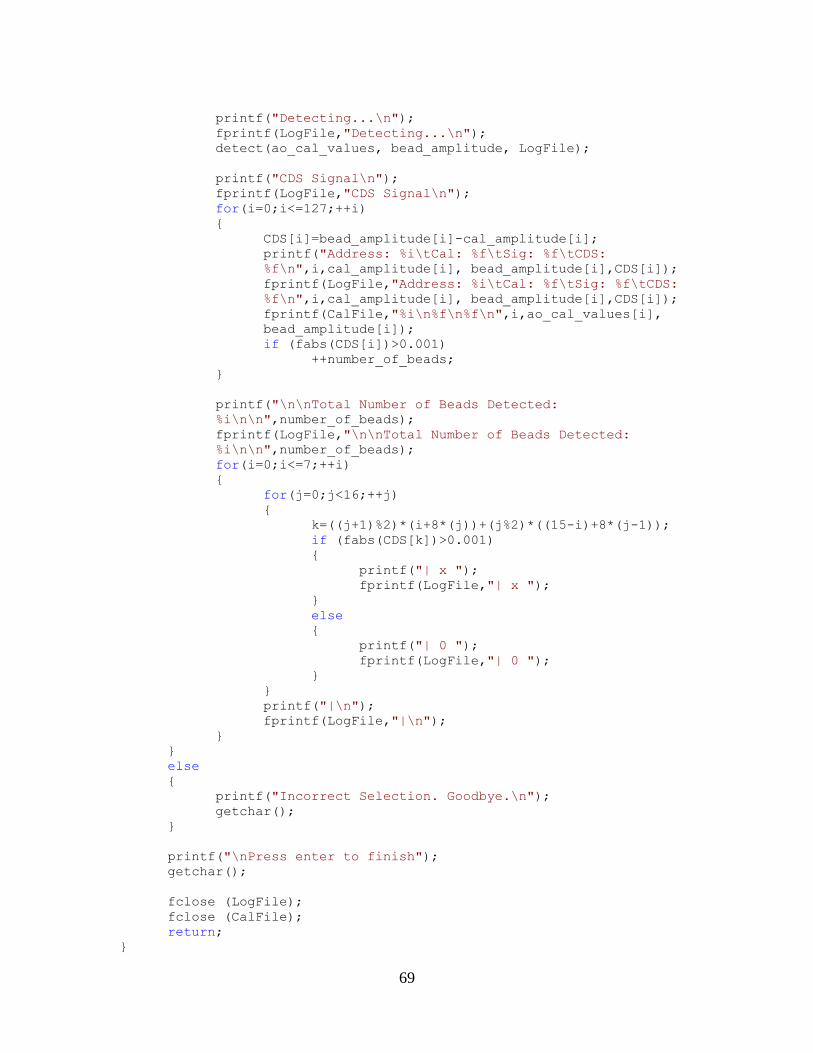
69
printf("Detecting...\n");
fprintf(LogFile,"Detecting...\n");
detect(ao_cal_values, bead_amplitude, LogFile);
printf("CDS Signal\n");
fprintf(LogFile,"CDS Signal\n");
for(i=0;i<=127;++i)
CDS[i]=bead_amplitude[i]-cal_amplitude[i];
printf("Address: %i\tCal: %f\tSig: %f\tCDS:
%f\n",i,cal_amplitude[i], bead_amplitude[i],CDS[i]);
fprintf(LogFile,"Address: %i\tCal: %f\tSig: %f\tCDS:
%f\n",i,cal_amplitude[i], bead_amplitude[i],CDS[i]);
fprintf(CalFile,"%i\n%f\n%f\n",i,ao_cal_values[i],
bead_amplitude[i]);
if (fabs(CDS[i])>0.001)
++number_of_beads;
printf("\n\nTotal Number of Beads Detected:
%i\n\n",number_of_beads);
fprintf(LogFile,"\n\nTotal Number of Beads Detected:
%i\n\n",number_of_beads);
for(i=0;i<=7;++i)
for(j=0;j<16;++j)
k=((j+1)%2)*(i+8*(j))+(j%2)*((15-i)+8*(j-1));
if (fabs(CDS[k])>0.001)
printf("| x ");
fprintf(LogFile,"| x ");
else
printf("| 0 ");
fprintf(LogFile,"| 0 ");
printf("|\n");
fprintf(LogFile,"|\n");
else
printf("Incorrect Selection. Goodbye.\n");
getchar();
printf("\nPress enter to finish");
getchar();
fclose (LogFile);
fclose (CalFile);
return;
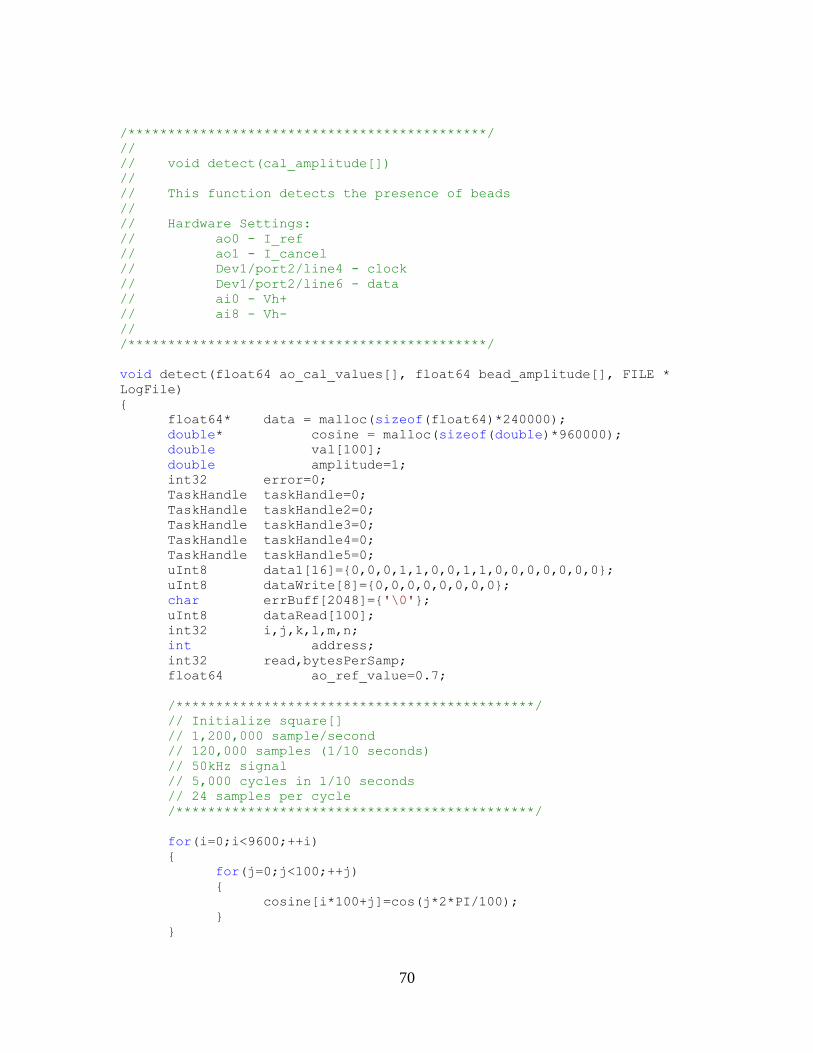
70
/*********************************************/
//
// void detect(cal_amplitude[])
//
// This function detects the presence of beads
//
// Hardware Settings:
// ao0 - I_ref
// ao1 - I_cancel
// Dev1/port2/line4 - clock
// Dev1/port2/line6 - data
// ai0 - Vh+
// ai8 - Vh-
//
/*********************************************/
void detect(float64 ao_cal_values[], float64 bead_amplitude[], FILE *
LogFile)
float64* data = malloc(sizeof(float64)*240000);
double* cosine = malloc(sizeof(double)*960000);
double val[100];
double amplitude=1;
int32 error=0;
TaskHandle taskHandle=0;
TaskHandle taskHandle2=0;
TaskHandle taskHandle3=0;
TaskHandle taskHandle4=0;
TaskHandle taskHandle5=0;
uInt8 data1[16]=0,0,0,1,1,0,0,1,1,0,0,0,0,0,0,0;
uInt8 dataWrite[8]=0,0,0,0,0,0,0,0;
char errBuff[2048]='\0';
uInt8 dataRead[100];
int32 i,j,k,l,m,n;
int address;
int32 read,bytesPerSamp;
float64 ao_ref_value=0.7;
/*********************************************/
// Initialize square[]
// 1,200,000 sample/second
// 120,000 samples (1/10 seconds)
// 50kHz signal
// 5,000 cycles in 1/10 seconds
// 24 samples per cycle
/*********************************************/
for(i=0;i<9600;++i)
for(j=0;j<100;++j)
cosine[i*100+j]=cos(j*2*PI/100);
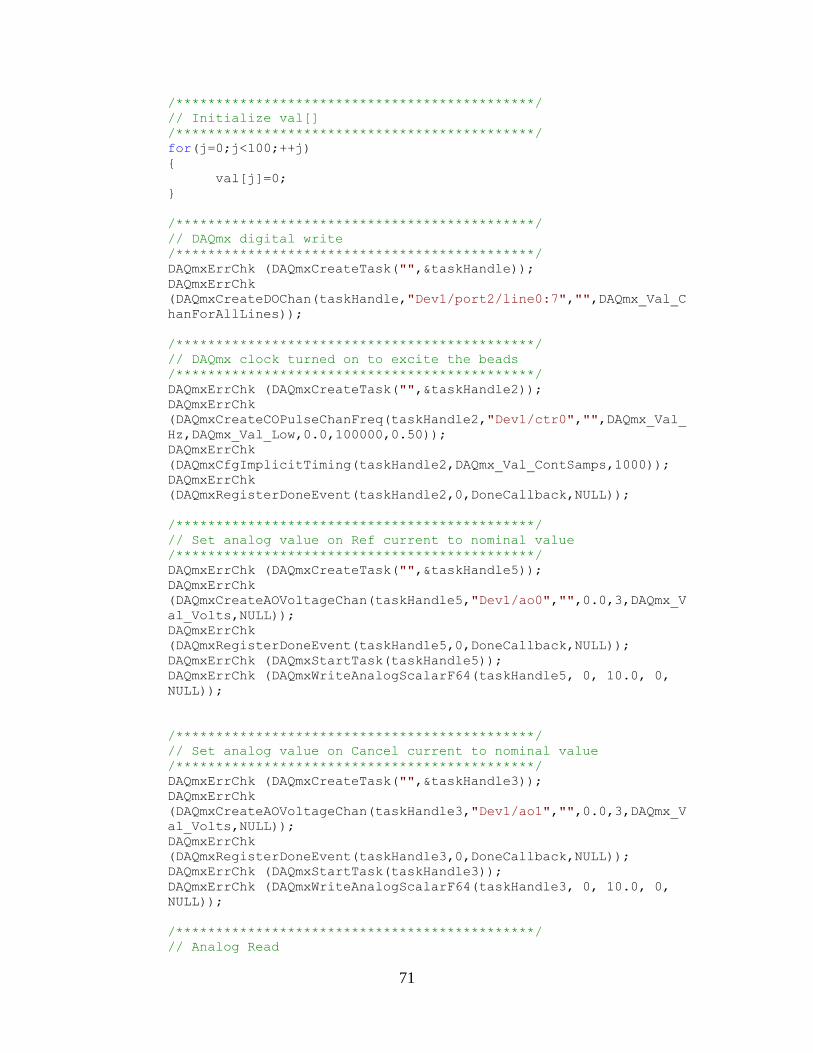
71
/*********************************************/
// Initialize val[]
/*********************************************/
for(j=0;j<100;++j)
val[j]=0;
/*********************************************/
// DAQmx digital write
/*********************************************/
DAQmxErrChk (DAQmxCreateTask("",&taskHandle));
DAQmxErrChk
(DAQmxCreateDOChan(taskHandle,"Dev1/port2/line0:7","",DAQmx_Val_C
hanForAllLines));
/*********************************************/
// DAQmx clock turned on to excite the beads
/*********************************************/
DAQmxErrChk (DAQmxCreateTask("",&taskHandle2));
DAQmxErrChk
(DAQmxCreateCOPulseChanFreq(taskHandle2,"Dev1/ctr0","",DAQmx_Val_
Hz,DAQmx_Val_Low,0.0,100000,0.50));
DAQmxErrChk
(DAQmxCfgImplicitTiming(taskHandle2,DAQmx_Val_ContSamps,1000));
DAQmxErrChk
(DAQmxRegisterDoneEvent(taskHandle2,0,DoneCallback,NULL));
/*********************************************/
// Set analog value on Ref current to nominal value
/*********************************************/
DAQmxErrChk (DAQmxCreateTask("",&taskHandle5));
DAQmxErrChk
(DAQmxCreateAOVoltageChan(taskHandle5,"Dev1/ao0","",0.0,3,DAQmx_V
al_Volts,NULL));
DAQmxErrChk
(DAQmxRegisterDoneEvent(taskHandle5,0,DoneCallback,NULL));
DAQmxErrChk (DAQmxStartTask(taskHandle5));
DAQmxErrChk (DAQmxWriteAnalogScalarF64(taskHandle5, 0, 10.0, 0,
NULL));
/*********************************************/
// Set analog value on Cancel current to nominal value
/*********************************************/
DAQmxErrChk (DAQmxCreateTask("",&taskHandle3));
DAQmxErrChk
(DAQmxCreateAOVoltageChan(taskHandle3,"Dev1/ao1","",0.0,3,DAQmx_V
al_Volts,NULL));
DAQmxErrChk
(DAQmxRegisterDoneEvent(taskHandle3,0,DoneCallback,NULL));
DAQmxErrChk (DAQmxStartTask(taskHandle3));
DAQmxErrChk (DAQmxWriteAnalogScalarF64(taskHandle3, 0, 10.0, 0,
NULL));
/*********************************************/
// Analog Read

72
/*********************************************/
DAQmxErrChk (DAQmxCreateTask("",&taskHandle4));
DAQmxErrChk
(DAQmxCreateAIVoltageChan(taskHandle4,"Dev1/ai0","Diff_input",DAQ
mx_Val_Diff,-0.2,0.2,DAQmx_Val_Volts,NULL));
DAQmxErrChk
(DAQmxCfgSampClkTiming(taskHandle4,"",1200000.0,DAQmx_Val_Rising,
DAQmx_Val_FiniteSamps,240000));
for (n=0;n<=130;++n)
l=(17*n)%128;
//l=n%128;
for(m = 0; m<=6; ++m)
data1[9+m] = (l >> m) & 0x01;
DAQmxErrChk (DAQmxStartTask(taskHandle));
/*********************************************/
// Clear the data buffer dataWrite[6] by toggling
dataWrite[4] 32x
// corresponding to Dev1/port2/line6 and 4 respectively
/*********************************************/
for(j=0;j<32;++j)
dataWrite[6] = 0;
dataWrite[4] = 0;
DAQmxErrChk
(DAQmxWriteDigitalLines(taskHandle,1,1,10.0,DAQmx_Val
_GroupByChannel,dataWrite,NULL,NULL));
DAQmxErrChk
(DAQmxReadDigitalLines(taskHandle,1,10.0,DAQmx_Val_Gr
oupByChannel,dataRead,100,&read,&bytesPerSamp,NULL));
dataWrite[4] = 1;
DAQmxErrChk
(DAQmxWriteDigitalLines(taskHandle,1,1,10.0,DAQmx_Val
_GroupByChannel,dataWrite,NULL,NULL));
DAQmxErrChk
(DAQmxReadDigitalLines(taskHandle,1,10.0,DAQmx_Val_Gr
oupByChannel,dataRead,100,&read,&bytesPerSamp,NULL));
/*********************************************/
// Uploading data from data1[16] starting with a leading 1
/*********************************************/
dataWrite[6] = 1;
dataWrite[4] = 0;
DAQmxErrChk
(DAQmxWriteDigitalLines(taskHandle,1,1,10.0,DAQmx_Val_Group
ByChannel,dataWrite,NULL,NULL));
DAQmxErrChk
(DAQmxReadDigitalLines(taskHandle,1,10.0,DAQmx_Val_GroupByC
hannel,dataRead,100,&read,&bytesPerSamp,NULL));
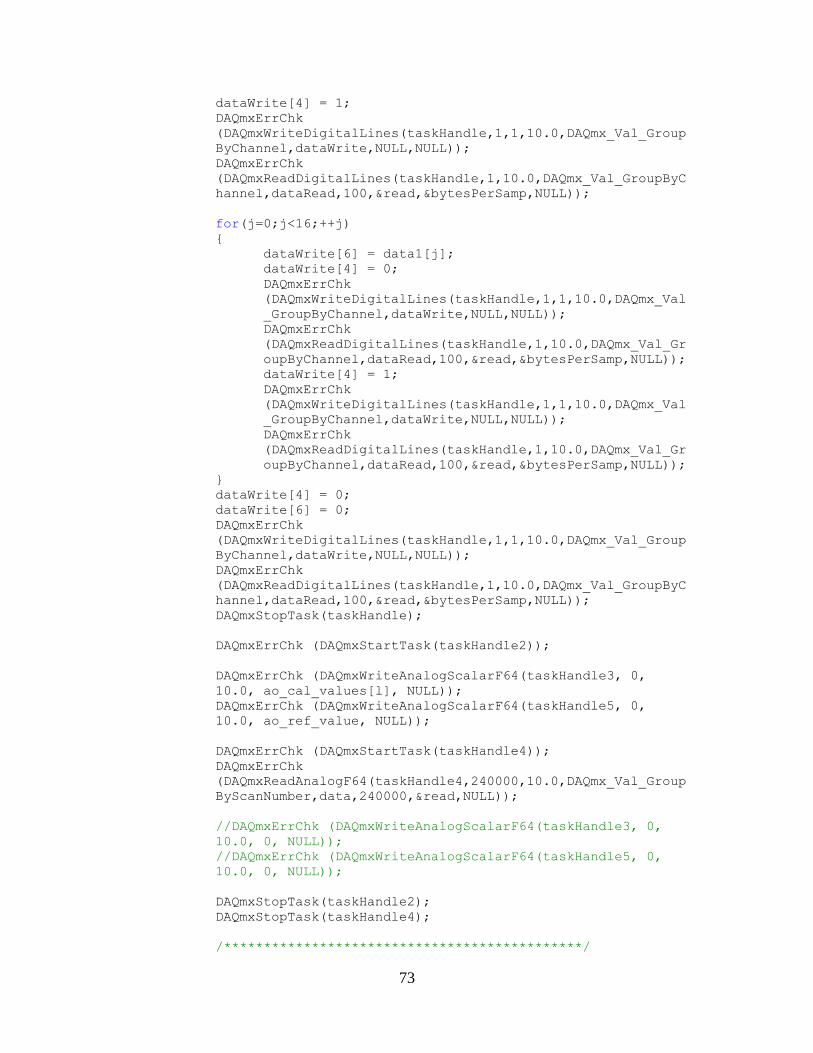
73
dataWrite[4] = 1;
DAQmxErrChk
(DAQmxWriteDigitalLines(taskHandle,1,1,10.0,DAQmx_Val_Group
ByChannel,dataWrite,NULL,NULL));
DAQmxErrChk
(DAQmxReadDigitalLines(taskHandle,1,10.0,DAQmx_Val_GroupByC
hannel,dataRead,100,&read,&bytesPerSamp,NULL));
for(j=0;j<16;++j)
dataWrite[6] = data1[j];
dataWrite[4] = 0;
DAQmxErrChk
(DAQmxWriteDigitalLines(taskHandle,1,1,10.0,DAQmx_Val
_GroupByChannel,dataWrite,NULL,NULL));
DAQmxErrChk
(DAQmxReadDigitalLines(taskHandle,1,10.0,DAQmx_Val_Gr
oupByChannel,dataRead,100,&read,&bytesPerSamp,NULL));
dataWrite[4] = 1;
DAQmxErrChk
(DAQmxWriteDigitalLines(taskHandle,1,1,10.0,DAQmx_Val
_GroupByChannel,dataWrite,NULL,NULL));
DAQmxErrChk
(DAQmxReadDigitalLines(taskHandle,1,10.0,DAQmx_Val_Gr
oupByChannel,dataRead,100,&read,&bytesPerSamp,NULL));
dataWrite[4] = 0;
dataWrite[6] = 0;
DAQmxErrChk
(DAQmxWriteDigitalLines(taskHandle,1,1,10.0,DAQmx_Val_Group
ByChannel,dataWrite,NULL,NULL));
DAQmxErrChk
(DAQmxReadDigitalLines(taskHandle,1,10.0,DAQmx_Val_GroupByC
hannel,dataRead,100,&read,&bytesPerSamp,NULL));
DAQmxStopTask(taskHandle);
DAQmxErrChk (DAQmxStartTask(taskHandle2));
DAQmxErrChk (DAQmxWriteAnalogScalarF64(taskHandle3, 0,
10.0, ao_cal_values[l], NULL));
DAQmxErrChk (DAQmxWriteAnalogScalarF64(taskHandle5, 0,
10.0, ao_ref_value, NULL));
DAQmxErrChk (DAQmxStartTask(taskHandle4));
DAQmxErrChk
(DAQmxReadAnalogF64(taskHandle4,240000,10.0,DAQmx_Val_Group
ByScanNumber,data,240000,&read,NULL));
//DAQmxErrChk (DAQmxWriteAnalogScalarF64(taskHandle3, 0,
10.0, 0, NULL));
//DAQmxErrChk (DAQmxWriteAnalogScalarF64(taskHandle5, 0,
10.0, 0, NULL));
DAQmxStopTask(taskHandle2);
DAQmxStopTask(taskHandle4);
/*********************************************/
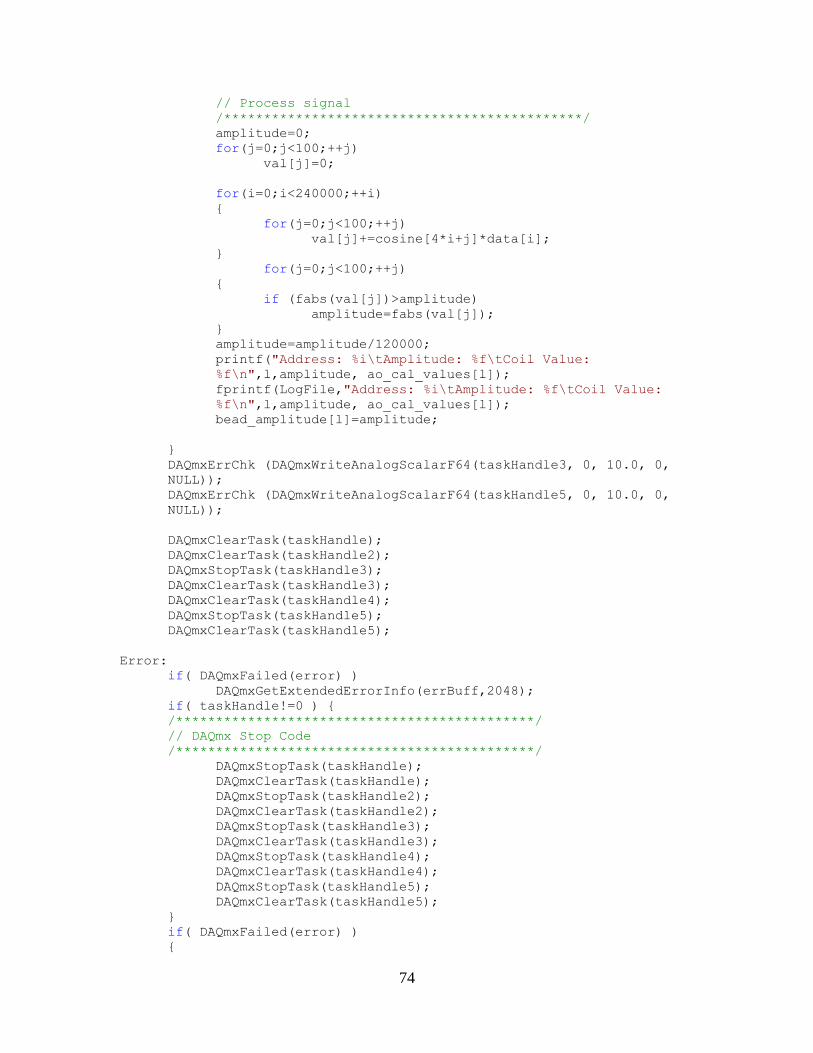
74
// Process signal
/*********************************************/
amplitude=0;
for(j=0;j<100;++j)
val[j]=0;
for(i=0;i<240000;++i)
for(j=0;j<100;++j)
val[j]+=cosine[4*i+j]*data[i];
for(j=0;j<100;++j)
if (fabs(val[j])>amplitude)
amplitude=fabs(val[j]);
amplitude=amplitude/120000;
printf("Address: %i\tAmplitude: %f\tCoil Value:
%f\n",l,amplitude, ao_cal_values[l]);
fprintf(LogFile,"Address: %i\tAmplitude: %f\tCoil Value:
%f\n",l,amplitude, ao_cal_values[l]);
bead_amplitude[l]=amplitude;
DAQmxErrChk (DAQmxWriteAnalogScalarF64(taskHandle3, 0, 10.0, 0,
NULL));
DAQmxErrChk (DAQmxWriteAnalogScalarF64(taskHandle5, 0, 10.0, 0,
NULL));
DAQmxClearTask(taskHandle);
DAQmxClearTask(taskHandle2);
DAQmxStopTask(taskHandle3);
DAQmxClearTask(taskHandle3);
DAQmxClearTask(taskHandle4);
DAQmxStopTask(taskHandle5);
DAQmxClearTask(taskHandle5);
Error:
if( DAQmxFailed(error) )
DAQmxGetExtendedErrorInfo(errBuff,2048);
if( taskHandle!=0 )
/*********************************************/
// DAQmx Stop Code
/*********************************************/
DAQmxStopTask(taskHandle);
DAQmxClearTask(taskHandle);
DAQmxStopTask(taskHandle2);
DAQmxClearTask(taskHandle2);
DAQmxStopTask(taskHandle3);
DAQmxClearTask(taskHandle3);
DAQmxStopTask(taskHandle4);
DAQmxClearTask(taskHandle4);
DAQmxStopTask(taskHandle5);
DAQmxClearTask(taskHandle5);
if( DAQmxFailed(error) )

75
printf("DAQmx Error: %s\n",errBuff);
getchar();
return;
return;
/*********************************************/
//
// void calibrate(cal_amplitude[])
//
// This function zeroes out the output of each
// Hall sensor before the beads are applied.
//
// Hardware Settings:
// ao0 - I_ref
// ao1 - I_cancel
// Dev1/port2/line4 - clock
// Dev1/port2/line6 - data
// ai0 - Vh+
// ai8 - Vh-
//
/*********************************************/
float64 calibrate(float64 ao_cal_values[], float64 bead_amplitude[],
FILE * LogFile)
float64* data = malloc(sizeof(float64)*24000);
double* cosine = malloc(sizeof(double)*96000);
double val[100];
double amplitude=0;
double min_amplitude=2;
float64 min_cal=10;
int32 error=0;
TaskHandle taskHandle=0;
TaskHandle taskHandle2=0;
TaskHandle taskHandle3=0;
TaskHandle taskHandle4=0;
TaskHandle taskHandle5=0;
uInt8 data1[16]=0,0,0,1,1,0,0,1,1,0,0,0,0,0,0,0;
uInt8 dataWrite[8]=0,0,0,0,0,0,0,0;
char errBuff[2048]='\0';
uInt8 dataRead[100];
int32 i,j,k,l,m,n;
int adbdress;
int32 read,bytesPerSamp;
float64 ao_ref_value=0.7;
float64 ao_cal_value=0.7;
float64 step=0.0005;
/*********************************************/
// Initialize square[]
// 1,200,000 sample/second
// 120,000 samples (1/10 seconds)
// 50kHz signal
// 5,000 cycles in 1/10 seconds
// 24 samples per cycle
/*********************************************/
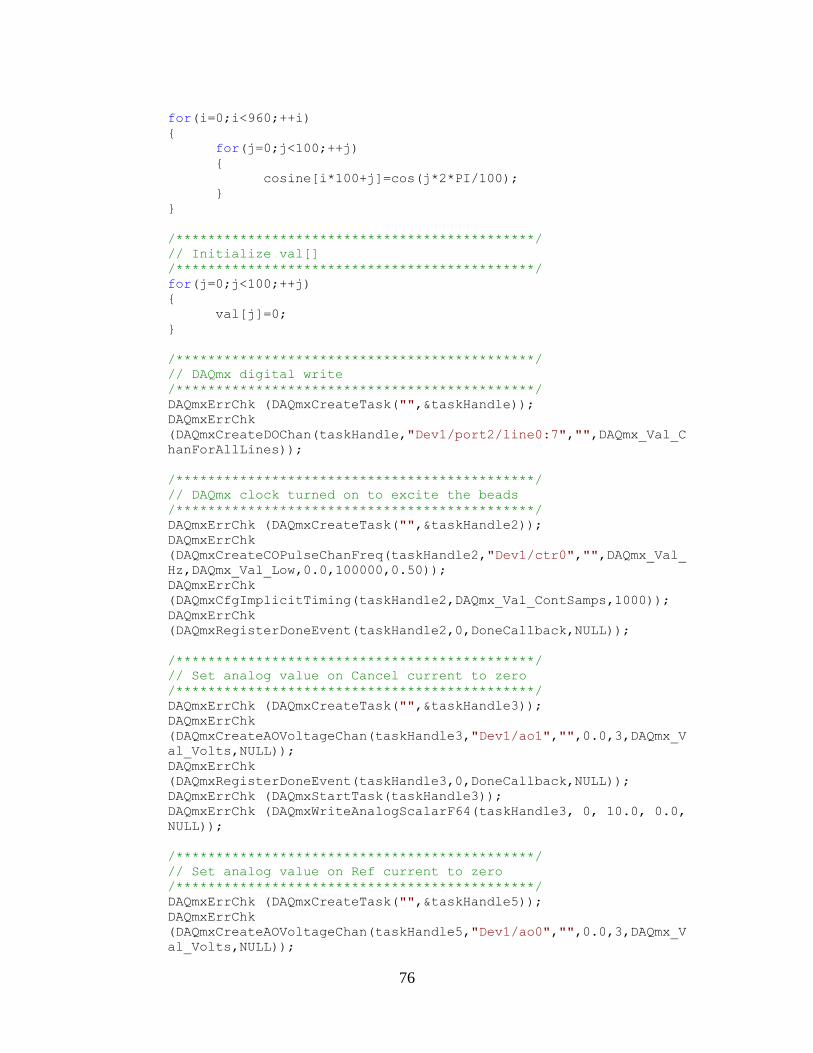
76
for(i=0;i<960;++i)
for(j=0;j<100;++j)
cosine[i*100+j]=cos(j*2*PI/100);
/*********************************************/
// Initialize val[]
/*********************************************/
for(j=0;j<100;++j)
val[j]=0;
/*********************************************/
// DAQmx digital write
/*********************************************/
DAQmxErrChk (DAQmxCreateTask("",&taskHandle));
DAQmxErrChk
(DAQmxCreateDOChan(taskHandle,"Dev1/port2/line0:7","",DAQmx_Val_C
hanForAllLines));
/*********************************************/
// DAQmx clock turned on to excite the beads
/*********************************************/
DAQmxErrChk (DAQmxCreateTask("",&taskHandle2));
DAQmxErrChk
(DAQmxCreateCOPulseChanFreq(taskHandle2,"Dev1/ctr0","",DAQmx_Val_
Hz,DAQmx_Val_Low,0.0,100000,0.50));
DAQmxErrChk
(DAQmxCfgImplicitTiming(taskHandle2,DAQmx_Val_ContSamps,1000));
DAQmxErrChk
(DAQmxRegisterDoneEvent(taskHandle2,0,DoneCallback,NULL));
/*********************************************/
// Set analog value on Cancel current to zero
/*********************************************/
DAQmxErrChk (DAQmxCreateTask("",&taskHandle3));
DAQmxErrChk
(DAQmxCreateAOVoltageChan(taskHandle3,"Dev1/ao1","",0.0,3,DAQmx_V
al_Volts,NULL));
DAQmxErrChk
(DAQmxRegisterDoneEvent(taskHandle3,0,DoneCallback,NULL));
DAQmxErrChk (DAQmxStartTask(taskHandle3));
DAQmxErrChk (DAQmxWriteAnalogScalarF64(taskHandle3, 0, 10.0, 0.0,
NULL));
/*********************************************/
// Set analog value on Ref current to zero
/*********************************************/
DAQmxErrChk (DAQmxCreateTask("",&taskHandle5));
DAQmxErrChk
(DAQmxCreateAOVoltageChan(taskHandle5,"Dev1/ao0","",0.0,3,DAQmx_V
al_Volts,NULL));
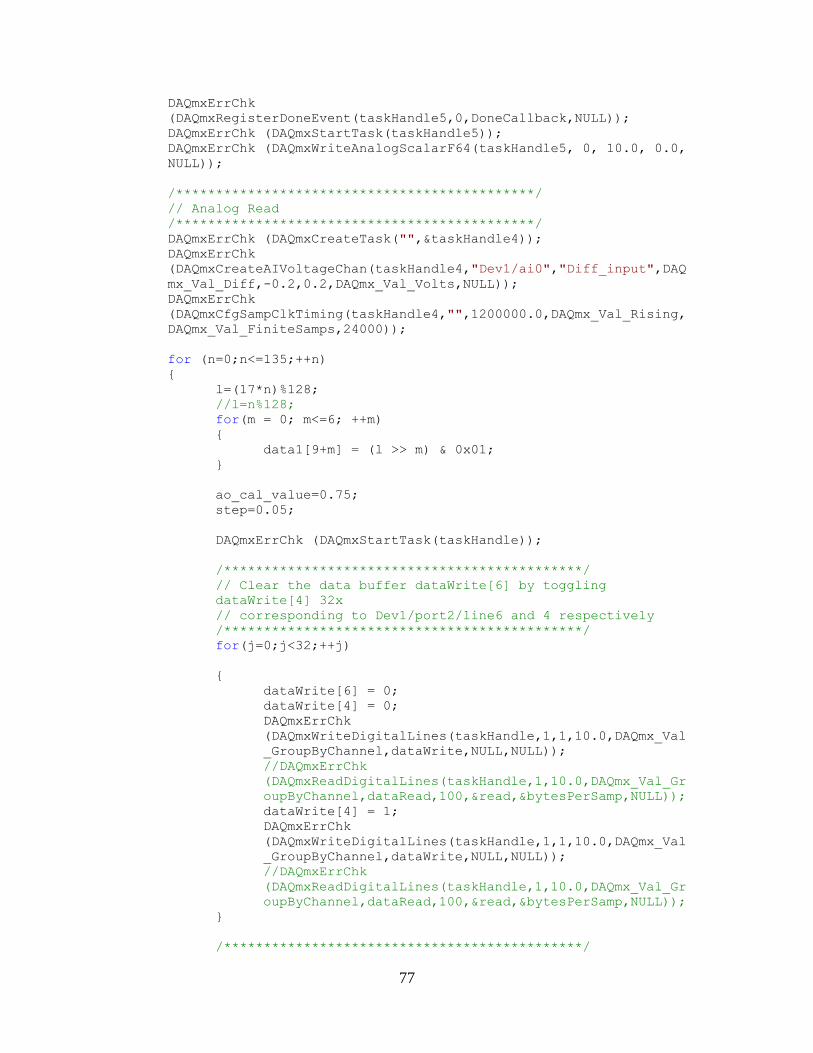
77
DAQmxErrChk
(DAQmxRegisterDoneEvent(taskHandle5,0,DoneCallback,NULL));
DAQmxErrChk (DAQmxStartTask(taskHandle5));
DAQmxErrChk (DAQmxWriteAnalogScalarF64(taskHandle5, 0, 10.0, 0.0,
NULL));
/*********************************************/
// Analog Read
/*********************************************/
DAQmxErrChk (DAQmxCreateTask("",&taskHandle4));
DAQmxErrChk
(DAQmxCreateAIVoltageChan(taskHandle4,"Dev1/ai0","Diff_input",DAQ
mx_Val_Diff,-0.2,0.2,DAQmx_Val_Volts,NULL));
DAQmxErrChk
(DAQmxCfgSampClkTiming(taskHandle4,"",1200000.0,DAQmx_Val_Rising,
DAQmx_Val_FiniteSamps,24000));
for (n=0;n<=135;++n)
l=(17*n)%128;
//l=n%128;
for(m = 0; m<=6; ++m)
data1[9+m] = (l >> m) & 0x01;
ao_cal_value=0.75;
step=0.05;
DAQmxErrChk (DAQmxStartTask(taskHandle));
/*********************************************/
// Clear the data buffer dataWrite[6] by toggling
dataWrite[4] 32x
// corresponding to Dev1/port2/line6 and 4 respectively
/*********************************************/
for(j=0;j<32;++j)
dataWrite[6] = 0;
dataWrite[4] = 0;
DAQmxErrChk
(DAQmxWriteDigitalLines(taskHandle,1,1,10.0,DAQmx_Val
_GroupByChannel,dataWrite,NULL,NULL));
//DAQmxErrChk
(DAQmxReadDigitalLines(taskHandle,1,10.0,DAQmx_Val_Gr
oupByChannel,dataRead,100,&read,&bytesPerSamp,NULL));
dataWrite[4] = 1;
DAQmxErrChk
(DAQmxWriteDigitalLines(taskHandle,1,1,10.0,DAQmx_Val
_GroupByChannel,dataWrite,NULL,NULL));
//DAQmxErrChk
(DAQmxReadDigitalLines(taskHandle,1,10.0,DAQmx_Val_Gr
oupByChannel,dataRead,100,&read,&bytesPerSamp,NULL));
/*********************************************/
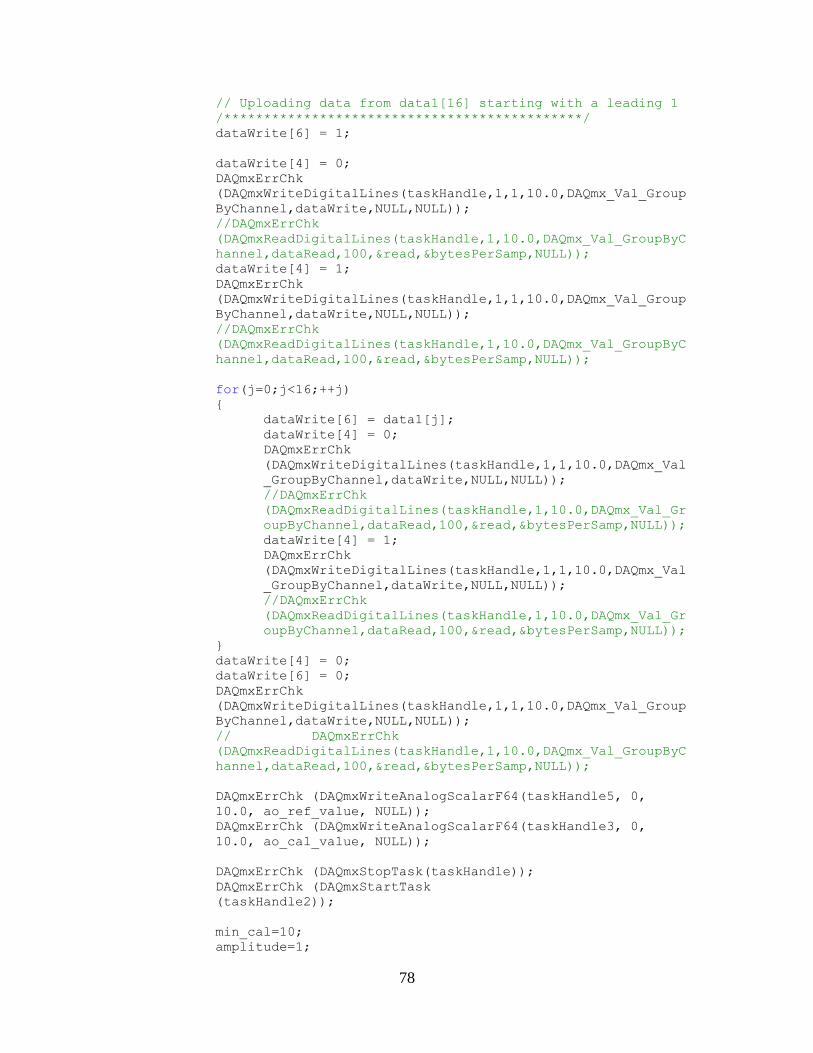
78
// Uploading data from data1[16] starting with a leading 1
/*********************************************/
dataWrite[6] = 1;
dataWrite[4] = 0;
DAQmxErrChk
(DAQmxWriteDigitalLines(taskHandle,1,1,10.0,DAQmx_Val_Group
ByChannel,dataWrite,NULL,NULL));
//DAQmxErrChk
(DAQmxReadDigitalLines(taskHandle,1,10.0,DAQmx_Val_GroupByC
hannel,dataRead,100,&read,&bytesPerSamp,NULL));
dataWrite[4] = 1;
DAQmxErrChk
(DAQmxWriteDigitalLines(taskHandle,1,1,10.0,DAQmx_Val_Group
ByChannel,dataWrite,NULL,NULL));
//DAQmxErrChk
(DAQmxReadDigitalLines(taskHandle,1,10.0,DAQmx_Val_GroupByC
hannel,dataRead,100,&read,&bytesPerSamp,NULL));
for(j=0;j<16;++j)
dataWrite[6] = data1[j];
dataWrite[4] = 0;
DAQmxErrChk
(DAQmxWriteDigitalLines(taskHandle,1,1,10.0,DAQmx_Val
_GroupByChannel,dataWrite,NULL,NULL));
//DAQmxErrChk
(DAQmxReadDigitalLines(taskHandle,1,10.0,DAQmx_Val_Gr
oupByChannel,dataRead,100,&read,&bytesPerSamp,NULL));
dataWrite[4] = 1;
DAQmxErrChk
(DAQmxWriteDigitalLines(taskHandle,1,1,10.0,DAQmx_Val
_GroupByChannel,dataWrite,NULL,NULL));
//DAQmxErrChk
(DAQmxReadDigitalLines(taskHandle,1,10.0,DAQmx_Val_Gr
oupByChannel,dataRead,100,&read,&bytesPerSamp,NULL));
dataWrite[4] = 0;
dataWrite[6] = 0;
DAQmxErrChk
(DAQmxWriteDigitalLines(taskHandle,1,1,10.0,DAQmx_Val_Group
ByChannel,dataWrite,NULL,NULL));
// DAQmxErrChk
(DAQmxReadDigitalLines(taskHandle,1,10.0,DAQmx_Val_GroupByC
hannel,dataRead,100,&read,&bytesPerSamp,NULL));
DAQmxErrChk (DAQmxWriteAnalogScalarF64(taskHandle5, 0,
10.0, ao_ref_value, NULL));
DAQmxErrChk (DAQmxWriteAnalogScalarF64(taskHandle3, 0,
10.0, ao_cal_value, NULL));
DAQmxErrChk (DAQmxStopTask(taskHandle));
DAQmxErrChk (DAQmxStartTask
(taskHandle2));
min_cal=10;
amplitude=1;
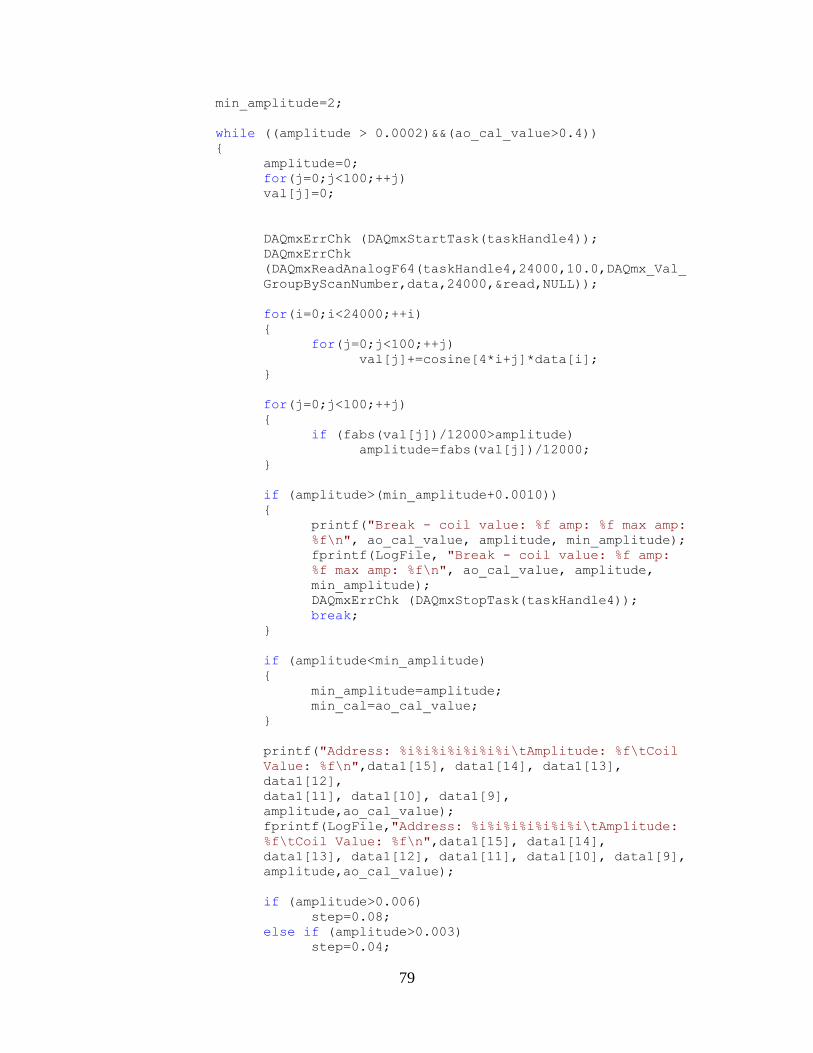
79
min_amplitude=2;
while ((amplitude > 0.0002)&&(ao_cal_value>0.4))
amplitude=0;
for(j=0;j<100;++j)
val[j]=0;
DAQmxErrChk (DAQmxStartTask(taskHandle4));
DAQmxErrChk
(DAQmxReadAnalogF64(taskHandle4,24000,10.0,DAQmx_Val_
GroupByScanNumber,data,24000,&read,NULL));
for(i=0;i<24000;++i)
for(j=0;j<100;++j)
val[j]+=cosine[4*i+j]*data[i];
for(j=0;j<100;++j)
if (fabs(val[j])/12000>amplitude)
amplitude=fabs(val[j])/12000;
if (amplitude>(min_amplitude+0.0010))
printf("Break - coil value: %f amp: %f max amp:
%f\n", ao_cal_value, amplitude, min_amplitude);
fprintf(LogFile, "Break - coil value: %f amp:
%f max amp: %f\n", ao_cal_value, amplitude,
min_amplitude);
DAQmxErrChk (DAQmxStopTask(taskHandle4));
break;
if (amplitude<min_amplitude)
min_amplitude=amplitude;
min_cal=ao_cal_value;
printf("Address: %i%i%i%i%i%i%i\tAmplitude: %f\tCoil
Value: %f\n",data1[15], data1[14], data1[13],
data1[12],
data1[11], data1[10], data1[9],
amplitude,ao_cal_value);
fprintf(LogFile,"Address: %i%i%i%i%i%i%i\tAmplitude:
%f\tCoil Value: %f\n",data1[15], data1[14],
data1[13], data1[12], data1[11], data1[10], data1[9],
amplitude,ao_cal_value);
if (amplitude>0.006)
step=0.08;
else if (amplitude>0.003)
step=0.04;
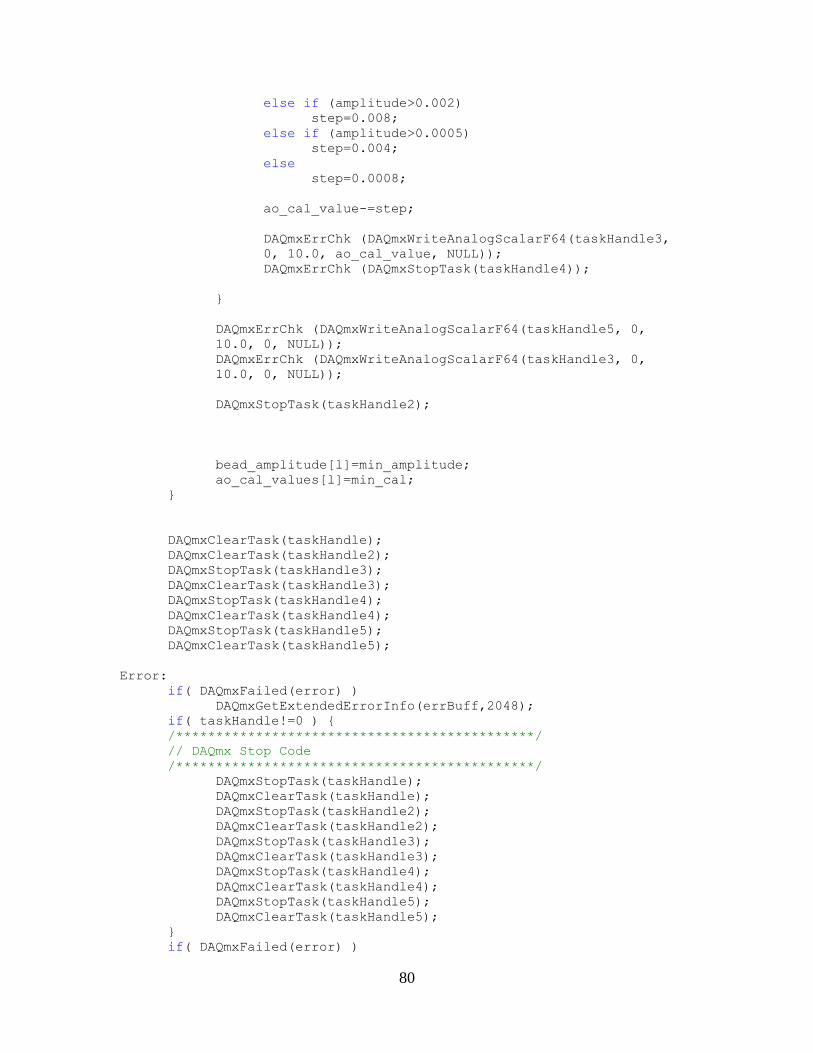
80
else if (amplitude>0.002)
step=0.008;
else if (amplitude>0.0005)
step=0.004;
else
step=0.0008;
ao_cal_value-=step;
DAQmxErrChk (DAQmxWriteAnalogScalarF64(taskHandle3,
0, 10.0, ao_cal_value, NULL));
DAQmxErrChk (DAQmxStopTask(taskHandle4));
DAQmxErrChk (DAQmxWriteAnalogScalarF64(taskHandle5, 0,
10.0, 0, NULL));
DAQmxErrChk (DAQmxWriteAnalogScalarF64(taskHandle3, 0,
10.0, 0, NULL));
DAQmxStopTask(taskHandle2);
bead_amplitude[l]=min_amplitude;
ao_cal_values[l]=min_cal;
DAQmxClearTask(taskHandle);
DAQmxClearTask(taskHandle2);
DAQmxStopTask(taskHandle3);
DAQmxClearTask(taskHandle3);
DAQmxStopTask(taskHandle4);
DAQmxClearTask(taskHandle4);
DAQmxStopTask(taskHandle5);
DAQmxClearTask(taskHandle5);
Error:
if( DAQmxFailed(error) )
DAQmxGetExtendedErrorInfo(errBuff,2048);
if( taskHandle!=0 )
/*********************************************/
// DAQmx Stop Code
/*********************************************/
DAQmxStopTask(taskHandle);
DAQmxClearTask(taskHandle);
DAQmxStopTask(taskHandle2);
DAQmxClearTask(taskHandle2);
DAQmxStopTask(taskHandle3);
DAQmxClearTask(taskHandle3);
DAQmxStopTask(taskHandle4);
DAQmxClearTask(taskHandle4);
DAQmxStopTask(taskHandle5);
DAQmxClearTask(taskHandle5);
if( DAQmxFailed(error) )
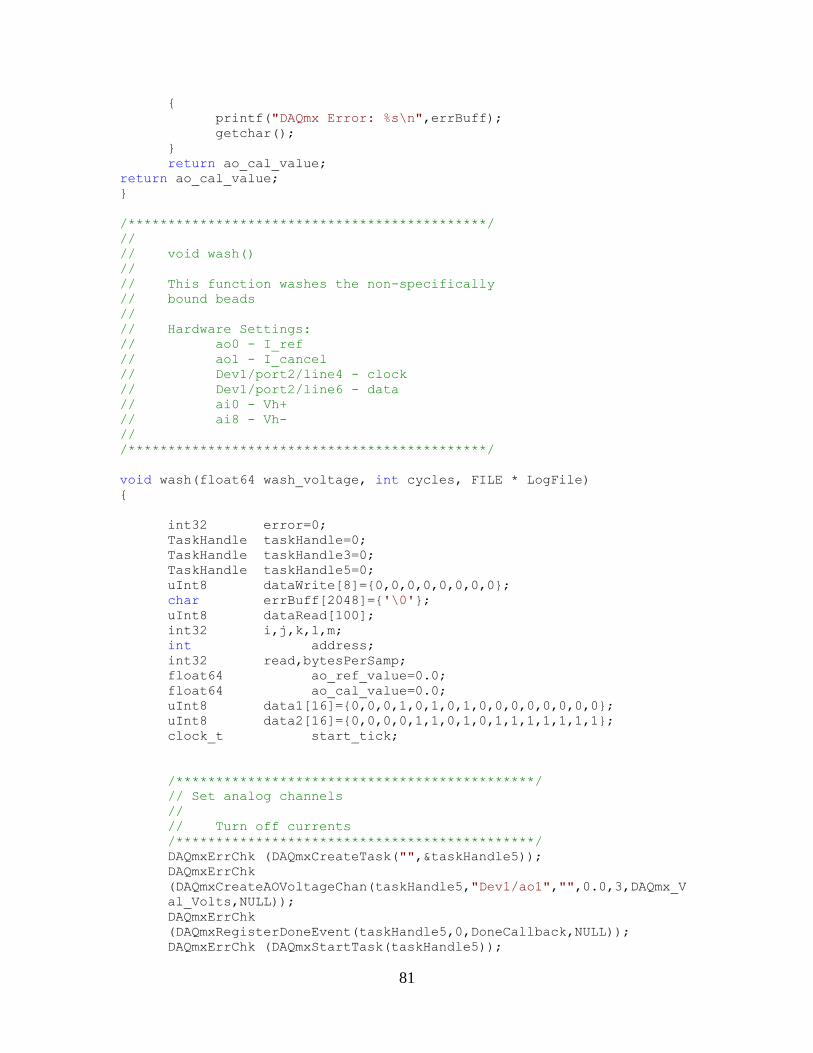
81
printf("DAQmx Error: %s\n",errBuff);
getchar();
return ao_cal_value;
return ao_cal_value;
/*********************************************/
//
// void wash()
//
// This function washes the non-specifically
// bound beads
//
// Hardware Settings:
// ao0 - I_ref
// ao1 - I_cancel
// Dev1/port2/line4 - clock
// Dev1/port2/line6 - data
// ai0 - Vh+
// ai8 - Vh-
//
/*********************************************/
void wash(float64 wash_voltage, int cycles, FILE * LogFile)
int32 error=0;
TaskHandle taskHandle=0;
TaskHandle taskHandle3=0;
TaskHandle taskHandle5=0;
uInt8 dataWrite[8]=0,0,0,0,0,0,0,0;
char errBuff[2048]='\0';
uInt8 dataRead[100];
int32 i,j,k,l,m;
int address;
int32 read,bytesPerSamp;
float64 ao_ref_value=0.0;
float64 ao_cal_value=0.0;
uInt8 data1[16]=0,0,0,1,0,1,0,1,0,0,0,0,0,0,0,0;
uInt8 data2[16]=0,0,0,0,1,1,0,1,0,1,1,1,1,1,1,1;
clock_t start_tick;
/*********************************************/
// Set analog channels
//
// Turn off currents
/*********************************************/
DAQmxErrChk (DAQmxCreateTask("",&taskHandle5));
DAQmxErrChk
(DAQmxCreateAOVoltageChan(taskHandle5,"Dev1/ao1","",0.0,3,DAQmx_V
al_Volts,NULL));
DAQmxErrChk
(DAQmxRegisterDoneEvent(taskHandle5,0,DoneCallback,NULL));
DAQmxErrChk (DAQmxStartTask(taskHandle5));
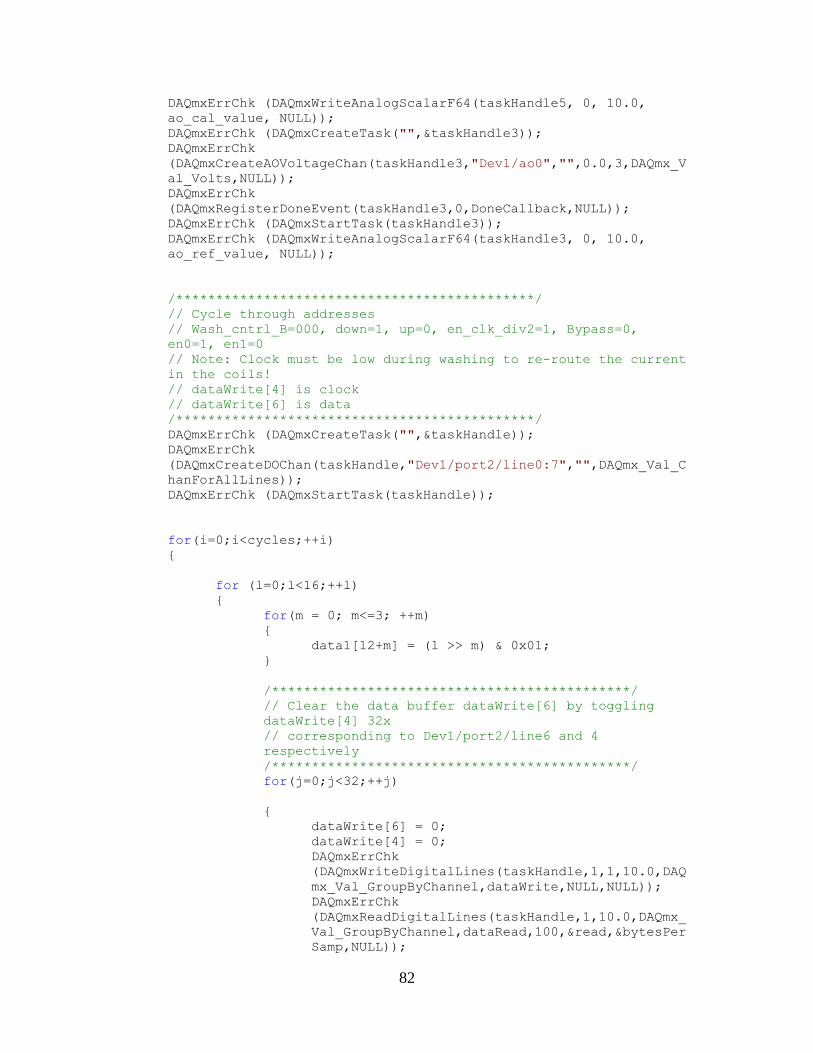
82
DAQmxErrChk (DAQmxWriteAnalogScalarF64(taskHandle5, 0, 10.0,
ao_cal_value, NULL));
DAQmxErrChk (DAQmxCreateTask("",&taskHandle3));
DAQmxErrChk
(DAQmxCreateAOVoltageChan(taskHandle3,"Dev1/ao0","",0.0,3,DAQmx_V
al_Volts,NULL));
DAQmxErrChk
(DAQmxRegisterDoneEvent(taskHandle3,0,DoneCallback,NULL));
DAQmxErrChk (DAQmxStartTask(taskHandle3));
DAQmxErrChk (DAQmxWriteAnalogScalarF64(taskHandle3, 0, 10.0,
ao_ref_value, NULL));
/*********************************************/
// Cycle through addresses
// Wash_cntrl_B=000, down=1, up=0, en_clk_div2=1, Bypass=0,
en0=1, en1=0
// Note: Clock must be low during washing to re-route the current
in the coils!
// dataWrite[4] is clock
// dataWrite[6] is data
/*********************************************/
DAQmxErrChk (DAQmxCreateTask("",&taskHandle));
DAQmxErrChk
(DAQmxCreateDOChan(taskHandle,"Dev1/port2/line0:7","",DAQmx_Val_C
hanForAllLines));
DAQmxErrChk (DAQmxStartTask(taskHandle));
for(i=0;i<cycles;++i)
for (l=0;l<16;++l)
for(m = 0; m<=3; ++m)
data1[12+m] = (l >> m) & 0x01;
/*********************************************/
// Clear the data buffer dataWrite[6] by toggling
dataWrite[4] 32x
// corresponding to Dev1/port2/line6 and 4
respectively
/*********************************************/
for(j=0;j<32;++j)
dataWrite[6] = 0;
dataWrite[4] = 0;
DAQmxErrChk
(DAQmxWriteDigitalLines(taskHandle,1,1,10.0,DAQ
mx_Val_GroupByChannel,dataWrite,NULL,NULL));
DAQmxErrChk
(DAQmxReadDigitalLines(taskHandle,1,10.0,DAQmx_
Val_GroupByChannel,dataRead,100,&read,&bytesPer
Samp,NULL));
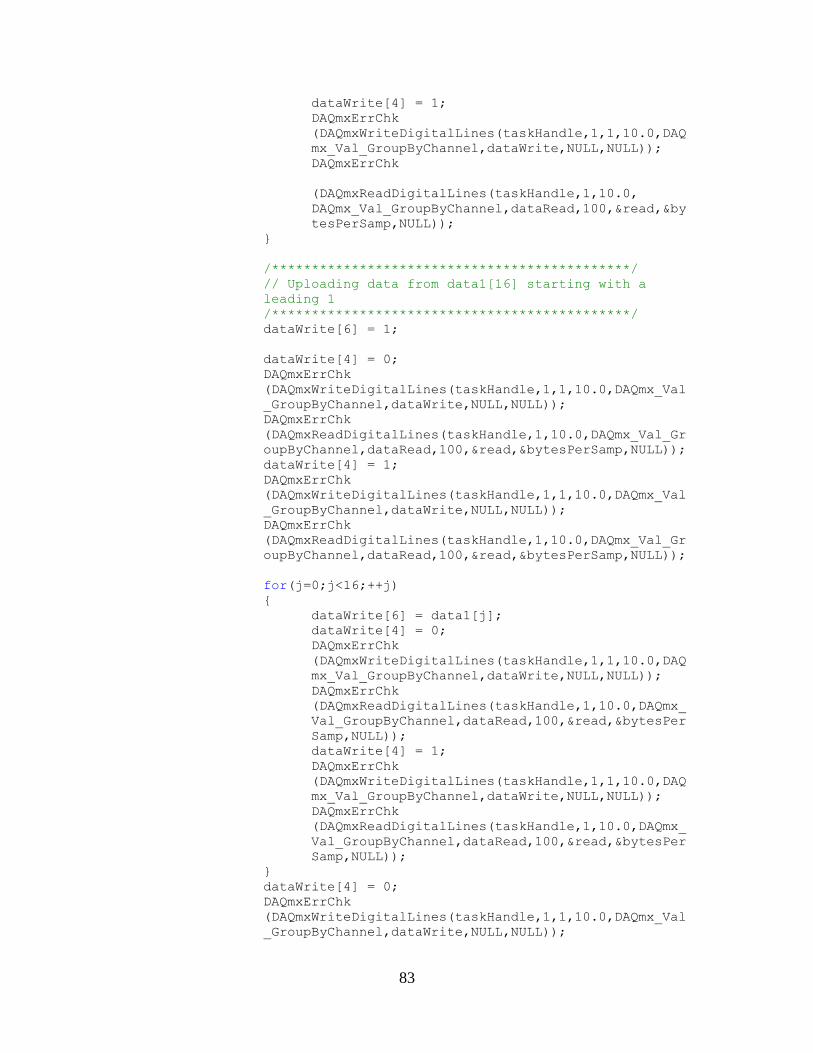
83
dataWrite[4] = 1;
DAQmxErrChk
(DAQmxWriteDigitalLines(taskHandle,1,1,10.0,DAQ
mx_Val_GroupByChannel,dataWrite,NULL,NULL));
DAQmxErrChk
(DAQmxReadDigitalLines(taskHandle,1,10.0,
DAQmx_Val_GroupByChannel,dataRead,100,&read,&by
tesPerSamp,NULL));
/*********************************************/
// Uploading data from data1[16] starting with a
leading 1
/*********************************************/
dataWrite[6] = 1;
dataWrite[4] = 0;
DAQmxErrChk
(DAQmxWriteDigitalLines(taskHandle,1,1,10.0,DAQmx_Val
_GroupByChannel,dataWrite,NULL,NULL));
DAQmxErrChk
(DAQmxReadDigitalLines(taskHandle,1,10.0,DAQmx_Val_Gr
oupByChannel,dataRead,100,&read,&bytesPerSamp,NULL));
dataWrite[4] = 1;
DAQmxErrChk
(DAQmxWriteDigitalLines(taskHandle,1,1,10.0,DAQmx_Val
_GroupByChannel,dataWrite,NULL,NULL));
DAQmxErrChk
(DAQmxReadDigitalLines(taskHandle,1,10.0,DAQmx_Val_Gr
oupByChannel,dataRead,100,&read,&bytesPerSamp,NULL));
for(j=0;j<16;++j)
dataWrite[6] = data1[j];
dataWrite[4] = 0;
DAQmxErrChk
(DAQmxWriteDigitalLines(taskHandle,1,1,10.0,DAQ
mx_Val_GroupByChannel,dataWrite,NULL,NULL));
DAQmxErrChk
(DAQmxReadDigitalLines(taskHandle,1,10.0,DAQmx_
Val_GroupByChannel,dataRead,100,&read,&bytesPer
Samp,NULL));
dataWrite[4] = 1;
DAQmxErrChk
(DAQmxWriteDigitalLines(taskHandle,1,1,10.0,DAQ
mx_Val_GroupByChannel,dataWrite,NULL,NULL));
DAQmxErrChk
(DAQmxReadDigitalLines(taskHandle,1,10.0,DAQmx_
Val_GroupByChannel,dataRead,100,&read,&bytesPer
Samp,NULL));
dataWrite[4] = 0;
DAQmxErrChk
(DAQmxWriteDigitalLines(taskHandle,1,1,10.0,DAQmx_Val
_GroupByChannel,dataWrite,NULL,NULL));
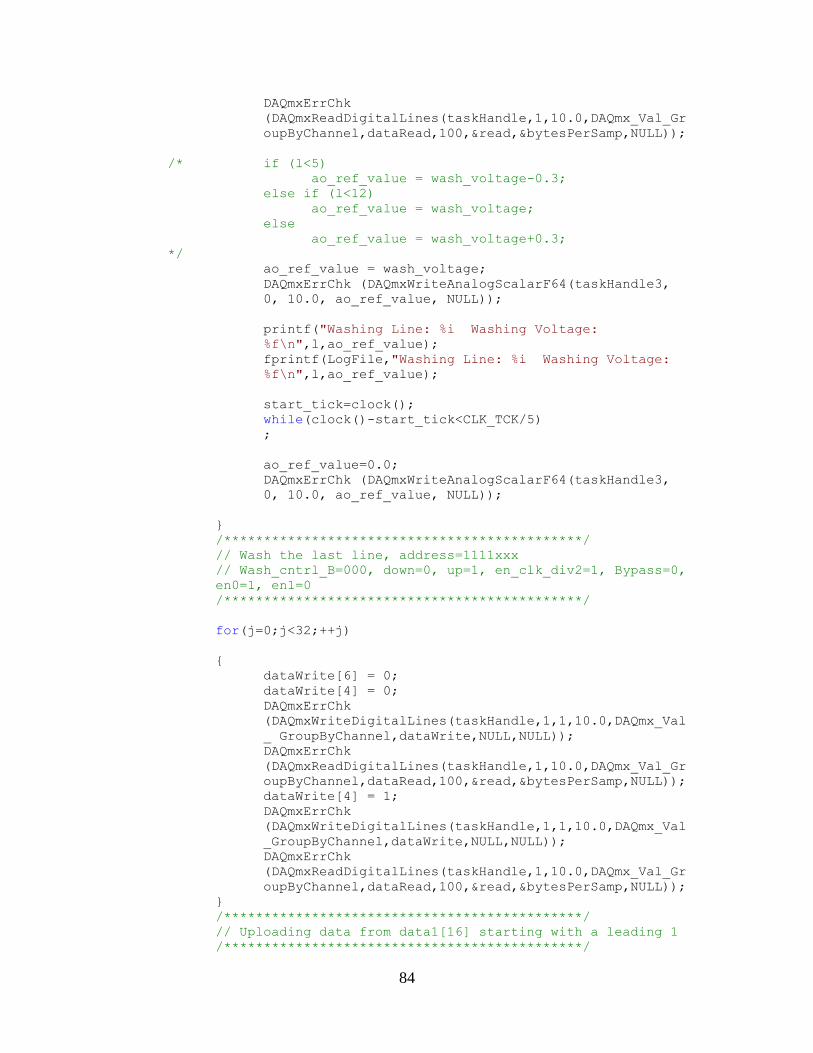
84
DAQmxErrChk
(DAQmxReadDigitalLines(taskHandle,1,10.0,DAQmx_Val_Gr
oupByChannel,dataRead,100,&read,&bytesPerSamp,NULL));
/* if (l<5)
ao_ref_value = wash_voltage-0.3;
else if (l<12)
ao_ref_value = wash_voltage;
else
ao_ref_value = wash_voltage+0.3;
*/
ao_ref_value = wash_voltage;
DAQmxErrChk (DAQmxWriteAnalogScalarF64(taskHandle3,
0, 10.0, ao_ref_value, NULL));
printf("Washing Line: %i Washing Voltage:
%f\n",l,ao_ref_value);
fprintf(LogFile,"Washing Line: %i Washing Voltage:
%f\n",l,ao_ref_value);
start_tick=clock();
while(clock()-start_tick<CLK_TCK/5)
;
ao_ref_value=0.0;
DAQmxErrChk (DAQmxWriteAnalogScalarF64(taskHandle3,
0, 10.0, ao_ref_value, NULL));
/*********************************************/
// Wash the last line, address=1111xxx
// Wash_cntrl_B=000, down=0, up=1, en_clk_div2=1, Bypass=0,
en0=1, en1=0
/*********************************************/
for(j=0;j<32;++j)
dataWrite[6] = 0;
dataWrite[4] = 0;
DAQmxErrChk
(DAQmxWriteDigitalLines(taskHandle,1,1,10.0,DAQmx_Val
_ GroupByChannel,dataWrite,NULL,NULL));
DAQmxErrChk
(DAQmxReadDigitalLines(taskHandle,1,10.0,DAQmx_Val_Gr
oupByChannel,dataRead,100,&read,&bytesPerSamp,NULL));
dataWrite[4] = 1;
DAQmxErrChk
(DAQmxWriteDigitalLines(taskHandle,1,1,10.0,DAQmx_Val
_GroupByChannel,dataWrite,NULL,NULL));
DAQmxErrChk
(DAQmxReadDigitalLines(taskHandle,1,10.0,DAQmx_Val_Gr
oupByChannel,dataRead,100,&read,&bytesPerSamp,NULL));
/*********************************************/
// Uploading data from data1[16] starting with a leading 1
/*********************************************/
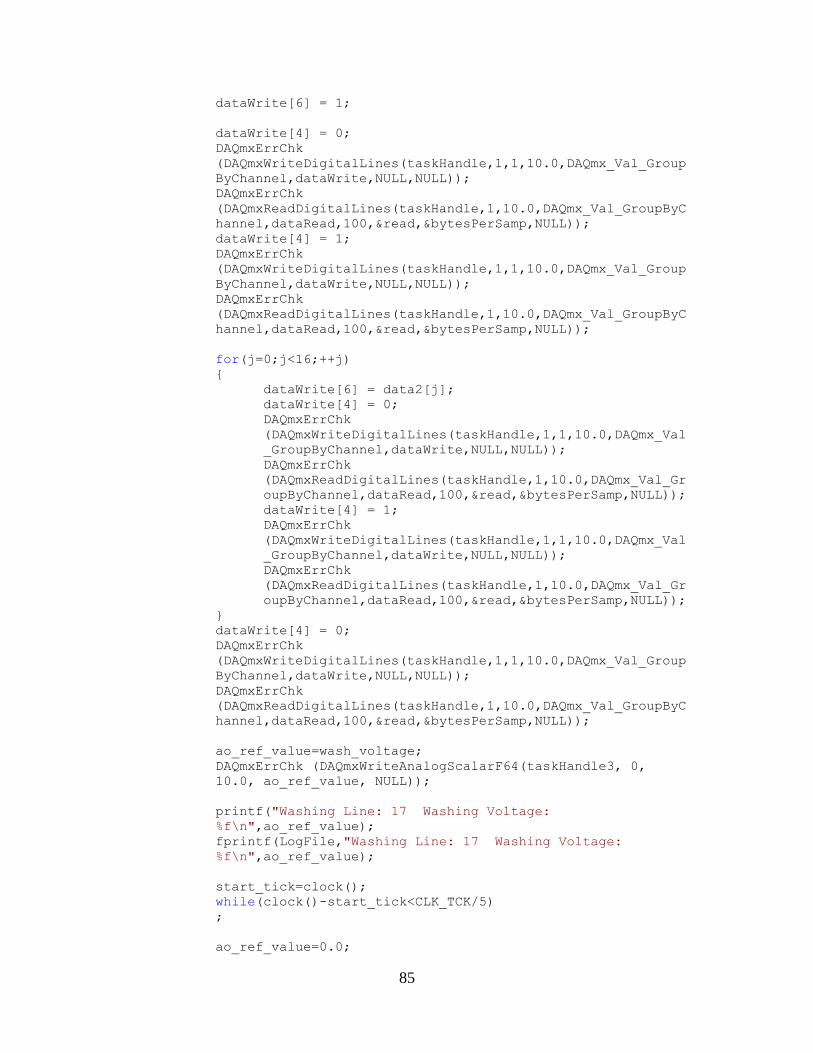
85
dataWrite[6] = 1;
dataWrite[4] = 0;
DAQmxErrChk
(DAQmxWriteDigitalLines(taskHandle,1,1,10.0,DAQmx_Val_Group
ByChannel,dataWrite,NULL,NULL));
DAQmxErrChk
(DAQmxReadDigitalLines(taskHandle,1,10.0,DAQmx_Val_GroupByC
hannel,dataRead,100,&read,&bytesPerSamp,NULL));
dataWrite[4] = 1;
DAQmxErrChk
(DAQmxWriteDigitalLines(taskHandle,1,1,10.0,DAQmx_Val_Group
ByChannel,dataWrite,NULL,NULL));
DAQmxErrChk
(DAQmxReadDigitalLines(taskHandle,1,10.0,DAQmx_Val_GroupByC
hannel,dataRead,100,&read,&bytesPerSamp,NULL));
for(j=0;j<16;++j)
dataWrite[6] = data2[j];
dataWrite[4] = 0;
DAQmxErrChk
(DAQmxWriteDigitalLines(taskHandle,1,1,10.0,DAQmx_Val
_GroupByChannel,dataWrite,NULL,NULL));
DAQmxErrChk
(DAQmxReadDigitalLines(taskHandle,1,10.0,DAQmx_Val_Gr
oupByChannel,dataRead,100,&read,&bytesPerSamp,NULL));
dataWrite[4] = 1;
DAQmxErrChk
(DAQmxWriteDigitalLines(taskHandle,1,1,10.0,DAQmx_Val
_GroupByChannel,dataWrite,NULL,NULL));
DAQmxErrChk
(DAQmxReadDigitalLines(taskHandle,1,10.0,DAQmx_Val_Gr
oupByChannel,dataRead,100,&read,&bytesPerSamp,NULL));
dataWrite[4] = 0;
DAQmxErrChk
(DAQmxWriteDigitalLines(taskHandle,1,1,10.0,DAQmx_Val_Group
ByChannel,dataWrite,NULL,NULL));
DAQmxErrChk
(DAQmxReadDigitalLines(taskHandle,1,10.0,DAQmx_Val_GroupByC
hannel,dataRead,100,&read,&bytesPerSamp,NULL));
ao_ref_value=wash_voltage;
DAQmxErrChk (DAQmxWriteAnalogScalarF64(taskHandle3, 0,
10.0, ao_ref_value, NULL));
printf("Washing Line: 17 Washing Voltage:
%f\n",ao_ref_value);
fprintf(LogFile,"Washing Line: 17 Washing Voltage:
%f\n",ao_ref_value);
start_tick=clock();
while(clock()-start_tick<CLK_TCK/5)
;
ao_ref_value=0.0;
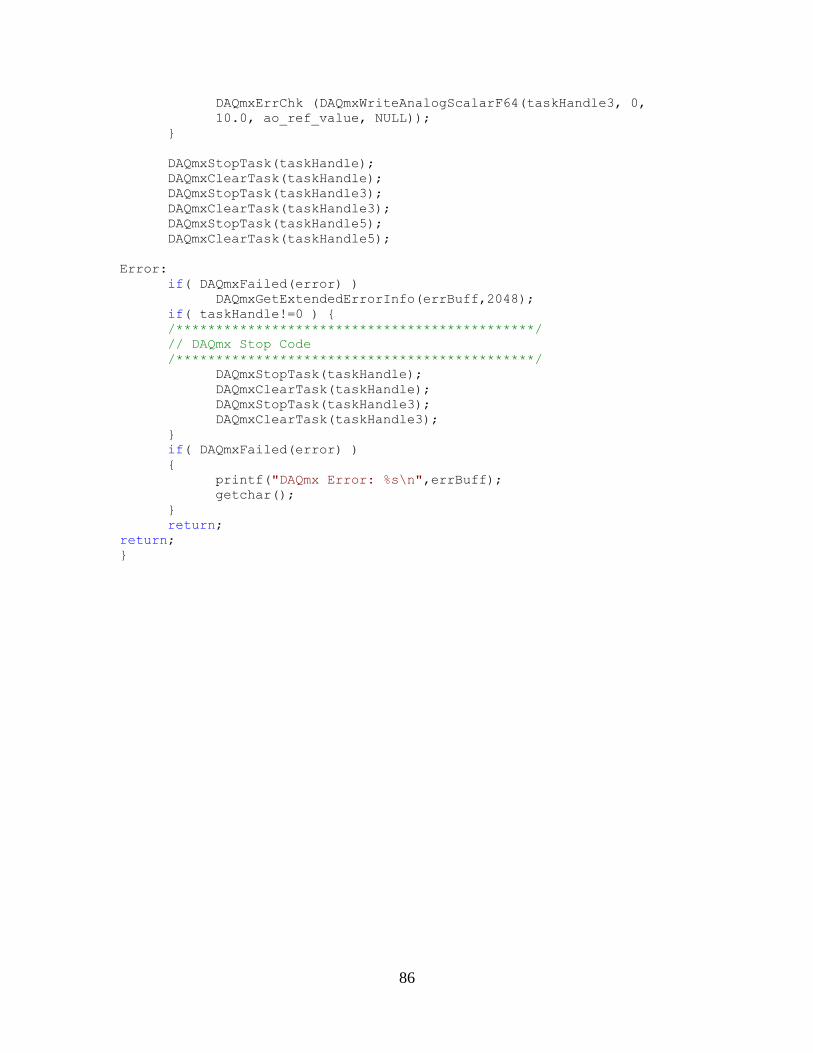
86
DAQmxErrChk (DAQmxWriteAnalogScalarF64(taskHandle3, 0,
10.0, ao_ref_value, NULL));
DAQmxStopTask(taskHandle);
DAQmxClearTask(taskHandle);
DAQmxStopTask(taskHandle3);
DAQmxClearTask(taskHandle3);
DAQmxStopTask(taskHandle5);
DAQmxClearTask(taskHandle5);
Error:
if( DAQmxFailed(error) )
DAQmxGetExtendedErrorInfo(errBuff,2048);
if( taskHandle!=0 )
/*********************************************/
// DAQmx Stop Code
/*********************************************/
DAQmxStopTask(taskHandle);
DAQmxClearTask(taskHandle);
DAQmxStopTask(taskHandle3);
DAQmxClearTask(taskHandle3);
if( DAQmxFailed(error) )
printf("DAQmx Error: %s\n",errBuff);
getchar();
return;
return;
87
References
[1] Oberpenning F, Hetzel S, Weining C, Brandt
B, De Angelis
G, Heinecke
A, Lein
M,
Fornara
P, Schmid
H P, Hertle
L and Semjonow
A, “Semi-Quantitative
Immunochromatographic Test for Prostate Specific Antigen in Whole Blood: Tossing the
Coin to Predict Prostate Cancer?”, European Urology, vol. 43, pp. 478-484, 2003
[2] Tomaso H, Thullier P, Seibold E, Guglielmo V, Buckendahl A, Rahalison L,
Neubauer H, Scholz H C, and Splettstoesser W D “Comparison of Hand-Held Test Kits,
Immunofluorescence Microscopy, Enzyme-Linked Immunosorbent Assay, and Flow
Cytometric Analysis for Rapid Presumptive Identification of Yersinia pestis” J. of Clin.
Micro., Vol. 45, No. 10, Oct. 2007, p. 3404–3407
[3] Martín-Hernández C, Muñoz M, Daury C, Weymuth H, Kemmers-Voncken A E M,
Corbatón V, Toribio T and Bremer M G E G, “Immunochromatographic lateral-flow test
strip for the rapid detection of added bovine rennet whey in milk and milk powder”,
International Dairy Journal, Vol. 19, No. 4, April 2009, p.205-208
[4] Whitesides G M, “The origins and the future of microfluidics”, Nature Vol. 442 July
2006
[5] Liu R H, Yang J, Lenigk R, Bonanno J and Grodzinski P, “Self-Contained, Fully
Integrated Biochip for Sample Preparation, Polymerase Chain Reaction Amplification,
and DNA Microarray Detection”, Anal. Chem. Vol. 76, p. 1824-1831, 2004
[6] Srinivasan V, Pamula V K and Fair R B, “An integrated digital microfluidic lab-on-a-
chip for clinical diagnostics on human physiological fluids”, Lab Chip , Vol. 4 , p. 310 -
315, 2004
[7] Sia S K, Linder V, Parviz B A, Siegel A, and Whitesides G M, “An Integrated
Approach to a Portable and Low-Cost Immunoassay for Resource-Poor Settings” Angew.
Chem. Int. Ed., Vol. 43, p. 498 –502, 2004
[8] Clearblue Easy Digital Pregnancy Test, www.clearblueeasy.com
[9] Customer Reviews for Clearblue Easy Pregnancy Test, Amazon.com,
www.amazon.com
[10] Han S J, Yu H, Murmann B, Pourmand N, Wang S X, “A High-Density
Magnetoresistive Biosensor Array with Drift-Compensation Mechanism”, ISSCC Dig.
Tech. Papers, pp.168-169, Feb. 2007
88
[11] Wang H, Chen Y, Hassibi A, Scherer A, and Hajimiri A “A Frequency-Shift CMOS
Magnetic Biosensor Array with Single-Bead Sensitivity and No External Magnet”,
ISSCC Dig. Tech. Papers, pp.438-439, Feb. 2009
[12] Rae B R, Griffin C, Muir K R, Girkin J M, Gu E, Renshaw D R, Charbon E,
Dawson M D, Henderson R K, “A Microsystem for Time-Resolved Fluorescence
Analysis using CMOS Single-Photon Avalanche and Micro-LEDs”, ISSCC Dig. Tech.
Papers, pp.166-167, Feb. 2008
[13] Lund V, Schmid F, Rickwood D, Robbiati F and Homes E, “Assessment of methods
for covalent binding of nucleic acids to magnetic beads, DynabeadsTM
, and the
characteristics of the bound nucleic acids in hybridization reactions”, Nucleic Acids
Research, 1988, Vol. 16, No. 22 10861-10880
[14] Besse P A, Boero G, Demierre M, Pott V, Popovic R “Detection of a single
magnetic microbead using a miniaturized silicon Hall sensor” 2002 Appl. Phys. Lett. 80
4199-01
[15] Fonnum G, Johansson C, Molteberg A, Morup S and Aksnes E, “Characterisation of
Dynabeads® by magnetization measurements and Mössbauer spectroscopy” 2005 J.
Magnetism and Magnetic Mat. 295 41-47
[16] Gijs M A M, “Magnetic bead handling on-chip: new opportunities for analytical
applications” Microfluidics and Nanofluidics 1, 1 (2004), 22-40
[17] Baselt D R, Lee G U, Natesan M, Metzger S W, Sheehan P E and Coulton R “The
BARC biosensor applied to the detection of biological warfare agents” 1998 J. Biosens.
Bioelectron. 13 731-739
[18] Tamanaha C R, Mulvaney S P, Rife J C, Whitman L J, “Magnetic labeling,
detection, and system integration” 2008 J. Biosens. Bioelectron, 24 1-13
[19] Aytur T, Foley J, Anwar M, Boser B, Harris E, Beatty P R, “A novel magnetic bead
bioassay platform using a microchip-based sensor for infectious disease diagnosis” 2006
Journal of Immunological Methods, 314 21-29
[20] Lee H, Liu Y, Westervelt R M, Ham D, “IC/Microfluidic Hybrid System for
Magnetic Manipulation of Biological Cells” IEEE JSSC, vol. 41, no. 6, June 2006
[21] Osterfeld S J, Yu H, Gaster R S, Caramuta S, Liang Xu, Han S J, Hall D A, Wilson
R J, Sun S,White R L, Davis R W, Pourmand N, Wang S X, “Multiplex protein assays
based on real-time magnetic nanotag sensing“ 2008, Proc. Nat. Acad. Sci. 52 20637-
20640

89
[22] Florescu O, Wang K, Au P, Tang J, Harris E, Beatty P R, and Boser B E, “On-chip
magnetic separation of superparamagnetic beads for integrated molecular analysis”, J.
Appl. Phys. 106, 1 2009, accepted for publication Nov 2009.
[23] Liu C, Lagae L, Borghs G, “Manipulation of magnetic particles on chip by
magnetophoretic actuation and dielectrophoretic levitation” 2007 Appl. Phys. Lett. 90
184109
[24] Shevkoplyas S S, Siegel A C, Westervelt R M,Prentiss M G, Whitesides G M, “The
force acting on a superparamagnetic bead due to an applied magnetic field” 2007, Lab
Chip, 7 1294–1302
[25] Kaur J, Singh K V, Schmid A H, Varshney G C, Suri C R, Raje M, “Atomic force
spectroscopy-based study of antibody pesticide interactions for characterization of
immunosensor surface” 2004, J. Biosens. and Bioelectron. 20 284–293
[26] Harris L J, Skaletsky E, McPherson A, “Crystallographic structure of an intact IgG1
monoclonal antibody” 1998, J. Mol. Biol. 275 861-872
[27] Product Catalog #0801182, Zeptometrix Corporation, Buffalo, New York, USA,
www.zeptometrix.com
[28] Lagae L, Wirix–Speetjens R, Das J, Graham D, Ferreira H, Freitas P P, Borghs G,
and De Boeck J J, “On-chip manipulation and magnetization assessment of magnetic
bead ensembles by integrated spin-valve sensors” J. Appl. Phys. 91, 7445 2002.
[29] Graham D, Ferreira H, and Bernardo J, “Single magnetic microsphere placement and
detection on-chip using current line designs with integrated spin valve sensors:
Biotechnological applications” J. Appl. Phys. 91, 7786 2002.
[30] Florescu O, Mattmann M and Boser B E, “Fully integrated detection of single
magnetic beads in complementary metal-oxide-semiconductor”, J. Appl. Phys. 103,
046101 (2008)
[31] Dennison E, Off-axis field due to a current loop, www.netdenizen.com/emagnet/
offaxis/iloopoffaxis.htm.
[32] Popovic R S, Hall Effect Devices, 2nd ed. IOP, New York, 1991, p.197–202
[33] van der Meer J C, Riedijk F R, van Kampen E, Makinwa K A A, and Huijsing J H,
“A fully integrated CMOS Hall sensor with a 3.65μT 3σ offset for compass applications”,
ISSCC Dig. Tech. Papers, pp.246-247, Feb. 2005
[34] Lagae L, Wirix-Speetjens R, Liu C-X, Laureyn W, Borghs G, Harvey S, Galvin P,
Ferreira H A, Graham D L, Freitas P P, Clarke L A, Amaral M D, “Magnetic biosensors
for genetic screening of cystic fibrosis” Circuits, Devices and Systems, IEE Proceedings
Vol. 152, No. 4, 5 August 2005, p.393 – 400
90
[35] Hamifton R G, “Human lgG Subclass Measurements in the Clinical Laboratory”,
Clin. Chem. 33/10, 1707-1725 (1987)


![ScanGate document (Charge Coupled Device), CMOS (Complementary Metal Oxide Semiconductor) , alebo DPS (Digital Pixel System). Historický vývoj kamery bol nasledujúci [22]: 1884](https://static.fdocuments.net/doc/165x107/5bbae9af09d3f241268bddc0/scangate-document-charge-coupled-device-cmos-complementary-metal-oxide-semiconductor.jpg)


![Introduction20Plasma... · Web viewCrystalline and poly-crystalline Ge-on-Si has many applications in the fields of complementary metal oxide semiconductor (CMOS) electronics [],](https://static.fdocuments.net/doc/165x107/5ae72ea67f8b9a87048eea6e/introduction-20plasmaweb-viewcrystalline-and-poly-crystalline-ge-on-si-has-many.jpg)
