Full year results 2019 Fyber N.V. · Mobile device engagement increases as more people are required...
32
Full year results 2019 Fyber N.V. 30 April 2020
Transcript of Full year results 2019 Fyber N.V. · Mobile device engagement increases as more people are required...

Full year results 2019
Fyber N.V.
30 April 2020

1Highlights &
newsAgenda
2Products &
differentiators
3Global growth
market
4Financials &
outlook
2

1
Highlights &
news

We build
technology that
empowers app
developers to grow
their business
through quality
advertising
4

Highlights 2019
Product & business
▪ 22% growth in programmatic business YoY in 2019; programmatic is 66%
of overall revenue
▪ Successful ongoing roll-out of Fyber’s proprietary monetization technology
Fyber FairBid
▪ 2019 was the first year relying solely on the core business – full ad space
supply is in-app and comes exclusively from direct integrations with app
developers
Financials
▪ Adjusted EBITDA improved by +62%; Positive adjusted EBITDA in Q4 2019
▪ Operational cost base reduced by 20% YoY in 2019
▪ Completed debt restructuring and returned to positive equity position
5

Preliminary Q1 2020 financials
▪ 36% growth of programmatic business in Q1 2020
▪ Overall revenue +12% growth to €31 million; adjusted
EBITDA of €-1 million
Initial effects from COVID-19 on Fyber
▪ Fyber’s mix of advertising sources shifted:
▪ Stable development of performance advertising
▪ Decrease in brand advertising spend
▪ Decline in revenue margin due to mix effects
▪ Initiated cost saving initiatives to maintain goal of positive
adj. EBITDA for the full year 2020
6
Recent news 2020

Q1
In € million 2020* 2019 YoY Change
Programmatic business 19.7 14.5 36%
Non-programmatic business 11.0 13.0 -15%
Total revenue 30.7 27.5 12%
Adj. EBITDA (1.0) (1.3) 23%
*Note: Preliminary non-audited figures
Preliminary Results Q1 2020Programmatic core business continues to grow; Improved adj. EBITDA
▪ Continued growth in the
programmatic business
▪ 12% growth in total revenue
translated into 23% improvement in
adjusted EBITDA
▪ Overcame short-term revenue
decline in offer wall business during
2019 – expecting to return to growth
for the full year 2020
7

8
Mixed impact of COVID-19 on ad tech
and app ecosystem
▪ Mobile device engagement
increases as more people
are required to stay at home
▪ Significant growth in activity
for gaming apps
▪ Spend on user acquisition
ads (performance
advertising is stable or
growing, as app developers
seek to grow their following
and user base
▪ Other growing app
segments include fitness,
delivery, streaming,
e-learning
▪ Brand advertising decreases
as marketing budget are
affected by cost cuts and ad
campaigns are being paused
▪ Activity and marketing spend
within certain app verticals
such as travel, ride sharing,
dating decline
▪ While ad tech companies
and app publishers are well
suited for remote work,
product development and
business conversation are
generally slower and less
effective
Opportunities Immediate impact
▪ As more people are affected
by economical challenges
due to a general economic
downturn, user spend on in-
app purchases may decline;
potentially translating into
reduced marketing spend on
user acquisition
▪ Increased seasonality in
advertising spend during and
following the crisis
▪ Increased collection
challenges as typical
payment cycles may expand
Mid-term risk

2
Products &
differentiators

Publisher Buyer
Fyber’s comprehensive solutionState-of-the-art publisher-facing app monetization
10

Fyber FairBidThe evolution of app monetization
Why Fyber?In-app header biddingMediation
■ Pro: get access to a large
amount of ad partners with one
integration
■ Con: ad partners bidding one at
a time based on predefined
ranking
■ Con: potential revenue loss for
publishers & ad spot loss for
advertisers
■ Con: increased manual effort
by publishers to establish the
ranking
■ Con: limited number of
advertisers that publishers can
enable
■ Enables publishers to offer every
ad opportunity to all demand
partners in real-time
■ All demand partners, regardless
of their technical integration,
participate in every auction
■ Highest bid wins = true yield
optimization for publishers
■ Maximize competition =
Maximize revenue
■ In web, header bidding created
an uplift of 20%-50% in publisher
revenue
■ Proven expertise in mediation
and real-time bidding
■ Extensive network of over 180
programmatic demand partners
■ Advanced analytics tools,
granular data & intuitive
dashboard
■ Partnerships in place with
market leading ad networks &
strong pipeline
Previously Now up
11

APP
Global
programmatic
marketplaceFyber Marketplace
Open auction
Private marketplace
Audience & data tools
Fyber
Direct
Top brand DSPs
Top performance DSPs
■ Healthy demand mix
creating a superior user
experience
■ Clean, direct traffic (SDK
integration)
■ Over 180 directly
integrated buyers and
advertising partners
12
Top 4 performer in
AdLibertas ranking
Top 3 banner demand source,
Top 7 interstitial demand
source in AppoDeal ranking
Source: Ad Libertas, Top Network Performance 2019,
Appodeal Performance Index, H1 2018 Edition

13
Boosts revenue,
retention, and re-
engagement
■ Non-intrusive opt-in ad format,
popular among gaming publishers
■ Enables users to explore more
free content within the app, driving
engagement and retention
13

Differentiation
through
technology &
service
Seconds
Seconds
▪ Technology & innovation: first-to-
market true app bidding with Fyber
FairBid
▪ One-stop-shop for publisher,
covering all aspects of in-app
advertising
▪ Expert guidance for publishers by
our monetization experts
▪ Deliberate focus on publisher-side
of value chain
▪ Direct technical publisher
integrations
▪ Diversified revenue base by
geography and product
14

Our growth strategy is based on
technology & innovation
1515
Our programmatic
business grew 22% in
2019 YoY
Innovations in areas of
fastest market growth laying
foundations for long-term
value creation
Existing products New products
Sustainable, loyal client network based on
SDK integrations with a consistent retention
rate of 85%+
Existing publishers
Onboarded 100+ high-profile publishers in 2019 | Strong
client pipeline for 2020
New publishers
15

16
3
Global growth
market

The Opportunity | Fyber is wholly focused on
in-app, the fastest growing segment in digital advertising
Source: eMarketer, October 2019, US market
2019
In-app
83%
($82bn)
Mobile Web
17%
($17bn)
In-App is dominating US
mobile advertising spend
17
99
120138
153167
23
22
23
22
21
7
9
11
13
14
2019 2020 2021 2022 2023
Mobile Desktop Connected TV
US digital ad spend in $bn

In-app dominates digitalin terms of ad spend & user time
Users spend
>3hrs/day on mobile (more than on
TV)
of that within apps
80%
Source: eMarketer
2018, 2019 / App
Annie 2020, data for
2019
18
3.2 billion
active
smartphone
users
$120 billion
global user
spend
on apps
$190 billion
global mobile
ad spend
200 billion app
downloads
worldwide

Gamingnot just for kids
The gaming audience
spans all ages, is highly
engaged, and is more
likely to make purchases.
19

4
Financials &
outlook

Fyber’s programmatic business is on a positive
momentum despite challenging business environment
21
Adj. EBITDA
-4
-2 -1.9
0.6
-7.2
-1.3 -0.3-1.7
0.6
-2.7
Q1 Q2 Q3 Q4 Full year
2018 2019
Total operating cost
14.2 13 13.2 12.9
53.3
11.2 10.1 10.8 10.9
43
Q1 Q2 Q3 Q4 Full year
2018 2019
12.415.2 16.9
22
65
14.518.6 20.3
25
79
Q1 Q2 Q3 Q4 Full year
2018 2019
29.3 29.5 31.138.6
128.5
27.5 26.6 28.636.3
119.0
Q1 Q2 Q3 Q4 Full year
2018 2019
+22%
+62%-19%
-7%
Total revenue Programmatic business revenue

▪ FY’2019: -7% in revenue; slight decline due to
external market effects in the offer wall
segment; revenue fully based on core business
▪ Q4’19: -6% in revenue due to the decline in
the non-programmatic business. The
programmatic business grow by 14%
▪ FY’2019: Cost of sales includes revenue
share to 3rd parties and other components, 6%
decrease YoY, resulting in 16% gross profit
margin
Q4’19: 85% of revenue
▪ FY’2019: Operational cost base reduced by
20% YoY, based on completed integration of
former group companies
Q4’19: Operational cost base reduced by 18%
YoY
▪ FY’2019: 62% improvement in adj. EBITDA
Q4’19: Positive adj. EBITDA of €0.6 million
Full year Q4
In € million 2019 2018YoY
change2019 2018
YoY
change
Revenue 119.0 128.5 -7% 36.3 38.6 -6%
Cost of sales (99.5) (105.6) 6% (30.6) (30.0) 1%
Gross profit 19.5 23.0 -15% 5.6 8.6 -15%
IT cost* (9.7) (11.2) 13% (2.5) (2.5) -
R&D cost* (11.6) (13.5) 14% (2.8) (3.6) 22%
S&M cost* (15.0) (19.6) 23% (3.5) (4.8) 27%
G&A cost* (6.8) (9.0) 24% (2.1) (1.9) 7%
Total operating
cost*(43.0) (53.3) 19% (10.9) (12.9) 16%
EBITDA* (2.7) (7.2) 63% 0.6 0.6 -
EBITDA margin* -2.3% -5.6% 3.3pp 1.6% 1.7% 0.1pp
Key Financials 2019Revenue fully based on in-app and core business
20% reduction in operational cost enabled adj. EBITDA improvement
*Note: Adjusted, non-IFRS figures excluding one-off impacts such as impairment of goodwill, acquisition related
costs and option plans.22

Revenue Composition 2019Programmatic business grew +22% FY 2019 YoY, +14% Q4 2019 YoY
FULL YEAR Q4
In € million 2019 2018 % Change 2019 2018 % Change
Programmatic business 79 65 22% 25 22 14%
Non-programmatic business 39 57 -32% 11 17 -35%
One-off effects 1 7 -86% - 0.5 n/a
Total revenue 119 129 -7% 36 39 -8%
▪ Total revenue declined by 7% in 2019 YoY and 8% in Q4 YoY, due to changes in the market
environment effecting the wider industry
▪ Ongoing growth in programmatic business
▪ Set stable foundations: revenue now exclusively coming from core business, fully in-app, direct
technical integrations with publishers only
23
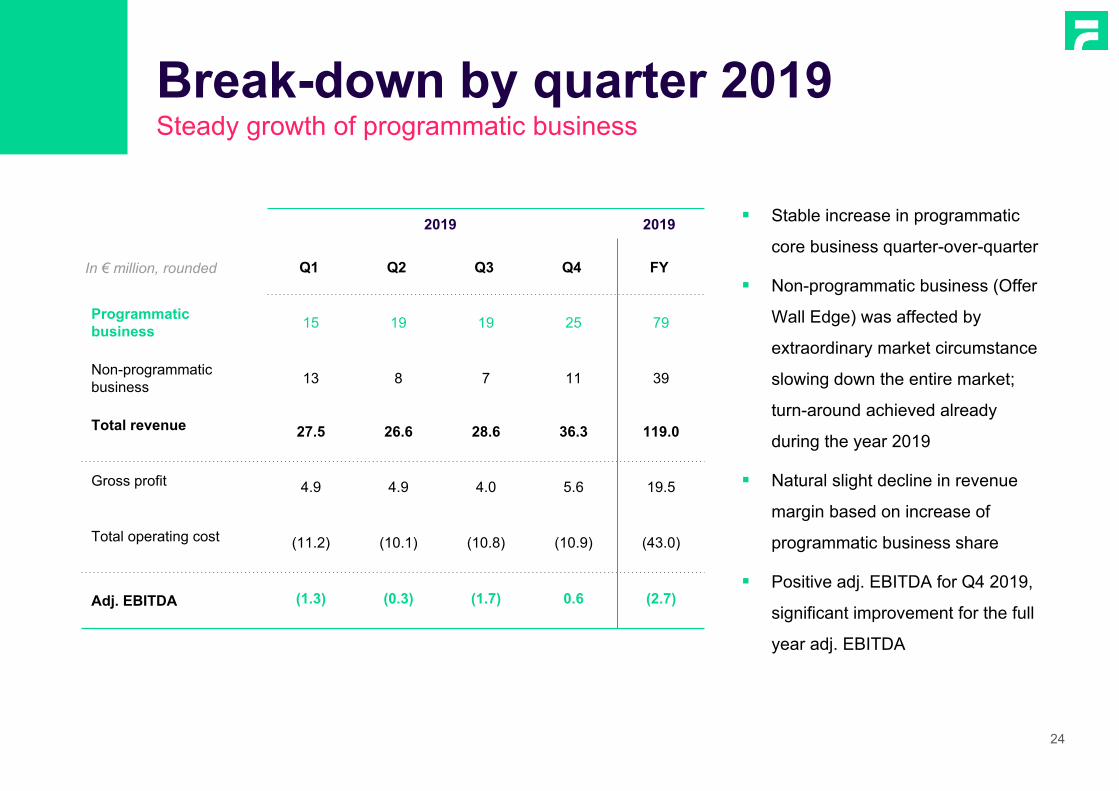
Break-down by quarter 2019Steady growth of programmatic business
▪ Stable increase in programmatic
core business quarter-over-quarter
▪ Non-programmatic business (Offer
Wall Edge) was affected by
extraordinary market circumstance
slowing down the entire market;
turn-around achieved already
during the year 2019
▪ Natural slight decline in revenue
margin based on increase of
programmatic business share
▪ Positive adj. EBITDA for Q4 2019,
significant improvement for the full
year adj. EBITDA
2019 2019
In € million, rounded Q1 Q2 Q3 Q4 FY
Programmatic
business15 19 19 25 79
Non-programmatic
business13 8 7 11 39
Total revenue 27.5 26.6 28.6 36.3 119.0
Gross profit 4.9 4.9 4.0 5.6 19.5
Total operating cost (11.2) (10.1) (10.8) (10.9) (43.0)
Adj. EBITDA (1.3) (0.3) (1.7) 0.6 (2.7)
24

Balance SheetReturning to positive equity following debt-to-equity exchange
▪ Apr 2019: Voluntary debt-to-equity
swap of €74 million of the
outstanding convertible bonds
▪ Nov 2019: Bondholder meeting
prolonged the remaining portion of
bonds until July 2022 including
interest payments
Currently no short-term liability from
bonds
▪ Prolonged existing debt facilities
from BillFront and Bank Leumi
▪ Shareholder loans from Tennor
Holding B.V. amount to €30 million
Year ended 31 Dec
In € millions 2019 2018
Intangible assets 148.3 155.6
Other assets 10.0 2.3
Cash and cash equivalents 12.9 12.3
Trade and other receivables 29.5 31.2
Other financial assets 8.2 8.3
Total assets 208.9 209.7
Interest bearing loans 120.7 173.0
Trade and other payables 36.7 38.4
Employee benefits 5.8 8.3
Other liabilities 12.7 4.6
Deferred tax liabilities - 1.0
Total liabilities 175.8 225.3
Total equity 33.1 (15.6)
*Note: Preliminary pro-forma figures including the debt-to-equity swap 25

Profit and Loss Statement 2019
Year ended 31 Dec Three months ended 31 Dec
In € million 2019 2018 2019 2018
Revenue 119.0 128.5 36.3 38.6
Cost of sales (99.5) (105.6) (30.7) (30.0)
Gross profit 19.5 23.0 5.6 8.6
Research and development expenses (12.8) (14.0) (3.1) (3.7)
Sales and marketing expenses (15.9) (20.2) (3.7) (5.0)
General and administrative expenses (8.8) (10.4) (2.5) (2.8)
Other operating expenses (2.5) - (2.7) -
Earnings before interest and tax (EBIT) (20.5) (21.6) (6.4) (2.9)
Net finance cost (28.7) (14.1) 4.0 (4.2)
Profit (loss) before taxes (49.2) (35.7) (2.4) (7.0)
Income tax gain (expense) 0.5 0.2 (0.3) (0.6)
Profit (loss) for the year after tax (48.8) (35.4) (2.7) (7.6)
26

In € millions 31 Dec 19 31 Dec 18
Non-current assets 161.1 157.6
Goodwill 134.9 133.3
Other intangible assets 13.4 22.3
Property & equipment 8.5 1.2
Non-current financial assets 4.3 0.8
Current assets 47.8 52.1
Inventories - 0.1
Trade and other receivables 29.5 32.2
Other current financial assets 3.9 6.5
Prepayments 1.4 1.0
Cash and cash equivalents 12.9 12.3
Total assets 208.9 209.7
In € thousands 31 Dec 19 31 Dec 18
Equity (Deficit) 33.1 (15.6)
Issued capital 36.2 11.5
Share premium 250.4 184.8
Treasury shares (4.7) (4.7)
Other capital reserves 30.5 25.3
Legal reserve 8.0 7.2
Retained earnings (287.0) (237.3)
Other components of equity (0.3) (2.2)
Non-current liabilities 115.5 159.0
Employee benefits 0.2 0.2
Loans and borrowings 102.7 154.1
Deferred tax liabilities - 1.0
Other non-current liabilities 12.5 3.7
Current liabilities 60.4 66.2
Trade and other payables 36.7 38.4
Employee benefits 5.5 8.0
Loans and borrowings 18.0 18.8
Current tax liabilities 0.2 0.9
Total liabilities 175.9 225.2
Total equity and liabilities 208.9 209.7
Financial Position 2019
▪ Positive equity due to reduction in convertible
bonds facility
▪ Outstanding facility of €76 million convertible
bonds, maturity 202227

In € millions1 Jan –
31 Dec 2019
1 Jan –
31 Dec 2018
Net cash flow from operating activities (9.2) (16.7)
Net cash flow from investing activities (5.5) (4.1)
Net cash flow from financing activities 14.9 15.2
Net change in cash & cash equivalents 0.2 (5.6)
Net foreign exchange difference 0.4 0.3
Opening balance cash & cash equivalents 12.3 17.6
Closing balance cash, cash equivalents & cash
deposits12.9 12.3
Cash Flow Statement 2019
28

Share
Information
Issuer Fyber N.V.
Ticker Symbol FBEN
ISIN NL0012377394
MarketFrankfurt SE
Prime Standard
Currency Euro
Number of shares 361.87 million
52 weeks high / -low (as of 08 Apr) 0.37 / 0.09
Shareholder registered above 3% (as of Apr 2020) % Voting Rights
Advert Finance B.V. 94%
29
1yr Xetra closing price
as of 08 Apr 2020
As per 31 Dec 2019:

Fyber enables investing
into digital’s strongest segment
▪ Fast-growing market dominated by few key players | High entry barriers
▪ Defensible competitive position | Deliberate focus on publisher-side
▪ Direct publisher integrations | Trust & client loyalty | Global reach & scale
▪ Diversified revenue base
▪ Commitment to profitability & stable growth
3030

“These materials may contain forward-looking statements based on current assumptions and
forecasts made by Fyber N.V.’s management and other information currently available to
Fyber N.V. By their nature, forward-looking statements involve a number of risks,
uncertainties and assumptions that could cause actual results, performance or events to differ
materially from those expressed or implied by the forward-looking statements. Statements
contained in these materials regarding past trends or events should not be taken as a
representation that such trends or events will continue in the future. Neither Fyber N.V. nor
any other party is under any duty to update or inform you of any changes, whether as a result
of new information, future events or otherwise, to the information in these materials.
Certain market data and financial and other figures (including percentages) in these materials
were rounded in accordance with commercial principles. Figures rounded may not in all cases
add up to the stated totals or the statements made in the underlying sources. For the
calculation of percentages used in the text, the actual figures, rather than the commercially
rounded figures, were used. Accordingly, in some cases, the percentages provided in the text
may deviate from percentages based on rounded figures. The financial information relating to
the Group contained in this document has not been audited or reviewed.
No reliance may be placed for any purposes whatsoever on the information contained in this
document or on its completeness. No representation or warranty, expressed or implied, is
given by or on behalf of Fyber N.V. or any of its affiliates, directors, officers or employees,
advisors or any other person as to the accuracy or completeness of the information or
opinions contained in this document, and no liability whatsoever is accepted for any such
information or opinions or any use which may be made of them. This document does not
constitute an offer to sell, or a solicitation of an offer to buy, any securities.”
Disclaimer
31
Thank You!
32
Contact
[email protected] +49 30 609 855 555
Office Address
Wallstr. 9-13, 10179 Berlin, Germany
About Fyber N.V.
Fyber is an app monetization company, developing a next-generation monetization
platform for app developers. Fyber combines proprietary technologies and expertise in
mediation and real-time bidding with centralized revenue data to help app developers
discover better ways to monetize mobile games. Fyber has seven global offices in Berlin,
San Francisco, New York, London, Tel Aviv, Beijing, and Seoul and is publicly traded on
the Frankfurt Stock Exchange under the symbol FBEN.