FYBER N.V. Annual Report 2018investors.fyber.com/assets/media/fyber-nv-annual... · Highlights 2018...
32
FYBER N.V. Annual Report 2018 Results Presentation April 2019 Ziv Elul CEO | Yaron Zaltsman CFO
Transcript of FYBER N.V. Annual Report 2018investors.fyber.com/assets/media/fyber-nv-annual... · Highlights 2018...
FYBER N.V.Annual Report 2018
Results PresentationApril 2019Ziv Elul CEO | Yaron Zaltsman CFO
“These materials may contain forward-looking statements based on current assumptions andforecasts made by Fyber N.V.’s management and other information currently available to FyberN.V. By their nature, forward-looking statements involve a number of risks, uncertainties andassumptions that could cause actual results, performance or events to differ materially fromthose expressed or implied by the forward-looking statements. Statements contained in thesematerials regarding past trends or events should not be taken as a representation that suchtrends or events will continue in the future. Neither Fyber N.V. nor any other party is under anyduty to update or inform you of any changes, whether as a result of new information, futureevents or otherwise, to the information in these materials.
Certain market data and financial and other figures (including percentages) in these materialswere rounded in accordance with commercial principles. Figures rounded may not in all casesadd up to the stated totals or the statements made in the underlying sources. For the calculationof percentages used in the text, the actual figures, rather than the commercially rounded figures,were used. Accordingly, in some cases, the percentages provided in the text may deviate frompercentages based on rounded figures. The financial information relating to the Group containedin this document has not been audited or reviewed.
No reliance may be placed for any purposes whatsoever on the information contained in thisdocument or on its completeness. No representation or warranty, expressed or implied, is givenby or on behalf of Fyber N.V. or any of its affiliates, directors, officers or employees, advisors orany other person as to the accuracy or completeness of the information or opinions contained inthis document, and no liability whatsoever is accepted for any such information or opinions orany use which may be made of them. This document does not constitute an offer to sell, or asolicitation of an offer to buy, any securities.”
Disclaimer
2

Fyber FairBid - Mediation EvolvedIntroduction & Highlights
Ziv ElulCEO
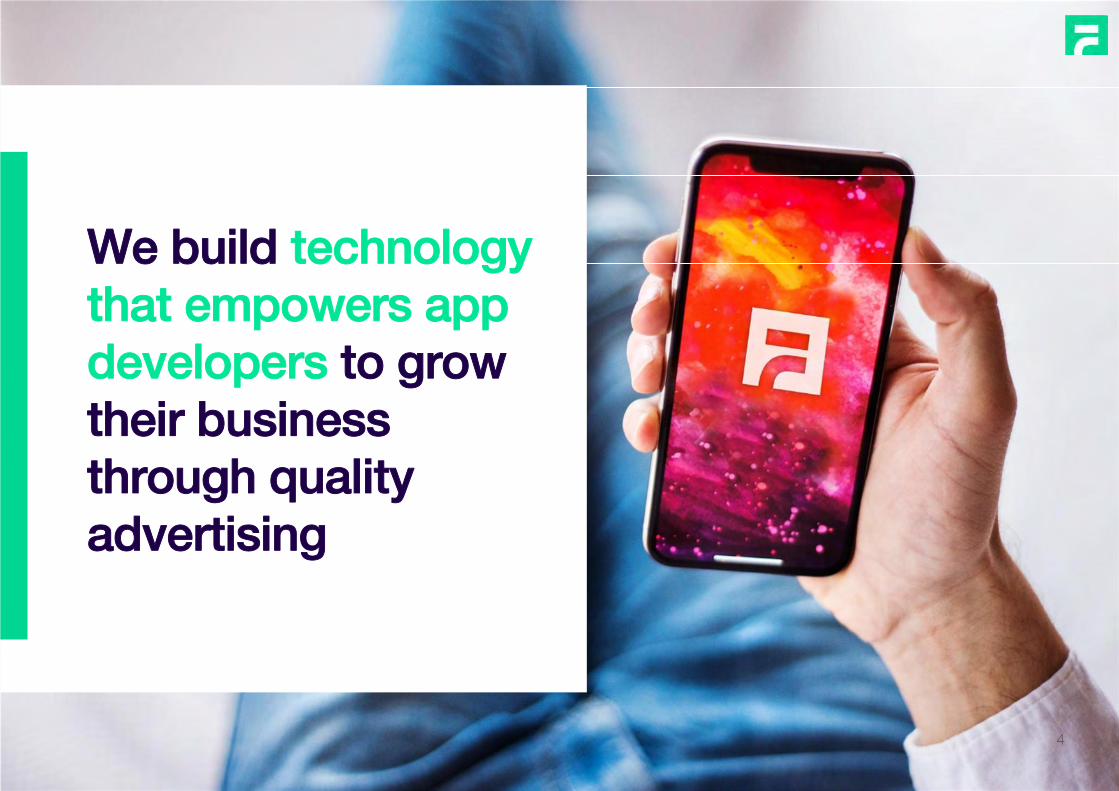
We build technology that empowers app developers to grow their business through quality advertising
4
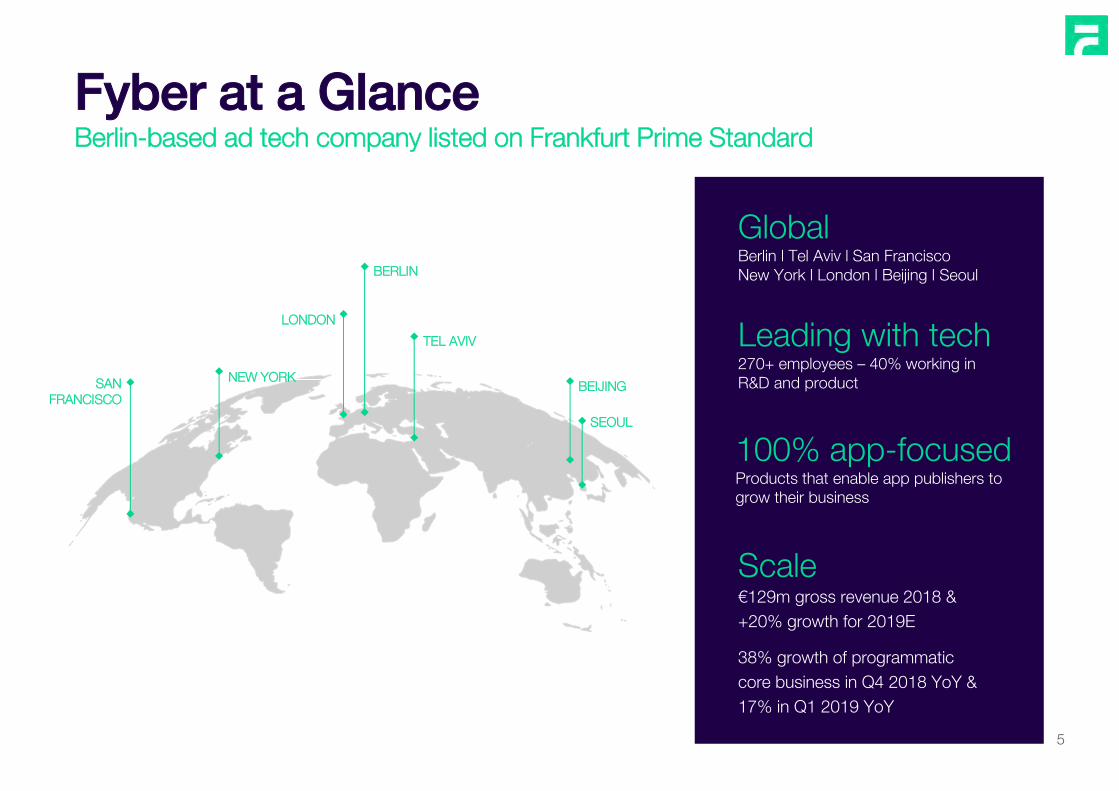
Fyber at a GlanceBerlin-based ad tech company listed on Frankfurt Prime Standard
Leading with tech270+ employees – 40% working in R&D and product
GlobalBerlin l Tel Aviv l San FranciscoNew York l London l Beijing l Seoul
SAN FRANCISCO
NEW YORK
LONDON
BERLIN
TEL AVIV
BEIJING
SEOUL
Scale€129m gross revenue 2018 & +20% growth for 2019E
38% growth of programmatic core business in Q4 2018 YoY & 17% in Q1 2019 YoY
5
100% app-focusedProducts that enable app publishers to grow their business
Highlights 2018 (1/2)
6
The merger is (essentially) completed
★ Launched new unified brand, sunsetting all old brands
★ Full organizational integration of former group companies, tech integration in final stages
★ Launched new flagship product, Fyber FairBid & formed partnerships with several significant in-app players including Facebook Audience Network
★ Moved from 3 mediation platforms & 2 ad exchanges to integrated product suite of Fyber FairBid & Fyber Marketplace
The one-off effects of cleaning up our marketplace have been completed
★ Fully transparent ad platform providing access to high-quality, direct publishers
★ Income from Q4 2018 onwards is fully coming from core business
Highlights 2018 (2/2)
7
The core programmatic business is growing unaffected from one-off effects
★ Core programmatic business grew 10% YoY in 2018, 38% YoY in Q4 2018
Product & business
★ 2k+ apps integrated with Fyber FairBid since its release in Q4 2018
★ Launched Offer Wall Edge, complete redesign of one of our core ad formats
Financials
★ 25% annual cost savings for 2018 vs. 2017
★ Achieved positive adj. EBITDA in Q4 2018
★ €74 million convertible bonds conversion into equity underway
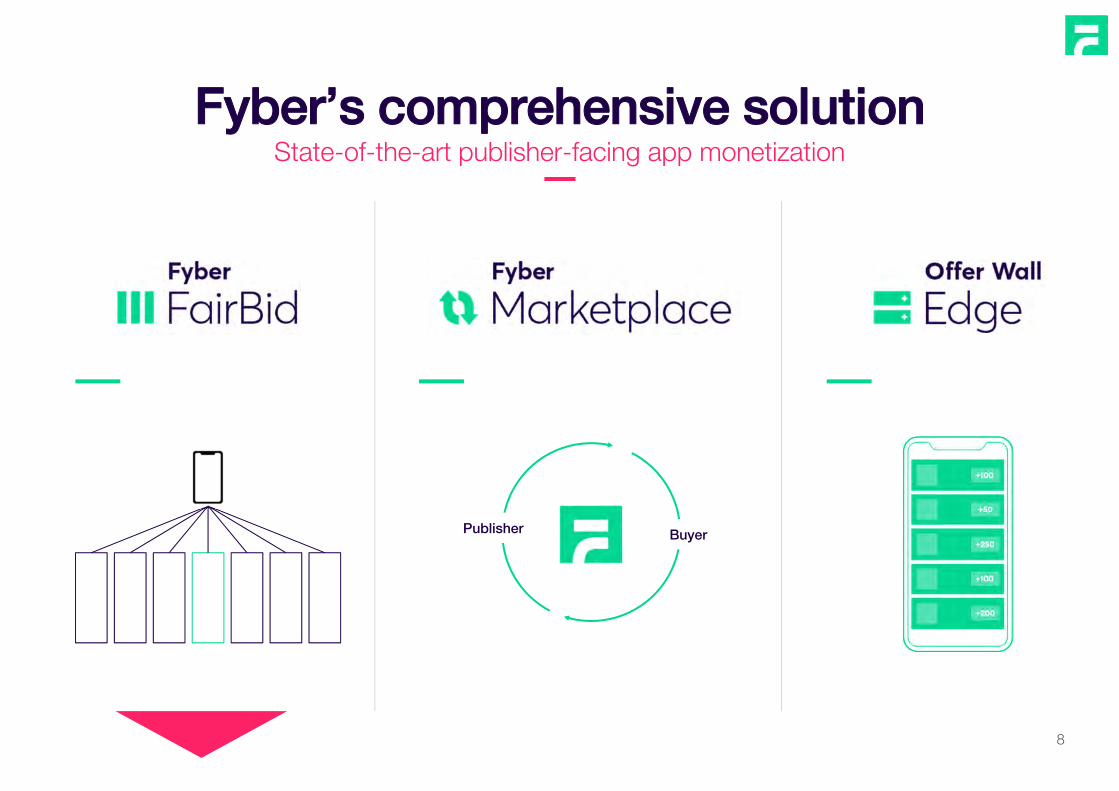
Publisher Buyer
Fyber’s comprehensive solutionState-of-the-art publisher-facing app monetization
8
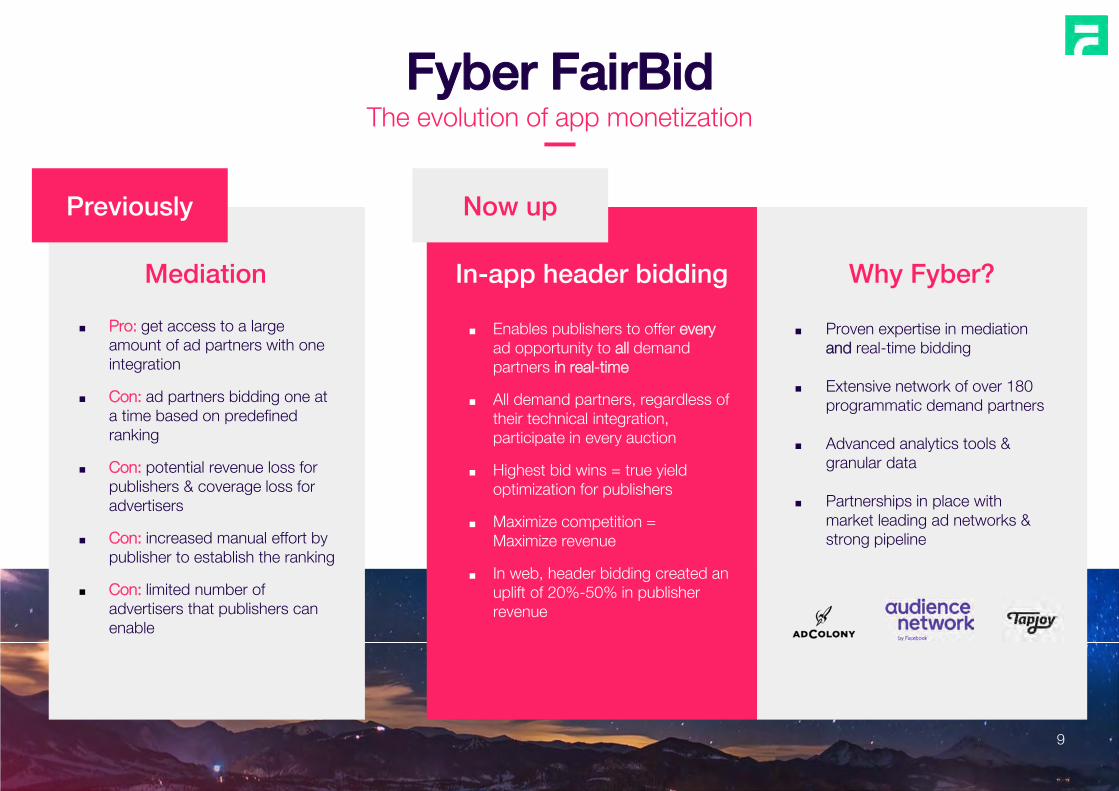
Fyber FairBidThe evolution of app monetization
Why Fyber?In-app header biddingMediation
■ Pro: get access to a large amount of ad partners with one integration
■ Con: ad partners bidding one at a time based on predefined ranking
■ Con: potential revenue loss for publishers & coverage loss for advertisers
■ Con: increased manual effort by publisher to establish the ranking
■ Con: limited number of advertisers that publishers can enable
■ Enables publishers to offer everyad opportunity to all demand partners in real-time
■ All demand partners, regardless of their technical integration, participate in every auction
■ Highest bid wins = true yield optimization for publishers
■ Maximize competition = Maximize revenue
■ In web, header bidding created an uplift of 20%-50% in publisher revenue
■ Proven expertise in mediation and real-time bidding
■ Extensive network of over 180 programmatic demand partners
■ Advanced analytics tools & granular data
■ Partnerships in place with market leading ad networks & strong pipeline
Previously Now up
9
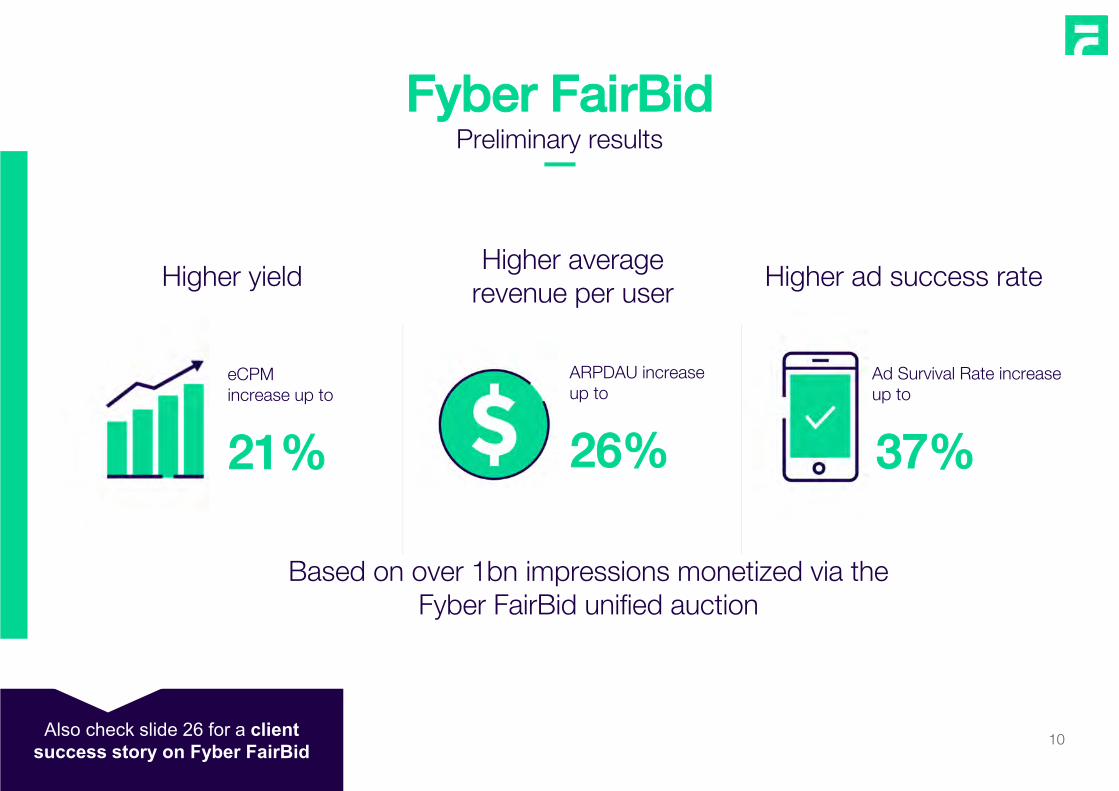
Based on over 1bn impressions monetized via the Fyber FairBid unified auction
10
21%
eCPM increase up to
26%
ARPDAU increase up to
37%
Ad Survival Rate increase up to
Higher yieldHigher average
revenue per userHigher ad success rate
Also check slide 26 for a client success story on Fyber FairBid
Fyber FairBidPreliminary results
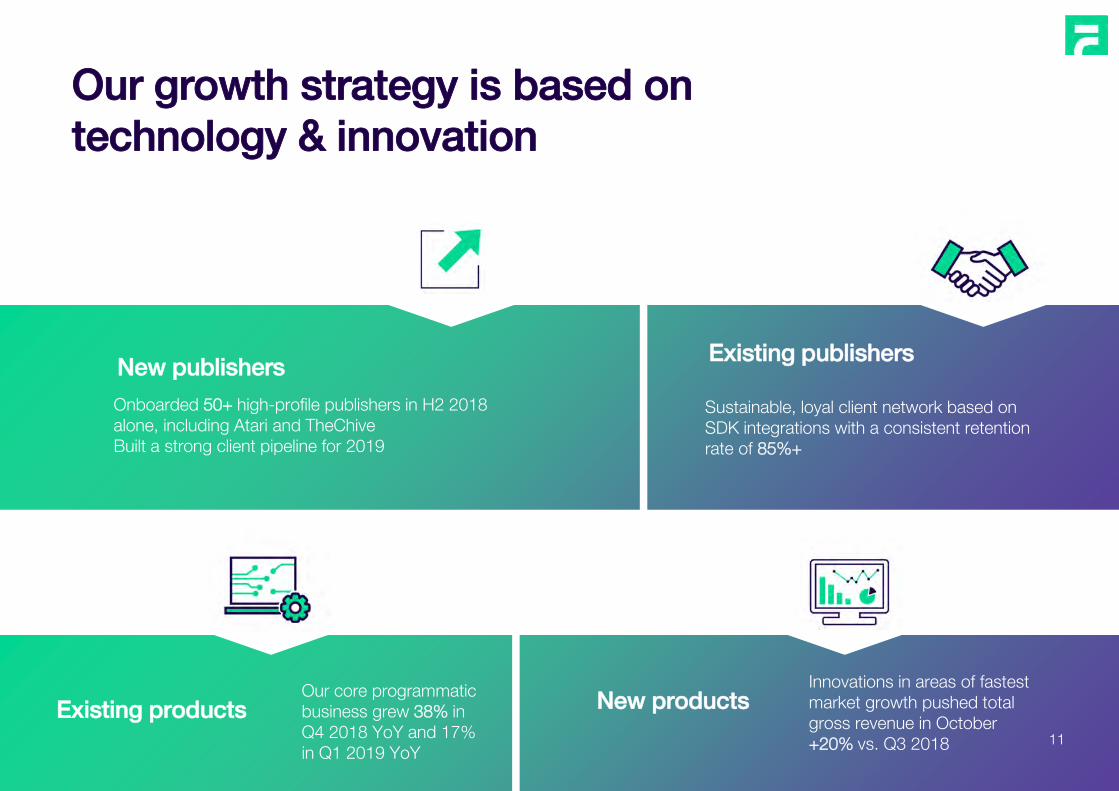
Our growth strategy is based on technology & innovation
1111
Our core programmatic business grew 38% in Q4 2018 YoY and 17% in Q1 2019 YoY
Innovations in areas of fastest market growth pushed total gross revenue in October +20% vs. Q3 2018
Existing products New products
Sustainable, loyal client network based on SDK integrations with a consistent retention rate of 85%+
Existing publishers
Onboarded 50+ high-profile publishers in H2 2018 alone, including Atari and TheChiveBuilt a strong client pipeline for 2019
New publishers
11

Financials & Outlook
Yaron ZaltsmanCFO
12
13
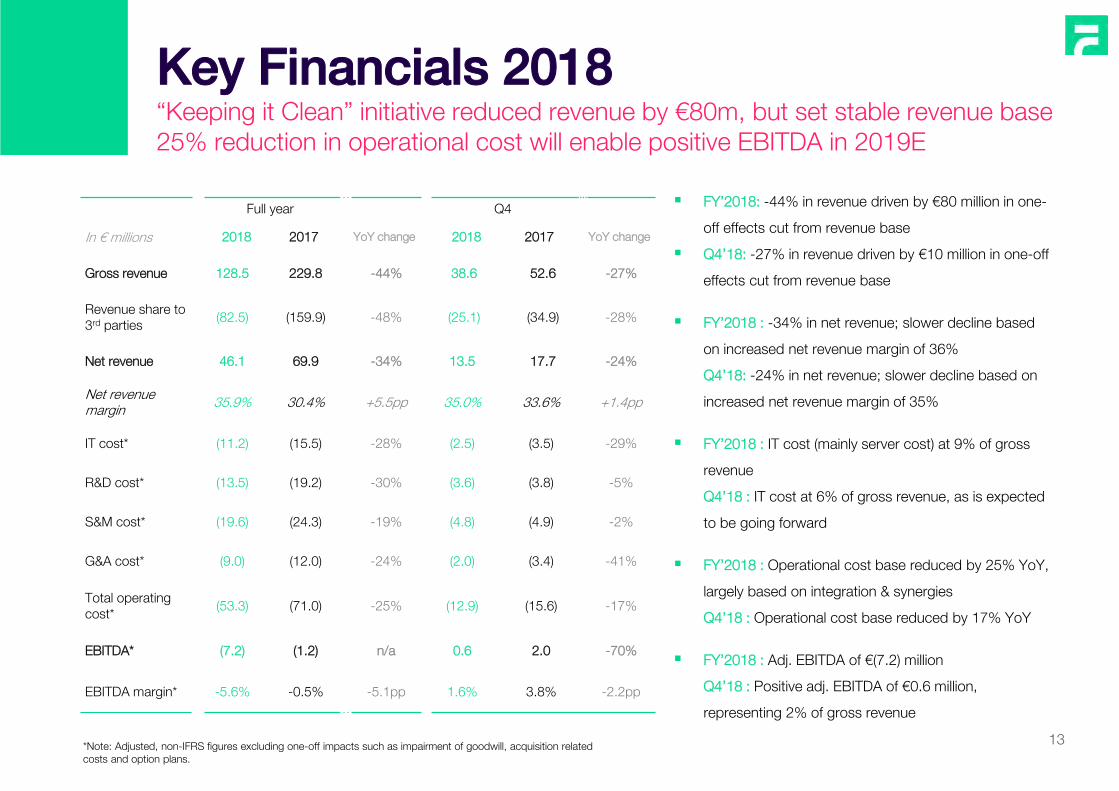
FY’2018: -44% in revenue driven by €80 million in one-
off effects cut from revenue base
Q4’18: -27% in revenue driven by €10 million in one-off
effects cut from revenue base
FY’2018 : -34% in net revenue; slower decline based
on increased net revenue margin of 36%
Q4’18: -24% in net revenue; slower decline based on
increased net revenue margin of 35%
FY’2018 : IT cost (mainly server cost) at 9% of gross
revenue
Q4’18 : IT cost at 6% of gross revenue, as is expected
to be going forward
FY’2018 : Operational cost base reduced by 25% YoY,
largely based on integration & synergies
Q4’18 : Operational cost base reduced by 17% YoY
FY’2018 : Adj. EBITDA of €(7.2) million
Q4’18 : Positive adj. EBITDA of €0.6 million,
representing 2% of gross revenue
Full year Q4
In € millions 2018 2017 YoY change 2018 2017 YoY change
Gross revenue 128.5 229.8 -44% 38.6 52.6 -27%
Revenue share to 3rd parties
(82.5) (159.9) -48% (25.1) (34.9) -28%
Net revenue 46.1 69.9 -34% 13.5 17.7 -24%
Net revenue margin 35.9% 30.4% +5.5pp 35.0% 33.6% +1.4pp
IT cost* (11.2) (15.5) -28% (2.5) (3.5) -29%
R&D cost* (13.5) (19.2) -30% (3.6) (3.8) -5%
S&M cost* (19.6) (24.3) -19% (4.8) (4.9) -2%
G&A cost* (9.0) (12.0) -24% (2.0) (3.4) -41%
Total operating cost*
(53.3) (71.0) -25% (12.9) (15.6) -17%
EBITDA* (7.2) (1.2) n/a 0.6 2.0 -70%
EBITDA margin* -5.6% -0.5% -5.1pp 1.6% 3.8% -2.2pp
Key Financials 2018“Keeping it Clean” initiative reduced revenue by €80m, but set stable revenue base25% reduction in operational cost will enable positive EBITDA in 2019E
*Note: Adjusted, non-IFRS figures excluding one-off impacts such as impairment of goodwill, acquisition related costs and option plans.
14
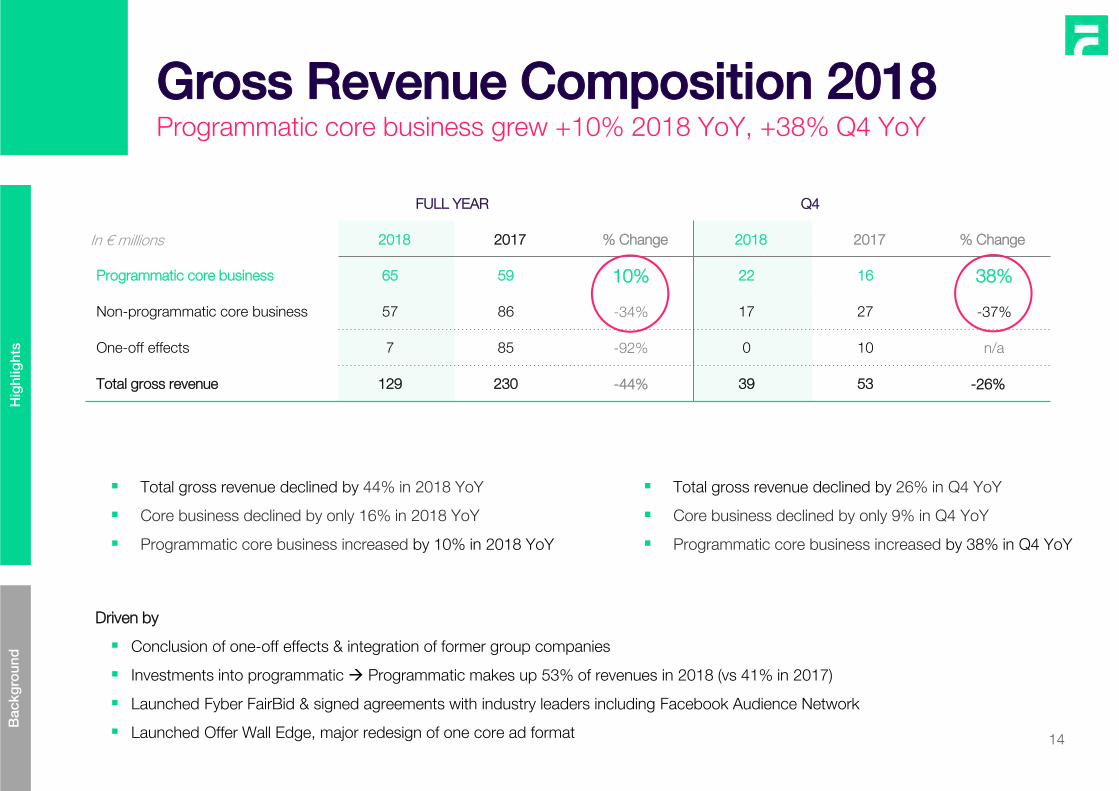
Gross Revenue Composition 2018Programmatic core business grew +10% 2018 YoY, +38% Q4 YoY
Hig
hlig
hts
FULL YEAR Q4
In € millions 2018 2017 % Change 2018 2017 % Change
Programmatic core business 65 59 10% 22 16 38%
Non-programmatic core business 57 86 -34% 17 27 -37%
One-off effects 7 85 -92% 0 10 n/a
Total gross revenue 129 230 -44% 39 53 -26%
Bac
kgro
und
Total gross revenue declined by 44% in 2018 YoY
Core business declined by only 16% in 2018 YoY
Programmatic core business increased by 10% in 2018 YoY
Driven by
Conclusion of one-off effects & integration of former group companies
Investments into programmatic Programmatic makes up 53% of revenues in 2018 (vs 41% in 2017)
Launched Fyber FairBid & signed agreements with industry leaders including Facebook Audience Network
Launched Offer Wall Edge, major redesign of one core ad format
Total gross revenue declined by 26% in Q4 YoY
Core business declined by only 9% in Q4 YoY
Programmatic core business increased by 38% in Q4 YoY
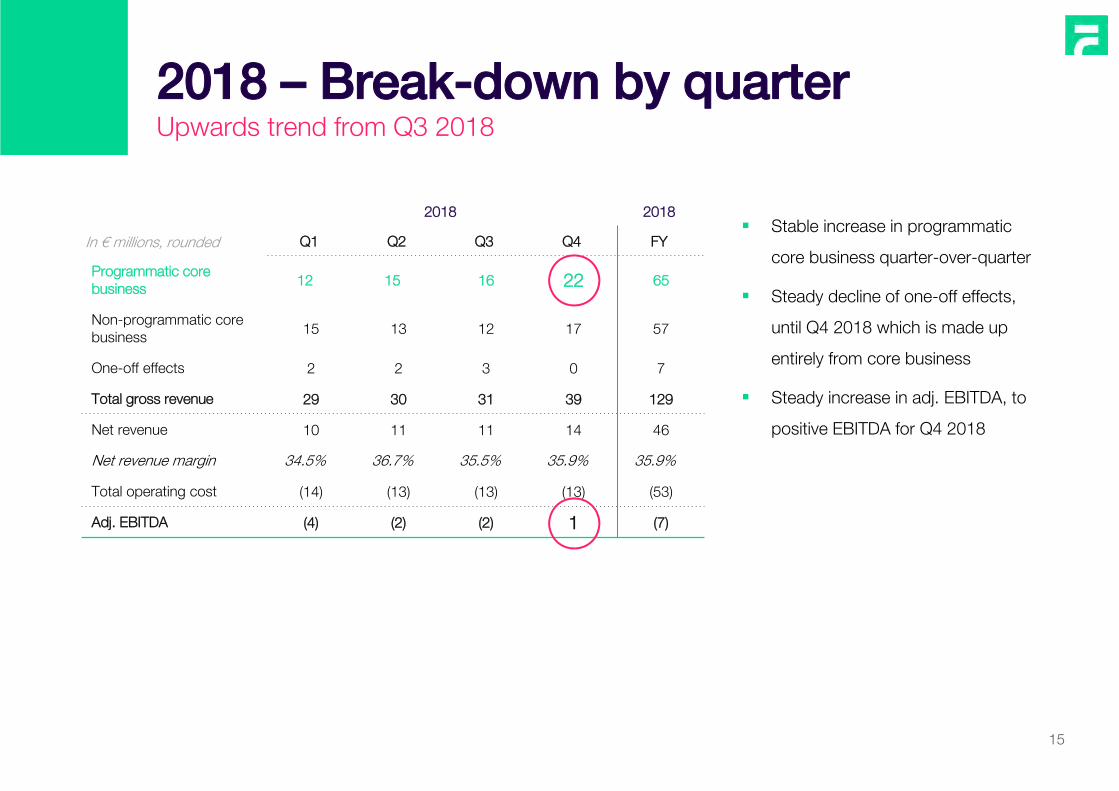
2018 – Break-down by quarterUpwards trend from Q3 2018
15
Stable increase in programmatic
core business quarter-over-quarter
Steady decline of one-off effects,
until Q4 2018 which is made up
entirely from core business
Steady increase in adj. EBITDA, to
positive EBITDA for Q4 2018
2018 2018
In € millions, rounded Q1 Q2 Q3 Q4 FY
Programmatic core business 12 15 16 22 65
Non-programmatic core business 15 13 12 17 57
One-off effects 2 2 3 0 7
Total gross revenue 29 30 31 39 129
Net revenue 10 11 11 14 46
Net revenue margin 34.5% 36.7% 35.5% 35.9% 35.9%
Total operating cost (14) (13) (13) (13) (53)
Adj. EBITDA (4) (2) (2) 1 (7)
16
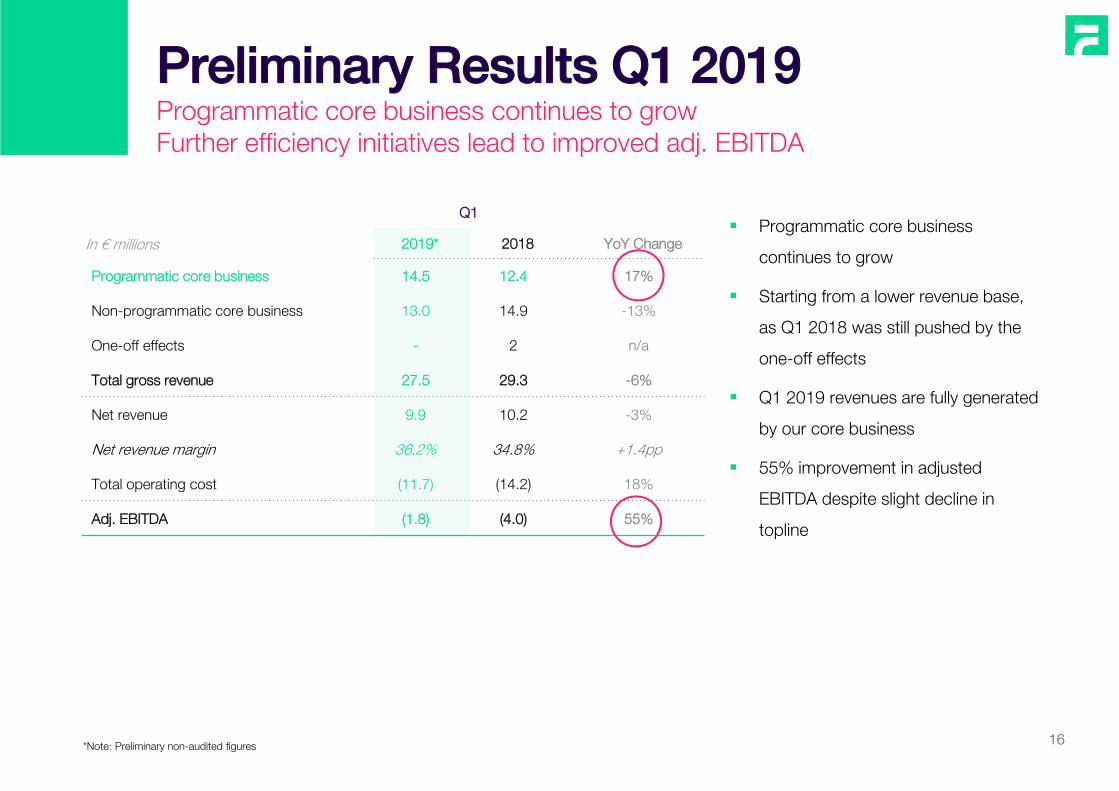
Q1
In € millions 2019* 2018 YoY Change
Programmatic core business 14.5 12.4 17%
Non-programmatic core business 13.0 14.9 -13%
One-off effects - 2 n/a
Total gross revenue 27.5 29.3 -6%
Net revenue 9.9 10.2 -3%
Net revenue margin 36.2% 34.8% +1.4pp
Total operating cost (11.7) (14.2) 18%
Adj. EBITDA (1.8) (4.0) 55%
*Note: Preliminary non-audited figures
Preliminary Results Q1 2019Programmatic core business continues to growFurther efficiency initiatives lead to improved adj. EBITDA
Programmatic core business
continues to grow
Starting from a lower revenue base,
as Q1 2018 was still pushed by the
one-off effects
Q1 2019 revenues are fully generated
by our core business
55% improvement in adjusted
EBITDA despite slight decline in
topline
17
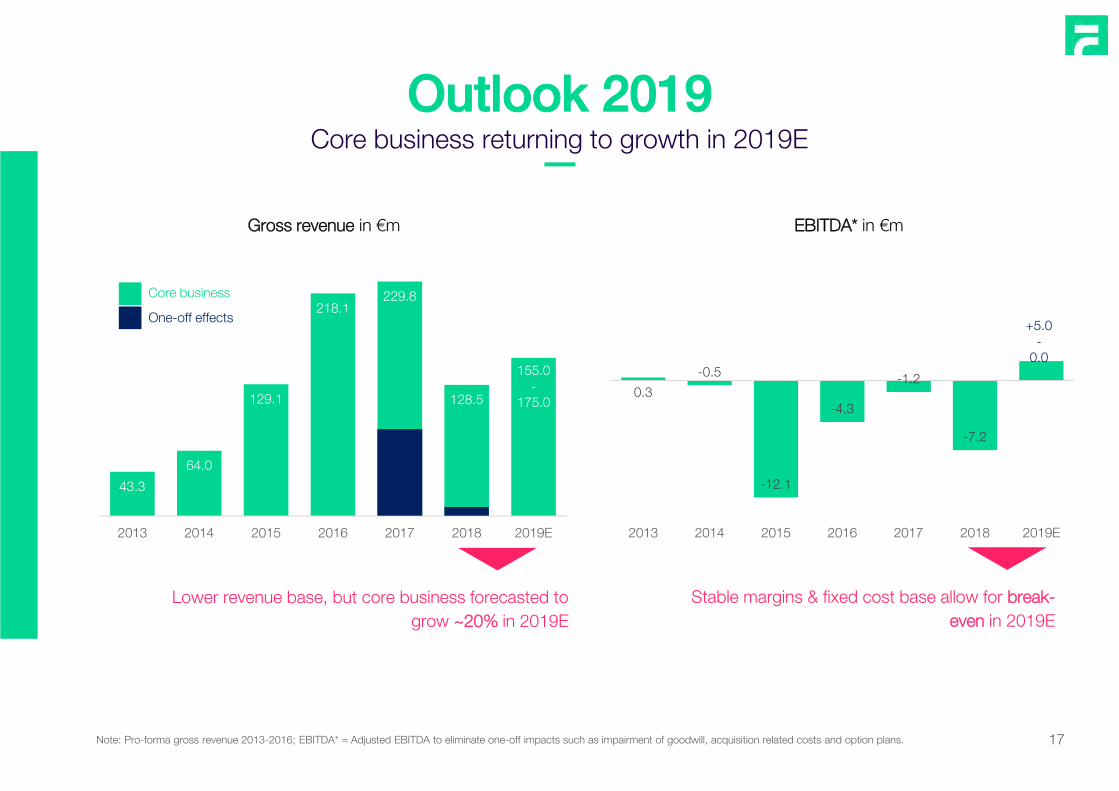
EBITDA* in €m Gross revenue in €m
Note: Pro-forma gross revenue 2013-2016; EBITDA* = Adjusted EBITDA to eliminate one-off impacts such as impairment of goodwill, acquisition related costs and option plans.
43.3
64.0
129.1
218.1229.8
128.5
2013 2014 2015 2016 2017 2018 2019E
155.0 -
175.00.3
-0.5
-12.1
-4.3
-1.2
-7.2
2013 2014 2015 2016 2017 2018 2019E
+5.0-
0.0
One-off effects
Core business
Lower revenue base, but core business forecasted to grow ~20% in 2019E
Stable margins & fixed cost base allow for break-even in 2019E
Outlook 2019Core business returning to growth in 2019E
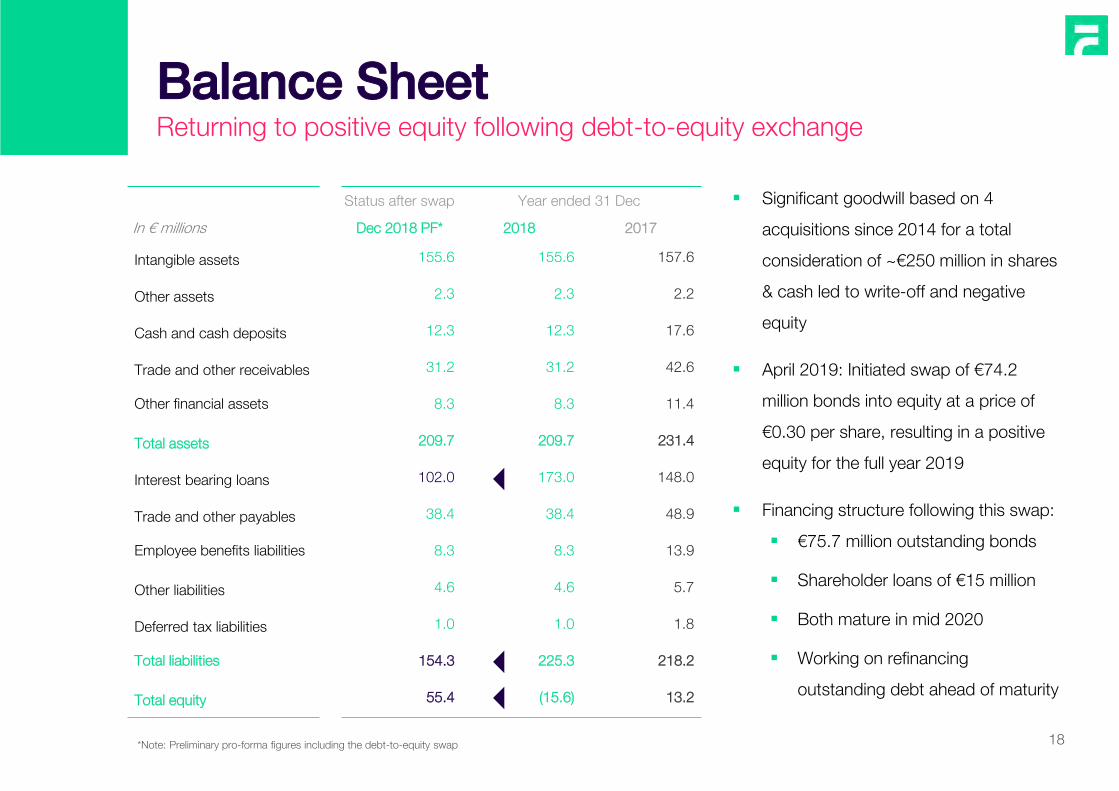
Balance SheetReturning to positive equity following debt-to-equity exchange
18
Status after swap Year ended 31 Dec
In € millions Dec 2018 PF* 2018 2017
Intangible assets 155.6 155.6 157.6
Other assets 2.3 2.3 2.2
Cash and cash deposits 12.3 12.3 17.6
Trade and other receivables 31.2 31.2 42.6
Other financial assets 8.3 8.3 11.4
Total assets 209.7 209.7 231.4
Interest bearing loans 102.0 173.0 148.0
Trade and other payables 38.4 38.4 48.9
Employee benefits liabilities 8.3 8.3 13.9
Other liabilities 4.6 4.6 5.7
Deferred tax liabilities 1.0 1.0 1.8
Total liabilities 154.3 225.3 218.2
Total equity 55.4 (15.6) 13.2
*Note: Preliminary pro-forma figures including the debt-to-equity swap
Significant goodwill based on 4
acquisitions since 2014 for a total
consideration of ~€250 million in shares
& cash led to write-off and negative
equity
April 2019: Initiated swap of €74.2
million bonds into equity at a price of
€0.30 per share, resulting in a positive
equity for the full year 2019
Financing structure following this swap:
€75.7 million outstanding bonds
Shareholder loans of €15 million
Both mature in mid 2020
Working on refinancing
outstanding debt ahead of maturity
19
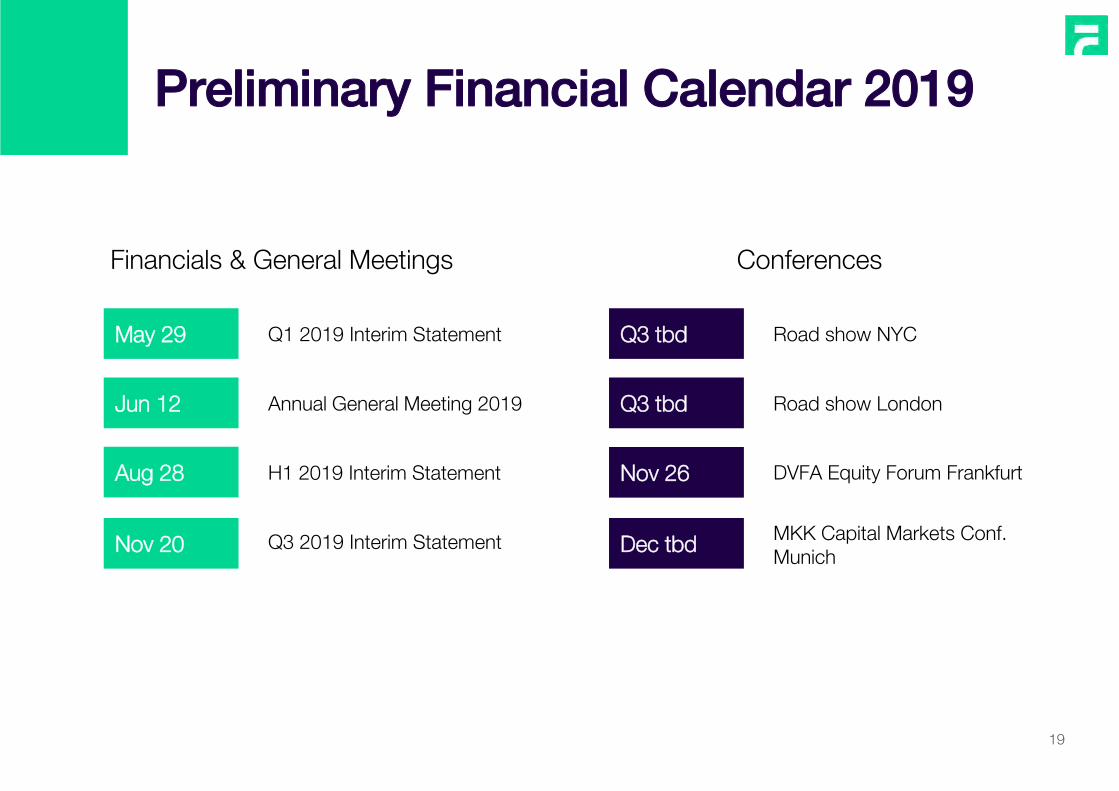
H1 2019 Interim StatementAug 28
Annual General Meeting 2019Jun 12
Q3 2019 Interim StatementNov 20
Q1 2019 Interim StatementMay 29
Financials & General Meetings Conferences
Road show LondonQ3 tbd
Road show NYCQ3 tbd
DVFA Equity Forum FrankfurtNov 26
Dec tbd MKK Capital Markets Conf. Munich
Preliminary Financial Calendar 2019
Thank You!
20
[email protected] +49 30 609 855 555
Office AddressJohannisstraße 20, 10117 Berlin, Germany
About Fyber N.V. Fyber is a leading advertising technology company, developing a next generation platform for the programmatic trading of ads, in a data-driven environment. Our mission is to fuel the creation of quality content by empowering digital publishers and app developers to unlock thetrue value of their advertising properties through advanced technologies, innovative ad formats and data-driven decision-making. Fyber’stechnology platform provides an open-access platform for both digital advertisers and publishers with a global reach of more than 1.2 billionunique monthly users. Fyber has offices in Berlin, Tel Aviv, New York, San Francisco, London, Beijing and Seoul. The Company employsmore than 270 people globally and is listed on the Prime Standard of Frankfurt Stock Exchange under the symbol ‘FBEN’ and the ISINNL0012377394.
Appendix
21
Appendix I Additional Information
22
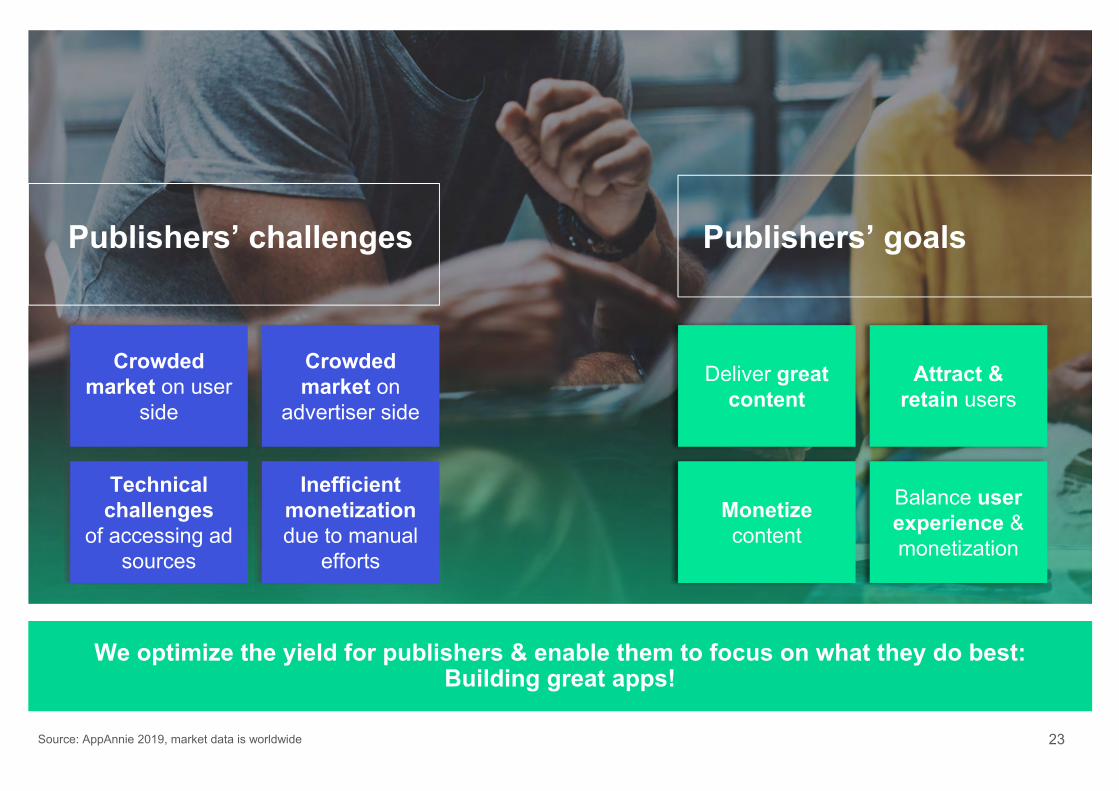
We optimize the yield for publishers & enable them to focus on what they do best:Building great apps!
Crowded market on user
side
Crowded market on
advertiser side
Inefficient monetization due to manual
efforts
Technical challenges
of accessing ad sources
23Source: AppAnnie 2019, market data is worldwide
Deliver great content
Attract & retain users
Balance user experience & monetization
Monetizecontent
Publishers’ challenges Publishers’ goals
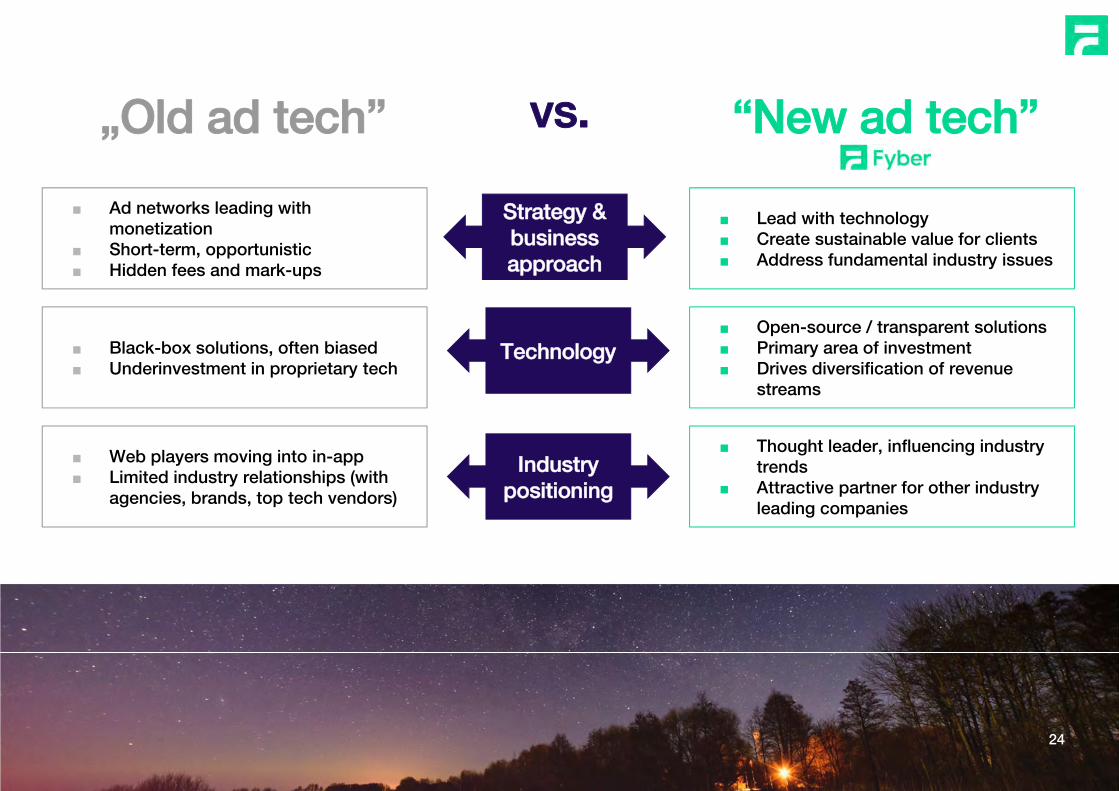
„Old ad tech” vs. “New ad tech”
Technology
Strategy & business approach
Industry positioning
■ Lead with technology■ Create sustainable value for clients■ Address fundamental industry issues
■ Open-source / transparent solutions■ Primary area of investment■ Drives diversification of revenue
streams
■ Thought leader, influencing industry trends
■ Attractive partner for other industry leading companies
■ Ad networks leading with monetization
■ Short-term, opportunistic ■ Hidden fees and mark-ups
■ Black-box solutions, often biased■ Underinvestment in proprietary tech
■ Web players moving into in-app■ Limited industry relationships (with
agencies, brands, top tech vendors)
24
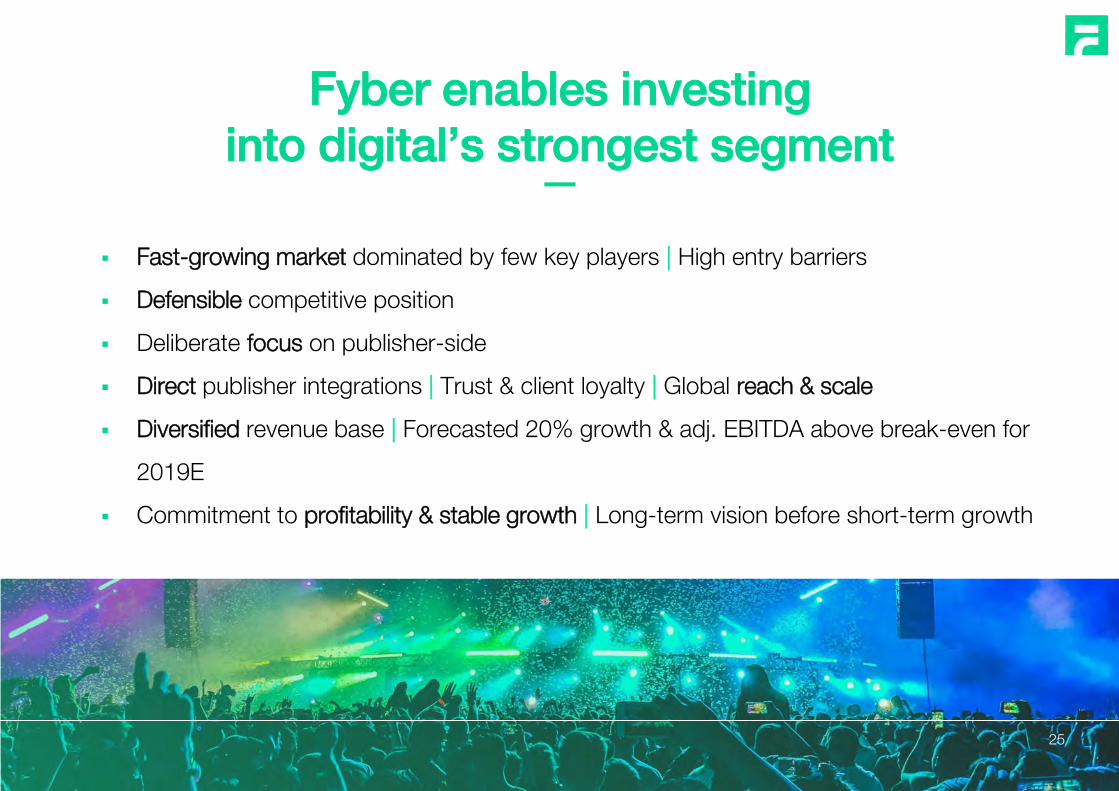
Fyber enables investing into digital’s strongest segment
Fast-growing market dominated by few key players | High entry barriers
Defensible competitive position
Deliberate focus on publisher-side
Direct publisher integrations | Trust & client loyalty | Global reach & scale
Diversified revenue base | Forecasted 20% growth & adj. EBITDA above break-even for
2019E
Commitment to profitability & stable growth | Long-term vision before short-term growth
2525
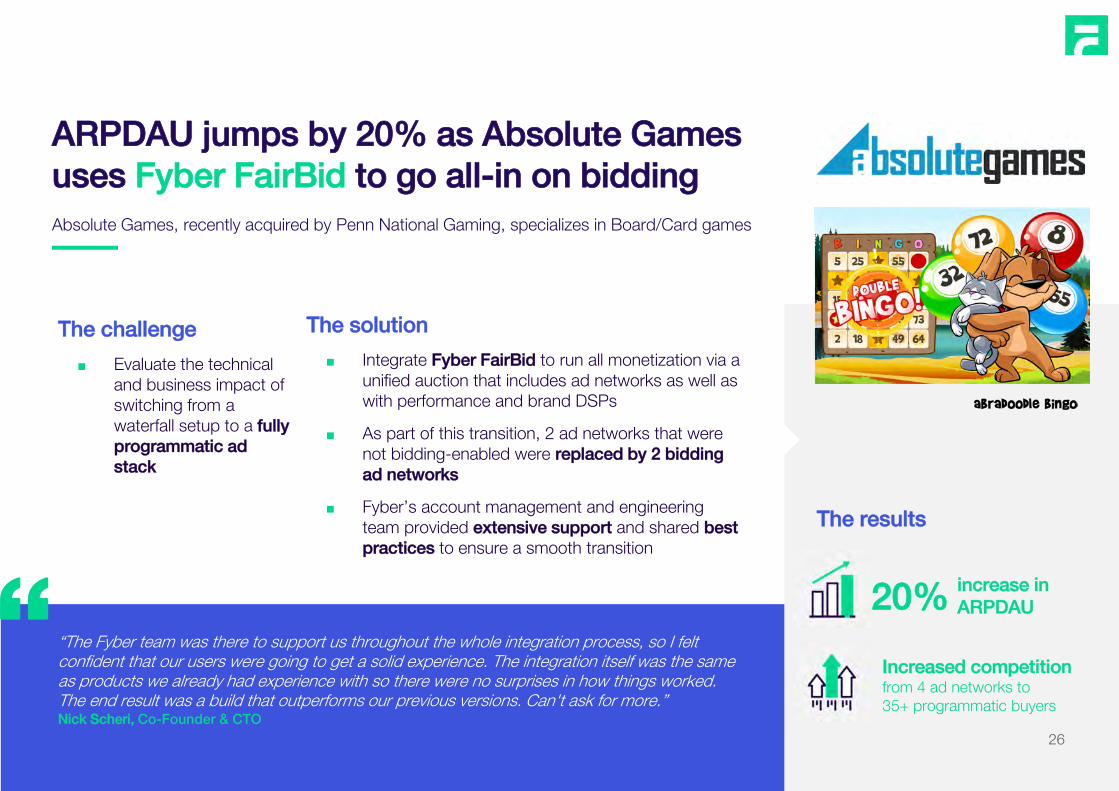
ARPDAU jumps by 20% as Absolute Games uses Fyber FairBid to go all-in on bidding
The challenge
■ Evaluate the technical and business impact of switching from a waterfall setup to a fully programmatic ad stack
The solution
■ Integrate Fyber FairBid to run all monetization via a unified auction that includes ad networks as well as with performance and brand DSPs
■ As part of this transition, 2 ad networks that were not bidding-enabled were replaced by 2 bidding ad networks
■ Fyber’s account management and engineering team provided extensive support and shared best practices to ensure a smooth transition
The results
“The Fyber team was there to support us throughout the whole integration process, so I felt confident that our users were going to get a solid experience. The integration itself was the same as products we already had experience with so there were no surprises in how things worked. The end result was a build that outperforms our previous versions. Can't ask for more.”Nick Scheri, Co-Founder & CTO
“increase in ARPDAU20%
Increased competition from 4 ad networks to 35+ programmatic buyers
Absolute Games, recently acquired by Penn National Gaming, specializes in Board/Card games
26
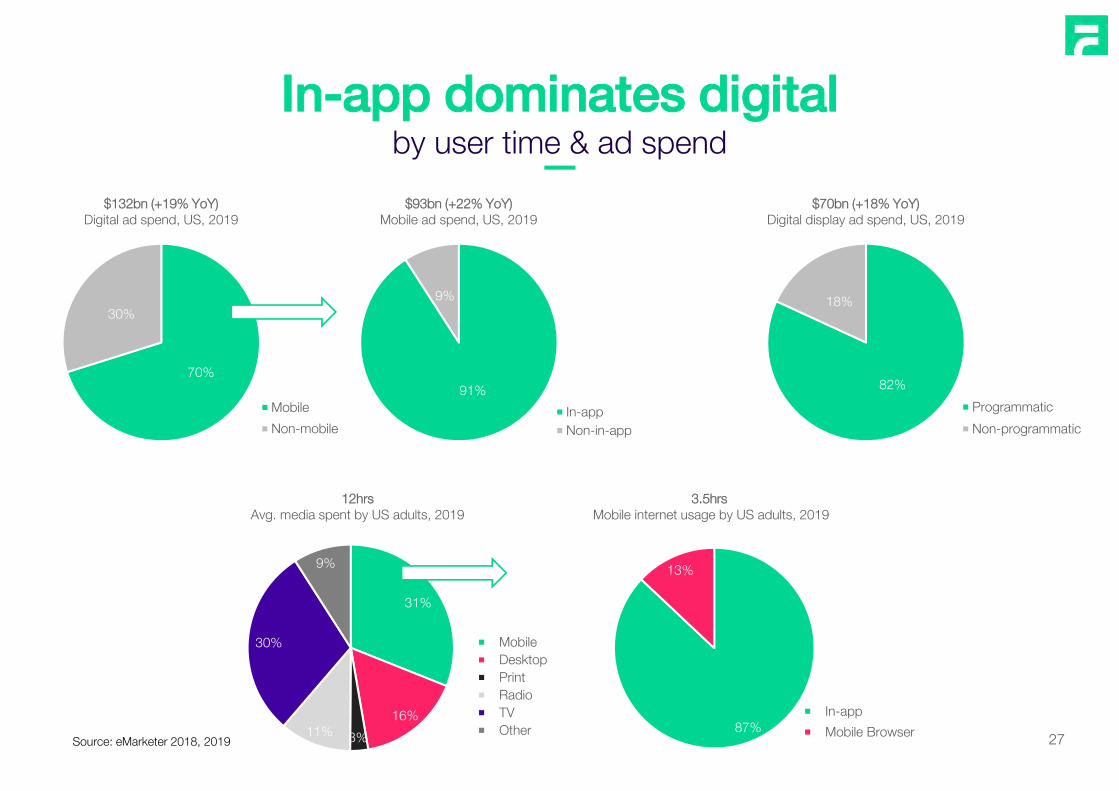
In-app dominates digitalby user time & ad spend
Source: eMarketer 2018, 2019
70%
30%
$132bn (+19% YoY) Digital ad spend, US, 2019
Mobile
Non-mobile
91%
9%
$93bn (+22% YoY) Mobile ad spend, US, 2019
In-appNon-in-app
82%
18%
$70bn (+18% YoY) Digital display ad spend, US, 2019
Programmatic
Non-programmatic
31%
16%
3%11%
30%
9%
12hrsAvg. media spent by US adults, 2019
Mobile Desktop Print Radio TV Other 87%
13%
3.5hrsMobile internet usage by US adults, 2019
In-app
Mobile Browser 27
Appendix II Additional Financials
28
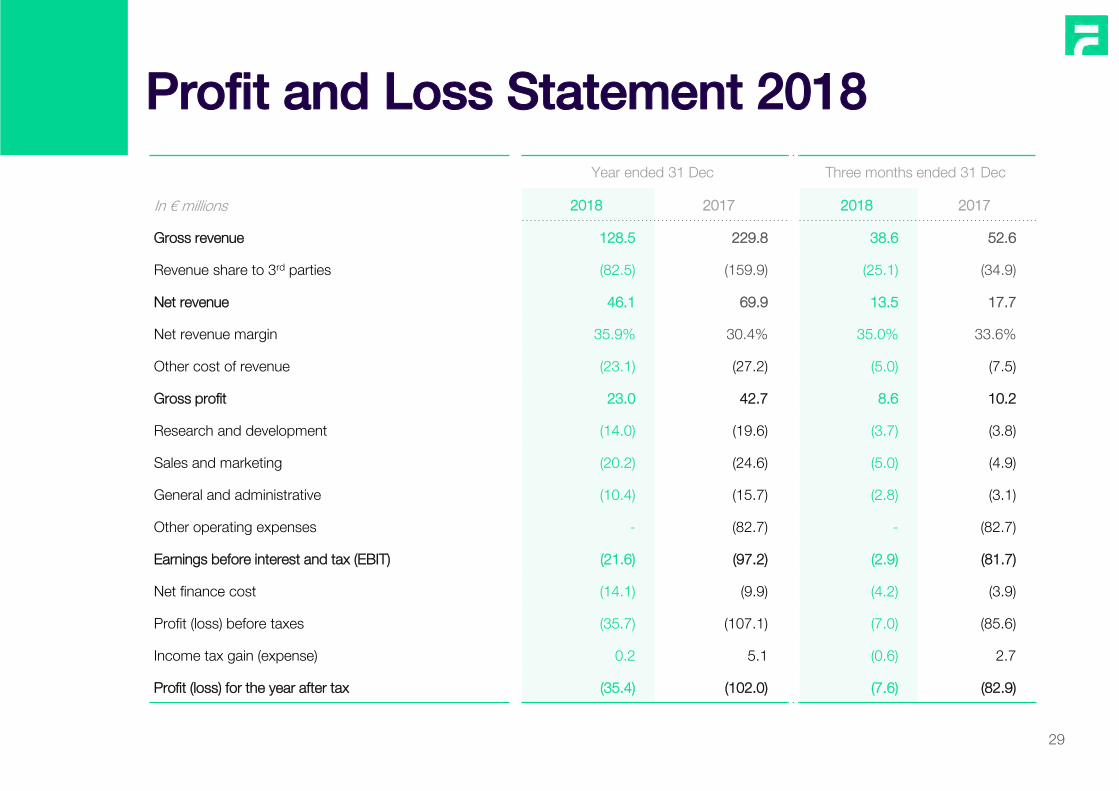
Profit and Loss Statement 2018
29
Year ended 31 Dec Three months ended 31 Dec
In € millions 2018 2017 2018 2017
Gross revenue 128.5 229.8 38.6 52.6
Revenue share to 3rd parties (82.5) (159.9) (25.1) (34.9)
Net revenue 46.1 69.9 13.5 17.7
Net revenue margin 35.9% 30.4% 35.0% 33.6%
Other cost of revenue (23.1) (27.2) (5.0) (7.5)
Gross profit 23.0 42.7 8.6 10.2
Research and development (14.0) (19.6) (3.7) (3.8)
Sales and marketing (20.2) (24.6) (5.0) (4.9)
General and administrative (10.4) (15.7) (2.8) (3.1)
Other operating expenses - (82.7) - (82.7)
Earnings before interest and tax (EBIT) (21.6) (97.2) (2.9) (81.7)
Net finance cost (14.1) (9.9) (4.2) (3.9)
Profit (loss) before taxes (35.7) (107.1) (7.0) (85.6)
Income tax gain (expense) 0.2 5.1 (0.6) 2.7
Profit (loss) for the year after tax (35.4) (102.0) (7.6) (82.9)
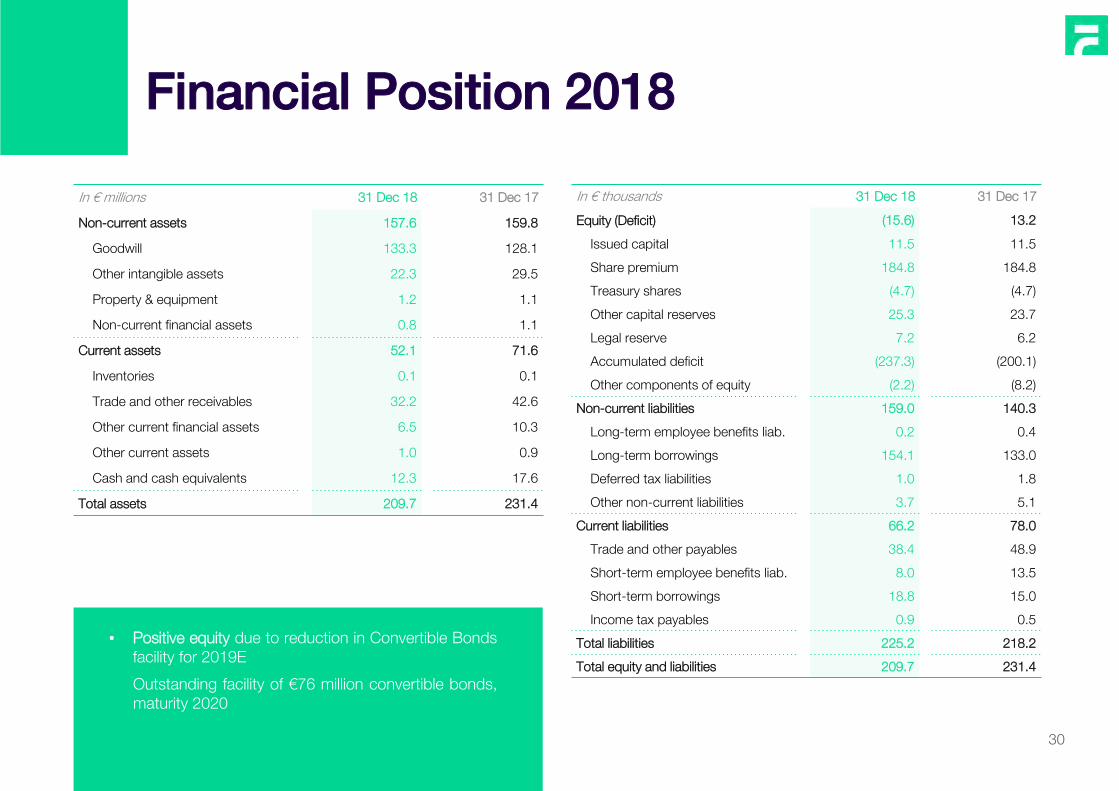
In € millions 31 Dec 18 31 Dec 17
Non-current assets 157.6 159.8
Goodwill 133.3 128.1
Other intangible assets 22.3 29.5
Property & equipment 1.2 1.1
Non-current financial assets 0.8 1.1
Current assets 52.1 71.6
Inventories 0.1 0.1
Trade and other receivables 32.2 42.6
Other current financial assets 6.5 10.3
Other current assets 1.0 0.9
Cash and cash equivalents 12.3 17.6
Total assets 209.7 231.4
In € thousands 31 Dec 18 31 Dec 17
Equity (Deficit) (15.6) 13.2
Issued capital 11.5 11.5
Share premium 184.8 184.8
Treasury shares (4.7) (4.7)
Other capital reserves 25.3 23.7
Legal reserve 7.2 6.2
Accumulated deficit (237.3) (200.1)
Other components of equity (2.2) (8.2)
Non-current liabilities 159.0 140.3
Long-term employee benefits liab. 0.2 0.4
Long-term borrowings 154.1 133.0
Deferred tax liabilities 1.0 1.8
Other non-current liabilities 3.7 5.1
Current liabilities 66.2 78.0
Trade and other payables 38.4 48.9
Short-term employee benefits liab. 8.0 13.5
Short-term borrowings 18.8 15.0
Income tax payables 0.9 0.5
Total liabilities 225.2 218.2
Total equity and liabilities 209.7 231.4
30
Financial Position 2018
▪ Positive equity due to reduction in Convertible Bondsfacility for 2019E
Outstanding facility of €76 million convertible bonds,maturity 2020
31
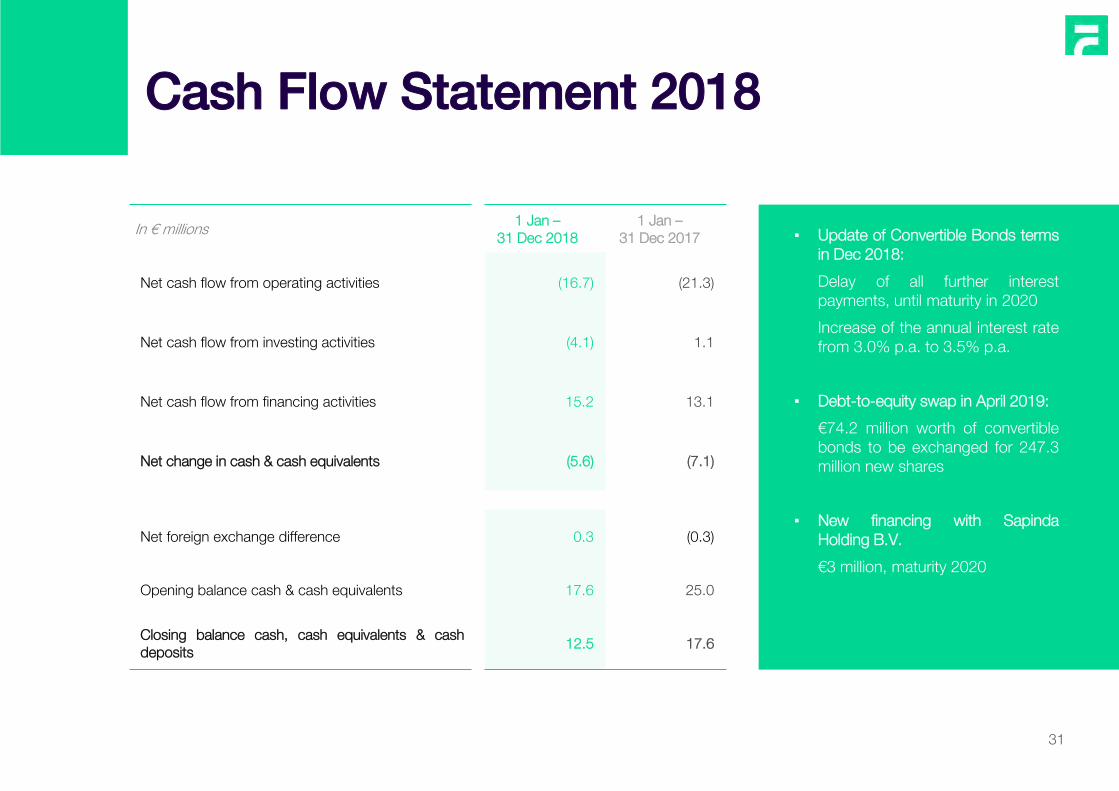
In € millions 1 Jan –31 Dec 2018
1 Jan –31 Dec 2017
Net cash flow from operating activities (16.7) (21.3)
Net cash flow from investing activities (4.1) 1.1
Net cash flow from financing activities 15.2 13.1
Net change in cash & cash equivalents (5.6) (7.1)
Net foreign exchange difference 0.3 (0.3)
Opening balance cash & cash equivalents 17.6 25.0
Closing balance cash, cash equivalents & cashdeposits
12.5 17.6
▪ Update of Convertible Bonds termsin Dec 2018:
Delay of all further interestpayments, until maturity in 2020
Increase of the annual interest ratefrom 3.0% p.a. to 3.5% p.a.
▪ Debt-to-equity swap in April 2019:
€74.2 million worth of convertiblebonds to be exchanged for 247.3million new shares
▪ New financing with SapindaHolding B.V.
€3 million, maturity 2020
Cash Flow Statement 2018
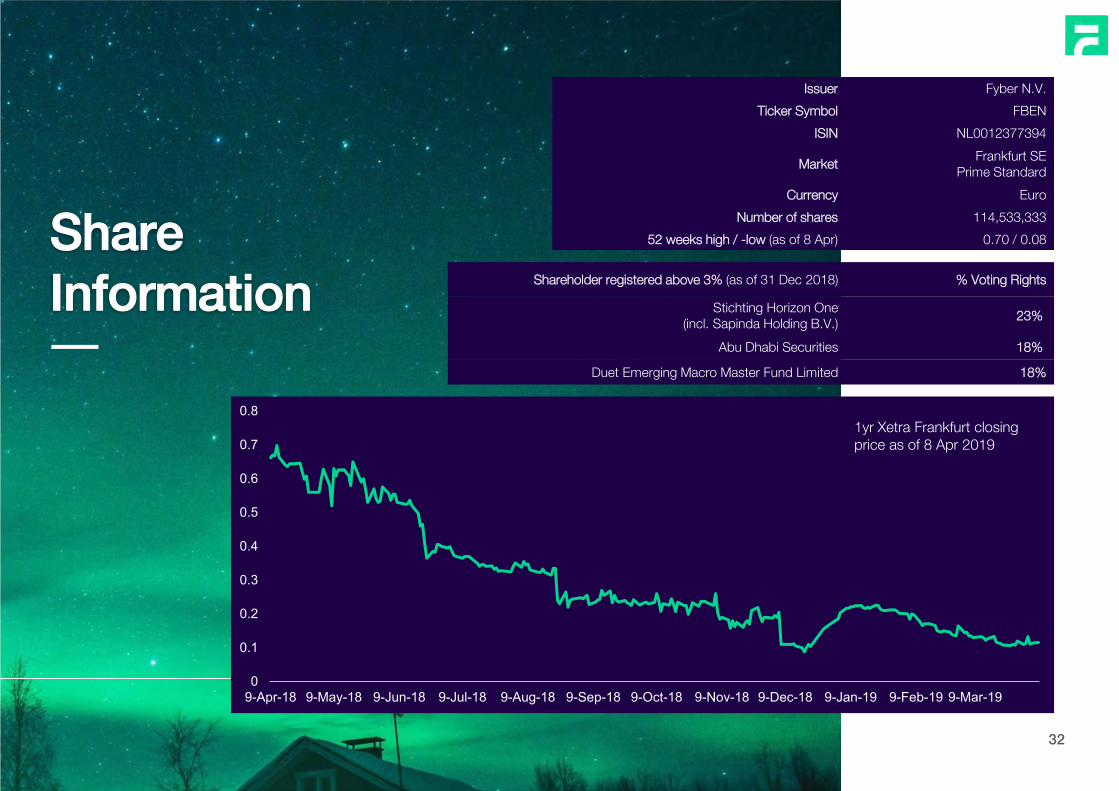
Share Information
Issuer Fyber N.V.
Ticker Symbol FBEN
ISIN NL0012377394
MarketFrankfurt SE
Prime Standard
Currency Euro
Number of shares 114,533,333
52 weeks high / -low (as of 8 Apr) 0.70 / 0.08
Shareholder registered above 3% (as of 31 Dec 2018) % Voting Rights
Stichting Horizon One (incl. Sapinda Holding B.V.)
23%
Abu Dhabi Securities 18%
Duet Emerging Macro Master Fund Limited 18%
32
1yr Xetra closing price as of 6 Nov ‘18
0
0.1
0.2
0.3
0.4
0.5
0.6
0.7
0.8
9-Apr-18 9-May-18 9-Jun-18 9-Jul-18 9-Aug-18 9-Sep-18 9-Oct-18 9-Nov-18 9-Dec-18 9-Jan-19 9-Feb-19 9-Mar-19
1yr Xetra Frankfurt closing price as of 8 Apr 2019


![Photosynthesis in Arabidopsis Is Unaffected by the · Photosynthesis in Arabidopsis Is Unaffected by the Function of the Vacuolar K1 Channel TPK31[OPEN] Ricarda Höhner,a,2 Viviana](https://static.fdocuments.net/doc/165x107/5fc74b69c00f1335b51dd5e2/photosynthesis-in-arabidopsis-is-unaffected-by-photosynthesis-in-arabidopsis-is.jpg)