Full Year 2016 Results Presentation - Bic · • 2016 Normalized IFO margin for BIC Graphic 2.4%...
68
Full Year 2016 Results Presentation 13 February 2017
Transcript of Full Year 2016 Results Presentation - Bic · • 2016 Normalized IFO margin for BIC Graphic 2.4%...

Full Year 2016 Results Presentation
13 February 2017

BIC in 2016Bruno Bich

KEY MESSAGES
3 3
Solid performance of Consumer business in all geographies
Strong cash generationEnhanced Shareholders’ Remuneration
Targeted and Efficient Additional investments in R&D and Brand Support + 79% in Development CAPEX
BIC Graphic strategic review partially completed

4
Net Sales: 2,025.8 million euros Net Sales: 2,272.4 million euros
As published Restated for discontinued operations
+1.6%
+4.9%
As reported Constantcurrency basis*
+1.4%
+4.2%
As reported Constantcurrency basis*
% of total sales
Consumer business +5.3% 86%
Developed Markets +4.1%
Developing Markets +7.5%
BIC Graphic -1.9% 14%
*See glossary
KEY FIGURESNET SALES

5
Normalized* Income from Operations:409.1 million euros (-2.8%)
Normalized* Income from Operations:418.9 million euros (-3.0%)
As published Restated for discontinued operations
*See glossary
21.0% 20.2% 20.6%
2015 2016 2016(excl. special
bonus)
19.3% 18.4% 18.9%
2015 2016 2016(excl. special
bonus)
Normalized IFO marginexcl. special
bonus
Consumer business 21.0% 21.4%
BIC Graphic 2.4% 3.3%
KEY FIGURESNORMALIZED INCOME FROM OPERATIONS

6.89 6.77
5.32
6.24
EPS Normalized EPS
6
325.1
249.7
2015 2016
Net Income Group Share: -23.2% Normalized* EPS (Group share): -7.8%
In million euros In euros
20162015
*See glossary
KEY FIGURESNET INCOME AND EPS

367.1
263.6
203.6
298.7
119.8 119.8
Cash fromoperatingactivities*
Free Cashbefore
acquisitions*
Free Cash Flowafter
acquisitions*
2015 2016
7
* See glossary
448.0
222.2
31-Dec-15 31-Dec-16
Cash Generation Net Cash Position*
In million euros In euros
KEY FIGURESCASH FLOW

OPERATIONAL INVESTMENTS
8
Main 2016 CAPEX by category
Manaus (BR) • Saltillo (MEX)Athens (GR)
Shavers
Redon (FR) • Milford (USA)Tarragona (SP)
Lighters
Samer (FR) • Marne-La-Vallée (FR)Bizerte (TU) - Manaus (BR)
Stationery
79% increase in Development CAPEX

OPERATIONAL INVESTMENTS
9
Evolution Graphite Pencil Viral Digital Ad in Brazil
New Facebookpage in Europe
Innovative Digital & Social Media Campaigns
Impactful Displays More Classic TV Advertising

65 65 68 91 104 121 122 135 16049
85
117
26 2
42 101
280
1026
82
2008 2009 2010 2011 2012 2013 2014 2015 2016
159
192 191 201
132161
359
91 67
SHAREHOLDERS’ REMUNERATION
3.45 euros Proposed ordinary dividend* per
share for 2016 fiscal year
(+1.5%)
* Payment from May 24, 2017 subject to the approval the AGM of May 10, 2017
Ordinary dividend Exceptional dividend Share buyback
10
In million euros

2016 – Operational Segment Performance
Jim DiPietro

CONSUMER BUSINESS
+7.5%
+2.7%
+6.5%
+7.2%+4.7%
+3.2%
+6.1% +5.3%
Q1 2016 Q2 2016 Q3 2016 Q4 2016 FY 2016
33% DEVELOPING
MARKETS
26%EUROPE
41%NORTH AMERICA
EUROPE
NORTH AMERICA
DEVELOPING MARKETS
1,961.0 million euros Net Sales
Change on a constant currency basis Breakdown by geo graphy
12

13.6%
7.1%9.1%
17.1%17.5%
10.4%
3.9% 2.0%5.4%
11.5%
9.2% 9.6%
1.8%
7.9%
2.5%
4.0%
6.1%
2.4%
4.3%
7.8%
3.6%
5.2%
STATIONERY
13
Net Sales growth on a constant currency basis*
2015 2016 Excl. Special bonus
Q1 Q2 Q3 Q4 FY
€67.5MFY 2016 NIFO
€736.6MFY 2016 Net Sales
Q1 Q2 Q3 Q4 FY
*See glossary
Normalized* IFO margin
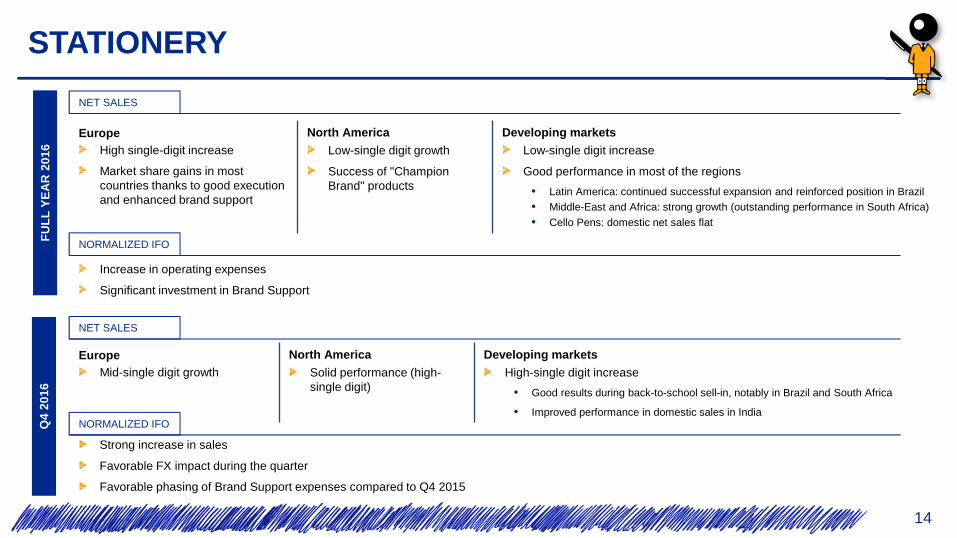
STATIONERY
Increase in operating expenses
Significant investment in Brand Support
EuropeHigh single-digit increase
Market share gains in most countries thanks to good execution and enhanced brand support
North America
Low-single digit growth
Success of "Champion Brand" products
Developing markets
Low-single digit increase
Good performance in most of the regions
• Latin America: continued successful expansion and reinforced position in Brazil• Middle-East and Africa: strong growth (outstanding performance in South Africa)
• Cello Pens: domestic net sales flat
14
NET SALES
NORMALIZED IFO
NET SALES
NORMALIZED IFO
Strong increase in sales
Favorable FX impact during the quarter
Favorable phasing of Brand Support expenses compared to Q4 2015
EuropeMid-single digit growth
North America
Solid performance (high-single digit)
Developing markets
High-single digit increase
• Good results during back-to-school sell-in, notably in Brazil and South Africa
• Improved performance in domestic sales in India
FU
LL Y
EA
R 2
016
Q4
2016

37.6% 38.0%39.5%
41.6%40.5%
39.8%41.7%
33.7%39.1% 38.2%
39.8%40.2%
9.7%
5.4%
9.3%
5.4% 5.2%6.5%
8.9%
5.2%
8.3%
5.6%
LIGHTERS
15
Net Sales growth on a constant currency basis*
2015 2016 Excl. Special bonus
Q1 Q2 Q3 Q4 FY
€277.3MFY 2016 NIFO
€696.4MFY 2016 Net Sales
Normalized* IFO margin
Q1 Q2 Q3 Q4 FY
*See glossary
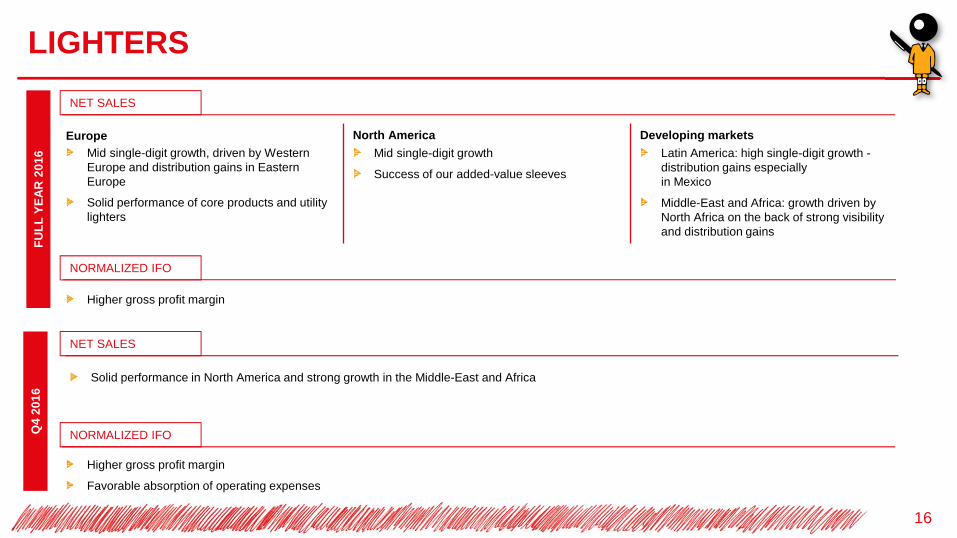
EuropeMid single-digit growth, driven by Western Europe and distribution gains in Eastern Europe
Solid performance of core products and utility lighters
North America
Mid single-digit growth
Success of our added-value sleeves
Developing markets
Latin America: high single-digit growth -distribution gains especially in Mexico
Middle-East and Africa: growth driven by North Africa on the back of strong visibility and distribution gains
LIGHTERS
16
NET SALES
NORMALIZED IFO
Higher gross profit margin
FU
LL Y
EA
R 2
016
NET SALES
NORMALIZED IFO
Higher gross profit margin
Favorable absorption of operating expenses
Q4
2016
Solid performance in North America and strong growth in the Middle-East and Africa

21.3%
10.7%12.9%
19.1%
13.8%17.0%
19.8%16.5%
15.5%18.5%
14.9%15.4%
14.7%
10.9%9.5% 9.0%
10.3%
1.4%
13.3%
6.6%
11.9%
7.0%
SHAVERS
17
Net Sales growth on a constant currency basis*
*See glossary 2015 2016 Excl. Special bonus
Q1 Q2 Q3 Q4 FY
€69.6MFY 2016 NIFO
€467.0MFY 2016 Net Sales
Normalized* IFO margin
Q1 Q2 Q3 Q4 FY

NET SALES
EuropeHigh-single digit growth
Solid performances in Eastern regions underpinned by distribution gains and successful new products launches (BIC® Flex 3 for men and BIC® Simply Soleil® for women)
North America
Market share gains: +1.4 points to 28% in value terms1
Best value/quality positioning across our entire range
Very strong new product pipeline (the BIC® Flex 5 and the BIC® Soleil® Shine shavers)
Developing markets
Double digit growth, with a solid performance across all regions
• Latin America: success of all product rangessupported by distribution gains and brand supportinvestment in the region
• Middle-East and Africa: good performance acrossall regions and in all product ranges
SHAVERS
18
NORMALIZED IFO
Increased investment in research and development and in brand support
1 Source: IRI total market YTD through 25-DECEMBER-2016 (one-piece shavers) – in value terms
NET SALES
NORMALIZED IFO
Good performance in Europe and developing markets, notably in Latin America
Negative FX impact on Gross Profit margin
Continued investment in research and development
FU
LL Y
EA
R 2
016
Q4
2016

BIC GRAPHIC
19
*See glossary
+2.4%+4.6%
+1.8%
-3.4%
+7.2% +4.6%
-13.6%
+1.6%
-1.9%
2015 2016 Excl. Special bonus
-6.7%-14.0%
-9.3%-3.0%
2.5%5.6%
8.2%11.3%
8.2%3.3% 2.4% 3.3%
Q1 Q2 Q4Q3
Q1 Q2
FY
Q4Q3 FY
Net Sales growth on a constant currency basis*
Normalized* IFO margin
€7.3MFY 2016 NIFO
€311.5MFY 2016 Net Sales
+0.3%

BIC GRAPHIC
20
Net sales
Normalized IFO
• Customers continued to recognize the vast expertise of BIC Graphic in the fields of quality, safety compliance and trademarks
• We continued to enhance our customer service and we benefited from our “Good value” positioning and new products launches
• 2016 Normalized IFO margin for BIC Graphic 2.4% compared to 3.3% in 2015
• Q4 2016 Normalized IFO margin for BIC Graphic was 8.2% compared to 11.3% in Q4 2015, due to timing impact in Calendars’ sales

BIC GRAPHIC STRATEGIC REVIEW
21
BIC Graphic Europe and Developing markets operations
BIC Graphic North America and Asia Sourcing operati ons
• BIC Graphic Europe operations:
- Will report to the European BIC Consumer Product business.
- European BIC Graphic team: focus on implementing a plan to develop a sustainable business model while developing innovative services and maintaining BIC Graphic’s imprinting and decorating expertise.
• Developing Markets: operations that have a sustainable business model will report to the local consumer business.
• Strategic alternative discussions still on-going.
• Conclusions to be communicated in the coming weeks.

-0.7 -0.4
2.9
1.2
-1.8-1.0
-3.8-2.5
-3.4-2.7 -2.5
-1.6%
-5.2%
8.5%
-15.3%
-10.9%-9.5%
-0.1%-3.2%
3.9%
-9.0%
OTHER CONSUMER PRODUCTS
22
2015 2016 Excl. Special bonus
Q1 Q2 Q3 Q4 FY
€(2.7)MFY 2016 NIFO
€61.0MFY 2016 Net Sales
Net Sales growth on a constant currency basis*
Normalized* IFO
Q1 Q2 Q3 Q4 FY
*See glossary

2016 – Consolidated Results
Jim DiPietro

BIC GroupIn million euros 2015 2016
Change in %
Change on a constant currency
basis*
Net Sales 1,993.4 2,025.8 +1.6% +4.9%
Gross Profit 1,030.8 1,065.3 +3.4%
Normalized* Income From Operations
419.4 409.1 -2.4%
Income from Operations 424.4 403.4 -4.9%
BIC GroupIn million euros 2015 2016
Change in %
Change on a constant currency
basis*
Net Sales 2,241.7 2,272.4 +1.4% +4.2%
Gross Profit 1,113.0 1,144.7 +2.8%
Normalized* Income From Operations
432.0 418.9 -3.0%
Income from Operations 439.9 355.0 -19.3%
FROM NET SALES TO INCOME FROM OPERATIONS
*See glossary
24
As published Restated for discontinued operations

FROM INCOME FROM OPERATIONS TO GROUP NET INCOME
25
In million euros FY 2015 FY 2016
Income From Operations 424.4 403.4
Finance revenue/costs 32.6 4.8
Income before Tax 457.0 408.2
Income tax -136.3 -122.7
Net Income From Continuing Operations 320.7 285.5
Net Income From Discontinued Operations 5.8 -35.8
Group Net Income 326.5 249.7
Net Income Group share 325.1 249.7
EPS Group share 6.89 5.32*
Tax rate 30.0% 29.5%
In million euros FY 2015 FY 2016
Income From Operations 439.9 355.0
Finance revenue/costs 26.8 -0.8
Income before Tax 466.7 354.3
Income tax 140.2 104.6
Group Net Income 326.5 249.7
Non-controlling interests -1.4 -
Net Income Group share 325.1 249.7
EPS Group share 6.89 5.32*
Normalized EPS Group share 6.77 6.24
Tax rate 30.0% 29.5%
As published Restated for discontinued operations
*: Including 0.78 euros related to BIC Graphic North America and Asia Sourcing impairment

+2.5 +0.5 -0.5
Q4 2015 Normalized* IFOmargin
Change in cost ofproduction**
Total brand support*** OPEX and other expenses Q4 2016 Normalized* IFOmargin
• Promotions and investments related to consumer and business development support accounted for in Gross Profit Margin : +0.2
• Advertising, consumer and trade support : +0.3
15.8%
26
*See glossary**Gross Profit margin excluding promotions and investments related to consumer and business development support***Total Brand Support: consumer and business development Support + advertising, consumer and trade support
18.3%
KEY COMPONENTS OF Q4 2016 NORMALIZED* INCOME FROM OPERATIONS MARGIN (RESTATED FOR DISCONTINUED OPERATIONS)

+1.0 -0.7 -0.7 -0.5
FY 2015 Normalized*IFO margin
Change in cost ofproduction**
Total brand support*** OPEX and otherexpenses
FY 2016 Normalized*IFO margin excluding
the impact of thespecial employee
bonus
Impact of the specialemployee bonus
FY 2016 Normalized*IFO margin
• Promotions and investments related to consumer and business development support accounted for in Gross Profit Margin: -0.1
• Advertising, consumer and trade support: -0.6
19.3% 18.9%
27
*See glossary**Gross Profit margin excluding promotions and investments related to consumer and business development support***Total Brand Support: consumer and business development support + advertising, consumer and trade support
18.4%
• Impact on Gross Profit: -0.3
• Impact in OPEX: -0.2
KEY COMPONENTS OF FY 2016 NORMALIZED* INCOME FROM OPERATIONS MARGIN (RESTATED FOR DISCONTINUED OPERATIONS)

STATIONERY24%
LIGHTERS22%
SHAVERS39%
OTHERS12%
BIC GRAPHIC
3%
5363
89
125107 112
121
181
75 77 71 72 75 8190 94
2009 2010 2011 2012 2013 2014 2015 2016
28
CAPEX Depreciation and Amortization
In million euros
CAPEX – DEPRECIATION & AMORTIZATION(RESTATED FOR DISCONTINUED OPERATIONS)

21.3% 22.8%
2015 2016
27.0%30.2%
2015 2016
62.3
16.1
101.9
101.4
196.7
59.1
16.1
106.7
121.3
215.7
BIC Graphic
Other Products
Shavers
Lighters
Stationery
2016
2015
29
Working Capital as % of sales Inventories as % of sales
BIC GroupIn million euros December 2015 December 2016
Total Working Capital 605.2 686.1
Of which inventories 478.4 518.9
Of which Trade and other receivables 440.0 522.9
Of which Trade and other payables 124.9 148.8
WORKING CAPITAL (RESTATED FOR DISCONTINUED OPERATIONS)

NET CASH POSITION
30
448.0
222.2
+ 417.2
- 118.5
- 180.8
+ 12.4 578.3
- 277.0
- 79.1
December 2015 NetCash Position
Operating cash flow Change in workingcapital and others
CAPEX Others Net Cash beforeShareholder'sRemuneration
Dividend payment Share buyback,exercise of stock
options and liquiditycontract
December 2016 NetCash Position
Operations
Net Cash From Operatingactivities €298.7M
In million euros

2016 - 2017
Paving the Way for Future Profitable Growth
Gonzalve Bich

STATIONERY 2016 MARKET SHARE
32
Source: EU7 GFK DEC-2016. / US NPD/IRI NOV-2016 / CAN. Nielsen DEC-2016 / MEX. Nielsen SEP-2016 / BRA. Nielsen OCT-2016 / SAF. Nielsen NOV-2016 / AUS. Aztec NOV-2016 / IND. Market Pulse NOV-2016
24.1% - FlatCanada (N°2)
18.3% - FlatGain in France & Germany
Western Europe (N°1)
40.4% Highest Market Share to
Date
South Africa (N°1)
14.3% - FlatUSA (N°2)
35.4% - FlatMexico (N°2)
53.9%Best Market Share gain
Brazil (N°1)
23.4%Widen gap vs. N°2
India – CELLO (N°1)
28.2% - DownAustralia (N°2)

33
23% 25% 27%
2010 2015 2016
36%45% 46%
2010 2015 2016
New Products as % of Sales
Champion Brands as % of Sales
Atlantis4 ColoursCristal’UP
STATIONERYA SOLID 2016 PERFORMANCE DRIVEN BY SUCCESSFUL NEW P RODUCT INTRODUCTIONS…

Social MediaClassic Advertising Digital
STATIONERY… AND ENHANCED BY INNOVATIVE MARKETING INITIATIVES
34
TV CAMPAIGN IN EUROPE
+16% sell-out App Generated over 120K downloads and ranked #1 under Kid’s category in App Store and Google Play
55.1K likes
5.1M views
EVOLUTION GRAPHITE PENCIL VIRAL DIGITAL AD IN LATIN AMERICA
BIC KIDS DRAWYBOOK IN EUROPE

STATIONERY 2017 NEW PRODUCTS
35
Continue to build on our Champion Brands
Innovative fast drying gel ink Extend the 4 Color range with 1 Mechanical Pencil + 3 ball pen cartridges
Improved ink smoothness on premium Atlantis Ball Pens
Erasable gel to meet growing consumer demand
The thickest eraser and clear body with an ultra comfortable grip
Enter Fine Writing Felt Pen with an attractive offer
BIC Gel-ocity Quick Dry BIC 4 Color 3+1HB BIC Atlantis X-Smooth
BIC Gel-ocity Illusion BIC Velocity Max BIC Intensity Fine

LIGHTERSFOCUS ON ADDED-VALUE PRODUCTS AND INCREASED DISTRIB UTION
36
2012 2013 2014 2015 2016
Sleeves CAGR: +10.7%
Total Lighters CAGR: +6.9%
BIC® Lighters Net Sales Growth
Sleeves: 21% of total Lighterssales in 2016
Increase distribution
Continue to reinforce distribution, notably in Latin America
and Eastern Europe

LIGHTERS2017 NEW SLEEVES
37
Europe North America
Latin America MEA - Asia - Pacific

Europe North America Latin America
SHAVERSRECENT MARKET TRENDS & BIC PERFORMANCE
38
49%
61% 62%
2011 2015 2016
- 5.0%
+ 5.0%
% of Value-added Products in total sales
Source: Nielsen/IRI / Europe= 16 countries (YTD June 2016) / NAM= USA (YTD December 2016) / LAM= BRA (YTD December 2016)
One-Piece Segment YonY performance BIC YonY Performance

On-line Players
SHAVERSTHE U.S. MARKET IN 2016
-1.9%
-5.0%-4.6%
-4.2%
2.3%
-6.1%
2015 2016
39
Off-line Market Sales
Total Refillable One-piece
Source: IRI MULO – YTD December 2015 & December 2016

SHAVERSBIC’S 2016 PERFORMANCE IN THE U.S.
40
Volume brand in the one-piece segment
25%
27%
28%
2014 2015 2016
+1.4 pt Market Share
28%
45%
60%
2014 2015 YTD Oct. 2016
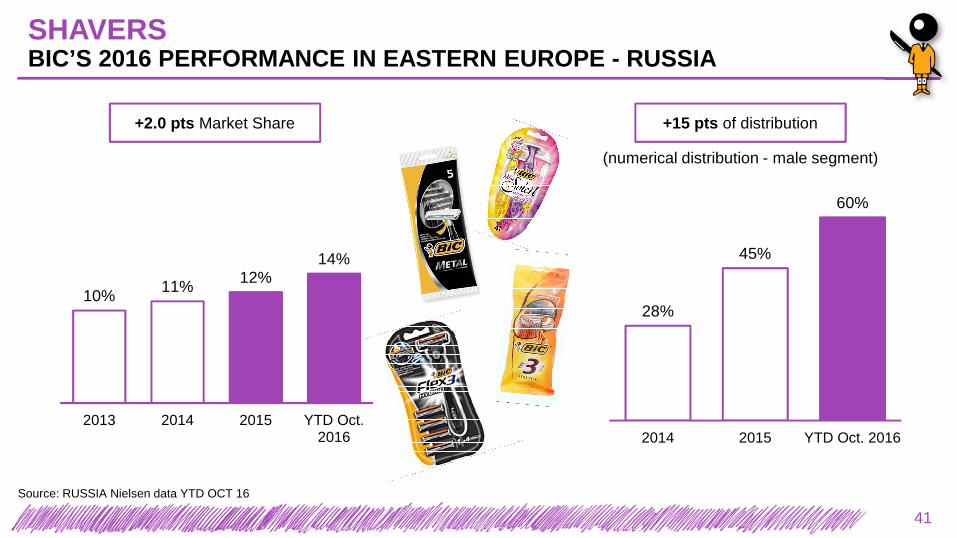
SHAVERSBIC’S 2016 PERFORMANCE IN EASTERN EUROPE - RUSSIA
10%11% 12%
14%
2013 2014 2015 YTD Oct.2016
+2.0 pts Market Share +15 pts of distribution
(numerical distribution - male segment)
Source: RUSSIA Nielsen data YTD OCT 16
41

16% 16% 17%
2014 2015 YTD June2016
29% 27%
32%
MAT June2014
MAT June2015
MAT June2016
SHAVERSBIC’S 2016 PERFORMANCE IN LATIN AMERICA - BRAZIL
Source: BRAZIL Nielsen data YTD JUN 16 & Kantar Worldpanel – Penetration: MAT JUN 2013 a MAT JUN 2016
+1.0 pt Market Share +18 pts household´s penetration
42

SHAVERS2017 NEW PRODUCT – U.S.
100
113
232
BIC Flex 5 Hybrid
Main Competitor Online
Main Competitor Offline
Price comparison – index 100
Our successful Value for Money Hybrid offer: 1 handle + 4 heads
Our best shaving performance: 5 flexible blades, heavy ergonomic handle with balancing sphere, precision edging blade for ultimate shaving performance
Source: Offline Walmart in store price per unit DEC 16 // Online advertised price per unit
43
Continue the trade up strategy and bring back consumers into retail with BIC Flex 5 Hybrid

SHAVERS2017 NEW PRODUCT – LATAM & EASTERN EUROPE
100
125
Bic Soleil Sensitive
Competitor 1
Price comparison – index 100
Continue the trade up strategy within our BIC franchise with the launch of two premium offerings
BIC’s successful Flex franchise BIC’s successful Soleil franchise
100
111
Bic Flex 3
Competitor 1
Price comparison – index 100
3 moveable blades
Ergonomic heavy handle
BIC’s best shave at a BIC price!
3 blades with protective comfort shield to reduce irritations
Ergonomic handle adapted to women
BIC’s best shave at a BIC price!
44

SHAVERS2017 NEW PRODUCT – WESTERN EUROPE
Direct-to-Consumer Subscription Offer
Men Refillable
Value Positioning
Launch: Spring 2017
An innovative on-line offer tested in France
45
2017 GROUP OUTLOOK1
46
In 2017, we plan to deliver mid-single digit organic growth in Net Sales.We will continue to launch new products and strengthen our distribution,with a focus on e-commerce in developed markets.
To enhance long-term growth, we plan another year of selectedinvestments in R&D, CAPEX and Brand Support. The total impact ofthese investments on Normalized Income From Operations margin willbe approximately -100 basis points compared to 2016, excluding majorcurrency fluctuations.
1 2017 perimeter includes Stationery, Lighters, Shavers, Other Consumer Products as well as BIC Graphic operations outside North America and Asia Sourcing

LONG-TERM STRATEGIC PRIORITIES
47
Continue to create long-term value by outperforming our markets and growing sales organicallylow to mid-single digit thanks to:
Maintain strong cash generation to:Grow Normalized Income From Operations through increased productivity as we invest in our people and Brand Support and in Research & Development with a focus on quality and innovative new products
We offer simple, inventive and reliable choices to everyone, everywhere, every time
Expanded distribution networks in all geographies
Increased focus on value-added segments in Developed markets
Enlarged consumer base in Developing markets
Continue to grow the business organically
Finance strategic bolt-on acquisitions
Sustain total Shareholders’ remuneration

Appendix

2016 VOLUMESBY CATEGORY (RESTATED FOR DISCONTINUED OPERATIONS)
49
In billion of units 2015 2016
Stationery (Consumer – including Cello)
6.763 6.905 +1.5%
Lighters 1.543 1.579 +2.3%
Shavers 2.585 2.602 +0.6%

32%
31%
21%
3%
14%
OTHER CONSUMERPRODUCTS
BIC GRAPHIC
SHAVERS
STATIONERY
LIGHTERS
2016 NET SALES BREAKDOWNBY CATEGORY (RESTATED FOR DISCONTINUED OPERATIONS)
50

24%
47%
29%
NORTH AMERICA
DEVELOPING MARKETS EUROPE
2016 NET SALES BREAKDOWNBY GEOGRAPHY (RESTATED FOR DISCONTINUED OPERATIONS)
51

2016 GROUP NET SALES EVOLUTIONBY GEOGRAPHY (RESTATED FOR DISCONTINUED OPERATIONS)
52
Change on a comparative basis*
9.1%
5.1%
7.7%8.7%
2.3%3.3%
2.6%
1.3%
9.2%
-0.1%-1.0%
8.5%
5.3%
1.8%
7.1%
Europe North America Developing countries
Q1 2016 Q2 2016 Q3 2016 Q4 2016 FY 2016
* See glossary

Q4 AND FY 2016 NET SALES MAIN EXCHANGE RATE EVOLUTION VS. EURO - RESTATED FOR DISCONTINUED OPERATIONS
53
% of sales
Average rate
Average rate % of
change % of sales
Average rate
Average rate % of
changeQ4 2015 Q4 2016 FY 2015 FY 2016US Dollar 44% 1.09 1.08 1.5% US Dollar 46% 1.11 1.11 0.3%
Brazilian Real 13% 4.22 3.56 18.5% Brazilian Real 9% 3.68 3.85 -4.5%
Mexican Peso 4% 18.34 21.43 -14.4% Mexican Peso 5% 17.58 20.69 -15.0%
Argentina 2% 11.05 16.68 -33.8% Argentina 2% 10.25 16.37 -37.4%
Canadian dollar 2% 1.46 1.44 1.7% Canadian dollar 3% 1.42 1.46 -3.3%
Australian dollar 2% 1.52 1.44 5.8% Australian dollar 2% 1.48 1.49 -0.8%
South African Zar 2% 15.55 14.97 3.9% South African Zar 1% 14.14 16.26 -13.1%
Indian Rupee 3% 72.19 72.62 -0.6% Indian Rupee 3% 71.15 74.36 -4.3%
Non Euro European countries 5% - - - Non Euro European countries 6% - - -
Sweden 9.31 9.76 -4.6% Sweden 9.35 9.47 -1.3%
Russia 72.37 67.85 6.7% Russia 67.89 74.03 -8.3%
Poland 4.26 4.39 -2.8% Poland 4.18 4.36 -4.2%
British Pound 0.72 0.87 -16.7% British Pound 0.73 0.82 -11.4%
54
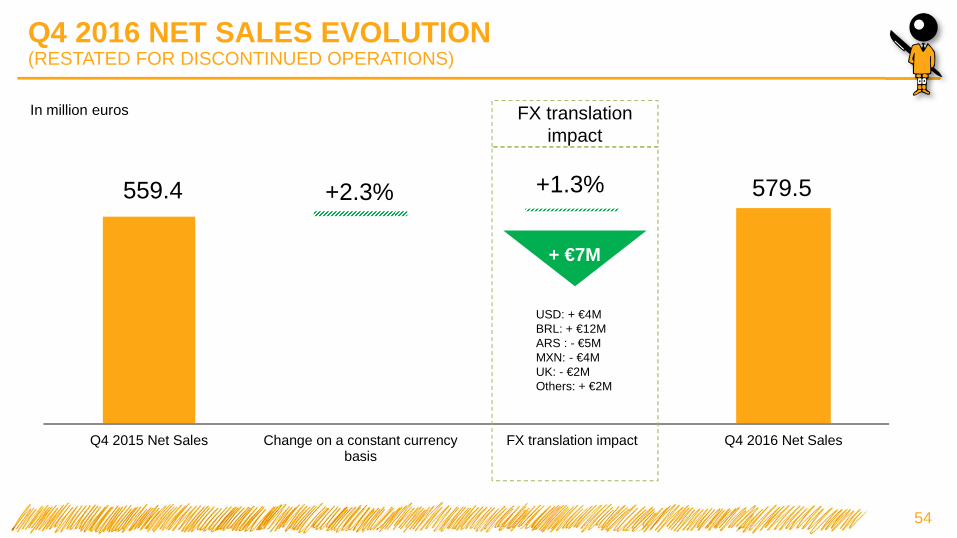
559.4 579.5
Q4 2015 Net Sales Change on a constant currencybasis
FX translation impact Q4 2016 Net Sales
+ €7M
FX translation impact
+1.3%+2.3%
USD: + €4MBRL: + €12MARS : - €5MMXN: - €4MUK: - €2MOthers: + €2M
In million euros
Q4 2016 NET SALES EVOLUTION (RESTATED FOR DISCONTINUED OPERATIONS)
55
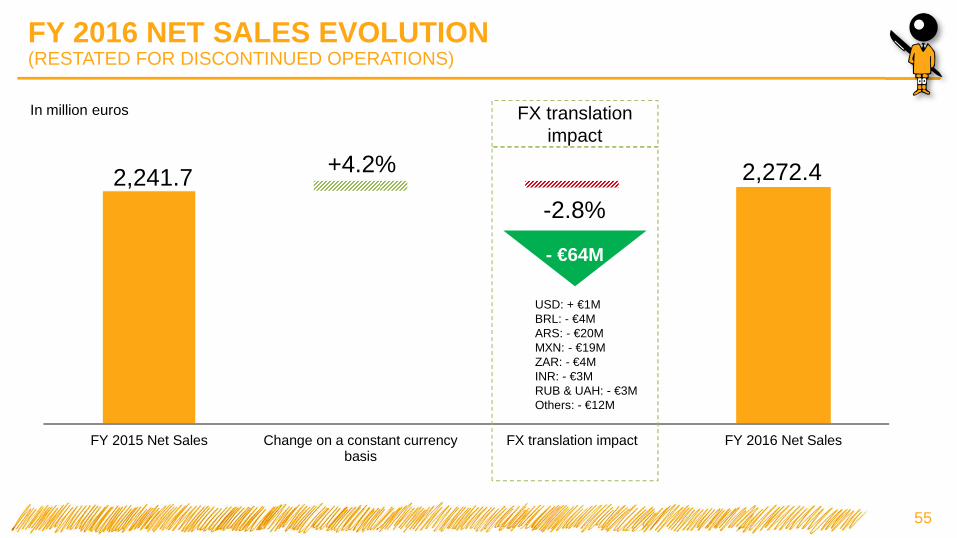
2,241.7 2,272.4
FY 2015 Net Sales Change on a constant currencybasis
FX translation impact FY 2016 Net Sales
- €64M
FX translation impact
-2.8%
+4.2%
USD: + €1MBRL: - €4MARS: - €20MMXN: - €19MZAR: - €4MINR: - €3MRUB & UAH: - €3MOthers: - €12M
In million euros
FY 2016 NET SALES EVOLUTION (RESTATED FOR DISCONTINUED OPERATIONS)

GROUP QUARTERLY FIGURES
*See glossary
56
Restated for Discontinued Operations
In million euros FY 13 Q1 14 Q2 14 Q3 14 Q4 14 FY 14 Q1 15 Q2 15 Q3 15 Q4 15 FY 15 Q1 16 Q2 16 Q3 16 Q4 16 FY 16 FY 16
Net Sales 1,887.8 434.2 534.3 496.8 513.8 1,979.1 510.8 623.1 548.3 559.4 2,241.7 517.3 616.0 559.6 579.5 2,272.4 2,025.8
YoY actual changes -0.6% +1.3% +5.0% +5.6% +7.1% +4.8% +17.6% +16.6% +10.4% +8.9% +13.3% +1.3% -1.1% 2.1% +3.6% +1.4% +1.6%
YoY changes on a constant currencies basis* +4.6% +6.2% +5.2% +4.1% +6.9% +5.6% +6.9% +4.2% +3.8% +2.3% +4.2% +4.9%
YoY changes on a comparative basis* +3.6% +4.5% +7.6% +2.6% +4.8% +4.9% +6.8% +5.8% +4.8% +7.3% +6.2% +6.9% +4.2% +3.8% +2.3% +4.2% +4.9%
IFO 339.2 73.0 123.7 94.7 77.9 369.3 97.6 143.9 104.2 94.2 439.9 76.4 127.3 104.0 47.4 355.0 403.4
Normalized IFO* 344.2 73.0 111.6 94.7 90.6 370.0 101.8 137.4 104.2 88.6 432.0 76.4 131.6 105.2 105.8 418.9 409.1
IFO margin 18.0% 16.8% 23.1% 19.1% 15.2% 18.7% 19.1% 23.1% 19.0% 16.8% 19.6% 14.8% 20.7% 18.6% 8.2% 15.6% 19.9%
Normalized IFO margin* 18.2% 16.8% 20.9% 19.1% 17.6% 18.7% 19.9% 22.1% 19.0% 15.8% 19.3% 14.8% 21.4% 18.8% 18.3% 18.4% 20.2%
Income before tax 345.8 74.5 123.7 96.2 86.1 380.4 110.3 142.9 110.3 103.1 466.7 73.0 127.3 105.2 103.4 354.3 408.2
Net Income Group Share 241.5 50.1 85.6 66.6 59.7 262.1 77.2 99.3 76.3 72.1 325.1 51.0 89.1 73.6 72.3 249.7 249.7
EPS Group Share 5.13 1.07 1.82 1.42 1.27 5.57 1.64 2.10 1.62 1.53 6.89 1.08 1.89 1.57 1.54 5.32 5.32

GROUP QUARTERLY FIGURES BY GEOGRAPHY(RESTATED FROM DISCONTINUED OPERATIONS)
*See glossary
57
In million euros FY 13 Q1 14 Q2 14 Q3 14 Q4 14 FY 14 Q1 15 Q2 15 Q3 15 Q4 15 FY 15 Q1 16 Q2 16 Q3 16 Q4 16 FY 16
Europe 493.8 111.4 153.7 130.2 113.9 509.1 117.6 160.0 131.4 118.9 527.8 126.4 170.1 131.4 116.8 544.8
Net Sales
YoY actual changes +1.9% +1.6% -+0.2% +8.5% +3.3% +3.1% +5.5% +4.1% +0.9% +4.4% +3.7% +7.5% +6.3% +0.1% -1.7% +3.2%
YoY changes on a comparative basis* +3.4% +2.6% +0.7% +8.7% +6.0% +4.3% +7.3% +5.0% +3.5% +5.7% +5.3% +9.1% +8.7% +2.6% -0.1% +5.3%
North America 802.6 169.4 225.1 220.7 214.9 830.1 220.9 290.5 268.7 259.9 1,040.1 235.9 290.3 271.1 261.5 1,058.6
Net Sales
YoY actual changes -1.9% -+3.0% +6.0% +0.4% +9.8% +3.4% +30.4% +29.0% +21.7% +21.0% +25.3% +6.8% -0.1% +0.9% +0.6% +1.8%
YoY changes on a comparative basis* +1.8% +1.4% +11.5% +0.9% +1.4% +4.0% +8.1% +4.9% +2.9% +6.8% +5.5% +5.1% +2.3% +1.3% -1.0% +1.8%
Developing markets591.3 153.4 155.4 145.9 185.1 639.8 172.3 172.6 148.3 180.6 673.8 154.9 155.6 157.1 201.2 669.0
Net Sales
YoY actual changes -0.8% +6.3% +9.2% +11.7% +6.4% +8.2% +12.3% +11.0% +1.6% -2.4% +5.3% -10.1% -9.8% +6.0% +11.4% -0.7%
YoY changes on a comparative basis* +6.4% +9.6% +9.1% -+0.2% +7.9% +6.8% +5.2% +8.0% +9.0% +8.9% +7.8% +7.7% +3.3% +9.2% +8.5% +7.1%

GROUP QUARTERLY FIGURES BY GEOGRAPHY(RESTATED FROM DISCONTINUED OPERATIONS)
*See glossary
58
In million euros FY 13 Q1 14 Q2 14 Q3 14 Q4 14 FY 14 Q1 15 Q2 15 Q3 15 Q4 15 FY 15 Q1 16 Q2 16 Q3 16 Q4 16 FY 16
Net Sales 1,619.9 382.6 475.0 426.0 420.0 1,703.6 449.7 551.7 470.0 450.9 1,922.4 453.1 546.6 476.3 485.0 1,961.0
YoY actual changes +0.8% +1.8% +6.3% +6.2% +5.9% +5.2% +17.6% +16.2% +10.3% +7.3% +12.8% +0.8% -0.9% +1.3% +7.6% +2.0%
YoY changes on a constant currencies basis* +6.3% +11.7% +12.8% +7.2% +3.9% +9.0% +6.7% +5.6% +5.3% +7.4% +6.2% +7.2% +4.7% +3.2% +6.1% +5.3%
YoY changes on a comparative basis* +5.2% +4.9% +8.6% +2.7% +4.6% +5.3% +7.4% +6.3% +6.2% +7.9% +6.9% +7.2% +4.7% +3.2% +6.1% +5.3%
IFO 333.8 76.7 124.7 91.2 67.1 359.7 101.7 144.5 99.8 80.7 426.7 85.4 125.9 97.3 98.7 407.3
Normalized IFO* 332.6 76.7 112.5 91.2 79.8 360.3 106.0 139.5 99.8 76.3 421.5 85.4 129.8 98.4 98.0 411.6
IFO margin 20.6% 20.1% 26.3% 21.4% 16.0% 21.1% 22.6% 26.2% 21.2% 17.9% 22.2% 18.8% 23.0% 20.4% 20.4% 20.8%
Normalized IFO margin* 20.5% 20.1% 23.7% 21.4% 19.0% 21.1% 23.6% 25.3% 21.2% 16.9% 21.9% 18.8% 23.8% 20.6% 20.2% 21.0%

STATIONARY(RESTATED FROM DISCONTINUED OPERATIONS)
*See glossary
59
In million euros FY 13 Q1 14 Q2 14 Q3 14 Q4 14 FY 14 Q1 15 Q2 15 Q3 15 Q4 15 FY 15 Q1 16 Q2 16 Q3 16 Q4 16 FY 16
Net Sales 616.4 144 212 169.2 151.7 676.9 157.1 233.2 184.3 152.4 727.0 156.0 230.7 184.4 165.6 736.6
YoY actual changes -0.2% +11.0% +12.6% +12.5% +2.5% +9.8% +9.1% +10.0% +8.9% +0.5% +7.4% -0.7% -1.1% +0.1% +8.6% +1.3%
YoY changes on a constant currencies basis* +23.9% +17.9% +12.5% +1.1% +13.8% -0.2% +1.1% +4.0% +2.9% +1.9% +7.9% +4.0% +2.4% +7.8% +5.2%
YoY changes on a comparative basis* 2.1% +4.2% +8.0% +0.5% +3.0% +4.2% +1.8% +2.5% +6.1% +4.3% +3.6% +7.9% +4.0% +2.4% +7.8% +5.2%
IFO 79.4 15.6 40 18.4 9.0 83.0 19.8 40.7 19.2 4.0 83.7 11.1 38.8 7.2 9.1 66.2
Normalized IFO* 78.3 15.6 36.5 18.4 14.0 84.5 21.3 39.9 19.2 3.1 83.4 11.1 40.3 7.2 8.9 67.5
IFO margin 12.9% 10.8% 18.9% 10.8% 5.9% 12.3% 12.6% 17.5% 10.4% 2.6% 11.5% 7.1% 16.8% 3.9% 5.5% 9.0%
Normalized IFO margin* 12.7% 10.8% 17.2% 10.8% 9.3% 12.5% 13.6% 17.1% 10.4% 2.0% 11.5% 7.1% 17.5% 3.9% 5.4% 9.2%
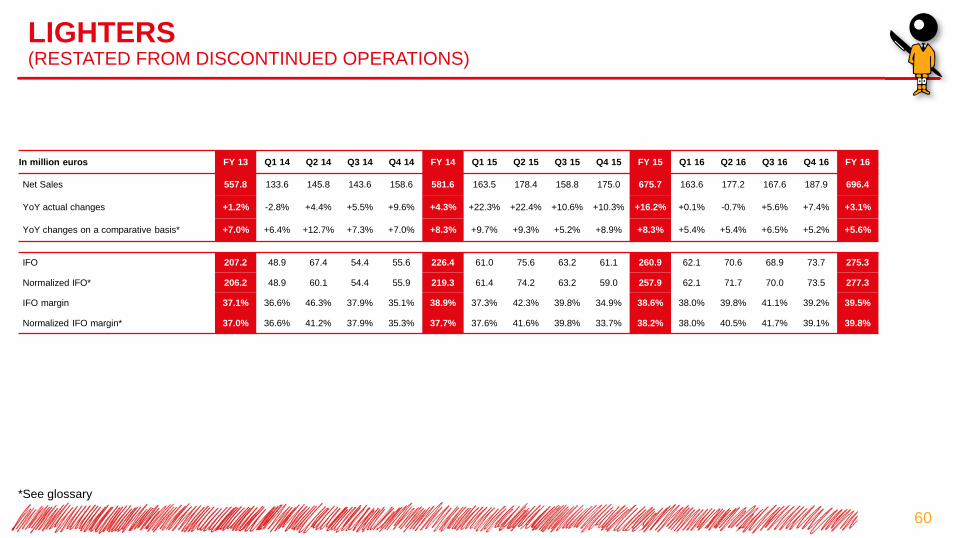
LIGHTERS(RESTATED FROM DISCONTINUED OPERATIONS)
*See glossary
60
In million euros FY 13 Q1 14 Q2 14 Q3 14 Q4 14 FY 14 Q1 15 Q2 15 Q3 15 Q4 15 FY 15 Q1 16 Q2 16 Q3 16 Q4 16 FY 16
Net Sales 557.8 133.6 145.8 143.6 158.6 581.6 163.5 178.4 158.8 175.0 675.7 163.6 177.2 167.6 187.9 696.4
YoY actual changes +1.2% -2.8% +4.4% +5.5% +9.6% +4.3% +22.3% +22.4% +10.6% +10.3% +16.2% +0.1% -0.7% +5.6% +7.4% +3.1%
YoY changes on a comparative basis* +7.0% +6.4% +12.7% +7.3% +7.0% +8.3% +9.7% +9.3% +5.2% +8.9% +8.3% +5.4% +5.4% +6.5% +5.2% +5.6%
IFO 207.2 48.9 67.4 54.4 55.6 226.4 61.0 75.6 63.2 61.1 260.9 62.1 70.6 68.9 73.7 275.3
Normalized IFO* 206.2 48.9 60.1 54.4 55.9 219.3 61.4 74.2 63.2 59.0 257.9 62.1 71.7 70.0 73.5 277.3
IFO margin 37.1% 36.6% 46.3% 37.9% 35.1% 38.9% 37.3% 42.3% 39.8% 34.9% 38.6% 38.0% 39.8% 41.1% 39.2% 39.5%
Normalized IFO margin* 37.0% 36.6% 41.2% 37.9% 35.3% 37.7% 37.6% 41.6% 39.8% 33.7% 38.2% 38.0% 40.5% 41.7% 39.1% 39.8%

SHAVERS(RESTATED FROM DISCONTINUED OPERATIONS)
*See glossary
61
In million euros FY 13 Q1 14 Q2 14 Q3 14 Q4 14 FY 14 Q1 15 Q2 15 Q3 15 Q4 15 FY 15 Q1 16 Q2 16 Q3 16 Q4 16 FY 16
Net Sales 377.5 88.9 98.1 97.9 95.1 380 112.4 117.8 113.0 108.8 452.0 117.8 120.1 111.8 117.3 467.0
YoY actual changes +1.1% -2.7% -0.6% -0.7% +7.0% +0.7% +26.5% +20.0% +15.4% +14.5% +18.9% +4.8% +2.0% -1.1% +7.8% +3.3%
YoY changes on a comparative basis* +6.5% +5.1% +6.3% +0.8% +4.5% +4.1% +14.7% +9.5% +10.3% +13.3% +11.9% +10.9% +9.0% +1.4% +6.6% +7.0%
IFO 65.3 15.5 18.9 19.2 11.1 64.7 21.4 23.4 19.2 19.4 83.3 12.6 15.4 22.2 18.4 68.6
Normalized IFO* 64.3 15.5 17.6 19.2 15.4 67.7 23.9 22.5 19.2 18.0 83.6 12.6 16.6 22.2 18.2 69.6
IFO margin 17.3% 17.4% 19.3% 19.6% 11.6% 17.0% 19.0% 19.8% 17.0% 17.8% 18.4% 10.7% 12.8% 19.8% 15.7% 14.7%
Normalized IFO margin* 17.0% 17.4% 18.0% 19.6% 16.2% 17.8% 21.3% 19.1% 17.0% 16.5% 18.5% 10.7% 13.8% 19.8% 15.5% 14.9%
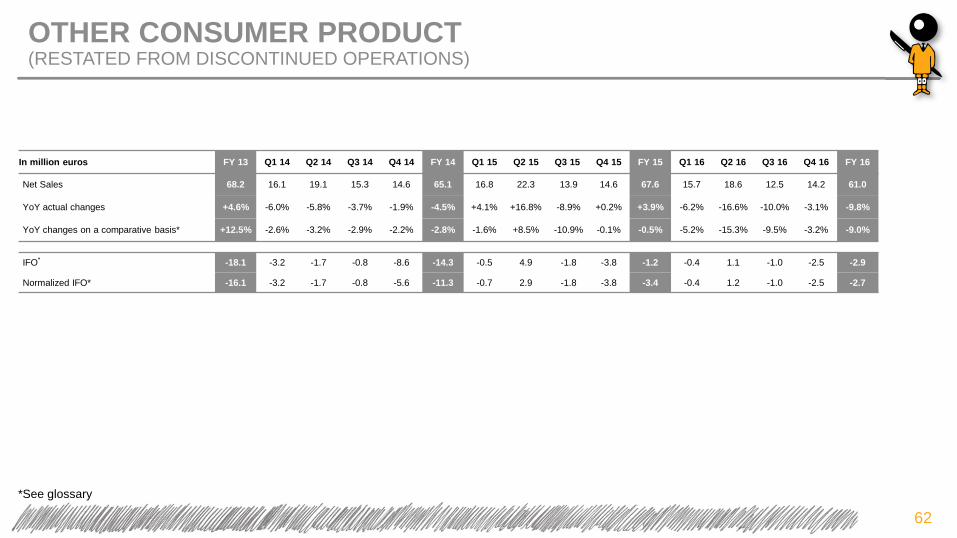
OTHER CONSUMER PRODUCT(RESTATED FROM DISCONTINUED OPERATIONS)
*See glossary
62
In million euros FY 13 Q1 14 Q2 14 Q3 14 Q4 14 FY 14 Q1 15 Q2 15 Q3 15 Q4 15 FY 15 Q1 16 Q2 16 Q3 16 Q4 16 FY 16
Net Sales 68.2 16.1 19.1 15.3 14.6 65.1 16.8 22.3 13.9 14.6 67.6 15.7 18.6 12.5 14.2 61.0
YoY actual changes +4.6% -6.0% -5.8% -3.7% -1.9% -4.5% +4.1% +16.8% -8.9% +0.2% +3.9% -6.2% -16.6% -10.0% -3.1% -9.8%
YoY changes on a comparative basis* +12.5% -2.6% -3.2% -2.9% -2.2% -2.8% -1.6% +8.5% -10.9% -0.1% -0.5% -5.2% -15.3% -9.5% -3.2% -9.0%
IFO* -18.1 -3.2 -1.7 -0.8 -8.6 -14.3 -0.5 4.9 -1.8 -3.8 -1.2 -0.4 1.1 -1.0 -2.5 -2.9
Normalized IFO* -16.1 -3.2 -1.7 -0.8 -5.6 -11.3 -0.7 2.9 -1.8 -3.8 -3.4 -0.4 1.2 -1.0 -2.5 -2.7

BIC GRAPHIC(RESTATED FROM DISCONTINUED OPERATIONS)
*See glossary
63
In million euros FY 13 Q1 14 Q2 14 Q3 14 Q4 14 FY 14 Q1 15 Q2 15 Q3 15 Q4 15 FY 15 Q1 16 Q2 16 Q3 16 Q4 16 FY 16
Net Sales 267.9 51.7 59.3 70.8 93.8 275.6 61.1 71.4 78.3 108.5 319.3 64.1 69.5 83.3 94.6 311.5
YoY actual changes -8.0% -2.5% -4.4% +1.9% +12.5% +2.9% +18.3% +20.4% +10.7% +15.7% +15.9% +5.0% -2.7% +6.3% -12.8% -2.5%
YoY changes on a comparative basis* -5.0% +1.4% +0.1% +1.9% +5.7% +2.5% +2.4% +1.8% -3.4% +4.6% +1.6% +4.6% +0.3% +7.2% -13.6% -1.9%
IFO 5.4 -3.8 -1 3.6 10.8 9.6 -4.1 -0.6 4.3 13.5 13.1 -9.0 1.4 6.7 -51.4 -52.2
Normalized IFO* 11.6 -3.7 -0.9 3.6 10.8 9.7 -4.1 -2.1 4.3 12.3 10.4 -9.0 1.8 6.8 7.8 7.3
IFO margin 2.0% -7.3% -1.8% 5.0% 11.5% 3.5% -6.7% -0.9% 5.6% 12.5% 4.1% -14.0% 2.0% 8.1% -54.3% -16.8%
Normalized IFO margin* 4.3% -7.2% -1.6% 5.0% 11.5% 3.5% -6.7% -3.0% 5.6% 11.3% 3.3% -14.0% 2.5% 8.2% 8.2% 2.4%

MISCELLANEOUS
Capital evolution:As of December 31, 2016, the total number of issued shares of SOCIÉTÉ BIC was 47,552,202 shares, representing:• 69,098,170 voting rights,• 68,230,150 voting rights excluding shares without v oting rights.
Total treasury shares at the end of December 2016: 868,020.
64

GLOSSARY
On a constant currency basis:• Constant currency figures are calculated by transla ting the current year figures at prior year monthly average exchange
rates
Comparative basis:• On a constant currency basis and constant perimeter
Normalized IFO:• Normalized means excluding non-recurring items
Normalized IFO margin• Normalized IFO as percentage of net sales
Net cash from operating activities• Principal revenue-generating activities of the entity and other activities that are not investing or financing activi ties
Net cash position• Cash and cash equivalents + Other current financial assets - Current borrowings - Non-current borrowings
FY 2016 as published• Figures presented within the “as published” caption are tak en directly from the consolidated financial statements as o f
and for the 12 month-periods ended December 31, 2015 and 2016 and present BIC Graphic NAM & Asian Sourcing asdiscontinued operations in accordance with IFRS.
FY 2016 restated for discontinued operations• Figures presented within the “restated for discontinued op erations” caption are based on the restatement of the
discontinued activities classification and aim at present ing information that is consistent with the historical pres entation.
65

DISCLAIMER
This document contains forward-looking statements. Although BIC believesits estimates are based on reasonable assumptions, these statementsare subject to numerous risks and uncertainties.
A description of the risks borne by BIC appears in section “Risks and Opportunities”of BIC “Registration Document” filed with the French financial markets authority(AMF) on March 23, 2016.
66

First quarter 2017 results 26 April 2017 Conference call
2016 AGM 10 May 2017 Meeting – BIC Headquarters
Second quarter 2017 results 03 August 2017 Conference call
Third quarter 2017 results 25 October 2017 Conference call
2017 AGENDA
67
All dates to be confirmed