Greendex 2014 - Consumer Choice and the Environment - A Worldwide Tracking Survey
FULL SCHOOL CHOICE TRACKING SURVEY 2016
29
FULL SCHOOL CHOICE TRACKING SURVEY 2016 AUGUST 8, 2016 MARKETING RESOURCE GROUP 225 S. Washington Square, Lansing, MI 48933
Transcript of FULL SCHOOL CHOICE TRACKING SURVEY 2016

FULL SCHOOL CHOICE TRACKING SURVEY 2016
AUGUST 8, 2016 MARKETING RESOURCE GROUP
225 S. Washington Square, Lansing, MI 48933

P a g e | 1
Table of Contents Overview ......................................................................................................................... 2
Key Findings ................................................................................................................... 2
Data Analysis .................................................................................................................. 4
Grading the Schools .................................................................................................... 4
School Choice Options and Support ............................................................................ 5
Support / Opposition to School Choice Expansion ...................................................... 7
Familiarity with and Support for Charter Schools ......................................................... 8
Familiarity ................................................................................................................. 8
Support for Charters ................................................................................................. 9
School Choice Funding Options ................................................................................ 11
Income Tax Credit Scholarship Program for Tuition ............................................... 11
Education Savings Accounts .................................................................................. 13
Vouchers vs. Choice Scholarship .............................................................................. 15
Vouchers ................................................................................................................ 15
Choice Scholarships .............................................................................................. 16
Survey of Michigan Likely Voters .................................................................................. 19

P a g e | 2
Full School Choice Survey 2016 Overview The Mackinac Center for Public Policy (MC) contracted Marketing Resource Group to conduct a tracking survey in Michigan on issues of school choice, vouchers, tax credits for private school tuition, charter schools and other education related issues. The first survey was conducted in June 2014, and the follow-up study reported here was conducted July 11-15, 2016. Both surveys used live operators to interview 800 likely voters from a listed sample of registered voters with a history of voting in general elections (as well as newly registered voters). The 2014 survey consisted of 20 percent cell-phone only homes while the 2016 survey had 30 percent cell-phone only homes. Both samples were stratified by geography, and met quotas based on gender and cell phone status within each geographic area. In addition, the 2016 sample was weighted by race to more accurately reflect the racial distribution found in the 2008 and 2012 electorate. A sample of 800 likely voters in Michigan yields a sampling margin of error of ±3.5 percent with a 95 percent confidence interval. The margin of error for demographic subgroups may be significantly higher.
Key Findings Public opinion about school choice, charter schools, and vouchers has remained
relatively stable since 2014.
While grades for Michigan public schools are down slightly from 2.45 GPA in 2014 to 2.25 GPA in 2016, grades for “local” public schools are slightly up from 2.7 GPA in 2014 to 2.95 GPA in 2016.
Choice remains popular in Michigan. Sixty-seven percent of all voters disagree students should only be allowed to go to their local public schools.
o Eighty-six percent support intra-district choice, and 62 percent support inter-district choice.
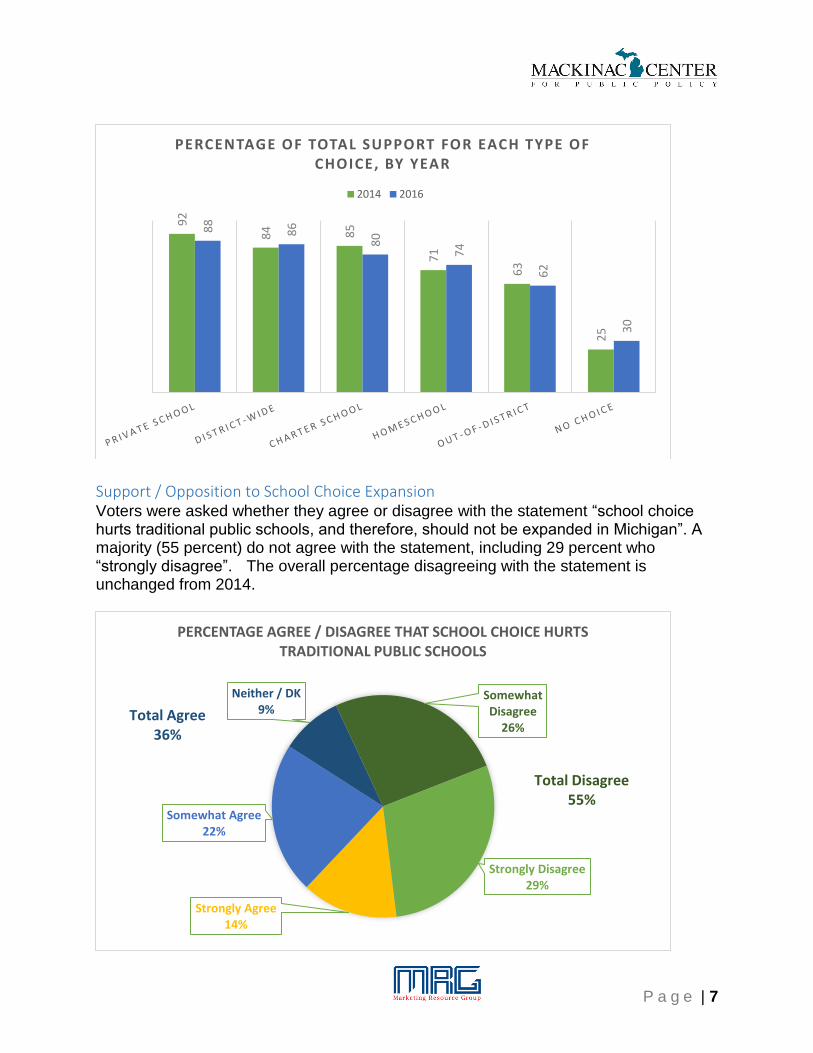
o Eighty percent support students being able to choose a charter school, and 88 percent support students’ freedom to choose private or parochial schools.
o While choice is popular, a majority (59 percent) believe parents in Michigan currently have just about the right amount of choice when deciding where their children should attend school. Only 24 percent think parents have too little choice. These numbers remain unchanged from 2014.
P a g e | 3
o A majority (55 percent) disagree with the statement that school choice hurts public schools, and therefore, should be limited (including 35 percent who strongly disagree).
Charter schools continue to enjoy a majority (55 percent) of support from voters.
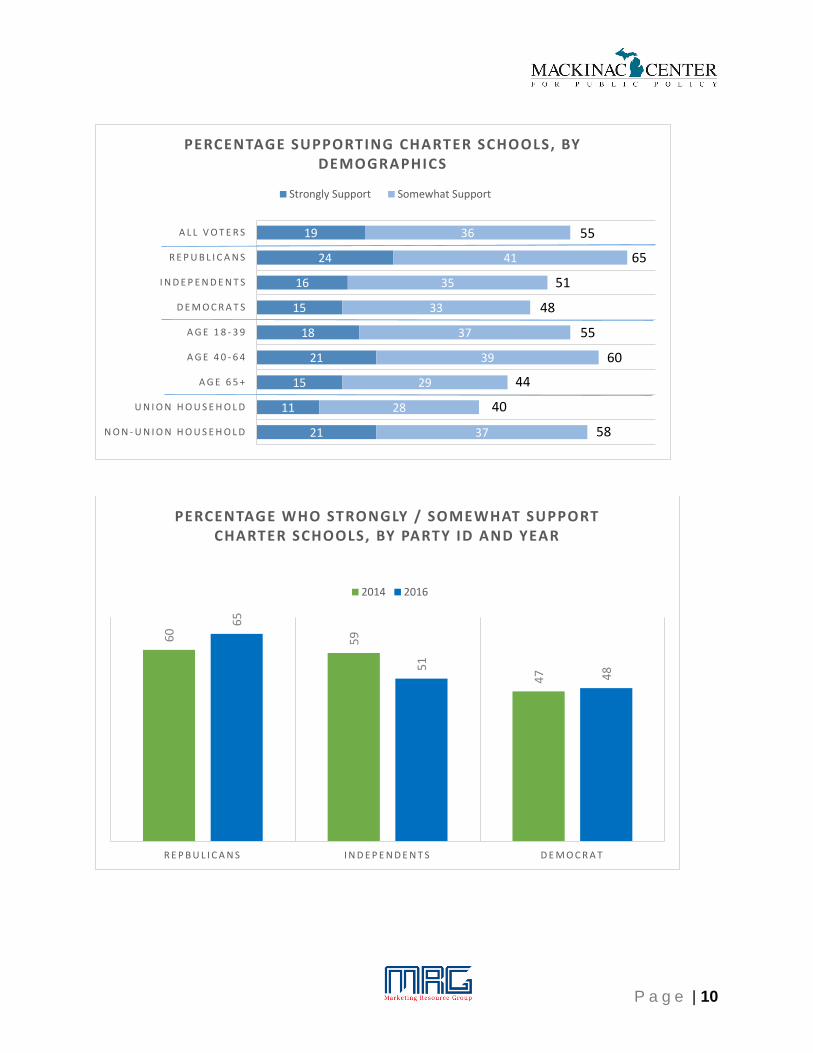
The coalition in favor of charter schools and some process for public funding of students to attend private schools continues to be Republicans (and to some extent, Independents), younger voters (under age 65), and African Americans.
A majority of voters (57 percent) support a tax credit for individuals and companies who donate to non-profits formed to award scholarships to students to attend private schools. Only 29 percent are opposed, and 14 percent either have no opinion or are unsure.
Education savings accounts – government-authorized savings accounts in which money usually allocated to public schools on a per pupil basis may be deposited and used for educational purposes – also enjoy a majority of support (55 percent).
Vouchers (and the indistinguishable except by name “choice scholarships”) do not garner a majority of support with only 47 percent in favor. (As seen in the survey questionnaire, and explained in the data analysis section, a split sample was used to see if renaming vouchers would change public opinion about them as described in the survey – it did not).
More research needs to be done to determine why a majority of voters are in support of education savings accounts, but not in favor of vouchers (or choice scholarships). Most likely, the difference is an artifact of how those systems are described in the survey. Below are some areas to explore:
o The voucher and choice scholarship questions specifically say the money can be used for private schools, including both religious and non-religious schools. The education savings account does not mention religious schools.
o The voucher and choice scholarship questions state the money would be allocated to parents while the education savings account question says the money will be deposited in a government-sanctioned account.
o The voucher and choice scholarship questions explicitly state the money would come from “tax dollars currently allocated to a school district”. The education savings account question did not and the education savings account question did not indicate the money would come from the funds currently due to local public schools.
o Education savings accounts can be used for many different educational purposes including tutoring, on-line and higher education – vouchers and choice scholarships are used for tuition to private schools, in a traditional sense.

P a g e | 4
Data Analysis
Grading the Schools Voters assign Michigan public schools a grade point average (GPA) of 2.23 on a four-point scale for the quality of their work (down from 2.45 GPA in 2014). Six percent grade the schools an “A” and six percent give them an “F” (with a plurality assigning a “C”).
Voters give public schools in their own community higher grades (2.65 GPA) than they do to public schools (2.23 GPA), overall. In 2014, voters assigned a 2.70 GPA to their local public schools. Grades are lowest in the City of Detroit where zero percent give the city’s public schools an “A”; 39 percent give them a “D” or “F’, and a 1.78 GPA. Grades are highest in Oakland County with 29 percent giving the local public schools an “A”, and the GPA is 2.94. Parents of school-aged children are more positive about the quality of their local public schools than people without school-aged children (with GPA’s of 3.79 and 3.64, respectively) Voters give local charter schools a GPA of 2.43. As in 2014, over half (54 percent) of all voters say they do not have enough information to grade local charters schools. Voters in Detroit, however, feel more informed with only 28 percent saying they are unsure of charter schools’ quality. Those who do offer an opinion give local charter schools a 2.33 GPA.
7
38
44
8
3
6
30
35
12
6
A B C D F
PERCENTAGE ASSIGNING EACH LET TER GRADE TO MICHIGAN PUBLIC SCHOOLS, BY YEAR
2014 2016
P a g e | 5
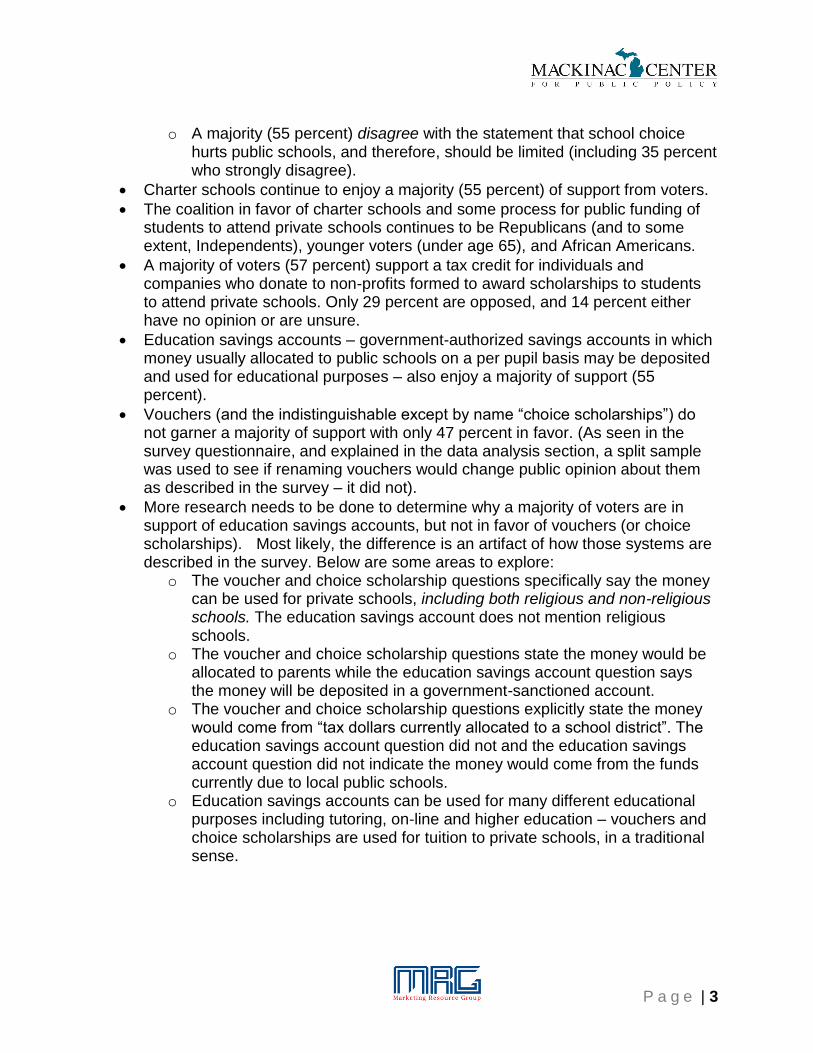
Local private schools receive the highest grades with a GPA of 3.11, and 23 percent of all voters assigning them an “A” (50 percent give them an “A” or a “B”). It should be noted that 38 percent of all voters say they do not have enough information to grade local private schools.
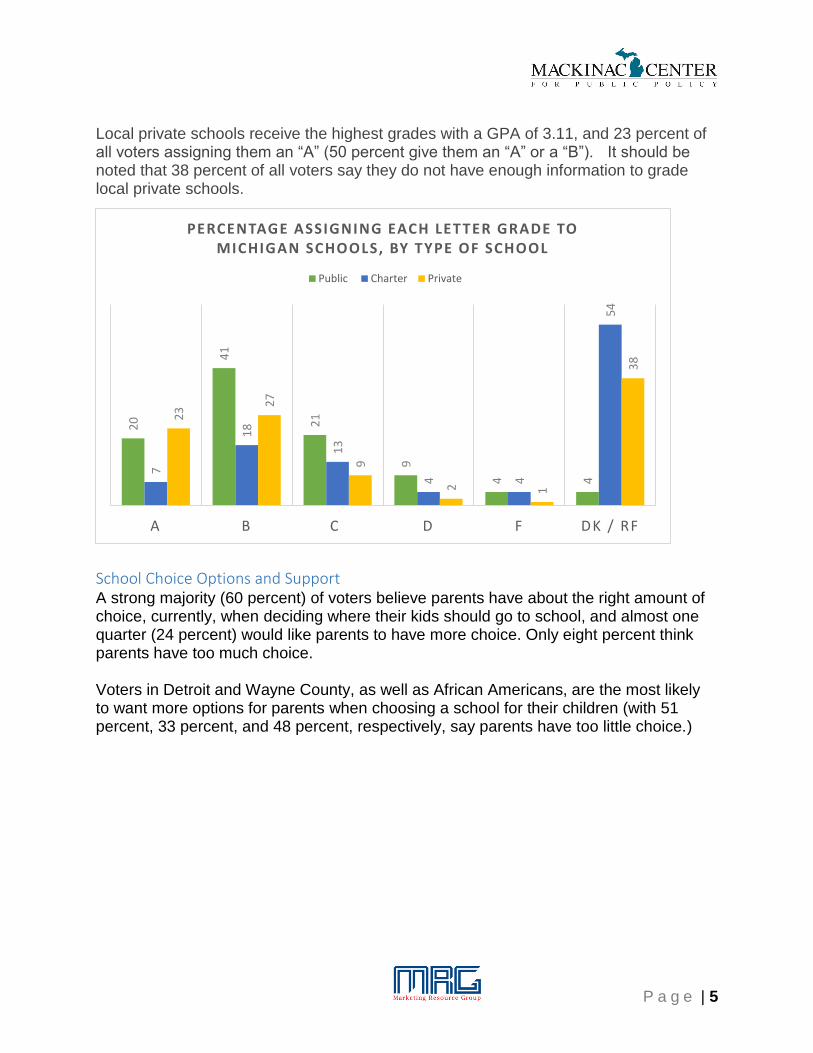
School Choice Options and Support A strong majority (60 percent) of voters believe parents have about the right amount of choice, currently, when deciding where their kids should go to school, and almost one quarter (24 percent) would like parents to have more choice. Only eight percent think parents have too much choice. Voters in Detroit and Wayne County, as well as African Americans, are the most likely to want more options for parents when choosing a school for their children (with 51 percent, 33 percent, and 48 percent, respectively, say parents have too little choice.)
20
41
21
9
4 4
7
18
13
4 4
54
23
27
9
2 1
38
A B C D F DK / RF
PERCENTAGE ASSIGNING EACH LET TER GRADE TO MICHIGAN SCHOOLS, BY TYPE OF SCHOOL
Public Charter Private
P a g e | 6
Too much8%
Just about right60%
Too little24%
DK/RF8%
PERCENTAGE SAYING PARENTS HAVE TOO MUCH, TOO LITTLE, OR JUST THE RIGHT AMOUNT OF CONTROL IN CHOOSING SCHOOLS
49
51
42
43
30
17
39
35
38
31
32
13
3
2
11
4
4
3
4
7
5
3
16
25
4
5
8
7
18
42
P R I V A T E S C H O O L
D I S T R I C T - W I D E
C H A R T E R S C H O O L
H O M E S C H O O L
O U T - O F - D I S T R I C T
N O C H O I C E
SUPPORT FOR CHOICE, BY TYPE OF SCHOOL
Strongly Support Somewhat Support Neither/ DK Somewhat Oppose Strongly Oppose
P a g e | 7
Support / Opposition to School Choice Expansion Voters were asked whether they agree or disagree with the statement “school choice hurts traditional public schools, and therefore, should not be expanded in Michigan”. A majority (55 percent) do not agree with the statement, including 29 percent who “strongly disagree”. The overall percentage disagreeing with the statement is unchanged from 2014.
92
84 85
71
63
25
88
86
80
74
62
30
PERCENTAGE OF TOTAL SUPPORT FOR EACH TYPE OF CHOICE, BY YEAR
2014 2016
Strongly Agree14%
Somewhat Agree22%
Neither / DK9%
Somewhat Disagree
26%
Strongly Disagree29%
PERCENTAGE AGREE / DISAGREE THAT SCHOOL CHOICE HURTS TRADITIONAL PUBLIC SCHOOLS
Total Disagree55%
Total Agree36%

P a g e | 8
Voters over the age of 65 are more likely to agree that school choice hurts public schools (43 percent) than are younger voters; 37 percent of those 40-64 years old agree choice hurts public schools, and 31 percent of those18-39 agree. There is some difference among voters by political party self-identification with 59 percent of Republicans and 52 percent of both Independents and Democrats disagreeing that choice hurts public schools. These numbers are somewhat different than what was found in 2014 when a larger percentage of Republicans (66 percent), and smaller percentage of Democrats (49 percent) felt this way. This may show a trend towards convergence on the issue of school of choice among those with different political ideologies, but it is too early to tell.
Familiarity with and Support for Charter Schools
Familiarity Familiarity with charter schools in Michigan remains unchanged since 2014. Fifteen-percent of voters say they are very familiar with charters schools, 37 percent are somewhat familiar, and 45 percent report being “not that familiar” with them. These numbers were 15, 39, and 46 percent, respectively, in 2014.
Those most likely to report being “very familiar” with charter schools live in Wayne County (21 percent), and more specifically, Detroit (26 percent). In addition, African Americans are more likely than whites to be “very familiar’ with charter schools (28 percent and 12 percent, respectively). And, only 28 percent of African Americans say they are “not that familiar” with charter schools.
Very Familiar15%
Somewhat Familiar37%
Not Very Familiar45%
DK / RF3%
FAMILIARITY WITH CHARTER SCHOOLSPERCENTAGE REPORTING EACH LEVEL OF FAMILIARITY

P a g e | 9
Not surprisingly, parents of school aged children (20 percent) are more likely than those without school aged children (12 percent) to be familiar with charter schools, and 22 percent of union households (compared to 13 percent of non-union households) are familiar with charter schools. Oddly, only 57 percent of parents who say they have or have had a child in a charter school report being “very familiar” with charter schools.
Support for Charters A majority of voters (55 percent) favors charter schools as independently run public schools with more control over their budgets, staff and curriculum. Of those who favor charters schools, 19 percent “strongly favor” and 36 percent “somewhat favor” them. Twenty-six percent are opposed to charter schools (12 percent somewhat and 14 strongly opposed), and 19 percent neither oppose nor support them or are unsure. Overall support for charter schools remains unchanged since 2014. Those most likely to support charter schools are Republicans (both men and women at 65 percent), people younger than 65 years of age, and non-union households (58 percent)
Strongly Favor19%
Somewhat Favor36%
Neither Favor / Oppose
11%
Somewhat Oppose12%
Strongly Oppose14%
DK / RF8%
PERCENTAGE WHO FAVOR / OPPOSE CHARTER SCHOOLS
Total Favor55%
Total Oppose26%
P a g e | 10
19
24
16
15
18
21
15
11
21
36
41
35
33
37
39
29
28
37
A L L V O T E R S
R E P U B L I C A N S
I N D E P E N D E N T S
D E M O C R A T S
A G E 1 8 - 3 9
A G E 4 0 - 6 4
A G E 6 5 +
U N I O N H O U S E H O L D
N O N - U N I O N H O U S E H O L D
PERCENTAGE SUPPORTING CHARTER SCHOOLS, BY DEMOGRAPHICS
Strongly Support Somewhat Support
55
65
51
48
55
60
44
40
58
60
59
47
65
51
48
R E P B U L I C A N S I N D E P E N D E N T S D E M O C R A T
PERCENTAGE WHO STRONGLY / SOMEWHAT SUPPORT CHARTER SCHOOLS, BY PARTY ID AND YEAR
2014 2016
P a g e | 11
School Choice Funding Options
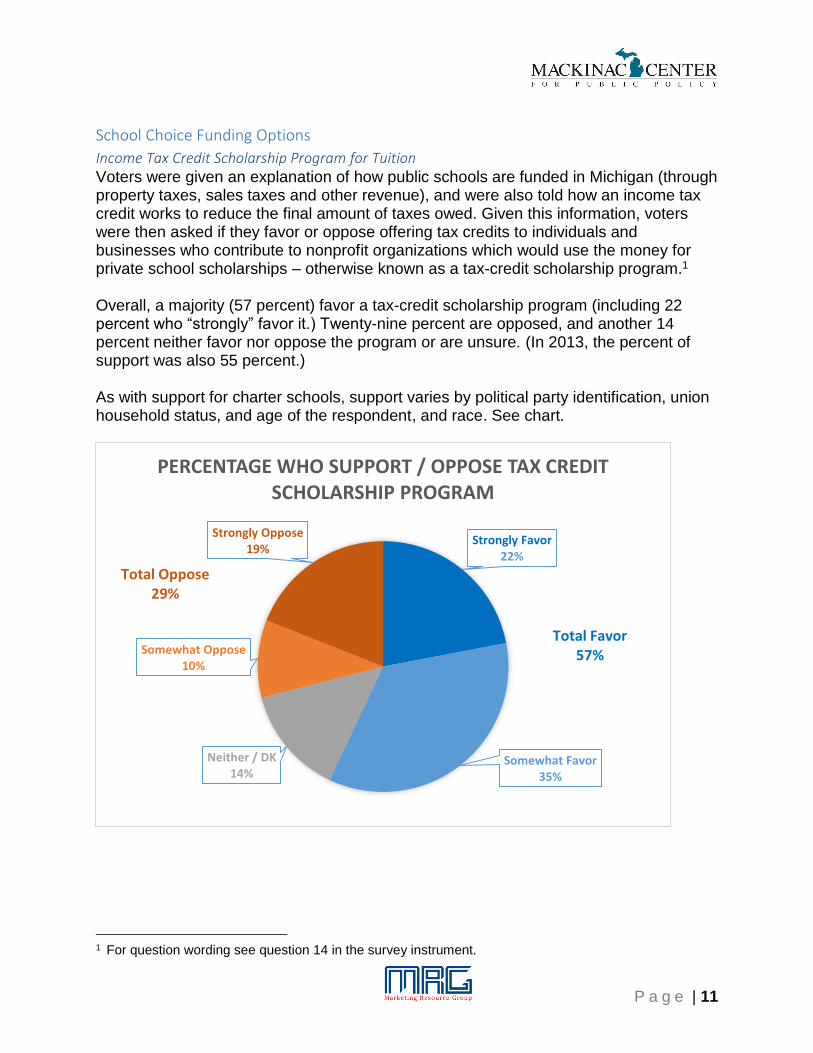
Income Tax Credit Scholarship Program for Tuition Voters were given an explanation of how public schools are funded in Michigan (through property taxes, sales taxes and other revenue), and were also told how an income tax credit works to reduce the final amount of taxes owed. Given this information, voters were then asked if they favor or oppose offering tax credits to individuals and businesses who contribute to nonprofit organizations which would use the money for private school scholarships – otherwise known as a tax-credit scholarship program.1 Overall, a majority (57 percent) favor a tax-credit scholarship program (including 22 percent who “strongly” favor it.) Twenty-nine percent are opposed, and another 14 percent neither favor nor oppose the program or are unsure. (In 2013, the percent of support was also 55 percent.) As with support for charter schools, support varies by political party identification, union household status, and age of the respondent, and race. See chart.
1 For question wording see question 14 in the survey instrument.
Strongly Favor22%
Somewhat Favor35%
Neither / DK14%
Somewhat Oppose10%
Strongly Oppose19%
PERCENTAGE WHO SUPPORT / OPPOSE TAX CREDIT SCHOLARSHIP PROGRAM
Total Favor57%
Total Oppose29%
P a g e | 12
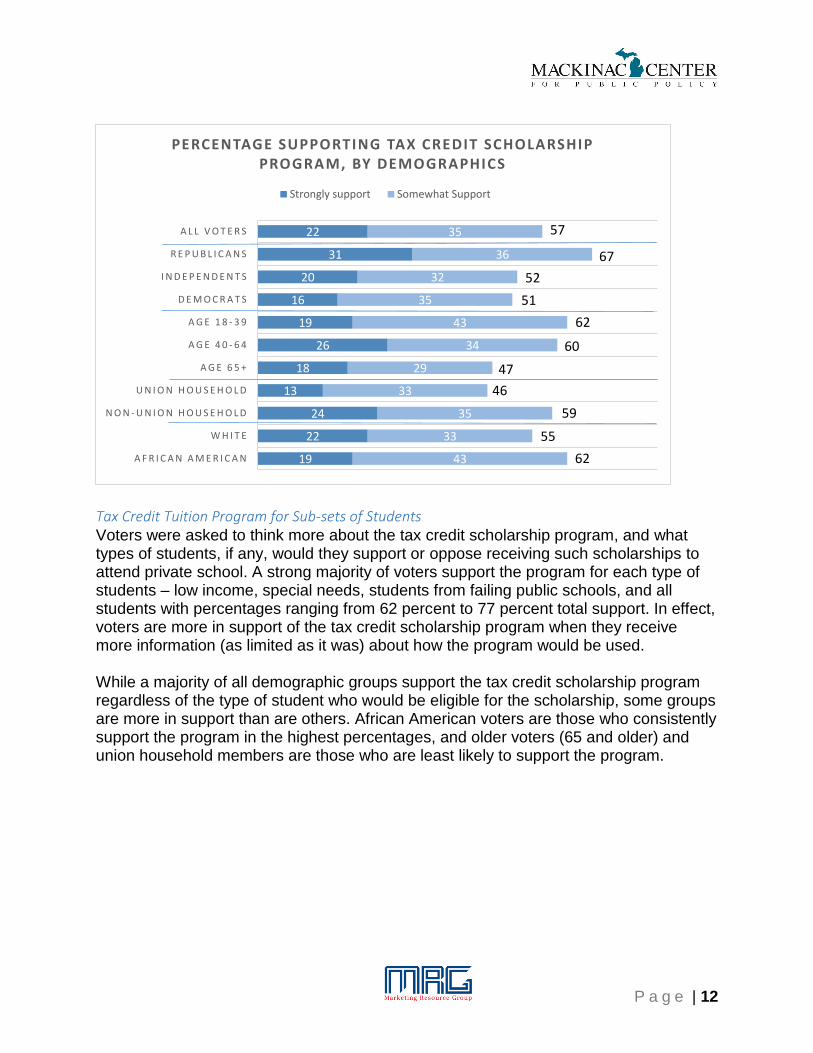
Tax Credit Tuition Program for Sub-sets of Students Voters were asked to think more about the tax credit scholarship program, and what types of students, if any, would they support or oppose receiving such scholarships to attend private school. A strong majority of voters support the program for each type of students – low income, special needs, students from failing public schools, and all students with percentages ranging from 62 percent to 77 percent total support. In effect, voters are more in support of the tax credit scholarship program when they receive more information (as limited as it was) about how the program would be used. While a majority of all demographic groups support the tax credit scholarship program regardless of the type of student who would be eligible for the scholarship, some groups are more in support than are others. African American voters are those who consistently support the program in the highest percentages, and older voters (65 and older) and union household members are those who are least likely to support the program.
22
31
20
16
19
26
18
13
24
22
19
35
36
32
35
43
34
29
33
35
33
43
A L L V O T E R S
R E P U B L I C A N S
I N D E P E N D E N T S
D E M O C R A T S
A G E 1 8 - 3 9
A G E 4 0 - 6 4
A G E 6 5 +
U N I O N H O U S E H O L D
N O N - U N I O N H O U S E H O L D
W H I T E
A F R I C A N A M E R I C A N
PERCENTAGE SUPPORTING TAX CREDIT SCHOLARSHIP PROGRAM, BY DEMOGRAPHICS
Strongly support Somewhat Support
57
67
52
51
62
60
47
46
59
55
62

P a g e | 13
Percent of Total Support for Tax Credit Scholarship Program for Each Type of Student, by Select Demographics
Special Needs Students
Low-income Students All Students
Students of Failing Schools
All 77% 70% 69% 62%
Republican 78% 64% 67% 59%
Independent 78% 70% 66% 62%
Democrat 78% 74% 71% 65%
White 75% 68% 67% 59%
Black 86% 81% 79% 76%
Men 75% 64% 65% 59%
Women 80% 75% 73% 65%
Ages 18-39 85% 78% 74% 68%
Ages 40-64 77% 73% 72% 65%
Ages 65+ 69% 56% 59% 47%
Union Household 68% 66% 56% 55%
Non-union Household 79% 71% 71% 64%
Education Savings Accounts Voters were told that an education savings account would allow parents to remove their child from a public school district and receive payment into a government-authorized savings account to be used for educational purposes, including post-high school education or training.2 A majority (55 percent) of voters support such an education savings account. As with
2 For exact wording, see question 16 of the questionnaire.
43
38
35
30
34
32
34
32
6
7
8
10
7
10
10
11
9
13
12
17
S P E C I A L N E E D S S T U D E N T S
L O W - I N C O M E S T U D E N T S
A L L S T U D E N T S
S T U D E N T S O F F A I L I N G S C H O O L S
PERCENTAGE WHO FAVOR / OPPOSE TAX CREDIT SCHOLARSHIP PROGRAM, BY STUDENT TYPE
Strongly Favor Somewhat Favor Neither / DK Somewhat Oppose Strongly Oppose

P a g e | 14
most questions related to school of choice, and especially funding of school of choice issues, those most in favor of the option are Republicans, African Americans, younger voters, and non-union household members. In 2013, 56 percent supported education savings accounts.
Strongly Favor26%
Somewhat Favor30%
Neither / DK11%
Somewhat Oppose10%
Strongly Oppose23%
PERCENTAGE WHO SUPPORT / OPPOSE EDUCATION SAVINGS ACCOUNT
Total Favor56%
Total Oppose33%
26
26
27
27
32
28
17
23
27
24
35
29
31
27
28
35
30
20
24
30
30
29
A L L V O T E R S
R E P U B L I C A N S
I N D E P E N D E N T S
D E M O C R A T S
A G E 1 8 - 3 9
A G E 4 0 - 6 4
A G E 6 5 +
U N I O N H O U S E H O L D
N O N - U N I O N H O U S E H O L D
W H I T E
A F R I C A N A M E R I C A N
PERCENTAGE SUPPORTING EDUCATION SAVINGS ACCOUNT, BY DEMOGRAPHICS
Strongly Support Somewhat Support
55
57
54
55
67
58
37
47
57
54
64

P a g e | 15
Vouchers vs. Choice Scholarship Voters were asked their opinions about school vouchers versus a choice scholarship in a split sample. This means, the sample was divided into two samples that were closely matched and representative of the larger sample as a whole. The purpose is to evaluate both the sentiment toward vouchers and a choice scholarship program, separately and comparatively.
Vouchers It was explained to respondents that a voucher program is “. . . allows parents the option of sending their child to a school of their choice that is public or private, including both religious and non-religious schools . . .” with parents receiving, in the form of a voucher, the money usually allocated to schools. As in 2014, support for a voucher system does not reach a majority – 46 percent favored it in 2014 compared to 47 percent in 2016. Thirty-nine percent are opposed to vouchers, including 27 percent who are strongly opposed (in contrast to 28 percent who are strongly in favor of them), and 14 percent are unsure or have no opinion. Support for vouchers, as opposed to education savings accounts (as explored in the previous section) drops off among most groups, but especially among Democrats. This suggests that something about the voucher question as posed is highly political – more so than the issue of choice in general, and education savings accounts, specifically. That is, the percentage of Republicans and Independents who support an education savings account is roughly the same as the percentage of those groups who support vouchers, but the percentage of Democrats who support education savings accounts is almost 20 percent higher than the percentage of Democrats who support vouchers.
28
33
33
21
28
34
15
21
30
29
24
18
20
23
15
20
17
20
17
19
18
23
A L L V O T E R S
R E P U B L I C A N S
I N D E P E N D E N T S
D E M O C R A T S
A G E 1 8 - 3 9
A G E 4 0 - 6 4
A G E 6 5 +
U N I O N H O U S E H O L D
N O N - U N I O N H O U S E H O L D
W H I T E
A F R I C A N A M E R I C A N
PERCENTAGE SUPPORTING SCHOOL VOUCHERS, BY DEMOGRAPHICS
Stronlgy support Somewhat Support
46
53
56
36
48
51
35
38
49
47
47

P a g e | 16
Reasons to Support Vouchers Voters who said they support vouchers (46 percent) were asked what they like most about vouchers; those who like vouchers are most likely to mention something about parental control (40 percent). Others (36 percent) mention the improvement in quality of education – either for all students (20 percent) or for those who are disadvantaged (16 percent). Here is a sample of responses:
“It takes control of tax payers' money”
“It just opens more choices for parents”
“It gives students and parents a choice of schools that gives the students a good education”
“Each student needs their own special help”
“The students will have the financial support to pay for a quality education”
Reasons to Oppose Vouchers Voters who said they oppose vouchers (39 percent) were asked why they oppose them. A plurality (41 percent) who oppose them report doing so because vouchers would take money from public schools or harm public schools in some way. Another 20 percent are concerned about misuse of vouchers by parents or the private schools. Below is a sample of responses:
“They need to keep the public school system strong”
“I see that public schools need to keep their students and improve the curriculum”
“The money goes to the parent; it should go to the school”
“It's just taking those dollars away from the public schools”
” Tax dollars are in the hands of parents”
Choice Scholarships Half of the sample was asked a question identical to the voucher question, but the words “choice scholarship system” replaced “school voucher system”.3 A choice scholarship system did not garner any more support than did the school voucher system (with both gathering 47 percent total support). Thirty-nine percent are opposed to “choice scholarships”, including 29 percent who are strongly opposed (in contrast to the 26 percent who are strongly in favor of them). Given this information, further investigation into the messages, words, and concepts contained in these questions should be explored. If voters support choice and support an education savings account, as explained in previously, why does a majority not support vouchers or a choice scholarship (as outlined in this survey)?
3 For full wording of questions, see questions 20A and 20B of the questionnaire.
P a g e | 17
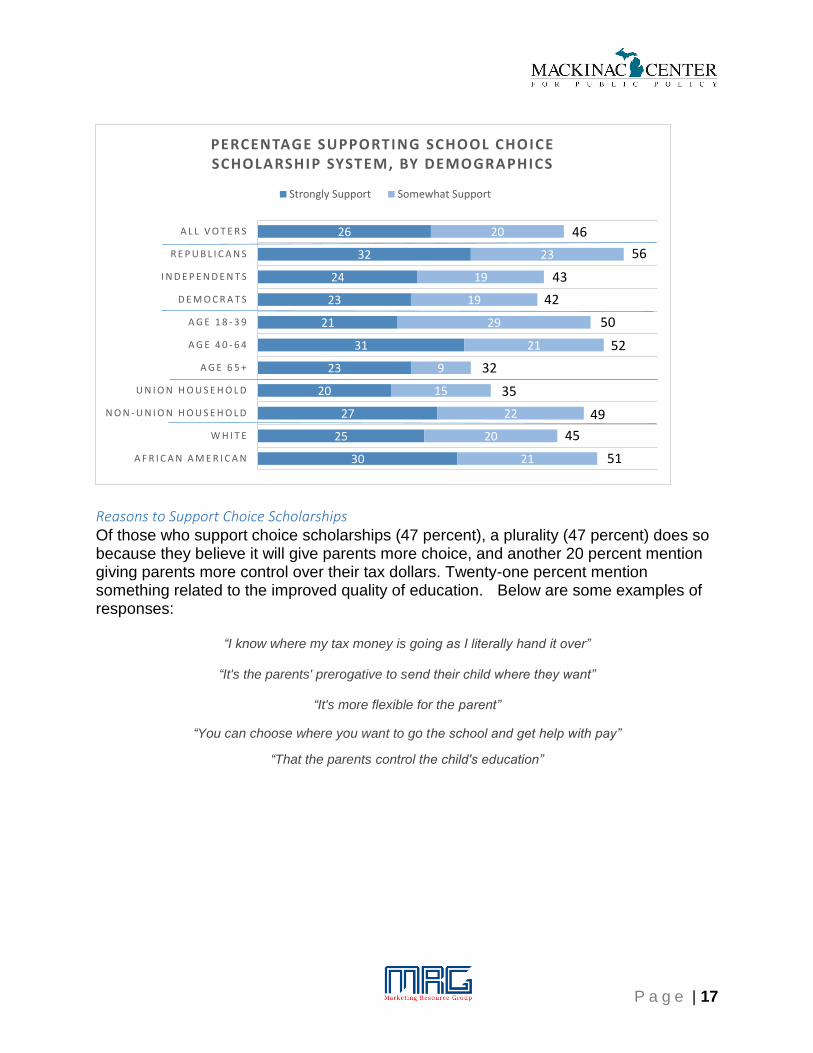
Reasons to Support Choice Scholarships Of those who support choice scholarships (47 percent), a plurality (47 percent) does so because they believe it will give parents more choice, and another 20 percent mention giving parents more control over their tax dollars. Twenty-one percent mention something related to the improved quality of education. Below are some examples of responses:
“I know where my tax money is going as I literally hand it over”
“It's the parents' prerogative to send their child where they want”
“It's more flexible for the parent”
“You can choose where you want to go the school and get help with pay”
“That the parents control the child's education”
26
32
24
23
21
31
23
20
27
25
30
20
23
19
19
29
21
9
15
22
20
21
A L L V O T E R S
R E P U B L I C A N S
I N D E P E N D E N T S
D E M O C R A T S
A G E 1 8 - 3 9
A G E 4 0 - 6 4
A G E 6 5 +
U N I O N H O U S E H O L D
N O N - U N I O N H O U S E H O L D
W H I T E
A F R I C A N A M E R I C A N
PERCENTAGE SUPPORTING SCHOOL CHOICE SCHOLARSHIP SYSTEM, BY DEMOGRAPHICS
Strongly Support Somewhat Support
46
56
43
42
50
52
32
35
49
45
51

P a g e | 18
Reasons to Oppose Choice Scholarships Those who oppose choice scholarships (39 percent) were asked what about the system would concern them most. Forty-two percent oppose the scholarship system because they believe it takes money from, and thus possibly harm, public schools. Another 21 percent are concerned about the money being misused, and 12 percent do not want tax dollars going to private schools. It also is worth noting that a small, but noticeable, percentage of respondents thought “scholarship” meant the system would only be available to students with good grades or high achievement. Below is a sample of responses:
“It's going to hurt inner city schools by taking a lot of money and giving it to parents to send their kids to private schools”
“It's taking money away from public schools and they already don't have any”
“Because families will find a way to get around it and spend the money on everything
but education”
“Funds should stay in schools and not in the hands of the parents”
“Politics in how they're awarded”

P a g e | 19
Mackinac Center for Public Policy 2016
Survey of Michigan Likely Voters 800 Sample Sampling Margin of Error ±3.46
30 Percent Cell Phone July 11-15, 2016
1. ADI Saginaw/Flint/Bay City ................................................. 12% GR/Kzoo/West ............................................................. 22% Cad/TC/Soo ................................................................... 6% Mid MI/Lansing .............................................................. 8% Metro Detroit ................................................................ 50% Misc/UP ......................................................................... 2%
2. GEOCODE City of Detroit ................................................................. 5% Balance of Wayne ....................................................... 13% Oakland ....................................................................... 14% Macomb ........................................................................ 8% Balance of Detroit SMSA ............................................. 10% Mid-MI ......................................................................... 11% West MI ....................................................................... 20% TriCities/thumb ............................................................ 10% Northern Lower MI ......................................................... 7% UP ................................................................................. 3%
3. Are you registered to vote in [City or Township List] __________________? Yes ............................................................................ 100% No .................................................................................. -
P a g e | 20
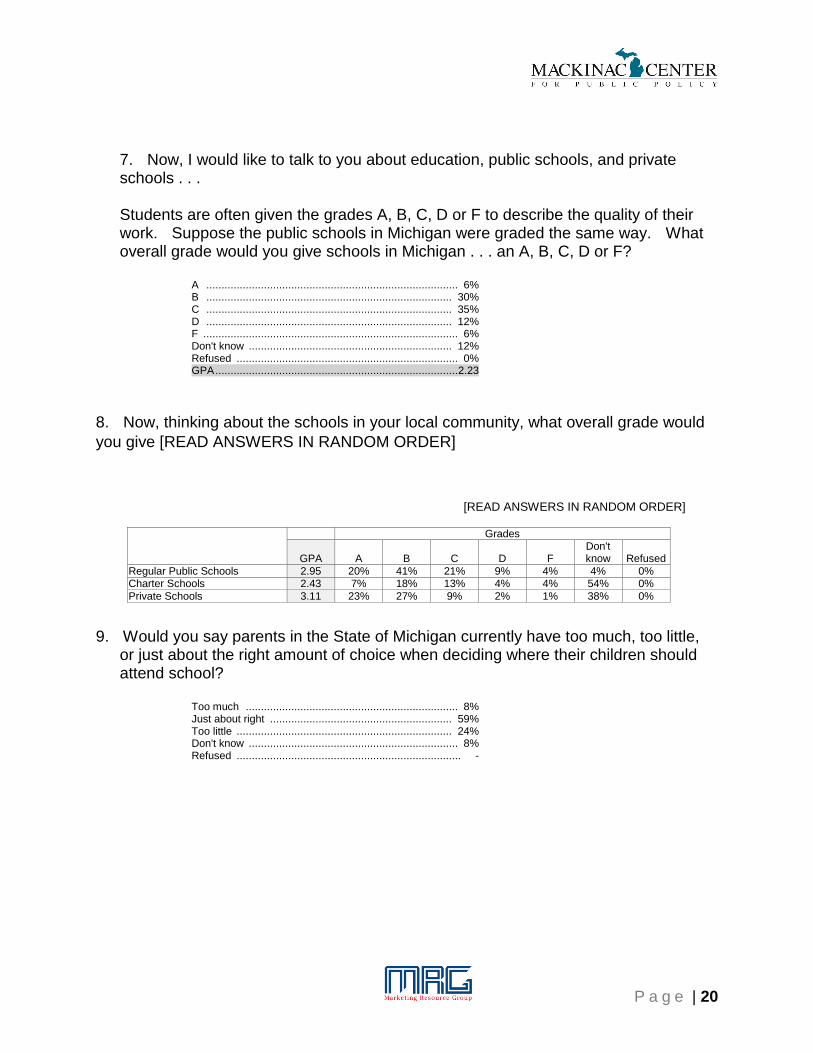
7. Now, I would like to talk to you about education, public schools, and private schools . . .
Students are often given the grades A, B, C, D or F to describe the quality of their work. Suppose the public schools in Michigan were graded the same way. What overall grade would you give schools in Michigan . . . an A, B, C, D or F?
A ................................................................................... 6% B ................................................................................. 30% C ................................................................................. 35% D ................................................................................. 12% F .................................................................................... 6% Don't know ................................................................... 12% Refused ......................................................................... 0% GPA ................................................................................ 2.23
8. Now, thinking about the schools in your local community, what overall grade would
you give [READ ANSWERS IN RANDOM ORDER]
[READ ANSWERS IN RANDOM ORDER]
Grades
GPA A B C D F Don't know Refused
Regular Public Schools 2.95 20% 41% 21% 9% 4% 4% 0% Charter Schools 2.43 7% 18% 13% 4% 4% 54% 0%
Private Schools 3.11 23% 27% 9% 2% 1% 38% 0%
9. Would you say parents in the State of Michigan currently have too much, too little, or just about the right amount of choice when deciding where their children should attend school?
Too much ...................................................................... 8% Just about right ............................................................ 59% Too little ....................................................................... 24% Don't know ..................................................................... 8% Refused .......................................................................... -

P a g e | 21
10. I am going to read a set of statements about different school options for students. For each, please tell me if you agree or disagree with the statement. The first is . . . [IF AGREE / DISAGREE, ASK:] Would that be strongly (agree/disagree) or just somewhat (agree/disagree)?
Strongly Agree
Somewhat Agree
Neither Agree/
Disagree Somewhat Disagree
Strongly Disagree Don't Know Refused
Students should only be able to attend their own neighborhood schools
17% 13% 1% 25% 42% 2% -
Students should be able to choose any traditional public school in their district
51% 35% 1% 7% 5% 1% -
Students should be able to choose a traditional public school in a different district
30% 32% 3% 16% 18% 2% -
Students should be able to choose a charter school
42% 38% 3% 5% 8% 4% -
Students should be able to choose a private or parochial school
49% 39% 2% 4% 4% 1% -
Students should be able to be homeschooled by their parents 43% 31% 3% 7% 14% 1% 0%
RANKED BY TOTAL AGREE
Total Agree Total
Disagree
Neither Agree/
Disagree Somewhat Disagree
Strongly Disagree Total Agree
Total Disagree
Students should be able to choose a private or parochial school 49% 39% 2% 4% 4% 88% 8%
Students should be able to choose any traditional public school in their district
51% 35% 1% 7% 5% 86% 12%
Students should be able to choose a charter school 42% 38% 3% 5% 8% 80% 13%
Students should be able to be homeschooled by their parents
43% 31% 3% 7% 14% 74% 21%
Students should be able to choose a traditional public school in a different district
30% 32% 3% 16% 18% 62% 34%
Students should only be able to attend their own neighborhood schools 17% 13% 1% 25% 42% 30% 67%
P a g e | 22
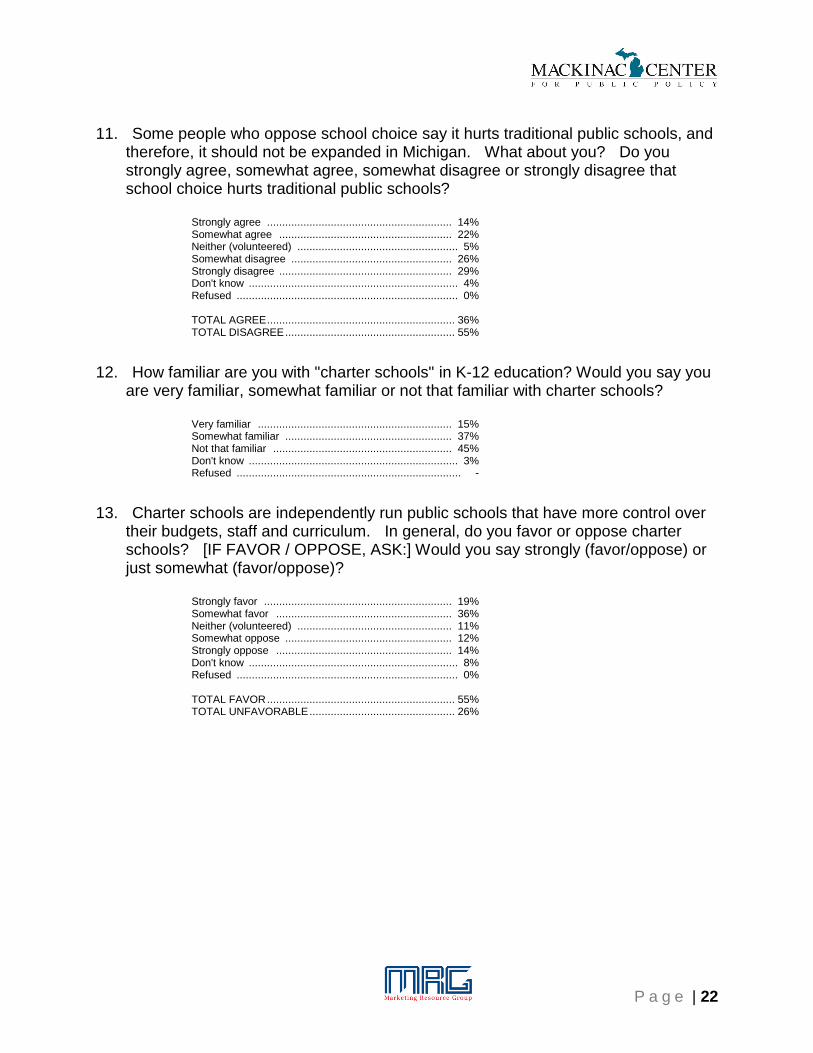
11. Some people who oppose school choice say it hurts traditional public schools, and therefore, it should not be expanded in Michigan. What about you? Do you strongly agree, somewhat agree, somewhat disagree or strongly disagree that school choice hurts traditional public schools?
Strongly agree ............................................................. 14% Somewhat agree ......................................................... 22% Neither (volunteered) ..................................................... 5% Somewhat disagree ..................................................... 26% Strongly disagree ......................................................... 29% Don't know ..................................................................... 4% Refused ......................................................................... 0% TOTAL AGREE .............................................................. 36% TOTAL DISAGREE ........................................................ 55%
12. How familiar are you with "charter schools" in K-12 education? Would you say you are very familiar, somewhat familiar or not that familiar with charter schools?
Very familiar ................................................................ 15% Somewhat familiar ....................................................... 37% Not that familiar ........................................................... 45% Don't know ..................................................................... 3% Refused .......................................................................... -
13. Charter schools are independently run public schools that have more control over their budgets, staff and curriculum. In general, do you favor or oppose charter schools? [IF FAVOR / OPPOSE, ASK:] Would you say strongly (favor/oppose) or just somewhat (favor/oppose)?
Strongly favor .............................................................. 19% Somewhat favor .......................................................... 36% Neither (volunteered) ................................................... 11% Somewhat oppose ....................................................... 12% Strongly oppose .......................................................... 14% Don't know ..................................................................... 8% Refused ......................................................................... 0% TOTAL FAVOR .............................................................. 55% TOTAL UNFAVORABLE ................................................ 26%

P a g e | 23
14. Public schools in Michigan are funded through a combination of property taxes, the sales tax, and other revenue. Parents who choose to send their children to a private school pay these taxes like everyone else, but also pay tuition for the private school.
And, as you may know, an income tax credit reduces the final amount of taxes owed to the government. Some state governments give tax credits to individuals and businesses if they contribute money to nonprofit organizations that use the donations to award private school scholarships to students. This policy is what's called a "tax-credit scholarship system." In general, do you favor or oppose a tax-credit scholarship system? [IF FAVOR / OPPOSE, ASK:] Would you say you strongly (favor/oppose) or just somewhat (favor/oppose)?
Strongly favor .............................................................. 22% Somewhat favor .......................................................... 35% Neither/No opinion (volunteered) ................................... 6% Somewhat oppose ....................................................... 10% Strongly oppose .......................................................... 19% Don't know ..................................................................... 8% Refused .......................................................................... - TOTAL FAVOR .............................................................. 57% TOTAL OPPOSE ........................................................... 29%
15. Thinking more about the "tax-credit scholarship system", would you favor or oppose the system if it awarded scholarships for . . .
[READ ANSWERS IN RANDOM ORDER, EXCEPT THE LAST 1]
TOTAL FAVOR
TOTAL OPPOSE
Strongly favor
Somewhat favor
Neither Somewhat
oppose Strongly oppose
Don't know Refused
Low-income students to attend private school
70% 23% 38% 32% 4% 10% 13% 3% -
Special-needs students to attend private school
77% 16% 43% 34% 4% 7% 9% 2% -
Students from failing traditional public schools to attend private school
62% 28% 30% 32% 5% 11% 17% 5% 0%
All students, regardless of income or special needs
69% 22% 35% 34% 4% 10% 12% 4% 0%
P a g e | 24
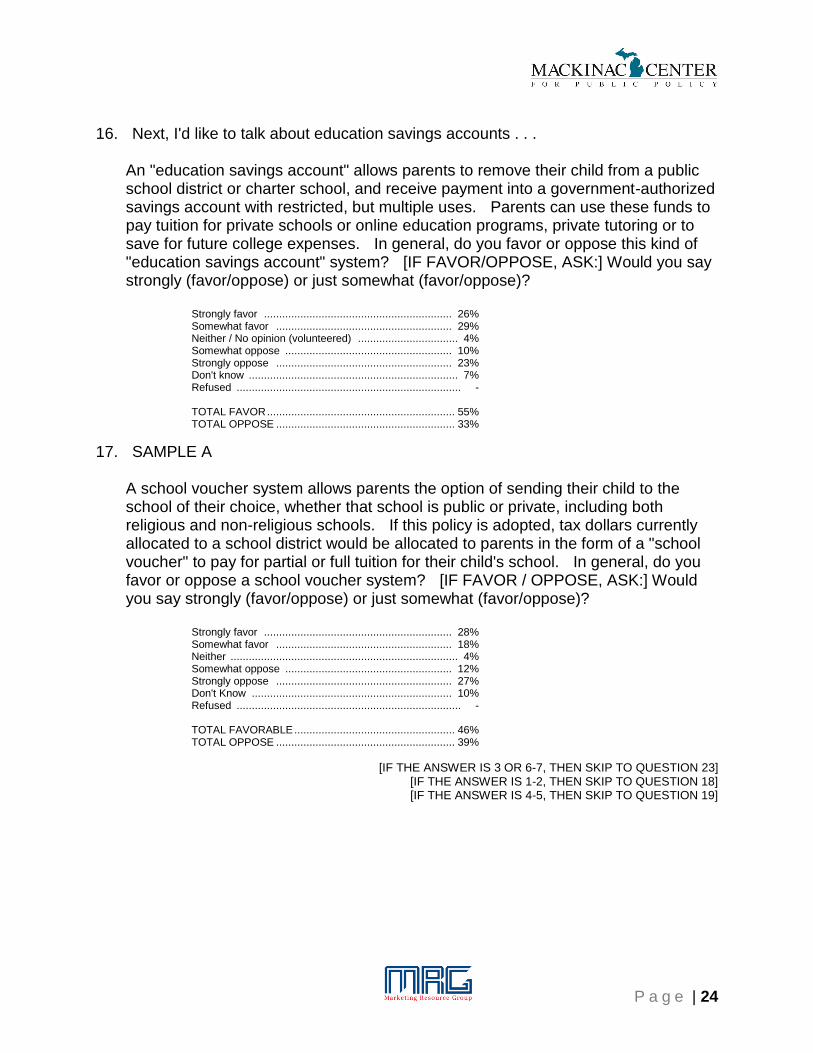
16. Next, I'd like to talk about education savings accounts . . . An "education savings account" allows parents to remove their child from a public school district or charter school, and receive payment into a government-authorized savings account with restricted, but multiple uses. Parents can use these funds to pay tuition for private schools or online education programs, private tutoring or to save for future college expenses. In general, do you favor or oppose this kind of "education savings account" system? [IF FAVOR/OPPOSE, ASK:] Would you say strongly (favor/oppose) or just somewhat (favor/oppose)?
Strongly favor .............................................................. 26% Somewhat favor .......................................................... 29% Neither / No opinion (volunteered) ................................. 4% Somewhat oppose ....................................................... 10% Strongly oppose .......................................................... 23% Don't know ..................................................................... 7% Refused .......................................................................... - TOTAL FAVOR .............................................................. 55% TOTAL OPPOSE ........................................................... 33%
17. SAMPLE A
A school voucher system allows parents the option of sending their child to the school of their choice, whether that school is public or private, including both religious and non-religious schools. If this policy is adopted, tax dollars currently allocated to a school district would be allocated to parents in the form of a "school voucher" to pay for partial or full tuition for their child's school. In general, do you favor or oppose a school voucher system? [IF FAVOR / OPPOSE, ASK:] Would you say strongly (favor/oppose) or just somewhat (favor/oppose)?
Strongly favor .............................................................. 28% Somewhat favor .......................................................... 18% Neither ........................................................................... 4% Somewhat oppose ....................................................... 12% Strongly oppose .......................................................... 27% Don't Know .................................................................. 10% Refused .......................................................................... - TOTAL FAVORABLE ..................................................... 46% TOTAL OPPOSE ........................................................... 39%
[IF THE ANSWER IS 3 OR 6-7, THEN SKIP TO QUESTION 23] [IF THE ANSWER IS 1-2, THEN SKIP TO QUESTION 18] [IF THE ANSWER IS 4-5, THEN SKIP TO QUESTION 19]

P a g e | 25
18. What do you like most about a school voucher system? N=186 [PROBE] Parents and students have more control / choice ................................ 40% Helps low income students / equality in education .............................. 16% Better education for all ........................................................................ 16% Use of tax dollars / control over taxes / offset costs of private school .. 16% Competition to improve public schools .................................................. 4% Religious Schools / Catholic Schools as a choice ................................. 1% Don't know ............................................................................................ 8%
[IF ANSWERED, THEN SKIP TO QUESTION 23]
19. What concerns you most about a school voucher system? [PROBE IF GIVEN ONE WORD ANSWER:] What do you mean by that? N=157
Hurts public schools / takes money from public schools ... 41% Money misused / parents shouldn’t control money ........... 20% Tax dollars to private / parochial schools ......................... 11% Don't understand the system ............................................. 6% People who don't need money would get it ........................ 5% Unfair to taxpayers / others ................................................. 5% Students / parents shouldn't have choice ........................... 3% Wouldn't work / wouldn’t improve anything .......................... 2% Loss of religious freedom ................................................... 1% Don't know ......................................................................... 6%
20. SAMPLE B
A choice scholarship system allows parents the option of sending their child to the school of their choice, whether that school is public or private, including both religious and non-religious schools. If this policy is adopted, tax dollars currently allocated to a school district would be allocated to parents in the form of a "choice scholarship" to pay for partial or full tuition for their child's school. In general, do you favor or oppose a choice scholarship system? [IF FAVOR / OPPOSE, ASK:] Would you say strongly (favor/oppose) or just somewhat (favor/oppose)?
Strongly favor .............................................................. 26% Somewhat favor .......................................................... 20% Neither ........................................................................... 4% Somewhat oppose ....................................................... 11% Strongly oppose .......................................................... 29% Don't Know .................................................................. 10% Refused .......................................................................... - TOTAL FAVOR .............................................................. 46% TOTAL OPPOSE ........................................................... 40%
[IF THE ANSWER IS 3 OR 6-7, THEN SKIP TO QUESTION 23] [IF THE ANSWER IS 1-2, THEN SKIP TO QUESTION 21] [IF THE ANSWER IS 4-5, THEN SKIP TO QUESTION 22]

P a g e | 26
21. What do you like most about a choice scholarship system? N=185 [PROBE] Parents and students have more control / choice ................................ 47% Use of tax dollars / control over taxes / offset costs of private school .. 20% Helps low income students / equality in education .............................. 10% Better education for all .......................................................................... 9% Religious Schools / Catholic Schools as a choice ................................. 5% Competition to improve public schools .................................................. 2% Don't know ............................................................................................ 8%
[IF ANSWERED, THEN SKIP TO QUESTION 23]
22. What concerns you most about a choice scholarship system? [PROBE IF GIVEN ONE WORD ANSWER:] What do you mean by that? N=158
Hurt public schools / takes money from public schools .... 42% Money misused / parents shouldn’t control money ............ 21% Tax dollars to private / parochial schools ......................... 12% Unfair to taxpayers .............................................................. 6% Students / parents shouldn't have choice ........................... 5% People who don't need money would get it ........................ 1% Wouldn't work / not everyone could use it............................ 3% Don't understand the system ............................................. 4% Loss of religious freedom ................................................... 1% Don't know ......................................................................... 6%
23. Finally, I have a few questions for statistical purposes. First, may I ask how old you were on your last birthday?
18-24 ............................................................................. 5% 25-29 ............................................................................. 5% 30-34 ............................................................................. 7% 35-39 ........................................................................... 11% 40-44 ............................................................................. 7% 45-49 ........................................................................... 12% 50-54 ............................................................................. 8% 55-59 ............................................................................. 9% 60-64 ........................................................................... 12% 65-69 ............................................................................. 8% 70+ .............................................................................. 15% Refused ......................................................................... 1%
24. What is your main racial or ethnic group?
Caucasian/White ......................................................... 75% African American/Black ................................................ 13% Hispanic ........................................................................ 2% Asian ............................................................................. 1% Multiracial/Biracial .......................................................... 2% Other ............................................................................. 1% Refused ......................................................................... 4%
P a g e | 27
25. Are you the parent or guardian of any school-aged children, pre-school through high school?
Yes .............................................................................. 32% No ............................................................................... 68% Refused ......................................................................... 0%
26. Do you currently, or have you ever, had a child enrolled in a private or charter
school? [IF YES, ASK:] Which?
Yes, Charter .................................................................. 6% Yes, Private ................................................................. 17% Yes, Both ....................................................................... 2% No ............................................................................... 74% Refused ......................................................................... 0%
27. Are you or is anyone in your household a member of a labor or teacher's union? [IF YES, ASK:] Is that your or someone else?
Yes, respondent .......................................................... 10% Yes, someone else ........................................................ 5% No ............................................................................... 82% Both ............................................................................... 2% Don't know ...................................................................... - Refused ......................................................................... 1%
28. Generally speaking, do you think of yourself as [ROTATE:] (a Republican), (a Democrat), an Independent or what? [IF ANSWER INDEPENDENT, NO PREFERENCE, OTHER, REFUSED, OR DK, ASK:] Do you think of yourself closer to the Republican Party or the Democratic Party? [PROBE ONCE:] Well if you had to choose?
Republican .................................................................. 25% Democrat ..................................................................... 33% Closer to Republican ..................................................... 8% Independent ................................................................ 22% Closer to Democrat ........................................................ 5% Refused ......................................................................... 6% Expresses no interest or knowledge of politics ............... 1% TOTAL REPUBLICAN .................................................... 33% TOTAL DEMOCRAT ...................................................... 38%

P a g e | 28
29. Gender (OBSERVATION)
Male ............................................................................ 48% Female ........................................................................ 52%
30. Cell phone?
Yes .............................................................................. 30% No ............................................................................... 70%