Fuel Moisture Monitoring and Fire Danger Indices
20
2012 Fuel Moisture Monitoring and Fire Danger Indices Eric Miller Contributors: Jennifer Barnes, Lisa Saperstein, Peter Butteri, Jon Grafft, Michael Goyette, Jennifer Northway, and others
Transcript of Fuel Moisture Monitoring and Fire Danger Indices

2012 Fuel Moisture Monitoring and Fire Danger Indices
Eric Miller Contributors: Jennifer Barnes, Lisa Saperstein, Peter
Butteri, Jon Grafft, Michael Goyette, Jennifer Northway, and others

The Problem • Fire management community in Alaska has used
the CFFDRS since 1992. • The AWFCG has recognized the need for
evaluation and has continued to rate it high on the list of fire research needs.
• Weak basis for calibrating DMC or DC value. • Related knowledge gaps.
– Default or over-winter the start-up DC value? – Given that Alaska’s fire season begins shortly after
snow-melt, poorly started indices may not reflect actual moisture conditions until the season is well underway or over.

The Problem • Fire Danger Rating = f(Weather)
– Indices build daily-- Equilibration requires 12 (DMC) or 53 (DC) days
– Fire season shortly follows snow-melt shortly follows station start-up
– Default or over-winter? – Mid-season interruptions to weather stream – Mid-season deployment of portable RAWS
• Fire Danger Rating = f(Fuel Moisture) – Best set indices to accurately represent conditions
on the landscape

Live Moss = FFMC
Dead Moss = DMC*
Upper Duff = DC*
(Lower Duff)
Soil Layers and Indices

CFFDRS seems to work fairly well

Calibrate RAWS stations with field measurements
Campbell Tract 2004
DC started at default 15 DC “accelerated” to 200

Calibrate RAWS stations with field measurements
2012 FBK RAWS DMC adjusted from 6 to 20 DC adjusted from 15 to 100
28 April 2012 9 October 2012
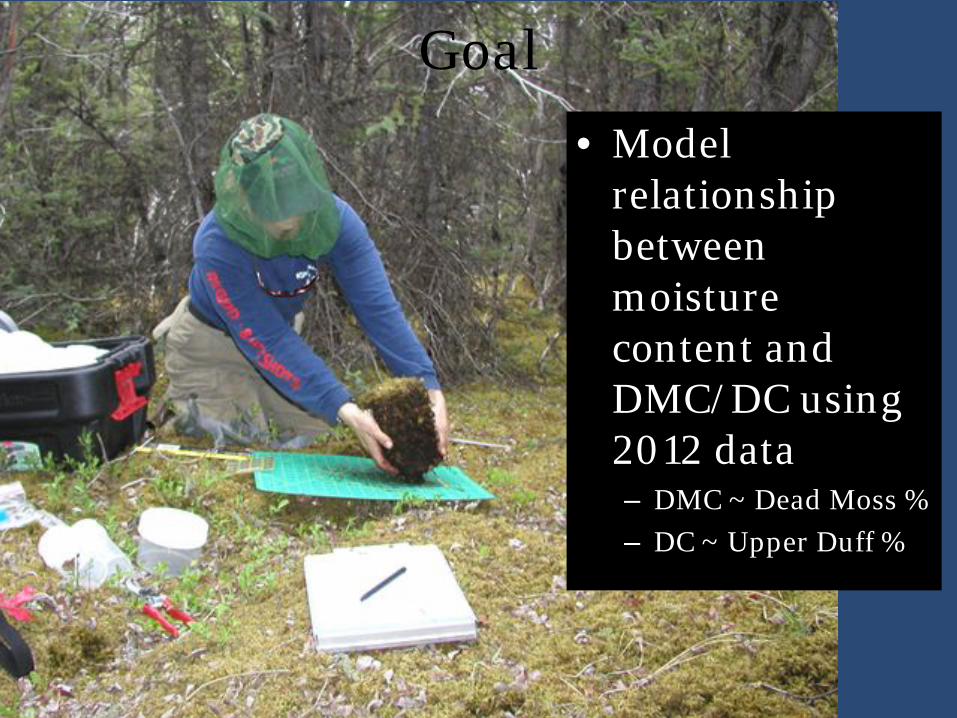
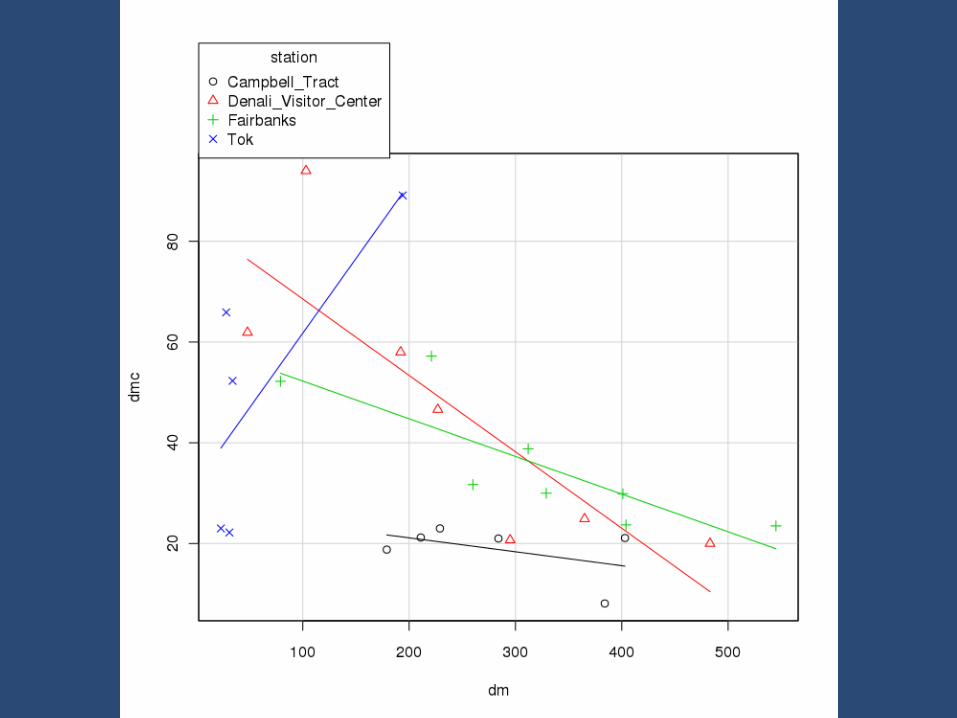
Goal • Model
relationship between moisture content and DMC/DC using 2012 data – DMC ~ Dead Moss % – DC ~ Upper Duff %

Tok Duff Plug

Kenai Duff Plug

DMC DC
Dead Moss
-0.66* -0.06
Upper Duff
-0.44 -0.70*
Correlation Coefficients


Equation Fit

Equation Fit


2012 Regression Equations
• Caution! Modelling with regression analysis: – Reverse the analysis, not the coefficients – Y= f(X) will have different coefficients from X=f(Y)
a b 493.2 57.51 DM=a/exp(DMC/b) 383.6 467.4 UD=a/exp(DC/b) 80.85 301.1 DMC=a/exp(DM/b) 755.4 205.8 DC=a/exp(UD/b)
DM= Dead Moss, UD= Upper Duff, DMC=Duff Moisture Code, DC=Drought Code

Next
• Continue sampling in 2013 – Capture a (possibly) drier year – Tease out regional differences
• Data loggers – Far more efficient and better data – $20k
References • Allen, J. and R. Jandt. 2001. Fuel and duff moisture monitoring in 2001. Unpublished report to the BLM Alaska Fire Service. 19 pp. • Jandt, R., J. Allen, and E. Horschel. 2005. Forest floor moisture content and fire danger indices in Alaska. Bureau of Land Management Alaska Technical Report 54. 30 pp. • Lawson, B.D. and G.N. Dalrymple. 1996. Ground-truthing the Drought Code: Field verification of overwinter recharge of forest floor moisture. FRDA Report 268. Canada/British Columbia partnership agreement on forest resource development. FRDA II. 21 pp. • Lawson, B.D., Dalrymple, G.N., and Hawkes, B.C. 1997a. Predicting forest floor moisture contents from Duff moisture code values. Can. For. Serv. Pac. For. Cent. Tech. Transfer Note 6. • Wilmore, Brenda. 2001. Duff moisture dynamics in black spruce feather moss stands and their relation to the Canadian Forest Fire Danger Rating System. Master of Science. University of Alaska-Fairbanks. 105 pp.