FTSE RAFI Index Series - researchaffiliates.com RAFI Index Series.pdfFTSE RAFI indices’ actual...
16
ARI POLYCHRONOPOULOS, CFA WHITE PAPER | September 2013 The FTSE RAFI® Index Series
Transcript of FTSE RAFI Index Series - researchaffiliates.com RAFI Index Series.pdfFTSE RAFI indices’ actual...
ARI POLYCHRONOPOULOS, CFA
WHITE PAPER | September 2013
The FTSE RAFI® Index Series


WHITE PAPER | September 2013 1
About the Author
ARI POLYCHRONOPOULOS, CFAVice President, Affiliate Relations
Ari Polychronopoulos is a relationship manager/product specialist. In this role, Ari leads the Affiliate Service Team providing partner service and support and coordinating marketing and research efforts related to Fundamental Index strategies.
Previously, Ari worked as a senior analyst for IndyMac Bank responsible for portfolio hedging and risk management. He also has served as a corporate retirement plan consultant for Precept, an employee benefits firm.
Ari earned a MS in financial engineering from Claremont Graduate University and a BS in mathemat-ical economics from Pitzer College. Ari is a member of CFA Institute and the CFA Society of Orange County.

WHITE PAPER | September 20132
INTRODUCTION
The FTSE RAFI Index Series (the “Series”) overcomes a major flaw in traditional passive investing. In conventional market-capitalization-weighted indices, the weights of individual securities are linked to their market prices. As the price of a security increases, so does the weight. Consequently, investors have greater exposure to overvalued securities and less exposure to more attractive securities. This flaw can result in a drag on performance, particularly during extreme market events like the crash of the tech bubble or the Global Financial Crisis.
The Series breaks the link between security prices and index weights. Based on the Fundamental In-dex® methodology developed by Research Affiliates (“RA”), the FTSE RAFI indices use non-price measures of company size to select and weight index holdings. By means of a transparent, rules-based rebalancing process, the Fundamental Index approach methodically reduces weights in stocks that have gone up in price and increases weights in stocks which have fallen in price. Thus the Funda-mental Index methodology systematically trades against market price movements.
In partnership with FTSE, RA launched the Series in 2005. That same year, the Financial Analysts Journal published a seminal article by Arnott, Hsu, and Moore (2005). The authors demonstrated that using fundamental measures of company size to select and weight index constituents can add value of approximately 2–4% in developed markets when compared to traditional market-cap-weighted indices.
In the first part of this paper we will explore the rationale behind a fundamentally weighted index ap-proach. We will then examine the index construction methodology for the Series, discuss index char-acteristics, and review performance.
INDEX PHILOSOPHY
The premise of the Fundamental Index methodology is that markets aren’t completely efficient. Rather, they are prone to excesses on both the upside and the downside. Over time, however, mar-kets “revert to the mean”—they correct themselves. Because the Fundamental Index methodology uses economic measures of company size to select and weight index constituents, it does not auto-matically add to positions in rising stocks or reduce positions in declining stocks. That’s what cap-weighted indices do. On the contrary, the Fundamental Index approach increases holdings in stocks whose prices have dropped and reduces exposure to securities whose prices have appreciated since the last rebalancing. In this way it methodically puts into effect the basic principle of investing: buy low and sell high.
The potential effect of rebalancing against price movements or “contra-trading” can be seen in the FTSE RAFI indices’ actual performance versus the corresponding cap-weighted indices during the Global Financial Crisis— the latest in a long list of irrational market periods characterized by inves-tor overreaction (the dot-com bubble, the Japanese asset pricing bubble, the roaring twenties, tulip mania, etc.). Table 1 displays the weight of two financial stocks, Bank of America (BofA) and Bar-clays, in their respective cap-weighted and fundamentally weighted indices.
3
The FTSE RAFI® Index Series
WHITE PAPER | September 2013
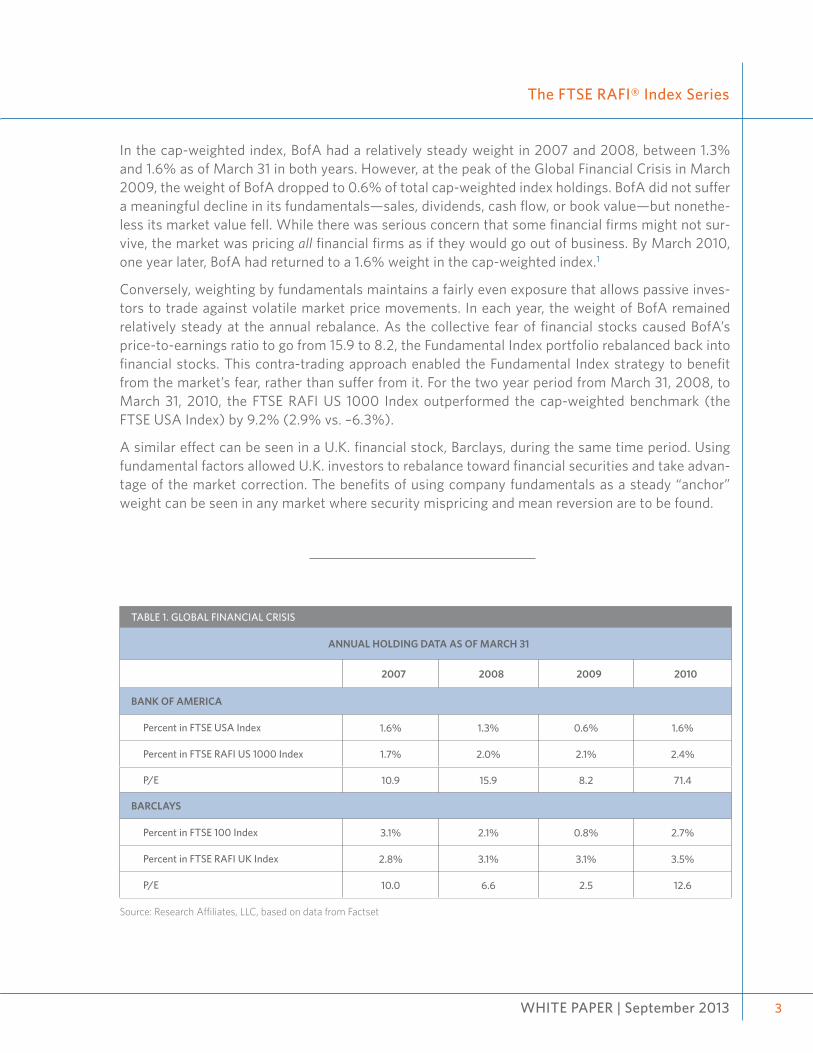
In the cap-weighted index, BofA had a relatively steady weight in 2007 and 2008, between 1.3% and 1.6% as of March 31 in both years. However, at the peak of the Global Financial Crisis in March 2009, the weight of BofA dropped to 0.6% of total cap-weighted index holdings. BofA did not suffer a meaningful decline in its fundamentals—sales, dividends, cash flow, or book value—but nonethe-less its market value fell. While there was serious concern that some financial firms might not sur-vive, the market was pricing all financial firms as if they would go out of business. By March 2010, one year later, BofA had returned to a 1.6% weight in the cap-weighted index.1
Conversely, weighting by fundamentals maintains a fairly even exposure that allows passive inves-tors to trade against volatile market price movements. In each year, the weight of BofA remained relatively steady at the annual rebalance. As the collective fear of financial stocks caused BofA’s price-to-earnings ratio to go from 15.9 to 8.2, the Fundamental Index portfolio rebalanced back into financial stocks. This contra-trading approach enabled the Fundamental Index strategy to benefit from the market’s fear, rather than suffer from it. For the two year period from March 31, 2008, to March 31, 2010, the FTSE RAFI US 1000 Index outperformed the cap-weighted benchmark (the FTSE USA Index) by 9.2% (2.9% vs. –6.3%).
A similar effect can be seen in a U.K. financial stock, Barclays, during the same time period. Using fundamental factors allowed U.K. investors to rebalance toward financial securities and take advan-tage of the market correction. The benefits of using company fundamentals as a steady “anchor” weight can be seen in any market where security mispricing and mean reversion are to be found.
TABLE 1. GLOBAL FINANCIAL CRISIS
ANNUAL HOLDING DATA AS OF MARCH 31
2007 2008 2009 2010
BANK OF AMERICA
Percent in FTSE USA Index 1.6% 1.3% 0.6% 1.6%
Percent in FTSE RAFI US 1000 Index 1.7% 2.0% 2.1% 2.4%
P/E 10.9 15.9 8.2 71.4
BARCLAYS
Percent in FTSE 100 Index 3.1% 2.1% 0.8% 2.7%
Percent in FTSE RAFI UK Index 2.8% 3.1% 3.1% 3.5%
P/E 10.0 6.6 2.5 12.6
Source: Research Affiliates, LLC, based on data from Factset
WHITE PAPER | September 20134
INDEX METHODOLOGY
FUNDAMENTAL FACTORS
The Series is built from FTSE’s security universe, the FTSE Global Equity Index Series (GEIS). In se-lecting and weighting index constituents, the indices utilize an equally weighted average of four fun-damental factors: sales, cash flow, dividends, and book value. If a security does not pay dividends, that factor is dropped and an equally weighted average of the remaining three factors is used.
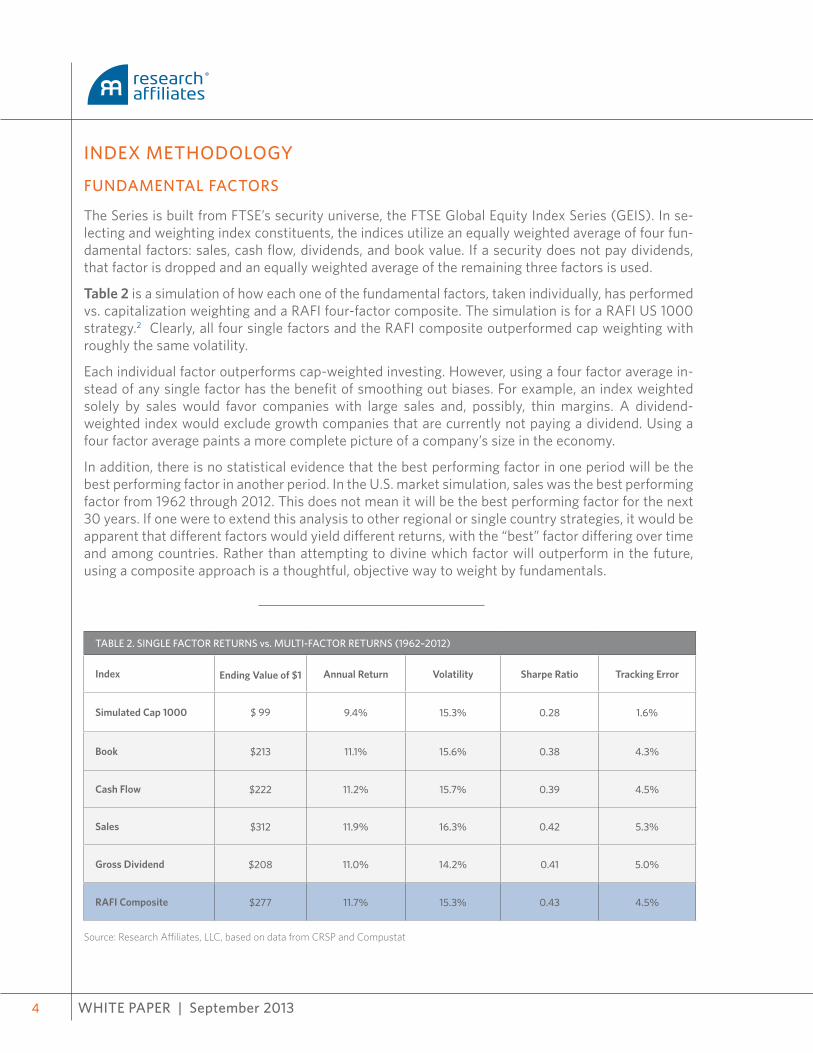
Table 2 is a simulation of how each one of the fundamental factors, taken individually, has performed vs. capitalization weighting and a RAFI four-factor composite. The simulation is for a RAFI US 1000 strategy.2 Clearly, all four single factors and the RAFI composite outperformed cap weighting with roughly the same volatility.
Each individual factor outperforms cap-weighted investing. However, using a four factor average in-stead of any single factor has the benefit of smoothing out biases. For example, an index weighted solely by sales would favor companies with large sales and, possibly, thin margins. A dividend-weighted index would exclude growth companies that are currently not paying a dividend. Using a four factor average paints a more complete picture of a company’s size in the economy.
In addition, there is no statistical evidence that the best performing factor in one period will be the best performing factor in another period. In the U.S. market simulation, sales was the best performing factor from 1962 through 2012. This does not mean it will be the best performing factor for the next 30 years. If one were to extend this analysis to other regional or single country strategies, it would be apparent that different factors would yield different returns, with the “best” factor differing over time and among countries. Rather than attempting to divine which factor will outperform in the future, using a composite approach is a thoughtful, objective way to weight by fundamentals.
TABLE 2. SINGLE FACTOR RETURNS vs. MULTI-FACTOR RETURNS (1962–2012)
Index Ending Value of $1 Annual Return Volatility Sharpe Ratio Tracking Error
Simulated Cap 1000 $ 99 9.4% 15.3% 0.28 1.6%
Book $213 11.1% 15.6% 0.38 4.3%
Cash Flow $222 11.2% 15.7% 0.39 4.5%
Sales $312 11.9% 16.3% 0.42 5.3%
Gross Dividend $208 11.0% 14.2% 0.41 5.0%
RAFI Composite $277 11.7% 15.3% 0.43 4.5%
Source: Research Affiliates, LLC, based on data from CRSP and Compustat

WHITE PAPER | September 2013
The FTSE RAFI® Index Series
5
FIVE–YEAR AVERAGING When constructing the Series, three of the fundamental factors—sales, dividends, and cash flow—are averaged over the previous five years. These variables are more volatile and susceptible to chang-es in the business cycle; measuring them over an interval of time tends to steady their values. For the fourth variable, book value, the most recently reported value is used. Book value is a stock variable, measured at a specific point in time.
Using a five year average is also beneficial with regard to overall performance and turnover. Using most recent financials or averaging over shorter periods of time can result in less stable fundamental weights that can have a higher correlation with price movements. Intuitively, this makes sense, as companies that report strong sales in a recent quarter or year are likely to see an increase in their stock prices and vice versa.
Table 3 outlines the change in performance by averaging fundamental factors over one-, two-, three-, four-, and five-year periods. While all of the averaging periods noticeably outperform cap weight, the five-year average outperforms the one-year average by 28 bps on an annualized basis. Even more compelling is the reduction in turnover by using a five-year average. By moving from a one-year aver-age to a five-year average of fundamental factors, turnover is reduced by 1.5%. Similar to using a composite of four factors, using a five-year average of fundamentals facilitates implementation and improves performance by reducing turnover and trading costs.
TABLE 3. AVERAGING OVER MULTIPLE YEARS
SIMULATED RAFI US 1000 (1962–2012)
5–Year 4–Year 3–Year 2–Year 1–Year Cap 1000
Annual Return 11.66% 11.53% 11.49% 11.45% 11.38% 9.59%
Annual Volatility 15.34% 15.44% 15.44% 15.46% 15.42% 15.24%
Value Add 2.07% 1.94% 1.90% 1.85% 1.79% –
Tracking Error 4.54% 4.44% 4.38% 4.34% 4.28% –
Information Ratio 0.46 0.44 0.43 0.43 0.42 –
Turnover 11.24% 11.47% 11.63% 11.91% 12.70% –
Source: Research Affiliates, LLC, based on data from CRSP and Compustat

WHITE PAPER | September 20136
ANNUAL REBALANCING The Series is rebalanced on an annual basis. Rebalancing more than once a year does not boost per-formance and significantly increases turnover. Table 4 presents a simulation of a RAFI US Large strat-egy using four different rebalancing periods: monthly, quarterly, semi-annually, and annually. With annual rebalancing, the RAFI US 1000 simulation posted an annualized return of 11.7% from 1962 through 2012. Rebalancing more frequently slightly detracts from performance. Short-term momen-tum affects index performance (Carhart, 1997). Stocks that have recently done well tend to continue doing well and stocks that have recently done poorly are likely to decline further. Rebalancing more frequently than annually curtails potential gains from the momentum effect.
The most important benefit of an annual rebalancing schedule is the turnover reduction. In Table 4, the annual one-way turnover for an annually rebalanced Fundamental Index strategy is 11.0%. Rebal-ancing more frequently only serves to raise turnover and, therefore, trading costs, as demonstrated by the step-up in turnover with each increase in rebalancing frequency.
FTSE RAFI INDEX SERIES CHARACTERISTICSTable 5 outlines the index characteristics of various FTSE RAFI indices compared to their cap-weight-ed benchmarks. Essentially, the Fundamental Index methodology and the cap-weighted index are two ways to achieve the same market exposure. The Fundamental Index methodology is a core equity holding with a similar beta, low tracking error, and high correlation to the cap-weighted index.
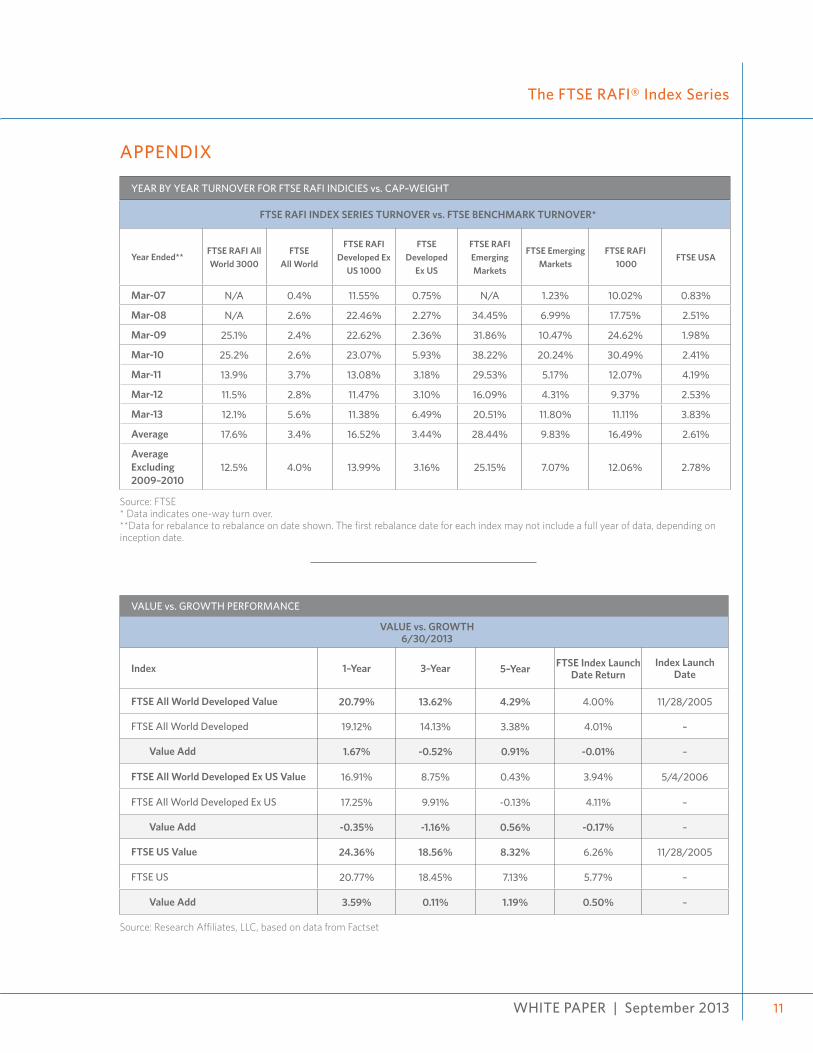
Since inception, the annual one-way turnover for the listed indices ranges between 16.5% and 28.5%. This average turnover for the five years ended March 31, 2013, is higher than the rates found in the above simulations. However, the average is somewhat skewed by the unusually high turnover in the years around the Global Financial Crisis. Excluding 2009 and 2010, turnover for the Series is in line with our original research. (Please see the Appendix for year by year turnover numbers.)
TABLE 4. ANNUAL REBALANCING
SIMULATED RAFI US 1000
Rebalancing Frequency Ann. Return Ann. Volitility Sharpe Ratios Turnover
Monthly 11.5% 15.6% 0.41 35.5%
Quarterly 11.4% 15.4% 0.41 21.0%
Semiannually 11.4% 15.4% 0.41 15.3%
Annually 11.7% 15.3% 0.43 11.2%
Source: Research Affiliates, LLC, based on data from CRSP and Compustat
WHITE PAPER | September 2013
The FTSE RAFI® Index Series
7
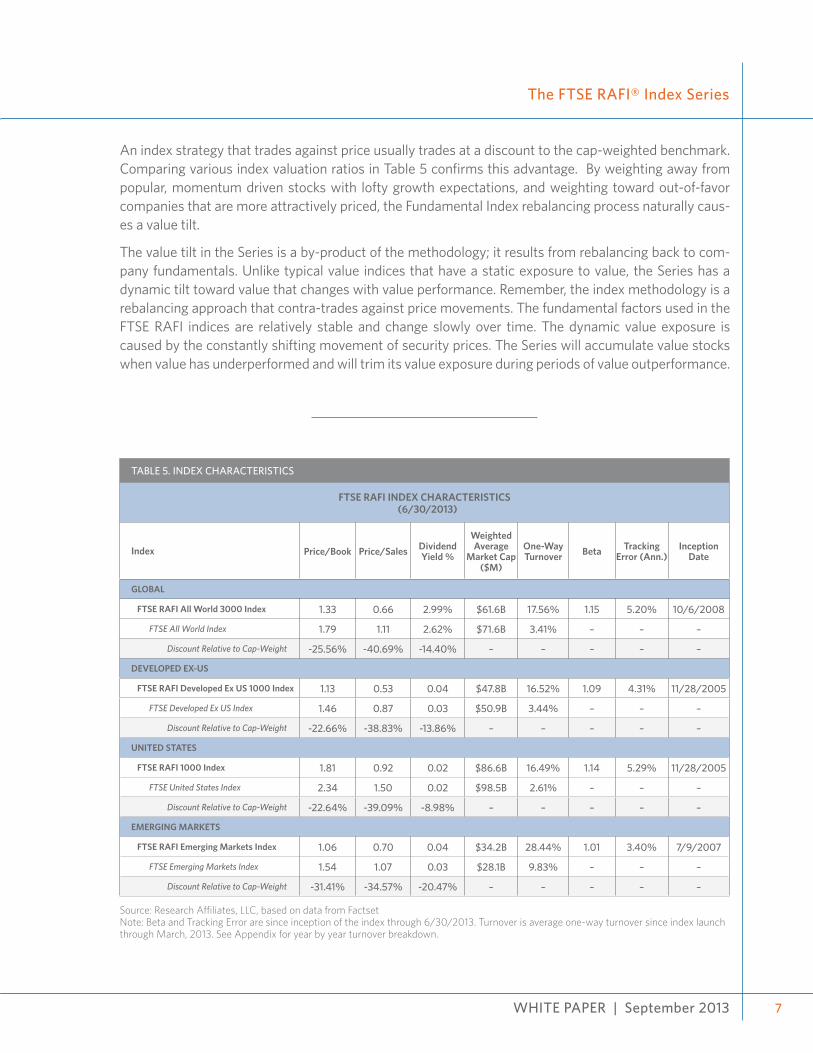
An index strategy that trades against price usually trades at a discount to the cap-weighted benchmark. Comparing various index valuation ratios in Table 5 confirms this advantage. By weighting away from popular, momentum driven stocks with lofty growth expectations, and weighting toward out-of-favor companies that are more attractively priced, the Fundamental Index rebalancing process naturally caus-es a value tilt.
The value tilt in the Series is a by-product of the methodology; it results from rebalancing back to com-pany fundamentals. Unlike typical value indices that have a static exposure to value, the Series has a dynamic tilt toward value that changes with value performance. Remember, the index methodology is a rebalancing approach that contra-trades against price movements. The fundamental factors used in the FTSE RAFI indices are relatively stable and change slowly over time. The dynamic value exposure is caused by the constantly shifting movement of security prices. The Series will accumulate value stocks when value has underperformed and will trim its value exposure during periods of value outperformance.
TABLE 5. INDEX CHARACTERISTICS
FTSE RAFI INDEX CHARACTERISTICS(6/30/2013)
Index Price/Book Price/Sales Dividend Yield %
Weighted Average
Market Cap ($M)
One-Way Turnover Beta Tracking
Error (Ann.)Inception
Date
GLOBAL
FTSE RAFI All World 3000 Index 1.33 0.66 2.99% $61.6B 17.56% 1.15 5.20% 10/6/2008
FTSE All World Index 1.79 1.11 2.62% $71.6B 3.41% – – –
Discount Relative to Cap-Weight -25.56% -40.69% -14.40% – – – – –
DEVELOPED EX-US
FTSE RAFI Developed Ex US 1000 Index 1.13 0.53 0.04 $47.8B 16.52% 1.09 4.31% 11/28/2005
FTSE Developed Ex US Index 1.46 0.87 0.03 $50.9B 3.44% – – –
Discount Relative to Cap-Weight -22.66% -38.83% -13.86% – – – – –
UNITED STATES
FTSE RAFI 1000 Index 1.81 0.92 0.02 $86.6B 16.49% 1.14 5.29% 11/28/2005
FTSE United States Index 2.34 1.50 0.02 $98.5B 2.61% – – –
Discount Relative to Cap-Weight -22.64% -39.09% -8.98% – – – – –
EMERGING MARKETS
FTSE RAFI Emerging Markets Index 1.06 0.70 0.04 $34.2B 28.44% 1.01 3.40% 7/9/2007
FTSE Emerging Markets Index 1.54 1.07 0.03 $28.1B 9.83% – – –
Discount Relative to Cap-Weight -31.41% -34.57% -20.47% – – – – –
Source: Research Affiliates, LLC, based on data from FactsetNote: Beta and Tracking Error are since inception of the index through 6/30/2013. Turnover is average one-way turnover since index launch through March, 2013. See Appendix for year by year turnover breakdown.

WHITE PAPER | September 20138
The dynamic nature of the Fundamental Index value tilt can be seen in Figure 1. In March 2008, the FTSE RAFI US 1000 Index rebalanced into value following a 12-month period where the FTSE World USA Value Index underperformed against the FTSE USA Index by 2.6%. This value tilt can be observed in the grow-ing discount of the FTSE RAFI US 1000 price-to-book ratio (P/B) relative to P/B of the FTSE USA Index. The discount moved from approximately 14% to 25%. The next 12 months proved to be another tough year for value as the FTSE World USA Value Index underperformed the FTSE USA by an additional 1.4%. This resulted in an even deeper dive into value during the 2009 rebalance, when the P/B discount rose to 49%. The FTSE RAFI US 1000 was well positioned for the brief rally in value stocks early in 2009 and outperformed the FTSE USA by 29.6% for the 12 months following the 2009 rebalance. One year later, in March 2010, the P/B discount was automatically reduced from approximately 31% to 20% after a strong year for value. In contrast, the FTSE World USA Value Index maintains a relatively static bias toward value over time, regardless of market conditions.
FIGURE 1. P/B DISCOUNT OF FTSE RAFI US 1000 vs. FTSE WORLD USA VALUE INDEX
FUNDAMENTAL INDEX vs. TRADITIONAL VALUE INDEX(3/1/2006–6/30/2013)
Source: Research Affiliates, LLC, based on data from Factset
-60.00%
-50.00%
-40.00%
-30.00%
-20.00%
-10.00%
0.00%
Fundamental Index P/B Discount Value Index P/B Discount

WHITE PAPER | September 2013
The FTSE RAFI® Index Series
9
INDEX PERFORMANCE
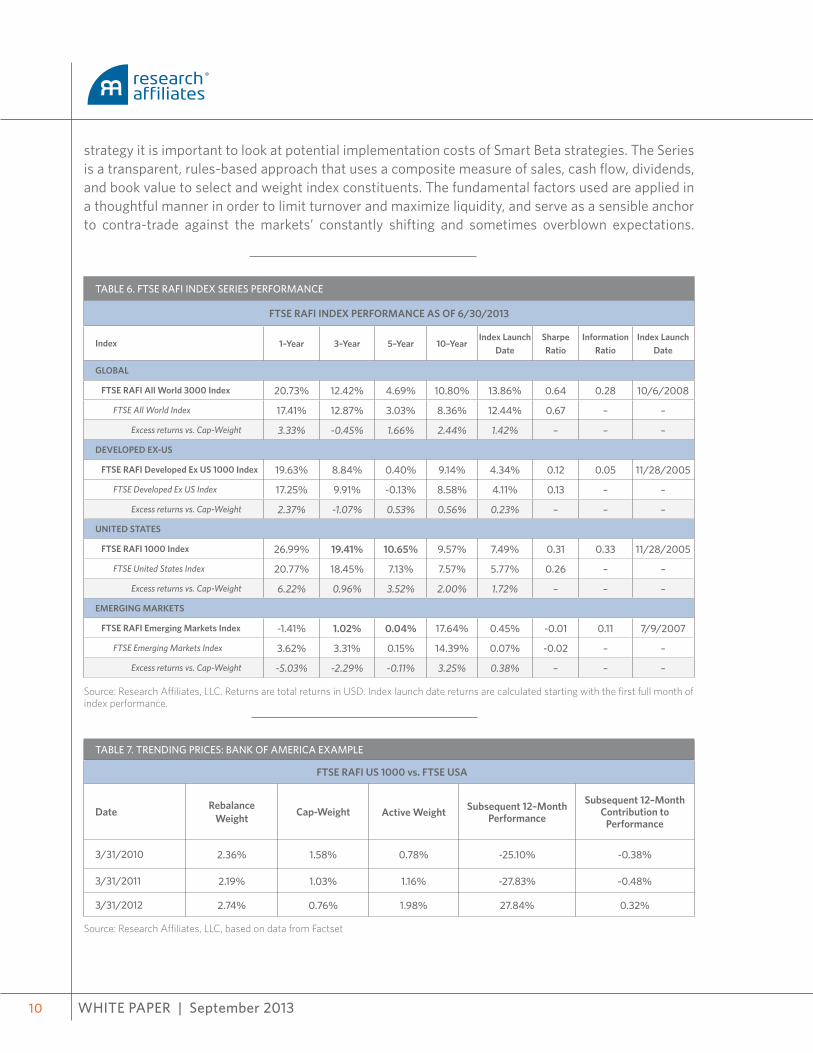
Turning to investment results, Table 6 outlines performance for various FTSE RAFI indices from in-ception through March 31, 2013. Since the launch of the Series, the majority of the indices have out-performed their benchmarks. The FTSE All World 3000, FTSE RAFI U.S. 1000, and FTSE RAFI Emerg-ing Markets indices all outperformed their cap-weighted benchmarks by between 88 bps and 169 bps, annualized, since launch. The FTSE RAFI Developed ex-US 1000 Index, however, has underper-formed since inception by 10 bps annually. Because this is less than the 2–4% outlined in the original research paper, it is important to examine the drivers of return and judge when the Fundamental In-dex may reasonably be expected to outperform and underperform.
As previously mentioned, an offshoot of the Fundamental Index strategy is a value tilt. The last sev-eral years have been a harsh environment for value strategies, as value has largely underperformed globally. Although recent value performance has started to turn, the FTSE Developed Value index has underperformed the market by 52 bps over the last three years and the FTSE Developed ex-US Value Index has underperformed the market by 116 bps over the last three years. Given such a headwind for value strategies, the fact that the Series has added value relative to the benchmarks is encouraging. (Please see the Appendix for the performance record of the value style since the FTSE RAFI indices were launched in 2005.)
A second performance driver for the Fundamental Index methodology is trending prices. Because the index methodology is largely a rebalancing strategy, the Fundamental Index relies on mean reversion in security prices. A market void of mean reversion would be a difficult environment for the index methodology to add value. An example of how trending prices detract from index performance can be seen by examining BofA in the FTSE RAFI US 1000 over the last three years (Table 7). For the two year period ending March 31, 2012, BofA posted a return of –46.0%, calculated by chain-linking re-turns of –25.1%% for the first 12 months and –27.8% for the next 12 months. The starting weight of BofA on March 31, 2010, was 2.36% vs. 1.58% for the cap-weighted index. Twelve months later, the weight of BofA in the cap-weighted index drifted down to 1.0%, while the FTSE RAFI US 1000 rebal-anced BofA back up to its fundamental weight of 2.2%. BofA continued to underperform in 2011, and the performance for the Fundamental Index strategy suffered much more than the cap-weighted in-dex, which did not rebalance at all.
By March 31, 2012, the weight of BofA had drifted down to 76 bps for the cap-weighted index, while the FTSE RAFI 1000 again rebalanced back to BofA’s fundamental weight (2.7% for 2012), creating an active weight of almost 200 bps. The 12 months that followed saw mean reversion for BofA as it posted a return of approximately 28%, contributing 32 bps to overall performance for that period.
CONCLUSION
With the recent growth of smart beta strategies, it is important to understand the concept and meth-odology behind how these strategies work. Chow, Hsu, Kalesnik, and Little (2011) demonstrate that many of the popular Smart Beta strategies currently in the market outperform for similar reasons. They break the link between price and portfolio weight. Therefore, when choosing a Smart Beta
WHITE PAPER | September 201310
strategy it is important to look at potential implementation costs of Smart Beta strategies. The Series is a transparent, rules-based approach that uses a composite measure of sales, cash flow, dividends, and book value to select and weight index constituents. The fundamental factors used are applied in a thoughtful manner in order to limit turnover and maximize liquidity, and serve as a sensible anchor to contra-trade against the markets’ constantly shifting and sometimes overblown expectations.
TABLE 6. FTSE RAFI INDEX SERIES PERFORMANCE
FTSE RAFI INDEX PERFORMANCE AS OF 6/30/2013
Index 1–Year 3–Year 5–Year 10–YearIndex Launch
DateSharpe Ratio
Information Ratio
Index Launch Date
GLOBAL
FTSE RAFI All World 3000 Index 20.73% 12.42% 4.69% 10.80% 13.86% 0.64 0.28 10/6/2008
FTSE All World Index 17.41% 12.87% 3.03% 8.36% 12.44% 0.67 – –
Excess returns vs. Cap-Weight 3.33% -0.45% 1.66% 2.44% 1.42% – – –
DEVELOPED EX-US
FTSE RAFI Developed Ex US 1000 Index 19.63% 8.84% 0.40% 9.14% 4.34% 0.12 0.05 11/28/2005
FTSE Developed Ex US Index 17.25% 9.91% -0.13% 8.58% 4.11% 0.13 – –
Excess returns vs. Cap-Weight 2.37% -1.07% 0.53% 0.56% 0.23% – – –
UNITED STATES
FTSE RAFI 1000 Index 26.99% 19.41% 10.65% 9.57% 7.49% 0.31 0.33 11/28/2005
FTSE United States Index 20.77% 18.45% 7.13% 7.57% 5.77% 0.26 – –
Excess returns vs. Cap-Weight 6.22% 0.96% 3.52% 2.00% 1.72% – – –
EMERGING MARKETS
FTSE RAFI Emerging Markets Index -1.41% 1.02% 0.04% 17.64% 0.45% -0.01 0.11 7/9/2007
FTSE Emerging Markets Index 3.62% 3.31% 0.15% 14.39% 0.07% -0.02 – –
Excess returns vs. Cap-Weight -5.03% -2.29% -0.11% 3.25% 0.38% – – –
Source: Research Affiliates, LLC. Returns are total returns in USD. Index launch date returns are calculated starting with the first full month of index performance.
TABLE 7. TRENDING PRICES: BANK OF AMERICA EXAMPLE
FTSE RAFI US 1000 vs. FTSE USA
Date RebalanceWeight Cap-Weight Active Weight Subsequent 12–Month
Performance
Subsequent 12–Month Contribution to
Performance
3/31/2010 2.36% 1.58% 0.78% -25.10% -0.38%
3/31/2011 2.19% 1.03% 1.16% -27.83% -0.48%
3/31/2012 2.74% 0.76% 1.98% 27.84% 0.32%
Source: Research Affiliates, LLC, based on data from Factset
WHITE PAPER | September 2013
The FTSE RAFI® Index Series
11
APPENDIX
YEAR BY YEAR TURNOVER FOR FTSE RAFI INDICIES vs. CAP–WEIGHT
FTSE RAFI INDEX SERIES TURNOVER vs. FTSE BENCHMARK TURNOVER*
Year Ended**FTSE RAFI All World 3000
FTSEAll World
FTSE RAFI Developed Ex
US 1000
FTSEDeveloped
Ex US
FTSE RAFI Emerging Markets
FTSE Emerging Markets
FTSE RAFI 1000
FTSE USA
Mar-07 N/A 0.4% 11.55% 0.75% N/A 1.23% 10.02% 0.83%
Mar-08 N/A 2.6% 22.46% 2.27% 34.45% 6.99% 17.75% 2.51%
Mar-09 25.1% 2.4% 22.62% 2.36% 31.86% 10.47% 24.62% 1.98%
Mar-10 25.2% 2.6% 23.07% 5.93% 38.22% 20.24% 30.49% 2.41%
Mar-11 13.9% 3.7% 13.08% 3.18% 29.53% 5.17% 12.07% 4.19%
Mar-12 11.5% 2.8% 11.47% 3.10% 16.09% 4.31% 9.37% 2.53%
Mar-13 12.1% 5.6% 11.38% 6.49% 20.51% 11.80% 11.11% 3.83%
Average 17.6% 3.4% 16.52% 3.44% 28.44% 9.83% 16.49% 2.61%
AverageExcluding 2009–2010
12.5% 4.0% 13.99% 3.16% 25.15% 7.07% 12.06% 2.78%
Source: FTSE* Data indicates one-way turn over.**Data for rebalance to rebalance on date shown. The first rebalance date for each index may not include a full year of data, depending on inception date.
Source: Research Affiliates, LLC, based on data from Factset
VALUE vs. GROWTH PERFORMANCE
VALUE vs. GROWTH6/30/2013
Index 1–Year 3–Year 5–Year FTSE Index Launch Date Return
Index Launch Date
FTSE All World Developed Value 20.79% 13.62% 4.29% 4.00% 11/28/2005
FTSE All World Developed 19.12% 14.13% 3.38% 4.01% –
Value Add 1.67% -0.52% 0.91% -0.01% –
FTSE All World Developed Ex US Value 16.91% 8.75% 0.43% 3.94% 5/4/2006
FTSE All World Developed Ex US 17.25% 9.91% -0.13% 4.11% –
Value Add -0.35% -1.16% 0.56% -0.17% –
FTSE US Value 24.36% 18.56% 8.32% 6.26% 11/28/2005
FTSE US 20.77% 18.45% 7.13% 5.77% –
Value Add 3.59% 0.11% 1.19% 0.50% –
WHITE PAPER | September 201312
ENDNOTES
1. All returns, index characteristics, and attribution information are calculated using data from Factset unless otherwise stated.
2. RAFI US 1000 simulation is for the period 1962–2012 and is based on CRSP and Compustat data. In this section we use the RAFI US 1000 as our example for explaining the index construction process as it has the longest period of data availability.
REFERENCES
Arnott, Robert D., Jason C. Hsu, and Philip Moore. 2005. “Fundamental Indexation.” Financial Analysts Journal, vol. 61, no. 2 (March/April):83–99.
Carhart, Mark M. 1997. “On Persistence in Mutual Fund Performance.” Journal of Finance, vol. 52, no. 1 (March):57–82.
Chow, Tzee-man, Jason C. Hsu, Vitali Kalesnik, and Bryce Little. 2011. “A Survey of Alternative Equity Index Strategies.” Finan-cial Analysts Journal, vol. 67. no. 5 (September/October):37–57.
WHITE PAPER | September 2013
The FTSE RAFI® Index Series
13
DISCLOSURESThe material contained in this document is for information purposes only. This material is not intended as an offer or solicitation for the purchase or sale of any secu-rity or financial instrument, nor is it advice or a recommendation to enter into any transaction. Any offer to sell or a solicitation of an offer to buy or sell pooled invest-ment vehicles shall be made solely to qualified investors through a private placement memorandum. Separately managed accounts will be based on an investment management agreement. This information is intended to supplement information contained in the respective disclosure documents. The information contained herein should not be construed as financial or investment advice on any subject matter. Research Affiliates does not warrant the accuracy of the information provided herein, either expressed or implied, for any particular purpose. The index data published herein are simulated, no allowance has been made for trading costs, management fees, or other costs, are not indicative of any specific in-vestment, are unmanaged and cannot be invested in directly. Past simulated performance is no guarantee of future performance and actual investment results may differ. Any information and data pertaining to an index contained in this document relate only to the index itself and not to any asset management product based on the index. With the exception of the data on Research Affiliates Fundamental Index, all other information and data are based on information and data from third party sources. Investors should be aware of the risks associated with data sources and quantitative processes used in our investment management process. Errors may exist in data acquired from third party vendors, the construction of model portfolios, and in coding related to the index and portfolio construction process. While Research Affiliates takes steps to identify data and process errors so as to minimize the potential impact of such errors on index and portfolio performance, we cannot guarantee that such errors will not occur.The FTSE Research Affiliates Fundamental Indexes are calculated by FTSE International Limited (“FTSE”) in conjunction with Research Affiliates LLC (“RA”). All rights and interests in the FTSE Research Affiliates Fundamental Indexes vest in FTSE. All rights in and to the RA fundamental weighting methodology used in the calculation of the FTSE Research Affiliates Fundamental Indexes vest in RA. All rights in the FTSE indices and / or FTSE ratings (together the “FTSE Data”) vest in FTSE and/or its licensors. Except to the extent disallowed by applicable law, neither FTSE nor RA nor their licensors shall be liable (including in negligence) for any loss arising out of use of the FTSE Research Affiliates Fundamental Indexes, the FTSE Data or underlying data by any person. “FTSE™” is a trademark of the London Stock Exchange Plc and is used by FTSE under license. “Research Affiliates” and “Fundamental Index” are trademarks of RA. FTSE is not an investment adviser and makes no representa-tion regarding the advisability of investing in any security. Inclusion of a security in an index is not a recommendation to buy, sell or hold such security. No further distribution of FTSE Data is permitted without FTSE’s express written consent.Research Affiliates is the owner of the trademarks, service marks, patents and copyrights related to the Fundamental Index methodology. The trade names Fundamen-tal Index®, RAFI®, the RAFI logo, and the Research Affiliates corporate name and logo are registered trademarks and are the exclusive intellectual property of Research Affiliates, LLC. Any use of these trade names and logos without the prior written permission of Research Affiliates is expressly prohibited. Research Affiliates reserves the right to take any and all necessary action to preserve all of its rights, title and interest in and to these marks.The Fundamental Index® concept, the non-capitalization method for creating and weighting of an index of securities, is patented and patent-pending proprietary intel-lectual property of Research Affiliates, LLC (US Patent No. 7,620,577; 7,792,719; 8,374,939; 8,380,604; RE 44,098; and RE 44,362; Patent Pending Publ. Nos. WO 2005/076812, WO 2007/078399 A2, and WO 2008/118372). Intellectual property protected by one, or more, of the foregoing may be used in the material pre-sented herein.

620 Newport Center Drive, Suite 900 Newport Beach, CA 92660 Main: +1 949.325.8700 www.researchaffiliates.com