Frontiers Climate change and solar variability:...
14
Frontiers Climate change and solar variability: What's new under the sun? Edouard Bard a, ⁎ , Martin Frank b,1 a CEREGE (UMR 6635), Collège de France, CNRS-Université Aix-Marseille, Europole de l'Arbois BP80, 13545 Aix-en-Provence cedex 4, France b IfM-GEOMAR, Leibniz Institute for Marine Sciences at the University of Kiel, Wischhofstrasse 1-3, 24148 Kiel, Germany 1 Received 29 December 2005; received in revised form 26 May 2006; accepted 9 June 2006 Available online 17 July 2006 Editor: A.N. Halliday Abstract The Sun has an obvious effect on climate since its radiation is the main energy source for the outer envelopes of our planet. Nevertheless, there is a long-standing controversy on whether solar variability can significantly generate climate change, and how this might occur. This is a crucial issue not only in the field of paleoclimatology, but also for predicting the future of the Earth's climate, which will be subject to perturbations by anthropogenic greenhouse gases. Indeed, if climate changes due to the Sun were large and rapid, this would make it more difficult to extract the anthropogenic effects from precise records of instrumental data over the past century. Hence, Sun–climate relationships have never been so controversial as today, forming a debate that often escapes the scientific arena. Here, we provide a review of this problem by considering changes on different time scales, from the last million years up to recent decades. In doing so, we also critically assess recent claims that the variability of the Sun has had a significant impact on global climate. The different studied records also illustrate the multi-disciplinary nature of this difficult problem, requiring knowledge in several fields such as astronomy and astrophysics, atmospheric dynamics and microphysics, isotope geochemistry and geochronology, as well as geophysics, paleoceanography and glaciology. Overall, the role of solar activity in climate changes — such as the Quaternary glaciations or the present global warming — remains unproven and most probably represents a second-order effect. Although we still require even more and better data, the weight of evidence suggests that solar changes have contributed to small climate oscillations occurring on time scales of a few centuries, similar in type to the fluctuations classically described for the last millennium: The so-called Medieval Warm Period (900–1400 A.D.) followed on by the Little Ice Age (1500–1800 A.D.). © 2006 Elsevier B.V. All rights reserved. Keywords: solar activity; climate forcing; cosmogenic isotopes; geomagnetic field 1. Introduction Does the Sun have an influence on climate? This question may seem absurd in relation to our own star, which is at the origin of essentially all phenomena affecting the atmosphere and the ocean and whose output radiation represents the main source for the radiative budget of the Earth [1]. Nevertheless, it has been known for many centuries that the Sun is variable. The most obvious evidence for its variable activity is the occurrence and disappearance of sunspots. These solar features began to be studied in detail as soon as the first telescopes were developed. From 1610 onwards, astro- nomers were turning their instruments towards the Sun and were describing and counting sunspots. Harriot in Earth and Planetary Science Letters 248 (2006) 1 – 14 www.elsevier.com/locate/epsl ⁎ Corresponding author. Tel.: +33 442507418; fax: +33 442507421. E-mail addresses: [email protected] (E. Bard), [email protected] (M. Frank). 1 Tel.: +49 4316002218; fax: +49 4316002925. 0012-821X/$ - see front matter © 2006 Elsevier B.V. All rights reserved. doi:10.1016/j.epsl.2006.06.016
Transcript of Frontiers Climate change and solar variability:...
Earth and Planetary Science Letters 248 (2006) 1–14www.elsevier.com/locate/epsl
Frontiers
Climate change and solar variability: What's new under the sun?
Edouard Bard a,⁎, Martin Frank b,1
a CEREGE (UMR 6635), Collège de France, CNRS-Université Aix-Marseille, Europole de l'Arbois BP80, 13545 Aix-en-Provence cedex 4, Franceb IfM-GEOMAR, Leibniz Institute for Marine Sciences at the University of Kiel, Wischhofstrasse 1-3, 24148 Kiel, Germany
1
Received 29 December 2005; received in revised form 26 May 2006; accepted 9 June 2006Available online 17 July 2006
Editor: A.N. Halliday
Abstract
The Sun has an obvious effect on climate since its radiation is the main energy source for the outer envelopes of our planet.Nevertheless, there is a long-standing controversy on whether solar variability can significantly generate climate change, and how thismight occur. This is a crucial issue not only in the field of paleoclimatology, but also for predicting the future of the Earth's climate, whichwill be subject to perturbations by anthropogenic greenhouse gases. Indeed, if climate changes due to the Sun were large and rapid, thiswould make it more difficult to extract the anthropogenic effects from precise records of instrumental data over the past century. Hence,Sun–climate relationships have never been so controversial as today, forming a debate that often escapes the scientific arena.
Here, we provide a review of this problem by considering changes on different time scales, from the last million years up to recentdecades. In doing so, we also critically assess recent claims that the variability of the Sun has had a significant impact on global climate.The different studied records also illustrate the multi-disciplinary nature of this difficult problem, requiring knowledge in several fieldssuch as astronomy and astrophysics, atmospheric dynamics and microphysics, isotope geochemistry and geochronology, as well asgeophysics, paleoceanography and glaciology.
Overall, the role of solar activity in climate changes— such as the Quaternary glaciations or the present global warming— remainsunproven andmost probably represents a second-order effect. Althoughwe still require evenmore and better data, theweight of evidencesuggests that solar changes have contributed to small climate oscillations occurring on time scales of a few centuries, similar in type to thefluctuations classically described for the last millennium: The so-called Medieval Warm Period (900–1400 A.D.) followed on by theLittle Ice Age (1500–1800 A.D.).© 2006 Elsevier B.V. All rights reserved.
Keywords: solar activity; climate forcing; cosmogenic isotopes; geomagnetic field
1. Introduction
Does the Sun have an influence on climate? Thisquestion may seem absurd in relation to our own star,which is at the origin of essentially all phenomena
⁎ Corresponding author. Tel.: +33 442507418; fax: +33 442507421.E-mail addresses: [email protected] (E. Bard),
[email protected] (M. Frank).1 Tel.: +49 4316002218; fax: +49 4316002925.
0012-821X/$ - see front matter © 2006 Elsevier B.V. All rights reserved.doi:10.1016/j.epsl.2006.06.016
affecting the atmosphere and the ocean andwhose outputradiation represents the main source for the radiativebudget of the Earth [1]. Nevertheless, it has been knownfor many centuries that the Sun is variable. The mostobvious evidence for its variable activity is theoccurrence and disappearance of sunspots. These solarfeatures began to be studied in detail as soon as the firsttelescopes were developed. From 1610 onwards, astro-nomers were turning their instruments towards the Sunand were describing and counting sunspots. Harriot in
2 E. Bard, M. Frank / Earth and Planetary Science Letters 248 (2006) 1–14
England was the first to mention them in his notebooks.The following year, Fabricius in Germany was the first toactually publish his own observations and interpreta-tions. In 1612 and 1613, Scheiner in Germany andGalileo in Italy became famous for their debate about thereal nature of sunspots and their dispute over priority forthe discovery.
Until the beginning of the 1980s, the relation betweenthe Sun and climate change were still viewed withsuspicion by the wider climate community and oftenremained a “taboo” subject in the solar astrophysics com-munity. The main reason was a fundamental lack ofknowledge about the causal link between the activity of theSun and its irradiance, i.e. the amount of energy receivedper surface unit at the average distance between the Earthand the Sun. For many years, the energy radiated by theSunwas even assumed invariable. This led to the use of theterm “solar constant”, a concept formalized in 1838 byPouillet [2] who first measured it in a quantitative manner.
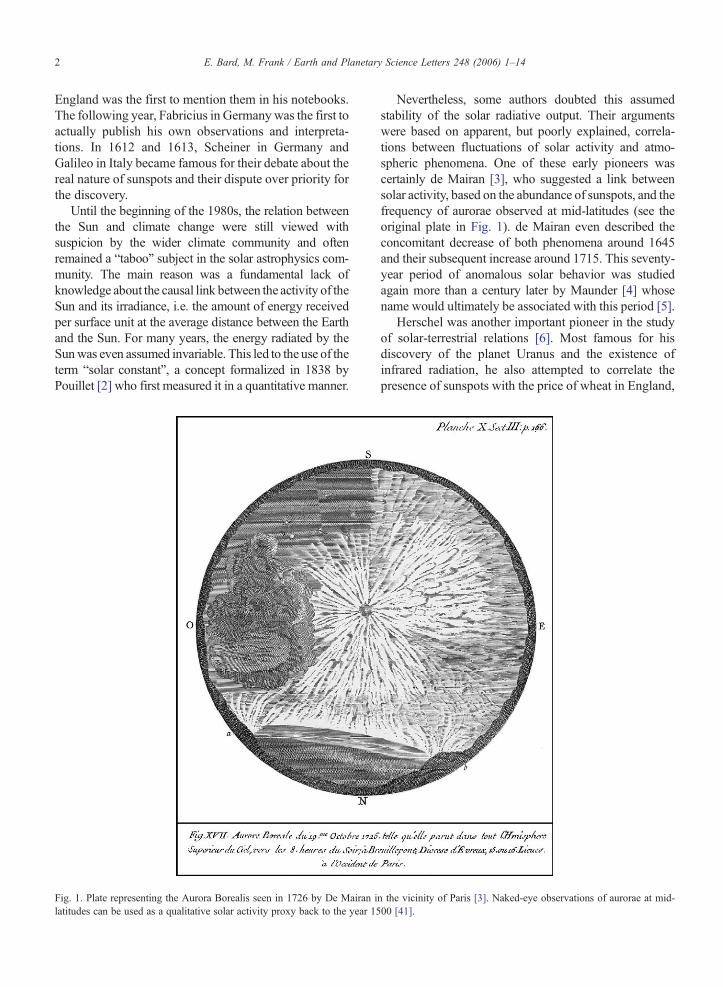
Fig. 1. Plate representing the Aurora Borealis seen in 1726 by De Mairan ilatitudes can be used as a qualitative solar activity proxy back to the year 15
Nevertheless, some authors doubted this assumedstability of the solar radiative output. Their argumentswere based on apparent, but poorly explained, correla-tions between fluctuations of solar activity and atmo-spheric phenomena. One of these early pioneers wascertainly de Mairan [3], who suggested a link betweensolar activity, based on the abundance of sunspots, and thefrequency of aurorae observed at mid-latitudes (see theoriginal plate in Fig. 1). de Mairan even described theconcomitant decrease of both phenomena around 1645and their subsequent increase around 1715. This seventy-year period of anomalous solar behavior was studiedagain more than a century later by Maunder [4] whosename would ultimately be associated with this period [5].
Herschel was another important pioneer in the studyof solar-terrestrial relations [6]. Most famous for hisdiscovery of the planet Uranus and the existence ofinfrared radiation, he also attempted to correlate thepresence of sunspots with the price of wheat in England,
n the vicinity of Paris [3]. Naked-eye observations of aurorae at mid-00 [41].

3E. Bard, M. Frank / Earth and Planetary Science Letters 248 (2006) 1–14
which was ultimately linked to climate variability [6].Following this early work, many studies reported similarapparent correlations, notably with Asian monsoonprecipitations (e.g. [7,8] published more than a centuryago and numerous subsequent papers). It is beyond thescope of our review to make an exhaustive list of thesestudies. Moreover, most of them remained elusive andqualitative on the actual physical processes generatingthe observed correlations.
Research on themechanisms of solar effects on climateand their magnitude is currently benefiting from atremendous renewal of interest. A large amount of highresolution data is now available from archives such as icecores, speleothems, corals, marine and lacustrine sedi-ments. However, thematter remains controversial becausemost of these records are influenced by other factors inaddition to solar activity. Moreover, we still lack a funda-mental understanding of all causal relationships betweensolar activity and climate.
We review here some of the more controversialissues, pointing out that this important field of climateresearch not only needs more reliable datasets, but also adeeper mechanistic understanding of the processes in-volved (see also Veizer [9] for a review with a differentperspective). This is essential for reliable interpretations
Fig. 2. Time series of the sunspot numbers since 1610. Since 1750 monthly aand the SIDC team, World Data Center for the Sunspot Index, Royal Observathere are fewer observations and the displayed curve is based on yearly averaflux precursor technique [92] and a calibrated flux-transport dynamo model
of the present or future impact of solar activity on globalclimate.
2. Has the warming observed during the past decadesbeen partly linked to solar variability?
We can be certain of one thing: solar activity has variedon recent time scales. Evidence for these fluctuations isprovided by the variation in the number of sunspots,which is following an 11-yr cycle (Fig. 2). Owing tomeasurements carried out by satellites, it is now clear thatthe “solar constant” also fluctuates on short time scalesfromweeks to years. The 11-yr cycle is characterized by avariation of about 0.1% in total solar irradiance (Fig. 3).Paradoxically, the irradiance increases with the number ofsunspots: although spots darken the Sun's surface, theireffect is overcompensated by the faculae, which are morebrilliant zones associated with the spots [10,11].
In addition, the irradiance variations are not spectrallyhomogeneous and the amplitude of the UV variability is,in relative terms, an order of magnitude larger than thevariability of total solar irradiance [10,11]. This enhancesstratospheric ozone formation through photochemicalreactions [12,13] leading to further heating of the strato-sphere through absorption of the excess UV radiation by
verages have been available (reproduced from R.A.M. Van der Lindentory of Belgium, http://sidc.oma.be/html/sunspot.html). Beyond 1750,ges [5,30]. Previsions for solar cycle 24 are based on the 10.7 cm radio(upper curve from [93]).
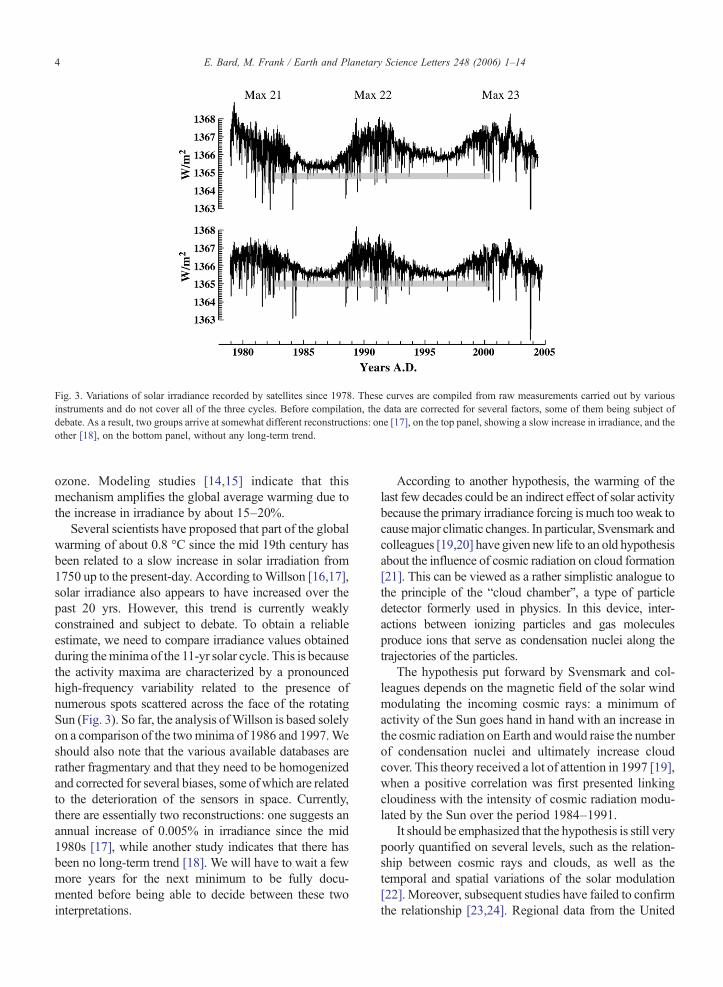
Fig. 3. Variations of solar irradiance recorded by satellites since 1978. These curves are compiled from raw measurements carried out by variousinstruments and do not cover all of the three cycles. Before compilation, the data are corrected for several factors, some of them being subject ofdebate. As a result, two groups arrive at somewhat different reconstructions: one [17], on the top panel, showing a slow increase in irradiance, and theother [18], on the bottom panel, without any long-term trend.
4 E. Bard, M. Frank / Earth and Planetary Science Letters 248 (2006) 1–14
ozone. Modeling studies [14,15] indicate that thismechanism amplifies the global average warming due tothe increase in irradiance by about 15–20%.
Several scientists have proposed that part of the globalwarming of about 0.8 °C since the mid 19th century hasbeen related to a slow increase in solar irradiation from1750 up to the present-day. According toWillson [16,17],solar irradiance also appears to have increased over thepast 20 yrs. However, this trend is currently weaklyconstrained and subject to debate. To obtain a reliableestimate, we need to compare irradiance values obtainedduring theminima of the 11-yr solar cycle. This is becausethe activity maxima are characterized by a pronouncedhigh-frequency variability related to the presence ofnumerous spots scattered across the face of the rotatingSun (Fig. 3). So far, the analysis ofWillson is based solelyon a comparison of the twominima of 1986 and 1997.Weshould also note that the various available databases arerather fragmentary and that they need to be homogenizedand corrected for several biases, some ofwhich are relatedto the deterioration of the sensors in space. Currently,there are essentially two reconstructions: one suggests anannual increase of 0.005% in irradiance since the mid1980s [17], while another study indicates that there hasbeen no long-term trend [18]. We will have to wait a fewmore years for the next minimum to be fully docu-mented before being able to decide between these twointerpretations.
According to another hypothesis, the warming of thelast few decades could be an indirect effect of solar activitybecause the primary irradiance forcing is much tooweak tocausemajor climatic changes. In particular, Svensmark andcolleagues [19,20] have given new life to an old hypothesisabout the influence of cosmic radiation on cloud formation[21]. This can be viewed as a rather simplistic analogue tothe principle of the “cloud chamber”, a type of particledetector formerly used in physics. In this device, inter-actions between ionizing particles and gas moleculesproduce ions that serve as condensation nuclei along thetrajectories of the particles.
The hypothesis put forward by Svensmark and col-leagues depends on the magnetic field of the solar windmodulating the incoming cosmic rays: a minimum ofactivity of the Sun goes hand in hand with an increase inthe cosmic radiation on Earth andwould raise the numberof condensation nuclei and ultimately increase cloudcover. This theory received a lot of attention in 1997 [19],when a positive correlation was first presented linkingcloudiness with the intensity of cosmic radiation modu-lated by the Sun over the period 1984–1991.
It should be emphasized that the hypothesis is still verypoorly quantified on several levels, such as the relation-ship between cosmic rays and clouds, as well as thetemporal and spatial variations of the solar modulation[22]. Moreover, subsequent studies have failed to confirmthe relationship [23,24]. Regional data from the United

5E. Bard, M. Frank / Earth and Planetary Science Letters 248 (2006) 1–14
States even appear to show an opposite correlation to thatproposed by Svensmark [25]. Thus, despite the fact thatthe cosmic ray hypothesis stimulated numerous researchinitiatives in this field, it was premature to suggest it couldpossibly explain all global temperature variations between1970 and 1990 [19]. Indeed, even the original correlationreported by Svensmark and colleagues did not show along-term trend over several decades.
It also needs to be stressed here that the climatic impactof clouds depends strongly on their radiative properties,and thus also on their altitude. Indeed, the actual overallradiative effect of a cloud comprises the competing influ-ences of its reflection properties, its absorption of visibleand IR, and its emission of IR towards the Earth and intoouter space. During periods of strong solar activity, theinitially considered solar modulation should induce areduction in high-altitude clouds at high latitudes. How-ever, these high-altitude clouds actually have an overalltendency towarm the climate, rather than to cool it, as low-altitude clouds do. Therefore, the initial hypothesis doesnot appear to be compatible with the apparent correlationbetween solar activity and global warming.
The hypothesis was subsequently modified by thesame group [26], who proposed a solar influence limitedto low-altitude clouds. Indeed, variations in low cloudcover seem tomatch better with the solar fluctuations overthe period between 1983 and 1995. Although theseauthors presented a number of working hypotheses, thisnew proposal seems somewhat paradoxical: We wouldexpect a maximum solar effect in the upper parts of theatmosphere rather than in its lowest part, which containsabundant condensation nuclei. In addition, cosmic raysand low cloud cover have not remained correlated after1995 [23]. Other sources of variability in cloudiness, suchas volcanic aerosols and ENSO, could have obscured thesignal over interannual and decadal time scales [27].
Pallé [28] recently performed a precise reanalysis ofthese correlations by considering spatial patterns in ad-dition to temporal relationships. He concluded that thesolar-like variability in low cloud covermight be an artifactinduced by the satellite observing perspective. A possibleexplanation would be a redistribution of clouds at high-altitude, rather than changing amounts of clouds throughcosmic ray forcing. Indeed, if there are any significantchanges in the atmospheric circulation modulated by theirradiance (total andUV), one could expect them to changecloud cover as well. Therefore, even if a correlationbetween clouds and cosmic ray flux exists, it does notconstitute a final proof for a direct causal relationship.
A major difficulty is that the noise, particularly in thecloud data, continues to obscure the identification of pos-sible signals. Data for the next solar cycles will ultimately
allow checking if there is any link between solar activityand cloudiness. For themoment, the exactmechanisms bywhich cosmic radiation and solar forcingmay affect cloudformation remain very poorly understood and clearly re-quire future research efforts [29].
3. Has solar forcing been the main cause of climatechange over the past few centuries?
Prior to the last two decades, there are no direct andreliable measurements of solar irradiance. The mainsource of information on solar variability is provided bysunspot observations, which have become systematicfrom the 17th century onwards (see [5,30] for compila-tions of early studies). As shown on Fig. 2, the yearlyaverage sunspot number displays a prominent 11-yrcyclicity. Minimum values are all similar and thus asimple linear correlation between sunspot number andtotal solar irradiance would not account for variationslarger than 0.1% in the long-term. This is particularlyimportant since the recent minima of the solar cycle andthe Maunder Minimum are both characterized by a nearabsence of sunspots, which, following this simplisticrule, would result in the same irradiance.
Studies of the Sun [10] and of other solar-type stars[31,32] indicate that the magnetic activity is positivelycorrelated with brightness. Using this linkage, it ispossible to infer long-term trends of irradiance by takingaccount of the magnetic activity records. In particular,Lean et al. [10] explicitly proposed that the irradiancerecord is composed of two components: a slowly varyingbase line and an 11-yr cycle. This periodic component iscalculated by modeling the darkening and brighteningeffects of sunspots and faculae, respectively [10]. Theseprinciples have led to reconstructions of the total solarirradiance based on the available sunspot observations[10,33]. Recently, Lean et al. [34] reassessed previousresults and provided arguments suggesting that previousstudies overestimated the variation of the base line,generally expressed by estimating the irradiance decreaseduring the Maunder Minimum.
Nevertheless, long-term changes have been identifiedin the record of geomagnetic perturbations [35], whichhave been linked to the magnetic field of the solar corona.The amplitude antipodal activity index (the so-called aaindex), which goes back to the year 1868, exhibits an 11-yrcycle superimposed on a long-term background [36]. Thislatter component exhibits a distinct rise during the first halfof the 20th century, a limited decrease during the 60s and70s, followed by a re-increase until the end of the lastcentury [36]. The overall shape of this curve is similar tothe irradiance curves derived from sunspots [10,33]. Cliver
6 E. Bard, M. Frank / Earth and Planetary Science Letters 248 (2006) 1–14
et al. [36] also showed that the aa base line is broadlysimilar in shape to the global surface air temperature curve,suggesting that the Sun is responsible for part of the globalwarming. The aa index was further used in a quantitativemanner to derive a time series of the solar magnetic flux,which exhibits more than a two-fold increase over the lastcentury [37]. Lockwood et al. [37] further showed that thisheliomagnetic increase was accompanied by a 0.1%increase of the total solar irradiance.
However, it has been shown that the original aaindex is affected by instrumental problems and newproxies of geomagnetic activity were developed for in-vestigating the long-term variability of the solar wind–magnetosphere system [38,39]. Mursula et al. [40] forexample showed that the centennial increase in globalgeomagnetic activity was considerably smaller thandepicted by the original aa index.
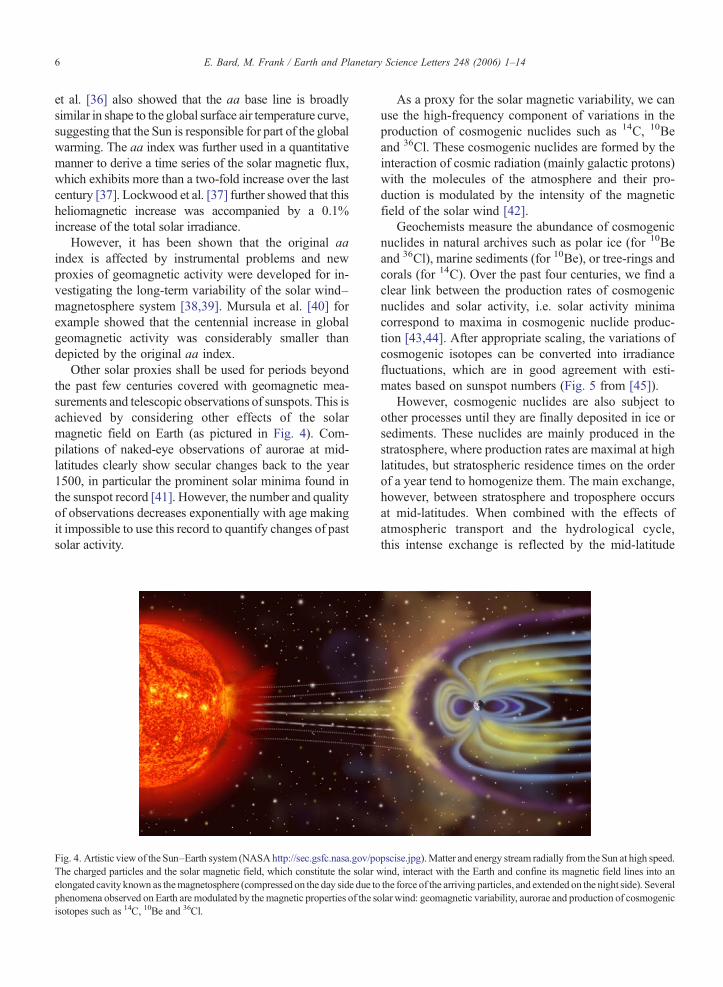
Other solar proxies shall be used for periods beyondthe past few centuries covered with geomagnetic mea-surements and telescopic observations of sunspots. This isachieved by considering other effects of the solarmagnetic field on Earth (as pictured in Fig. 4). Com-pilations of naked-eye observations of aurorae at mid-latitudes clearly show secular changes back to the year1500, in particular the prominent solar minima found inthe sunspot record [41]. However, the number and qualityof observations decreases exponentially with age makingit impossible to use this record to quantify changes of pastsolar activity.
Fig. 4. Artistic view of the Sun–Earth system (NASAhttp://sec.gsfc.nasa.gov/poThe charged particles and the solar magnetic field, which constitute the solar welongated cavity known as themagnetosphere (compressed on the day side due tophenomena observed on Earth are modulated by the magnetic properties of the sisotopes such as 14C, 10Be and 36Cl.
As a proxy for the solar magnetic variability, we canuse the high-frequency component of variations in theproduction of cosmogenic nuclides such as 14C, 10Beand 36Cl. These cosmogenic nuclides are formed by theinteraction of cosmic radiation (mainly galactic protons)with the molecules of the atmosphere and their pro-duction is modulated by the intensity of the magneticfield of the solar wind [42].
Geochemists measure the abundance of cosmogenicnuclides in natural archives such as polar ice (for 10Beand 36Cl), marine sediments (for 10Be), or tree-rings andcorals (for 14C). Over the past four centuries, we find aclear link between the production rates of cosmogenicnuclides and solar activity, i.e. solar activity minimacorrespond to maxima in cosmogenic nuclide produc-tion [43,44]. After appropriate scaling, the variations ofcosmogenic isotopes can be converted into irradiancefluctuations, which are in good agreement with esti-mates based on sunspot numbers (Fig. 5 from [45]).
However, cosmogenic nuclides are also subject toother processes until they are finally deposited in ice orsediments. These nuclides are mainly produced in thestratosphere, where production rates are maximal at highlatitudes, but stratospheric residence times on the orderof a year tend to homogenize them. The main exchange,however, between stratosphere and troposphere occursat mid-latitudes. When combined with the effects ofatmospheric transport and the hydrological cycle,this intense exchange is reflected by the mid-latitude
pscise.jpg).Matter and energy stream radially from the Sun at high speed.ind, interact with the Earth and confine its magnetic field lines into anthe force of the arriving particles, and extended on the night side). Severalolar wind: geomagnetic variability, aurorae and production of cosmogenic

Fig. 5. Reconstructions of the total solar irradiance based on datarelated to the solar variability. The black line is based on sunspots [10]and the grey line on cosmogenic nuclides [45]. Letters correspond tosolar activity minima named after pioneers in solar research (Dalton,Maunder, Spörer, Wolf).
Fig. 6. Relationship between the atmospheric 10Be production rate andgeomagnetic latitude, for different values of the solarmodulation parameterphi [90]. Typical solar-minimum and -maximum phi values are 300 and900, respectively. The average effective value is about 450 during a typical11-yr solar cycle. The dashed line provides a best fit to measurements of10Be deposition rate at the Earth's surface [42], which is controlled by themaximum in stratospheric/tropospheric exchange at mid-latitudes (see [47]for recent estimates based on a general circulation model).
7E. Bard, M. Frank / Earth and Planetary Science Letters 248 (2006) 1–14
maximum in 10Be flux arriving at the Earth's surface[42,46,47] (Fig. 6). Hence, there are considerable uncer-tainties concerning records from single locations due toatmospheric transport and the relative efficiency of wetand dry deposition of 10Be. These processes may havevaried along with climate changes, which complicatesthe interpretations.
Overall, studies of cosmogenic isotopes indicate thatsolar minima have been numerous and that the Sun hasspent much of the last millennium in calm phases,conceivably exhibiting an irradiance several ‰ weakerthan at present. Solar fluctuations appear to have beeninvolved in causing widespread climatic changes, suchas the Medieval Warm Period (900–1400 A.D.) or thesubsequent Little Ice Age (1500–1800 A.D.) [5,45,48].
Climate models give results for the solar forcing thatare in line with their sensitivity to CO2 increases. For aforcing corresponding to an activity minimum, themodels indicate coolings of a few tenths of a degree[49]. However, these drops are not evenly distributedacross regions, seasons and altitudes. Results from theGISS GCM indicate that intense cooling (1–2 °C)would be concentrated in Europe and North America,especially during winter, in a pattern resembling the lowindex state of the Arctic Oscillation/North AtlanticOscillation [14]. In contrast, similar modeling per-formed with a GCM from the Hadley Centre suggestsregional patterns different from that of the AO/NAO[15].
4. Was there any solar modulation of climate duringthe Holocene period?
Several authors have studied various archives toidentify climate variability associated with changes insolar activity. Beyond the last millennium, the usualtechnique involves comparing the records of cosmogenicnuclides, mainly 14C and 10Be, with time series based onclimate proxies measured in archives such as tree-rings,sediments or stalagmites.
The usefulness of these comparisons relies on theaccuracy and precision of the time scales of the differentrecords. The best chronological constraints are given bytree-rings that allow us to study 14C production over thepast twelve millennia [50]. The 10Be content in polar icecores is another proxy that can be used to track past solarchanges [43,44,51,52]. Both 14C and 10Be records aretightly coupled, exhibiting prominent cycles, e.g. 90 and210 yr, that are probably linked to intrinsic solar varia-tions similar to the 11-yr sunspot cycle.
Bond et al. [53,54] followed by Hu et al. [55],proposed that variations of solar activity are responsiblefor quasi-periodic climatic and oceanographic fluctua-tions that follow cycles of about one to two millennia.
8 E. Bard, M. Frank / Earth and Planetary Science Letters 248 (2006) 1–14
The succession from the Medieval Warm Period to theLittle Ice Age would thus represent the last cycle [54].According to this hypothesis, our present climate is in anascending phase on its way to attaining a new warmoptimum in a few centuries.
Climate scientists remain cautious because thesehypotheses really are founded solely on an apparent cor-relation between paleoenvironmental records and varia-tions of solar activity. In addition, even if the millenniumcycle is present, it appears to have a nonstationary charac-ter. For example, the 1500-year cyclicity observed in theGreenland ice core temperature profile during the lastglacial period (based on 18O/16O) is essentially dominatedby the presence of three maxima in the record [56], whichcontrasts with the hypothesis of a regular solar cycle.
More fundamentally, there is actually no evidence for asignificant millennium cycle in the 14C record measuredfrom well-dated tree-rings [57]. As a working hypothesis,a recent modeling study suggests that an apparent 1500-yrcycle could arise from the superimposed influence of the90 and 210 yr solar cycles on the climate system, which ischaracterized by both nonlinear dynamics and long timescale memory effects [58].
The search for solar variability in climate recordsspanning the Holocene has been revived recently byanalyzing 18O/16O fluctuations, a proxy for rainfall, inwell-dated speleothems from the Asian monsoon area[59–61]. After subtracting a long-term decrease attrib-uted to orbital forcing, these authors suggested that thecentennial variability of the monsoon has been, at leastpartly, linked to solar forcing. Based on statistical con-sideration of the comparison of climate and solar re-cords, it appears that a solar effect can explain, at best,only part of the observed climate variability over theHolocene period (see [62] for a recent review). Othermechanisms and forcings are superimposed on eachother, making it particularly difficult to detect them or toattribute their different effects to a particular forcing.
In addition, these recent statistical analyses are merelyqualitative because the 18O/16O variations in speleothemscan only be taken as a crude proxy for rainfall, which isnot easy to scale quantitatively with regard to climate. Inaddition, the cosmogenic nuclide records are also usedqualitatively: 14C and 10Be records are simply detrendedfor slow changes occurring over several millennia [50].The long-term trends are usually ascribed to variations ofthe geomagnetic dipolar field that effectively deflectscosmic protons colliding with the upper atmosphere atlow and mid-latitudes (Fig. 6). Some authors haverecently invoked the possibility of shorter-term archeo-magnetic “jerks” [63]. However, it is unclear whethersuch events were synchronous with 14C and 10Be
excursions, in particular the most recent ones, which docorrespond to well-identified sunspot minima.
In order to achieve a more detailed interpretation,several authors have tried to extract the solar componentby subtracting the nuclide production component linkedto geomagnetic variations as modeled from paleomag-netic data. This is a rather difficult task, even for thewell-dated tree-ring 14C record spanning the past twelvemillennia. Indeed, the short-term wiggles linked to solarchanges are an order of magnitude smaller than the long-term trend ascribed to the geomagnetic modulation. Thismeans that detrending is problematic, especially whenstudying the still hypothetical slow changes of solaractivity.
Based on such an approach, Solanki et al. [64] haveclaimed that the Sun's activity was much more intenseduring the past century when compared to the previouselevenmillennia. These authors converted the numerous14C excursions observed during the Holocene intochanges of sunspot numbers on the basis of a model: Atypical 20–30‰ increase of Δ14C, similar to the onecorresponding to the Maunder Minimum, wouldcorrespond to a drop of the sunspot number by 30–50[64]. In addition to this variability, Solanki et al. makethe case that the sunspot number was significantlyhigher (by about 20) over the past century than duringthe rest of the Holocene period.
As pointed out in a subsequent criticism [65], aproblem arises in bridging the 14C-based reconstructionwith the recent variability based on counting sunspots.Furthermore, the raw 14C data are detrended bymodeling the geomagnetic modulation with a recordof the virtual dipole moment (VDM), as reconstructedusing archeomagnetic intensity data that are bothspatially and temporally scattered (i.e. [66]). As shownby Korte and Constable [67], it is possible to separatethe dipolar field variations from nondipole contributionsto the geomagnetic field. The bias linked to the use ofVDM instead of DM has been calculated for the pastseven millennia [68]. These new calculations suggestthat two century-long periods around 4000 BP exhibitedsolar activity levels comparable to those observed overthe past century.
Other sources of variations could have operatedduring the Holocene: for example atmospheric CO2
levels have slowly risen by about 20 ppm [69] whichsomehow affected atmosphericΔ14C. In a box-diffusionmodel at steady state, this CO2 change leads to asystematic Δ14C shift of about 5‰ [70]. Relativelysmall variations of ocean circulation may also havechanged the atmospheric Δ14C by altering air–seaexchange and 14C transfer to the deep-sea. By using the
9E. Bard, M. Frank / Earth and Planetary Science Letters 248 (2006) 1–14
same box-diffusion model, it has been shown [70] thatvarying the eddy diffusivity by 20% leads to atmo-spheric Δ14C changes on the order of 20‰ (equivalentto a change of the sunspot number by ca. 30, accordingto [64]). Such an oceanic change would be difficult todetect with paleoceanographic proxies as it would shiftby only 200 yr the apparent 14C age of the deep-ocean(ca. 1600 yr on average). Other climate parameters, suchas sea–ice distribution and wind strength may havechanged slightly over the Holocene as well and mayhave had a significant impact on the long-term trend ofatmospheric Δ14C.
It is clear that, besides uncertainties of past geo-magnetic intensity, other systematic biases may havebeen involved in the 14C-based reconstruction of sun-spot numbers [64]. Therefore, the hypothesis of a dis-tinctly unusual Sun over the past century remains anunresolved issue.
5. Solar variability and climate on orbital timescales
In 1968, Suess proposed that the last glaciation mighthave been driven by variations of solar activity [71]. Toreach this conclusion, he extrapolated the observedtrends of 14C content measured in tree-rings and scaledthem in terms of solar changes. Less than a decade afterthe solar hypothesis of Suess, paleoclimatic data [72]and theoretical considerations [73] provided convincingevidence in favor of the Milankovitch theory, whichexplains glaciations by periodic changes in the Earth'sorbital parameters and not by solar irradiance changes.
It is now recognized that cosmogenic nuclide pro-duction is mainly modulated on time scales of 104 to105 yrs by changes in the geomagnetic field intensity[74–77]. In fact, compared with the rather mutedchanges reconstructed for the past few millennia [67],variations of the dipole moment were much larger overthe past 200 kyr [77–81]. This geomagnetic modulationaccounts quantitatively for most of the increase ofatmospheric 14C documented for the glacial period (see[70] for a review), which is incidentally not far from thevalue guessed by Suess [71].
In principle, 14C variations can also be linked tointernal causes such as changes in the carbon cycle [70].Therefore, it is crucial to validate the productionmodulation hypothesis by considering other cosmogen-ic isotopes such as 10Be and 36Cl in polar ice cores. Sofar, a discrepancy remains concerning the generalincrease in 36Cl fluxes between 40 and 25 kyr BP inthe GRIP ice core [82], which is inconsistent with thealmost invariant 10Be fluxes in the GISP2 ice core for
the same interval of time [52]. The studied core-sites arevery close to each other on the Greenland Summit andshould thus provide similar records. The observed dis-crepancies in 10Be flux may be partly related todifferences (i.e. biases) between the chronologies usedfor the GRIP and GISP2 cores, which have been datedindependently.
Recently, Sharma revisited the issue and proposed thatvery large solar variations have modulated climate overthe past 200 millennia [83]. This author claimed that theclimatic evolution during the Late Pleistocene— with itspronounced 100 kyr cycle — was triggered by largechanges in solar activity rather than being driven byvariations in the Earth's orbital parameters. This hypoth-esis was proposed to resolve a problem that has puzzledclimate researchers for a long time, i.e. the 100-kyr cycle,related to changes in the orbital eccentricity, generatesvery small changes in insolation that would be unable todirectly produce the major glacial/interglacial termina-tions experienced by the Earth during the last millionyears. If confirmed, the alternative solar activity triggeringwould have a dramatic impact on our understanding of thefactors driving climate in the past.
In proposing this mechanism, Sharma [83] used areconstruction of the geomagnetic field intensity over thepast 200 kyr based on a globally stacked paleointensityrecord derived from deep-sea sediment records [78,79].This was combined with a reconstruction of the globalcosmogenic nuclide production rate obtained from a stackof 10Be deposition rates in deep-sea sediments coveringthe same interval of time [74,75]. Assuming that the 10Berecord contains both the geomagnetic and solar modula-tions, the residual signal between the two stacked curveswas interpreted as the pure solar component. In otherwords, the largest discrepancies between the two recordsare interpreted as reflecting the largest variations in solaractivity. The amplitude of the proposed variations in solaractivity [83] is very large in comparisonwith the estimatesfor the past seven millennia [57].
In this contribution we critically evaluate the uncer-tainties of each of these stacks to obtain a realistic error onthe residual between the stacks of geomagnetic paleoin-tensity [78,79] and cosmogenic radionuclide production[74,75]. One of the main problems in calculating aresidual between such independent stacks arises fromdiscrepancies in the agemodels of the individual sedimentcores. For example, the relatively large differencebetween the stacks between 42 and 30 kyr BP has beenascribed to a difference in the methods used to derive theage models for the deep-sea cores [74,75]. The chronol-ogy used for the cores of the paleointensity stack wasderived using linearly interpolated sedimentation rates

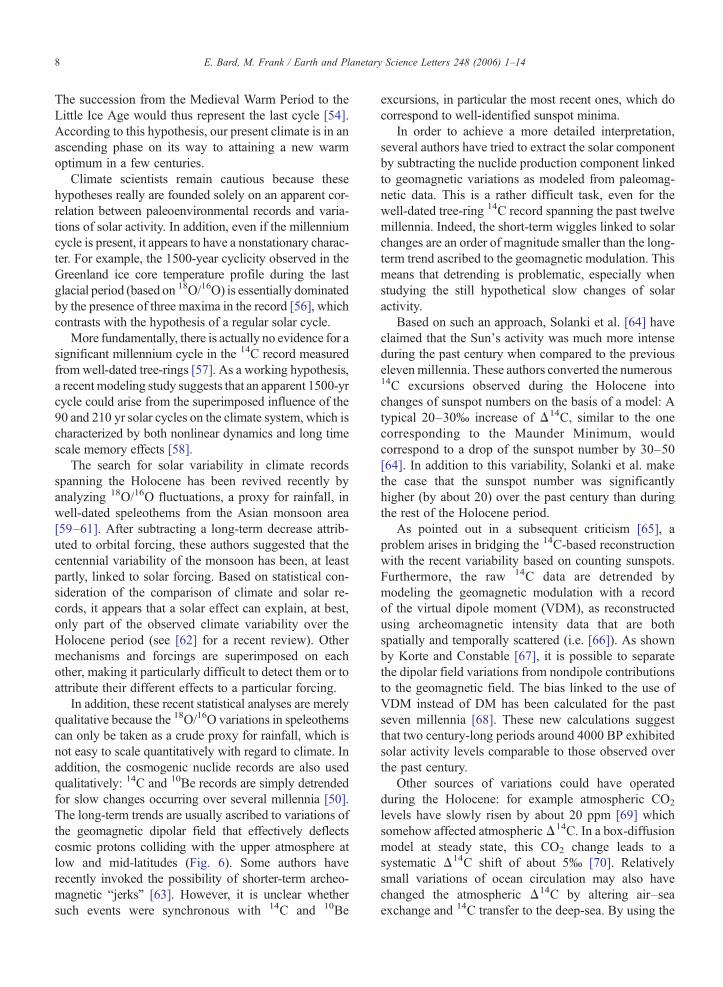
Fig. 7. Comparison of the normalized solar modulation factor (calculatedas in [83]) from different available databases: a) from the Sint geomagneticfield intensity record [79] and the 10Be production record of [75] (i.e. thereconstruction published in [83]), b) from a geomagnetic stack based onNorthAtlantic sediments (NAPIS-75, [80]) and the 10Be production recordof [75], c) from the NAPIS-75 curve [80] and the 10Be production ratesdeduced from a stack of boundary scavenging-corrected 10Be depositionrates [76], d) from the Sint curve [79] and the 10Be production record of[76], e) from the Sint curve [79] and the 36Cl flux record based on theGRIPice core [82], f) from theNAPIS-75 curve [80] and the 36Cl flux fromGRIP[82]. For these calculations, we used the original chronology published foreach of these different records. The grey bars mark periods during whichthe maxima and minima apparently coincide in most records.
10 E. Bard, M. Frank / Earth and Planetary Science Letters 248 (2006) 1–14
between the main Marine Isotope Stages (MIS) identifiedby 18O/16O stratigraphy. By contrast, a 230Th-constantflux method was used for the 10Be stack to derive higherresolution sedimentation rates also between the mainMISderived from 18O/16O stratigraphy. If we introduce only aslight adjustment of the chronologies within the givendating uncertainties for each core, the difference betweenthe stacks from 42 to 30 kyr BP (i.e. the residual signal)completely disappears. A small error in age, for example,around 40 kyr BP, will be expressed as a huge differencein residual signals in cases where the variability in thestacks is large over short intervals of time.
To circumvent this problem, some paleomagneticreconstructions (e.g. [80,81]) are based on the assumptionthat the sharpest minimum of field intensity observed inthe records between 30 and 50 kyr BP should reflect theLaschamp Excursion that occurred around 41 kyr BP.Although realigning the paleomagnetic records has someadvantages, we cannot be sure than an equivalentprocedure would result in a fully compatible chronologywhen applied to 10Be measured in different deep-seacores. To avoid relying on ad hoc assumptions, the bestapproach is clearly to study paleomagnetic properties and10Be fluxes in the very same deep-sea cores. Unfortu-nately, this approach has rarely been adopted [e.g. 77,84],which is the reason why the chronologies of both stacksare not fully compatible.
An even more severe problem (discussed in [75] andalso in [83]) is the presence of a potential residual climaticsignal in the stacked records derived frommarine sedimentcores. Climatic residuals may originate from the fact that10Be is particle-reactive in the ocean, which means thatclimatically driven changes in biogenic or detrital particlefluxes have modulated its flux at particular locations, e.g.[85,86]. Moreover, changes in ocean circulation onglacial/interglacial time scales may have led to redistribu-tion of 10Be by advection. This can influence the averagerecord because core locations included in the stack are notevenly distributed spatially. In the case of the relativepaleointensity records based on magnetic parameters inmarine sediments, the most important problem has beenthe correction for the influence of climatically inducedchanges in lithology of the deposited detrital particles.Magnetization processes in sediments are complex andstill not fully understood. Advanced normalization tech-niques may help in correcting lithological signals (see [87]for a comprehensive overview).
Although great efforts had been made to eliminateclimatic influences in the records of the original studies[74,75,78,79], Kok [88] showed that there still may be asmall but significant residual climate signal in the 10Beproduction record. By contrast, spectral analyses of the
paleointensity stack [79] do not yield frequency maximathat are related to the Milankovich frequencies [88]. It isthus not too surprising that the residual between the twostacks shows frequency maxima related to orbital cycli-cities, which probably originate from the small climaticsignal left in the 10Be-stack.
Therefore, the apparent orbital cyclicity in thecalculated residual is probably not caused by solarmodulation of the 10Be production. In fact, calculatingthe residual between the two records amplifies the smallclimatic (probably orbital) signal. This would explainwhy the variability of solar modulation proposed in [83]is much larger than the variations reconstructed over thepast five millennia.
Several independent reconstructions of past geomag-netic field intensity [78–81] and cosmogenic isotope
11E. Bard, M. Frank / Earth and Planetary Science Letters 248 (2006) 1–14
production [74–77,82] have recently improved ourknowledge of the evolution of both parameters overtime. Different combinations of these records may becompiled to calculate residuals that can be expressed interms of a normalized “solar modulation factor” (ascalculated by [83]). Fig. 7 shows that the general patternof the “solar modulation record” is reproduced by mostof the combinations. Even when all the reconstructionsare combined into one plot (Fig. 8), we are still able torecognize the general pattern (as given by the greyshading picking out all individual records).
However, a closer look reveals some highly significantdiscrepancies: around 31 kyr BP, the values range between0 and 1.7. Similarly, for the period around 45 kyr BP, therange is between 0.9 and 2.9. In addition to the scatteringbetween the residual records, we should take into accountthe statistical errors associated with each of the records ofpast geomagnetic field intensity and cosmogenic isotopeproduction rate. By assuming the propagation of Gaussianerrors, we obtain error bars for the solar modulation factorrecord that are similar to those calculated by the MonteCarlo simulation [83]. This error propagation was appliedto all the other combinations of field intensity and nuclideproduction rate used to reconstruct the solar modulationcurves (Fig. 7). In Fig. 8, the light grey area indicates thecomposite range of uncertainty defined by the errorpropagations of all reconstructions. It is clear that nostatistically significant variation can be resolved.
It should be stressed that error bars calculated for thestacked curves probably underestimate the true size of theuncertainties. Indeed, both Guyodo and Valet [79] and
Fig. 8. Same records as in Fig. 7 but combined on the same graph. Thedark grey area represents the range of all calculations. The light greyarea marks the composite range of uncertainties obtained bypropagating the errors published for each reconstruction. It is clearthat in view of the cumulative uncertainties of the individuallycalculated records, no reliable reconstruction of the solar modulationcan be achieved on the basis of the presently available datasets.
Frank [75] calculated errors as the standard error of themean (the observed scatter between core records dividedby the square root of the number of cores). The bootstraptechnique used in [80,81] to construct their geomagneticstack leads to errors that are even smaller than thosederived by Guyodo and Valet [79]. These statisticalprocedures imply that strict criteria should be satisfied bythe sets of individual curves used to build the stacks. Inreality, the uncertainty ranges are caused by variableerrors in the chronologies of the individual records (i.e.errors on the x-axis) and by several sources of uncertaintyin the approaches used to reconstruct the geomagneticfield intensities and cosmogenic nuclide production rates(i.e. errors on the y-axis). Finally, the overall error rangeswould be even larger if the calculations took into accountuncertainties in the relationships between geomagneticintensity and cosmogenic nuclides ([89] used in [83]; seealso [90,91] for different model calculations).
The above discussion clearly illustrates that, with thecurrently available reconstructions of field intensity andcosmogenic nuclide production over the past 200 kyr, it isnot possible to extract a solar component with the pre-cision required to draw meaningful conclusions. Thisapproach should be viewed as a theoretical possibility, but,before applying it, we need more reliable reconstructionsof past cosmogenic nuclide production and geomagneticfield intensity established over longer time scales.
6. Conclusions
Astrophysical data demonstrate that the Sun has beenvariable in activity and radiative output. Unfortunately,precise data are limited to the satellite era, i.e. after 1978.Looking at the solar variability over this short periodonly provides a small range of solar forcing, e.g. 1‰ ofthe total irradiance over the 11-yr activity cycle.
Conflicting views exist about a multi-decadal trendin irradiance and a possible link between solar activityand cloud cover. Acquiring data over the next solarminimum may contribute to answering both of thesequestions. Moreover, the hypothetical effect of cosmicrays on cloud formation is poorly understood andrequires further research efforts.
Solar records are intrinsically incomplete for periodsprior to the past three decades. Thus models are used torelate various proxies to the climatic forcing of the Sun.Several studies clearly suggest that solar output hasvaried on a time scale longer than the 11-yr sunspotcycle. It appears that solar fluctuations were involved incausing widespread but limited climatic changes, suchas the Little Ice Age (1500–1800 A.D.) that followedthe Medieval Warm Period (900–1400 A.D.).
12 E. Bard, M. Frank / Earth and Planetary Science Letters 248 (2006) 1–14
Beyond the past four centuries of telescopicobservations of the Sun, the main tool for evaluatingsolar activity is provided by cosmogenic nuclides. Theproduction of these isotopes is modulated by themagnetic properties of the solar wind, which can beultimately linked to solar activity. After their formation,cosmogenic isotopes are transported in the atmosphereand the ocean before being buried in various archives.These processes make the interpretation more compli-cated. Nevertheless, studies of cosmogenic isotopesgenerally agree in indicating numerous solar activityminima in the past, with the Sun passing a large part ofits history in calm phases, conceivably with an irradi-ance several ‰ weaker than the present-day value.
Several recent studies have attempted to extract solarchanges over periods of ten thousands [64] to hundredsof thousand years [83]. On such time scales, cosmogenicnuclide production is largely modulated by slow varia-tions of the Earth's magnetic field. The currently avail-able reconstructions of geomagnetic field intensity andcosmogenic nuclide production are still not sufficientlyprecise to extract a meaningful solar component. Toapply this approach, we await more reliable and longerrecords of both cosmogenic nuclide production andgeomagnetic field intensity of the past.
Acknowledgments
We thank J.-P. Valet and an anonymous referee fortheir helpful reviews. J.-J. Motte is acknowledged forthe help in drawing Figs. 3 and 5. Work by E.B. andM.F. is supported by the European Community projectSTOPFEN (HPRN-CT-2002- 0221) and E.B. is alsofunded by the Gary Comer Science and EducationFoundation.
References
[1] J.T. Kiehl, Earth's annual global mean energy budget, Bull. Am.Meteorol. Soc. 78 (2) (1997) 197–208.
[2] C. Pouillet, Mémoire sur la chaleur solaire, sur les pouvoirsrayonnants et absorbants de l'air atmosphérique, et sur latempérature de l'espace, C. R. Acad. Sci. 7 (1838) 24–65.
[3] J.J.D. de Mairan, Traité Physique et Historique de l'AuroreBoréale, Imprimerie Royale, Paris, 1754, pp. 1–570, 1st edition1733, 2nd edition.
[4] R.W. Maunder, A prolonged sunspot minimum, Knowledge 17(106) (1894) 173–176.
[5] J.A. Eddy, The Maunder Minimum. The reign of Louis XIVappears to have been a time of real anomaly in the behavior of thesun, Science 192 (1976) 1189–1202.
[6] F.W. Herschel, Observations tending to investigate the nature ofthe Sun, in order to find the causes or symptoms of its variableemission of light and heat; with remarks on the use that may
possibly be drawn from solar observations, Philos. Trans. R. Soc.Lond. 91 (1801) 265–318.
[7] C. Meldrum, On a periodicity of rainfall in connection with theSun-spot periodicity, Proc. R. Soc. Lond. 21 (1873) 297–308.
[8] N. Lockyer, Solar changes of temperature and variations inrainfall in the region surrounding the Indian Ocean, Science 12(1900) 915–918.
[9] J. Veizer, Celestial climate driver: a perspective from four billionyears of the carbon cycle, Geosc. Can. 32 (2005) 13–28.
[10] J. Lean, J. Beer, R. Bradley, Reconstruction of solar irradiancesince 1610: implications for climate change, Geophys. Res. Lett.22 (1995) 3195–3198.
[11] J. Lean, Living with a variable Sun, Phys. Today 6 (2005) 32–38.[12] J.D. Haigh, The role of stratospheric ozone in modulating the
solar radiative forcing of climate, Nature 370 (1994) 544–546.[13] J.D. Haigh, The effects of solar variability on the Earth's climate,
Philos. Trans. R. Soc. Lond., A 361 (2003) 95–111.[14] D.T. Shindell, G.A. Schmidt, M.E. Mann, D. Rind, A. Waple,
Solar forcing of regional climate change during the Maunderminimum, Science 294 (2001) 2149–2152.
[15] M.A. Palmer, L.J. Gray, M.R. Allen, W.A. Norton, Solar forcingof climate: model results, Adv. Space Res. 34 (2004) 343–348.
[16] R.C. Willson, Total solar irradiance trend during solar cycles 21and 22, Science 277 (1997) 1963–1965.
[17] R.C. Willson, A.V. Mordvinov, Secular total solar irradiancetrend during solar cycles 21–23, Geophys. Res. Lett. 30 (5)(2003) 1–4 (1199).
[18] C. Fröhlich, J. Lean, Solar radiative output and its variability:evidence and mechanisms, Astron. Astrophys. Rev. 12 (4) (2004)273–320.
[19] H. Svensmark, E. Friis-Christensen, Variation of cosmic ray fluxand global cloud coverage — a missing link in solar–climaterelationships, J. Atmos. Sol. –Terr. Phys. 59 (1997) 1225–1232.
[20] H. Svensmark, Influence of cosmic rays on Earth's climate, Phys.Rev. Lett. 81 (1998) 5027–5030.
[21] E.P. Ney, Cosmic radiation and the weather, Nature 183 (1959)451–452.
[22] T.S. Jorgensen, A.W. Hansen. Comments on “Variation ofcosmic ray flux and global cloud coverage — a missing link insolar–climate relationships. by Henrik Svensmark and EigilFriis-Christensen. Journal of Atmospheric and Solar–TerrestrialPhysics 59 (1997) 1225–1232.” Journal of Atmospheric andSolar–Terrestrial Physics 62, (2000), 73–77.
[23] P. Laut, Solar activity and terrestrial climate: an analysis of somepurported correlations, J. Atmos. Sol. –Terr. Phys. 65 (2003)801–812.
[24] P.E. Damon, P. Laut, Pattern of strange errors plagues solaractivity and terrestrial climate data, Eos 85 (39) (2004)370–374.
[25] P.M. Udelhofen, R.D. Cess, Cloud cover variations over theUnited States: an influence of cosmic rays or solar variability?Geophys. Res. Lett. 28 (2001) 2617–2620.
[26] N.D. Marsh, H. Svensmark, Low cloud properties influenced bycosmic rays, Phys. Rev. Lett. 85 (2000) 5004–5007.
[27] F. Yu, Altitude variations of cosmic ray induced productionof aerosols: implications for global cloudiness and climate,J. Geophys. Res. 107 (A7) (2002) 1–10 (1118).
[28] E. Pallé, Possible satellite perspective effects on the reportedcorrelations between solar activity and clouds, Geophys. Res.Lett. 32 (2001) 1–4 (L03802).
[29] K.S. Carslaw, R.G. Harrison, J. Kirkby, Cosmic rays, clouds, andclimate, Science 298 (2002) 1732–1737.
13E. Bard, M. Frank / Earth and Planetary Science Letters 248 (2006) 1–14
[30] D.V. Hoyt, K.H. Schatten, Group sunspot numbers: a new solaractivity reconstruction, Sol. Phys. 179 (1998) 189–219.
[31] G.W. Lockwood, B.A. Skiff, S.L. Baliunas, R.R. Radick, Long-term solar brightness changes estimated from a survey of Sun-like stars, Nature 360 (1992) 653–655.
[32] Q. Zhang, W.H. Soon, S.L. Baliunas, G.W. Lockwood, B.A.Skiff, R.R. Radick, A method of determining possible brightnessvariations of the Sun in past centuries from observations of solar-type stars, Astrophys. J. 427 (1994) L111–L114.
[33] S.K. Solanki, M. Fligge, A reconstruction of total solar irradiancesince 1700, Geophys. Res. Lett. 26 (16) (1999) 2465–2468.
[34] J.L. Lean, Y.M. Wang, N.R. Sheeley, SORCE contributions tonew understanding of global change and solar variability, Sol.Phys. 230 (2005) 27–53.
[35] P.N. Mayaud, The aa indices: a 100-year series characterizing themagnetic activity, J. Geophys. Res. 77 (1972) 6870–6874.
[36] E.W. Cliver, V. Boriakoff, J. Feynman, Solar variability andclimate change: geomagnetic aa index and global surfacetemperature, Geophys. Res. Lett. 25 (7) (1998) 1035–1038.
[37] M. Lockwood, R. Stamper, M.N. Wild, Long-term drift of thecoronal source magnetic flux and the total solar irradiance,Geophys. Res. Lett. 26 (16) (1999) 437–439.
[38] L. Svalgaard, E.W. Cliver, P. Le Sager, IHV: a new long-termgeomagnetic index, Adv. Space Res. 34 (2004) 436–439.
[39] J.-L. Le Mouël, V. Kossobokov, V. Courtillot, On long-termvariations of simple geomagnetic indices and slow changes inmagnetospheric currents: the emergence of anthropogenic globalwarming after 1990? Earth Planet. Sci. Lett. 232 (2005) 273–286.
[40] K. Mursula, D. Martini, A. Karinen, Did open solar magneticfield increase during the last 100 years? A reanalysis of geo-magnetic activity, Sol. Phys. 224 (2004) 85–94.
[41] S.M. Silverman, Secular variation of the Aurora for the past500 years, Rev. Geophys. 30 (4) (1992) 333–351.
[42] D. Lal, B. Peters, Cosmic ray produced radioactivity on theEarth, Handbuch der Physik, XLVI/2, Springer, Berlin, 1967,pp. 551–612.
[43] J. Beer, U. Siegenthaler, G. Bonani, R.C. Finkel, H. Oeschger, M.Suter, W. Wölfli, Information on past solar activity and geo-magnetism from 10Be in the Camp Century ice core, Nature 331(1988) 675–679.
[44] E. Bard, G.M. Raisbeck, F. Yiou, J. Jouzel, Solar modulation ofcosmogenic nuclide production over the last millennium:comparison between 14C and 10Be records, Earth Planet. Sci.Lett. 150 (1997) 453–462.
[45] E. Bard, G. Raisbeck, F. Yiou, J. Jouzel, Solar irradiance duringthe last 1200 years based on cosmogenic nuclides, Tellus, B 52(2000) 985–992.
[46] K.G. McCracken, Geomagnetic and atmospheric effects upon thecosmogenic 10Be observed in polar ice, J. Geophys. Res. 109(2004) 1–17 (A04101).
[47] C.V. Field, G.A. Schmidt, D. Koch, C. Salyk, Modelingproduction and climate-related impacts on 10Be concentrationin ice cores, J. Geophys. Res. (in press).
[48] I.G. Usoskin, M. Schüssler, S.K. Solanki, K. Mursula, Solaractivity, cosmic rays, and Earth's temperature: a millennium-scale comparison, J. Geophys. Res. 110 (2005) 1–10 (A10102).
[49] U. Cubash, R. Voss, G.C. Hegerl, J. Waszkewitz, T.J. Crowley,Simulation of the influence of solar radiation variations on theglobal climate with an ocean–atmosphere general circulationmodel, Clim. Dyn. 13 (1997) 757–767.
[50] P.J. Reimer, M.G.L. Baillie, E. Bard, A. Bayliss, J.W. Beck, C.Bertrand, P.G. Blackwell, C.E. Buck, G.S. Burr, K.B. Cutler, P.E.
Damon, R.L. Edwards, R.G. Fairbanks, M. Friedrich, T.P.Guilderson, A.G. Hog, K.A. Hughen, B. Kromer, G. McCormac,S. Manning, C. Bronk Ramsey, R.W. Reimer, S. Remmele, J.R.Southon,M. Stuiver, S. Talamo, F.W. Taylor, J. van der Plicht, C.E.Weyhenmeyer, INTCAL04 terrestrial radiocarbon age calibration,Radiocarbon 46 (2004) 1029–1058.
[51] F. Yiou, G.M. Raisbeck, S. Baumgartner, J. Beer, C.U. Hammer,S. Johnsen, J. Jouzel, P.W. Kubik, J. Lestringuez, M. Stievenard,M. Suter, P. Yiou, 10Be in the GRIP ice core at Summit, Green-land, J. Geophys. Res. 102 (C12) (1997) 26783–26794.
[52] R.C. Finkel,K.Nishiizumi, 10Be concentrations in theGISP2 ice corefrom 3–40 ka, J. Geophys. Res. 102 (C12) (1997) 26699–26706.
[53] G. Bond, W. Showers, M. Cheseby, R. Lotti, P. Almasi, P.deMenocal, P. Priore, H. Cullen, I. Hajdas, G. Bonani, Apervasive millennial-scale cycle in North Atlantic Holocene andglacial climates, Science 278 (1997) 1257–1266.
[54] G.Bond,B.Kromer, J. Beer, R.Muscheler,M.N.Evans,W.Showers,S. Hoffmann, R. Lotti-Bond, I. Hajdas, G. Bonani, Persistent solarinfluence on north Atlantic climate during the Holocene, Science 294(2001) 2130–2136.
[55] F.S. Hu, D. Kaufman, S. Yoneji, D. Nelson, A. Shemesh, Y. Huang,J. Tian, G. Bond, B. Clegg, T. Brown, Cyclic variation and solarforcing of Holocene climate in the Alaskan subarctic, Science 301(2003) 1890–1893.
[56] M. Schulz, On the 1470-year pacing of Dansgaard–Oeschgerwarm events, Paleoceanography 17 (2) (2002) 1–9.
[57] M. Stuiver, T.F. Braziunas, Sun, ocean, climate and atmospheric14CO2: an evaluation of causal and spectral relationships, TheHolocene 3 (1993) 289–305.
[58] H. Braun, M. Christl, S. Rahmstorf, A. Ganopolski, A. Mangini,C. Kubatzki, K. Roth, B. Kromer, Possible solar origin of the1470-year glacial climate cycle demonstrated in a coupled model,Nature 438 (2005) 208–211.
[59] U. Neff, S.J. Burns, A. Mangini, M. Mudelsee, D. Fleitmann, A.Matter, Strong coherence between solar variability and themonsoon in Oman between 9 and 6 kyr ago, Nature 411 (2001)290–293.
[60] D. Fleitmann, S.J. Burns, M. Mudelsee, U. Neff, U. Kramers,A. Mangini, A. Matter, Holocene forcing of the Indianmonsoon recorded in a stalagmite from Southern Oman,Science 300 (2003) 1737–1739.
[61] Y. Wang, H. Cheng, R.L. Edwards, Y. He, X. Kong, Z. An, J. Wu,M.J. Kelly, C.A. Dykoski, X. Li, The Holocene Asian monsoon:links to solar changes and North Atlantic climate, Science 308(2005) 854–857.
[62] P.A. Mayewski, E.E. Rohling, J.C. Stager, W. Karlen, K.A. Maasch,L.D. Meeker, E.A. Meyerson, F. Gasse, S. van Kreveld,K. Holmgren, J. Lee-Thorp, G. Rosqvist, F. Rack, M. Staubwasser,R.R. Schneider, E.J. Steig, Holocene climate variability, Quat. Res.62 (2004) 243–255.
[63] Y. Gallet, A. Genevey, F. Fluteau, Does Earth's magnetic fieldsecular variation control centennial climate change? Earth Planet.Sci. Lett. 236 (2005) 339–347.
[64] S.K. Solanki, I.G. Usoskin, B. Kromer, M. Schüssler, J. Beer,Unusual activity of the sun during recent decades compared tothe previous 11,000 years, Nature 431 (2004) 1–12.
[65] R. Muscheler, F. Joos, S.A. Müller, I. Snowball. How unusualis today's solar activity? Comment on “Unusual activity of thesun during recent decades compared to the previous 11,000years. by S.K. Solanki, I.G. Usoskin, B. Kromer, M. Schüssler,J. Beer. Nature, 431, (2004), 1084–1087”. Nature, 436, (2005),E3–E5.
14 E. Bard, M. Frank / Earth and Planetary Science Letters 248 (2006) 1–14
[66] S. Yang, H. Odah, J. Shaw, Variations in the geomagnetic dipolemoment over the last 12000 years, Geophys. J. Int. 140 (2000)158–162.
[67] M. Korte, C.G. Constable, Continuous geomagnetic field modelsfor the past 7 millennia: 2. CALS7K, G-cubed 6 (1) (2005) 1–18.
[68] I.G. Usoskin, S.K. Solanki, M. Korte, Solar activity recon-structed over the last 7000 years: the influence of geomagneticfield changes, Geophys. Res. Lett. 33 (2006) 1–4 (L08103).
[69] A. Indermuhle, T.F. Stocker, F. Joos, H. Fischer, H.J. Smith, M.Wahlen, B. Deck, D.Mastroianni, J. Tschumi, T. Blunier, R.Meyer,B. Stauffer, Holocene carbon-cycle dynamics based onCO2 trappedin ice at Taylor Dome, Antarctica, Nature 398 (1999) 121–126.
[70] E. Bard, Geochemical and geophysical implications of theradiocarbon calibration, Geochim. Cosmochim. Acta 62 (1998)2025–2038.
[71] H.E. Suess, Climatic changes, solar activity, and the cosmic-rayproduction rate of natural radiocarbon, Meteorol. Monogr. 8 (30)(1968) 146–150.
[72] J.D. Hays, J. Imbrie, N.J. Shackleton, Variations in the earth'sorbit: pacemaker of the ice ages, Science 194 (1976) 1121–1132.
[73] A.L. Berger, Support for the astronomical theory of climaticchange, Nature 269 (1977) 44–45.
[74] M. Frank, B. Schwarz, S. Baumann, P.W. Kubik, M. Suter,A. Mangini, A 200 kyr record of cosmogenic radionuclideproduction rate and geomagnetic field intensity from Be-10in globally stacked deep-sea sediments, Earth Planet. Sci.Lett. 149 (1997) 121–129.
[75] M. Frank, Comparison of cosmogenic radionuclide productionand geomagnetic field intensity over the last 200000 years,Philos. Trans. R. Soc. Lond. Ser. A: Math. Phys. Sci. 358 (2000)1089–1107.
[76] M. Christl, C. Strobl, A. Mangini, Beryllium-10 in deep-seasediments: a tracer for the Earth's magnetic field intensity duringthe last 200,000 years, Quat. Sci. Rev. 22 (2003) 725–739.
[77] J. Carcaillet, D.L. Bourles, N. Thouveny, M. Arnold, A highresolution authigenic Be-10/Be-9 record of geomagnetic momentvariations over the last 300 ka from sedimentary cores of thePortuguese margin, Earth Planet. Sci. Lett. 219 (2004) 397–412.
[78] Y. Guyodo, J.P. Valet, Relative variations in geomagneticintensity from sedimentary records: the past 200,000 years,Earth Planet. Sci. Lett. 143 (1996) 23–36.
[79] Y. Guyodo, J.P. Valet, Global changes in intensity of the Earth'smagnetic field during the past 800 kyr, Nature 399 (1999)249–252.
[80] C. Laj, C. Kissel, A. Mazaud, J.E.T. Channell, J. Beer, NorthAtlantic palaeointensity stack since 75 ka (NAPIS-75) and theduration of the Laschamp event, Philos. Trans. R. Soc. Lond. Ser.A: Math. Phys. Sci. 358 (2000) 1009–1025.
[81] C. Laj, C. Kissel, A. Mazaud, E. Michel, R. Muscheler, J. Beer,Geomagnetic field intensity, North Atlantic deep water circula-tion and atmospheric Delta C-14 during the last 50 kyr, EarthPlanet. Sci. Lett. 200 (2002) 177–190.
[82] S. Baumgartner, J. Beer, J. Masarik, G. Wagner, L. Meynadier,H.A. Synal, Geomagnetic modulation of the Cl-36 flux in theGRIP ice core, Greenland, Science 279 (1998) 1330–1332.
[83] M. Sharma, Variations in solar magnetic activity during the last200,000 years: is there a Sun–climate connection? Earth Planet.Sci. Lett. 199 (2002) 459–472.
[84] G. Leduc, N. Thouveny, D.L. Bourlès, C.L. Blanchet, J.T.Carcaillet, Authigenic 10Be/9Be signature of the Laschamp ex-cursion: a tool for global synchronisation of paleoclimaticarchives, Earth Planet. Sci. Lett. 245 (2006) 19–28.
[85] R.F.Anderson,Y.Lao,W.S.Broecker, S.E. Trumbore,H.J.Hofmann,W. Wölfli, Boundary scavenging in the Pacific Ocean: a comparisonof 10Be and 231Pa, Earth Planet. Sci. Lett. 96 (1990) 287–304.
[86] M. Frank,R.Gersonde,M.M.Rutgers van der Loeff, G.Bohrmann,C.C. Nürnberg, P.W. Kubik, M. Suter, A. Mangini, Similar glacialand interglacial export bioproductivity in the Atlantic sector of theSouthern Ocean: multiproxy evidence and implications foratmospheric CO2, Paleoceanography 15 (2000) 642–658.
[87] J.-P. Valet, Time variations in geomagnetic intensity, Rev.Geophys. 41 (1) (2003) 1–44 (1004).
[88] Y.S. Kok, Climatic influence in NRM and Be-10-derivedgeomagnetic paleointensity data, Earth Planet. Sci. Lett. 166(1999) 105–119.
[89] J. Masarik, J. Beer, Simulation of particle fluxes and cosmogenicnuclide production in the Earth's atmosphere, J. Geophys. Res.104 (1999) 12099–12111.
[90] D. Lal, Theoretically expected variations in the terrestrialcosmic-ray production rates of isotopes, in: X.C.V. Corso (Ed.),Solar–Terrestrial Relationships and the Earth Environment inthe Last Millennia, Soc. Italiana di Fisica, Bologna Italy, 1988,pp. 216–233.
[91] J. Masarik, R.C. Reedy, Terrestrial cosmogenic-nuclide produc-tion systematics calculated from numerical simulations, EarthPlanet. Sci. Lett. 136 (1995) 381–395.
[92] D.H. Hathaway, R.M. Wilson, E.J. Reichmann, A synthesis ofsolar cycle prediction techniques, J. Geophys. Res. 104 (1999)22375–22388.
[93] M. Dikpati, G. de Toma, P.A. Gilman, Predicting the strength ofsolar cycle 24 using a flux-transport dynamo-based tool,Geophys. Res. Lett. 33 (2006) 1–4 (L05102).
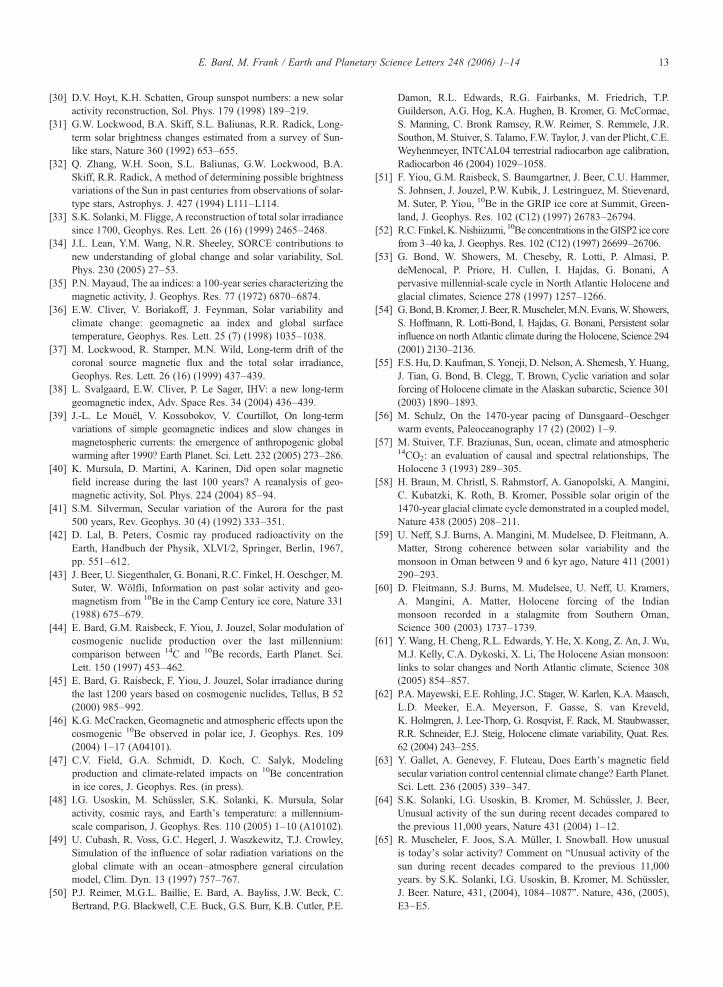
Edouard Bard has the Professor chair of“évolution du climat et de l'océan” at theCollège de France in Paris, while hislaboratory is located in Aix-en-Provence. Heearned a masters degree in 1985 from theNational School of Geological Engineering(Nancy) and his doctoral degree in 1987 fromthe University of Paris XI (Orsay). For hisresearch, he uses several techniques ofanalytical chemistry to determine the extent
and the timing of climatic variations. These are applied to variousarchives such as oceanic sediments, corals, lake sediments, stalagmitesand polar ice.
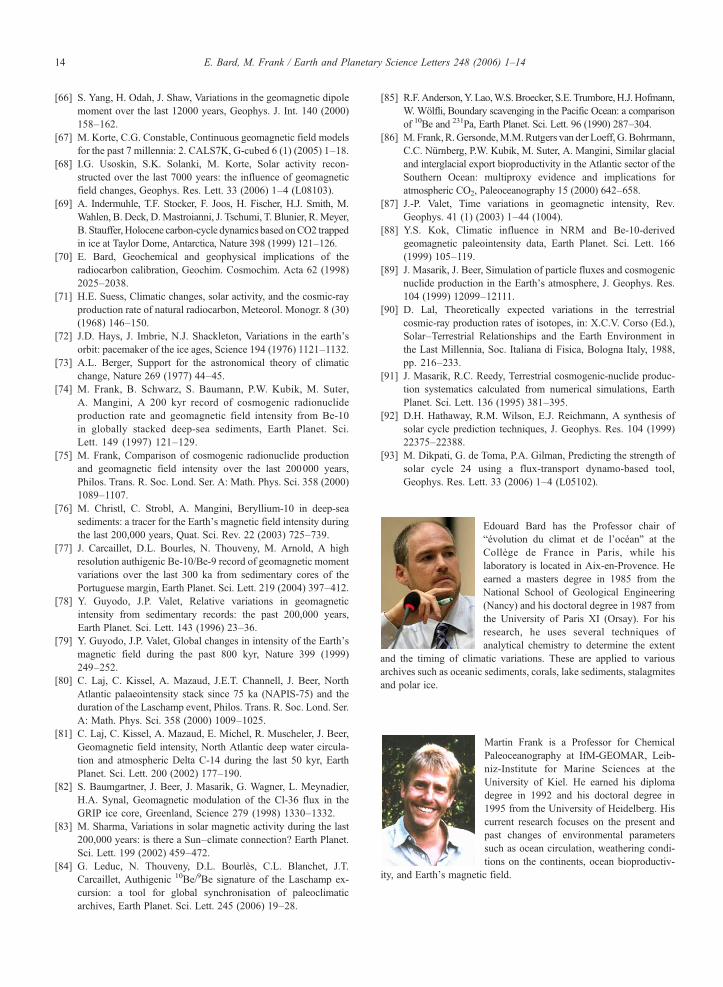
Martin Frank is a Professor for ChemicalPaleoceanography at IfM-GEOMAR, Leib-niz-Institute for Marine Sciences at theUniversity of Kiel. He earned his diplomadegree in 1992 and his doctoral degree in1995 from the University of Heidelberg. Hiscurrent research focuses on the present andpast changes of environmental parameterssuch as ocean circulation, weathering condi-tions on the continents, ocean bioproductiv-
ity, and Earth's magnetic field.