From Molecular Understanding to Innovative Applications of ... · From Molecular Understanding to...
414
Volume II From Molecular Understanding to Innovative Applications of Humic Substances Proceedings of the 14 th International Meeting of the International Humic Substances Society Editors Irina V. Perminova Natalia A. Kulikova September 14-19, 2008 Moscow – Saint Petersburg Russia
Transcript of From Molecular Understanding to Innovative Applications of ... · From Molecular Understanding to...

Volume II
From Molecular Understanding to Innovative Applications
of Humic Substances
Proceedings of the 14th International Meeting
of the International Humic Substances Society
Editors
Irina V. Perminova Natalia A. Kulikova
September 14-19, 2008
Moscow – Saint Petersburg
Russia

Copy of this publication can be ordered at:
Department of Chemistry
Lomonosov Moscow State University
Leninskie Gory 1-3
119992 Moscow
Russia
E-mail: [email protected]
Tel./Fax: +7(495)939-55-46
(Attn: Dr. Irina Perminova)
From Molecular Understanding to Innovative Applications of Humic Substances; Proceedings of the 14th International Meeting of the International Humic
Substances Society, September 14-19, 2008, Moscow – Saint Petersburg, Russia,
Editors: I. V. Perminova, N. A. Kulikova, Vol. II, Humus Sapiens, Moscow, 2008, 414 pp.

iii
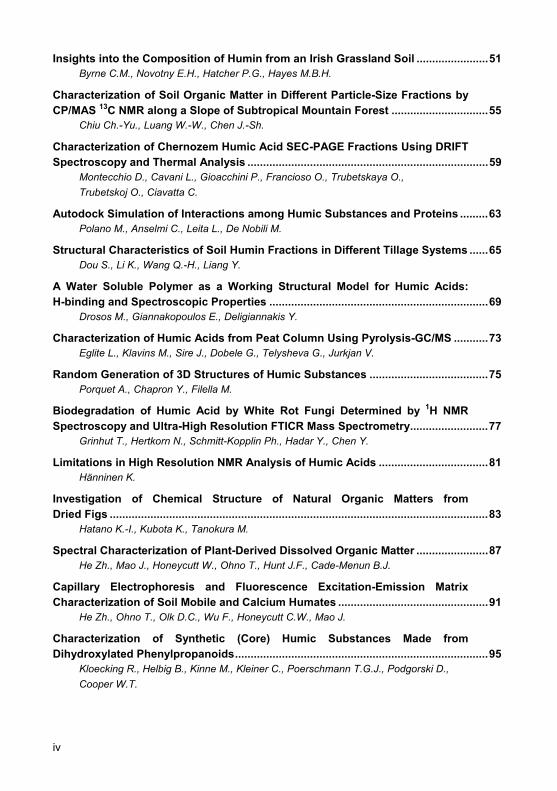
Contents
Volume I
Section I – Novel methods and approaches to molecular understanding of humic substances and natural organic matter
Agent-Based Modeling of Natural Organic Matter ..........................................................3 Cabaniss S.
Probing Local pH in Hydrophobic Domains of Humic Acids: an EPR Based Method................................................................................................................................7
Deligiannakis Y., Christoforidis K., Drosos M. Weiner L.
Study on Self-Assembling Mechanism of IHSS Humic and Fulvic Standards ...........11 Drastík M., tvrtní ková A., Ku erík J.
Multiple Charged Constituents in Suwannee River Natural Organic Matter...............15 Gaspar A., Kunenkov E., Lock R., Desor M., Perminova I., Schmitt-Kopplin Ph.
Depicting Molecular Dissimilarity in Complex Materials..............................................19 Hertkorn N., Frommberger M., Schmitt-Kopplin Ph., Perdue E.M.
Isolation and Characterization of Humic and Fulvic Acids from Thermal Waters as an Unexplored Biogeosystem.......................................................................23
Kovács K., Sajgó C., Brukner-Wein A., Kárpáti Z., Gáspár A., Tombácz E., Schmitt-Kopplin Ph.
Hydrous Pyrolysis of Natural Organic Matter from a Highly Coloured Surface Water.................................................................................................................................27
Allpike B., McDonald S., Joll C., Kagi R.
High Resolution and Hyphenated Analytics as Tools for Exploring Chemical Space of HS and NOM from Various Environments .....................................................31
Schmitt-Kopplin Ph., Hertkorn N., Harir M., Lucio M. Gaspar A., Kanavati B., Fekete A., Gebefuegi I.
X-Ray Spectromicroscopy of Organic Matter in the Environment ..............................35 Thieme J.
Effects of pH, Temperature, and Organic and Inorganic Ions on the Dissolution Kinetics of Humic Acid Particles ...............................................................39
Brigante M., Zanini G., Avena M.
Spectroscopic Evaluation of Charcoal Derived Humic-Like Acid ...............................43 Ferreira E.J.B., Brocchi E.A., Maurício G.M., Nunes R.A., Benites, V.
Properties of Hydration Shell of IHSS Humic Standards .............................................47 Bursáková P., Pr šová A., Ku erík J.
iv
Insights into the Composition of Humin from an Irish Grassland Soil .......................51 Byrne C.M., Novotny E.H., Hatcher P.G., Hayes M.B.H.
Characterization of Soil Organic Matter in Different Particle-Size Fractions by CP/MAS 13C NMR along a Slope of Subtropical Mountain Forest ...............................55
Chiu Ch.-Yu., Luang W.-W., Chen J.-Sh.
Characterization of Chernozem Humic Acid SEC-PAGE Fractions Using DRIFT Spectroscopy and Thermal Analysis .............................................................................59
Montecchio D., Cavani L., Gioacchini P., Francioso O., Trubetskaya O., Trubetskoj O., Ciavatta C.
Autodock Simulation of Interactions among Humic Substances and Proteins .........63 Polano M., Anselmi C., Leita L., De Nobili M.
Structural Characteristics of Soil Humin Fractions in Different Tillage Systems ......65 Dou S., Li K., Wang Q.-H., Liang Y.
A Water Soluble Polymer as a Working Structural Model for Humic Acids: H-binding and Spectroscopic Properties ......................................................................69
Drosos M., Giannakopoulos E., Deligiannakis Y.
Characterization of Humic Acids from Peat Column Using Pyrolysis-GC/MS ...........73 Eglite L., Klavins M., Sire J., Dobele G., Telysheva G., Jurkjan V.
Random Generation of 3D Structures of Humic Substances ......................................75 Porquet A., Chapron Y., Filella M.
Biodegradation of Humic Acid by White Rot Fungi Determined by 1H NMR Spectroscopy and Ultra-High Resolution FTICR Mass Spectrometry.........................77
Grinhut T., Hertkorn N., Schmitt-Kopplin Ph., Hadar Y., Chen Y.
Limitations in High Resolution NMR Analysis of Humic Acids ...................................81 Hänninen K.
Investigation of Chemical Structure of Natural Organic Matters from Dried Figs .........................................................................................................................83
Hatano K.-I., Kubota K., Tanokura M.
Spectral Characterization of Plant-Derived Dissolved Organic Matter .......................87 He Zh., Mao J., Honeycutt W., Ohno T., Hunt J.F., Cade-Menun B.J.
Capillary Electrophoresis and Fluorescence Excitation-Emission Matrix Characterization of Soil Mobile and Calcium Humates ................................................91
He Zh., Ohno T., Olk D.C., Wu F., Honeycutt C.W., Mao J.
Characterization of Synthetic (Core) Humic Substances Made from Dihydroxylated Phenylpropanoids.................................................................................95
Kloecking R., Helbig B., Kinne M., Kleiner C., Poerschmann T.G.J., Podgorski D., Cooper W.T.

v
High Resolution Ultrasonic Spectroscopy as Aid in Study of Complexation of Humic Acids .....................................................................................................................99
Klu áková M., Ku erík J., Peka M., Válková D.
Characterization of Mumijo (Shilajit) from Different Regions by FTICR Mass-Spectrometry..................................................................................................................103
Kononikhin A, Vladimirov G., Kunenkov E., Perminova I., Popov I., Garmash A., Nikolaev E.
Extraction and Characterisation of Humin Fraction from Amazonian Anthropogenic Dark Earths Soils (“Terra Preta de Índios”) ......................................105
Novotny E.H., Hayes M.H.B., Song G., deAzevedo E.R., Bonagamba T.J.
Measuring Soil Amino Compounds by Anion Chromatography-Pulsed Amperometry .................................................................................................................109
Olk D.C., Fortuna A.-M., Honeycutt C.W.
Membrane Processes Applied to the Study of Marine Dissolved Organic Matter ..............................................................................................................................113
Huguet A., Casademont E., Roux-de Balmann H., Ibalot F., Parlanti E.
Studies of the Structure of Extracted Humic Acid from Naharhoran Forest Gorgan’s Soil .................................................................................................................117
Sardashti A.R., Alidoost M.
Application of a Novel Polarity Method for the Analysis of Natural Organic Matter during Water Treatment.....................................................................................121
Rosario-Ortiz F.L., Gerringer F.W., Suffet I.H.
Separation and Isolation of Soil Humic Acid Fluorescence Species by Tandem Ultrafiltration-PAGE.......................................................................................................125
Trubetskaya O.E., Shaloiko L.A., Demin D.V., Richard C., Trubetskoj O.A.
NMR Approaches for Characterization of Soil HA Fractions Obtained by SEC-PAGE ......................................................................................................................129
Trubetskoj O.A., Trubetskaya O.E., Ruhl I.D., Hatcher P.G.
Comparison of Humic Acid and Metal Salt Interactions in Capillary Electrophoresis..............................................................................................................133
Übner M., Kaljurand M., Lopp M.
Comparison of Mumijo (Shilajit) and Humic Acids (HA) Chemical Composition Using FTICR Mass-Spectrometry .................................................................................137
Vladimirov G., Kononikhin A., Kunenkov E., Perminova I., Popov I., Garmash A., Nikolaev E.
Solid Phase Micro Extraction (SPME): A Powerful Tool for Complex Natural Organic Matter Investigation ........................................................................................139
Walter S., Freitag S., Neunlist S., Hadj-Mebarek A., Gabelica Z.
vi
Section II – Natural organic matter and humic substances as markers of climate change and anthropogenic repercussions
Evolution of Soil Humic Substances............................................................................145 Chukov S.
Humus and the Birth of Pedology : Müller, Dokuchaev and Successors .................149 Feller C., Sastriques F.O., Chen Y.
Freshwaters: Do ‘Humics’ Always Represent 50% of NOM? .....................................151 Filella M., Quentel F., Chanudet V.
Atmospheric HULIS: How Humic-Like Are They?.......................................................155 Graber E.R., Rudich Y.
Short Time Humification and Mineralisation of Different Pyrogenic Materials under Controlled Laboratory Conditions.....................................................................159
Hilscher A., Siewert C., Knicker H.
Sedimentary Organic Matter in the Earth System: Origin and Fate ..........................163 Huc A.-Y.
Biological and Molecular Structure Analyses of the Controls on Soil Organic Matter Dynamics ............................................................................................................167
Paul E.A., Magrini K., Conant R., Follett R.F., Morris S.J.
Genesis of Cambisol, Luvisol and Rendzic Leptosol of Samara Forest-Steppe Ridges with Special Reference to Characteristic of Humic Acids.............................171
Abakumov E.V., Fujitake N., Kosaki T.
Paramagnetic Activity of Humic Acids in Soil Chronosequence of Former Sandy Quarry, Leningrad Region, Russia ...................................................................175
Abakumov E., Ryumin A., Chukov S., Kechaikina I.
Global Warming and Effects of Sea-Salts on Dissolved Natural Organic Matter (DNOM) Draining From a Sub-Catchment Upstream Lake Terjevann, Southernmost Norway...................................................................................................177
Andersen D.O.
Characterization of Soil Organic Matter from Flooded Rice Fields Contaminated by Geogenic Arsenic in Bangladesh...................................................181
Breider F., Hassouna M., Pfeifer H.-R., Abraham A., Garnier J.-M.
Soil Organic Matter Chemical and Physical Fractionation: a Comparison on a Developing Soil ..............................................................................................................185
Celi L., Cerli C., Guggenberger G., Kaiser K.
Study on the Role of Microorganism in the Structure of Soil Humic Acid ...............187 Cui J.-T., Dou S., Zhang W., Feng L.-W.
vii
Impact on SOM of an Oxisol after Application of Sewer Effluent Treated by Brazilian Septic Cesspool Biodigester ........................................................................191
da Silva W.T.L, Faustino A.S., Nogueira A.R.A., Simões M.L., Martin-Neto L.
Organic Matter in Oxisol Profiles under Pasture Submitted to Periodic Burning in the Past........................................................................................................195
Dick D.P., Martinazzo R., Mangrich A.S., Pereira B.F., Dalmolin R.S.D., Knicker H.
Chemical and Spectroscopic Characterization of Humic Acids Isolated from Urban Soils.....................................................................................................................199
D’Orazio V., Traversa A., Senesi N.
Effect of Different Fruit Tree Cultivation on Humic Substances and Soil Properties .......................................................................................................................203
Licznar M., Licznar S.E., Drozd J., Weber J.
Long-Term Effects of Wildfires in the Characteristics of Soil Organic Matter: a Study in Mediterranean Shrublands.............................................................................207
Duguy B., Rovira P., Vallejo V.R
Organic Carbon Stocks in Bulgarian Soils..................................................................211 Filcheva E., Koulikov A., Rousseva S.
Use of Lipid Biomarkers in Sediment and Aquatic Systems .....................................215 Fouchard S., Freitag S., Zeller F., Llopiz P., Walter S., Neunlist S.
Thermal Properties in Soil Particle-Size Fractions of Andosols, with Different Land-Use, in the Trans-Mexican Volcanic Range .......................................................219
Covaleda S., Gallardo J.F., García-Oliva F., Prat C., Bravo M., Kirchmann H., González M.I.
Soil Organic Carbon Stocks and Humic Substances in Extremely Acid Soils, Sierra Norte de Oaxaca, México ...................................................................................223
García-Calderón N.E., Galicia-Palacios M.S., Álvarez A.G., Lasso T.A., Krasilnikov P.
Mechanisms of Soil Carbon Storage in Experimental Grasslands ...........................227 Steinbeiss S., Temperton V.M., Gleixner G.
The Content of Humic Substances in Ground Water from Agricultural Area in Opole Region, Poland....................................................................................................231
Glowacki M., Pisarek I.
Espectroscopic Features of Humic Substances in Diagnostic Horizons from Andosols as Seen by FT-IR and 13C CPMAS NMR ......................................................235
González-Pérez J.A., Knicker H., Rodríguez A.R., Arbelo C.D., González-Vázquez R., González-Vila F.J.
Characterization of Humic and Fulvic Acids in Tropical Spodosols by FTIR and Fluorescence Spectroscopy..................................................................................239
González-Pérez M., Vidal-Torrado P., Martin-Neto L., Milori D.M.P.B., Colnago L.A.

viii
Distribution of Water Soluble Organic Nitrogen (WSON) in Acidic Forest Soils, Southwestern China ......................................................................................................243
Guo J., Zhang Yi, Zhang X.
Evolution and NOM........................................................................................................247 Hänninen K.
Long Term Trends of DOC and Colour in Raw Water from a Forest Lake Caused by Increased Precipitation and Changed Precipitation Chemistry..............249
Hongve D., Haaland S., Riise G., Fauskrud S.L.
Role of Aromaticity Degree in the Stability of Humic Substances ............................253 Kislinger J., Novák F., Ku erík J.
Humic Acids Structure as a Reflection of Bioclimatic Factor of Soil Formation in Boreal Ecosystems....................................................................................................257
Klenov B., Almendros G.
Bioluminescent Monitoring of Detoxification Processes...........................................261 Kudryasheva N., Fedorova E., Rozhko T., Alexandrova M., Mogil’naya O., Vydryakova G., Bondareva L., Bolsunovsky A., Stom D.
Humus Substances in Natural and Technogenic Polluted Waters in Priamurje ......265 Levshina S.
Analysis of Pore Water Dissolved Organic Matter by UV-spectroscopy and Spectral Fluorescence Signatures Technology ..........................................................269
Makarõtševa N., Lepane V., Alliksaar T., Tõnno I.
Risk Assessment of Soil Degradation and Possible Soil Recultivation in Mining in Priokhotje Region .........................................................................................273
Makhinova A.F., Makhinov A.N.
Variation in Lipid Relative Abundance and Composition among Different Peat Bog Profiles....................................................................................................................277
Malawska M., M trak M., Wi komirski B.
Characterization of Humic Substances Isolated from Various Peat Bog Profiles............................................................................................................................279
M trak M., Brechowskych-Jaworska N., Malawska M.
Characterization of Soil and Humic Acids Extracted from Native Forest and Oil Shale Industrialization Rehabilitated Areas ................................................................281
Pereira B.F., dos Santos J.V., Mangrich A.S., Pillon C.N.
Diversity of Fractional Composition of Humic Substances and the Content of Total and Availability Forms of Some Metals in Selected Soils of the Opole Region, Poland...............................................................................................................285
Pisarek I., G owacki M.
ix
Characterization of Microbiological Effects on the Composition and Photochemical Properties of DOM in Coastal Sands Using Ultrahigh Resolution Mass Spectrometry and 3-D Excitation/Emission Fluorescence Spectroscopy .................................................................................................................289
Podgorski D., Cooper W.T., Dittmar T., Huettel M., Kostka J.
Reactive Polyphenols and Dissolved Nutrients in a Nitrogen-Limited Headwater Catchment in Western Oregon, USA.........................................................291
Rasmussen J., Lajtha K., Caldwell B.
Density Fractions of SOM in Mediterranean Forest Soils: Characterization by TMAH-Thermochemolysis-GC-MS................................................................................295
Rovira P., Grasset L., Amblès A.
Use of Bioluminescent Assay Systems to Monitor Detoxification Processes in Radionuclide’ Solutions ................................................................................................299
Rozhko T., Kudryasheva N., Alexandrova M., Mogil’naya O., Vydryakova G., Bondareva L., Bolsunovsky A.
Humification of Peat and Characteristics of its Humic Substances Depending on their Origin and Age.................................................................................................303
Š re J., K avi š M.
The Impact of Land Use Conversion on Carbon and Humic Substances.................307 Slepetiene A., Maryganova V., Slepetys J., Liaudanskiene I., Kavoliute F., Kadziuliene Z.
Char and Humin Fractions in Amazonian Dark Earths...............................................311 Song G., Novotny E.H., Hayes M.H.B., de Azêvedo E.R., Bonagamba T.J.
Diverse Microbial Carbon Turnover and Dynamics in Temperate and Tropical Forest Soils ....................................................................................................................315
Throckmorton H.M., Bird J.A., Firestone M.K., Horwath W.R.
The Comparison between Humus Structure of 5 to 1 m Particle-Size Fractions and Fine Clay Fractions in Soils of Locally Hydromorphic Landscapes ....................................................................................................................319
Tischenko S.A., Bezuglova O.S.
Properties of Humic Acids in Forest Soils: Influence of Different Plant Covering .........................................................................................................................323
Traversa A., Said-Pullicino D., D’Orazio V., Gigliotti G., Senesi N.
Fluorescence Spectroscopy of Humic Acids Isolated from Different Litters and Corresponding Underlying Soils...........................................................................327
Traversa A., D’Orazio V., Senesi N.
In Situ Humification and Humics Preservation in Phosphatic Pellets, under Sulfate Reducing Conditions........................................................................................331
Trichet J., Hassen-Trabelsi A.B.

x
Comparison of 13C NMR Spectra of Fulvic Acids from Neighboring Two Clear Water Lakes in Japan ....................................................................................................333
Tsuda K., Aso S., Kodama H., Yonebayashi K., Fujitake N.
Correlation between Optical and Chemical Properties of DNOM ..............................337 Vogt R.D., Gjessing E.T.
Difference between Humic Acids from Soils Derived under Different Tree Species in a Temperate Rain Forest, as Measured with 13C CPMAS-NMR ...............341
Tseng T.-Y., Wang Y.-N., Chiou C.-R., Wang M.-K., Yeh H.-J., Chen T.-H.
Humus Level in Soils of South Kazakhstan Irrigated Massifs ...................................345 Wi komirski B., Ibraeva M., Otarov A., Suska-Malawska M.
The Role of Lichens in Carbon Preservation in Soils of Tundra Zone......................349 Zavarzina A., Knoblauch C., Zavarzin A., Pfeiffer E.-M.
Volume II
Section III – Physical, chemical and biological properties of natural organic matter and humic substances
The Specific UV-Absorbance of Dissolved Organic Matter (DOM) Explains the 5-fold Variation of the Copper Mobilisation by DOM in an Agricultural Soil Horizon ...........................................................................................................................353
Amery F., Degryse F., De Troyer I., Cheyns K., Mertens J., Smolders E.
Strength of Methylmercury Binding by Fulvic Acid and Aquatic NOM.....................357 Brezonik P., Bloom P., Khwaja A.
Organo-Mineral Complexes and Their Effects on the Physico-Chemical Properties of Soils .........................................................................................................361
Chen Y., Tarchitzky J.
Reactive and Refractory Components of Dissolved Organic Matter (DOM) in Peatland Soil Porewaters and their Relation to Climate Change ..............................365
Cooper W., D’Andrilli J., Jones M., Chanton J.
Interactions between Dissolved Organic Matter and Organic Contaminants in Aquatic Environment.....................................................................................................367
De Perre C., Le Ménach K., Ibalot F., Budzinski H., Parlanti E.
Greenhouse Effect and Mitigation by Soil Carbon Sequestration in Tropical Areas: Importance and Characteristics of Humic Substances..................................371
Martin-Neto L., Segnini A., Primavesi O., da Silva W.T.L., Milori D.M.B.P., Simões M.L.
What Is Making up Dissolved Organic Matter in Anthropized Aquatic System? .....375 Pernet-Coudrier B., Pouliquen S., Varrault G., Muresan B., Mouchel J.-M.
Humic Substances in Soils and in Their Drainage Waters.........................................379 Hayes M.H.B., Swift R.S.

xi
Size Exclusion Chromatography Investigation of the Photocatalytic Degradation of Natural Organic Matter ........................................................................383
Tercero Espinoza L.A., ter Haseborg E., Weber M., Karle E., Peschke R., Frimmel F.H.
Interaction between Pentachlorophenol and Soil Organic Matter: Sorption-Desorption Reaction and Hysteresis ...........................................................................387
Xu J., He Y., Wang H., Wu J., Huang P.M.
Modeling Zn Adsorption and Desorption to Soils.......................................................391 Shi Z., Di Toro D.M., Allen H.E., Sparks D.L.
Use of Diffusive Gradient in Thin-Films (DGT) for the in vitro Study of the Effects of Humic Fractions and Metals on the Growth of a Phytopathogenic Fungus............................................................................................................................395
Berloco M., Loffredo E., Mortimer R., Senesi N.
A Relationship of P Chemical Speciation and PZSE in Allophanic Synthetic Surfaces Enriched with Natural Humic Acids from Chilean Andisols ......................399
Canales J., Mora M.L., Aguirre M.J., Gaviño R., Antilén M., Briceño M.
Correspondence Analysis of Microbe Species in the Formation of Humic Acid .....401 Zhang W., Cui J.-T., Dou S., Cao T.-S.
Testing Online Collaboration on Trace Metal-Humic Binding Modelling..................405 Filella M.
Influence of Sorption to Dissolved Humic Substances on Transformation Reactions of Organic Compounds in Water................................................................409
Georgi A., Kopinke F.-D.
Ultrafiltration Behaviour of Nitrophenols in the Presence of Humic Substances.....................................................................................................................411
Ghaemi N., Madaeni S.S., Cudini A., Bertoni A., De Nobili M.
Interaction Selectivity between Lignin and Phenolic Compounds............................413 Barrera Garcia V.D., Bellat J.P., Cayot Ph., Voilley A., Gougeon R.D., Chassagne D.
Experimental Analysis of Sorption of Environmental Chemicals to Model Soil Organic Matter ...............................................................................................................417
Hammer H., Paschke A., Schüürmann G.
Influence of Suwannee River Fulvic Acid on the Speciation and Toxicity of Uranium, Aluminium and Arsenic to Australian Tropical Freshwater Species ........421
Houston M., Ng J., Noller B., Markich S., van Dam R.
Uptake of Humic Substances by Plants: a Study Using Tritium Autoradiography and FTICR MS Analysis ...................................................................425
Kulikova N., Badun G., Kunenkov E., Korobkov V., Tyasto Z., Chernysheva M., Tsvetkova E., Perminova I.

xii
Effect of Humic Substances on Metal Desorption From Sediments under Conditions of Experimental Simulation.......................................................................427
Linnik P., Malinovskaya L., Zubenko I., Zubko A.
Acid-Base Properties of Dissolved Humic Substances in Landscape Waters of the Southern Primorye (Russia) ...................................................................................431
Lutsenko T.N., Bratskaya S.Yu.
Photochemical Reactivity of Australian Floodplain River and Billabong Fulvic Acids upon Exposure to UV-B Radiation.....................................................................435
McDonald S., Prenzler P.D., Bishop A.G., Robards K.
Complexation of Mercury to Dissolved Organic Matter Isolated from an Anthropized Aquatic Ecosystem..................................................................................439
Muresan B., Pernet-Coudrier B., Cossa D., Varrault G.
Development and Validation of Antioxidant Capacity Assessment Protocol for Humic and Humic-Like Substances .............................................................................441
Nikolaev I., Klein O., Kulikova N., Stepanova E., Koroleva O.
Dissolved Organic Matter in Urban Water: a Protective Role to Organisms ............445 Pernet-Coudrier B., Pouliquen S., Muresan B., Varrault G., Galceran J., Tusseau-Vuillemin M.-H., Mouchel J.-M.
Physiological Activity of Humic Substances from Bark Compost ............................449 Popova T., Chakalov K., Savov V., Mitov K., Angelova G.
The Probable Mechanism of Biological Effect of Humic Substances.......................453 Popov A.I.
Chemical and Optical Characteristics of HS Isolated from the South Moravian Soils ................................................................................................................................457
Pospíšilová L., Fasurová N., Jurica L., Pokorný E.
Relationship between Spectral and Photosensitizing Properties in Bulk and Fractionated Humic Substances ..................................................................................461
Richard C., ter Halle A., Guyot G., Trubetskaya O.E., Trubetskoj O.A., Corrado G., Cavani L., Ciavatta C.
Diffusivity of Cu2+ in the Humic Gel .............................................................................465 Sedlá ek P., Klu áková M., Malenovská M.
The Role of Hormonal System in Protection of Wheat Plants Induced by HUMI M........................................................................................................469
Shakirova F., Kusnetsov V., Lubyanova A., Fatkhutdinova R., Bezrukova M., Nurgalieva R.
Effects of Soil Organic Matter Conformation and Substrates Addition on the Fate of Xenobiotics in Soils ..........................................................................................473
Shchegolikhina A., Stumpe B., Marschner B.
xiii
The Influence of Humic Acids on the Phototransformation of Organic Chemical Contaminants in Water.................................................................................477
Sokolova I., Tchaikovskaya O., Mayer G., Yudina N.
Potentiometric and IR Quantification of Metal Binding in Humic Substances.........481 Szpoganicz B., da Silva M.R., Koslova V., Szpoganicz B.P., Martini M., Costa T.G.
A Rapid Batch Procedure for Assessment of Humic Substances and Biodegradable Components of Organic Matter in Natural and Contaminated Materials .........................................................................................................................485
Van Zomeren A., van der Sloot H.A., Comans R.N.J.
Natural Organic Matter in Some Tributaries of the Dnieper River and their Effect on Phytoplankton Growth ..................................................................................489
Vasylchuk T., Klochenko P.
The Influence of Apparent Molecular Size of Aquatic Humic Substances during Coagulation with Ferric Chloride .....................................................................493
Sloboda E., Di Bernardo Dantas A., Di Bernardo L., Vieira E.M.
Influence of Tropical Humic Substances and Copper on the Survival and Reproduction of Tropical Cladocerans (Daphnia similis and Ceriodaphniasilvestrii) .........................................................................................................................497
Barbosa D.S., Vieira E.M., Barbosa D.S., Espíndola E.L.G., Malpass G.R.P.
Buffer Properties of Humic Acids in the System with Phosphate Ions.....................499 Warchulska P., Soko owska Z.
Population of Humic Acid Degrading Microorganisms under Different Soil Types and Vegetation Types ........................................................................................503
Yanagi Y., Yoda K., Ogura K., Fujitake N.
Section IV – Nature- and man-made design of humic materials and their properties
Radiochemical Approach for Studying Properties of Humic Substances................509 Chernysheva M.G., Badun G.A., Perminova I.V., Korobkov V.I., Tyasto Z.A., Belyaeva E.Yu., Kudryavtsev A.V., Tsvetkova E.A., Kulikova N.A.
Oxidative Degradation of Chlorophenol by Iron-Porphyrin Catalyst Bound to Humic Acid via Formaldehyde Polycondensation......................................................513
Fukushima M., Shigematsu S.
Biorefinery Chars as Potential Sources of Soil Humics.............................................517 Hayes D.J.
Synthesis of Alkoxysilylated Humic Derivatives with Different Modification Rate Capable of Self-Adhering to Mineral Surfaces ...................................................521
Karpiouk L.A., Perminova I.V., Ponomarenko S.A., Muzafarov A.M., Hatfield K.

xiv
Hybrid Sorbents on the Basis of Magneto-Active Nanoparticles and Humic Substances.....................................................................................................................525
Zaripova A., Kydralieva K., Dzhardimalieva G., Pomogailo S., Golubeva N., Pomogailo A., Jorobekova S.
Preparation and Characterization of Biodiesel Industry Waste Partially Carbonized Material in Order to Produce an Organic Soil Conditioner ....................529
Mangrich A.S., Novotny E.H., Nicolini K.P., Bonagamba T.J., de Souza A.A., de Azevedo E.R., Wypych F.
Interaction of Modified Humic Substances with Np(V): Influence of Monomer Nature on Redox Properties of Humic Substances ....................................................533
Shcherbina N.S., Perminova I.V., Bolkova A., Kovalenko A.N., Kalmykov S.N., Petrosyan V.S.
Microbial Oxidation of Humic Substances: Agricultural Consequences..................537 Van Trump J.I., Jones N.N., Achenbach L.A., Coates J.D.
TG Study of the -irradiation Effect on PVA with Addition of Sodium and Ammonium Salts of Humic Acids ................................................................................541
Bakajová B., Peka M., Il in M., Ku erík J.
In vivo Algae Growth Monitoring in Sea Water Containing Production Water Treated with Humic Compounds..................................................................................545
Nunes R.A., Mauricio, M.H.P., Mauricio G.M., Brocchi E.A., Araújo M.A.V.
New Mechanochemical and Cavitations Technology and Products Deep Chemical Modification of Peat......................................................................................549
Efanov M., Galochkin A., Chernenko P., Novozhenov V.
Effect of Humic and Fulvic Acids on the Anaerobic Hydrolysis of Lignocellulosic Biomass...............................................................................................553
Fernandes T.V., Sciubidlo I., Sancho N.R., Blazquez A.P., Zeeman G., van Lier J.J.B.
Pyrolysis of Biomass and the Genesis and Oxidations of the Chars .......................557 Jordan M., Kwapinski W., Leahy L., Hayes M.H.B.
Retention of Plutonium on Model Kaolin-Humic Complexes.....................................561 Kholodov V., Novikov A., Goriachenkova T., Kozinskaja I., Perminova I.
Synthesis, Biological Activity and Detoxifying Properties of Carbonylated Humic Substances.........................................................................................................563
Li S., Kydralieva K., Kulikova N., Perminova I., Jorobekova S.
Extraction and Characterization of Organic Fractions Isolated from a China Ball Clay Quarried in Devon South West England......................................................567
McInerney R., Stuart J., Novotny E.H., Hayes M.H.B., Young K.
Efficiency of Lignite as an Antioxidant for Polyolefines ............................................571 Peka M., Bakajová B., Ku erík J.
xv
Mitigating Activity of Humic Substances and Their Si-enriched Derivatives in relation to Wheat Seedlings under Salt-Stress Condition..........................................573
Philippova O.I., Kulikova N.A., Karpiouk L.A., Lebedeva G.F., Perminova I.V.
Evaluation of the Quality Assurance of Ultrafiltration Separation for Humic Substances by Chemical Probes .................................................................................577
Revchuk A.D., Suffet I.H.
Results of a Study on Obtaining of the Humic Containing Plasticizers and Their Influence on the Physic-Mechanical Properties for the Cement and Concrete Mixtures .........................................................................................................581
Sanjaasuren R., Nordov E., Erdenebat Ts., Norjinbadam S.
Humic Substances as Stabilizing Agents for Superparamagnetic Nanoparticles .................................................................................................................585
Chekanova A., Sorkina T., Dubov A., Goodilin E., Kulikova N., Perminova I.
Sorption of Np(V) onto Hybrid Clay-Based Materials: Montmorillonite-Melanoidin ......................................................................................................................587
Vicente Vilas V., de la Rosa S.R., Kratz J.V.
Section V – Industrial production, standardization and innovative application of humic materials
Primary Energy Production by Photoreduced Humic Materials................................593 Van Trump J.I., Coates J.D.
Characterization of Organic and Organomineral Liquid Fertilizers...........................597 Dominguez D.X., Benites V.M., Santa Maria L.C.D., Szpoganicz B., Simões M.L.
Standardization and Legislative Regulations of Commercial Humic and Humic-Based Products .................................................................................................601
Sequi P., Ciavatta C.
A Perspective on over a Decade of On-Farm Research on the Influence of Humates Products on Crop Production.......................................................................603
Seyedbagheri M.-M.
Organogenic Waste Materials as Promising Metal Sorbents.....................................605 Twardowska I., Janta-Koszuta K., Miszczak E., Stefaniak S.
Commercial Humates: The Origin of Organic Matter and Its Environmental Role.................................................................................................................................607
Yakimenko O., Lapenis A., Aranson J.
Greenhouse Experiment on the Effect of Humic Substances on Solubilization of Ogun Phosphate Rock ..............................................................................................609
Adesanwo O.O., Dunlevey J.N., Adetunji M.T., Diatta S., Osiname O., Adesanwo J.K., Kolawole A.

xvi
Structural Components and Biological Activity among Humic Substances of Low-Mineralized Silt Sulphide Muds............................................................................613
Avvakumova N.P., Zhdanova A.V.
Beneficial Effects of the Complex Humic Microfertilizer Applied to the Ornamental Plum Hessei...............................................................................................617
Bezuglova O.S., Perminova I.V., Neganova N.M.
Use of Natural and Modified Materials to Minimize Influence of Sulfide Tailings ....619 Bogush A., Voronin V.
Humic Acids of Brown Coals of the Russia South Far East: Extraction and Complexing Properties toward Gold, Platinum, and Palladium ................................623
Bratskaya S., Volk A., Ivanov V., Sukhoverkhov S., Avramenko V.
Influence of Humics Containing Materials on Poinsettia Hydroponics ....................627 Chakalov K., Popova T., Savov V., Angelova G.
Thermal Analysis of Standard Humic Acids................................................................631 Montecchio D., Francioso O., Gioacchini P., Ciavatta C.
Photoremediation Properties of Dissolved Organic Matter Extracted from Compost .........................................................................................................................635
Coelho C., Ter Halle A., Guyot G., Richard C., Cavani L., Ciavatta C.
Potentials of Technical Lignins for Application as Soil Amendments: Free Radical Scavengers and Biological Activity................................................................639
Dizhbite T., Telysheva G., Bikovens O., Mutere O., Andersone A.
Influence of Selected Conditions on Chemical Properties of Humic Substances Formed during Composting of Municipal Solid Wastes (MSW) ...........643
Bekier J., Drozd J., Jerzykiewicz M.
Effect of Potassium Humate on Advanced Potato Cultivars for Water Deficit Tolerance in Ardabil Region, Iran.................................................................................647
Hassanpanah D., Gurbanov E., Gadimov A., Shahriari R.
Effect of Potassium Humate and Kadostim on Plantlets of Advanced Potato CVs......................................................................................................................651
Hassanpanah D., Gurbanov E., Gadimov A., Shahriari R.
Effect of Potassium Humate on Production of Advanced Potato Mini-Tuber CVs ..............................................................................................................655
Hassanpanah D., Gurbanov E., Gadimov A., Shahriari R.
The Stimulation of Microorganisms Activity of Petropolluted Soils by Humic Preparations...................................................................................................................659
Ivanov A., Maltzeva E., Yudina N., Svarovskaya L.
Coal Biodegradation by Basidiomycetes for Production of Biofertilizers and Soil Conditioners ...........................................................................................................663
Klein O., Stepanova E., Kulikova N., Koroleva O.
xvii
Influence of Humic Substances on the Foam Formation and Cytotoxicity of Detergents ......................................................................................................................667
Kloecking H.-P., Junek R., Kloecking R., Schoenherr J.I.
Effect of Different Physiologically Active Substances in Conditions of Greenhouse Industrial Production...............................................................................671
Komarov A., Karpenco V., Naida N.
Efficacy of Silicious Lignin Products Application for Biological Agriculture Exemplified by Experiments with Red Clovers ...........................................................673
Lebedeva G., Telysheva G., Tiltina L., Volperts A.
Inhibitory Action of New Organic Substrates for Ornamental Plants and Their Humic Fractions on the Growth of the Phytopathogenic Fungus Pythium ultimum...........................................................................................................................677
Loffredo E., Berloco M., Senesi N.
Artificial Humic Substances as Possible Compensators of the Destroyed Links in Carbon Cycle ...................................................................................................681
Nadporozhskaya M., Fedoros E., Shipov V.
Isolation of Humic Substances from Underground Brine Water of Chiba, Southeast Japan ............................................................................................................685
Ken N., Hideki E., Tatsuaki Y.
Biotic Control of Humic Substances Ecotoxicity and Their Remediation Effect in Contaminated Environment......................................................................................687
Terekhova V., Poputnikova T., Fedoseeva E., Rakhleeva A., Vavilova V., Kaniskin M., Timofeev M., Ibatullina I., Yakovlev A.
Extraction and Exchange Behavior of Metal Species in Therapeutically Applied Peat Characterized by Competitive Extractants ...........................................691
Romão L.P.C., Rosa A.H., Silva Â.A.M.J., Lobo F.A., Goveia D., Fraceto L.F., Rocha J.C., Burba P.
Study of the Parameters that Influence on the Process of Alkaline Extraction of Humic Substances from Peat...................................................................................695
Silva Â.A.M.J., Rosa A.H., Duarte J.G.C., Moretti J.P., Lobo F.A., Goveia D., Fraceto L.F., Rocha J.C., Romão L.P.C.
Evaluation of Tropical Peat as a Potential Medium for Bioremediation of Vanadium........................................................................................................................699
Cunha B.B., de Jesus A.M.D., Bellin I.C., Romão L.P.C., Rosa A.H.
Influence of Soybean Chelates on Chemical and Biochemical Properties of Humic Substances from Biotransformed Lignite .......................................................703
Savov V., Mitov K., Chakalov K., Popova T., Angelova G.
In Vitro Effect of Potassium Humate on Terminal Drought Tolerant Bread Wheat..............................................................................................................................707
Shahriari R., Gurbanov E., Gadimov A., Hassanpanah D.

xviii
The Effect of Bioaugmentation on the PCP Degradation in Soil Amended with Humic Acids ...................................................................................................................711
Skokanová M., Dercová K.
Application of White Rot Fungi for the Removal of Natural Organic Matter.............715 Solarska S., Roddick F., Lawrie A.
Synthesis and Use of Iron Humates for Correction of Iron Deficiency Chlorosis in Higher Plants ............................................................................................719
Sorkina T.A., Kulikova N.A., Necvetay A.M., Philippova O.I., Lebedeva G.F., Perminova I.V.
Use of Soil Microorganisms for Producing Standard Samples of Humic Acids ......721 Stepanov A., Zviagyntsev D., Lisak L., Shapovalov A., Putsykin Yu.
Metabolic and Immune-Modulating Properties of Commercial Humic Preparations Produced from Peat................................................................................723
Stepchenko L., Mihailenko E.
Chemical and Plant Growth Stimulatory Properties of Lignohumate .......................725 Yakimenko O., Gladkov O., Poloskin R.
New Express Technique for Determination of Antioxidant Activity of Humic Substances.....................................................................................................................727
Yashin A.Ya., Fedin P.A., Perminova I.V.
The Metal Ions Sorption by the Humic-Containing Anion Exchangers.....................729 Mitchenko A., Mitchenko T., Makarova N., Shevchuk H.
Humic Acids of Pelosilt (Sapropel) as Prospective Biogenic Stimulators for Medicine and Cosmetology Use .............................................................................733
Puntus F. A., Puntus A. F.
Author Index...................................................................................................................737

Section III
Physical, chemical and biological properties of natural organic matter and humic substances


The Specific UV-Absorbance of Dissolved Organic Matter (DOM) Explains the 5-fold Variation of the Copper Mobilisation by DOM in an Agricultural Soil Horizon
Fien Amery, Fien Degryse, Inne De Troyer, Karlien Cheyns, Jan Mertens, Erik Smolders Division Soil and Water Management, Department Land Management and Economics,
K.U.Leuven, Kasteelpark Arenberg 20, 3001 Heverlee, Belgium, [email protected]
Keywords: dissolved organic matter (DOM, DOC), specific UV-absorbance (SUVA), Cu mobility,
WHAM, modelling, Cu affinity, complexation
1. INTRODUCTION
In soil column studies, increased Cu mobility is shown with increasing dissolved
organic carbon (DOC) concentration (1). The variation of DOM composition likely
influences the Cu affinity of DOM. A method was developed to measure the Cu-mobilizing-
potential of isolated DOM (CuMP, mmol Cu/kg DOC) based on the Cu binding to DOM at
defined environmentally relevant conditions, i.e. pH = 7, a solution Cu2+ activity = 5 10-12 M
and soluble Ca= 1.5 mM (2). In the lab, we showed that the CuMP of DOM in soil solutions
varied tenfold depending on incubation and extraction procedure. A positive significant
correlation between the DOM specific UV-absorbance at 254 nm (SUVA) and CuMP was
found, suggesting a relationship between aromaticity and Cu affinity of DOM in soil
solutions. Here, we investigated if a similar variation and correlation is found in the field by
analyzing leachates sampled in an agricultural field during five months. It was verified if the
varying Cu mobilization by DOM could be predicted by the speciation program WHAM6,
and if information on the DOM quality (SUVA) could improve this prediction.
2. MATERIALS AND METHODS
A field experiment was set up at an uncontaminated agricultural field (luvisol) in
Belgium in 2006. On both sides of an 18 m long, 2 m wide and 2.5 m deep trench, 4 small
experimental plots (4 m x 4 m) were located. Under each of the 8 plots, 2 passive capillary
wick samplers (PCAPS) (3) with each 3 fiberglass wicks were horizontally installed at 45
cm depth. By creating suction using a hanging water column inside the fiberglass wick
(100 cm), each wick sampled leachate water from the soil above their wick compartment
(900 cm²). Prior to use, the wicks were combusted in a muffle oven (400 °C) for 4 hours to
remove organic impurities (4). Preliminary experiments showed that Cu and DOM were not
retarded on the wicks. The leachates of wick 1 and 2 of the 16 PCAPS were sampled
353

approximately every two weeks between 22 November 2006 and 7 March 2007, resulting
in 250 collected leachates with a volume larger than 10 mL. Cation, anion and DOC
concentrations and SUVA (L/(g.cm)) were measured in the leachates.
The solution Cu concentrations in the 250 leachate samples were predicted with the
assemblage model WHAM6 (6.0.13, Natural Environment Research Council) which
includes WHAM model VI (5) for Cu binding to organic matter (particulate and dissolved),
a surface complexation model for sorption on iron oxides and an ion exchange model for
sorption on clay minerals. The input was the measured ion concentrations in the leachates
(Na, Mg, Ca, K, Ni, Zn, Cl-, NO3-, SO4
2-), the free ion activity of Al and Fe calculated by the
ion activity product of Al and Fe hydroxide and the following properties of the soil adjacent
to the wick sampled (36-47 cm depth): pH, total Cu, % organic matter, % clay, % Fe, Mn
and Al oxide. The total Cu concentration was multiplied by 0.30, this is the labile Cu
fraction measured in the top soil. Fulvic acid (FA) was entered as the measured DOC
concentration, multiplied by a factor 2, based on the assumption that 50% of the DOM is
carbon, and multiplied by a factor 0.65, i.e. assuming that the fraction of DOM active as
fulvic acids (%AFA) is 65% (6). The particulate humic acid concentration (HA) was entered
as the difference between the total carbon concentration and the CaCO3 concentration,
multiplied by a factor 2 based on the assumption that 50% of humic acid is carbon.
3. RESULTS AND DISCUSSION
During the 5 month period, approximately 1.1 pore volumes percolated through the
soil above the PCAPS. Copper concentrations in the leachates varied 7-fold with a median
of 0.076 µM (range 0.030-0.195 µM). Concentrations of DOC ranged from 3.1 to 22.9
mg/L. A positive significant correlation (p<0.0001) was found between the Cu and DOC
concentrations in the leachates, however the pearson correlation coefficient was rather low
(r=0.56; Figure 1a). The [Cu]:[DOC] ratio varied about fivefold and increased with
decreasing DOC concentration. The [Cu]:[DOC] ratio exhibited a positive significant
correlation with the SUVA of DOM (r=0.77, p<0.0001; Figure 1b). This suggests an
important role of the DOM quality, i.e. the aromaticity, on the Cu mobility of the DOM in the
leachates of the agricultural soil.
Assuming %AFA to be 65%, the predicted free Cu2+ activity ranges 7.2 10-12-1.4 10-11
M in the 250 leachates. Copper concentrations in the leachates are predicted to vary from
0.027 to 0.205 µM, which is in agreement with the measured values. However the
predicted [Cu]:[DOC] ratio is almost constant (8.1 to 9.3 mmol Cu/kg DOC) and contrasts
the 5-fold range of observed values (Figure 2a).
354

(a)
0.00
0.05
0.10
0.15
0.20
0 5 10 15 20 25
[DOC] (mg/L)
[Cu]
(µM
)
(b)
0
5
10
15
20
25
0 20 40 60
SUVA (L/(g.cm))
[Cu]
/[DO
C] (
mm
ol/k
g D
OC
)
Figure 1 (a) The Cu concentrations in leachates of an agricultural soils are explained by
DOC concentrations, however the correlation is weak; (b) the SUVA of the DOM explains
the Cu:DOC concentration ratio in the leachates.
The importance of the quality of DOM for the prediction of the Cu mobilization by
DOM can be introduced by relating the fraction of DOM active as fulvic acids (%AFA) to
the SUVA of DOM, instead of assuming a constant value of %AFA=65%:
%100% ⋅=FA
DOM
SUVASUVAAFA (1)
with SUVADOM the SUVA (L/(g.cm)) of DOM measured in the leachates. The SUVAFA is the
SUVA of FA with default properties as in Model VI, and is fitted by minimizing the sum of
the squares of the difference between the predicted and measured [Cu]:[DOC] ratios in the
250 leachates. The best fit is found for SUVAFA = 38 L/(g.cm). This is a reasonable value
as 37 L/(g.cm) is the measured SUVA of Suwannee River Fulvic Acid, a fulvic acid isolated
by the International Humic Substances Society (IHSS) and used among others to
determine the default parameters of FA in Model VI (5). The average predicted free Cu2+
activity is 9.2 10-12 M, the predicted Cu concentrations range from 0.036 to 0.216 µM. The
variation in the predicted [Cu]:[DOC] ratio (from 4.6 to 16.3 mmol Cu/kg DOC) is much
larger compared to the approach where SUVA was not taken into account (Figure 2b).
4. CONCLUSIONS
Speciation models are a useful tool to predict Cu complexation and mobility in soils,
but lack parameters to take the varying DOM quality in soils into account. At a constant
conversion of DOC to active fulvic acid, the WHAM model predicted an almost constant
[Cu]:[DOC] ratio in leachates monitored during 5 months in an agricultural field. This
355

contrasts the 5-fold variation of the measured [Cu]:[DOC] ratio. That ratio exhibited a
positive significant correlation with the SUVA of DOM. Introducing this measure for
aromaticity in the model to estimate Cu mobility, increases the predictive capacity of the
model.
(a)
0
5
10
15
20
25
0 5 10 15 20 25
[Cu]/[DOC] measured
[Cu]
/[DO
C] p
redi
cted
(b)
0
5
10
15
20
25
0 5 10 15 20 25
[Cu]/[DOC] measured
[Cu]
/[DO
C] p
redi
cted
Figure 2. The [Cu]:[DOC] ratio (mmol Cu/kg DOC) predicted with WHAM6 versus the
[Cu]:[DOC] ratio measured in the 250 leachates. (a) Under the assumption of constant
DOM properties, with %AFA = 65%; (b) DOM quality based on SUVA as calculated by
equation (1), with SUVAFA = 38 L/(g.cm).
ACKNOWLEDGEMENTS
This research was funded by the Onderzoeksfonds K.U.Leuven under the project
number GOA/2006/07-TBA, and was supported by the fund for Scientific Research-
Flanders (F.W.O.) through a doctoral fellowship awarded to F. Amery.
REFERENCES
1. Temminghoff, E.J.M., Van Der Zee, S.E.A.T.M., De Haan, F.A.M. 1998. Eur. J. Soil Sci. 49,
617-628.
2. Amery, F., Degryse, F., Degeling, W., Smolders, E., Merckx, R. 2007. Environ. Sci. Technol.
41, 2277-2281.
3. Brown, K.W., Thomas J.C., Holder, M.W. 1986. Environmental Monitoring System Laboratory,
United States, Environmental Protection Agency, Las Vegas.
4. Knutson, J.H., Selker, J.S. 1994. Sci. Soc. Am. J. 58, 721-729
5. Tipping, E. 1998. Aquat. Geochem. 4, 3-48.
6. Weng, L., Temminghoff, E.J.M, Lofts, S., Tipping, E., Van Riemsdijk, W.H. 2002. Environ. Sci.
Technol. 36: 4804-4810.
356

Strength of Methylmercury Binding by Fulvic Acid and Aquatic NOM
Patrick Brezonik1, Paul Bloom2, Abdul Khwaja3 1Department of Civil Engineering, University of Minnesota, Minneapolis, MN 55455 USA,
[email protected] 2Department of Soil, Water and Climate, University of Minnesota, St. Paul, MN 55108 USA,
[email protected] 3GE Infrastructure Water & Process Technologies, Trevose, PA
Keywords: methylmercury, humic matter, NOM, stability constants, reduced sulfur
1. INTRODUCTION
Methylmercury (MeHg), a neurotoxin that bioaccumulates in organisms, is formed in
natural waters by sulfate-reducing bacteria. Uptake by and bioavailability of MeHg to
aquatic organisms are influenced by natural organic matter (NOM), a heterogeneous
mixture of macromolecules. Abiotic transformations of MeHg, e.g., demethylation, also are
influenced by NOM, and transport of MeHg through watersheds often is correlated with
dissolved organic carbon concentrations.
MeHg is a soft Lewis acid, and according to Pearson’s Soft-Hard Acid Base theory, it
should complex strongly with reduced sulfur ligands. Xia et al. (1) used x-ray absorption
near-edge structure spectroscopy (XANES) to show that up to 50% of the total S in aquatic
and soil humic matter is in chemically reduced forms (Sre): thiols (RSH), thioethers (RSR)
and disulfides (RSSR). Qian et al. (2) and Yoon et al. (3) used extended x-ray absorption
fine structure spectroscopy (EXAFS) to show that reduced S in soil and aquatic organic
matter forms complexes with MeHg. NOM forms strong complexes with MeHg, and
researchers have reported high values of binding constants of MeHg with NOM. Here we
used a competitive-ligand, equilibrium-dialysis technique with Br- as the competitive ligand
to measure binding strengths of methylmercuric ion (MeHg+) with Suwannee River fulvic
acid and extracts of dissolved NOM from a Minnesota bog and lake.
2. MATERIALS AND METHODS
IHSS Suwannee River fulvic acid, IR101-F (IHSS SRFA) was purchased from
International Humic Substance Society (IHSS), St. Paul, MN, USA. Water samples were
collected in acid-cleaned carboys from an acidic bog (wetland S2) and a small, moderately
colored seepage lake (Spring Lake) in the Marcell Experimental Forest (Itasca County,
Minnesota) and stored at 4°C. DEAE-cellulose, a hydrophilic weak anion exchanger (4),
357
was used to extract aquatic humic matter. Filtered bog and lake water (0.2-0.6 μm
Millipore AP15 glass fiber membranes) was passed through Whatman DEAE-cellulose
columns; material retained on the column was eluted with 0.1 M NaOH, passed through an
H+ Amberlite strong-acid exchange column, and freeze-dried.
Inorganic content of water and NOM was determined by ion chromatography for Cl-,
SO42-, NO3-, and ICP emission spectrometry for Na, K, Mg, Ca. Total carbon in dry
samples was determined on a Carlo Erba CNS combustion analyzer. Lake NOM samples
were analyzed for total S Huffman laboratories (Golden, CO). S2 NOM had 21.3% ash,
30.9% C and 0.37% S. Spring Lake NOM had 5.8% ash, 45.2% C and 1.84% S. IHSS
SRFA has 1.0% ash, 53.0% C and 0.47% S. Dissolved organic carbon (DOC) was
determined using U.S. EPA method 415.1 with UV-persulfate oxidation on a Tekmar
Dorhman Phoenix 8000 TOC analyzer. A pH meter calibrated with standard buffers (pH
4.0, 7.0, 10.0) was used to measure pH. MeHg was determined using a Tekran model
2500 cold vapor atomic fluorescence spectrometer (CVAFS) for total Hg after distillation to
separate MeHg (5). Visual MINTEQ (6) was used to calculate free MeHg+ using input data
of MeHg bound to Br-, free Br-, K+ and Na+ concentrations and pH.
Experiments were conducted to determine effects of KBr concentration, Hg:Sre molar
ratio and pH on MeHg binding constants with IHSS SRFA. A dialysis membrane method
and competitive ligand exchange technique with Br- as the competitive ligand was used to
determine binding constants. Spectra/Por cellulose-ester membranes (nominal pore size
100 mol. wt. cut-off, Spectrum Lab., Rancho Dominguez, CA) were used in dialysis
separations. Prior to experiments, membranes were soaked in ultra-pure water for 72 h to
remove NaN3 preservative. Experiments were conducted in the dark. MeHg recoveries
were performed; only results with > 80% recovery, are reported. QC procedures included
use of acid-cleaned glassware, clean-room techniques, and mass balance checks. A small
amount of DOC leakage from the membranes was observed and corrected for in the
binding constant calculations.
3. RESULTS AND DISCUSSIONS
Calculated values of distribution coefficients (Koc) and stability constants (K) varied
only slightly over a broad range of (i) Br- concentrations and (ii) ratios of MeHg to reduced
sulfur, Sre, (the putative binding site for MeHg+) in the NOM. For example, at pH 3.0, Koc
ranged from 107.9 to 108.1 and K from 1015.8 to 1016.0 over MeHg:Sre ratios of 1:1220 to
1:12200 (all below the saturation limit of Sre). The importance of pH on binding constants
depended on the model used to calculate binding constants. Over the pH range 2.98-7.62,
358

distribution coefficients showed little pH dependence (slope = 0.2; r2 = 0.4; range of Koc =
107.7-109.1), but stability constants calculated using thiol (RSH) groups with pKa = 9.96 as
ligands had a strong inverse relationship with pH (slope = -0.8; r2 = 0.9; range of K =
1015.6-1012.3). in contrast, a “pH-independent” model with thioethers or disulfides as binding
sites yielded a range of K of 108.6-1010.2 with a small slope of 0.2 (r2 = 0.4) over the same
pH range.
The above values are similar to values for MeHg+ binding by NOM reported by
others. Hintelmann et al. (7) reported constants in the range 1013.02-1014.56 for a “strong
site” and 1012.15-1013.07 for a “weak site” at pH 6.5 using equilibrium dialysis and Scatchard
analysis. Amirbahman et al. (8) used a discrete log-K spectrum approach to model data
from experiments with 500-MWCO equilibrium-dialysis membranes and obtained
constants in the range 1010.39-1010.54 for the weakest site, 1012.39-1014.77 for a mid-strength
site and 1014.47-1014.84 for the strongest site for IHSS SRHA, IHSS Peat HA and a stream
HA from Maine. Karlsson and Skyllberg (9) used a competitive ligand-exchange technique
with halides (Cl-, Br- I-) to determine binding constants of MeHg with soils and reported
binding constants decreasing from K = 1017.2 at pH 2.0 to K = 1015.6 at pH 5.0.
A review of stability constants reported in the literature for MeHg with various ligands
showed that inorganic ligands like Cl-, OH-, and Br- do not bind as strongly with MeHg as
inorganic and organic sulfur-containing ligands, especially at the low concentrations of
these ligands typically found in natural systems. The stability constants for MeHg-NOM
that we found are somewhat lower than stability constants of thiol-containing compounds
like cysteine (1016.5) and mercaptoacetic acid (1016.9).
It is apparent from the comparison of previous studies on binding constants of MeHg
with NOM that the values depend not only on the type of NOM and MeHg:Sre ratios, but
also on the calculation model used to estimate them. Most recent studies have used thiol-
based models, but both two- or three-site models have been used with pKa values ranging
from 4 to 10. These approaches have produced constants in the range 1010.39 for weak
sites to 1017.2 for strong sites. There is a growing consensus (based on spectroscopic
evidence from Hg-EXAFS) that reduced S sites are the predominant MeHg binding sites in
NOM under ambient conditions (low MeHg:Sre ratios). However, the choice of pKa values
of the RSH groups and the number of weak and strong binding sites is based on model
fitting. Despite the lack of molecular-level understanding of the exact binding site (thiol,
disulfane, thioether or disulfide linkages), which can introduce large challenges in trying to
account for the different binding constants reported in the literature, there is substantial
consistency in stability constants values reported in literature and those calculated by us.
359
Slight differences in the magnitudes exist because of different methodologies, different pH
and different types of NOM.
REFERENCES
1. Xia, K.; Weesner, F.; Bleam, W. F.; Bloom, P. R.; Skyllberg, U. L.; Helmke, P. A. Soil Sci. Soc.
Amer. J. 1998, 62, 1240-1246.
2. Qian, J.; Skyllberg, U. L.; Frech, W.; Bleam; W. F.; Bloom, P. R.; Petit, P. E. Geochim.
Cosmochim Acta 2002, 66, 3873-3885.
3. Yoon, S-J, L.M. Diener, P.R. Bloom, E.A. Nater, and W.F. Bleam. 2005. Geochim.
Cosmochim. Acta, 69:1111-1121.
4. Miles, C. J.; Tuschall, Jr., J. R.; Brezonik, P. L. Anal. Chem. 1983, 55, 410�411.
5. Bloom, N. S. Can. J. Fish. Aquat. Sci. 1989, 46, 1131-1139.
6. Visual MINTEQ. Visual MINTEQ, Ver. 2.1, www.lwr.kth.se/English/OurSoftware/vminteq,
2002.
7. Hintelmann, H.; Welbourne, P. M.; Evans, R. D. Water, Air Soil Pollut. 1995, 80, 1031-1034.
8. Hintelmann, H.; Welbourn, P. M.; Evans, D. R. Environ. Sci. Technol. 1997, 31, 489-495.
9. Karlsson, T.; Skyllberg, U. L. Environ. Sci. Technol. 2003, 37, 4912-4918.
360

Organo-Mineral Complexes and Their Effects on the Physico-Chemical Properties of Soils
Yona Chen, Jorge Tarchitzky Dept. of Soil and Water Sciences, Faculty of Agricultural, Food and Environmental Quality
Sciences, The Hebrew University of Jerusalem, P.O. Box 12, Rehovot 76100, Israel,
Keywords: soil structure, humic substances, clay minerals, humic molecule, aggregates, SOM
1. INTRODUCTION
Most arable soils contain 0.1 to 5% organic matter (OM) by weight. The lower end of
this range represent sandy soils of arid zones, whereas the higher values are typical of
clayey soils in temperate zones. All soils are physically and chemically influenced by the
OM which they contain. In addition to the nutritional value of OM, it plays a critical role in
the formation and stabilization of soil structure, which in turn produces desired tilth and
drainage rates as well as resistance to erosion.
Soil mineral particles usually aggregate into granular structures. The stability of soil
aggregates (or micro-aggregates – the small particle size fraction of the aggregates – see
below) is an important indicator of soil quality due to their significance in the determination
of soil porosity and hydraulic conductivity. The degree to which soil is organized into water-
stable aggregates influences many of the agricultural and ecosystem properties of soils
(4). Cropping systems or soil management that promote SOM accumulation (e.g. no-till)
also promote soil aggregation. A number of soil properties contribute to the formation and
stabilization of aggregates including: SOM, clay mineralogy, soil texture, exchangeable
cations and salt content, CaCO3 content, and Fe and Al oxides.
The scope of this presentation is limited to a thorough examination of clay-organic
complexes and their function in soil structure formation.
2. MATERIAL AND METHODS
Due to the important role of humic substance (HS) in aggregate formation and
dispersion in soils, an effort was made in the first stage of this study to suggest a model
formula for a humic acid (HA) based on average values of the following: (i) elemental
analysis including C/N ratios; (ii) functional groups concentrations; (iii) 13C-NMR data on
their contents of: aliphaticity, aromaticity, carbohydrate, carboxy, methoxy, keton, phenolic
and other groups. With the input of the data listed above and the use of the
361
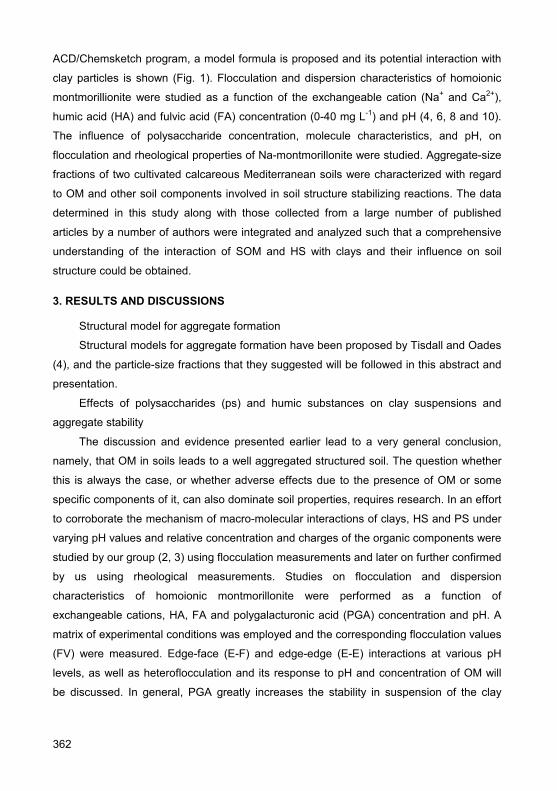
ACD/Chemsketch program, a model formula is proposed and its potential interaction with
clay particles is shown (Fig. 1). Flocculation and dispersion characteristics of homoionic
montmorillionite were studied as a function of the exchangeable cation (Na+ and Ca2+),
humic acid (HA) and fulvic acid (FA) concentration (0-40 mg L-1) and pH (4, 6, 8 and 10).
The influence of polysaccharide concentration, molecule characteristics, and pH, on
flocculation and rheological properties of Na-montmorillonite were studied. Aggregate-size
fractions of two cultivated calcareous Mediterranean soils were characterized with regard
to OM and other soil components involved in soil structure stabilizing reactions. The data
determined in this study along with those collected from a large number of published
articles by a number of authors were integrated and analyzed such that a comprehensive
understanding of the interaction of SOM and HS with clays and their influence on soil
structure could be obtained.
3. RESULTS AND DISCUSSIONS
Structural model for aggregate formation
Structural models for aggregate formation have been proposed by Tisdall and Oades
(4), and the particle-size fractions that they suggested will be followed in this abstract and
presentation.
Effects of polysaccharides (ps) and humic substances on clay suspensions and
aggregate stability
The discussion and evidence presented earlier lead to a very general conclusion,
namely, that OM in soils leads to a well aggregated structured soil. The question whether
this is always the case, or whether adverse effects due to the presence of OM or some
specific components of it, can also dominate soil properties, requires research. In an effort
to corroborate the mechanism of macro-molecular interactions of clays, HS and PS under
varying pH values and relative concentration and charges of the organic components were
studied by our group (2, 3) using flocculation measurements and later on further confirmed
by us using rheological measurements. Studies on flocculation and dispersion
characteristics of homoionic montmorillonite were performed as a function of
exchangeable cations, HA, FA and polygalacturonic acid (PGA) concentration and pH. A
matrix of experimental conditions was employed and the corresponding flocculation values
(FV) were measured. Edge-face (E-F) and edge-edge (E-E) interactions at various pH
levels, as well as heteroflocculation and its response to pH and concentration of OM will
be discussed. In general, PGA greatly increases the stability in suspension of the clay
362

particles. This effect is pH dependent due to changes in the edge charge of the clay and
the increase in dissociation of functional groups of the PGA with pH.
Aggregate-size fractions were separated and characterized for: particle size
distribution, CaCO3, organic C and N, fulvic acid fraction (FF), HA, total HS, 13C-NMR
spectra and extractable Al and Fe. Except for the organic C and HS in the Nevo Horon
(MH) soil, all of the calculated ratios between the contents of each of the components in
any size fraction and that calculated for the same component in the <2-μm fraction,
exhibited a parabolic type curve, reaching a maximum for the 20- to 50-μm aggregates. In
practically all combinations of aggregate-size fractions and all soil components (in both
soils), the individual stabilizing component is present at higher relative concentration than
in the <2-μm fraction. These components, therefore, act first as surface coating materials,
with the excess material forming interparticle associations. Higher polysaccharide content
was observed by 13C-NMR measurements in the larger particle size fraction, reflecting the
influence of recent plant material.
M M M
Clay mineral
Oxides and hydroxides
Figure 1. Interaction of soil humic acid (HA) molecules with clay minerals, oxides and
hydroxides. The proposed macromolecular structure of the HA based on the following
common characteristics: MW- 6386 Da; Elemental analysis (%): C- 53.9; N- 5.0-; H- 5.8;
O- 35.1; S- 0.5; C/N: 10.7; Functional groups (cmol/g): carboxyl- 376; phenol- 188; total
acidity- 564; Distribution of % C based on NMR analyses: aliphatic – 18.1, aromatic- 20.9,
carbohydrates 23.7, methoxy – 4.9, carboxylic – 8.4, keton-4.5, phenolic – 4.2, other
groups- 15.3 (Stevenson, 1994). The structure was built using the ACD/ChemSketch
program.
363
4. CONCLUSIONS
A wide array of organic compounds, including HS, PS, amino acids, peptides,
proteins and aliphatics are adsorbed to the mineral components of soils, clays and
hydroxides in particular, to varying degrees, thereby playing an important role in the
determination of aggregate stability. Adsorption is determined to a large extent by the
properties and charge of the organic and mineral components, pH, ionic strength and the
nature of the exchangeable cation on the clay surface.
ACKNOWLEDGEMENTS
The authors wish to thank the DFG Germany project "Irrigation with municipal
effluents: effects on physical soil properties, contaminant transport, soil carbon dynamics,
soil microbial activity and crop quality"; and the GLOWA project – BMBF for their financial
support.
REFERENCES
1. Tarchitzky, J., Hatcher, P.G. and Chen, Y. 2000. Soil Science, 165, 328-342.
2. Tarchitzky, J., and Y. Chen. 2002a. Soil Science Society of America Journal, 66, 406-412.
3. Tarchitzky, J. and Chen, Y. 2002b. Soil Science, 167, 791-801.
4. Tisdall, J.M. and Oades, J.M. 1982. Soil Science Society of America Journal, 33, 141-163.
364

Reactive and Refractory Components of Dissolved Organic Matter (DOM) in Peatland Soil Porewaters and their Relation to Climate Change
William Cooper1, Juliana D’Andrilli1, Melinda Jones1, Jeff Chanton2 1Department of Chemistry & Biochemistry, Florida State University, Tallahassee, FL 32306-4390,
USA, [email protected] 2Department of Oceanography, Florida State University, Tallahassee, FL 32306-4320, USA
Keywords: peatlands, porewater DOM, climate change
1. INTRODUCTION
The growth of northern peatlands during the Holocene created a globally important
source and sink for greenhouse gases. However, the response of these large carbon
reservoirs to global warming remains uncertain. We have therefore begun a multi-
disciplinary study of porewater DOM in the Glacial Lake Agassiz Peatlands (GLAP) in
northern Minnesota in which we will develop a multiphase groundwater flow model that
incorporates solute transport, organic matter reactivity and peat accumulation.
In this presentation we will describe the results of experiments designed to identify
the differences in reactive and refractory DOM pools from two distinctly different peatland
geoforms; bogs and fens. Raised bogs develop over sites that support local recharge
mounds that drive surface waters downward into the deeper peat. Bogs thus have acidic
surface waters with low concentrations of inorganic solutes. In contrast, fens develop
where mineral solutes are transported upward to the peat surface. Bogs tend to develop
over sand and gravel deposits, whereas fens are generally underlain by silty or clayey
sediments.
2. MATERIALS AND METHODS
Soil porewaters were sampled from numerous sites in bog and fen peat formations at
2-cm intervals to depths of 1-2 m using piezometer nests. DOM in the porewaters was
concentrated by freeze-drying followed by simple ion-exchange filtration to remove
residual salts that would interfere with subsequent analyses. FT-ICR mass spectra using
electrospray ionization (ESI) were acquired on a home-built 9.4 T FT-ICR mass
spectrometer at the National High Magnetic Field Laboratory in Tallahassee, FL.
365

3. RESULTS AND DISCUSSION
Ultrahigh resolution FT-ICR mass spectrometry allows DOM mixtures to be
compared based on molecular features, including formulas of individual compounds.
Kendrick plots (Nominal Mass vs. Kendrick Mass Defect) from formulas comparing HMW
DOM in surface porewaters from a fen and bog are quite similar (Figure 1.a). However,
dramatic differences are obvious when such plots for porewaters at depth are compared
(Figure 1.b). These initial data suggest that organic matter evolution in peatlands is highly
variable and a function of numerous locally-important variables such hydrology and
nutrient availability.
4. CONCLUSIONS
Comparisons of molecular formulas obtained from FT-ICR mass spectra suggest
that high molecular weight DOM is initially quite similar in fens and bogs. However,
complex localized conditions drive the evolution of DOM in very different directions. Initial
results confirm our hypothesis that peatlands are spatially highly variable ecosystems.
0
200
400
600
800
1000
200 400 600 800Nominal Mass (Da)
Ken
dric
k M
ass
Def
ect
Bog 0.3Fen 0.2
0
200
400
600
800
1000
200 400 600 800Nominal Mass (Da)
Ken
dric
k M
ass
Def
ect
Bog 2.6Fen 2.6
Figure 1. Kendrick plots of DOM from surface porewaters in a bog and fen (left), and DOM
from the same formations at depth (right).
ACKNOWLEDGEMENTS
This work was supported by the US National Science Foundation, Grant No. EAR
0628349.
366

Interactions between Dissolved Organic Matter and Organic Contaminants in Aquatic Environment
Chloé de Perre, Karyn Le Ménach, Fabienne Ibalot, Hélène Budzinski, Edith Parlanti Université Bordeaux 1; CNRS; UMR 5255; ISM-LPTC, 351 cours de la Libération, 33405 Talence
cedex, France, [email protected]
Keywords: DOM, interactions, PAH, pharmaceuticals, SPME
1. INTRODUCTION
Dissolved organic matter (DOM) in aquatic environments is a complex mixture which
is well known to play an important role in the fate of inorganic and organic pollutants.
Indeed, DOM could bind these compounds modifying their distribution in aquatic
environment, but also their bioavailability, biodegradation and subsequently their toxicity
towards aquatic organisms (1).
In order to calculate the partitioning coefficient of each pollutant to DOM (KDOC), it is
necessary to quantify the free pollutant fraction separately from the DOM bound one. Few
techniques allow the measurement of only free compound concentration without modifying
the equilibrium during the analysis (e.g. fluorescence quenching, solid-phase micro-
extraction, equilibrium dialysis).
The goal of this study was therefore to develop a reliable technique that permits to
quantify rapidly total and free organic pollutant concentrations: solid-phase micro-
extraction coupled to gas chromatography-mass spectrometry (SPME-GC-MS). Indeed,
SPME fiber is introduced into the sample and only free pollutants are extracted according
to their affinity with the fiber coating.
A series of tests was performed to optimize SPME parameters for the analysis of
organic compounds (fiber coating, extraction time, injection system, desorption time…).
After that, DOM was added to calculate KDOC values.
2. MATERIALS AND METHODS
Organic pollutants: Four PAHs were used as hydrophobic model compounds:
phenanthrene, fluoranthene, chrysene and benzo[a]pyrene. Secondly, neutral
pharmaceuticals were tested: carbamazepine and diazepam, which are anxiolytic agents.
DOM preparation: Aldrich humic acid was added to pure water and then filtered on a
0.7 µm GF/F filter. Concentration of Dissolved Organic Carbon (DOC) was measured
using a Shimadzu TOC-V CSN and was about 10 mg/L. For pharmaceuticals, natural
367

samples of DOM from the Gironde estuary (La Réole) and the Mediterranean Sea (Toulon)
were tested. These samples were concentrated by reverse osmosis previously being used
with drugs at the required concentration in DOC (about 10 mg/L). The size distribution of
macromolecules was determined by ultrafiltration in natural samples (figure 1).
9% 9%
29%53%
500 Da filtrate 500 Da retentate
1 Kda retentate3 kDa retentate
Toulon La Réole
29%
20%26%
7%18%
3 kDa retentate
1 kDa retentate500 Da retentate
500 Da filtrate
Losses
Figure 1. DOC distribution of ultrafiltration fractions (2).
SPME: For PAH, SPME analysis of the 10 mL samples were performed with
commercially available PDMS (polydimethylsiloxane) and PDMS-DVB (divinylbenzene)
coated fibers from Supelco. Different sizes of PDMS coating were compared (7 µm and
100 µm). A carbowax-DVB fiber was used for pharmaceuticals as recommended for N-
heterocyclic molecules (3). After the immersion of the fiber in the sample, it was
immediately desorbed into the GC/MS injection port. All samples and analyses were
performed in triplicate.
GC-MS: The GC was an Agilent HP 6890 model equipped with a mass selective
detector, model 5972 in the Selected Ion Monitoring (SIM) acquisition mode. During the
GC/MS analysis (30 min) the SPME fiber is maintained in the injector port to condition it
before each extraction at the appropriated temperature determined by the fiber coating. Quantification: Corresponding deuterated PAHs and pharmaceuticals were used as
internal standards to calculate the total concentration (free and bound fractions). Free
compounds were quantified by external calibration or by comparison with a standard which
does not interact with DOM (4). According to our tests, deuterated naphthalene (Nd8) was
then chosen as this standard.
KDOC calculation:
free
DOCDOC ]PAH][DOC[
]PAH[=K
with [PAH]DOC, the concentration of PAH bound to DOM, [DOC] the Dissolved
Organic Carbon content, [PAH]free the concentration of PAH free in solution. If PAH-DOM
interactions are linear on the range of the [DOC], they follow the Stern-Volmer equation:
1+]DOC[K=]PAH[]PAH[
DOCfree
total
368
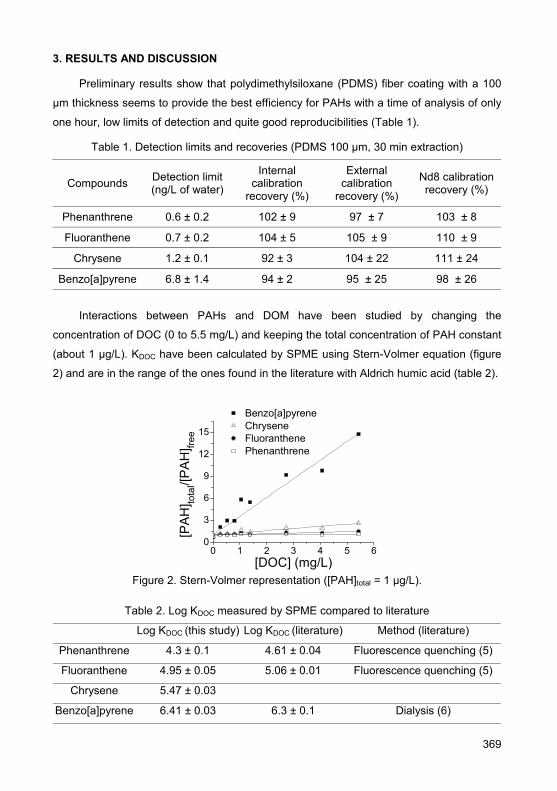
3. RESULTS AND DISCUSSION
Preliminary results show that polydimethylsiloxane (PDMS) fiber coating with a 100
µm thickness seems to provide the best efficiency for PAHs with a time of analysis of only
one hour, low limits of detection and quite good reproducibilities (Table 1).
Table 1. Detection limits and recoveries (PDMS 100 µm, 30 min extraction)
Compounds Detection limit (ng/L of water)
Internal calibration
recovery (%)
External calibration
recovery (%)
Nd8 calibration recovery (%)
Phenanthrene 0.6 ± 0.2 102 ± 9 97 ± 7 103 ± 8
Fluoranthene 0.7 ± 0.2 104 ± 5 105 ± 9 110 ± 9
Chrysene 1.2 ± 0.1 92 ± 3 104 ± 22 111 ± 24
Benzo[a]pyrene 6.8 ± 1.4 94 ± 2 95 ± 25 98 ± 26
Interactions between PAHs and DOM have been studied by changing the
concentration of DOC (0 to 5.5 mg/L) and keeping the total concentration of PAH constant
(about 1 µg/L). KDOC have been calculated by SPME using Stern-Volmer equation (figure
2) and are in the range of the ones found in the literature with Aldrich humic acid (table 2).
0 1 2 3 4 5 60
3
6
9
12
15
Benzo[a]pyreneChryseneFluoranthenePhenanthrene
[PAH
] tota
l/[PA
H] fre
e
[DOC] (mg/L) Figure 2. Stern-Volmer representation ([PAH]total = 1 µg/L).
Table 2. Log KDOC measured by SPME compared to literature
Log KDOC (this study) Log KDOC (literature) Method (literature)
Phenanthrene 4.3 ± 0.1 4.61 ± 0.04 Fluorescence quenching (5)
Fluoranthene 4.95 ± 0.05 5.06 ± 0.01 Fluorescence quenching (5)
Chrysene 5.47 ± 0.03
Benzo[a]pyrene 6.41 ± 0.03 6.3 ± 0.1 Dialysis (6)
369

Regarding pharmaceuticals, SPME-GC-MS does not show interaction with Aldrich
humic acid but La Réole and Toulon DOM samples seem to weakly associate drugs. It
may be due to the composition of DOM, since natural samples are composed of much
more small molecules than Aldrich humic acid and have probably a different structure.
However, more analyses have to be made to determine whether or not interactions
statistically occur. Carbamazepine
0
500
1000
1500
Aldrich HA La Réole Toulon
GC
-MS a
rea
blank without DOMsample with DOM
Diazepam
0
5000
10000
Aldrich HA La Réole ToulonG
C-M
S a
rea
blank without DOMsample with DOM
Figure 3. Free pharmaceuticals measured by SPME-GC-MS.
4. CONCLUSIONS
Thus, SPME seems to be a good tool to study the interactions between organic
pollutants and DOM in complex aquatic environments. Log KDOC were calculated between
PAHs and Aldrich humic acid. Results are in accordance with literature so this technique
can be applied to natural samples. Preliminary tests on pharmaceuticals show no or weak
interactions with DOM but more analysis are needed to conclude.
ACKNOWLEDGEMENTS
The "Region Aquitaine" is acknowledged for financial support and the French Ministry
of Research for the PhD grant of C. de Perre.
REFERENCES
1. Haitzer, M., Hoss, S., Traunspurger, W., Steinberg, C. 1998. Chemosphere 37, 1335-1362.
2. Huguet, A. 2007. PhD thesis: Mise au point de procédés membranaires pour l’étude de la
matière organique dissoute en milieux côtiers, Université Bordeaux 1, n°3504.
3. Moeder, M., Schrader, S., Winkler, M., Popp, P. 2000. J. Chromatogr. A. 873, 95-106.
4. Hawthorne, S. B., Grabanski, C.B., Miller, D.J., Kreitinger, J.P. 2005. Environ. Sci. Technol.
39, 2795-2803.
5. Laor, Y., Rebhun, M. 2002. Environ. Sci. Technol. 36, 955-961.
6. McCarthy, J. F., Jimenez, B. D. 1985. Environ. Sci. Technol. 19, 1072-1076.
370

Greenhouse Effect and Mitigation by Soil Carbon Sequestration in Tropical Areas: Importance and Characteristics of Humic Substances
Ladislau Martin-Neto1, Aline Segnini1,2, Odo Primavesi3, Wilson T.L. da Silva1,
Debora M.B.P. Milori1, Marcelo L. Simões1 1Brazilian Agricultural Research Corporation (Embrapa), National Center of Agricultural
Instrumentation, Rua XV de Novembro, 1452, P. O. Box 741, 13560-970 São Carlos/SP, Brazil,
[email protected] 2University of São Paulo, Institute of Chemistry of São Carlos, SP, Brazil 3Embrapa, Southeast Cattle Research Center, São Carlos, SP, Brazil
Keywords: carbon sequestration, humic acids, tropical soils
1. INTRODUCTION
The energy matrix of Brazil is composed by 44% of renewable energy, mainly from
hydroelectricity and bio-ethanol uses, compared with the world mean of only 14% of
renewable energy. However greenhouse gases (GHG) emission is relatively high, mainly
due to land use changes, including deforestation that can be reduced and/or mitigated.
Also Brazil has increased dramatically adoption of soil conservative systems,
including use of no-till or direct drilling with around 22 M ha under no-till. Besides
contributions to soil fertility, local and regional environmental aspects, no-till has been
proven to be successful in promoting soil carbon sequestration in Brazil (Bayer et al.,
2006). In the present work are described field studies on others areas with potential to soil
carbon sequestration, as pastureland grass (Brachiaria decumbens). To evaluate the
dynamic and reactivity of humic acids (HA) and soil organic matter (SOM) in these areas
spectroscopic tools, as Electron Spin Resonance (ESR) and UV-Vis fluorescence, were
applied helping to explain reactions in the soil.
2. MATERIALS AND METHODS
This study refers to a long-term experiment located in São Carlos city, state of São
Paulo, Brazil, at experimental farm of Brazilian Corporation for Agricultural Research
(Embrapa), at Southeast Cattle Research Center (21º58’S, 47º50’W), on a Brachiaria
decumbens pastureland, established 27 years ago, following a corn field. Soil was a low
fertility, acid Oxisol, with 25% clay content. Treatments were: T00 – 27 years under
Brachiaria decumbens pasture, without limestone and fertilizer additions; t0- without
surface liming, but with 400 kg y-1 N- ammonium sulfate and K2O; t2m- 2 t ha-1 surface
371
limestone with same t0 NK fertilizer use and 1 t ha-1 annual reinforcement of limestone;
t4sa- 4 t ha-1 of surface limestone without NK fertilizer use; CV- dense cerrado vegetation
in transition to a native mesophyle semideciduous tropical forest and tilled soil- pasture
area changed to crop, with 0-20 cm depth till.
Total carbon analysis were performed in soil and HA samples using a total carbon
analyzer (LECO model CR 412) and CHN (Perkin Elmer model), respectively. Soil bulk
density was assessed and used to calculate the soil C stocks.
HA samples were extracted from soil samples and purified according to the IHSS
recommended method from two depths: 0-10 cm and 10-20 cm, in all treatments reported
before.
The ESR measurements of HA were performed in a Bruker EMX spectrometer
operating at 9 GHz (X- band) at room temperature. The relative concentrations for
semiquinone-type free radicals were obtained using Singer’s method using as a secondary
standard a ruby crystal calibrated with strong pitch reference of known free radical content.
Ultraviolet and Visible Fluorescence spectra in the emission and synchronous-scan
excitation modes were acquired in a Perkin Elmer LS-50B luminescence spectrometer.
Each HA sample was dissolved in 0.05 mol L-1 NaHCO3 with 20 mg L-1 concentration, and
pH 8.
3. RESULTS AND DISCUSSION
In the pastureland areas were measured the carbon storage potential of a 25% clay
content Oxisol under well managed tropical grass pasture, Brachiaria decumbens,
established 27 years ago after corn crop, in comparison to native dense Savannah
(Cerrado) vegetation, in São Carlos, SP, Brazil. Greatest SOM content occurred under
pastureland in the 10 cm surface soil layer (Figure 1). Compared to native Cerrado, the C
stocks in pasture increased from 1.7 to 3.5 Mg C ha-1 y-1 for the 0-100 cm layer, depending
on nitrogen availability. So changing the soil management from Cerrado vegetation to
good managed grass pasture will result in an annual sequestration rate ranging from 6.1 to
12.8 Mg CO2 ha-1 y-1. Nowadays Brazil has around 200 Mi ha under pastureland, being 80
Mi ha with Brachiaria decumbens. So considering only the potential of land associated with
Brachiaria decumbens it is possible to estimate, using the mean value of
9.45 MgCO2 ha-1 y-1 as soil carbon sequestration rate, obtained from our data, a total of
carbon sequestration of 756 Tg CO2 per year by pastureland under Brachiaria decumbens
that corresponds to practically half of total Brazil’s GHG emission (1,500 Tg CO2 -
equivalent per year) or around 44% of total Planet emission due to deforestation and land
372
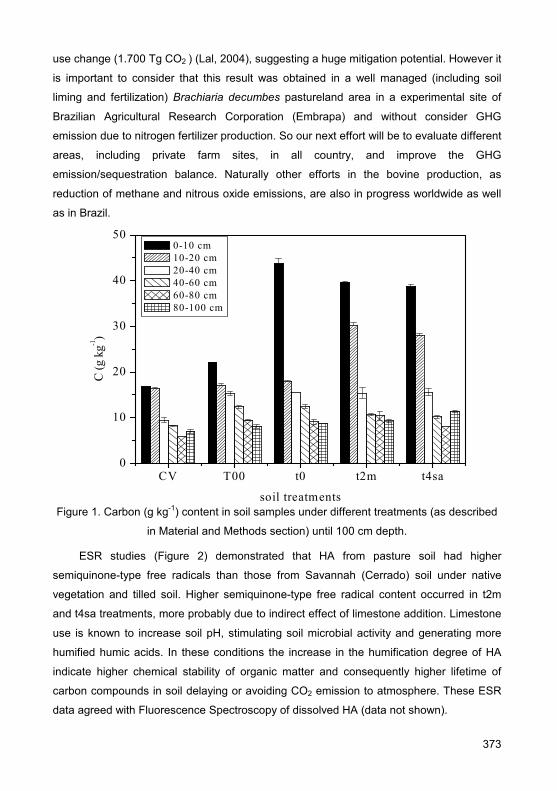
use change (1.700 Tg CO2 ) (Lal, 2004), suggesting a huge mitigation potential. However it
is important to consider that this result was obtained in a well managed (including soil
liming and fertilization) Brachiaria decumbes pastureland area in a experimental site of
Brazilian Agricultural Research Corporation (Embrapa) and without consider GHG
emission due to nitrogen fertilizer production. So our next effort will be to evaluate different
areas, including private farm sites, in all country, and improve the GHG
emission/sequestration balance. Naturally other efforts in the bovine production, as
reduction of methane and nitrous oxide emissions, are also in progress worldwide as well
as in Brazil.
CV T00 t0 t2m t4sa0
10
20
30
40
50
C (g
kg-1
)
soil treatments
0-10 cm 10-20 cm 20-40 cm 40-60 cm 60-80 cm 80-100 cm
Figure 1. Carbon (g kg-1) content in soil samples under different treatments (as described
in Material and Methods section) until 100 cm depth.
ESR studies (Figure 2) demonstrated that HA from pasture soil had higher
semiquinone-type free radicals than those from Savannah (Cerrado) soil under native
vegetation and tilled soil. Higher semiquinone-type free radical content occurred in t2m
and t4sa treatments, more probably due to indirect effect of limestone addition. Limestone
use is known to increase soil pH, stimulating soil microbial activity and generating more
humified humic acids. In these conditions the increase in the humification degree of HA
indicate higher chemical stability of organic matter and consequently higher lifetime of
carbon compounds in soil delaying or avoiding CO2 emission to atmosphere. These ESR
data agreed with Fluorescence Spectroscopy of dissolved HA (data not shown).
373

CV till soil T00 t0 t2m t4sa0.0
0.2
0.4
0.6
0.8
1.0
1.2
SFRC
(x 1
017 sp
in g
-1 H
A)
soil treatments
0-10 cm 10-20 cm
Figure 2. Content of semiquinone-type free radical (SFRC) given in spins g-1 (x1017) of soil
HA determined by ESR under different soil treatments in the pastureland Brachiaria
Decumbens areas. Symbols are same of Figure 1 (CV, T00, to, t2m and t4sa) and till soil
is another reference area with grains under conventional tilled soil.
4. CONCLUSIONS
Considering the large Savannah (Cerrado) land area (about 200 million hectares),
which is, and could be, used for cropland and pasture the adoption of soil conservative
systems (as no-tillage) and well managed pastureland has the potential to turn Cerrado
soils into a significant atmospheric C sink and contribute to mitigating global carbon
dioxide emissions in addition to increase food and biofuel production.
The spectroscopic analysis permitted to identify increase of humification degree of
HA, as detected by ESR and UV-Vis fluorescence, in areas of pastureland (Brachiaria
decumbens) under soil liming and fertilization compared with native Cerrado.
REFERENCES
1. Bayer, C; Martin-Neto, L.; Mielniczuck, J; Pavinato, A; Dieckow, J. Soil & Tillage Research, v.
86, p. 237-245, 2006.
2. Lal, R. Science, v. 304, p. 1623-1627, 2004.
374
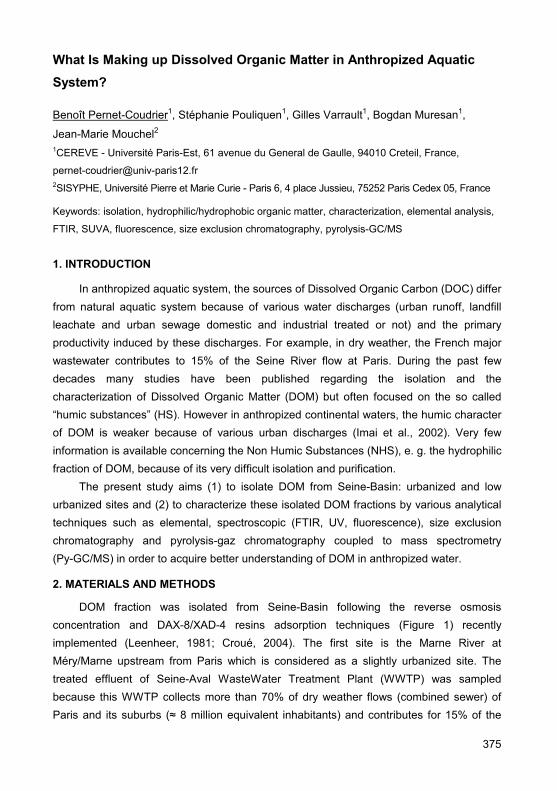
What Is Making up Dissolved Organic Matter in Anthropized Aquatic System?
Benoît Pernet-Coudrier1, Stéphanie Pouliquen1, Gilles Varrault1, Bogdan Muresan1,
Jean-Marie Mouchel2
1CEREVE - Université Paris-Est, 61 avenue du General de Gaulle, 94010 Creteil, France,
[email protected] 2SISYPHE, Université Pierre et Marie Curie - Paris 6, 4 place Jussieu, 75252 Paris Cedex 05, France
Keywords: isolation, hydrophilic/hydrophobic organic matter, characterization, elemental analysis,
FTIR, SUVA, fluorescence, size exclusion chromatography, pyrolysis-GC/MS
1. INTRODUCTION
In anthropized aquatic system, the sources of Dissolved Organic Carbon (DOC) differ from natural aquatic system because of various water discharges (urban runoff, landfill leachate and urban sewage domestic and industrial treated or not) and the primary productivity induced by these discharges. For example, in dry weather, the French major wastewater contributes to 15% of the Seine River flow at Paris. During the past few decades many studies have been published regarding the isolation and the characterization of Dissolved Organic Matter (DOM) but often focused on the so called “humic substances” (HS). However in anthropized continental waters, the humic character of DOM is weaker because of various urban discharges (Imai et al., 2002). Very few information is available concerning the Non Humic Substances (NHS), e. g. the hydrophilic fraction of DOM, because of its very difficult isolation and purification.
The present study aims (1) to isolate DOM from Seine-Basin: urbanized and low urbanized sites and (2) to characterize these isolated DOM fractions by various analytical techniques such as elemental, spectroscopic (FTIR, UV, fluorescence), size exclusion chromatography and pyrolysis-gaz chromatography coupled to mass spectrometry (Py-GC/MS) in order to acquire better understanding of DOM in anthropized water.
2. MATERIALS AND METHODS
DOM fraction was isolated from Seine-Basin following the reverse osmosis concentration and DAX-8/XAD-4 resins adsorption techniques (Figure 1) recently implemented (Leenheer, 1981; Croué, 2004). The first site is the Marne River at Méry/Marne upstream from Paris which is considered as a slightly urbanized site. The treated effluent of Seine-Aval WasteWater Treatment Plant (WWTP) was sampled because this WWTP collects more than 70% of dry weather flows (combined sewer) of Paris and its suburbs (≈ 8 million equivalent inhabitants) and contributes for 15% of the
375
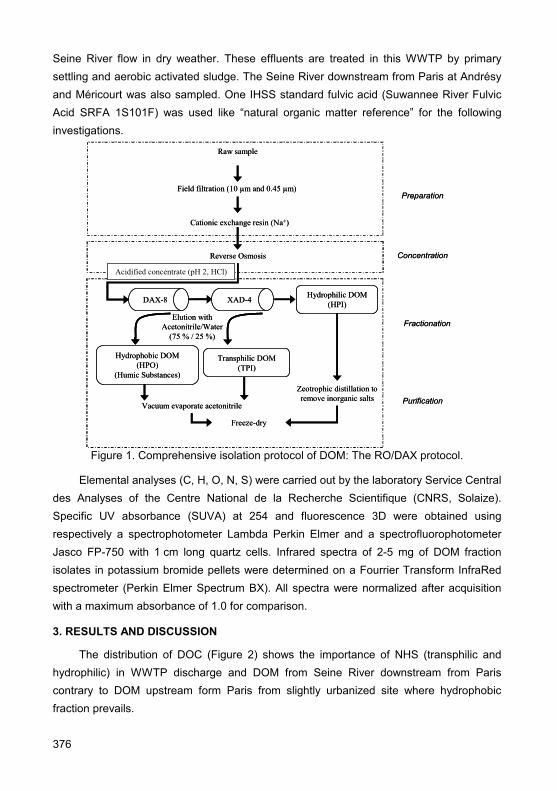
Seine River flow in dry weather. These effluents are treated in this WWTP by primary settling and aerobic activated sludge. The Seine River downstream from Paris at Andrésy and Méricourt was also sampled. One IHSS standard fulvic acid (Suwannee River Fulvic Acid SRFA 1S101F) was used like “natural organic matter reference” for the following investigations.
Preparation
Concentration
Fractionation
Cationic exchange resin (Na+)
Raw sample
Reverse Osmosis
Field filtration (10 µm and 0.45 µm)
Hydrophobic DOM (HPO)
(Humic Substances)
DAX-8 XAD-4
Acidified concentrate (pH 2, HCl)
Transphilic DOM(TPI)
Hydrophilic DOM(HPI)
Elution withAcetonitrile/Water
(75 % / 25 %)
Zeotrophic distillation to remove inorganic salts
Freeze-dry
Vacuum evaporate acetonitrile Purification
Figure 1. Comprehensive isolation protocol of DOM: The RO/DAX protocol.
Elemental analyses (C, H, O, N, S) were carried out by the laboratory Service Central des Analyses of the Centre National de la Recherche Scientifique (CNRS, Solaize). Specific UV absorbance (SUVA) at 254 and fluorescence 3D were obtained using respectively a spectrophotometer Lambda Perkin Elmer and a spectrofluorophotometer Jasco FP-750 with 1 cm long quartz cells. Infrared spectra of 2-5 mg of DOM fraction isolates in potassium bromide pellets were determined on a Fourrier Transform InfraRed spectrometer (Perkin Elmer Spectrum BX). All spectra were normalized after acquisition with a maximum absorbance of 1.0 for comparison.
3. RESULTS AND DISCUSSION
The distribution of DOC (Figure 2) shows the importance of NHS (transphilic and hydrophilic) in WWTP discharge and DOM from Seine River downstream from Paris contrary to DOM upstream form Paris from slightly urbanized site where hydrophobic fraction prevails.
376
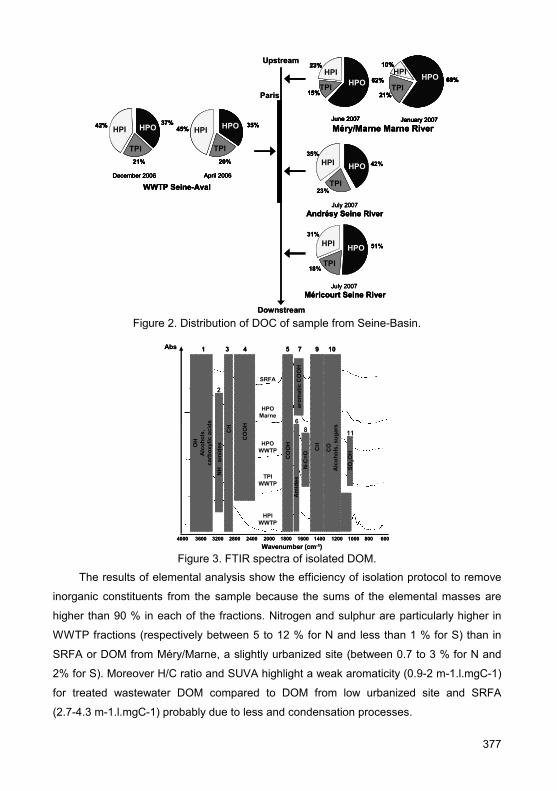
42%
23%
35%
HPO
TPI
HPI
July 2007Andrésy Seine River
51%
18%
31%
HPO
TPI
HPI
July 2007 Méricourt Seine River
Upstream
Downstream
Paris
35%
20%
45% HPO
TPI
HPI
April 2006
37%
21%
42% HPO
TPI
HPI
December 2006
WWTP Seine-Aval
69%
21%
10%
HPOTPI
HPI
January 2007
62%
15%
23%
HPOTPI
HPI
June 2007
Méry/Marne Marne River
42%
23%
35%
HPO
TPI
HPI
July 2007Andrésy Seine River
42%
23%
35%
HPO
TPI
HPI
July 2007Andrésy Seine River
51%
18%
31%
HPO
TPI
HPI
July 2007 Méricourt Seine River
51%
18%
31%
HPO
TPI
HPI
July 2007 Méricourt Seine River
Upstream
Downstream
Paris
35%
20%
45% HPO
TPI
HPI
April 2006
37%
21%
42% HPO
TPI
HPI
December 2006
WWTP Seine-Aval
35%
20%
45% HPO
TPI
HPI
April 2006
35%
20%
45% HPO
TPI
HPI
April 2006
37%
21%
42% HPO
TPI
HPI
December 2006
37%
21%
42% HPO
TPI
HPI
December 2006
WWTP Seine-Aval
69%
21%
10%
HPOTPI
HPI
January 2007
62%
15%
23%
HPOTPI
HPI
June 2007
Méry/Marne Marne River
69%
21%
10%
HPOTPI
HPI
January 2007
62%
15%
23%
HPOTPI
HPI
June 2007
69%
21%
10%
HPOTPI
HPI
January 2007
69%
21%
10%
HPOTPI
HPI
January 2007
62%
15%
23%
HPOTPI
HPI
June 2007
62%
15%
23%
HPOTPI
HPI
June 2007
Méry/Marne Marne River
Figure 2. Distribution of DOC of sample from Seine-Basin.
SRFA
HPOMarne
Abs
4000 3600 3200 20002400 18002800 1400 1200 1000 800 6001600Wavenumber (cm-1)
1
2
8
9
OH
Alc
ohol
s,ca
rbox
ylic
acid
s
CH
CO
OH
CO
OH
arom
atic
CO
OH
CH
TPIWWTP
HPIWWTP
3 54
6
7
11
NH
am
ides
Am
ides
N-C
=O
SO2O
H
HPOWWTP C
OA
lcoh
ols,
sug
ars
10
SRFA
HPOMarne
Abs
4000 3600 3200 20002400 18002800 1400 1200 1000 800 6001600Wavenumber (cm-1)
1
2
8
9
OH
Alc
ohol
s,ca
rbox
ylic
acid
s
CH
CO
OH
CO
OH
arom
atic
CO
OH
CH
TPIWWTP
HPIWWTP
3 54
6
7
11
NH
am
ides
Am
ides
N-C
=O
SO2O
H
HPOWWTP C
OA
lcoh
ols,
sug
ars
10
Figure 3. FTIR spectra of isolated DOM.
The results of elemental analysis show the efficiency of isolation protocol to remove
inorganic constituents from the sample because the sums of the elemental masses are
higher than 90 % in each of the fractions. Nitrogen and sulphur are particularly higher in
WWTP fractions (respectively between 5 to 12 % for N and less than 1 % for S) than in
SRFA or DOM from Méry/Marne, a slightly urbanized site (between 0.7 to 3 % for N and
2% for S). Moreover H/C ratio and SUVA highlight a weak aromaticity (0.9-2 m-1.l.mgC-1)
for treated wastewater DOM compared to DOM from low urbanized site and SRFA
(2.7-4.3 m-1.l.mgC-1) probably due to less and condensation processes.
377

On the FTIR spectra (Figure 3), eleven bands can be allotted to various chemical
bonds vibrations. Treated wastewater DOM differs from SRFA particularly in amides group
presence which is interpreted as an indicator of intense microbial activity.
Concerning the size exclusion chromatography results revealed significant differences
about molecular weight according to the DOM fraction nature and the sample origin.
Py-GC/MS revealed contrasts between the chemical compositions of the samples
examined, and revealed certain relationships between this composition and the initial
origin of some of the compounds.
4. CONCLUSIONS
In conclusions, hydrophilic DOM appeared as the most important fraction in WWTP
discharge contrary to natural aquatic ecosystem where hydrophobic DOM prevails.
Various analytical techniques (elemental, spectroscopic: UV, FTIR and fluorescence, size
exclusion and Py-GC/MS) allow to characterize DOM from Seine-Basin. Results revealed
a weak aromaticity and a high rate of proteinaceous structures of treated wastewater DOM
compared to DOM form low urbanized site probably due to less condensation processes
and intense microbial activity.
ACKNOWLEDGEMENTS
The authors want to thank the Syndicat Interdépartemental pour l’Assainissement de
l’Agglomération Parisienne for the accessibility of sampling site Jean-Philippe Croué and
David Violleau for their help in DOM fractionation, Le Ministère de la Recherche et de
l’Enseignement Supérieur for financial support of the Ph. D. grant of Benoît Pernet-
Coudrier. This work was supported by the Agence Nationale de la Recherche (project
BIOMET JC05_59809).
REFERENCES
1. Croué J.P., 2004. Isolation of humic and non-humic NOM fractions: structural characterization.
Environ. Monit. Asses. 92, 193-207.
2. Imai A., Fukushima T., Matsushige K., Kim Y.H. and Choi K. 2002. Characterization of
dissolved organic matter in effluents from wastewater treatment plants. Wat. Res. 36 (4), 859-
870.
3. Leenheer J.A. 1981. Comprehensive approach to preparative isolation and fractionation of
dissolved organic carbon from natural waters and wastewaters. Environ. Sci. Technol. 15 (5),
578-587.
378
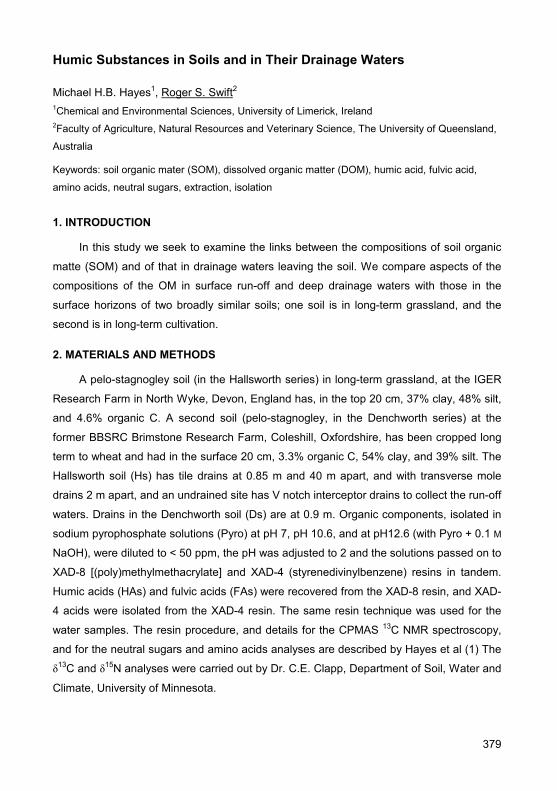
Humic Substances in Soils and in Their Drainage Waters
Michael H.B. Hayes1, Roger S. Swift2 1Chemical and Environmental Sciences, University of Limerick, Ireland 2Faculty of Agriculture, Natural Resources and Veterinary Science, The University of Queensland,
Australia
Keywords: soil organic mater (SOM), dissolved organic matter (DOM), humic acid, fulvic acid,
amino acids, neutral sugars, extraction, isolation
1. INTRODUCTION
In this study we seek to examine the links between the compositions of soil organic
matte (SOM) and of that in drainage waters leaving the soil. We compare aspects of the
compositions of the OM in surface run-off and deep drainage waters with those in the
surface horizons of two broadly similar soils; one soil is in long-term grassland, and the
second is in long-term cultivation.
2. MATERIALS AND METHODS
A pelo-stagnogley soil (in the Hallsworth series) in long-term grassland, at the IGER
Research Farm in North Wyke, Devon, England has, in the top 20 cm, 37% clay, 48% silt,
and 4.6% organic C. A second soil (pelo-stagnogley, in the Denchworth series) at the
former BBSRC Brimstone Research Farm, Coleshill, Oxfordshire, has been cropped long
term to wheat and had in the surface 20 cm, 3.3% organic C, 54% clay, and 39% silt. The
Hallsworth soil (Hs) has tile drains at 0.85 m and 40 m apart, and with transverse mole
drains 2 m apart, and an undrained site has V notch interceptor drains to collect the run-off
waters. Drains in the Denchworth soil (Ds) are at 0.9 m. Organic components, isolated in
sodium pyrophosphate solutions (Pyro) at pH 7, pH 10.6, and at pH12.6 (with Pyro + 0.1 M
NaOH), were diluted to < 50 ppm, the pH was adjusted to 2 and the solutions passed on to
XAD-8 [(poly)methylmethacrylate] and XAD-4 (styrenedivinylbenzene) resins in tandem.
Humic acids (HAs) and fulvic acids (FAs) were recovered from the XAD-8 resin, and XAD-
4 acids were isolated from the XAD-4 resin. The same resin technique was used for the
water samples. The resin procedure, and details for the CPMAS 13C NMR spectroscopy,
and for the neutral sugars and amino acids analyses are described by Hayes et al (1) The
δ13C and δ15N analyses were carried out by Dr. C.E. Clapp, Department of Soil, Water and
Climate, University of Minnesota.
379

3. RESULTS AND DISCUSSION
There were significant differences in the compositions of the fractions isolated at pH
7, 10.6 and 12.6. Since the compositions of the fractions isolated at pH 7 resembled most
closely those isolated from the drainage waters, only results from that fraction are
presented here. The isolates at pH 7 from both soils represent the most highly biologically
transformed and oxidized components of the SOM. However, only 33% of the total
extracted was in the HAs, FAs, and XAD-4 fractions in the case of the Ds, whereas 57%
was in these fractions from the Hs. The OM contents of the drainage waters from the Hs
and Ds were 2.63 and 5.11 mg l-1, respectively; that of the run-off waters was 11.6 mg l-1.
Table 1. C (%) in seven regions (ppm) of the CPMAS 13C NMR spectra of the humic acids
(HA), fulvic acids (FA) and XAD-4 acids (XAD) in the Hallsworth (Hs) and Denchworth (Ds)
soils and drainage waters (Hw and Dw), and in the Hallsworth run-off (Hro) waters
Sample 220-190 190-160 160-140 140-110 110-65 65-45 45-10 ppm
HsHA 4 16 7` 22 18 12 21
HwHA 1 13 5 23 15 12 31
HroHA 3 15 9 27 13 13 21
HsFA 5 21 4 21 17 11 22
HwFA 4 17 1 16 13 – 49
HroFA 4 20 5 21 13 7 30
HsXAD 1 19 1 6 53 – 21
HwXAD 2 18 1 6 28 14 32
HroXAD 3 19 2 9 36 11 21
DsHA 3 14 6 28 15 11 22
DwHA 2 13 6 24 12 8 35
DsFA 6 20 5 23 18 9 19
DwFA 4 20 2 16 12 – 46
DsXAD 0 16 1 4 58 – 21
DwXAD 2 21 1 7 29 15 25
The higher aliphatic (45-10 ppm) content in the case of the HwHA is the major
difference between the functionalities abundances of the HsHA and HwHA samples. The
380
HsFA has significant carboxyl enrichment (190-160 ppm), but is otherwise similar to HsHA
in terms of the distributions of the functionalities. The data for the HwFA show definite
differences in their aromaticity (140-110 ppm) and aliphatic functionalities. It is clear that
the HroHAs and FAs are different from those from the SOM. The run-off samples were
formed from decaying vegetation and the manures of grazing animals, and the
enrichments in O-aromatic (160-140 ppm) and methoxyl (65-45 ppm) resonances indicate
lignin residues and incomplete humification. The HsXAD, HwXAD, and HroXADs have
features in common, but these components are different from the corresponding HAs and
FAs, and are not humic substances on the basis of the classical definitions
In general the trends observed for the Hallsworth samples applied for the isolates
from the Denchworth soils and waters, but a detailed examination of the data in Table 1
will show definite differences between the isolates from the grassland and arable soils.
Table 2. Total neutral sugars (NS), (Mannose + Galactose)/(Arabinose + Xylose)
(M+G)/A+X) ratios, amino acids (AA) contents, and δ13C and δ15N values for the humic
acids (HA), fulvic acids (FA), and XAD-4 (XAD) acids isolated at pH 7 from the Hallsworth
(Hs) and Denchworth soils (Ds), from the drainage (Hw, and Dw) waters from the soils,
and for the run-off waters (Hro) from the Hallsworth soil
Sample NS (mg/g) (M+G/)(A+X) AA (nmol/mg) δ13C δ15N
HsHA 50 0.7 750 -29.3 2.5
HwHA 28 0.6 287 -31.0 3.1
HroHA 28 0.3 297 -31.8 3.1
HsFA 45 0.5 457 -28.1 1.6
HwFA 4 0.4 94 -30.2 1.3
HroFA 12 0.3 99 -30.6 0.8
HsXAD 152 1.4 390 -28.4 3.2
HwXAD 9 0.9 141 -28.9 3.2
HroXAD 53 1.4 258 -29.0 3.6
DsHA 35 0.6 559 -29.4 3.1
DwHA 7 0.7 154 -29.1 1.0
DsFA 54 0.5 315 -29.6 2.9
DwFA 3 0.7 60 -29.1 1.5
DsXAD 101 0.7 382 -27.8 5.4
DwXAD 3 1.0 87 -28.1 3.0
381

These differences are especially evident in the NMR spectra (not shown).
The data in Table 2 confirm similar sugar and amino acids trends for the HsHA and
HsFA samples. There are significant differences, however, between the HwHA and HwFA
samples, although there are some similarities between the data for HwHA and HroHA
samples. Large differences are evident between XAD samples and the HAs and FAs.
Again, compositional trends for sugars and amino acids are broadly similar for the
DsHAs and DsFAs, and there are some similarities between the DwHAs and DwFAs.
There is little relationship between the DsXADs and DwXADs. The (M+G)/(A+X) ratios
strongly suggest that the sugars in the HAs and FAs of the run-off samples had origins in
plants (we regard a ratio of 7 or less as indicative of plant origins, predominantly) while the
origins of all of the XAD samples were more likely to have resulted from microbial
involvements in the transformations of the organic residues. The δ13C data indicate that all
of the fractions were from C3 plants, although small 13C enrichments are evident in the
cases of some samples (HsFA, Hs and HwXADs, and Ds and DwXADs). These
enrichments are likely to have arisen from microbial metabolites. The δ15N data would
suggest inputs from the fertilizer N applied.
4. CONCLUSIONS
The greater contents of DOM in the drainage waters from the Denchworth soil in
long-term cultivation suggests that biological oxidation is still occurring faster in that soil
(than in the grassland soil) as the result of the cultivation. The run-off water samples were
taken in a rainfall event during the autumnal flush of transformations of senescent
vegetation, and the classical humic fractions in these were less well humified than those
that had formed in the soils. The pyrophosphate complexed divalent and polyvalent
cations that immobilize humic substances in soil, thereby releasing humic materials
soluble in aqueous media. This study shows that the materials released in that way have
definite similarities with those that are slowly released into, and lost in the drainage waters.
ACKNOWLEDGEMENTS
We acknowledge the contributions of Drs T.M. Hayes and J. O. Skjemstad.
REFERENCES
1. Hayes, T.M., Hayes, M.H.B., Skjemstad, J.O Swift, R.S. 2008. Eur. J. Soil Sci. In press.
382

Size Exclusion Chromatography Investigation of the Photocatalytic Degradation of Natural Organic Matter
Luis A. Tercero Espinoza, Eike ter Haseborg, Matthias Weber, Elly Karle, Rafael Peschke,
Fritz H. Frimmel Division of Water Chemistry, Engler-Bunte-Institut, Universität Karlsruhe (TH), Engler-Bunte-Ring
1, 76131 Karlsruhe, Germany, [email protected]
Keywords: photocatalysis, size exclusion chromatography, small organic acids, bioavailability
1. INTRODUCTION
Natural organic matter (NOM) is ubiquitous in natural waters. Although NOM is in
itself harmless, it is a source of unwanted disinfection byproducts (DBPs) in drinking water
treatment, including trihalomethanes. As a source of DBPs, it is critical to understand the
behavior of NOM in established and emerging water treatment steps.
Among the so-called advanced oxidation processes (AOPs), heterogeneous
photocatalysis with titanium dioxide (TiO2, Figure 1) as the photocatalyst has been shown
to be an effective oxidative treatment for a wide variety of organic micropollutants (1). It
continues to attract the attention of researchers around the globe, especially from
countries with an ample supply of sunshine, which can be used to provide the otherwise
expensive photons required for heterogeneous photocatalysis.
Figure 1: Simplified scheme of heterogeneous photocatalysis with TiO2 suspensions.
With the work presented here, we aimed to:
1. contribute to the understanding of the photocatalytic degradation of NOM by
quantifying the changes in molecular size occurring during the course of irradiation,
2. examine the effect of the presence of Fe3+, Mn2+, Cu2+ and Zn2+ in the range of 0
to 10 µmol/L on the photocatalytic process,
383

3. examine the production of small organic acids upon irradiation, and
4. characterize the bioavailability of the organic material after irradiation.
2. MATERIALS AND METHODS
Experimental design:
We used a simple 24 full factorial design to systematically study the effect of adding
the metals separately and in every possible combination (2). The distribution of points in
full factorial designs allows the recognition of single factor effects as well as those effects
caused by a combination of factors.
Size exclusion chromatography with organic carbon and ultraviolet detection (SEC-
DOC, SEC-UV):
The size exclusion chromatography setup has been previously described (3).
Low molecular weight organic acids (LMWOA):
The detection of LMWOA by means of ion chromatography has been reported in
detail by Brinkmann et al. (4).
Sample preparation:
20 mg of P25 (TiO2 powder, BET surface area = 50 ± 15 m2 g-1, mean particle
diameter = 20-30 nm, approx. 75% anatase and 25% rutile, Degussa, Germany) were
added to 40 mL of filtered (0.45 µm) lake Hohloh water (this brown water is described in
5). Samples were then sonicated for 10 min and used immediately for the irradiation
procedure. For the experiments with added metals, appropriate amounts of CuSO4, FeCl3,
ZnCl2, MnCl2 were dissolved in lake Hohloh water and let stand for a minimum of 3 days in
the dark. This spiked water was used to prepare the TiO2 suspensions.
Irradiation procedure:
The samples were irradiated using a solar UV simulator (Oriel Corp., USA) with
additional WG 295 filters (6 mm, Schott, Germany) and an atmospheric attenuation filter
(Oriel Corp., USA) installed in the irradiation beam to match the specturm of the Xe lamp
to the typical solar UV-spectrum. The samples were stirred, open to the atmosphere and
irradiated from above by a homogeneous light field.
Bioavailability:
Irradiated samples (50 mL) were incubated under sterile conditions with mixed
bacterial sludge from two wastewater treatment plants and stirred and incubated at 36 °C
for two days.
384

3. RESULTS AND DISCUSSION
First, we performed irradiation experiments in the absence of added metals. The
SEC-DOC (Figure 1a) and SEC-UV (not shown) chromatograms of the original and
irradiated samples were divided into three fractions (F1-F3). Upon irradiation, we observed
a rapid decrease in F1, accompanied by an increase in both F2 and F3 (Figure 1a & b).
This shows a redistribution of molecular sizes in the NOM during irradiation, where the
larger molecules are degraded to smaller ones without noticeable decrease in overall DOC
content (Figure 1b). With continuing irradiation, the rate of formation for F2 (presumably
from F1) decreases because of a smaller F1, the DOC content of F2 passes through a
maximum and starts to decrease. At the same time, the rate of increase of F3 decreases,
leading to an overall decrease in DOC content.
(a) (b)
Figure 2: (a) SEC-DOC chromatograms showing the defined fractions (F1-F3) and their
time evolution under UV irradiation in the presence of 0.5 g L-1 P25; (b) DOC content of
each fraction as a function of irradiation time.
The effect of adding Fe3+, Mn2+, Cu2+ and Zn2+ in the range of 0 to 10 µmol/L was
analyzed for the DOC content of the fractions after 30 and 60 minutes of irradiation.
Differences in the size of the fractions for samples containing different metals were more
pronounced after 60 min than after 30 min. We found that the addition of Cu2+ had a
delaying effect on the degradation of F1, leading to smaller F2 and F3, respectively.
Addition of Fe3+, Zn2+ and Mn2+ had no independent effect on the DOC content of either of
the fractions. However, they were involved in interaction effects, as revealed by fitting a
linear model including interaction terms to the data. That is, the effect of these metals was
dependent on the levels of the other metals.
385
After incubation of the irradiated samples with a bacterial culture, F1 was larger and
both F2 and F3 smaller than before incubation. This indicates that F2 and F3 are both
bioavailable. We attribute the increase in F1 to the synthesis of high molecular weight
molecules by the bacteria. Of the organic acids produced during irradiation (formic > oxalic
> succinic ≈ glutaric), all except oxalic acid were completely biodegraded.
4. CONCLUSIONS
The photocatalytic degradation of NOM is influenced by the presence of added
metals, especially Cu2+. Other metals tested had no influence on their own but were found
to interact with Cu2+ and each other to favor or retard the degradation of the NOM fractions
in a non-trivial way. The systematic assessment of these effects gives insight into the
various interactions which govern this complex system.
ACKNOWLEDGEMENTS
We gratefully acknowlege the financial support of the German Technical Association
for Gas and Water (DVGW). Our special thanks go to Marta López Furelos and Johannes
Kern for their assistance in the lab.
REFERENCES
1. Oppenländer, T. 2003. Photochemical purification of water and air, Wiley VCH, Weinheim.
2. Box, G. E. P., Hunter, J. S., Hunter, W. G. 2005. Statistics for Experimenters: Design,
Innovation, and Discovery, Wiley-Interscience, New Jersey.
3. Brinkmann, T., Sartorius, D., Frimmel, F. H. 2003. Aquat. Sci. 65, 415-424
4. Brinkmann, T., Horsch, P., Sartorius, D., Frimmel, F. H. 2003. Environ. Sci. Technol. 37, 4190-
4198
5. Frimmel, F. H., Abbt-Braun, G., Heumann, K. G., Hock, B., Lüdemann, H.-D., Spiteller, M.
(Eds.) 2002. Refractory organic substances (ROS) in the environment, Wiley, New York.
386

Interaction between Pentachlorophenol and Soil Organic Matter: Sorption-Desorption Reaction and Hysteresis
Jianming Xu1,2, Yan He1,2, Haizhen Wang1,2, Jianjun Wu1,2, P.M. Huang1,3 1College of Environmental and Natural Resource Sciences, Zhejiang University, Hangzhou
310029, China, [email protected] 2Zhejiang Provincial Key Laboratory of Subtropic Soil and Plant Nutrition, Hangzhou 310029,
China 3Department of Soil Science, University of Saskatchewan, Saskatoon, SK S7N 5A8, Canada
Keywords: pentachlorophenol (PCP); sorption-desorption; humic acids (HA); hysteresis
1. INTRODUCTION
Pentachlorophenol (PCP) is one of the ionizable hydrophobic organic contaminants
(HOCs) and has been designated as a priority pollutant. Understanding the behavior of
PCP requires an assessment of the processes influencing its fate, transport, bioactivity
and persistence in soils. The objectives of this study were to investigate the
sorption/desorption of PCP by humic acids and soil organic matter in order to improve our
understanding of soil parameters that control the transformation and transport of ionizable
HOCs.
2. MATERIALS AND METHODS
Two kinds of humic acids (HA) were used. One was a commercially available HA,
designed as HA1 (with a 36.8% C content). The other designed as HA2 (with a 57.4% C
content) was extracted and purified from a paddy soil. Six soils were used for further
investigation of the potential contribution of SOM to sorption by comparing the different
retention behaviors before and after the removal of organic carbon with H2O2 treatment.
PCP was Aldrich standard with purity more than 98%.
Sorption was conducted in glass screw- PTFE-cap centrifuge vials. The solid to liquid
ratio was adjusted to achieve 30-70% of total solute sorbed. Each series comprised 15
samples. The vials were shaken in the dark until the sorption equilibration was achieved
and the suspension was then centrifuged at 4000 rpm for 20 min. The supernatant was
analyzed by HPLC. A single-dilution desorption step was further conducted for soil
sorbents to investigate the sorption-desorption hysteresis.
387

3. RESULTS AND DISCUSSION
Typical sorption isotherms of PCP on HAs were fitted to the logarithmic form of the
Freundlich equation. The Freundlich model fitted very well the individual isotherms (r2 =
0.990 and 0.986 for HA1 and HA2, rspectively; p < 0.01, n = 15). N values (0.770 for HA1
and 0.740 for HA2) were less than 1, resembling L-type isotherms. A L-type curve
indicated a relatively high PCP-sorbent affinity at low concentration; the extent of sorption
decreased as the PCP concentration increased, because it became increasingly more
difficult for PCP to find vacant adsorption sites. The system pH might emerge as a primary
factor that controlled the sorption behavior of PCP by affecting the surface characteristics
of the HAs and the distribution of PCP species in solution. The equilibrium pH values for
the HA1 and HA2 after PCP sorption were 5.26 and 4.94, respectively, approaching nearly
the pKa value of OM (~5) and PCP (4.75) (1). Therefore, both the OM and the PCP
molecules would be partly dissociated and PCP sorption increases with the increase in the
fraction of neutral PCP. With a functional group of OH, PCP would dissociate over the
range of equilibrium pH and be present as two chemical species with very different
physico-chemical properties. Results presented by Lee et al. (2) suggested that for pH less
than 7, PCP sorption increased with an increase in the fractions of the neutral PCP
species. Simultaneously, the component of aromatics in HAs allowed the neutral PCP to
sorb through hydrophobic bond formation. And the conjugation between neutral PCP and
carbohydrates, and the formation of intermolecular hydrogen bonds between PCP and
COOH groups were also likely involved (3). Therefore, the pH-dependent chemical
characteristics of PCP and the surface properties of HAs co-contributed to the complexity
of PCP behavior in the HAs-liquid interface, and thus could result in the high sorption
capacity observed.
Table 1. Parameters influencing changes of PCP sorption on soils tested before and after
H2O2-treatment
TOC (g kg-1) pH Kd (L kg-1)b Soil No. H2O2-BFa H2O2-AF H2O2-BF H2O2-AF H2O2-BF H2O2-AF 1 18.3 3.2 6.2 4.8 23.6(1.0) 11.4(0.9) 2 24.3 2.9 6.5 4.8 15.9(0.2) 6.6(0.9) 3 17.9 1.5 5.8 4.9 35.6(0.5) 7.7(0.4) 4 6.6 0.9 5.6 5.2 6.2(0.3) 4.9(0.8) 5 11.0 1.8 5.3 4.7 52.5(2.3) 33.5(2.2) 6 5.5 3.4 9.0 7.5 2.7(0.2) 0.6(0.1)
a H2O2-BF: before H2O2-treatment; H2O2-AF: after H2O2-treatment; b Values are means with standard errors in the parentheses.
388

The H2O2 treatment may be considered as a drastic treatment of the soil, but no significant difference in specific surface area was observed (data not shown). The only changes detected were the total soil organic carbon (TOC) and pH (Table 1). The two parameters were approximately parallel before and after the H2O2-treatment. The H2O2 treatment decreased 7.14%-26.15% of pH and removed, on average, about 80% of TOC (Table 1), resulting in the drastic decrease in the sorption of PCP as shown in the Kd values. This indicates that the sorption capacity in the investigated soils was related to the organic carbon content.
The hysteresis index (HI) was studied for the convenience of comparing the irreversibility of sorption-desorption. The values of HI at 20 oC and five representative concentration levels before and after H2O2-treatment were investigated (Figure 1). As shown in Figure 1, the HI generally decreased after the treatment of H2O2, especially for the soils 1, 2, 4 and 5. With the 86% removal of organic carbon, the HI values were negative, indicating that PCP desorption was completely reversible in soil 4 after treated with H2O2 (A zero or negative HI value indicates that sorption-desorption hysteresis is statistically insignificant). It was noteworthy that although the H2O2 treatment greatly decreased both TOC and pH values, soil 1 showed a steady but low decline leading to the inverse 10-15% increase of HI at the highest concentrations. In soils 3 and 6, the HI values increased unexpectedly at the majority of the concentrations tested. This is attributable to exposed sorption sites of clay and oxide minerals and their possible minor surface changes, which might not be detected by the used characterization methods.
Figure 1. Hysteresis index (HI) for pentachlorophenol sorption on the six soils at five
representative concentrations before and after removal of the organic carbon by H2O2-
treatment.
389
4. CONCLUSIONS
The results obtained in this study provide a basis for understanding and quantifying
the sorption-desorption behavior of PCP and its hysteresis in soil/sediment environments.
This information is essential for the prediction of the fate of PCP in soils and sediments.
ACKNOWLEDGEMENTS
This work was supported by the National Nature Science Foundation for
Distinguished Young Scholars of China ( 40425007), the National Natural Science
Foundation of China (40671092, 20707020 and 40701075), and the Program of
Introducing Talents of Discipline to University of China (B06014).
REFERENCES
1. He, Y., Xu, J.M., Wang, H.Z., Ma, Z.H., Chen, J.Q. 2006. Environ. Res. 101, 362-372.
2. Lee, L.S., Rao, P.S.C., Nkedi-Kizza, P., Delfino, J.J. 1990. Environ. Sci. Technol. 24,654-666.
3. Paaso, N., Peuravuori, J., Lehtonen, T., Pihlaja, K. 2002. Environ. Int. 28, 173-183.
390
Modeling Zn Adsorption and Desorption to Soils
Zhenqing Shi1,2, Dominic M. Di Toro1, Herbert E. Allen1, Donald L. Sparks2
1Center for the Study of Metals in the Environment, Department of Civil and Environmental
Engineering, University of Delaware, Newark Delaware, Newark, DE 19716, U.S.A.,
[email protected] 2Environmental Soil Chemistry Research Group, Department of Plant and Soil Sciences, University
of Delaware, Newark, DE 19717, U.S.A.
Keywords: adsorption, desorption, kinetics, soil organic matter, WHAM
1. INTRODUCTION
The rate of reaction of trace metals between soils and solutions is important in
predicting trace metal behavior as equilibrium may not be attained. Although chemical
equilibrium models are commonly used for soil systems, there has been less progress in
developing predictive kinetic models.
Kinetics of Zn adsorption/desorption have been modeled based on the linear
adsorption isotherm assumption (1, 2), where adsorption and desorption rate coefficients
remain constant at constant pH and are constrained by the equilibrium partition coefficient.
This approach is in agreement with Zn adsorption/desorption behavior only within a narrow
range of Zn concentrations. However, a nonlinear adsorption isotherm is often observed
over wide range of Zn concentrations, indicating that a general kinetics model needs to
account for the nonlinearity of Zn binding to soils. In the nonlinear adsorption process, the
adsorption rate could vary with the Zn loading in soils. Moreover, Zn adsorption and
desorption reactions with soil particles are controlled by both soil composition, such as soil
organic matter (SOM) content, and solution chemistry, e.g. pH and Zn concentration.
2. MATERIALS AND METHODS
Soil samples were obtained from the 0-20 cm layer, air-dried, and then sieved using
a 2-mm screen. These soils have low background Zn concentrations ranging from 16 to
127 mg kg-1. Soil organic carbon (SOC) concentrations were 0.76% to 12.90%.
The stirred-flow reaction chamber has a reaction volume of 6.4 cm3 and contained
0.3 g soil for most experiments. Zn concentrations were 0.83 to 3.62 mg L-1 in 3 mM
Ca(NO3)2 background electrolyte. The pH (5.5 – 6.5) was controlled using 3 mM MES,
which does not complex Zn ions. After 4-h adsorption at a 0.9 mL min-1 flow, Zn-free
electrolyte was pumped through the flow chamber. Samples were analyzed by ICP-MS.
391

The basic formulation for the change in the concentration of sorbed zinc is a two-site
adsorption and desorption kinetics model has been described previously (1). The Zn
adsorption/desorption reaction is controlled by two groups of sites, one fast and another
slow. The kinetic equations for Zn adsorption /desorption on the two sites are
ionapdp CkCk
dtdC
1111 +−= and ionapd
p CkCkdt
dC222
2 +−= where ka1,2 (L (g min)-1), kd1,2
(min-1), and Cp1,2 (μg Zn g-1) are the adsorption and the desorption rate coefficient and
particulate Zn concentration for sites 1 and 2 respectively, and Cion (μg Zn L-1) is the
solution concentration of ionic Zn. The equation for ionic Zn concentration follows from a
mass balance for the reactor volume.
In our previous study (1), we used a linear adsorption isotherm, in which adsorption
rate coefficients remained constant at constant pH, irrespective of Zn loadings in soils.
Using a mechanistic model for Zn adsorption on soils would generalize the model. It would
be possible to calculate the change of the adsorption rates during the nonlinear binding
process under different reaction chemistry conditions.
The basic model assumption is that the Zn concentration in the particulate phase,
which determines the free sites concentrations, determines the corresponding individual
adsorption rate constants for Zn adsorption to these free sites as follows. At a specific
particulate Zn concentration Cp1 and solution conditions, it is possible to compute
concentration of ionic Zn in solution, Cion, that is in equilibrium with this particulate Zn
concentration and the corresponding partition coefficient Kp1(Cp1) based on the adsorption
isotherm. Thus, with desorption rate coefficient kd1, the adsorption rate at equilibrium is
found from eq 1 with =dt
dCp1 0. Then, )(/ 111111 ppdwpda CKkCCkk == where the Kp1(Cp1)
is the partition coefficient for the fast site at the specific particulate Zn concentration Cp1.
This equation determines the adsorption rate coefficient at each time during the reaction. A
similar equation applies for the slow site. SOM was considered as the sole adsorbent for
Zn binding to the tested soils (1).
The mechanistic model WHAM was used to obtain Kp1 and Kp2 at various reaction
conditions. In WHAM V calculations (3), Zn can bind to either monodentate or bidentate
sites, and can also form outer-sphere complexes in the electrical double layer (DL) via
electrostatic interactions. We associate the fast adsorption reactions to both Zn binding to
monodentate sites and formation of outer-sphere complexes in the DL. The slow
adsorption reactions are assumed to be Zn binding to bidentate sites in SOM. Thus the
392

partition coefficients Kp1(Cp1) and Kp2(Cp2) can be calculated using WHAM at various
reaction conditions.
3. RESULTS AND DISCUSSION
Three parameters must be fit for the model, desorption rate constants for the two
sites and the fraction of the organic matter that is active in the partitioning. The partitioning
coefficients are defined by WHAM. The data for all soils and all conditions tested were
globally fit to obtain the best value for the desorption rate constants. These are 3.0 × 10⁻²
and 5.1 × 10⁻⁶ sec-1 for the fast and slow sites respectively. This result is very similar to
that of Gee et al. (4) who found the desorption rate constant for zinc from particulate
matter in South San Francisco Bay was 1.74 × 10⁻⁶ sec.
As shown in Figure 1, the model fits are consistent with the experimental data. The
kinetics model incorporating WHAM can account for the variations in Zn loading, solution
pH and concentrations of SOC.
0
500
1000
1500
2000
0 100 200 300 400
[Zn] 0.83 mg L-1
(RMSE 48.8)[Zn] 1.91 mg L-1
(RMSE 141.6)
Efflu
ent Z
n co
ncen
trat
ion
(μg
L-1)
time (min)
pH 5.5, 2.32% SOC
0
400
800
1200
1600
0 100 200 300 400
2.32% SOC(RMSE 134.5)3.43% SOC(RMSE 108.4)7.15% SOC(RMSE 94.6)
Efflu
ent Z
n co
ncen
trat
ion
(μg
L-1)
time (min)
pH 6.5
Figure 1. Kinetics of Zn adsorption and desorption on soils.
0
20
40
60
80
0 100 200 300 400
Soil
Zn c
once
ntra
tion
(μg
g-1)
time (min)
Bidentate sites
Monodentate sites
pH 5.5, 2.32% SOC [Zn] 0.83 mgL-1
Total sites
0
100
200
300
400
500
600
0 100 200 300 400
Soil
Zn c
once
ntra
tion
(μg
g-1)
time (min)
Bidentate sites
Monodentate sites
pH 6.5, 7.15% SOC [Zn] 1.70 mgL-1
Total sites
Figure 2. Kinetics of Zn adsorption/desorption on monodentate and bidentate sites.
393
The role of monodentate (fast) and bidentate (slow) sites on controlling Zn adsorption
/desorption kinetics depends on reaction conditions and reaction time (Figure 2). At pH
5.5, binding of Zn to monodentate sites dominated the overall adsorption/desorption
reactions. With an increase in pH to 6.5, more Zn was bound to bidentate sites than to
monodentate sites after adsorption. During 4 h desorption experiments, the overall Zn
release was mainly controlled by the monodentate sites. The amount of Zn adsorbed in
bidentate sites continued to increase even during the desorption process, indicating a re-
distribution of Zn from monodentate sites to bidentate sites.
4. CONCLUSIONS
Differences in the measured net desorption rate under various solution chemistries
result from changes in the readsorption rate, not the desorption rate as has been claimed.
Changes in solution speciation, for example by the addition of strong chelating agents,
affect the rate of readsorption, not that of the desorption. The initial sorption to
monodentate sites is followed by a slow transition to bidentate sites. Desorption of metal
from the monodentate sites is rapid, but desorption from the bidentate sites is slow.
Desorption of Zn from soil is a slow process with many days required for a new
equilibrium state to be attained. This is likely to have important effects on Zn bioavailability
and Zn flux from soil in the field. Because laboratory studies of metal sorption desorption
have usually been run for relatively short times relative to the reaction rates, the
experimental soil – soil solution distribution will depend on the experimental conditions.
Comparison of the results of different investigators and extrapolation to new conditions is
difficult.
ACKNOWLEDGEMENTS
The Center for the Study of Metals in the Environment sponsored this study.
REFERENCES
1. Shi, Z., Di Toro, D. M., Allen, H. E., Ponizovsky, A. A. 2005. Environ. Sci. Technol. 39, 4562-
4568.
2. Harper, M. P., Davison, W., Zhang, H., Tych, W. 1998. Geochim. Cosmochim. Acta 62, 2757-
2770.
3. Tipping, E. 1994. Computers Geosci. 20, 973-1023.
4. Gee, A. K., Bruland, K. W. 2002. Geochim. Cosmochim. Acta 66, 3063-3083.
394
Use of Diffusive Gradient in Thin-Films (DGT) for the in vitro Study of the Effects of Humic Fractions and Metals on the Growth of a Phytopathogenic Fungus
Mariagrazia Berloco1, Elisabetta Loffredo1, Robert Mortimer2, Nicola Senesi1 1Dipartimento di Biologia e Chimica Agroforestale ed Ambientale, University of Bari, Via Amendola
165/A, 70126 Bari, Italy, [email protected] 2School of Earth and Environment, University of Leeds, LS2 9JT England
Keywords: humic fractions, compost, peat, coconut fiber, phytopathogenic fungi, Sclerotinia
sclerotiorum, DGT technique
1. INTRODUCTION
Recent studies have demonstrated that composts and their humic fractions (HAs)
can exert a suppressive activity on different soil-borne plant pathogenic fungi, thus
allowing a more limited use of chemical fungicides and favouring sustainable crop
protection (1-4). The soil-borne fungus Sclerotinia sclerotiorum is non specific
phytopathogen commonly present in the rhizosphere of a large number of vegetables and
crops with a life cycle occurring mostly in the soil (5). When the mycelial growth
encounters adverse nutritional or environmental conditions, it forms black seed-like
resistance structures called sclerotia. Diffusive gradient in thin-films (DGT) is a new and
interesting technique initially developed to measure trace metal concentrations in natural
waters (6), and later used to measure solute fluxes and concentrations in sediments and
soils (7). Solutes that have been measured by the DGT technique include Ni, Cu, Fe, Mn,
Zn, Cd. Mg, Ca and others (8). This technique, which has been shown to measure
bioavailable metals, uses a simple device that accumulates solutes on a binding agent
after passage through a hydrogel, which acts as a well defined diffusion layer (6). The
binding agent used is selective to the species being measured. It relies on the
establishment of a steady state concentration gradient in the diffusion layer so that Fick’s
First Law can be used to calculate unknown concentrations.
The objectives of this work were to study: (i) the effects of three different HAs,
extracted from conventional and new plant growth substrates, and some metals on the
growth of S. Sclerotiorum, and (ii) the capacity of these HAs to alter the DGT
concentrations of these metals, i.e. to regulate metal availability, when present both in the
growing medium of the fungus.
395
2. MATERIALS AND METHODS
The HAs were isolated from three different organic substrates: a compost (C-HA), a
coconut fiber (CF-HA) and a peat (P-HA). The elemental and acidic functional group
composition of the HA examined are shown in Table 1. Stock suspensions of each HA
were prepared at concentrations of 1000 mg/L by using sterile double distilled water. ICP
standard solutions at concentration of 1000 mg/L (Fluka) of the metals Cu, Zn, Mn, Fe and
Al were used. Aqueous solutions of potato dextrose agar (PDA, 4%, w/v) were steam
sterilized, cooled at about 55°C and then added with each metal solution (M) at
concentrations of 0 (control, only PDA), 5, 10 and 25 mg/L. Each substrate was also
added with appropriate aliquots, withdrawn under stirring, of any HA sample at
concentration of 0 (only metals) and 100 mg/L. The media obtained were poured in Petri
dishes, and left to cool and solidify at room temperature. Then, the fungus was inoculated
in the middle of the plates (4) and the DGT unit was placed at the edge of these. The
plates were kept in an incubator in the dark at a constant temperature of 20°C. After
appropriate time periods, and until the fungus reached approximately the border of the
plate (96 h), the apparent morphology and radial growth of the mycelium were evaluated.
Starting from sclerotial initiation (144 h after inoculation) and until 264 h, the number and
dimensions of sclerotia were measured. All the experiments were replicated six times, and
data were statistically analyzed by one-way analysis of variance (ANOVA), and the means
of treatments separated by the least significant differences (LSD) test.
At the end of the experimental time, the DGT discs were removed from the plates
and disassembled. Metals present in the binding gel were extracted by using 0.5 mL of
Aristar nitric acid for 24 h and analysed by inductively coupled plasma–optical emission
spectroscopy (ICP-oes).
3. RESULTS AND DISCUSSION
With respect to the corresponding control, no morphological changes were observed
for the fungal mycelium as a function of the presence of metals (M) at 5 and 10 mg/L and
any HA examined. Conversely, the fungal growth was highly stimulated by the presence of
M at the lower concentration (up to more than 6 times the control at 48 h after inoculation)
with a decreasing trend during growth (Fig. 1). The presence of any HA in combination
with M at 5 mg/L greatly reduced the M effect, especially at 48 and 72 h after inoculation
(Fig. 1). This is probably due to some metal adsorption/complexation by HAs. In the
treatments with the sole M at concentration of 10 mg/L, a significant mycelial stimulating
effect was observed only at 48 h whereas a general almost total inhibition of the fungal
396

growth was observed in the combinations of M at 10 mg/L with any HA. At the highest M
dose (25 mg/L), either alone or in combination with each HA, the fungal growth was
completely inhibited thus suggesting the occurrence of toxic metal concentrations.
As it concerns sclerotial initiation, the presence in the growing medium of M alone at
both doses was able to promote sclerotia initiation and development with respect to the
control, i.e. sclerotia appeared earlier and their number and dimension in the plates
increased (Fig. 2). Also the combinations of M at 5 mg/L with any HA, especially C-HA,
promoted high significantly the formation of sclerotia with respect to the control (Fig. 2).
These results may be interpreted as the occurrence of adverse nutritional conditions.
The DGT concentrations measured in the M treatments at 5 and 10 mg/L are referred
in Table 2. The combinations M at 5 and 10 mg/L + C-HA or P-HA produced DGT
concentrations always lower than the sole M at both concentrations (Table 2) suggesting a
relevant role of HAs in the sorption of metals, i.e., a reduced metal availability for the
fungus, especially in the case of C-HA. The combinations M at 25 mg/L + any HA fractions
caused a DGT concentration generally similar to the M treatment at 25 mg/L alone (data
not shown) indicating that the sorption capacity of HAs is not able at a metal dose so high
to influence the DGT concentration.
Table 1. Elemental and acidic functional group composition (on a moisture- and ash-free
basis) of the HAs examined
C H N S O Total Acidity COOH Phenolic OH SAMPLE
(g kg-1) (meq g-1) C C-HA 583 56 69 6 286 5.6 3.6 2.0
CF-HA 581 51 19 1 348 6.1 4.6 1.5 P-HA 599 56 21 1 323 5.7 3.3 2.4
0
100
200
300
400
500
600
700
Varia
tion
%
Hours
967248 ***
***
** ** *
*
Figure 1. Effects of M alone (striped bars) at 5 mg/L and its combinations with C-HA
(white bars), CF-HA (black bars), and P-HA (grey bars) at 100 mg/L on the variation (%) of
radial mycelial growth of S. sclerotiorum with respect to control (only error bars).
397

Table 2. Effects of different substrates on the DGT concentration (µg/L) of the metals
SAMPLE Fe Mn Cu Zn Al Control 1,49 0,30 2,57 27,40 3,18 M 5 mg/L 70,22 104,33 82,64 180,87 116,03M 5 mg/L + C-HA 3,68 1,24 7,84 70,15 5,66 M 5 mg/L + CF-HA n.d. n.d. n.d. n.d. n.d. M 5 mg/L + P-HA 23,80 23,21 56,84 53,87 20,07 M 10 mg/L 116,27 170,69 180,84 382,03 261,60M 10 mg/L + C-HA 24,30 16,24 34,28 62,64 31,75 M 10 mg/L +CF-HA 20,81 13,82 136,54 48,03 59,04 M 10 mg/L + P-HA 57,58 31,32 172,26 77,19 95,07
Figure 2. Effects of M alone at concentrations of 5 and 10 mg/L and its combinations with
C-HA at 100 mg/L on the number of sclerotia formed by S. Sclerotiorum in comparison to
the control, as a function of time.
ACKNOWLEDGEMENTS
Supported by the Italian Ministry of University and Research, Project PRIN 2005.
REFERENCES
1. Pascual, J.A., Garcia, C., Hernandez, T., Lerma, S., Lynch, J.M. 2002.Microb. Ecol. 44, 59.
2. Litterick, A.M., Harrier, Wallace, P., Watson, C.A. Wood, M. 2004. Crit. Rev. Plant Sci. 23, 453.
3. Loffredo, E., Berloco, M., Casulli, F., Senesi, N. 2007. Biol. Fertil Soils 43, 759.
4. Loffredo, E., Berloco, M., Senesi, N. 2007. Ecotox. Environ. Safe. (in press, available online)
http://dx.doi.org/10.1016/j.ecoenv.2007.11.005.
5. Purdy, L.H. 1979. Phytopathol. 69, 875.
6. Davison, W., Zhang, H. 1994. Nature 367, 546.
7. Harper, M.P., Davison, W., Zhang, H., Tych, W. 1998. Geochim. Cosmoch. Acta 62, 2757.
8. Zhang, H., Davison, W., Miller, S., Tych, W. 1995. Geochem. Cosmochim. Acta 59, 4181.
398

A Relationship of P Chemical Speciation and PZSE in Allophanic Synthetic Surfaces Enriched with Natural Humic Acids from Chilean Andisols
Josefina Canales1, María de la Luz Mora, María Jesús Aguirre2, Rubén Gaviño3, Mónica Antilén4, Margarita Briceño5
1Depto. Ciencias Químicas, Facultad de Ingeniería, Ciencias y Administración, Universidad de La Frontera, Casilla 54-D Temuco, Chile, [email protected] 2Universidad de Santiago de Chile, Casilla 40, Correo 33, Santiago, Chile Chile, Santiago, Chile 3Instituto de Química, Universidad Nacional Autónoma de México, 70-213, México D.F. 4Pontificia Universidad Católica de Chile, 6904411, Santiago, Chile 5Universidad Arturo Prat, Casilla 121, Iquique, Chile
Keywords: Chemical Speciation, Chilean Andisols, PZSE
1. INTRODUCTION
Humic acids (HA) and fulvic acids (FA) represent two important fractions of soil humic substances. These substances in Chilean Andisols represent around 70% of the total organic carbon (OC) content. A high P adsorption capacity of allophanic soils is closely related to their surface acidity dependent of pH, and the presence of Al(Fe)-humus complexes. The aim of this study was establish the relationship between P chemical speciation using GEOCHEM-PC (1) and surface charge determined by potentiometric titration (Point of zero salt effect, PZSE) modeling with the constant capacitance model (CCM, 2) on synthetic alluminosilicates with iron oxide and natural humic acid obtained from Chilean Andisols.
2. MATERIALS AND METHODS
Soil samples: from 0-15 cm depth of two Andisols (Osorno and Vilcun) collected from
uncultivated areas were used. The OC fractionation was realized according Schnitzer
method (1).
Synthetic aluminosilicates: (Al-Si allophane) were prepared from AlCl3 and potassium
K4SiO4 (1). Allophane were coated with two different percentage of iron oxide, 6% (Al-Si-
Fe-I) and 12 % (Al-Si-Fe-II) and also with two levels of natural HA (2% and 6%)
Potentiometric titration: data were obtained from the suspended sample in 0.1 M KCl
solution giving a final volume of 100 mL with and without 1x10⁻³ M KH2PO4 (3).
Chemical speciation: The P chemical speciation was performed using the computer
program GEOCHEM-PC (1).
399
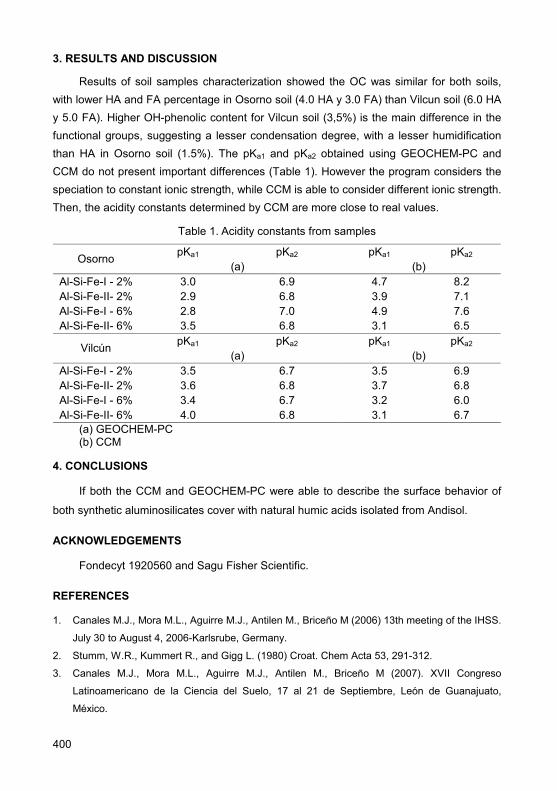
3. RESULTS AND DISCUSSION
Results of soil samples characterization showed the OC was similar for both soils, with lower HA and FA percentage in Osorno soil (4.0 HA y 3.0 FA) than Vilcun soil (6.0 HA y 5.0 FA). Higher OH-phenolic content for Vilcun soil (3,5%) is the main difference in the functional groups, suggesting a lesser condensation degree, with a lesser humidification than HA in Osorno soil (1.5%). The pKa1 and pKa2 obtained using GEOCHEM-PC and CCM do not present important differences (Table 1). However the program considers the speciation to constant ionic strength, while CCM is able to consider different ionic strength. Then, the acidity constants determined by CCM are more close to real values.
Table 1. Acidity constants from samples
pKa1 pKa2 pKa1 pKa2 Osorno (a) (b)
Al-Si-Fe-I - 2% 3.0 6.9 4.7 8.2 Al-Si-Fe-II- 2% 2.9 6.8 3.9 7.1 Al-Si-Fe-I - 6% 2.8 7.0 4.9 7.6 Al-Si-Fe-II- 6% 3.5 6.8 3.1 6.5
pKa1 pKa2 pKa1 pKa2 Vilcún (a) (b)
Al-Si-Fe-I - 2% 3.5 6.7 3.5 6.9 Al-Si-Fe-II- 2% 3.6 6.8 3.7 6.8 Al-Si-Fe-I - 6% 3.4 6.7 3.2 6.0 Al-Si-Fe-II- 6% 4.0 6.8 3.1 6.7
(a) GEOCHEM-PC (b) CCM
4. CONCLUSIONS
If both the CCM and GEOCHEM-PC were able to describe the surface behavior of
both synthetic aluminosilicates cover with natural humic acids isolated from Andisol.
ACKNOWLEDGEMENTS
Fondecyt 1920560 and Sagu Fisher Scientific.
REFERENCES
1. Canales M.J., Mora M.L., Aguirre M.J., Antilen M., Briceño M (2006) 13th meeting of the IHSS.
July 30 to August 4, 2006-Karlsrube, Germany.
2. Stumm, W.R., Kummert R., and Gigg L. (1980) Croat. Chem Acta 53, 291-312.
3. Canales M.J., Mora M.L., Aguirre M.J., Antilen M., Briceño M (2007). XVII Congreso
Latinoamericano de la Ciencia del Suelo, 17 al 21 de Septiembre, León de Guanajuato,
México.
400

Correspondence Analysis of Microbe Species in the Formation of Humic Acid
Wei Zhang2, Jun-tao Cui1, Sen Dou1, Tian-shu Cao1 1Jilin Agricultural University, XinCheng Street, 130118, Changchun, Jilin Province, China,
[email protected] 2Changchun Agricultural school, Xinglongshan, 130000, Changchun, Jilin Province, China
Keywords: microbe, correspondence analysis, humic acid
1. INTRODUCTION
Microorganisms are the driving force behind the formation, transformation,
degradation and mineralization of humic substances (1). A recent study (2) linked to global
warming revealed that over a 6 y period under elevated CO2, soil carbon was reduced by
half, with this decline driven by the activity of the soil microbial community. However, their
relative abundance and role during turnover of humic substances are still unclear (3, 4).
Correspondence analysis (CA) is a technique for studying the associations among a
set of variables by graphically displaying the patterns and structures existing in the data
which serves as a window onto the data. The method has been widely applied to
multivariate data analysis in, for example, sociology, environmental science, and
marketing research. In this paper, we explore the feasibility of applying the method to deal
with high dimensional microarray data produced in experiments in the relationship
between microbe species and humic acid formation studies. Combined with a bootstrap
procedure using sample replicates, we show how the nice feature of the relationship
between microbe species and humic acid formation. The significance of our approach in
microarray data analysis in the studies is discussed at the end of the presentation.
2. MATERIALS AND METHODS
Materials: Sampling site locates in Liujia village, Nong An county, Jilin province,
China. (N: 44°11'39.7’’, E: 125°07’58.5’’). Samples for this study were collected from 0-
40 cm depth, uncultivated soil. Microbial species for test: B1: Arthrobacter citreus;
B2: A. globiformis; B3: Agrobacterium radiobacter var. I; B4: Pseudomonas
pseudoalaligenes; B5: P. fluorescens var. I; B6: Bacillus subtilis; B7: B. mycoides;
B8: C. fimi; B9: Pantoea agglomerans; B10: Pantoea soilia; B11: P. vulgaris;
B12: B. megaterium; B13: Agrobacterium radiobacter var. I; B14: Ac. calcoaceticus;
B15: Micrococcus; B16: C. flavigena; B17: Ac. johnsonii; B18: Xanthobacter flavus;
401

B19: P. stutzeri; B20: B. cerecus; B21: other bacteria; S1: S. albus; S2: S. caeruleus;
S3: S. chromfuscus; S4: Nocardia rubropertincta; S5: Nocardia convoluta;
S6: S. roseoviolaceus; S7: S. canescens; F1: A. niger; F2: P. expansum; F3: P. nebulosa;
F4: P. putaminum; F5: A. versicolor; F6: B. cinerea; F7: T. viriderma; F8: M. spinescens;
F9: R. stolonifer; F10: other fungi.
Methods: After added 2% (w/w) corn stalk powder in soil, fully mixed them together,
and then put it (50 g) into a glass bottle with cotton plug, sterilized at 121°C, 2 hours,
inoculated pure culture to each glass bottle, Water content: 30%, culture temperature:
25°C, 180 days, 3 times. Contrast soil samples without any microorganisms in soil. The
method of Humic acid and fulvic acid isolation is according to (6).
3. RESULTS AND DISCUSSION
3.1. The results shown: After 180 d culture the amounts of soil humic acid in soil
samples are substantially similar to each other, they concentrated in the center of
coordinate axis, but not all the microbe participate in the transformation of soil humic acid.
Among them, Arthrobacter citreus, A. globiformis, N. convoluta, Aspergillus niger,
Penicilium expansum, Phoma putaminum and Ph. nebulosa take part in the transformation
of soil humic acid. But Cellulomonas fimi, S. chromfuscus, Nocardia rubropertincta,
Bacillus subtilis do not taken part in the formation and transformation of HA (Fig. 1, Fig. 2).
3.2. Although bacteria and fungi both participate in the transformation of humic acid,
fungi may dominate the process of humic acid transformation (Fig. 1).
Figure 1. Relationship between streptomyces, fungi and HA.
402
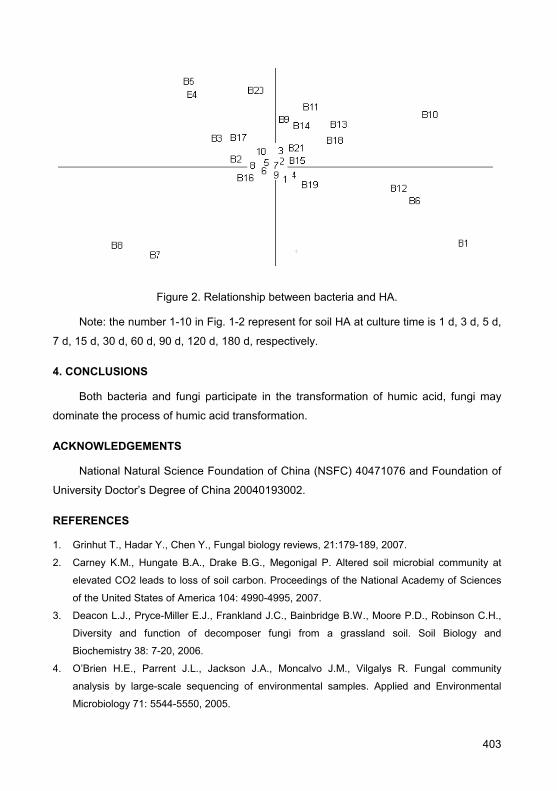
Figure 2. Relationship between bacteria and HA.
Note: the number 1-10 in Fig. 1-2 represent for soil HA at culture time is 1 d, 3 d, 5 d,
7 d, 15 d, 30 d, 60 d, 90 d, 120 d, 180 d, respectively.
4. CONCLUSIONS
Both bacteria and fungi participate in the transformation of humic acid, fungi may
dominate the process of humic acid transformation.
ACKNOWLEDGEMENTS
National Natural Science Foundation of China (NSFC) 40471076 and Foundation of
University Doctor’s Degree of China 20040193002.
REFERENCES
1. Grinhut T., Hadar Y., Chen Y., Fungal biology reviews, 21:179-189, 2007.
2. Carney K.M., Hungate B.A., Drake B.G., Megonigal P. Altered soil microbial community at
elevated CO2 leads to loss of soil carbon. Proceedings of the National Academy of Sciences
of the United States of America 104: 4990-4995, 2007.
3. Deacon L.J., Pryce-Miller E.J., Frankland J.C., Bainbridge B.W., Moore P.D., Robinson C.H.,
Diversity and function of decomposer fungi from a grassland soil. Soil Biology and
Biochemistry 38: 7-20, 2006.
4. O’Brien H.E., Parrent J.L., Jackson J.A., Moncalvo J.M., Vilgalys R. Fungal community
analysis by large-scale sequencing of environmental samples. Applied and Environmental
Microbiology 71: 5544-5550, 2005.
403

5. Everitt B.S. and G. Dunn. Applied multivariate data analysis. (2nd ed.), Arnold press, London,
2001.
6. Zhang J.-J., Dou S. Dynamic changes of FA and HA in ignited soil during corn stalk
decomposition, Journal of Jilin Agricultural University, 24(3),60-64, 2002.
404
Testing Online Collaboration on Trace Metal-Humic Binding Modelling
Montserrat Filella SCHEMA, Rue Principale 92, L-6990 Rameldange, Luxembourg, [email protected]
Keywords: humic, fulvic, natural organic matter, metal binding, complexation constants, models
1. INTRODUCTION
Ten years ago, W. Hummel, in one of the best reviews ever published on binding
models for humic substances, described the situation faced by any modeller as a “veritable
jungle” (1). The situation is even worse for any potential model user freshly embarking in
the field or for any scientist who simply wishes to gain an understanding of the scientific
literature. Reading the many reviews that exist on the subject may be very useful to all the
potential ‘explorers’ of this jungle, whether modellers, users or ‘outsiders’, but these
reviews are sometimes difficult to follow, often lack the practical details indispensable for
practical applications, and are unavoidably biased by the subjective appreciation of the
‘expert’ who wrote them. Thus, review papers alone rarely provide the complete picture.
It is important to note that such a myriad of models exist not because of the caprices
of model developers. Rather, this stems from the fact that the nature itself of the trace
element binding properties of humic-type substances severely hampers description: they
are undefined complex mixtures of organic compounds that defy the rules commonly
applied to other types of chemical substances. This has the serious consequence that, in
all probability, there will never be a universal, definitive model and that humic-binding
models are ‘empirical’ by nature, their usefulness finally being directly related to their
ability to solve particular problems. Scientists trained in disciplines where mechanistic
models, based on first-principles, are highly praised find this fact difficult to accept.
Choosing the most appropriate model for solving a particular problem may be
facilitated by taking an evidence-based approach, similar to those developed in the
medical sciences (2, 3). This path has rarely been explored in environmental sciences. It
requires clear information about the existing approaches and access to the models. The
online collaboration described here will hopefully be a first step in this direction.
2. TRACKING AND ARCHIVING MODELS
Most of the models described in the literature require specific computer applications
in order to be applied. In practice, however, most of these applications are now
unavailable. Various factors have led to this situation:
405
- Although code obsolescence is a problem faced in many different environments
(business, government, academia, etc), it is particularly serious in the academic world
where the economic incentive to upgrade programs is lacking and where know-how is
often lost due to the complexities of the academic world.
- Some models were intended to be used only once. A typical example would be the
“oligotroelectrolyte model” developed by Bartschat and co-workers (4). This model has
been abundantly cited (146 times according to the Web of Knowledge) and described in
virtually every review on the subject but, to our knowledge, it was used only once to
produce the original publication. It probably constitutes a perfect example of the halo effect
of scientists working in high-prestige institutions (5, 6).
- Most of the models never had a finished, optimized version. Computer code is
usually developed as part of a PhD thesis or project and used only by the developer and a
limited number of collaborators. Often, user-friendly and well-documented copies are
never produced and distributed.
The result is that (i) an incredible amount of scientific knowledge is in fact lost; (ii)
only readily-available models are used in practice, irrespective of their actual value and
suitability with regard to the problem that needs to be solved; (iii) significant amounts of
time are lost reinventing the wheel.
The collaborative web portal being developed contains links to available code and
may act as a repository for any existing program. An ’open source‘ approach whereby
obsolete code is made available to be improved will be used, subject to the approval of the
original developers.
3. A COLLABORATIVE WEB PORTAL THE WIKI WAY
The scientific literature describing and modelling trace element binding by NOM
includes four types of publications: (i) original publications where the model is initially
described by the developers and possibly modified later; (ii) applications of the models by
end-users; (iii) papers comparing models; (iv) review papers. As mentioned above, finding
one’s way through this ‘jungle’ is far from straightforward. Many traps are lying in wait for
the unwary:
- Often models are published without having undergone the necessary validation
process. Over time, mistakes are discovered (or the repeated use of the code reveals
some shortcomings) and, hopefully, corrected. This process produces a saga of articles
where the logical thread is difficult to follow and from which misunderstandings easily
406
arise. For instance, just such a situation recently prompted the developers of a popular
model, the NICCA-DONAN model, to devote an entire paper to clarifying the situation (7).
- In the cases where the code is available, the developers’ help is needed to apply it
correctly. At least, a quick review of the applications of Model VI-WHAM (8) and the
NICCA-DONAN model (7) in a well-known journal, Environmental Science and Technology
(years 2002-2007) shows that in a significant percentage of the articles where these
models are applied, either the developer appears as an author or the study has been
performed in close connection with his lab.
- By nature, model developers always think that their own models are the best and an
objective exchange of experiences becomes difficult.
The above considerations mean that an online portal where information is contributed
and updated by the developers themselves and the users would be extremely valuable.
However, this is difficult to achieve through the traditional channels of scientific
communication (conferences, peer-reviewed articles) because of their lack of ‘reactivity’
and limited audience. New collaborative tools such as wikis may provide a better platform.
A wiki is a type of website that can be directly edited by visitors using only their web
browser. Wikis are useful for collaborative document creation because document viewing
and editing are integrated on-line. The changes to the wiki are stored in a database on a
web server and are immediately visible to visitors. A record of all changes is also stored in
the database so that older versions of the site’s pages can be restored. The construction
of a wiki on humic binding modelling may help to establish a neutral, permanently updated
reference.
4. FOLLOW-UP OF THE LITERATURE THE BLOG WAY
New applications of existing models continuously appear in the scientific literature.
Comprehensive follow-up is difficult and, in all probability, not worthwhile. Publication of
reviews and compilations is time-consuming and relatively slow. Moreover, personal
opinions and experiences cannot always be adequately reflected in such publications. An
experiment is underway whereby new publications will be spotted and referenced and, if
deemed interesting, commented on in a blog. The very nature of such coverage means it
makes no claim to being comprehensive and the contents will be, to a certain extent,
subjective. Information on ‘buried’ ideas and papers will also occasionally be commented
on. The overall objective is to stimulate feedback and the exchange of experiences in the
‘humic binding community’.
407
REFERENCES
1. Hummel, W. 1997. In: Modelling in Aquatic Chemistry, I. Grenthe and I. Puigdomenech (Eds.),
Nuclear Energy Agency, Paris, pp. 153-206.
2. Sackett, D.L., Rosenberg, W.M., Gray, J.A., Haynes, R.B., Richardson, W.S. 1996. BMJ 312,
71-72.
3. Elstein, A.S. 2004. Inflamm. Res. 53 Suppl 2, S184-S189.
4. Bartschat, B.M., Cabaniss, S.E., Morel, F.M.M. 1992. Environ. Sci. Technol. 26, 284-294.
5. Cole, J.R., Cole. S. 1972. Science 178, 368-375.
6. Cole, J.R., Cole. S. 1973. Social Stratification in Science. University of Chicago Press,
Chicago.
7. Koopal, L.K., Saito, T., Pinheiro, J.P., van Riemsdijk, W.H. 2005. Coll. Surf. A 265, 40-54.
8. Tipping, E. 2002. Cation Binding by Humic Substances. Cambridge University Press,
Cambridge.
408

Influence of Sorption to Dissolved Humic Substances on Transformation Reactions of Organic Compounds in Water
Anett Georgi, Frank-Dieter Kopinke UFZ – Helmholtz-Centre for Environmental Research, Department of Environmental Technology,
Permoserstrasse 15, D-04318 Leipzig, Germany, [email protected]
Keywords: dissolved humic substances, hydrolysis, chlorination, catalysis
1. INTRODUCTION
Dissolved humic substances (DOM) as ubiquitous components of natural waters can
sorb hydrophobic organic xenobiotics and thereby affect their fate in the environment.
Sorption phenomena on DOM have been extensively studied in recent decades. Several
models allowing a quantitative prediction of the extent of sorption depending on sorbate
and DOM properties have been proposed. However, the effect of sorption on trans-
formation and degradation reactions of the sorbates is less well understood. In the present
study the influence of DOM on two types of chemical reactions is investigated: (i) hydroly-
sis under alkaline and acidic conditions, and (ii) chlorination of polycyclic aromatic hydro-
carbons (PAHs).
2. MATERIALS AND METHODS
Typically batch experiments were conducted with aqueous solutions of two commer-
cial humic acids (Roth-HA from Carl Roth GmbH, Karlsruhe, Germany and Aldrich-HA
from Sigma-Aldrich Chemie GmbH, Muenchen, Germany) as well as one natural aquatic
HA from a brown-water lake (Hohlohsee, Germany) were used. This HA is a reference
sample of the German research project ROSIG. Measurement of reaction kinetics and
identification of products were conducted by GC-MS analyses, combined with headspace
sampling or liquid-liquid extraction. Sorption coefficients were determined by means of
solid-phase microextraction (SPME). Details of the applied methods are given in (1-3).
3. RESULTS AND DISCUSSION
The effect of DOM on two types of hydrolysis reactions was investigated: (i) dehydrochlorination of γ-hexachlorocyclohexane (HCH) and 1,1,2,2-tetrachloroethane (TeCA) as reactions involving OH- and (ii) hydrolysis of 1-octyl acetate (OA) which is catalyzed by H+ at the applied pH value (pH 4.5). The rate of TeCA hydrolysis was not affected by addition of up to 2 g L-1 of HA at pH 10 (k = 0.33 h-1) but HCH hydrolysis was significantly inhibited (k = 4.6 · 10-3 h-1 without HA and 2.8 · 10-3 h-1 at 2 g L-1 HA). HCH is
409
sorbed to 51% whereas TeCA sorption is insignificant at this HA concentration. Apparently, sorbed HCH molecules are effectively protected due to electrostatic repulsion of OH- by the net negative charge of the HA molecules. In contrast, OA hydrolysis at pH 4.5 (k = 1.6 · 10-5 h-1) was drastically accelerated after addition of 2 g L-1 HA (k = 1.1 · 10-3 h-1). The ratio of the pseudo-first-order rate constants of the sorbed and the freely dissolved ester fractions is about 70. This rate enhancement can be explained by H+
accumulation in the microenvironment of the negatively charged HA molecules. The addition of DOM accelerated the chlorination of fluoranthene and naphthalene as
two representatives of the class of PAHs in hypochlorite solutions at pH 5. The stronger effect was observed for fluoranthene that is sorbed to a higher extent than naphthalene. The observed rate constant for fluoranthene chlorination is larger by a factor of 5 in the presence of 10 mg L-1 of an aquatic HA as compared to HA-free solution. While Cl2 is the dominant reactive species in pure aqueous solution for both PAHs, the reaction of fluoranthene seems to involve an additional pathway of chlorination by HOCl in the presence of HA. It was found that not only HA did not protect PAHs from the electrophilic attack - as could be expected - but sorption of PAHs on the hydrophobic domains of the HA favoured instead the extent of the chlorination reaction.
4. CONCLUSIONS
In order to understand the effects of DOM on different chemical reactions it is
necessary to consider the nature of the reacting species and of the microenvironment of
sorbed molecules. The net effect can be a shielding of the sorbed substrate as well as an
acceleration of its transformation.
Hydrolysis is not only an important mechanism for the transformation of xenobiotics
in the environment but also for the degradation and transformation of 'biogenic waste'. The
finding that DOM is able to accelerate acid-catalyzed hydrolysis reactions brings up the
interesting question of whether humic substances might themselves act as catalysts of the
humification process by means of this mechanism.
REFERENCES
1. Georgi, A. , Schierz, A., Trommler, U., Horwitz, C. P., Collins, T. J., Kopinke, F.�D. 2007.
Appl. Cat. B 72, 26-36.
2. Georgi, A., Reimer, A., Trommler, U., Kopinke, F.-D. 2007. Environ. Sci. Technol. 41, 7003-
7009.
3. Georgi, A., Trommler, U., Reichl, A., Kopinke, F.-D. 2007. Chemosphere, in press.
410
Ultrafiltration Behaviour of Nitrophenols in the Presence of Humic Substances
Negin Ghaemi1, Sayed S. Madaeni1, Andrea Cudini2, Aldo Bertoni2, Maria De Nobili2 1Department of Chemical Engineering, Razi University, Tagh Bostan, 67149 Kermanshah, Iran 2Dipartimento di Scienze Agrarie ed Ambientali, Università di Udine, via delle Scienze 208, 33100
Udine, Italy, [email protected]
Keywords: nitroaromatic compounds, ultrafiltration, humic substances
1. INTRODUCTION
Nitrophenols (NP) and 2,4-dinitrophenol (DNP) in particular, are listed as priority
pollutants by the US Environmental Protection Agency (EPA) because of their strong
phytotoxic activity which is enhanced by their long-term chemical and photochemical
stability. These compounds are used as reagents in the manufacture of dyes, drugs,
fungicides and pesticides. As pollutants, the nitrophenols are almost entirely attributed to
anthropogenic sources, however they are also formed in the atmosphere by OH-initiated
photo-oxidation of aromatic hydrocarbons (1) and are therefore largely diffuse in the
environment. The use of ultrafiltration for water treatment is nowadays growing rapidly and
membrane processes, have received considerable attention because of the lower costs,
simplicity of operation and addition of fewer chemicals. The retention of solutes depends
on the size and shape of the solutes relative to the pore sizes of the membrane and is
influenced by interactions, not only between membrane and solute but also by chemical
properties of the solution and interactions among solutes (3). It is therefore important to
understand the effect of common components of dissolved natural organic matter, such as
humic substances on the ultrafiltration behaviour of these compounds. In this work we
examined a series of NP of different acidity and hydrophobicity and studied whether their
ultrafiltration behaviour was affected by the presence of dissolved humic acids.
2. MATERIALS AND METHODS
Ultrafiltrations of 4 nitrophenol, 2,4 dinitrophenol, 3 methyl 2,4 dinitrophenol,
dinitrosalycilic acid and 4 nitro phenilphosphate solutions (0.5 mM, pH=7.0 and pH=4.5)
were carried out with Amicon YM3 ultrafiltration membranes (d=62 mm, cut off for proteins
3000 daltons). The flux was set at 1 ml/minute by adjusting the pressure of N2 gas
connected to the ultrafiltration cell. At the beginning of each experiment, the volume inside
411
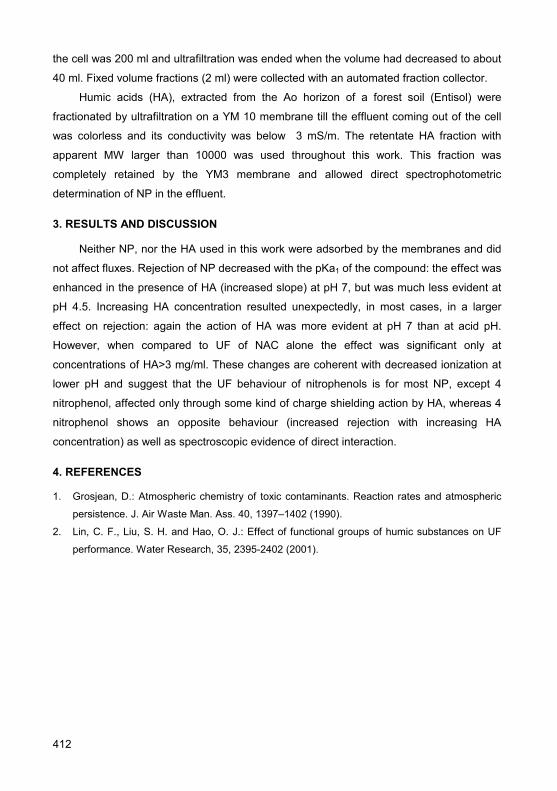
the cell was 200 ml and ultrafiltration was ended when the volume had decreased to about
40 ml. Fixed volume fractions (2 ml) were collected with an automated fraction collector.
Humic acids (HA), extracted from the Ao horizon of a forest soil (Entisol) were
fractionated by ultrafiltration on a YM 10 membrane till the effluent coming out of the cell
was colorless and its conductivity was below 3 mS/m. The retentate HA fraction with
apparent MW larger than 10000 was used throughout this work. This fraction was
completely retained by the YM3 membrane and allowed direct spectrophotometric
determination of NP in the effluent.
3. RESULTS AND DISCUSSION
Neither NP, nor the HA used in this work were adsorbed by the membranes and did
not affect fluxes. Rejection of NP decreased with the pKa1 of the compound: the effect was
enhanced in the presence of HA (increased slope) at pH 7, but was much less evident at
pH 4.5. Increasing HA concentration resulted unexpectedly, in most cases, in a larger
effect on rejection: again the action of HA was more evident at pH 7 than at acid pH.
However, when compared to UF of NAC alone the effect was significant only at
concentrations of HA>3 mg/ml. These changes are coherent with decreased ionization at
lower pH and suggest that the UF behaviour of nitrophenols is for most NP, except 4
nitrophenol, affected only through some kind of charge shielding action by HA, whereas 4
nitrophenol shows an opposite behaviour (increased rejection with increasing HA
concentration) as well as spectroscopic evidence of direct interaction.
4. REFERENCES
1. Grosjean, D.: Atmospheric chemistry of toxic contaminants. Reaction rates and atmospheric
persistence. J. Air Waste Man. Ass. 40, 1397–1402 (1990).
2. Lin, C. F., Liu, S. H. and Hao, O. J.: Effect of functional groups of humic substances on UF
performance. Water Research, 35, 2395-2402 (2001).
412

Interaction Selectivity between Lignin and Phenolic Compounds
V. Daniela Barrera Garcia1, Jean Pierre Bellat2, Philippe Cayot3, Andrée Voilley3,
Régis D. Gougeon1, David Chassagne1 1Equipe EMMA, Institut Universitaire de la Vigne et du Vin - Jules Guyot, Université de Bourgogne,
Campus Montmuzard, 21078 Dijon France, [email protected] 2Institut Carnot de Bourgogne, UMR 5209, CNRS-Université de Bourgogne, 9 avenue A. Savary
BP 47870, 21078 Dijon Cedex, France 3Equipe EMMA, ENSBANA, Université de Bourgogne, 1 Esplanade Erasme, 21079 Dijon France
Keywords: lignin, phenolics, sorption
1. INTRODUCTION
Sorption of phenolic compounds onto wood actually occurs in several different
situations, which go from environmental processes such as water decontamination (1,2) to
food processes such as barrel aging of wines (3,4). Although the composition of the liquid
medium differs between these systems, sorption mechanisms appear to rely on some
common features, one of which being that among wood macromolecules, lignin seems to
be responsable for the selective sorption of aromatic hydrocarbons (1,2,5,6). Here we
report a study of the sorption of phenolic compounds onto oak wood or lignin, either in the
vapour phase or in an acidic liquid medium, with the aim of discriminating and
characterizing different possible mechanisms according to the nature of the phenolics.
2. MATERIALS AND METHODS
Phenolics were purchased from Sigma- Aldrich (4-propylguaiacol, 4-vinylguaiacol,
resveratrol) or TCI-EP (4-methylguaicol, 4-ethylguaiacol, 4-ethylphenol), all with a
minimum purity of 98%, and used as received.
Wood plates (2x10x20 mm) were donated by the Office National des Forêts (ONF,
France) and taken from trees of Quercus robur oak from the Cîteaux forest (France).
Lignin has been extracted from similar wood samples using HCl-acidified dioxane (6).
Sorption isotherms in the liquid phase were recorded after immersing for 10 days at
10°C, either a wood plate or lignin powder in a buffer (12 % v/v hydroalcoolic solution, pH
3.5) containing phenolics in mixture or alone. Concentration measurements in the liquid
phase were done in triplicate after liquid-liquid extraction with dichloromethane, by gas
chromatography (GC TRACE ULTRA,Thermo Electron Corporation with a flame ionisation
detector; CP-WAX 57CB column: 25 m x 0.25 id; 0.2 µm bonded phase; 3,4-
dimethylphenol was added as an internal standard) or by HPLC (resveratrol).
413

Isothermal adsorption experiments in vapor phase have been performed using a
home-made McBain type thermobalance, at 298 K, on sample weights of about 20 ± 0.02
mg. The saturated vapor pressure was recorded with an MKS Baratron gauge with a
relative precision of 1%. The experimental accuracy is ±0.02 mg for the adsorbate weight.
Investigated pressures ranged from 10-5 hPa to a value close to the saturated vapour
pressure of the adsorptive fluid at 298 K.
3. RESULTS AND DISCUSSION
Whether the sorbent was wood or extracted lignin, essentially two kinds of sorption
isotherms were recorded for guaiacol-related phenolics within the 0 – 35 mg/kg range of
concentrations at equilibrium (Figure 1). Linear isotherms were observed for all
compounds except for 4-vinylguaiacol where a continuous non-linear increase was
apparent.
4-ethylguaiacol 4-vinylguaiacol
0 5 10 15 20 25 30 35
2000
4000
6000
8000
10000
12000
0 5 10 15 20 25 30 35
2000
4000
6000
8000
10000
12000
Cequilibrium (mg/kg)
Cad
sorb
ed(m
g/kg
)
4-ethylguaiacol 4-vinylguaiacol4-ethylguaiacol 4-vinylguaiacol
0 5 10 15 20 25 30 35
2000
4000
6000
8000
10000
12000
0 5 10 15 20 25 30 35
2000
4000
6000
8000
10000
12000
Cequilibrium (mg/kg)
Cad
sorb
ed(m
g/kg
)
4-ethylguaiacol 4-vinylguaiacol
Figure 1. Sorption isotherms of 4-ethylguaiacol and 4-vinylguaiacol onto lignin at 10°C.
From the initial linear part of these isotherms, partition coefficients (Kw so-called
Henry constants) were measured. As can be seen from figure 2, including the value for
resveratrol, we have determined that, except for 4-vinylguaiacol, there is a good
correlation between the wood-acidic buffer partition coefficient of a given compound and
its hydrophobicity (logP), whereas partition coefficients are inversely correlated to
solubilities (S) of compounds in the acidic buffer. This trend is particularly well illustrated
by the homologous series of alkylguaiacols, where partition coefficients linearly increase
with the length of the para side chain. In agreement with related studies in the literature,
we postulated that lignin, which is the constitutive wood macromolecule which exhibits the
strongest hydrophobic character was responsible for this selective sorption behaviour.
Indeed, we have observed that neither cellulose nor xylan lead to any sorption selectivity
among phenolics (6).
414
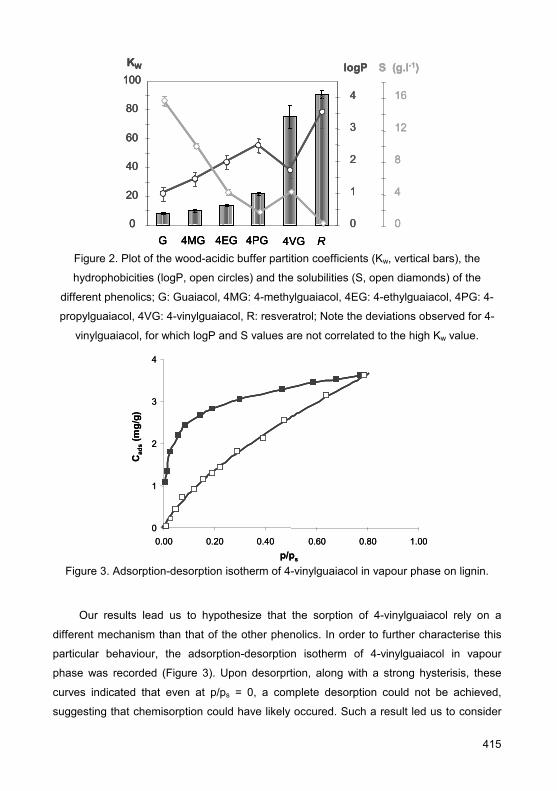
0
20
40
60
80
100
G 4MG 4EG 4PG 4VG R
KW
0
1
2
3
4
logP
0
4
8
12
16
S (g.l-1)
0
20
40
60
80
100
G 4MG 4EG 4PG 4VG R
KW
0
1
2
3
4
logP
0
4
8
12
16
S (g.l-1)
0
20
40
60
80
100
G 4MG 4EG 4PG 4VG R
KW
0
1
2
3
4
logP
0
4
8
12
16
S (g.l-1)
Figure 2. Plot of the wood-acidic buffer partition coefficients (Kw, vertical bars), the
hydrophobicities (logP, open circles) and the solubilities (S, open diamonds) of the
different phenolics; G: Guaiacol, 4MG: 4-methylguaiacol, 4EG: 4-ethylguaiacol, 4PG: 4-
propylguaiacol, 4VG: 4-vinylguaiacol, R: resveratrol; Note the deviations observed for 4-
vinylguaiacol, for which logP and S values are not correlated to the high Kw value.
Cad
s(m
g/g)
p/ps
0
1
2
3
4
0.00 0.20 0.40 0.60 0.80 1.00
Cad
s(m
g/g)
p/ps
0
1
2
3
4
0.00 0.20 0.40 0.60 0.80 1.00
Figure 3. Adsorption-desorption isotherm of 4-vinylguaiacol in vapour phase on lignin.
Our results lead us to hypothesize that the sorption of 4-vinylguaiacol rely on a
different mechanism than that of the other phenolics. In order to further characterise this
particular behaviour, the adsorption-desorption isotherm of 4-vinylguaiacol in vapour
phase was recorded (Figure 3). Upon desorprtion, along with a strong hysterisis, these
curves indicated that even at p/ps = 0, a complete desorption could not be achieved,
suggesting that chemisorption could have likely occured. Such a result led us to consider
415

selective reactions between the conjugated para-double bond of 4-vinylguaiacol and
reactive moieties of the lignin network. Since 4-vinylguaiacol had been shown to self-
polymerise through acidic promotion by phenolic OH groups (7), we hypothesized that it
could react with lignin OH groups through an acid-catalysed addition to the double bond to
form aryl ether bridges. FTIR and NMR results supported this hypothesis (8).
4. CONCLUSIONS
Beyond the sorption selectivity exhibited by wood, that we mainly attributed to its
lignin hydrophobic macromolecular network, our results bring insights into the ability of
natural lignocellulosic materials to sorb targeted compounds. These can either be non-
desirable pollutants or high-value nutrients such as the acclaimed antioxydant stilbene
resveratrol. In the latter case, lignocellulosic materials could be considered as candidates
for further controlled release applications.
ACKNOWLEDGEMENTS
This work was financially supported by the Region Bourgogne Council and the
AROBOIS Company (France). V.D. Barrera-García is grateful to CONACyT-Mexico for
financial support.
REFERENCES
1. Boving, T.B., Zhang, W. 2004. Chemosphere 54, 831-839.
2. Garbarini, D.R., Lion, L.W. 1986. Environ. Sci. Tech. 20, 1263-1269.
3. Barrera-Garcia, V.D., Gougeon, R.D., Voilley, A., Chassagne, D. 2006. J Agric. Food Chem.
54, 3982-3989.
4. Barrera-Garcia, V.D., Gougeon, R.D., Di Majo, D., De Aguirre, C., Voilley, A., Chassagne, D.
2007. J. Agric. Food Chem. 55, 7021-7028.
5. Severtson, S.J., Banerjee, S. 1996. Environ. Sci. Tech. 30, 1961-1969.
6. Barrera-Garcia, V.D., Gougeon, R., Karbowiak, T., Voilley, A., Chassagne, D. J. Coll. Int. Sci.
Submitted
7. Kodaira, K., Onishi, Y., Ito, K. 1980. Die Makromol. Chem. Rapid Commun. 1, 427-431
8. Barrera-Garcia, V.D., Bellat, J.P., Bertrand, O., Paulin, C., Delmotte, L. Gougeon, R.D.,
Chassagne, D. Langmuir. submitted
416

Experimental Analysis of Sorption of Environmental Chemicals to Model Soil Organic Matter
Heiko Hammer1,2, Albrecht Paschke1, Gerrit Schüürmann1,2 1Department of Ecological Chemistry, UFZ Helmholtz Centre for Environmental Research, 04318,
Leipzig, Germany, [email protected] 2Institute for Organic Chemistry, TU Bergakademie Freiberg, 09596 Freiberg, Germany
Keywords: soil sorption, pH dependence, humic substances, HPLC
1. INTRODUCTION
Sorption of environmental chemicals to soils and sediments affects their mobility and
fate. The predominant sorbent phase for organic compounds is the organic carbon (OC)
fraction (fOC > 0.001 g/g) of the solid matrix (1). The soil organic matter consists mainly of
humic substances, proteins and carbohydrates. Humic substances are anionic
polyelectrolytes which are very heterogeneous in terms of structure and physical and
chemical properties. Instead of solubility they were divide in three groups humine, humic
acids and fulvic acids. Humic substances Polar functional groups (amine, amid and
carboxylic groups) and hydrophobic moieties are characteristic elements of humic
substances, and form sites of interaction with environmental chemicals (2). Normalization
of the solid-liquid partition coefficient of the solute, Kd, to the OC content of the matrix
results in Koc = Kd / foc, a relation that is often used as quantitative measure of the
sorption process. Sorption coefficients Koc of ionizable compounds depend on their
degree of dissociation (α), the latter of which is governed by the pH of the matrix and the
pKa of the solute.
2. MATERIALS AND METHODS
The compounds listed in Figure 1 were obtained from several companies as pure
compounds. The RP-HPLC system used was a LaChrom Merck Hitachi system with L
4500 Diode Array Detector, tempered column oven at 25°C and auto sampler. The
Nucleosil OH and Nucleosil NH columns (250 mm x 4.6 mm, 100 - 5 µm) were packed
from Macherey-Nagel, Zorbax CN column from Agilent, and the humic acid immobilized
Nucleosil column from MZ Analysentechnik. The eluent was an aqueous buffer, which was
made of bidistilled water, solid phosphate tablets and hydrochloric acid. Koc values of the
compounds were determined through measuring their retention times, employing the
417

column at 100 vol. % aqueous buffer. The capacity coefficients (k’w) were obtained from
retention and dead time. Koc was calculated by the equation Koc = 'wk • (VM/Voc) • ρsorb,
where VM is the volume of the mobile phase in the column, Voc the organic carbon volume
of the stationary phase, and ρSorb the density of the column material. For weak organic
acids and bases, Koc was determined at pH 3, 5 and 7. Here, Koc is given by Koc = Koc,un •
(1-α) + Koc,diss • α, keeping in mind that these compounds are (mainly) undissociated at pH
≤ 3, and (mainly) dissociated at pH ≥ 7, respectively (3).
3. RESULTS AND DISCUSSION
Fig. 1 shows that for weak organic acids (bases), log Koc (CN column) decreases
(increases) with increasing pH. The results suggest that for the undissociated species, the
interaction with hydrophobic stationary phases is stronger than for the respective ionized
compound forms.
-1
0
1
2
3
3 5 7pH
log K OC
Aniline
3-Aminophenol
Butyric acid
Propanoic acid
Acrylic acid
Acet acid
Formic acid
Figure 1. Log Koc (CN column) vs. pH for weak organic acids and bases (pKa 3.77…4.88).
In Fig. 2, the log Koc dependence on both the column type and pH is shown for
acetic acid. As can be seen from the figure, the log Koc variation with pH is negligible
418

when using polar stationary phases (OH and NH colums). Respective experiments with
humic acid immobilized Nucleosil column are in progress, and will be compared with
results using the other commercial columns. In addition, pH-dependent results from batch
experiments with dissolved humic substances will be reported.
-1
0
1
2
3
3 5 7
pH
log K OC
CN column OH column NH column
Figure 2. Log KOC of acetic acid vs. pH and column type.
4. CONCLUSIONS
Sorption of weak organic acids and bases depends on the pH-dependent fractions of
their neutral and ionized species. For the former, Koc is governed by hydrophobic
interactions, while the latter interact more strongly with polar components of the matrix. It
follows that indirect chromatographic methods calibrated for neutral organic compounds
can not be employed directly to assess the sorption capacity of ionogenic compounds.
Moreover, for ionogenic compounds the ambient pH triggers the hydrophobic and polar
contributions to sorption. Accordingly, evaluation of the sorption capacity of such
compounds should take into account its variation with pH.
ACKNOWLEDGEMENTS
This work was partly funded by the EU Integrated Project OSIRIS (http://www.osiris-
reach.eu), contract no. 037017, under the EU-theme "Global Change and Ecosystems“.
419
REFERENCES
1. Matthess, G. 1994. Die Beschaffenheit des Grundwassers. – Lehrbuch der Hydrogeologie. –
Bd. 2, 3. Auflage. Borntraeger, Berlin – Stuttgart, Germany, p. 120.
2. Sutton, R., Sposito, G. 2005. Environ. Sci. Technol., 39, 9009-9015.
3. Lee, L. S., Suresh P., Nkedl-Kizza, P., Delfino, J. J. 1990. Environ. Sci. Technol., 24, 654-661
420
Influence of Suwannee River Fulvic Acid on the Speciation and Toxicity of Uranium, Aluminium and Arsenic to Australian Tropical Freshwater Species
Melanie Houston1,2, Jack Ng2, Barry Noller3, Scott Markich4, Rick van Dam1 1Environmental Research Institute of the Supervising Scientist, 812 Darwin, Australia,
[email protected] 2National Research Centre for Environmental Toxicology, University of Queensland, 4108 Coopers
Plains, QLD 3Centre for Mined Land Rehabilitation, University of Queensland, 4067 St Lucia, QLD 4Aquatic Solutions International, 2062 Cammeray, NSW
Keywords: fulvic acid, uranium, speciation, toxicity, tropical, freshwater
1. INTRODUCTION
Mining represents one of the threats to the quality and biodiversity of freshwater
ecosystems in northern Australia. Uranium (U), aluminium (Al) and arsenic (As) are priority
metals of ecotoxicological concern for the region’s mining industry for which insufficient
toxicity data exist (6). Few existing studies (see reviews 8, 3 and 4 for uranium, aluminium
and arsenic, respectively) have incorporated dissolved organic carbon (DOC) as a
variable, despite humic substances having been recognised as playing a major role in
metal speciation for half a century (9). The few tropical freshwater toxicity studies that
have investigated the influence of DOC on metal speciation and bioavailability, have
demonstrated it is a key determinant of metal toxicity (7, 5). It is essential to build upon
these studies in order to gain a comprehensive understanding of the role of DOC in metal
bioavailability and toxicity in tropical freshwater ecosystems.
This study will quantify the influence of DOC on the toxicity of uranium, aluminium
and arsenic to five tropical freshwater species, at a fixed pH, water hardness and alkalinity.
The selected species, Northern Trout gudgeon, Mogurnda mogurnda, green hydra, Hydra
viridissima, the unicellular alga, Chlorella sp. and two species of the unicellular flagellate,
Euglena (E. gracilis and E. mutabilis) were chosen to cover a range of trophic levels.
Laboratory toxicity testing is being conducted using a synthetic soft water and IHSS
Suwannee River Fulvic Acid Standard I (SRFA). Tests will also be conducted using natural
waters with a range of DOC concentrations. SRFA was selected as the organic carbon
source for this study as it is a well characterised reference material (2) and the most
biologically relevant standard for this study.
421
This study aims to: 1) quantify and improve the understanding of the relationship
between dissolved organic carbon (SRFA) and the bioavailability and toxicity of U, Al and
As to tropical freshwater biota, 2) use this relationship to enhance existing ecological risk
assessment methodologies for metals in fresh surface waters; and 3) enhance future
revisions of the Australian and New Zealand Guidelines for Fresh and Marine Water
Quality (1) by incorporating information for bioavailable metal concentrations.
2. MATERIALS AND METHODS
Test organisms were exposed to a range of U concentrations (using uranyl sulphate)
at a range of DOC concentrations (0, 1, 5, 10 and 20 mg/L) using SRFA in a standard
synthetic water. The synthetic water used was of very low ionic strength (low hardness and
alkalinity) and was slightly acidic (pH 6) - characteristic of sandy braided streams in
tropical Australia. Test systems were static with 24 h renewal of test solutions (there was
no renewal for the Chlorella test). Test temperatures were maintained at 27±1°C for M.
mogurnda and H. viridissima and 28±1°C for Chlorella sp. Three tests were run for each
species in order to fully characterise the concentration-response relationships.
The M. mogurnda test measured sac-fry survival over a 96-h exposure period. Each
replicate consisted of 10 newly hatched (unfed) fry in 30 mL test solution. The H.
viridissima test measured population growth rate over a 96-h exposure period. Each
replicate consisted of 10 hydra in 30 mL test solution fed brine shrimp nauplii once daily.
The Chlorella sp. test measured population growth rate, in doublings per day, over a 72-h
exposure period. Each replicate consisted of an initial inoculation of 3x10⁴ algal cells/mL in
30 mL test solution.
For all tests, water parameters (pH, DO, EC) were monitored daily. Water samples
were taken for analyses of DOC (combustion catalytic oxidation), alkalinity (electro
analysis), hardness (based on Ca and Mg concentration) and a standard suite of metals
and major ions (ICP-MS, ICP-AES or ICP-OES). Physicochemical variables were used in
the HARPHRQ geochemical speciation model to determine the effect of DOC on metal
speciation. For each species, response data from three tests were pooled, and
concentration–response relationships were determined (using both simple linear and
multivariate logistic regression analyses).
3. RESULTS AND DISCUSSION
U toxicity was reduced with increasing SRFA for the three species tested.
Concentration-response relationships, and associated linear regressions of toxicity
422

(expressed as IC/LC50) against DOC concentration, are shown in Figure 1. Toxicity
summary and regression equations are shown in Table 1. The decrease in toxicity of U in
the presence of SRFA for all three species can be explained by a reduction in the free
uranyl ion concentration due to its complexation by the fulvic acid.
1a
Uranium (µg/L)
0 2000 4000 6000 8000 10000 12000 14000
Per
cent
age
surv
ival
(as
% o
f con
trol)
0
20
40
60
80
100
0.1 mg/L DOC 1.0 mg/L DOC 4.8 mg/L DOC 9.7 mg/L DOC19.7 mg/L DOC
1b
DOC (mg/L)
0 5 10 15 20 25
LC50
(µg/
L U
)
1000
2000
3000
4000
5000
6000
7000
8000
1c
Uranium (µg/L)
0 200 400 600 800 1000
Popu
latio
n gr
owth
(as
% o
f con
trol)
0
20
40
60
80
100
120
0.3 mg/L DOC 1.3 mg/L DOC 5.4 mg/L DOC10.3 mg/L DOC20.2 mg/L DOC
1d
DOC (mg/L)
0 5 10 15 20 25
IC50
(µg/
L U
)
0
100
200
300
400
500
600
1e
Uranium (µg/L)
0 100 200 300 400 500 600
Gro
wth
rate
(as
% o
f con
trol)
0
20
40
60
80
100
120
0.1 mg/L DOC 1.0 mg/L DOC 4.7 mg/L DOC 9.3 mg/L DOC18.3 mg/L DOC
1f
DOC (mg/L)
0 5 10 15 20 25
IC50
(µg/
L U
)
0
50
100
150
200
250
300
350
400
Figure 1. Effect of DOC on U toxicity to Mogurnda mogurnda (a & b), Hydra viridissima (c
& d) and Chlorella sp. (e & f). Left: concentration-response relationships with curve fits
based on a sigmoidal, 3-parameter model. Right: linear regressions of uranium toxicity
(expressed as the IC/LC50) against DOC concentration.
423

Table 1. Results of uranium testing with three tropical freshwater species
Species IC50 range (µg/L) from 0-20mg/L DOC
Reduction in toxicity
IC50 v DOC Regression equation, adjusted R2, P value
Mogurnda mogurnda 1600-7200 4× IC50=287[DOC]+1548, R2=98%,
P<0.0001 Hydra viridissima 65-470 7× IC50=19[DOC]+85, R2=91%, P<0.0001
Chlorella sp. 40-270 7× IC50=7[DOC]+51, R2=72%, P=0.045
4. CONCLUSIONS
The extent to which DOC ameliorated U toxicity differed for each species. DOC appeared to result in a more gradual (but higher overall) reduction in U toxicity for H. viridissima and Chlorella sp. than M. mogurnda. For M. mogurnda, there was an apparent increase in the threshold U concentration (the point at which survival dropped from 100%) with increasing DOC. However survival fell from 100% to 0% at a similar rate for all DOC concentrations. This may indicate a similar toxic response is occurring across DOC treatments once cation-binding sites of DOC are saturated with U.
Toxicity testing with SRFA for Al and As is still to be conducted. Short term exposures of all three metals to Euglena spp. will assess cell viability and morphology.
ACKNOWLEDGEMENTS
This project is funded by an ARC-Linkage grant (LP 0562507). EnTox is a partnership between Queensland Health and the University of Queensland.
REFERENCES
1. ANZECC, ARMCANZ 2000. Australian and New Zealand Guidelines for fresh and marine
water quality, Canberra.
2. Cabaniss, S. E., Shuman, M. S. 1988. Geochim Cosmochim Ac. 52, 185-193.
3. Gensemer, R. W., Playle, R. C. 1999. Crit Rev Env Sci Tec. 29 (4), 315-450.
4. Gomez-Caminero, A., Howe, P., Hughes, M., Kenyon, E., Lewis, D. R., Moore, M., Ng, J.,
Aitio, A., Becking, G. 2001. Environmental health criteria for arsenic and arsenic compounds,
World Health Organisation.
5. Hogan, A. C., van Dam, R. A., Markich, S. J., Camilleri, C. 2005. Aquat Toxicol. 75, 343-353.
6. Markich, S. J., Camilleri, C. 1997. Supervising Scientist Report 155. Department of
Environment, Water, Heritage and the Arts.
7. Markich, S.J., Brown, P.L., Jeffree, R.A., Lim, R.P. 2000. Aquat Toxicol. 51, 155-175.
8. Sheppard, S. C., Sheppard, M. I., Gallerand, M. and Sanipelli, B. 2005. Derivation of
ecotoxicity thresholds for uranium. J Environ Radioactiv. 79, 55-83.
9. Tipping, E. (2002). Cation binding by humic substances. New York, Cambridge University
Press.
424

Uptake of Humic Substances by Plants: a Study Using Tritium Autoradiography and FTICR MS Analysis
Natalia Kulikova1, Gennady Badun2, Erast Kunenkov2, Viktor Korobkov2, Zinaida Tyasto2,
Maria Chernysheva2, Eugenia Tsvetkova3, Irina Perminova2 1Department of Soil Science, M.V. Lomonosov Moscow State University, Leninskie Gory, 119992
Moscow, Russia, [email protected] 2Department of Chemistry, M.V. Lomonosov Moscow State University, Leninskie Gory, 119992
Moscow, Russia 3N.D. Zelinski Institute of Organic Chemistry of RAS, Leninskii Ave. 47, 117913 Moscow, Russia
Keywords: humic, uptake, autoradiography, FTICR mass spectrometry
1. INTRODUCTION
Bioavailability of humic substances (HS) to plants is still questionable due to
difficulties in HS determination in plant tissues. The most convenient way is a usage of
labeled compounds, and the availability of isotope-labeled HS is an important prerequisite
to elucidate the fate of the heterogeneous organic matter in complex environments. On the
other hand, presence of the isotope does not allow identifying specific compounds of HS
that entered a target object. To solve this problem, isotope-labeled HS together with
Fourier Transformed Ion Cyclotron Resonance mass spectrometry (FTICR MS) approach
could be applied. This study was aimed (1) to find out uptake and distribution of HS in
wheat seedlings and (2) to identify humic-derived compounds that can found in plants.
2. MATERIALS AND METHODS
For this study humic acids (HA) derived from leonardite was used. To synthesize
isotope-labeled HA, an approach developed in (1) for the preparation of tritium-labeled HS
was used. The obtained 3H-HA sample was dissolved in a phosphate buffer (0.028 M,
pH 6.8) and purified by dialysis during a month at 4ºC. It allowed eliminating exchangeable
tritium of OH–, COOH–, and NHn groups of HA. Plants of wheat Triticum aestivum L. were
used for the experiments. Wheat seeds were germinated at 24°C in the dark for 72 h
followed by transferring seedlings into the 0.5 l tanks containing Knopp nutrition solution.
After another 72 h plants were transferred into the vials containing HA at concentration
50 mg⋅l–1 with specific radioactivity 0.02 Curie⋅l–1. After 24 h plants were harvested and
subjected to autoradiography. To perform FTICR MS analysis, shoots’ tips were colleted
and subjected to methanol extraction followed by FTICR MS. FTICR was conducted at
425
Apex Qe (Bruker Daltonics, Bremen, Germany) equipped with Apollo II electrospray
ionization (ESI) source and 12 Tesla actively shielded superconductive magnet. Negative
ionization mode was used with spray shield set to 3 kV and capillary voltage 3.5 kV. Flow
rate was set to 120 mkl/hour. 100 scans in mass range 150…2000 Da were collected for
each sample. To find tritium traces, FIRAN software (Kunenkov, 2006-2008) was used
under the following considerations: a) there is only one tritium atom in the labeled ion; b)
for each labeled ion there is ion without the label which consists only of 12C, 1H, 16O and 14N; c) for each labeled ion there is ion without the label but with one of its 12C replaced by 13C (this consideration were used to find ion charge by mass difference between two
unlabeled ions); d) labeled ion present in mass spectrum of extract from shoots subjected
to 3H-HA must be absent in mass spectrum of extract from shoots subjected to non-
modified HA.
3. RESULTS AND DISCUSSION
The obtained results revealed that coal HA were intensively adsorbed by wheat
plants. The roots of the plants subjected to 3H-HA were characterized with homogeneous
distribution of signal intensity. Distribution of HA within the shoots was also relatively
homogeneous except for the tips of the leaves where local increase of signal density was
observed. That finding was evident for the fact that HA could be taken up through plant
roots and moved al least in the xylem with transpiration stream to areas of new growth.
FTICR MS analysis of extract demonstrated presence of tritium-labelled fatty acids in
the shoots of wheat plants treated with 3H-HA. As fatty acids are important moieties for
plant lipids biosynthesis, the obtained data demonstrated clearly that HA-derived
compounds can be used for membrane formation.
4. CONCLUSIONS
Distribution of HA in plants was demonstrated to be relatively homogeneous except
for the tips of both roots and leaves where increase in 3H-HA concentration was observed.
FTICR analysis of extract from tips leaves revealed presence of tritium-labelled fatty acids
what was evident that HA-derived compounds could be used for membrane formation.
ACKNOWLEDGEMENTS
This work was supported by RFBR (#06-04-49017a).
REFERENCES 1. Badun, G. A. et al.: // Bulgarian J. of Ecol. Sci. 2(3-4), 26-27 (2003).
426

Effect of Humic Substances on Metal Desorption From Sediments under Conditions of Experimental Simulation
Peter Linnik, Lidiya Malinovskaya, Irina Zubenko, Alexandr Zubko Institute of Hydrobiology, Ukrainian National Academy of Sciences, Geroev Stalingrada Avenue
12, 04210 Kiev, Ukraine, [email protected]
Keywords: humic substances, metals, sediments, desorption
1. INTODUCTION Humic substances (HS) contained in surface waters are a complicated mixture of
organic polyelectrolytes differed one from another by the molecular sizes, molecular
structure and presence of diverse functional groups (1, 2). The sources of HS in surface
waters are the soil humus and also terrestrial and aquatic plants. HS belong to the group
of stable natural organic compounds and they are practically poorly decomposed (3).
HS, being an important source of organic matter in all terrigenous and aquatic
ecosystems, are involved in a variety of biochemical and geochemical processes. It is
evident that the role of HS in water bodies is regarded quite often from different
standpoints, sometimes even diametrically opposite ones. HS are believed to be potential
nutriments for plants, benthonic animals, and microorganisms (4). These compounds play
an important role in the cycles of nutritive elements, such as phosphorus. Based on
another point of view it is suggested that the bioproductivity of water bodies with high HS
concentrations is lower substantially because of the increased water colority and binding of
biogenic elements to their inaccessible forms.
Owing to the properties of complexation, HS are capable of extracting metals from
sediments in water bodies, increasing thereby their migration mobility in the sediments –
water system. As a result of this process, there rises a probability of a secondary pollution
of aquatic environment with metal compounds that has to be considered as an undesirable
phenomenon.
The aim of this paper is to assess the migration of metals in the bottom
sediment/water zone under different HS concentrations.
2. MATERIALS AND METHODS
Experiments were conducted by stages in glass aquariums of volume 18 L at room
temperature (20–22oC). The samples of the sediments and natural water were taken in the
upper part of the Kanev reservoir and loaded in the aquariums at ratio 1:10. Experiments
427

were conducted under the static conditions without aeration and mixing. The first and
second aquariums were taken as the control, where natural water only and silt and natural
water were present. In the next 5 aquariums humic acids (HA) were introduced in the
concentrations 2.5, 4.0, 5.0, 10.0, 20.0 mgּL-1, and in 3 aquariums fulvic acids (FA) were
introduced in the concentrations 8.0, 16.0, 32.0 mgּL-1 respectively. HA of the firm “Fluka”
were used. Preparations of FA were obtained out of water of the upper part of the Kanev
reservoir by sorption and purification.
The concentration of dissolved oxygen, pH, and the dissolved forms of metals were
determined daily. Metal analysis involved chemiluminescence methods (Cu, Cr) (5) and
anodic stripping voltammetry (Zn, Pb) (6).
Molecular weight distribution of metal complex compounds was studied by gel-
permeation chromatography when using the column filled with TOYOPEARL HW-50 gel
(Japan).
3. RESULTS AND DISCUSSION
Lowering in concentration of dissolved oxygen and pH occurs in the process of
contact of natural water with silty sediments, because the oxygen expense for chemical
and biochemical oxidation reactions of organic and inorganic substances contained in
aquatic environment, and especially in sediments increases. Anaerobic conditions are
among the main causes of increase in organic matter concentration, metals, and biogenic
elements and so on in water.
Results of previous studies have shown that HS, FA chiefly, play the main role in
complexation in the Dnieper reservoirs (7). It is also characteristic that the noted metal
complexes are prevailing, too, in pore solutions of silty sediments. Therefore, it is
sufficiently evident that the influence of HS on migration of metals in the sediment – water
system may be rather appreciable.
Owing to HS reductive properties, they promote decrease of dissolved oxygen
concentration and pH in the aquatic environment. The O2 content in overlying water
lowered to 0.9–1.3 mg·L-1 and 0.2–0.5 mg·L-1 at elevation of HA concentrations in natural
water up to 10.0 mg·L-1 and 20.0 mg·L-1, respectively. The analogous lowering in
concentration of dissolved oxygen occurred at the additional concentrations of FA in
natural water 16.0 and 32.0 mg·L-1.
It should be noted that under anaerobic conditions concentrations of metals in natural
water contacting with sediments is always higher and these may rise 3–6 times in
comparison with their initial contents in the same water. The presence of HS in the aquatic
428

environment should lead to an additive extraction of metals from bottom sediments owing
to formation of complexes by these ligands.
For comparison, Figures 1 and 2 demonstrate the data on the maximally possible
quantity of metals that could be desorbed from sediments and pass in dissolved state into
the aquatic environment under various experimental conditions, including influence of HA
or FA.
Aquarium numbers
Cu(II)
0306090
120150180210
1 2 3 4 5 6
µg L-1 Cr(III)
0
40
80
120
160
200
240
1 2 3 4 5 6
µg L-1
Figure 1. Maximal quantities of metals migrating from sediments into natural water under
experimental aerobic (1, 2, 4) and anaerobic (3, 5. 6) conditions and at the presence of HA
in contacting water: 1, initial natural water; 2, 3, sediments + natural water; 4, 5, 6,
sediments + natural water + HA (3.8, 10.0 and 20.0 mg·L-1respectively).
Aquarium numbers
Zn(II)
0
50100
150200
250300
350
1 2 3 4 5
µg L-1 Pb(II)
0
5
10
15
20
25
1 2 3 4 5
µg L-1
Figure 2. Maximal quantities of metals migrating from sediments into natural water in the
absence and at the presence of additional concentrations of FA in contacting water: 1,
initial natural water; 2, sediments + natural water; 3, 4, 5, sediments + natural water + FA
(8.0, 16.0 and 32.0 mg·L-1 respectively).
429

It is very complicated to estimate quantitatively the influence of HS as natural high-molecular ligands upon migration of metals from sediments into the aquatic environment owing to concomitant process of oxidation of these organic compounds because this process promotes aggravation of the deficiency in dissolved oxygen. Nevertheless, it is clearly seen from the data presented in Figures 1 and 2 that maximal quantities of metals migrating from sediments are higher when water contains HS than it is under anaerobic conditions in the absence of additional concentrations of HS in overlying water.
The most part of metals migrated as the complexes with organic substances of interstitial solutions from the sediments and with the HA or FA added to natural water, which molecular weight did not exceed 2.0 kDa.
4. CONCLUSIONS
The results of experimental studies have shown that the migration intensity of metals in the sediments – water system, as well as the degree of secondary pollution of the aquatic phase by them, depends on a number of factors. Under anaerobic conditions of a simulation experiment, the quantities of metals desorbed from sediments and passed into contacting water are much higher than under aerobic conditions. The additions of HS to natural water influence significantly migration of metals from sediments; however, it is rather difficult to evaluate quantitatively this influence because of simultaneous effects of deficiency in dissolved oxygen and complexation at the participation of these natural organic ligands.
REFERENCES
1. Perminova, I.V., Hatfield, K. 2005. In: Use of Humic Substances to Remediate Polluted
Environments: From Theory to Practice, I.V. Perminova et al. (Eds.), NATO Science Series,
IV. Earth and Environmental Sciences – Vol. 52, Printed in the Netherlands, pp. 3–36.
2. Weber, J.H. 1988. In: Humic substances and Their Role in the Environment, F.H. Frimmel,
R.F. Christman (Eds.), Wiley, Chichester, pp. 165–178.
3. Geller, A. 1986. Limnol. Oceanogr. 31, 755–764.
4. Belzile, N., Joli, H.A., Li, H. 1997. Can. J. Chem. 75, 14–27.
5. Nabivanets, B.I., Linnik, P.N., Kalabina, L.V. 1981. Kinetics methods of analysis of natural
water, Naukova Dumka Press, Kiev, 140 p. (in Russian).
6. Linnik, P.N., Nabivanets, Yu.B. 1988. Gidrobiologicheskiy Zhurnal. 24(1), 68–71 (in Russian).
7. Linnik, P.N., Vasilchuk, T.A. 2005. In: Use of Humic Substances to Remediate Polluted
Environments: From Theory to Practice, I.V. Perminova et al. (Eds.), NATO Science Series,
IV. Earth and Environmental Sciences – Vol. 52, Printed in the Netherlands, pp. 135–154.
430

Acid-Base Properties of Dissolved Humic Substances in Landscape Waters of the Southern Primorye (Russia)
Tatiana N. Lutsenko, Svetlana Yu. Bratskaya1 Pacific Institute of Geography, Far Eastern Branch of the Russian Academy of Sciences, Radio St.
7, 690041 Vladivostok, Russia, [email protected] 1Institute of Chemistry, Far Eastern Branch of the Russian Academy of Sciences, 100-letiya
Vladivostoka Av. 159, 690022 Vladivostok, Russia
Keywords: humic, fulvic, potentiometric titration
1. INTRODUCTION
Due to the acidic non-saturated functional groups of dissolved organic matter (DOM),
soil waters participate in weathering of mineral matrix and transportation processes of the
metal-organic complexes through landscape. These processes are especially pronounced
in the regions with a monsoon climate. Study of ecosystems in consecutively alternating
altitudinal belt of vegetation enables one to reveal changes in characteristics of landscape
components within relatively short distance. The aim of our study was to investigate the
acid-base properties of soil water humic (HA) and fulvic (FA) acids, which are among the
most active agents of pedogenesis and biogeochemical migration in mountain-taiga
landscapes of the southern Primorye.
2. MATERIALS AND METHODS
The area under study is one of the southern slopes of the Sikhote-Aline mountain
ridge, located in the South of the Russian Far East, southern part of Primorye. Soil waters
were collected in zero-tension lysimeters below humus horizons of the main types of
mountain-taiga brown soils: humic cambisol (750 and 950 m a.s.l.); and dystric cambisol
(1250 and 1400 m a.s.l.). The characteristics of the soils and the composition of the
seepage waters were published in (1).
HA were separated from FA by overnight precipitation at pH 1,5 followed by
centrifugation of solutions for 30 min at 3000 rpm. HA were re-precipitated for purification.
Acidic centrifugates were fractionated according to (2). The method is based on the
Forsyth fractionation on the coal column followed by the separation of low-molecular-
weight DOM. Solutions of HA and FA were dried at 30-40°C.
Potentiometric titrations of HA and FA were performed in a PC-controlled system
under constant argon flow. 6-10 mg of air-dried sample was dissolved in 10 ml of 0.1M KCl
431

adjusted to pH=10 by addition of 0,1M KOH to allow complete solubilization. Prior to
titration the HA/FA solution was readjusted to pH=2,5 with 0,1M HCl to attain complete
protonation of functional groups. Results of potentiometric titration were processed using
the density function method (3) which yields pK-spectra of HA and FA.
3. RESULTS AND DISCUSSION
Potentiometric titration data indicated that HA and FA have different acidic
characteristics determined by change of the ecological conditions of their synthesis. Total
content of acidic groups was 6,9-9,3 mmol/g and 3,6-5,6 mmol/g for FA and HA of
lysimetric waters, respectively (Table 1).
Table 1. Acid-base properties of lysimetric humic substances of mountain-taiga brown
soils (humus horizons)
Sample Total content of groups, mmol/g pK Content,
mmol/g
FA, humic cambisol, 750 m a.s.l. 6,9 4,59 6,82 9,24
2,5 0,6 3,8
FA, humic cambisol, 950 m a.s.l. 9,3 4,0
6,59 9,35
5,1 0,5 3,6
FA, dystric cambisol, 1250 m a.s.l. 8,9 3,94 6,18 9,47
4,7 0,8 3,4
FA, dystric cambisol, 1400 m a.s.l. 5,6 4,10 6,30 8,50
3,1 0,9 1,6
HA, humic cambisol, 750 m a.s.l. 3,6 4,76 6,94 9,65
1,7 0,7 1,2
HA, humic cambisol, 950 m a.s.l. 4,9 4,53 6,76 9,41
2,2 0,6 2,1
HA, dystric cambisol, 1250 m a.s.l. 5,6 3,29 4,71 9,59
1,3 2,5 1,8
HA, dystric cambisol, 1400 m a.s.l.
4,6 4,41 6,65 9,41
1,9 1,8 0,9
432
FA of humic cambisol (950 m a.s.l.), whose DOM is characterized by the highest
mobility in the soil profile, differ remarkably in total acidity (9,3 mmol/g). Another
characteristic feature of this type of soil DOM was detected in FTIR-spectrum, which
showed the highest intensity of the COOH groups stretching band (1720-1730 cm-1).
In pK-spectra of HA and FA we distinguished three types of acidic functional groups
with pK1 = 3,94-4,59; pK2= 6,18-6,82; and pK3=8,5-9,47 for FA, and pK1=3,29-4,76; pK2=
4,71-6,94; and pK3= 9,41-9,65 for HA. The results obtained reveal the tendency to
increase of acidic strength of HA and FA functional groups with increase of the absolute
altitude (Figure 1). However, this tendency is less explicit for weak functional groups that
can be determined by the higher errors in evaluation of high pK-values.
y = -676,73x + 3901R2 = 0,47
0
500
1000
1500
3 4 5рК1
Elev
atio
n a
bove
sea
leve
l, m
FULVIC ACIDS
y = -939,97x +7171R2 = 0,86
0
500
1000
1500
5 6 7рК2
y = -365x + 4423,6R2 = 0,30
0
500
1000
1500
8 9 10рК3
y = -246,27x + 2133R2 = 0,30
0
500
1000
1500
3 4 5 рК1
HUMIC ACIDS
y = -131,09x +1908,8R2 = 0,22
0
500
1000
1500
4,5 5 5,5 6 6,5 7pK2
y = -1127,5x + 11815R2 = 0,23
0
500
1000
1500
8 9 10рК3
Figure 1. Trends of acidity of lyzimetric HS with the elevation.
pK1 (black) - strong acidic functional groups, pK2 (grey) - moderate strength groups,
pK3 (open) – weak functional groups.
It is important, that this altitude trend is broken by the lower values of pK for HA of
dystric cambisol, (1250 m a.s.l.) formed under the coldest conditions among the studied
soils of mountain pine formation on the slope of north exposition (1). Thus, the
temperature trend in acidity of humic substances was more explicit than the altitude trend.
Lysimetric FA of humic cambisol (750 m a.s.l.) contain about 36% of acidic groups
with pK1 (pK=4.59), while about 50% of functional groups have pK>9, and are not ionized
at environmental pH. At higher altitude of the macroslope with alternation of hydrothermal
433
regime and increase of conifers share in vegetation composition (1), more than a half of
FA acidic groups shows strongest acidity (рК1=3,9-4,1). These groups are completely
ionized at pH of lysimetric waters (4,0 – 6,5) and can interact with soil minerals.
Most likely, increase of acidic strength of HA and FA results from changes in the
composition of community of organic substances destructors and humic substances
producers under transition from warmer to colder forest ecosystems. Acidic conditions
hamper the decomposition process of plant residues due to the depression of bacterial
microflora activity and the stimulation of fungi development (4).
4. CONCLUSIONS
About 50% of functional groups of dissolved FA and HA of lysimetric waters are of
the type with the strongest acidity, most likely, of carboxylic origin. These groups
correspond to the most reactive type, which is completely ionized and can be involved in
cation-exchange reactions at environmental pH of lysimetric waters (4,0 – 6,5). Substantial
part of groups (30-50 % for FA, and 20-40 % - for HA) can be related to the phenolic type,
which is unable to dissociate under environmental conditions, and, therefore, is
geochemically inert. The most pronounced acidic properties (the high total content of
acidic groups and the presence of groups with the lowest pK1) were revealed for humic
substances of dystric cambisol, (1250 m a.s.l.) formed under the coldest conditions of
pedogenesis in mountain pine formation on the slope of the north exposition.
ACKNOWLEDGEMENTS
We thank Dr. Valentina S. Arzhanova, senior researcher of Pacific Institute of
Geography of FEBRAS for the samples of lysimetric waters.
REFERENCES
1. Arzhanova, V.S.: Alpine forest soils of the Sikhote-Alin Range. Eurasian Soil Science 4, 440-
448 (1999).
2. Varshal, G.M. et al.: Fractionation, quantitative determination and study of some main
components of dissolved organic substances of natural waters. Gydrochem. Mater. 59, 143-
151 (1973).
3. Bratskaya S.Y., Golikov A.P. Use of the density function method for interpreting the results of
the potentiometric titration of mixtures of weak acids and bases J.Anal.Chem. 53, 234-239
(1998).
4. Aleksandrova L.A. Organic matter of soils and processes of its transformation. Leningrad,
Nauka, 1980. Leningrad division. 286 p.
434
Photochemical Reactivity of Australian Floodplain River and Billabong Fulvic Acids upon Exposure to UV-B Radiation
Suzanne McDonald1,2, Paul D. Prenzler1, Andrea G. Bishop1, Kevin Robards1 1School of Food and Wine Science, Charles Sturt University, Wagga Wagga, NSW 2678, Australia 2Curtin Water Quality Research Centre (CWQRC), Curtin University of Technology, GPO Box
U1987, Perth, WA 6845, [email protected]
Keywords: aquatic, fulvic acid, chemical characteristics, UV-B, photodegradation
1. INTRODUCTION
The importance of lateral connectivity between the main river channel and adjoining floodplain is well recognized, and is fundamental to the Flood Pulse Concept (1). Floodplain-river interactions are important for exchanging particulate and dissolved organic matter. Suspended sediments and nutrients are transported from the river to the floodplain, while organic detritus, algal and microbial biomass is returned to the river channel (3).
Billabongs, or meander cutoffs, are an integral part of Australian floodplain landscapes, and are thought to play an important role in the exchange of resources between the main river ecosystem and terrestrial floodplain ecosystem (2). Little is known, however, regarding the chemical characteristics or quality of dissolved organic carbon (DOC) contained in these systems. In addition, photochemical transformations can alter chemical properties, which may subsequently alter the quality (in terms of bioavailability) of DOC. Of particular interest is the effect of increased levels of UV radiation, due to the hole in the ozone layer. Fulvic acid, which comprises the majority of DOC, is chromophoric in nature and may be particularly susceptible to photochemical transformations. It is not yet clear whether or not different sources of organic matter yield different photoproducts or rates of photoproduct formation at various wavelengths. This research examines the photochemical transformations of fulvic acids from different environments.
2. MATERIALS AND METHODS
Sample Site
Sampling sites were located on the Murrumbidgee River (35°1’10”S, 147°3’38”E),
and adjoining Berry Jerry Lagoon (35°0’60”S, 147°3’54”E), on the semi-arid Riverine Plain, approximately 30 km west of Wagga Wagga, Australia.
Isolation of fulvic acid
Fulvic acids were isolated using Supelite™ DAX-8 resin. Resin (50.0 g) was added to 4.0 L filtered water sample (adjusted to pH 2.0 with conc. HCl) in a glass beaker (5.0 L),
435
and stirred for 30 min using a stirrer bar. After settling, the supernatant was decanted, and the slurry collected in a 10 mm diameter glass chromatography column fitted with a frit. Humic and fulvic acids were eluted from the resin with 0.1 M NaOH, and acidified to pH 2.0 immediately with conc. HCl. The humic substances were then re-concentrated onto DAX-8 resin, and again eluted with 0.1 M NaOH. Humic acid was separated from fulvic acid by lowering the pH to <1.0 (conc. HCl), and allowing the humic acid to aggregate
overnight at 4°C in the dark. The humic and fulvic acid suspension was then centrifuged at 3000 rpm for 10 min, and filtered through a Whatman GF/C filter to remove the humic acid. The fulvic acid fraction was adjusted to pH 2.0 with 1.0 M aqueous NaOH and re-adsorbed onto the DAX-8 resin. The DAX-8 resin was then rinsed with one bed volume of Milli-Q water, and fulvic acid desorbed with 0.1 M NaOH. Fulvic acid was immediately pass thourh an Amberlite IR-120 (H) resin, frozen, and freeze-dried.
Sample preparation Fulvic acid was re-dissolved in Milli-Q water to give a final concentration of
approximately 20 mg L-1 carbon. Solutions were adjusted to pH 7 using NaOH (0.1 M) or HCl (1.0 M), and 10 mL placed into 20 mL glass scintillation vials. UV transparent film (Cast Away Premium) was placed over the top of the vials to prevent loss of water, but allow UV-B radiation to enter the vials.
Sample irradiation Fulvic acid solutions were irradiated using a UVB-313 (40W Q-Panel, USA) lamp for
14 days to give a total dose of 234078 mJ cm-2.
3. RESULTS AND DISCUSSION
The Murrumbidgee River differed in physico-chemical characteristics to Berry Jerry Lagoon, having a lower DOC content (3.3 -10.9 mg L-1 for the river, and 22.5 – 114 mg L-1 for the lagoon during 2004), and lower chlorophyll-a content (0.02-0.04 mg L-1 for river and 0.20 - 2.16 mg L-1 for lagoon) than the lagoon. Sunlight was also able to penetrate further
through the water column of the river than the lagoon (River Kd = 2.90 ± 0.83; Lagoon Kd =
25.58 ± 9.66). Fulvic acids from the Murrumbidgee River and Berry Jerry Lagoon differed in
chemical characteristics, with the river fulvic acid being more aliphatic in nature, having a higher apparent molecular weight and polydispersity (Table 1). For comparison, Suwannee River fulvic acid had a higher molecular weight and aromaticity than Murrumbidgee River fulvic acid.
436

Table 1. Change in chemical characteristics of fulvic acids after exposure to UV-B
radiation
Mw (Da) Polydispersity aCDOM (380 ) (m-1)
SUVA (UV254/DOC; L mg C-1 m-1)
Initial
Berry Jerry Lagoon 986 (32) 1.9 (2x10⁻²) 3.1 (3.0 x 10⁻²) 2.8 (6.0x10⁻³) Murrumbidgee River 1409 (9) 2.4 (3x10⁻²) 11.8 (0.2) 4.1 (5.2x10⁻³)
Suwannee River 2280 (128) 2.0 (3x10⁻²) 9.8 (0.1) 4.8 (2.2x10⁻²)
% Decrease after irradiation
Berry Jerry Lagoon -22.1 (1.4) -12.3 (1.0) -47.9 (1.5) -33.8 (1.5) Murrumbidgee River -61.7 (0.7) -23.8 (0.2) -51.3 (0.4) -47.8 (1.1)
Suwannee River -37.8 (2.6) -10.9 (1.1) -19.6 (3.6) -16.0 (2.8) Note: Errors are shown in brackets and are the standard deviation of triplicate
analyses.
0
2
4
6
8
10
12
14
0 50000 100000 150000 200000 250000
Dose (mJ.cm-2)
Conc
entra
tion
of fo
rmal
dehy
de
(nM
)
Berry Jerry Lagoon fulvic acidMurrumbidgee River fulvic acidSuwannee River fulvic acid
0
0.5
1
1.5
2
2.5
3
3.5
4
0 50000 100000 150000 200000 250000
Dose (mJ.cm-2)
Conc
entra
tion
of a
ceta
ldeh
yde
(nM
)
Berry Jerry Lagoon fulvic acidMurrumbidgee River fulvic acidSuwannee River fulvic acid
Figure 1. Formaldehyde and acetaldehyde formation from UV-B irradiated Berry Jerry
Lagoon fulvic acid, Murrumbidgee River fulvic acid and Suwannee River fulvic acid.
Error bars are standard deviations of triplicate analyses.
437
Exposure of fulvic acids to UV-B radiation resulted in a decrease in absorbing
species, molecular weight, polydispersity and aromaticity. Typically Murrumbidgee River
fulvic acid underwent greater change than Berry Jerry Lagoon fulvic acid (i.e. more photo-
reactive). Upon exposure to UV-B radiation acetaldehyde and formaldehyde were
produced in all samples (Figure 1), with Murrumbidgee River fulvic acid producing the
highest concentration, followed by Berry Jerry Lagoon fulvic acid and Suwannee River
fulvic acid.
4. CONCLUSIONS
Similar photochemical transformations were evident for fulvic acids from different
environments, however, the degree of transformation varied. Murrumbidgee River fulvic
acid typically underwent greater change due to UV-B radiation than Berry Jerry Lagoon
fulvic acid. Photochemical transformations may alter the bioavailability of carbon, and
therefore have implications for the quality of carbon between the two environments.
ACKNOWLEDGEMENTS
Charles Sturt University is thanked for funding this project, and an APA scholarship is
gratefully acknowledged.
REFERENCES
1. Junk, W.J., Bayley, P.B., Sparks, R.E. 1989. Can. Sp. Publ. J. Fish Aquat. Sci. 106, 110-127.
2. Gell, P.A., Bulpin, S., Wallbrink, P., Hancock, G., Bickford, S. 2005. Mar. Freshwater Res. 56,
441-456.
3. Robertson, A.I., Bunn, S.E., Boon, P.I., Walker, K.F. 1999. Mar. Freshwater Res. 50, 813-829.
438

Complexation of Mercury to Dissolved Organic Matter Isolated from an Anthropized Aquatic Ecosystem
Bogdan Muresan1, Benoît Pernet-Coudrier1, Daniel Cossa2, Gilles Varrault1 1CEREVE – Université Paris-Est, 61 avenue du Général de Gaulle, 94010 Créteil, France,
[email protected] 2IFREMER – BP 21105, F.44311 Nantes cedex 3, France
Keywords: mercury, complexation, humic/non-humic substances, speciation modeling
1. INTRODUCTION
The strong interactions of mercuric (Hg2+) ions with dissolved organic matter (DOM)
exert important controls on the mercury (Hg) fate, distribution and speciation in the aquatic
systems. To obtain representative stability constants, we probed the binding affinity of
Hg2+ with natural and urban DOM fractions of humic and non-humic substances.
2. MATERIALS AND METHODS
The competitive ligand exchange with solvent-solvent extraction (CLE-SSE) method
was adapted for the determination of Hg2+ conditional stability constants (K´cond) with the
DOM fractions from the Seine Basin. The sampling sites consisted of the low urbanized
Marne River (at Méry, upstream from Paris) and of the treated effluent of the Seine-Aval
Wastewater Treatment Plant (~ 8 million equivalent inhabitants). The hydrophobic (HPO),
transphilic (TPI) and hydrophilic (HPI) DOM fractions were isolated according to Croué
(2004) by reverse osmosis concentration and DAX-8/XAD-4 resins adsorption. The CLE-
SSE method utilizes two competitive ligands for Hg2+ binding, chlorides and DOM fraction,
followed by water-methylene chloride extraction to separate the charged chloride Hg
complexes from the neutral and organic Hg complexes (Hg-L). The concentrations of Hg2+
and chloride Hg complexes were assessed by applying the Winderemere Humic Aqueous
Model (WHAM 6) to the measured concentrations of total dissolved Hg (HgTD) in the
aqueous phases. The K´cond and L contents were determined using the Langmuir isotherm.
3. RESULTS AND DISCUSSION
At pH = 6.8, in the presence of 0.5 M chlorides and 1 µg L-1 DOM fraction, the
inorganic Hg shifts from organic to aqueous phases with increasing Hg(OH)2 additions
(Figure 1). On this basis, the determined K´cond values indicated that DOM fractions from
the treated wastewater effluent contain extremely strong Hg-complexing ligands.
439
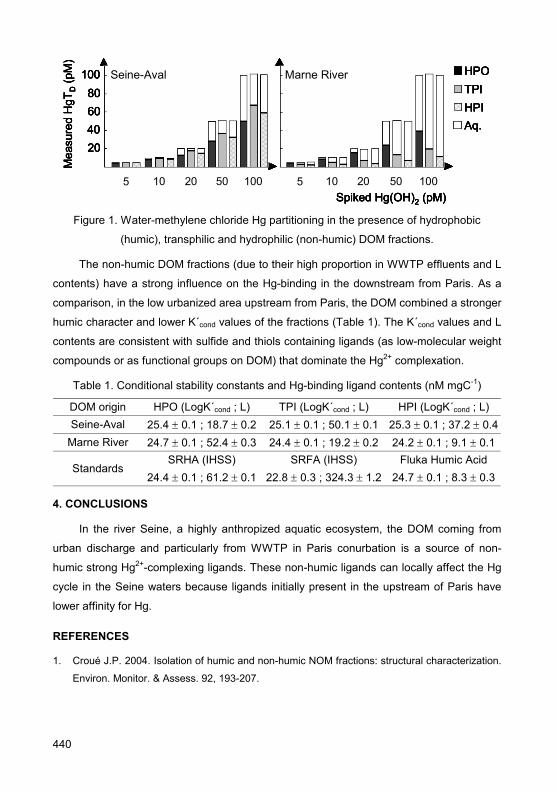
Spiked Hg(OH)2 (pM)
20406080
100
20 40 60 80 100 20 40 60 80 100
HPOTPIHPIAq.
Mea
sure
d H
gTD
(pM
)Seine-Aval Marne River
Spiked Hg(OH)2 (pM)
20406080
100
20 40 60 80 100 20 40 60 80 100
HPOTPIHPIAq.
Mea
sure
d H
gTD
(pM
)Seine-Aval Marne River
5 10 20 50 100 5 10 20 50 100Spiked Hg(OH)2 (pM)
20406080
100
20 40 60 80 100 20 40 60 80 100
HPOTPIHPIAq.
Mea
sure
d H
gTD
(pM
)Seine-Aval Marne River
Spiked Hg(OH)2 (pM)
20406080
100
20 40 60 80 100 20 40 60 80 100
HPOTPIHPIAq.
Mea
sure
d H
gTD
(pM
)Seine-Aval Marne River
5 10 20 50 100 5 10 20 50 100
Figure 1. Water-methylene chloride Hg partitioning in the presence of hydrophobic
(humic), transphilic and hydrophilic (non-humic) DOM fractions.
The non-humic DOM fractions (due to their high proportion in WWTP effluents and L
contents) have a strong influence on the Hg-binding in the downstream from Paris. As a
comparison, in the low urbanized area upstream from Paris, the DOM combined a stronger
humic character and lower K´cond values of the fractions (Table 1). The K´cond values and L
contents are consistent with sulfide and thiols containing ligands (as low-molecular weight
compounds or as functional groups on DOM) that dominate the Hg2+ complexation.
Table 1. Conditional stability constants and Hg-binding ligand contents (nM mgC-1)
DOM origin HPO (LogK´cond ; L) TPI (LogK´cond ; L) HPI (LogK´cond ; L) Seine-Aval 25.4 ± 0.1 ; 18.7 ± 0.2 25.1 ± 0.1 ; 50.1 ± 0.1 25.3 ± 0.1 ; 37.2 ± 0.4
Marne River 24.7 ± 0.1 ; 52.4 ± 0.3 24.4 ± 0.1 ; 19.2 ± 0.2 24.2 ± 0.1 ; 9.1 ± 0.1SRHA (IHSS) SRFA (IHSS) Fluka Humic Acid
Standards 24.4 ± 0.1 ; 61.2 ± 0.1 22.8 ± 0.3 ; 324.3 ± 1.2 24.7 ± 0.1 ; 8.3 ± 0.3
4. CONCLUSIONS
In the river Seine, a highly anthropized aquatic ecosystem, the DOM coming from
urban discharge and particularly from WWTP in Paris conurbation is a source of non-
humic strong Hg2+-complexing ligands. These non-humic ligands can locally affect the Hg
cycle in the Seine waters because ligands initially present in the upstream of Paris have
lower affinity for Hg.
REFERENCES
1. Croué J.P. 2004. Isolation of humic and non-humic NOM fractions: structural characterization.
Environ. Monitor. & Assess. 92, 193-207.
440

Development and Validation of Antioxidant Capacity Assessment Protocol for Humic and Humic-Like Substances
Ilya Nikolaev1, Olga Klein1, Natalia Kulikova1,2, Elena Stepanova1, Olga Koroleva1
1A.N. Bach Institute of Biochemistry Russian Academy of Sciences, Leninskii 33, 119071,Moscow,
Russia, [email protected] 2Department of soil Science, Lomonosov Moscow State University, Leninskie Gory, 119992,
Moscow, Russia
Keywords: antioxidant capacity, humic and humic-like substances
1. INTRODUCTION
Humic substances (HS) are considered to be involved in realization of various
processes in soil and aquatic ecosystems (1, 2). The main feature of HS is their
polyfunctionality as they can act as sorbents, soil conditioners, fertilizers, bioactive
compounds etc. Due to their structure and functions HS have been widely explored for
practical use. Nevertheless there is still little knowledge about quantitative characteristics
of their biological activity. Therefore such parameters are of great importance. HS are
known to take part in redox and radical processes and their antioxidant capacity (AOC)
can be proposed as one of essential parameter for evaluation of their properties. Thus,
AOC should be a quantitative characteristic of HS efficiency as reactive oxygen species
scavenger or trap providing comparison of different HS preparations both for fundamental
study and their application. The aim of this study was to develop standardized protocol for
quantitative estimation of HS and humic-like substances antioxidant capacity.
2. MATERIALS AND METHODS
Standard and commercially available samples of HS including Suwannee River
humic (SR-HA), fulvic acids (SR-FA) and dissolved organic matter (SR-DOM) and Aldrich
coal humic acid (CHA-ALD) were chosen for development of antioxidant capacity
measurement protocol. For verifying of the developed protocol two samples of humic-like
substances (HLS) produced by basidiomycetes Cerrena maxima 0275 cultivated on oat
straw were used. HLS-45 and HLS-70 were isolated from nutritional media after 45 and 70
days of cultivation as described earlier (3).
Antioxidant capacity (AOC) of HS and HLS was measured as a decrease in the
absorbance at 734 nm of radical-cation ABTS ((2,2-azyno-bis-(3-ethylbenzthiazoline-6-
sulfonic acid) diammonium salt) in their presence. A water soluble analogue of vitamin E
441
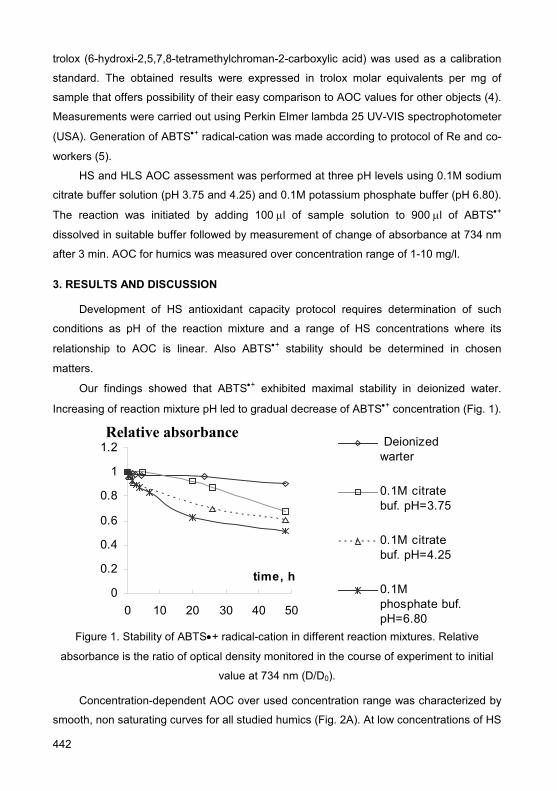
trolox (6-hydroxi-2,5,7,8-tetramethylchroman-2-carboxylic acid) was used as a calibration
standard. The obtained results were expressed in trolox molar equivalents per mg of
sample that offers possibility of their easy comparison to AOC values for other objects (4).
Measurements were carried out using Perkin Elmer lambda 25 UV-VIS spectrophotometer
(USA). Generation of ABTS•+ radical-cation was made according to protocol of Re and co-
workers (5).
HS and HLS AOC assessment was performed at three pH levels using 0.1M sodium
citrate buffer solution (pH 3.75 and 4.25) and 0.1M potassium phosphate buffer (pH 6.80).
The reaction was initiated by adding 100 μl of sample solution to 900 μl of ABTS•+
dissolved in suitable buffer followed by measurement of change of absorbance at 734 nm
after 3 min. AOC for humics was measured over concentration range of 1-10 mg/l.
3. RESULTS AND DISCUSSION
Development of HS antioxidant capacity protocol requires determination of such
conditions as pH of the reaction mixture and a range of HS concentrations where its
relationship to AOC is linear. Also ABTS•+ stability should be determined in chosen
matters.
Our findings showed that ABTS•+ exhibited maximal stability in deionized water.
Increasing of reaction mixture pH led to gradual decrease of ABTS•+ concentration (Fig. 1).
0
0.2
0.4
0.6
0.8
1
1.2
0 10 20 30 40 50
time, h
Deionizedwarter
0.1M citratebuf. pH=3.75
0.1M citratebuf. pH=4.25
0.1Mphosphate buf.pH=6.80
Relative absorbance
Figure 1. Stability of ABTS•+ radical-cation in different reaction mixtures. Relative
absorbance is the ratio of optical density monitored in the course of experiment to initial
value at 734 nm (D/D0).
Concentration-dependent AOC over used concentration range was characterized by
smooth, non saturating curves for all studied humics (Fig. 2A). At low concentrations of HS
442
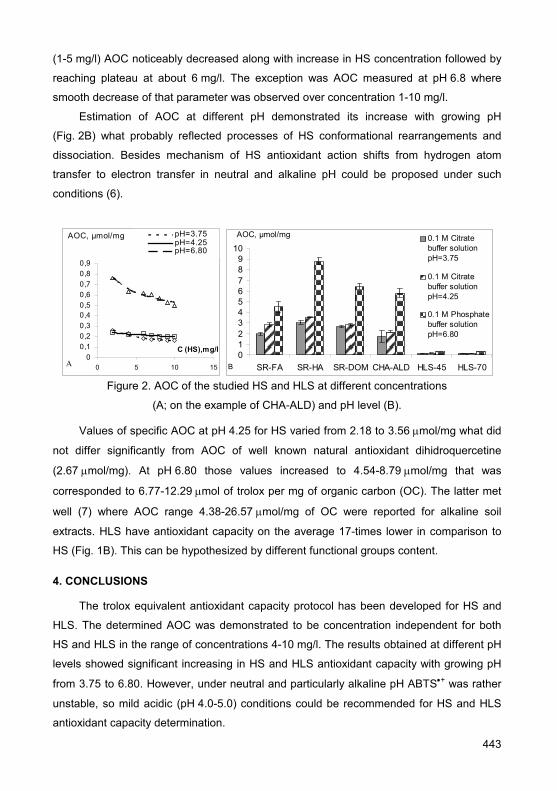
(1-5 mg/l) AOC noticeably decreased along with increase in HS concentration followed by
reaching plateau at about 6 mg/l. The exception was AOC measured at pH 6.8 where
smooth decrease of that parameter was observed over concentration 1-10 mg/l.
Estimation of AOC at different pH demonstrated its increase with growing pH
(Fig. 2B) what probably reflected processes of HS conformational rearrangements and
dissociation. Besides mechanism of HS antioxidant action shifts from hydrogen atom
transfer to electron transfer in neutral and alkaline pH could be proposed under such
conditions (6).
00,10,20,30,40,50,60,70,80,9
0 5 10 15
C (HS),mg/l
pH=3.75pH=4.25pH=6.80
AOC, µmol/mg
0123456789
10
SR-FA SR-HA SR-DOM CHA-ALD HLS-45 HLS-70
0.1 M Citratebuffer solutionpH=3.75
0.1 M Citratebuffer solutionpH=4.25
0.1 M Phosphatebuffer solutionpH=6.80
AOC, µmol/mg
B
A
Figure 2. AOC of the studied HS and HLS at different concentrations
(A; on the example of CHA-ALD) and pH level (B).
Values of specific AOC at pH 4.25 for HS varied from 2.18 to 3.56 μmol/mg what did
not differ significantly from AOC of well known natural antioxidant dihidroquercetine
(2.67 μmol/mg). At pH 6.80 those values increased to 4.54-8.79 μmol/mg that was
corresponded to 6.77-12.29 μmol of trolox per mg of organic carbon (OC). The latter met
well (7) where AOC range 4.38-26.57 μmol/mg of OC were reported for alkaline soil
extracts. HLS have antioxidant capacity on the average 17-times lower in comparison to
HS (Fig. 1B). This can be hypothesized by different functional groups content.
4. CONCLUSIONS
The trolox equivalent antioxidant capacity protocol has been developed for HS and
HLS. The determined AOC was demonstrated to be concentration independent for both
HS and HLS in the range of concentrations 4-10 mg/l. The results obtained at different pH
levels showed significant increasing in HS and HLS antioxidant capacity with growing pH
from 3.75 to 6.80. However, under neutral and particularly alkaline pH ABTS•+ was rather
unstable, so mild acidic (pH 4.0-5.0) conditions could be recommended for HS and HLS
antioxidant capacity determination.
443

ACKNOWLEDGEMENTS
Authors express their deepest appreciation to Prof. Irina Perminova for the samples
of HS. This research was financially supported by the International Science and
Technology Center (#KR-993.2)
REFERENCES
1. Nardi S., Pizzeghello D., Muscolo A., Vianello A. 2002 Soil Biol. and Biochem. 34, 1527-1537.
2. Latch D.E., McNeil K. 2006 Science 311, 1743-47.
3. Koroleva O. V., Kulikova N. A., Alekseeva T. N., Stepanova E. V., Davidchik V. N., Belyaeva
E. Yu., and Tsvetkova E. A. 2007 Applied Biochem. and Microbiol. 43,(1), 61–67.
4. Prior R.L., Wu X., Schaich K. 2005 J. Agric. Food Chem. 53, 4290-4302.
5. Re R., Pellegrini N., Proteggente A., Pannala A., Yang M., Rice-Evans C. 1999 Free rad. Biol.
and med. 26, 1231-1237.
6. Lemanska K., Szymusiak H., Tyrakowska B., Zielinski R., Soffers E. M., M. Rietjens 2001 Free
rad. Biol. and med. 31, 869-881.
7. Rimmer D.L. Humic substances linking structure to function 2006, proceedings of 13-th
meeting of International Humic Substances Society, 613-616.
444

Dissolved Organic Matter in Urban Water: a Protective Role to Organisms
Benoît Pernet-Coudrier1, Stéphanie Pouliquen1, Bogdan Muresan1, Gilles Varrault1,
Josep Galceran2, Marie-Hélène Tusseau-Vuillemin3, Jean-Marie Mouchel4
1CEREVE - Université Paris-Est, 61 avenue du General de Gaulle, 94010 Creteil, France,
[email protected] 2Departament de Quimica, Universitat de Lleida, Rovira Roure 191, 25198 Lleida, Spain 3CEMAGREF - Unité QHAN, Parc de Tourvoie, BP 44, 92163 Antony Cedex, France 4SISYPHE, Université Pierre et Marie Curie - Paris 6, 4 place Jussieu, 75252 Paris Cedex 05, France
Keywords: bioavailability, isolation, hydrophilic/hydrophobic organic matter, trace metals,
speciation
1. INTRODUCTION
In aquatic systems, Dissolved Organic Matter (DOM) is an important component of
the carbon cycle that controls the speciation, the bioavailability and the toxicity of trace
metals (2). Studies dealing with DOM-metals interactions are mainly focused on Humic
Substances (HS) (hydrophobic DOM). Nevertheless, the humic character of DOM is
weaker in anthropized continental waters (about 30 % of DOC) because of various urban
discharges (5; 7). Very few information are available concerning the Non Humic
Substances (NHS)-metal interactions because of the very difficult isolation and purification.
The present study aims to evaluate the effect of DOM fractions particularly NHS
isolated from Seine Basin: urbanized and low urbanized site (1) on the copper
bioavailability and toxicity and (2) on the copper and lead speciation.
2. MATERIALS AND METHODS
DOM fractions were isolated from Seine-Basin following the reverse osmosis
concentration and DAX-8/XAD-4 resins adsorption techniques (Figure 1) recently
implemented (3; 6). The first site is the Marne River at Méry/Marne upstream from Paris
which is considered as a slightly urbanized site. The treated effluent of Seine-Aval
WasteWater Treatment Plant (WWTP) was also sampled. This WWTP collects more than
70% of dry weather flows (combined sewer) of Paris and its suburbs (≈ 8 million equivalent
inhabitants) and contributes for 15% of the Seine River flow in dry weather. These
effluents are treated in this WWTP by primary settling and aerobic activated sludge. The
Seine River downstream from Paris was also sampled at Andrésy and Méricourt. One
445

IHSS standard fulvic acid (Suwannee River Fulvic Acid SRFA 1S101F) was used like
“natural organic matter reference” for the following investigations.
Preparation
Concentration
Fractionation
Cationic exchange resin (Na+)
Raw sample
Reverse Osmosis
Field filtration (10 µm and 0.45 µm)
Hydrophobic DOM (HPO)
(Humic Substances)
DAX-8 XAD-4
Acidified concentrate (pH 2, HCl)
Transphilic DOM(TPI)
Hydrophilic DOM(HPI)
Elution withAcetonitrile/Water
(75 % / 25 %)
Zeotrophic distillation to remove inorganic salts
Freeze-dry
Vacuum evaporate acetonitrile Purification
Figure 1. Comprehensive isolation protocol of DOM: The RO/DAX protocol.
Acute 24-h immobilization assays on a crustacean (Daphnia magna) were carried out
according to the standard procedure ISO 6341 (International Standard Organization, 1993)
in order to evaluate the effect of each isolated DOM fraction on copper toxicity. The results
are expressed as EC50: the total copper concentration which immobilizes 50% of the
Daphnia population. Copper bioavailability was also investigated by bioaccumulation tests
on bryophytes (Fontinalis antipyretica) following the rate of disappearance of copper in
solution in presence of each DOM fractions.
Copper titrations of each DOM fraction were performed by ionic selective electrode at
three pHs and at constant ionic strength. Lead complexation was investigated by a new
electroanalytical technique AGNES: Absence of Gradients and Nernstian Equilibrium
Stripping (4) at three pH and constant ionic strength. Data were modeled by NICA-Donnan
model (1) in order to determinate binding capacities and binding constants of each isolated
DOM fraction.
446

3. RESULTS AND DISCUSSION
Concerning copper toxicity, results highlight a similar role of DOM fractions from
treated wastewater compared to reference Suwannee River Fulvic Acid (SRFA) (Figure 2).
The Non Humic Substances (transphilic and hydrophilic organic matter) from wastewater
effluent present a protective role on copper toxicity to Daphnia magna because of their
high proportion: 65% of DOC of raw sample (7). HS, e.g. hydrophobic organic matter
(HPO) isolated from Méry/Marne (Marne River upstream from Paris), seem to have a
significant low protective effect compared to DOM from effluent of wastewater.
0
10
20
30
40
Inorganic media
EC50 (µg.l-1)
HPO TPH HPIWWTP Seine-Aval
EC 50 expressed in total copper
HPOMarne RiverSRFA
0
10
20
30
40
Inorganic media
EC50 (µg.l-1)
HPO TPH HPIWWTP Seine-Aval
EC 50 expressed in total copper EC 50 expressed in total copper
HPOMarne RiverSRFA
Figure 2. Copper EC50 obtained for each media.
Results of copper bioaccumulation on Fontinalis antipyretica (Table 1) reveal a low
and similar bioaccumulation rate in presence of SRFA and treated wastewater DOM and
higher rates in presence of DOM from Marne River. Copper bioaccumulation on Fontinalis
antipyretica and copper toxicity on Daphnia magna present the same trends: a key and
protective role of DOM from wastewater effluent particularly NHS (because of their high
proportion) and a lower protective role of DOM (HPO + TPI) from Méry/Marne which is a
slightly urbanized site.
Table 1. Influence of DOM fractions on copper bioaccumulation rate on Fontinalis Antipyretica
Sample Fraction Copper bioaccumulation rate (µg.l-1.h-1)
Inorganic media - 4,30 ± 1,93 HPO 0,27 ± 0,07 TPI 0,28 ± 0,05 Wastewater effluent HPI 0,28 ± 0,03 HPO 2,12 ± 0,21 Marne River
(upstream from Paris) TPI 2,29 ± 0,44 Suwannee River Fulvic Acid 0,56 ± 0,14
Concerning the trace metal (Cu, Zn and Cd) bindings, results revealed significant
differences about binding site number and binding constants according to the DOM
fraction nature and the sample origin.
447
4. CONCLUSIONS
In conclusions, Non Humic Substances in anthropized aquatic systems play a key
and protective role on copper bioavailability to Daphnia magna and Fontinalis antipyretica.
HPO and TPI fraction isolated from Marne River upstream from Paris seem to have a low
protective effect compared to DOM from wastewater effluent. Binding capacity and stability
constant vary significantly according to the DOM fraction nature and the sample origin.
ACKNOWLEDGEMENTS
The authors want to thank the Syndicat Interdépartemental pour l’Assainissement de
l’Agglomération Parisienne for the accessibility of sampling site, Emmanuelle Kuhn for the
chemical analyses in toxicity tests, Jean-Philippe Croué and David Violleau for their help in
DOM fractionation, the department of chemistry of the university of Lleida for the
application of AGNES technique, Le Ministère de la Recherche et de l’Enseignement
Supérieur for financial support of the Ph. D. grant of Benoît Pernet-Coudrier. This work
was supported by the Agence Nationale de la Recherche (project BIOMET JC05_59809).
REFERENCES
1. Benedetti M.F., Milne C.J., Kinniburgh D.G., Van Riemsdijk W.H. and Koopal L.K. 1995. Metal
ion binding to humic substances: application of the non-ideal competitive adsorption model.
Environmental Science and Technology 29, 446-457.
2. Buffle J. 1988. Complexation reactions in aquatic systems: an analytical approach. Ellis
Horwood, New York, 692p.
3. Croué J.P. 2004. Isolation of humic and non-humic NOM fractions: structural characterization.
Environmental Monitoring and Assessment 92, 193-207.
4. Galceran J., Companys E., Puy J., Cecilia J. and Garces J.L. 2004. AGNES: a new
electroanalytical technique for measuring free metal ion concentration. Journal of
Electroanalytical Chemistry 566, 95-109.
5. Imai A., Fukushima T., Matsushige K., Kim Y.H. and Choi K. 2002. Characterization of
dissolved organic matter in effluents from wastewater treatment plants. Water Research 36
(4), 859-870.
6. Leenheer J.A. 1981. Comprehensive approach to preparative isolation and fractionation of
dissolved organic carbon from natural waters and wastewaters. Environmental Science and
Technology 15 (5), 578-587.
7. Pernet-Coudrier B., Varrault G., Tusseau-Vuillemin M.-H. and Mouchel J.-M. 2007. Effects of
urban dissolved organic matter from wastewater treatment plant and anthropized river on
speciation and toxicity of copper to Daphnia magna (Strauss). Beijing, 19-24 July, International
Conference On Biogeochemistry of Trace Element.
448

Physiological Activity of Humic Substances from Bark Compost
Todorka Popova1, Konstantin Chakalov1, Valentin Savov1, Konstantin Mitov2,
Gergana Angelova1 1ROMB Ltd, 2 “Aboba” str., Sofia, Bulgaria; [email protected] 2NIPRORUDA JSCo, 205 Al.Stamboliiski str., 1309 Sofia, Bulgaria
Keywords: compost, humic, phytochrome
1. INTRODUCTION
It is well known that bark composts have a stimulating effect on growing plants. In a
recent study, demonstrated that indoleacetic acid (IAA) is present in humic substances but
its concentration is not sufficient to justify its biochemical activity in plant systems. The
uncertainty about the mechanism by which humic substances stimulate plant biochemical
activities is partly due to their chemical heterogenity and the difficulty of their
characterization. Thus, the attempts to relate humus structure to biochemical activity have
produced contradictory results (2).
The aim of this study is to determine the hormone and hormone-like effect of humic
fractions with a standard seedling test using Lactuca sativa (evaluated with
polyphenoloxidase, peroxidase, and dehydrogenase activities in humic extracts)
2. MATERIALS AND METHODS
The samples were prepared by composting for -14 days in a thermostat 25-mm-
crushed barks added with 2g/dm3 NPK (20:20:20) and various additives (Table 1).
Microbial inoculation was done with conidia of Trichoderma viride - 5x10⁹/100g;and
T.harzianum 5x10⁹/100g .The substrate humidity was 70% and the temperature was 28оС
in the first 3 days, 35оС the second 3 days, and 38оС until the end of the process.
The level of humification of bark was determined according the method of Kononova-
Belchikova (1). The polyphenoloxidase, peroxidase, and dehydrogenase activities were
measured in humic substances extracted with 0,1 N NaOH at a ratio extractant : substrate
= 10:1. The physiological effect of the humic substances extracts was determined by a test
using hypocotyls of lettuce on the controls: Barks 1; GA3 and coffee compost with
T.harzianum. “Magic Green” is a commercial product of ROMB Ltd, Bulgaria, proposed for
increasing the enzyme activity in soilless substrates.
449
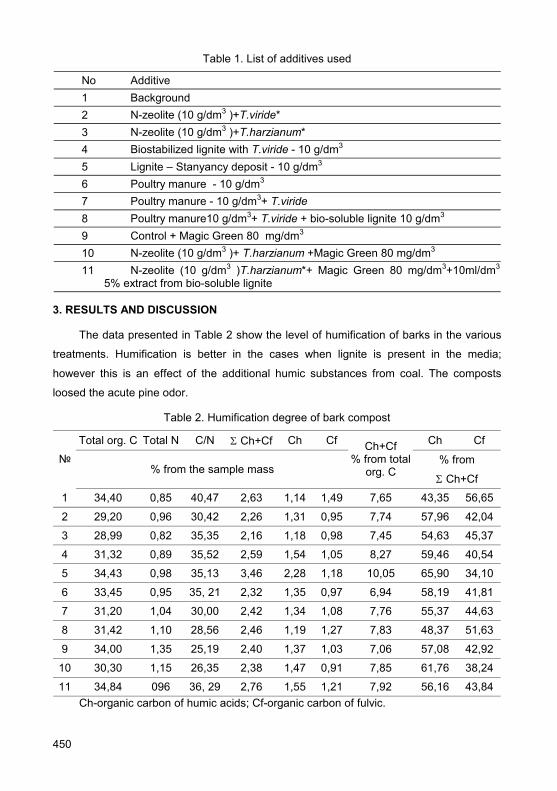
Table 1. List of additives used
No Additive 1 Background 2 N-zeolite (10 g/dm3 )+T.viride* 3 N-zeolite (10 g/dm3 )+T.harzianum* 4 Biostabilized lignite with T.viride - 10 g/dm3 5 Lignite – Stanyancy deposit - 10 g/dm3 6 Poultry manure - 10 g/dm3 7 Poultry manure - 10 g/dm3+ T.viride 8 Poultry manure10 g/dm3+ T.viride + bio-soluble lignite 10 g/dm3 9 Control + Magic Green 80 mg/dm3 10 N-zeolite (10 g/dm3 )+ T.harzianum +Magic Green 80 mg/dm3 11 N-zeolite (10 g/dm3 )T.harzianum*+ Magic Green 80 mg/dm3+10ml/dm3
5% extract from bio-soluble lignite
3. RESULTS AND DISCUSSION
The data presented in Table 2 show the level of humification of barks in the various
treatments. Humification is better in the cases when lignite is present in the media;
however this is an effect of the additional humic substances from coal. The composts
loosed the acute pine odor.
Table 2. Humification degree of bark compost
Total org. С Total N C/N Σ Сh+Сf Сh Сf Сh Сf
№ % from the sample mass
Сh+Сf % from total
org. С % from
Σ Сh+Сf
1 34,40 0,85 40,47 2,63 1,14 1,49 7,65 43,35 56,65
2 29,20 0,96 30,42 2,26 1,31 0,95 7,74 57,96 42,04
3 28,99 0,82 35,35 2,16 1,18 0,98 7,45 54,63 45,37
4 31,32 0,89 35,52 2,59 1,54 1,05 8,27 59,46 40,54
5 34,43 0,98 35,13 3,46 2,28 1,18 10,05 65,90 34,10
6 33,45 0,95 35, 21 2,32 1,35 0,97 6,94 58,19 41,81
7 31,20 1,04 30,00 2,42 1,34 1,08 7,76 55,37 44,63
8 31,42 1,10 28,56 2,46 1,19 1,27 7,83 48,37 51,63
9 34,00 1,35 25,19 2,40 1,37 1,03 7,06 57,08 42,92
10 30,30 1,15 26,35 2,38 1,47 0,91 7,85 61,76 38,24
11 34,84 096 36, 29 2,76 1,55 1,21 7,92 56,16 43,84 Ch-organic carbon of humic acids; Cf-organic carbon of fulvic.
450

Table 3. Enzyme activity of compost
№ Polyphenoloxidase mgPPG/ 100g/30’
Peroxidase mgPPG/ 100g/30’
Dehydrogenase mg formazan/1g/
24h
1 37 46 0,12197
2 - 70,8 0,06628
3 - 48,3 0,07823
4 7,2 97,4 0,09285
5 - 27,1 0,16457
6 8,1 69 0,18027
7 0,5 45,1 0,10124
8 0,5 32 0,03864
9 5,9 46,9 -
10 8,6 100,6 0,1166
11 11,3 114,6 0,148
The data presented in Table 3 show the influence of composting accelerators on
enzyme activity of humic-like substances. Microfungal influence using the background of
zeolite has no suitable effect, whereas in the presence of Magic Green or bio-soluble
lignite T.harzianum increased almost twice the peroxidase activity of the extract.
Table 4. Lactuca sativa hypostyle test-mm of hypostyls after germination
Dark D-mm of hypostyls after germination
D Control D GA3* D 1** D 2 D 3 D 4 D 9 D 10 D 11 D Coffee
32,00 46,40 34,60 33,60 33,00 38,40 32,40 38,60 39,80 30,80
Red light R-mm of hypostyls after germination
R Control R GA3 R 1 R 2 R 3 R 4 R 9 R 10 R 11 R Coffee
32,80 51,20 40,00 41,40 35,40 34,60 39,60 45,20 42,80 39,60
Difference in mm of hypostyls after germination R-D-%
Control GA3 % 1 % 2 % 3 % 4 % 9 % 10 % 11 Coffee
1,01 10,29 16,33 25,53 9,64 -8,72 23,90 19,20 8,30 29,11 D+/ limits=5, 09; F= 7, 06; P=0,000; +/-limits=4, 64; F=11, 68; P=0,000
*20 ppm.
**All extracts are 1000 times water diluted.
451
The data presented in table 4 show that the humic-like extracts influence strongly the
phytochrom activation with red light. T. viride and T. harzianum influence hypocotyls
growth like gibberelic acid. Bio-soluble lignite forms humic substances with auxin-like
effect. Magic Green promotes the activity of humic-like compounds and their effect on
phytochrom activation.
4. CONCLUSIONS
The biotransformation of organic matter in bark composts was strongly affected by
the microfungal treatment in combination with the commercial product Magic Green.
ACKNOWLEDGEMENTS
This work was supported by the National Innovation Fund – Bulgaria and by
ADVANCED NUTRIENTS - Canada.
REFERENCES
1. Kononova M.M. 1966. Soil Organic Matter. (2e). Pergamon, N.Y., p. 544.
2. S. Nardi, D. Pizzeghello, F. Reniero and N. Rascio. 2000 Chemical and Biochemical
Properties of Humic Substances Isolated from Forest Soils and Plant Growth In: Soil Science
Society of America Journal 64, 639-64
452

The Probable Mechanism of Biological Effect of Humic Substances
Alexander I. Popov The Saint Petersburg State University, biological and soil faculty, department of soil science and
soil ecology, 16th line 29, 199127, Saint Petersburg, Russian Federation, [email protected]
Keywords: humic, biological effect, biological activity
1. INTRODUCTION
Humic substances (HS) are main component of soil organic matter. One of major property of HS is their biological activity (1, 4, 6-9). There are most amounts of scientific publications, which are devoted HS biological effect on growing and development of green vascular plants. The HS biological effect on plants is connected with that that they, penetrating into plants (but unnecessary in cytoplasm), participate in different biochemical and biophysical processes (6-9, 12, 14, 17). Optimization of crops is an important direction of economic people activity. Understanding of biochemical ways of interplay between plant and soil, in which HS play a key role, will allow to develop effective crop technologies and to act upon agricultural plants under stress by non-root treatment of HS solution (3).
In this connection, the aim of this publication was to present a conceptual model, reflecting a HS biological effect on biochemical and biophysical plant processes. Model is built on the base of scientific literature analysis and own experimental data.
2. DESCRIPTION MODELS
Developing scientific positions, connected with this question, I worked up the new conceptual model of HS participation in biochemical and biophysical processes, occurring in green vascular plants (Fig. 1). In accordance with the proposed model, biological activity HS is determined by: 1) the presence of the varied functional groups, 2) the colloidal characteristic and 3) the material constitution.
Varied functional groups as positively (e. g. amides, amines, azogroups, imines etc.), so and negatively charged (e. g. carboxylic, carbonyl, hydroxyl groups etc.) are presented in humic substances (5, 9, 16), therefore HS – polyfunctional polyampholites. Although HS are polyampholites, they can be considered among acidosic colloidal micelles (10). Totality of functional groups determines the reactionary ability of these compounds a whole. Humic substances are donors and acceptors of electrons and hydrogen ions; therefore they can participate in different redox-reactions, including reversible ones too (18). Consequently HS inputting into plants can optimize a respiration and less photosynthesis as a result of that a biosynthesis is quickened (1, 4, 6-9, 12, 17).
453

P o l y a m p h o l y t e s (acid-base complex)
H e t e r o- p o l y m e r s
Donors and acceptors of electrons, anions, cations and hydrogen ions
Complexation
Participation in redox-reactions Reactionary ability, including ion
exchange and chelation
Physiological activity and source of
structured fragments of macromolecules
H U M I C S U B S T A N C E S
Mitosis and
merosis Influence on cell
walls and channels of transport systems
Transport and circulation of
nutrients substances
Photo-synthesis
Optimization of growing, developments and productivity of plants
Respiration
Detoxication of xenobiotics
Biosynthesis
Complexation with organic compounds
Influence upon functions of cell
membranes
C o l l o i d a l d i s p e r s i o n
Hydrophilic-hydrophobic and electrostatic
interactions on phase boundary
Surface activity Electrosurface
phenomena
Material constitution and molecular-weight
Osmotic pressure
Chelate compounds
Counterions for cations
Flow property of liquid phase
Presence of physiologically active
substances
Arylglycoproteid poly- and oligomers
Figure 1. Participation of humic substances in plant metabolism.
Reactionary ability of HS is connected with possibility of complexation with macro-
and microelements (1, 6, 7, 15). These compounds are easy transported both into plants,
and inside ones. Besides reactionary ability of HS is showed by influence upon an osmotic
pressure, ATPase activity, synthesizing of a transport proteins, bioelectrical reactions,
intercellular diffusion relationship, counteraction to alkalization (in this case the decrease
454
of absorption of NO3– and the increase of absorption of NH4
+ can be observed), synergetic
or antagonistic interactions with enzymes and some growth regulators of plants,
detoxication of xenobiotics and etc. (4, 6, 12). Humic substances can lead to optimization
of ratio between organic and inorganic anions and as a result of decrease a content of
nitrates in plant product too. As well as HS can participate in some other processes.
From the position of colloid chemistry, HS are colloidal dispersions and so they have
electrosurface and surface activity properties (10-11, 14). Electrosurface phenomena of
HS are explained a double electrical layer on surface of dispersed phase. These
phenomena of HS are realized in sorption properties, ion-exchange ability and electrostatic
interactions. Humic substances as surfactant species can decrease a surface tension of
water solution. Exactly this property of HS is indicative. The more surface activity
properties of HS, the higher biological effect of ones. Humic substances inputting into
plants make hydrophilic the walls of transport system channels and make easy a
pinocytosis. They influence upon bioelectrical reactions, viscosity of protoplasm, surface
tension of solution, properties of cell wall, penetrability of intercellular canaliculi, ionophore
effect, selectivity of cell membrane and etc. (1, 3, 6, 7, 12-14). The higher a speed of
transport and circulation of nutrients in plants, the more a speed of photosynthesis, the
more an assimilation of mineral phytonutrients from soil. In result the growth and evolution
of crops is improved, and the use factor of fertilizers is decreased.
From chemical point of view HS are heteropoly(oligo)mers, which are
arylglycoproteid poly- or oligomers with the different molecular mass. That is why HS can
be a source of structured fragments of organic macromolecules after the consumption and
assimilation HS by plants. In this case plants "economize" energy by using the organic
molecules (14). Biological effect of HS can be conditioned by the action like
phytohormones and/or contents of physiology active compound in its composition (5-7, 12,
14) too. Besides HS can increase a value of mitotic index (6), influence on biosynthesis (2,
4, 12, 17). The biochemical composition of HS determines nutritive value, the molecular
mass of components — food accessibility these compounds for plants. Factions of HS with
the various molecular masses are differed by both properties and effects on plants (6, 12).
3. CONCLUSIONS
In the most general type a model is universal for green vascular plants and it
illustrates that the biological effect of HS is integral representation of their properties. The
biological activity HS is determined by: (i) presence the varied functional groups,
(ii) colloidal characteristics and (iii) material constitution.
455

ACKNOWLEDGEMENTS
The work was carried out by the financial support of RFBR, grant: 07-04-01162.
REFERENCES
1. Chen, Y., Aviad, T. 1990. In: Humic Substances in Soil and Crop Sciences: Selected
Readings. P. MacCarthy, C. E. Clapp, R. L. Malcolm, P. R. Bloom (Eds.). Soil Sci Society of
America, Special Publications, Madison Wis., pp. 161–186.
2. Činčerova, A. 1964. Biol. Plantarum. 6 (3), 183–188.
3. Ermakov, E. I., Popov, A. I. 2001. Herald of the Russian Academy of Agricultural Sciences. 1.
58–62 (In Russian).
4. Flaig, W. 1963. About the effect of humic substances on the plant metabolism. Int. Peat
Congress. Leningrad, USSR. 48 p. (In Russian).
5. Flaig, W., Beutelspacher, H., Rietz, E. 1975 In: Soil Components. Organic Components (Vol.
1), Springler-Verlag; Berlin, Heidelberg, New York, pp. 1–111.
6. Gorovaya, A. I., Orlov, D. S., Sherbenko, O. V. 1995. Humic substances: Construction,
functions, mechanism of action, protector, characteristics, ecological role. Naukova dumka,
Kiev. 303 p. (In Russian).
7. Humic Preparations. 1971. Sci. works of Tyumen Agricultural Inst. Vol. 14. 266 p. (In Russian).
8. Khristeva, L. A. 1953. Pochvovedenie (Soil science). 10, 46–50.
9. Kononova, M. M. 1966 Soil Organic Matter: Its Role in Soil Formation and in Soil Fertility.
Pergamon Press, New York. 544 p.
10. Laktionov, N. I. 1978. Humus as natural colloidal surfactant. Publishers of Kharkov Agricultural
Inst. Kharkov. 25 p. (In Russian).
11. Lishtvan, I. I., Kruglitskii, N. N., Tretinnik, V. U. 1976. Physicochemical mechanics of humic
substances. Nauka i tehnika, Minsk. 262 p. (In Russian).
12. Nardi, S., Pizzeghello, D., Muscolo, A., Vianello, A. 2002. Soil Biol. Biochem. 34 (11), 1527–
1536.
13. Perminova, I. V., Grechishcheva, N. Yu., Kovalevskii, D. V., Kudryavtsev, A. V., Petrosyan, V.
S., Matorin, D. N. 2001. Environ. Sci. Technol. 35 (19), 3841-3848.
14. Popov, A. I. 2004. The Humic Substances: Properties, Construction, Formation. E. I. Ermakov
(Ed.), Saint Petersburg University Press, Saint Petersburg. 248 p. (in Russian).
15. Prozorovskaya, A. A. 1936. In: Organic Mineral Fertilizers. Book of chemical-engineering and
agrochemical works. 127. pp. 143–161. (In Russian).
16. Schnitzer, M. 1978 In: Soil Organic Matter. Development of Soil Science (No 8), M. Schnitzer
and S. U. Khan (Eds.), Ottawa, pp. 1-64.
17. Visser, S. A. 1972. In: The Proc. of the 4-th Int. Peat Congress, Helsinky, pp. 2-23.
18. Ziechmann, W. 1977. Z. Pflanz. Boden. 140, 133-150.
456

Chemical and Optical Characteristics of HS Isolated from the South Moravian Soils
Ľubica Pospíšilová1, Naděžda Fasurová2, Lubomír Jurica3, Eduard Pokorný1
1Mendel University of Agriculture and Forestry, Institute of Agrochemistry, Soil Science,
Microbiology and Plant Nutrition, Zemedelska 1, 613 00 Brno, Czech Republic, [email protected] 2Brno University of Technology, Faculty of Chemistry, Institute of Physical and Applied Chemistry,
Purkynova 118, 612 00 Brno, Czech Republic
3Zoll laboratory CR SR, Mileticova 42, 824 59 Bratislava, Slovak Republic
Keywords: humic substances, synchronous fluorescence and energy dispersive X–ray
spectroscopy
1. INTRODUCTION
The reactivity of humic substances (HS) is given by their functional group chemistry
and microstructure, which are in turn influenced by the composition of the surrounding
materials. They possess a highly complex and refractory character, and have the capacity
for diverse chemical and physical interactions in the environment (1). Therefore
determination of HS and humic acids (HA) spectral characteristics performed fast and
convenient method for their evaluation. Synchronous fluorescence spectroscopy (SFS)
can characterize content of condensed aromatic ring systems, bear electron-withdrawing
substituents, such as carboxyl and carbonyl groups in order to investigate its function,
origin and fate in soils (1) and (2).
Energy dispersive X–ray spectroscopy (EDXS) is capable to identify which elements
are actually present under electron probe. The aim of our work was to compare humic
substances quality in different soil types.
2. MATERIALS AND METHODS
Soil samples were collected from the topsoil of Modal Chernozem (locality Bratčice),
Haplic Luvisol (locality Veverské Knínice), and Gleyic Stagnosol (locality Kameničky). We
followed total carbon content (TOC) by oxidimetric method (3), fractional composition of
HS according to Kononova-Belchikova method (4). Isolation of HA was made according to
IHSS method (5). Elementary analysis of isolated HA was kindly made in Institute of Rock
structure and Mechanics of the ASCR in Prague. Standard methods of Carlo Erba and
elementary CHNS/O analyser - Thermo Finnigan were used. The non-destructive optical
457

methods have been used for HA characterization. EDX spectra were measured using
energy–dispersive X-ray spectrofluorimeter XEPOS to detect elements in situ. SFS
spectra we measured by Spectrofluorimeter AMINCO BOWMAN Series 2,
Thermospectronics, bandpass of both monochromators 4 nm, temperature 20°C, and
constant difference (Δλ=(λem.−λex.)=20nm) between excitation and emission
monochromators and were corrected at 845 V.
3. RESULTS AND DISCUSSION
Fractional composition of different soil types is listed at the Table 1. Results showed
the highest amount of HS in Gleyic Stagnosol following by Modal Chernozem and Haplic
Luvisol. Quality of HS was the highest in Modal Chernozem followed by Haplic Luvisol and
Gleyic Stagnosol. Gleyic Stagnosol HS contained the highest amount of FA, which is
typical for this soil type. Humification degree was middle for all samples (Table 1).
Elemental composition of isolated HA is given at the Table 2. The highest carbon and
oxygen content was found in Modal Chernozem HA, which corresponded with literature
data (1). SFS spectra measured in mixture of 0.1M Na2P4O7 and 0.1M NaOH are listed at
Fig. 1. All samples exhibited the presence of five main spectral peaks at λex./ λem.: 467/487,
481/501, 492/512, 450/470, 339/359. Maximum relative fluorescence intensity gave the
sample of Gleyic Stagnosol at 487 nm (the main peak). Lower relative fluorescence
intensity gave Haplic Luvisol and Modal Chernozem at the same wavelength. We suppose
that emission peaks at 359 nm and 419 nm were affected by the FA presence in the alkali
extract. High amount of FA was typical for Gleyic Stagnosol (see Table 1, Fig. 1). The
main peak (487 nm) was shifted to the longer wavelengths, which was caused by the
polyaromatic moieties. Peaks at the lower wavelengths (<450nm) indicated the presence
of simple phenolic compounds. Our results were compared with Elliot HA standard (Fig. 1)
and the relative fluorescence intensity indexes were calculated. Correlation between
optical indexes and fractional composition was found. EDX spectroscopy was used to
investigate elemental composition of HA samples as a complex. Modal Chernozem HA
and Haplic Luvisols HA had practically the same X - ray spectra (Fig. is not shown). Both
samples contained by Fe, Ti, Al, Si, S and Cl. Gleyic Stagnosol HA contained much more
Fe, Ti, Al, Cu, Zn, As, S and Cl (Fig. is not shown).
458

Figure 1. SFS spectra of HS isolated from different soil types.
Table 1. Total carbon content (TOC), fractional composition of HS and humification degree
(HD) in selected soil types (numerator: in mg/kg, determinator: in % of TOC)
Soil Types TOC HS sum HA sum FA sum HD HA/FA (%) (mg/kg) (mg/kg) (mg/kg) (%)
Modal 1.61 5.0 4.0 1.0 24.8 3 Chernozem 31.1 24.8 6.2
Gleyic 3.65 16.5 9.0 7.5 24.6 1.4 Stagnosol 45.2 24.6 20.5
Haplic 2.1 5.0 3.0 2.0 14.3 1.5 Luvisol 23.8 14.3 9.5
Table 2. Elemental composition of isolated HA in atomic %
SAMPLE %C %H %N %O
HA – Modal Chernozem 37.9 39 2.9 20
HA – Gleyic Stagnosol 36 42.4 3 18.4
HA – Haplic Luvisol 34.5 43 2.7 19.7
HA – Elliot standard 44.1 33.7 2.7 19.4
459
4. CONCLUSIONS
SFS spectra showed that the spectral behaviour (shape of curve) depends on
fractional composition of HS. The relative fluorescence intensity indexes correlated with
HA/FA ratio. Amount of HS was decreasing in order: Gleyic Stagnosol > Modal
Chernozem > Haplic Luvisol. The relative fluorescence intensity suggested the highest
values in Gleyic Stagnosol. EDX spectroscopy allowed us a quick, direct quantification of
different elements in HA molecule.
ACKNOWLEDGEMENTS
This study was supported by the Research plan No. MSM6215648905 “Biological
and technological aspects of sustainability of controlled ecosystems and their adaptability
to climate change“, which is financed by the Ministry of Education, Youth and Sports of the
Czech Republic and by the project of GAČR No. 10403/D135.
REFERENCES
1. Senesi, N. 1993. In: Beck, A. J., Jones, K. C., Hayes, M. H. B., Mingelgrin, U. (Eds.), Organic
Substances in Soil and Water: Natural Components and their Influence on Contaminant
Behaviour, Ch 4, Royal Society of Chemistry, London, 73–101.
2. Sierra, M. M. D., Giovanela, M., Parlanti, E., Soriano-Sierra, E. J.2005. Chemosphere 58,
715_733.
3. Nelson, D. W. and Sommers, L. E.1982. In: Page, A. L., Miller, R. H. and Keeney, D. R. (eds.)
Methods of soil analysis. Part 2. ASA, SSSA Publ., Madison, Wisconcin. 539–579.
4. Kononova, M.M.- Bělčiková, N.P. 1963. In: Organičeskoje veščestvo počvy. Moskva, 228-234.
5. Hayes, M. H. B. 1985. In: Aiken, G.R., Wershaw,R.L., McKnight, D. M., McCarthy, P.(Eds.),
Humic Substances in Soil Sediments and Water. John Wiley, N.Y., 329-362.
460
Relationship between Spectral and Photosensitizing Properties in Bulk and Fractionated Humic Substances
Claire Richard1, Alexandra ter Halle1, Ghislain Guyot1, Olga E. Trubetskaya2, Oleg A.
Trubetskoj3, Giampetro Corrado4, Luciano Cavani4, Claudio Ciavatta4
1Laboratoire de Photochimie Moléculaire et Macromoléculaire, UMR CNRS-Université Blaise
Pascal 6505, 63177 Aubière Cedex, France; [email protected] 2Institute of Basic Biological Problems, Russian Academy of Sciences, 142290 Pushchino,
Moscow region, Russia 3Branch of Shemyakin and Ovchinnikov Institute of Bioorganic Chemistry, Russian Academy of
Sciences, 142290 Pushchino, Moscow region, Russia 4Dept. Of Agro-Environmental Science and Technology, Alma Mater Studiorum University of
Bologna, Viale G. Fanin, 40, I-40127 Bologna, Italy
Keywords: humic acid, fractionation, fluorescence, photosensitizing, singlet oxygen
1. INTRODUCTION
Size fractionation of humic substances is often performed in order to study the
change of one or other structural characteristics or properties as a function of the
macromolecules weight and to have a better insight into the basic constituents or
functional groups distribution. It may be also a way to draw a parallel between two
properties or between structural characteristics and a property when the changes of both
among fractions are similar. It was our purpose: we aimed to show that photosensitizing
properties, i.e. the ability to generate singlet oxygen under light excitation, is linked to the
emitting properties at long wavelength.
HS hνsinglet oxygen
emission at λ> 450 nm
Two types of fractionation was used. A Chernozem HA was fractionated in three
fractions using a two-step method: first size exclusion chromatography (SEC) in the
presence of denaturing compounds and second polyacryacrylmide gel electrophoresis
(PAGE). A peat HA was fractionated by tangential ultrafiltration into seven nominal
molecular weight (NMW) fractions which were purified by dialysis (0.5 kDa) [1]. Separated
fractions were further compared for their emitting properties and for their ability to generate
singlet oxygen under light excitation. The photosensitizing properties were investigated
using furfuryl alcohol as a probe molecule to scavenge singlet oxygen.
461

2. MATERIALS AND METHODS
Humic acids were extracted from the A horizon (10-20cm) of typical chernozem soil
(Kursk region, Russia) and from an Irish peat (1). SEC-Page fractionation of Chernozem
HA was described elsewhere (2). Three fractions were obtained: A, B and C+D showing
distinct NMW and electrophoretic mobilities. Seven fractions with NMW using tangential
ultrafiltration device with cellulose regenerated filters were obtained from peat (3). Finally,
each fraction was dialysed (0.5 Da cut-off) against deionised water and freeze dried. We
got the following NMW cut-offs: 0.5-5.0 Da (HA0.5-5); 5.0-10 Da (HA5-10); 10-20 Da (HA10-
20); 20-50 Da (HA20-50); 50-100 Da (HA50-100); 100-300 Da (HA100-300); > 300 Da (HA>300).
Furfuryl alcohol (FFA) was provided from Aldrich. Stock solutions (10-3 M) were
stored at 4°C and their level in furaldehyde was checked every day. Water was purified
using Millipore milli-Q system (Millipore αQ, resistivity 18MΩcm, DOC<0.1 mg/L).
Excitation Emission Matrix (EEM) spectra were recorded on a Perkin-Elmer LS-55
luminescence spectrometer that was equipped with a xenon excitation source. Excitation
and emission slits were set to 10 and 5 nm band pass, respectively. Correction for
instrumental configuration was made using the calibration data for excitation and emission
factors provided by the manufacturer. In order to minimize the excitation inner filter effect,
an absorbance of 0.100 ± 0.005 at 300 nm was chosen for all the samples solutions.
Irradiation experiments were conducted in a device equipped with polychromatic
lamps simulating solar light, in a pyrex reactor. HLAs or fractions were irradiated with
furfurylic alcohol (FFA) at an initial concentration of 10-4 M. All the solutions were buffered
at pH 6.5. Photochemical reactions were investigated at a constant initial absorbance of
0.1 at 300 nm. FFA loss was monitored by HPLC. For all samples, FFA loss followed a
first order kinetics. The rate coefficient was measured by plotting ln(c/c0) vs t, where c and
c0 represent FFA concentrations at t and 0, respectively.
3. RESULTS AND DISCUSSION
In the case of Chernozem HA and SEC-PAGE fractions, the rate of FFA loss was
significantly higher for C+D fraction than for A or B fractions (Table 1). Differences in rate
coefficient values would be even more drastic if they would be corrected for the mass and
normalized at a constant mass for all fractions. Indeed, fraction C+D was about twice more
absorbing than fractions A and B (it means that when one works at a fixed absorbance,
fraction C+D is less concentrated in organic carbon than other fractions). In fluorescence,
important differences were also observed between fractions: only fraction C+D was
emitting at λ > 450 nm (4).
462

Table 1. Rate coefficient, k. Chernozem HA and fractions
Sample HA Fraction A Fraction B Fraction C+D
k/10-6 s-1 35 5.7 4.7 72
In the case of peat HA and its fractions, results are summarized in Table 2. The rate
coefficient is the lowest for HA>300 and the highest for HA50-100. All the samples are emitting
within the wavelength 398-540 nm, but again HA>300 is the less emitting. We plotted k vs. I.
The correlation coefficients were quite good for I498 and I540 (0.890 et 0.898, respectively)
while fair for I398 and I430 (0.728 and 0.482, respectively).
Table 2. Rate coefficient, k, and emission intensities at several wavelengths for excitation
at 300 nm. Peat HA and fractions
Sample k/10-6 s-1 I398 I430 I498 I540
HA 6.5 89.3 103.6 58.2 76.46
HA0-5 8 131.6 121.5 62.5 78.2
HA5-10 8.11 89.3 92.7 69 82.8
HA10-20 6.94 107.6 95.7 63.5 71.6
HA20-50 5.94 58.8 67.3 52.2 55.9
HA50-100 9.38 87.5 113 86.8 102
HA100-300 5.76 57.5 61 36 42
HA>300 4.72 38.9 46.5 21.4 28.2
Thus, whatever the studied HA and the type of fractionation the capacities to
generate singlet oxygen under light excitation and to emit at long wavelength are
correlated. Either these properties arise from the same types of constituents, or they arise
from different constituents linked together.
4. CONCLUSIONS
With both HAs and both types of fractionation, it appears that there is a good
correlation between the ability of the fraction to generate singlet oxygen upon irradiation in
polychromatic light and the property to emit at long wavelength (above 450 nm). This
result will be discussed.
463

ACKNOWLEDGEMENTS
The work has been supported by INTAS grant 06-8055.
REFERENCES
1. Francioso, O., Ciavatta, C., Tugnoli, V., Sànchez-Cortés, S., Gessa, C. 1998. Soil Sci. Soc.
Am. J. 1,181-187.
2. Trubetskoj, O.A., Trubetskaya, O.E., Afanas'eva, G.V., Reznikova, O.I., Saiz-Jimenez, C.
1997. J, Chromat. A 767, 285-292.
3. Francioso, O., Sanchez-Cortes, S., Canarini, D., Garcia-Ramos, J.V., Ciavatta, C., Gessa, C.
2002. J. Mol. Struct. 609, 137-147.
4. Trubetskaya, O., Trubetskoj, O., Guyot, G., Richard, C. 2002. Org. Geochem. 33, 213.
464
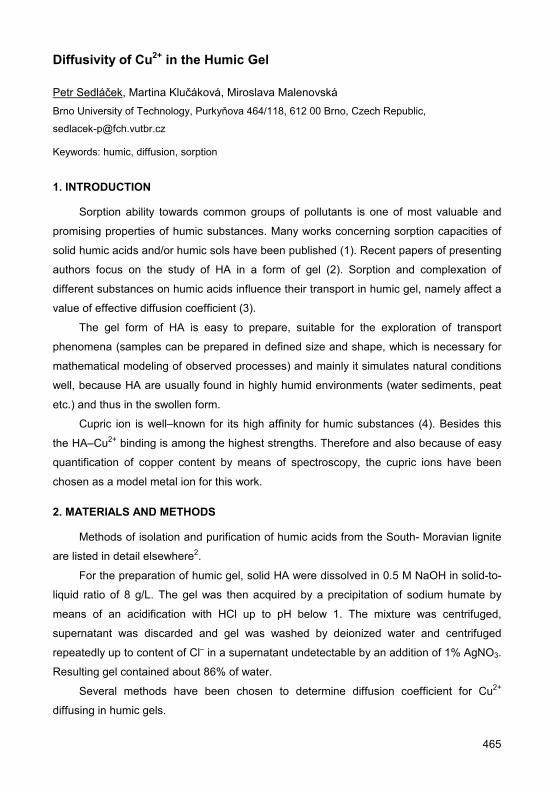
Diffusivity of Cu2+ in the Humic Gel
Petr Sedláček, Martina Klučáková, Miroslava Malenovská Brno University of Technology, Purkyňova 464/118, 612 00 Brno, Czech Republic,
Keywords: humic, diffusion, sorption
1. INTRODUCTION
Sorption ability towards common groups of pollutants is one of most valuable and
promising properties of humic substances. Many works concerning sorption capacities of
solid humic acids and/or humic sols have been published (1). Recent papers of presenting
authors focus on the study of HA in a form of gel (2). Sorption and complexation of
different substances on humic acids influence their transport in humic gel, namely affect a
value of effective diffusion coefficient (3).
The gel form of HA is easy to prepare, suitable for the exploration of transport
phenomena (samples can be prepared in defined size and shape, which is necessary for
mathematical modeling of observed processes) and mainly it simulates natural conditions
well, because HA are usually found in highly humid environments (water sediments, peat
etc.) and thus in the swollen form.
Cupric ion is well–known for its high affinity for humic substances (4). Besides this
the HA–Cu2+ binding is among the highest strengths. Therefore and also because of easy
quantification of copper content by means of spectroscopy, the cupric ions have been
chosen as a model metal ion for this work.
2. MATERIALS AND METHODS
Methods of isolation and purification of humic acids from the South- Moravian lignite
are listed in detail elsewhere2.
For the preparation of humic gel, solid HA were dissolved in 0.5 M NaOH in solid-to-
liquid ratio of 8 g/L. The gel was then acquired by a precipitation of sodium humate by
means of an acidification with HCl up to pH below 1. The mixture was centrifuged,
supernatant was discarded and gel was washed by deionized water and centrifuged
repeatedly up to content of Cl– in a supernatant undetectable by an addition of 1% AgNO3.
Resulting gel contained about 86% of water.
Several methods have been chosen to determine diffusion coefficient for Cu2+
diffusing in humic gels.
465
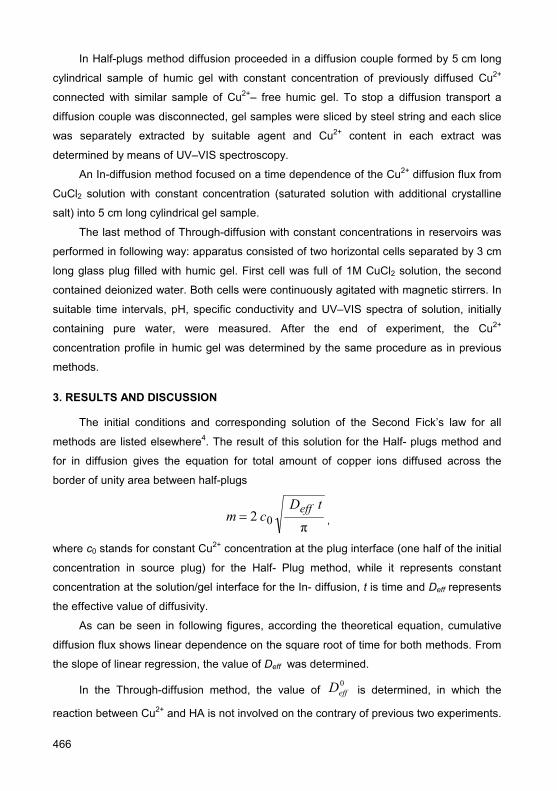
In Half-plugs method diffusion proceeded in a diffusion couple formed by 5 cm long
cylindrical sample of humic gel with constant concentration of previously diffused Cu2+
connected with similar sample of Cu2+– free humic gel. To stop a diffusion transport a
diffusion couple was disconnected, gel samples were sliced by steel string and each slice
was separately extracted by suitable agent and Cu2+ content in each extract was
determined by means of UV–VIS spectroscopy.
An In-diffusion method focused on a time dependence of the Cu2+ diffusion flux from
CuCl2 solution with constant concentration (saturated solution with additional crystalline
salt) into 5 cm long cylindrical gel sample.
The last method of Through-diffusion with constant concentrations in reservoirs was
performed in following way: apparatus consisted of two horizontal cells separated by 3 cm
long glass plug filled with humic gel. First cell was full of 1M CuCl2 solution, the second
contained deionized water. Both cells were continuously agitated with magnetic stirrers. In
suitable time intervals, pH, specific conductivity and UV–VIS spectra of solution, initially
containing pure water, were measured. After the end of experiment, the Cu2+
concentration profile in humic gel was determined by the same procedure as in previous
methods.
3. RESULTS AND DISCUSSION
The initial conditions and corresponding solution of the Second Fick’s law for all
methods are listed elsewhere4. The result of this solution for the Half- plugs method and
for in diffusion gives the equation for total amount of copper ions diffused across the
border of unity area between half-plugs
π2 0
tDcm eff= ,
where c0 stands for constant Cu2+ concentration at the plug interface (one half of the initial
concentration in source plug) for the Half- Plug method, while it represents constant
concentration at the solution/gel interface for the In- diffusion, t is time and Deff represents
the effective value of diffusivity.
As can be seen in following figures, according the theoretical equation, cumulative
diffusion flux shows linear dependence on the square root of time for both methods. From
the slope of linear regression, the value of Deff was determined.
In the Through-diffusion method, the value of 0effD is determined, in which the
reaction between Cu2+ and HA is not involved on the contrary of previous two experiments.
466
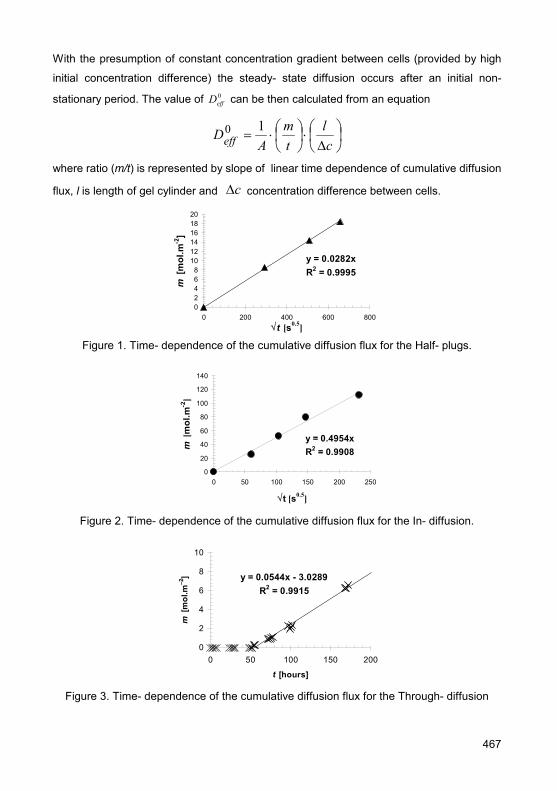
With the presumption of constant concentration gradient between cells (provided by high
initial concentration difference) the steady- state diffusion occurs after an initial non-
stationary period. The value of 0effD can be then calculated from an equation
⎟⎠⎞
⎜⎝⎛
Δ⋅⎟
⎠⎞
⎜⎝⎛⋅=
cl
tm
ADeff
10
where ratio (m/t) is represented by slope of linear time dependence of cumulative diffusion
flux, l is length of gel cylinder and cΔ concentration difference between cells.
y = 0.0282xR2 = 0.9995
02468
101214161820
0 200 400 600 800√t [s0.5]
m [m
ol.m
-2]
Figure 1. Time- dependence of the cumulative diffusion flux for the Half- plugs.
y = 0.4954xR2 = 0.9908
0
20
40
60
80
100
120
140
0 50 100 150 200 250
√t [s0.5]
m [ m
ol.m
-2]
Figure 2. Time- dependence of the cumulative diffusion flux for the In- diffusion.
y = 0.0544x - 3.0289R2 = 0.9915
0
2
4
6
8
10
0 50 100 150 200
t [hours]
m [m
ol.m
–2]
Figure 3. Time- dependence of the cumulative diffusion flux for the Through- diffusion
467

All calculated values of diffusivity are listed in Table 1 together with a value published
for diffusion in water. It can be seen, that all determined values are of the same order with
the value published for diffusion in water, which is expected for diffusion in hydrogels.
Table 1. Calculated values of Cu2+ diffusivity in the humic gel and a published value for the
diffusion in water (5)
Deff, Half-plug method 7.19×10⁻¹⁰ m2.s–1
Deff, In- diffusion method 7.92×10⁻¹⁰ m2.s–1
Deff0, Through diffusion method 4.58×10⁻¹⁰ m2.s–1
D, diffusion in water 1.43×10⁻⁹ m2.s–1
4. CONCLUSIONS
All methods proved themselves valuable for simple laboratory determination of the
diffusivity of cupric ions in the humic gel. Determined values of diffusivity were used in
following diffusion experiments in humic gels.
ACKNOWLEDGEMENTS
This work was financially supported by Ministry of Education, Youth and Sports –
Project No. MSM0021630501.
REFERENCES
1. Tipping, E., Hurley, M. A. 1992. Geochim. Cosmochim. Acta. 56, 3627–3641
2. Sedláček, P., Klučáková, M. 2007. In ECCE-6 Book of Abstracts Vol. 1, Technical University of
Denmark, Copenhagen, pp. 995-996
3. Cussler, E.L. 1984. Diffusion: Mass Transfer in Fluid Systems, Cambridge University Press,
Cambridge, pp. 132–143.
4. Stevenson, F. J. 1982. Humus Chemistry: Genesis, Composition, Reactions. 2nd ed., New
York, Wiley–Interscience Publ.,
5. Lide D.R. 1995. Handbook of chemistry and physics, 76th Edn., CRC Press, New York
468

The Role of Hormonal System in Protection of Wheat Plants Induced by HUMI M
Farida Shakirova, Vyacheslav Kusnetsov, Alsu Lubyanova, Rimma Fatkhutdinova, Marina
Bezrukova, Raisa Nurgalieva Institute of Biochemistry and Genetics, Ufa Scientific Center, Russian Academy of Sciences, pr.
Oktyabrya 71, 450054, Ufa, Russia, [email protected]
Keywords: Humi M, salinity, abscisic acid, indoleacetic acid, cytokinins, mitotic index
1 INTRODUCTION
Salinity is one of the most world-widespread stress factors not only causing water
deficit, but also having toxic effect on plants, which results in reduction in yield of
agricultural crops (1). Growth regulators which are known to render growth stimulating and
antistress effects may be used in order to increase stress-resistance and productivity of
plants. Preparations created on the basis of humic acids are such growth regulators (2; 3).
The present study is focused on the involvement of hormonal system in the protective
effect of preparation of Humi М under salinity.
2. MATERIALS AND METHODS
The seeds of wheat (Triticum aestivum L., cv. Bashkirskaya 24) were treated with
distilled water or Humi M (300 mg/kg of seeds) and grown for 3 days on filter paper
moistened with distilled water under illumination of 400 µmol m-2 s-1 (PAR from mercury-
arc luminous lamps) under 16-h photoperiod, at 21-23ºС. Humi M is a complex of sodium
salts of humic acids and microelements (NVP “BashIncom”). Further experiments were
carried out with 2-5-d-old seedlings grown hydroponically and their physiological and
biochemical parameters were analyzed. Salinity was initiated by adding 2 % NaCl into the
incubation medium containing 4-d-old seedlings. Plants pretreated by distilled water and
incubated on the medium without 2 % NaCl served as control in all experiments. Mitotic
index (MI) of root apical meristem was calculated as per cent of dividing cells (4). The
contents of free abscisic acid (ABA), indoleacetic acid (IAA) and cytokinins (CKs) were
measured in wheat plants by ELISA as described earlier (5). The analysis of lignin
deposition in cell walls of basal region of roots was determined as describes (6).
469
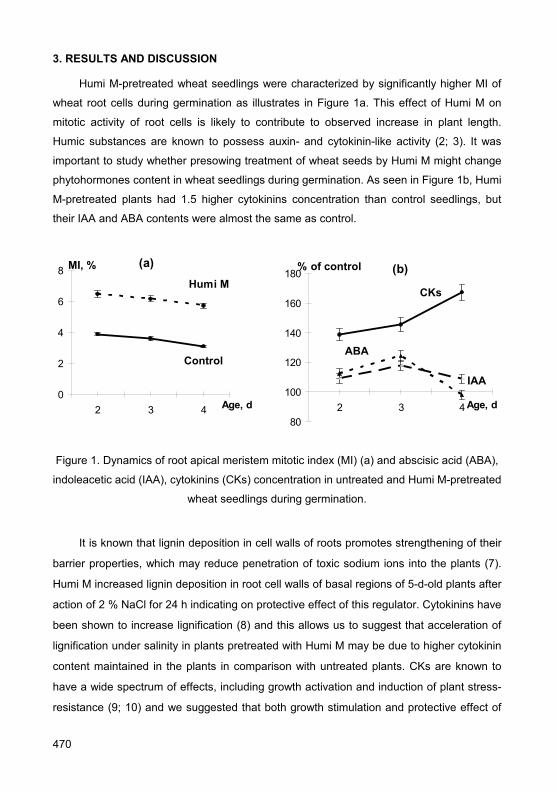
3. RESULTS AND DISCUSSION
Humi M-pretreated wheat seedlings were characterized by significantly higher MI of
wheat root cells during germination as illustrates in Figure 1а. This effect of Humi M on
mitotic activity of root cells is likely to contribute to observed increase in plant length.
Humic substances are known to possess auxin- and cytokinin-like activity (2; 3). It was
important to study whether presowing treatment of wheat seeds by Humi M might change
phytohormones content in wheat seedlings during germination. As seen in Figure 1b, Humi
M-pretreated plants had 1.5 higher cytokinins concentration than control seedlings, but
their IAA and ABA contents were almost the same as control.
0
2
4
6
8
2 3 4 Age, d
(a)
Control
Humi MMI, %
80
100
120
140
160
180
2 3 4 Age, d
CKs
ABA
IAA
(b)% of control
Figure 1. Dynamics of root apical meristem mitotic index (MI) (а) and abscisic acid (ABA),
indoleacetic acid (IAA), cytokinins (CKs) concentration in untreated and Humi M-pretreated
wheat seedlings during germination.
It is known that lignin deposition in cell walls of roots promotes strengthening of their
barrier properties, which may reduce penetration of toxic sodium ions into the plants (7).
Humi M increased lignin deposition in root cell walls of basal regions of 5-d-old plants after
action of 2 % NaCl for 24 h indicating on protective effect of this regulator. Cytokinins have
been shown to increase lignification (8) and this allows us to suggest that acceleration of
lignification under salinity in plants pretreated with Humi M may be due to higher cytokinin
content maintained in the plants in comparison with untreated plants. CKs are known to
have a wide spectrum of effects, including growth activation and induction of plant stress-
resistance (9; 10) and we suggested that both growth stimulation and protective effect of
470

Humi M on wheat seedlings under salinity is likely to be due to accumulation of
endogenous CKs.
Protective effect of Humi M-pretreatment is also seen in Figure 2a, showing a
decrease in detrimental effect caused by salinity on MI of wheat root apical meristem of
plants pretreated with Humi M. MI of Humi M-pretreated 4-d-old wheat plants under salt
stress was maintained close the control level. This was likely to result from ability of Humi
M to diminish the degree of disturbance of hormonal balance caused by salinity. Figure 2
also shows that the balance of phytohormones of Humi M-pretreated wheat seedling
reached the control level 24 h after withdrawal of salt unlike plants untreated with Humi M.
Moreover, CKs concentration in Humi M-pretreated wheat seedlings during post-stress
period exceeded the control level by 1.5-fold. All the data obtained allow to conclude that
presowing treatment of wheat seeds by Humi M have an active effect on the hormonal
system of plants due to regulation of CKs concentration in wheat seedlings.
50
100
150
200
ABA
IAA
CKs3 7 24
(b)2% NaCl
% of control
50
100
150
200
ABA CKs
IAA3 7 24
Time, h
Humi M+NaCl(c)% of control
1
2
3
4
Control 2%NaCl Humi M+
2%NaCl
2% NaCl, 3 h(a)MI, %
Figure 2. The effect of Humi M presowing treatment of wheat seeds and salinity on mitotic
index (MI) of root apical meristem (а) and ABA, IAA and CKs contents (b, с) of 4-d-old
wheat seedling under saline stress applied during 7 h and 24 h after stress.
4. CONCLUSIONS
The growth-stimulating and antistress effects of presowing treatment of wheat seeds
by Humi M is caused by its ability to induce 1.5-fold CKs accumulation in plants. CKs, in
turn, are likely to activate plant metabolism, which contributes to plant growth stimulation
and development of protective reactions.
471
REFERENCES
1. Zhu, J. 2001. Trends Plant Sci. 6, 66-71.
2. Nardi, S., Pizzeghello, D., Muscolo, A., Vianello, A. 2002. Soil Biol. Biochem. 34, 1527-1536.
3. Zhang, X., Ervin, E.H. 2004. Crop Sci. 44, 1737-1745.
4. Fambrini, M., Cionini, G., Pugliesi, C. 1997. Plant Cell, Tissue Organ Cult. 51, 103-110.
5. Shakirova, F., Sakhabutdinova, A., Bezrukova, M., Fatkhutdinova, D., Fatkhutdinova, R. Plant
Sci. 2003. 164, 317-322.
6. Furst, G.G. 1979. In: The methods of anatomical and hystochemical research of plants.
Nauka, Moscow. 155 p.
7. Hose, E., Clarkson, T., Steudle, E., Schreiber, L., Hartung, W. 2001. J. Exp. Bot. 52, 2245-
2264.
8. Guo, J., Hu, X., Duan R. 2005. J. Plant Growth Regul. 24, 93-101.
9. Musgrave, M.E. 1994. In: Cytokinins: Chemistry, activity and function. D. Mok et al. (Eds),
CRC Press, Inc., Boca Raton, FL. pp. 167-178.
10. Kulaeva, O.N., Kusnetsov, V.V. 2002. Russ. J. Plant Physiol. 49, 626-940.
472
Effects of Soil Organic Matter Conformation and Substrates Addition on the Fate of Xenobiotics in Soils
Anastasia Shchegolikhina1, Britta Stumpe1, Bernd Marschner1 1Ruhr-Universität Bochum, Universitätsstr. 150, 44780 Bochum, Germany,
Keywords: soil organic matter, sorption, bound residues
1. INTRODUCTION
Organic chemicals that are introduced into soils by human activities may persist, be
translocated or are subject to complete mineralization or partial degradation in the
pedosphere. For many chemicals, the parent compounds or their metabolites form
nonextractable residues, mainly through interactions with the native soil organic matter
(SOM). At present, there is only limited knowledge about the formation and binding
mechanisms of these residues which in turn complicates their risk assessment.
There is evidence that the structural conformation of SOM is altered by cations at the
exchange sites and that this affects sorption and desorption kinetics of xenobiotics and
thus influences the formation of bound residues (1). The addition of substrates can
enhance the biodegradation of xenobiotics, either through co-metabolism or through
enhanced degradation of the sorbent (2). In an extensive preliminary study about the fate
of polychlorinated biphenyls (PCBs) and PAHs in soils from sewage treatment farms,
numerous experiments about the effects of pH, electrolytes and biological activity on the
mobility or solubility on PCB 52 and on benzo(a)pyrene were conducted. The results
showed that low pH and higher Ca-concentrations in the solute reduced the release of the
two compounds from a spiked and aged soil, which was attributed to structural alterations
of SOM (3, 4).
Our research is directed to investigate features of bioaccessibility and
biodegradability of such xenobiotics as 17β-estradiol (E2), nonylphenol (NP) and
phenanthrene (Phe). Especially research is developed to see the effects of SOM structural
conformation on the mineralization and sorption of NP and Phe.
473

2. MATERIALS AND METHODS
Preliminary experiments with the steroid hormone 17β-estradiol (E2) were carried out
with topsoil samples from various agricultural and forest sites. The soils were amended in
the laboratory with different compounds to test their effects on E2 mineralization.
For the main experiments with altered soils the material with high organic content
(peat soils and topsoil from agricultural fields) are used. Clay-rich soils were excluded to
minimize alterations of the physical soil properties throughout chemical conformation of
SOM. The structural modification of SOM was altered by changing the cation composition
and by removing or adding specific cations from/to the SOM matrix. It was assumed that
strongly hydrated monovalent cations (i.e. Na+) cause SOM to expand and thus make it
more accessible to xenobiotics. Polyvalent cations (i.e. Ca2+ or Al3+) reduce the volume
and flexibility of SOM through cation bridging, which can thus limit diffusion of xenobiotics
into the matrix and back out again. Therefore, soil treatment was conducted to optimize
the methodology with respect to minimizing SOM losses and achieving homogeneous
cation saturation. The effects of sample treatment on SOM conformation are analyzed with
differential scanning calorimetry by determining the glass-transition temperature (5).
Sterilized samples were used to perform short-term sorption studies in sterile batch
assays. For investigation of bioaccessibility and biodegradability of 14C-labelled
xenobiotics the degradation experiment was carried out in Respicond-apparatus (Nordren
Innovations) during 4 weeks.
3. RESULTS AND DISCUSSION
In most soils, the mineralization of E2 was in the range of 5-15 % within 4 weeks.
Only in one acidic forest soil with high SOC content, E2 mineralization reached almost
50% although sorption was highest in this soil. Generally, no relationship between Kd and
E2 mineralization was found for the 14 soils investigated, indicating that sorption was not
the limiting factor for E2 degradation. The addition of glucose stimulated microbial activity
in all soils and also the mineralization of E2 (Fig. 1), thus indicating co-metabolic
degradation of E2. Again, the forest soil was an exception, because here, glucose
decreased E2 mineralization despite its strong stimulatory effect on soil respiration. This
shows that the E2 degraders in this soil are not operating co-metabolically and are out-
competed by other microorganisms when easily degradable substrates become available.
474
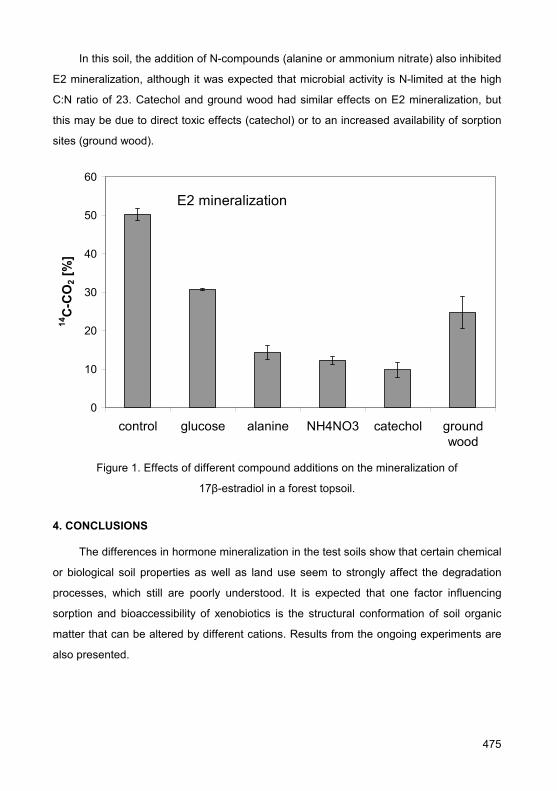
In this soil, the addition of N-compounds (alanine or ammonium nitrate) also inhibited
E2 mineralization, although it was expected that microbial activity is N-limited at the high
C:N ratio of 23. Catechol and ground wood had similar effects on E2 mineralization, but
this may be due to direct toxic effects (catechol) or to an increased availability of sorption
sites (ground wood).
E2 mineralization
0
10
20
30
40
50
60
control glucose alanine NH4NO3 catechol groundwood
14C
-CO
2 [%
]
Figure 1. Effects of different compound additions on the mineralization of
17β-estradiol in a forest topsoil.
4. CONCLUSIONS
The differences in hormone mineralization in the test soils show that certain chemical
or biological soil properties as well as land use seem to strongly affect the degradation
processes, which still are poorly understood. It is expected that one factor influencing
sorption and bioaccessibility of xenobiotics is the structural conformation of soil organic
matter that can be altered by different cations. Results from the ongoing experiments are
also presented.
475

ACKNOWLEDGEMENTS
This work is supported by the German Ministry of Education and Research (BMBF)
and by the German Research Foundation (DFG) as part of the program “Biogeochemical
Interfaces in Soil”.
REFERENCES
1. Clapp, C.E., Hayes, M.H.B. and Mingelgrin, U., 2001. Measurements of sorption –desorption
and isotherm analyses. In: Humic Substances and Chemical Contaminants, C.E. Clapp,
M.H.B. Hayes, N. Senesi, P. Bloom and P.M. Jardine (Editors), Soil Science Society of
America, Madison, pp. 205-240.
2. Chen, S.H. and Aitken, M.D., 1999. Environmental Science & Technology, 33(3), 435-439.
3. Marschner, B., 1998. Physical Chemistry Earth, 23, 199-203.
4. Marschner, B., Baschien, C., Sarnes, M. and Döring, U., 1999. Effects of pH, electrolytes and
microbial activity on the mobilization of PCB and PAH in a former sewage farm soil. In: Effects
of Mineral-Organic-Microorganism Interactions on Soil and Freshwater Environments, E.
Berthelin, W. Huang and J.C. Bollag (Editors), Kluwer/Plenum, New York, pp. 227-236.
5. Hurass J., Schaumann G.E. 2006. Geoderma, 132(1-2), 222-239.
476

The Influence of Humic Acids on the Phototransformation of Organic Chemical Contaminants in Water
Irina Sokolova1, Olga Tchaikovskaya1, Georgi Mayer1, Natalia Yudina2
1Tomsk State University, Siberian Physical Technical Institute, Novosobornaya Sq. 1, 654050
Tomsk, Russia, [email protected] 2Institute of Petroleum, Chemistry Siberian Branch of Russian Academy of Science,
Akademicheski Avenue 3, 634055 Tomsk, Russia
Keywords: humic acids, ecotoxicants, phototransformation, water
1. INTRODUCTION
Aqueous photochemistry has recently received considerable attention because of the
growing interest in processes involving photochemical transformations of organic
pollutants in the natural environment. All natural waters contain dissolved humic
substances. Humic substances representing the main fraction of organic matter receive
increased attention because of their reactivity as light absorbers (1). Depending on their
origin, humic substances have a remarkable ability to absorb light and transfer this energy
to other substrates and in some cases strongly affect photolysis of xenobiotics. In water
and in soils humic substances have been found to act as photosensitisers and they have
also been reported to produce oxygen species upon irradiation, and be able to
photoinduce the transformation of ecotoxicants. They could behave as quenchers or as
photostabilizers. Humic acids (HAs), being the major component of peats of different
structure, render unequal influence on natural ecosystems of biospheres. Excited singlet
and triplet states of dissolved HAs are important players for the transformation of organic
chemical contaminants in sunlit natural waters (2). Photochemical processes also play an
essential role in engineering water treatment systems which use UV light for water
purification and disinfection (3). In addition to direct phototransformations, which occur
after absorption of light by a given chemical compound, a variety of processes take place
as a result of absorption of light by natural water components, leading to the formation of
transient species, which may react with this compound. This paper describes
investigations into the photolysis of 2-methylphenol (2-MP) and 4-methylphenol (4-MP)
mixture in distilled water and in water in the presence (HAs).
477
2. MATERIALS AND METHODS
Fractions of HAs were prepared from peat of Tomsk region (Klyukvennoe, Russia) as
described elsewhere (4). The HAs pretreatment was made: HA-1 – from crushed peat;
HA-2 – from mechanoactivated peat (5); HA-3 - from mechanoactivated peat with addition
of fermented celloveridin (0.5%); HA-4 - from mechanoactivated peat with addition of
NaOH (3%). The 2-MP and 4-MP mixture concentration («Aldrich») was 1⋅10-4 mol/L. The
aqueous MP solutions were irradiated with UV light in the presence and absence of HAs.
As sources for photochemical investigations we used: 1) commercial mercury lamp high
pressure OKN-11M; 2) exciplex U-type–barrier lamp on KrCl* working molecules with the
parameters λrad ~ 222 nm, Δλ = 5–10 nm, Wmax = 18 MW/cm2, f = 200 kHz, and 1-μs pulse
duration; 3) exciplex U-type–barrier lamp on XeBr* working molecules with the parameters
λrad ~ 283 nm, Δλ = 5–10 nm, Wmax = 18 MW/cm2, f = 200 kHz, and 1-μs pulse duration; 4)
exciplex U-type–barrier lamp on XeCl* working molecules with the parameters λrad ~ 308
nm, Δλ = 5–10 nm, Wmax = 18 MW/cm2, f = 200 kHz, and 1-μs pulse duration (3). The
irradiation time was varied from 1 min to 32 min. To prevent the solution from heating
during the irradiation and to provide for stable operation of the lamp, the installation was
air-cooled using a fan. The solutions were placed in a quartz cuvette (optical length =1
cm). Pre- and post-irradiation absorption and fluorescence spectra were recorded by a
conventional procedure using a Specord M40 spectrophotometer and a CM2203
spectrofluorimeter, at 25 ± 1 °C in air equilibrated solutions.
3. RESULTS AND DISCUSSION
Photodegradation of MP mixture in aqueous solution in the absence of HAs has been
carried out by UV-irradiation from different sources (Figure 1,a). After treatment of 222 nm
excilamp irradiation the MP mixture was completely photodegraded. The transformation
from the highest electronic excited states is the most probable route of MP decomposition
by irradiation by 222 nm. With the increase in the energy of the photoexciting quantum, the
probability of the population of the photodissociative triplet state increases and OH bond
rupture in the MP molecule may occur (6). The worst MP degradation was observed under
exposure to XeCl* excilamp.
Due to the complex nature of HAs, the absorption spectra of the HA solution shows a
continuous absorption without typical peaks, and absorbance increases with the
decreasing wavelength. The fluorescence of the HA solution is around 450-480 nm. The
HAs pretreatment has an influence on the phototransformation of methylphenols. The
478
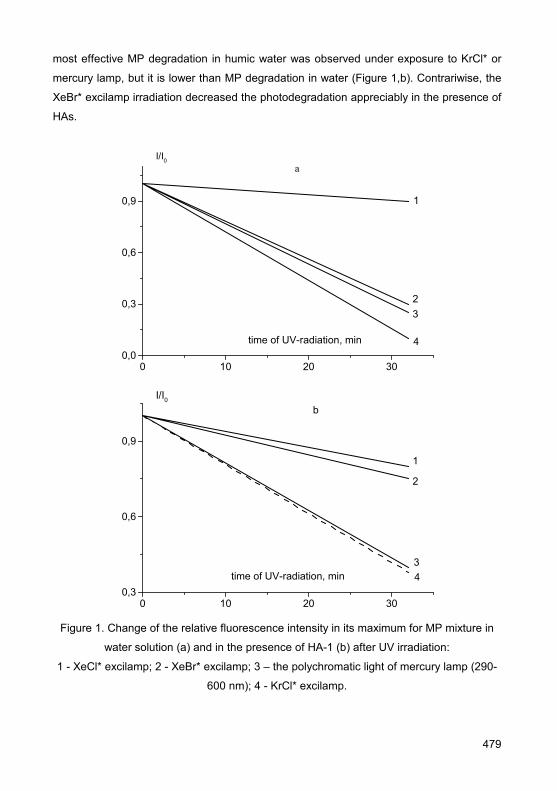
most effective MP degradation in humic water was observed under exposure to KrCl* or
mercury lamp, but it is lower than MP degradation in water (Figure 1,b). Contrariwise, the
XeBr* excilamp irradiation decreased the photodegradation appreciably in the presence of
HAs.
0 10 20 300,0
0,3
0,6
0,9
I/I0a
4
32
1
time of UV-radiation, min
0 10 20 300,3
0,6
0,9
I/I0b
43
2
1
time of UV-radiation, min
Figure 1. Change of the relative fluorescence intensity in its maximum for MP mixture in
water solution (a) and in the presence of HA-1 (b) after UV irradiation:
1 - XeCl* excilamp; 2 - XeBr* excilamp; 3 – the polychromatic light of mercury lamp (290-
600 nm); 4 - KrCl* excilamp.
479

Our experiments show that different samples of HAs lead to the appearance of
various photoproducts. In the case of HA-2 and HA-4 presence were detected the
products with the fluorescent spectra at 365 and 410 nm.
Table 1. The fluorescence characteristics of the aqueous MP mixture in the presence of
HAs after irradiation
Humic acids
– HA-1 HA-2 HA-3 HA-4 UV irradiation
Fluorescence maximum of photoproducts (nm)
KrCl 325 325, 410 325 410
Hg 350, 410
325 410 320 365, 410
XeBr 410 325 410 320 410
XeCl 365, 410 – 410 325 410
4. CONCLUSIONS
Humic acid did not increase the efficiency of MP photolysis contrary to earlier data for
phenol at 222 nm irradiation. The results of our work have shown that HAs have
photostabilizing properties with respect to methylphenols almost at all investigated
excitation wavelengths.
ACKNOWLEDGEMENTS
The work was supported by the Russian Basic Research Foundation (Projects № 05-
07-98002-r_ob’_v, № 06-08-01380).
REFERENCES
1. Werner, J.J., McNeill, K., Arnold, W.A. 2005. Chemosphere, 58, 1339-1346.
2. Canonica, S., Hellrung, B., Mueller, P., Wirz, J. 2006. Environ. Sci. Technol. 40, 6636-6641.
3. Sosnin, E., Oppenlaender, T., Tarasenko, V.F. 2006. J. Photochem. Photobiol. C 7, 145-163.
4. Tchaikovskaya, O.N., Sokolova, I. V., Udina N.V. 2005. Luminescence. 20, 187-191.
5. Lomovskii, O.I., Ivanov, A.A., Rozhanskaya, O.A., Yudina, N. V., Korolev, K.G. 2004.
Chemistry for Sustainable Development. 12, 355-361, [in Russian].
6. Bazyl’, O., Artyukhov, V., Mayer, G., Sokolova, I. 2001. High Energy Chemistry, 35, 33-38.
480
Potentiometric and IR Quantification of Metal Binding in Humic Substances
Bruno Szpoganicz1, Marcos Rivail da Silva2, Veronika Koslova3, Bruna P. Szpoganicz2,
Mariane Martini1, Thiago G. Costa1 1Federal University of St. Catarina, 88040-900 Florianópolis, SC, Brazil, [email protected] 2Regional University of Blumenau, 89010-971 Blumenau, SC, Brazil 3Instituto Politécnico de Castelo Branco, 6001-909 Castelo Branco, Portugal
Keywords: humic acids, potentiometric titration, metal complexation, IR
1. INTRODUCTION
HAs are a complex mixture of different compounds, with different sizes and molar
masses and several functional groups. The major groups are: carboxyl, phenol, catechol,
phthalic and salicylic. Knowledge of the amount of each group present in this mixture is
important in order to understand the interaction of humic substances (HS) with metal ions
in the environment (1, 2, 3). Different models and methods have been employed to
calculate HA metal ion complexation. In this study, the interactions of Cu(II) and Zn(II)
were characterized by potentiometric titration and IR spectroscopy.
2. MATERIALS AND METHODS
The potentiometric titration of HA (from Aldrich) in the absence and presence of
copper(II) and zinc(II) were carried out with a Corning pH/ion analyzer 350 fitted with blue-
glass and Ag-AgCl reference electrodes. The potentiometric apparatus was calibrated with
standard HCl and KOH solutions to read −log [H+] directly, and the pKw for water at
μ = 0.100 M was 13.78. Samples of around 0.100 g of HA were diluted with 40 ml of
bidistilled water (KMnO4) in a sealed thermostated vessel at 25.0oC. Computations of the
triplicate experiments were all carried out with the BEST7 program (4), and the species
diagrams were obtained with the aid of SPECIES program.
Infrared spectra of the HA fractions were recorded using samples in KBr pellets (1
mg of Aldrich HA per 100 mg of KBr) with a SHIMADZU Resolution 1.04 FT-IR
spectrometer. The KBr (FT-IR grade, Aldrich Co.) was dried by heating and was kept
under vacuum in desiccators prior to use.
3. RESULTS AND DISCUSSION
The distribution curves of the binding sites of the Zn(II)-HA system are shown in
Figure 1.
481
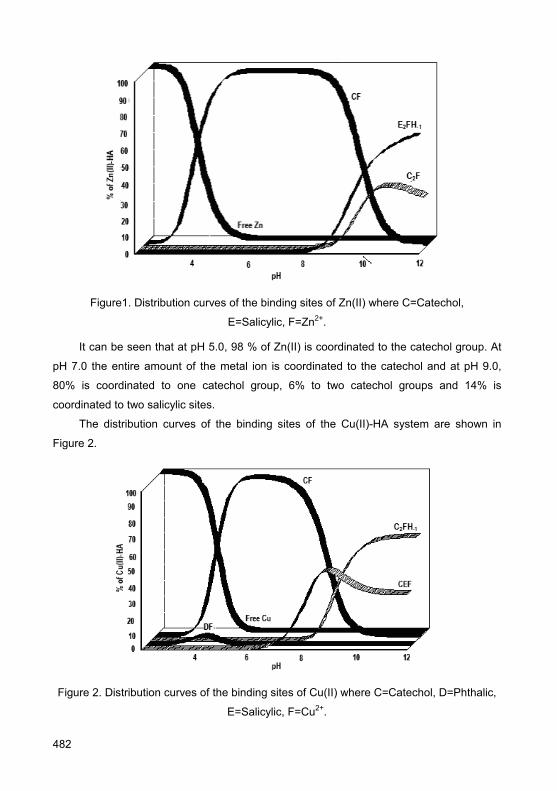
Figure1. Distribution curves of the binding sites of Zn(II) where C=Catechol,
E=Salicylic, F=Zn2+.
It can be seen that at pH 5.0, 98 % of Zn(II) is coordinated to the catechol group. At
pH 7.0 the entire amount of the metal ion is coordinated to the catechol and at pH 9.0,
80% is coordinated to one catechol group, 6% to two catechol groups and 14% is
coordinated to two salicylic sites.
The distribution curves of the binding sites of the Cu(II)-HA system are shown in
Figure 2.
Figure 2. Distribution curves of the binding sites of Cu(II) where C=Catechol, D=Phthalic,
E=Salicylic, F=Cu2+.
482

a)
HA
b)
HA-Zn(II)
pH=5.0
c)
HA-Zn(II)
pH=7.0
d)
HA-Zn(II)
pH=9.0
Figure 3. IR spectra of HA-Zn(II) system.
483

It can be seen that at pH 5.0, 48% of copper(II) is coordinated to the catechol site,
and at pH 7, all of the copper is bound to the catechol group. This situation changes at pH
9.0, where the metal ion is 81% bound to the catechol site, and 19% is bound to the
salicylic site.
The IR studies show the complexation of the metal ions. On the IR spectrum of HA
(Figure 3 for HA-Zn(II) system, not shown for HA-Cu(II) system) a broad peak can be
seen at 3400 cm-1 due to the axial stretching of the carboxylic and catechol O-H groups.
The peaks between 2915 cm-1 and 2851 cm-1 are due to the CH2CH3 stretching, and at
1680 cm-1 there is a peak due to the stretching of deprotonated C=O. The evidence of
metal complexation can be seen by the increase in the intensity of the peaks at 1680 cm-1,
attributed to asymmetric stretching of the COO- group (spectra b, c and d) and the broad
peak lower than 800 cm-1, due to C-O bonded to the metal ion. Also, at acid pH it can be
seen that the peak at 1394 cm-1 is narrow due to the interaction with the metal ion and
catechol group. At neutral pH it can be observed that there is complexation of the metal
ion with the catechol, due to the increasing intensity of the peak at 1680 cm-1. At alkaline
pH values, the tuning of the peaks between 1680 cm-1 and 1394 cm-1 is attributed to the
complexation of other oxygenated groups with the metal, as shown in the binding site
distribution curves of HA-Zn(II) and HA-Cu(II) systems.
This study shows the binding sites where copper(II) and zinc(II) are coordinated to
HA. The sites are characterized by potentiometric titration and IR spectroscopy. Copper
and zinc show some similarities and some differences in the interactions with HA.
The major interaction for both metal ions at acidic and neutral pH values is at the
catechol site, and at basic pH values, the metals interact with the catechol and salicylic
sites.
ACKNOWLEDGEMENTS
The authors thanks CNPq and CAPES.
REFERENCES
1. Schnitzer, M; Skinner, S.I. 1968. Soil Science, 105, 392-6.
2. Nifantéva, T.I.;Shkinev, V.M.; Spivakov, B.Y.; Burba, P. I999. Talanta 48, 257-267.
3. Prado, A.G.S.; Torres, J.D.; Martins, P.C.; Pertusatti, J.; Bolzon, L.B.; Faria, E.A. 2006.
Journal of Hazardous Materials 136(3), 585-588.
4. Martell, A.E.; Motekaitis, R. J. 1992, in: The Determination and Use of Stability Constants, 2nd
ed., VCH Publishers, Inc., New York, N.Y.
484

A Rapid Batch Procedure for Assessment of Humic Substances and Biodegradable Components of Organic Matter in Natural and Contaminated Materials
André van Zomeren1, Hans A. van der Sloot1, Rob N.J. Comans1 1Energy research centre of the Netherlands, P.O. box 1, 1755 ZG Petten, The Netherlands,
Keywords: humic acid, fulvic acid, biodegradation
1. INTRODUCTION
Organic matter in sludge, contaminated soil and waste can lead to instability in
landfilling due to gas formation and settling. As a result of biodegradation, dissolved
organic matter (DOC) is generated. Depending on the nature of the organic matter, DOC
can possibly mobilise heavy metals and organic micro pollutants (e.g. PAHs and PCBs). In
the EU landfill directive (1), demanding targets have been set to reduce the amount of
biodegradable organic matter on landfills. In addition, treatment techniques for organic
materials (e.g. compost, sludge, source separated organic residues) require methods to
assess the degree of organic matter degradation to judge treatment acceptability (2, 3).
Numerous test methods have been developed to test the degradability of organic
matter in waste materials (3). Biological methods are promising to assess biodegradability
of organic matter. However, these methods can be time consuming and are possibly
affected by the presence of toxic contaminants, leading to underestimation of organic
matter degradability (3). In addition, these methods are not suitable for estimation of the
organic carbon fraction that is responsible for facilitated transport of metals and organic
micro-pollutants from natural and contaminated materials. Particularly, relatively stable
humic substances as humic (HA) and fulvic (FA) acids in the organic matter fraction can
significantly enhance the solubility of these contaminants (4).
We have developed a new rapid batch method to measure the concentrations of HA,
FA and the more hydrophilic organic acids (Hy) in both solid and aqueous samples (5).
The method can be performed within 1.5-4 hours per sample.
Since HA and FA are only very slowly biodegradable (mean residence times can vary
from hundreds to thousands of years), the Hy part of organic carbon can be regarded as
the more biodegradable fraction. The new batch method for estimation of HA, FA and Hy
concentrations in solid and aquatic samples may therefore contribute to the development
of biodegradability assessment in the field of landfilling and for organic matter treatment
485
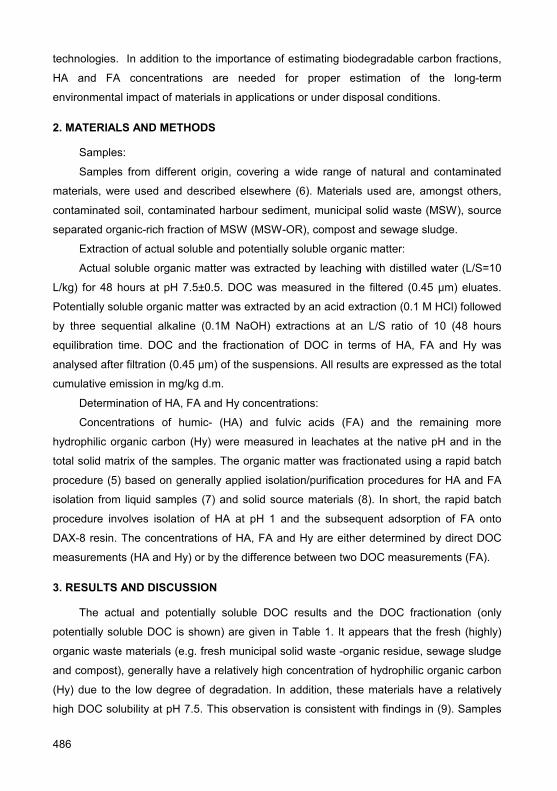
technologies. In addition to the importance of estimating biodegradable carbon fractions,
HA and FA concentrations are needed for proper estimation of the long-term
environmental impact of materials in applications or under disposal conditions.
2. MATERIALS AND METHODS
Samples:
Samples from different origin, covering a wide range of natural and contaminated
materials, were used and described elsewhere (6). Materials used are, amongst others,
contaminated soil, contaminated harbour sediment, municipal solid waste (MSW), source
separated organic-rich fraction of MSW (MSW-OR), compost and sewage sludge.
Extraction of actual soluble and potentially soluble organic matter:
Actual soluble organic matter was extracted by leaching with distilled water (L/S=10
L/kg) for 48 hours at pH 7.5±0.5. DOC was measured in the filtered (0.45 μm) eluates.
Potentially soluble organic matter was extracted by an acid extraction (0.1 M HCl) followed
by three sequential alkaline (0.1M NaOH) extractions at an L/S ratio of 10 (48 hours
equilibration time. DOC and the fractionation of DOC in terms of HA, FA and Hy was
analysed after filtration (0.45 μm) of the suspensions. All results are expressed as the total
cumulative emission in mg/kg d.m.
Determination of HA, FA and Hy concentrations:
Concentrations of humic- (HA) and fulvic acids (FA) and the remaining more
hydrophilic organic carbon (Hy) were measured in leachates at the native pH and in the
total solid matrix of the samples. The organic matter was fractionated using a rapid batch
procedure (5) based on generally applied isolation/purification procedures for HA and FA
isolation from liquid samples (7) and solid source materials (8). In short, the rapid batch
procedure involves isolation of HA at pH 1 and the subsequent adsorption of FA onto
DAX-8 resin. The concentrations of HA, FA and Hy are either determined by direct DOC
measurements (HA and Hy) or by the difference between two DOC measurements (FA).
3. RESULTS AND DISCUSSION
The actual and potentially soluble DOC results and the DOC fractionation (only
potentially soluble DOC is shown) are given in Table 1. It appears that the fresh (highly)
organic waste materials (e.g. fresh municipal solid waste -organic residue, sewage sludge
and compost), generally have a relatively high concentration of hydrophilic organic carbon
(Hy) due to the low degree of degradation. In addition, these materials have a relatively
high DOC solubility at pH 7.5. This observation is consistent with findings in (9). Samples
486

with a higher relative contribution of degraded organic matter (e.g. harbour sludge, soil
samples and sieve sand) show a relatively low Hy contribution to the DOC concentration.
We believe that this method forms a promising tool towards an improved understanding of
organic matter stability in landfill scenarios. More examples and applications of the
procedure will be shown in the presentation.
Table 1. Actual (pH 7.5) and potentially soluble DOC (g C/kg d.m.), fractionation in terms
of humic and fulvic acids and hydrophilic organic carbon (potentially soluble DOC) and the
percentage leached at pH 7.5 relative to the potentially soluble DOC for several soil and
waste materials (6)
Sample HApot. FApot. Hypot. DOCpot. DOCpH 7.5 %pH7.5
Sewage sludge (SEW) 105 28 44 177 35 20
Fresh MSW-OR 2 22 13 26 62 20 33
Fresh MSW-OR 18 18 20 57 26 46
Compost (CW5) 68 6 7 81 7 9
Degraded MSW-OR 15 6 6 27 3 11
predominantly inorganic waste 15 5 5 26 1 3
untreated landfilled MSW 7 3 4 15 3 19
Degraded landfilled MSW 10 4 3 17 1 4
Soil (SO24) 8 3 3 13 0.4 3
Harbour sludge Malburg 10 2 2 14 0.4 3
Sieve sand 0.1 1 1 2 0.3 14
MSWI bottom ash 0.0 0.2 1 1 0.4 55
Soil (BG) 1 1 0.3 2 0.3 13
Tar containing asphaltgranulate 0.0 0.5 0.0 1 0.1 20
4. CONCLUSIONS
The rapid batch method for HA, FA and Hy measurements significantly enhances the
possibilities to include DOC fractionation in biodegradation studies. The results indicate
the degradation stage of the samples and the ability of DOC (in terms of HA and FA) to
bind contaminants (facilitated leaching/transport). The hydrophilic organic carbon fraction
seems to represent the biodegradable part of DOC, although FA seems to be
biodegradable to a certain extent in our samples. The extraction procedures for actual and
487

potentially soluble organic matter and the batch method for quantification of humic
substances are currently proposed for international standardization. Ongoing work
focusses on linkage between organic matter fractionation and gas formation to gain more
insight in changes in the organic matter species and properties during biodegradation.
REFERENCES
1. Council Directive 1999/31/EC of 26 April 1999 on the landfill of waste, Official Journal of the
European Communities.
2. Adani, F., Genevini, P. L., Tambone, F. 1995. Compost Sci. & Util. 3, 25-37.
3. Zach, A., Widerin, M., Binner, E., Lechner, P. 1998. In: Auswahl und Anwendbarkeit von
Parametern zur Charakterisierung der Endprodukte aus mechanisch-biologischen
Restmüllbehandlungsverfahren. Schriftenreihe "Abfallwirtschaft", Band 9/1998; Eigenverlag
des Bundesministeriums für Umwelt, Jugend & Familie, Sektion III: Wien.
4. Milne, C. J., Kinniburgh, D. G., van Riemsdijk, W. H., Tipping, E. 2003. Environ. Sci. Technol.
37, 958-971.
5. van Zomeren, A., Comans, R. N. J. 2007. Environ. Sci. Technol. 41, 6755-6761.
6. Comans, R. N. J., Steketee, J. J., van Zomeren, A., and Zuiver, E. 2004. Bepalingsmethoden
voor reaktieve en inerte vormen van koolstof in grond, bouw- en afvalstoffen (ANVM project
247). ECN-C--03-127.
7. Thurman, E. M., Malcolm, R. L. 1981. Environ. Sci. Technol. 15, 463-466.
8. Swift, R. S. Organic matter characterization. 1996. In: Methods of soil analysis. Part 3.
Chemical methods. Sparks, D. L., (Ed.), Soil Science Society of America: Madison, WI, pp.
1011-1069.
9. van der Sloot, H. A., Rietra, R. P. J. J., Vroon, R., Scharff, H., and Woelders, J. A. 2001. In:
Similarities in the long term leaching behaviour of predominantly inorganic waste, MSWI
bottom ash, degraded MSW and bioreactor residues, Christensen, T. H., Cossu, R., and
Stegmann, R. (Eds.), CISA - Environmental Sanitary Engineering Centre, S. Margherita di
Pula, Cagliari, Italy. pp. 199-208.
488

Natural Organic Matter in Some Tributaries of the Dnieper River and their Effect on Phytoplankton Growth
Tetiana Vasylchuk, Peter Klochenko Institute of Hydrobiology of National Academy of Sciences of Ukraine, Geroiv Stalingrada ave 12,
04210 Kyiv, Ukraine, [email protected]
Keywords: humic, fulvic, proteins, carbohydrates, river, phytoplancton
1. INTRODUCTION
Relationship between dynamics of the content of organic matter and the peculiarities
of development of hydrobionts is of considerable importance in the process of formation of
water quality in environment. Planktonic algae are involved in the process of formation of
the composition and quantitative indices of dissolved organic matter (DOM). In its turn,
organic matter depending on its chemical nature may serve as a source of organic
compounds of nitrogen and phosphorus, and also as a potential reserve of various
nutrients essential to the vital activity of hydrobionts [1, 2].
The main objective of the present work was to assess the composition and seasonal
dynamics of DOM in some tributaries of the Dnieper depending on the peculiarities of
development of planktonic algae.
2. MATERIALS AND METHODS
The samples of water from the Pripyat, Zdvizh and Irpen rivers were taken twice a
month in 1998-1999, from another river in May, August, 2001, 2003, 2006. Suspended
organic matter was separated from DOM by means of filtration through membranous filters
with 0.40 µm sieve. The chemical nature of DOM was studied by the method of ion-
exchange chromatography. Diethylaminoethylcellulose (DEAE-cellulose) was used for
isolating DOM of the acid nature (humic substances) (HS) whereas
carboxymethylcellulose (CM-cellulose) was used for isolating DOM of the alkaline nature
(protein-like substances). The neutral group of DOM (carbohydrates) was concentrated by
means of freezing. The molecular-weight distribution of the isolated groups of substances
was investigated by the method of gel-penetrating chromatography using the G-25 and G-
50 neutral Sephadexes. The content of humic and fulvic acids (HA and FA) was assessed
by the method of spectrophotometry in terms of their own coloration with λ=400 nm in the
concentrated samples. The numerical abundance of algal cells was determined by the
489

sedimentation method by means of a direct microscopic count in a Najotte chamber.
Biomass was calculated by the count cell-volume method.
3. RESULTS AND DISCUSSION
The surface runoff, water balance, and intra-waterbody processes are of
considerable importance in the process of formation of organic matter. These factors are
also responsible for dynamics of its content and composition. The obtained data suggest
that HS prevailed amond DOM in the studied rivers (Table 1). In the Pripyat, Lva, Stvyga,
Ubort rivers the HS concentration were assentially higher, than that observed in other
rivers studied. The content of HS in the rivers with its high concentration consists 90–97%
in total DOM.
Table 1. Changes of Corg and humic substances content in the rivers water
during 1998–2006
River C org,
mgC L-1 HA,
mg L-1 FA,
mg L-1
Pripyat 14.36 –29.31 0.98 – 6.31 25.75 –51.61
Styr 8.13 – 30.41 0.29 – 4.22 11.97– 54.61
Goryn 6.21 – 8.01 0.47 – 1.11 9.74 – 12.91
Lva 23.69 – 43.05 1.92 – 6.98 40.77 – 76.90
Stvyga 29.50 – 37.40 2.54 – 5.47 54.09 – 65.55
Ubort 28.43 – 68.70 2.08 – 9.54 50.35 – 124.03
Slovechna 14.38 – 16.83 0.53 – 1.02 22.85 – 29.68
Nobel 13.42 – 17.33 1.02 – 2.49 22.81 – 28.20
Desna 9.63 – 10.54 0.48 – 0.65 14.15 – 17.30
Zdvizh 5.31 – 8.43 0.24 – 0.52 6.07 –13.91
Irpen 4.22 –7.92 0.15 – 0.41 4.73 – 10.51
The obtained data suggest that FA with the molecular weight > 1.0 kDa prevail
mainly in the Pripyat river. In spring their relative amount in the Pripyat river accounted for
72.2%, in the Zdvizh river it was 30.4%, whereas in the Irpen river it accounted for 17.8%.
It has been known that in spring the composition of DOM is formed mainly at the expense
of DOM contained in the surface runoff. These HA are characterized by a high molecular
weight. A relative amount of high-molecular FA in the Pripyat river gradually decreased
from spring until winter. In this case, it was rather high throughout the year. In autumn in
the Zdvizh and Irpen rivers, this index increased up to 40% (Figure 1).
490
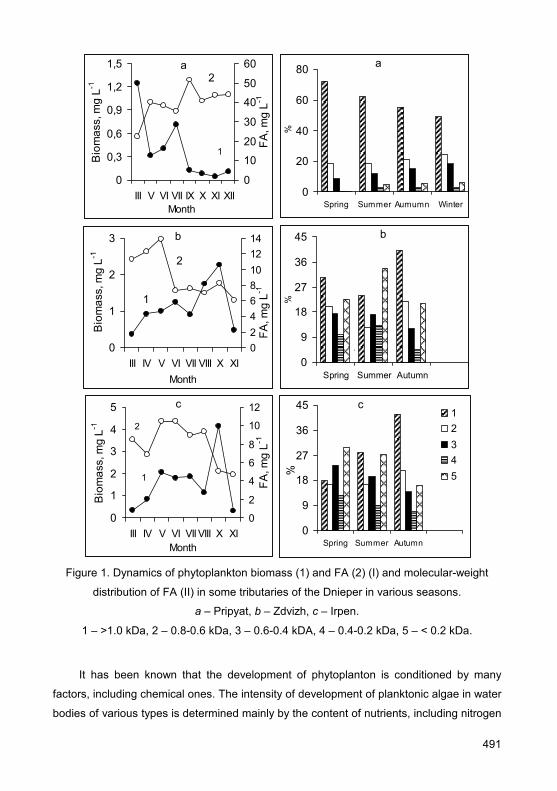
0
20
40
60
80
Spring Summer Aumumn Winter
%
а
0
9
18
27
36
45
Spring Summer Autumn
%
4
b
0
9
18
27
36
45
Spring Summer Autumn
%
12345
c
0
0,3
0,6
0,9
1,2
1,5
III V VI VII IX X XI XIIMonth
Bio
mas
s, m
g L-1
0
10
20
30
40
50
60
FA, m
g L-1
1
2a
0
1
2
3
III IV V VI VII VIII X XIМonth
Bio
mas
s, m
g L-1
02468101214
FA, m
g L-1
1
2
b
0
1
2
3
4
5
III IV V VI VIIVIII X XIМonth
Bio
mas
s, m
g L-1
0
2
4
6
8
10
12
FA, m
g L-1
c
1
2
Figure 1. Dynamics of phytoplankton biomass (1) and FA (2) (I) and molecular-weight
distribution of FA (II) in some tributaries of the Dnieper in various seasons.
a – Pripyat, b – Zdvizh, c – Irpen.
1 – >1.0 kDa, 2 – 0.8-0.6 kDa, 3 – 0.6-0.4 kDA, 4 – 0.4-0.2 kDa, 5 – < 0.2 kDa.
It has been known that the development of phytoplanton is conditioned by many
factors, including chemical ones. The intensity of development of planktonic algae in water
bodies of various types is determined mainly by the content of nutrients, including nitrogen
491
and phosphorus. At the same time, HS are also of considerable importance in the
formation of the hydrobiological regime of many water bodies. It is thought, that inhibition
of the development of phytoplankton registered at a high concentration of HS conditioned
by binding nutrients into the complexes.
The obtained data suggest that in the Pripyat river the biomass of phytoplankton
inversely depended on the content of FA (r = -0.91). The same is true of the species
diversity of phytoplankton. The number of algal species decreased with increasing the
content of FA (r = -0.75). The biomass and species diversity of individual groups of
planktonic algae occurring in the Pripyat river also inversely depended on the content of
FA. Thus, the biomass of Bacillariophyta (r = -0.91) and their species diversity (r = -0.88)
inversely depended on the FA concentration. Cyanophyta were observed in this river only
at a low FA concentration.
In other studied rivers characterized by a lower content of HS,the biomass of
phytoplancton was higher. It has been found that in the Zdvizh river the biomass of
phytoplancton inversely depended on the FA content (r= -0.25). In particular, the biomass
of Cyanophyta (r= -0.45) and their species diversity (r= -0.74) inversely depended on the
FA content.
4. CONCLUSIONS
The obtained data suggest that in the studied rivers HS, primarily FA, are among the
main components of DOM. Their content varied from season to season and depended on
the peculiarities of the catchment area. The highest concentration of FA (up to 124 mg L-1)
was observed in the Pripyat, Stvyga, Ubort river in spring. In the Goryn, Slovechna,
Desna, Zdvizh and Irpen rivers, the maximum content of these acids was essentially lower
(10.51 –17,30 mg L-1). In the Pripyat river, a relative content of FA with the molecular
weight > 1.0 kDa accounted for 48.9–72.2%. In the Zdvizh river, it was 24.0–40.3%,
whereas in the Irpen river it accounted for 17.8–41.7%. The concentration of FA in the
studied rivers inversely depended on the biomass of phytoplankton.
REFERENCES
1. Vigneault, B., Percot, A., Lafleur, M., Campbell, P.G.G. 2000. Environ. Sci. Technol. 34, 3907–
3913.
2. Danilov, R., Ekelung, N.G.A. 2001. Hydrobiologia. 444, 203–212.
492

The Influence of Apparent Molecular Size of Aquatic Humic Substances during Coagulation with Ferric Chloride
Eliane Sloboda1, Angela Di Bernardo Dantas2, Luiz Di Bernardo2, Eny Maria Vieira1 1Instituto de Química de São Carlos, Universidade de São Paulo, São Carlos-SP, Brazil,
[email protected] 2Escola de Engenharia de São Carlos, Universidade de São Paulo, São Carlos-SP, Brazil
Keywords: aquatic humic substances, ferric chloride, coagulation, removal color
1. INTRODUCTION
Water sources that are used to supply the public frequently present high levels of
true color due to the presence of aquatic humic substances, which contribute from 50 to
70% of dissolved carbon in such waters (1). The presence of aquatic humic substances in
many water treatment plants can cause problems in the coagulation process.
Functionally, humic substances predominantly contain phenolic and carboxylic
groups, but also contain alcohol, amine and ketone groups (2). Approximately 80-90% of
the humic substances found in natural waters are fulvic acids, while humic acids constitute
the remaining 10-20% (3).
Processes involving coagulation with ferric chloride have been studied for removal of
humic substances in natural waters (4, 5, 6). The mechanism of coagulation with regard to
the removal of aquatic humic substances is by charge neutralization for soluble colloidal
compounds. The removal occurs due to adsorption on to precipitated flocs and metal
hydroxides (7) and accordingly, optimization of the coagulation process occurs under
acidic conditions, pH 4.5–5.5 (8). The aim of this study was to verify the influence of the
apparent molecular size of aquatic humic substances on the effectiveness of coagulation
with ferric chloride.
2. MATERIALS AND METHODS
The water samples were collected from the Itapanhaú river, Bertioga, São Paulo
State, Brazil. The collected samples exhibited true color intensity in the order of 300 Hazen
units. An XAD-8 resin was used to extract the aquatic humic substances. The extracted
humic substances were filtered through a membrane with 0.45 μm pores (Millipore) and
this fraction was denoted as F1. Fraction F1 was then separated by ultrafiltration using
polyethersulfone membranes (Vivalflow50) into 2 apparent molecular size fractions of
humic material: F2 from 100 kDalton to 0.45 μm and F3 from 10 to 30 kDalton. The
493

fractions (F1, F2 and F3) were characterized by elemental analysis (CE instruments EA
1110 CHNS-O, Fisons) and UV/Vis (Hitachi model U3501). Water from an artesian well
was used to prepare 3 experimental samples of the following molecular size fractions of
aquatic humic substances. F1: 0.45 μm (water sample I), F2 from 100 kDalton to 0.45 μm
(water sample II) and F3’: < 30 kDalton (water sample III). Water sample color intensity
was approximately 100 Hazen units, turbidity approximately 5.0 NTU with added kaolinite
and temperature 20 ± 1°C. Solutions of NaOH (0.1M) and HCl (0.1M) were used to adjust
the coagulation pH in the range of 3.4 to 7.0. Jar test equipment (ETICA), using direct
filtration, was used to carry out the tests. The following parameters were adopted for the
tests, rapid mixing time, 30 s; medium velocity, 1000 s-1, filtration time was 20 min. The
coagulant employed was commercial ferric chloride. Color measurements were based on
the procedure recommended by the Standard Methods for the Examination of Water and
Wastewater (9).
3. RESULTS AND DISCUSSION
In general, characterization results (Table 1 and Table 2) indicated that the smaller
molecular-size fraction (F3) had a higher proportion of aliphatic than aromatic carbon
atoms and a relatively high percentage of oxygen atoms bonded to alkyl groups and
carboxylic acids. Conversely, the apparently larger molecules (fractions F1 and F2) showed
a higher content of aromatic groups this suggests an increase in the humification degree.
This indicates that for the aquatic humic substances as a whole, there are a greater
proportion of oxygenated groups and aliphatic carbon atoms.
Table 1. Elemental composition of aquatic humic substances
In atom percentage Molar ratio Fractions
C H N O H/C C/N N/O F1 (<0.45 µm) 37.35 3.34 1.44 57.86 1.07 1.16 30.23
F2 (<0.45 µm - 100 kDalton) 36.01 3.32 1.29 59.38 1.10 1.24 32.57 F3 (10 – 30 kDalton) 37.95 4.34 0.80 56.90 1.37 1.12 55.20
Table 2. Values of absorbance and absorbance ratios
Absorbance (nm) Ratio Absorbance (nm) Ratio Fractions
465 665 E4/E6 250 365 E2/E3 Aromatic character
F1 0.314 0.037 8.40 0.866 0.274 3.16 31.07 F2 0.044 0.007 6.07 0.449 0.146 3.06 31.75 F3 0.331 0.031 10.52 0.680 0.198 3.43 29.24
494

Table 3 presents the best results for the removal of apparent color as a function of
coagulant dosage for each water sample and pH range. The coagulation diagrams
obtained with ferric chloride revealed the effects of the molecular size of the aquatic humic
substances on the coagulation process. Based on the color removal observed in the
coagulation diagram for each water sample, the region where the most efficient removal
was obtained was selected for analysis in this paper: ≤ 5.0 Hazen units.
Table 3. Coagulation pH and dosage of commercial ferric chloride of the regions of
apparent color in filtered water ≤ 5.0 Hazen units and turbidity ≤ 0.5 NTU
Water sample
Apparent color removal and
turbidity Coagulation pH Dosage commercial
ferric chloride (mg L-1) Control
parameters
4.0 – 4.3 30 - 40 Apparent color Region 1
3.9 – 6.0 From 30 to > 80 Turbidity I
Region 2 4.8 – 6.0 From 40 to > 80 Apparent color
< 3.4 – 6.0 From 26 to > 132 Apparent color II Region 1
< 3.4 – 6.2 From 26 to > 132 Turbidity
3.9 – 5.3 From 60 to > 100 Apparent color III Region 1
4.1 – 5.2 From 70 to > 100 Turbidity
It can be seen in Table 3 that for all doses of ferric chloride and pH ranges, the
apparent molecular size had a significant influence on the color removal. The removal
decreased with decreasing apparent molecular size according to: F1>F2> F3’. For fraction
F3’, a greater dose of coagulant was needed to remove the apparent color and, even then,
the amount removed was lower. F3 also presented a higher proportion of fulvic acids,
which exhibit a larger number of negatively-charged groups. These smaller molecules are
formed mainly by small, stable micelles, which remain dispersed due to the repulsion of
the negative charge that originates from the dissociation of the large amount of groups
with an oxygen in their structure (10,11,12). For these reasons, a high dose of coagulant is
necessary to achieve efficient removal of apparent color. Charge neutralization seems to
be the mechanism responsible for the removal of humic substances under the conditions
employed in this study.
495
4. CONCLUSIONS
From the experimental results obtained the following conclusions can be made: i)
Humic substances with different apparent molecular sizes behave differently during
coagulation; ii) The higher the apparent molecular size of the humic substances used to
prepare water samples (true color ~ 100 HU), the more efficient the removal of color; iii).
The characterization results showed that for the fractions of aquatic humic substances
used to prepare the water samples (F3: < 30 kDa), which presented higher proportions of
bonded oxygen groups, resulted in the lowest removal of apparent color.
REFERENCES
1. Aiken, G. R. 1985. Isolation and concentration techniques for aquatic humic substances. In:
Humic substances in soil, sediment and water: Geochemistry, isolation and characterization,
G. R. Aiken et al. (Eds.), John Wiley and Sons, New York, pp. 363–385.
2. Dennett, K. E., Amirtharajah, A., Studstill, A.; Moran,T. F., Gould, J. P. 1995. Humic substance
removal and minimization of trihalomethanes by ferric chloride coagulation. WWARF.
Colorado, USA7 Denver.
3. Amy, G. L., Chadik, P. A., King, P. H. 1985. Org. Geochem. 8, 1-8.
4. Johnson, P. N., Amirtharajah, A. 1983. Res.Technol. J. AWWA. 75, 232-239.
5. Odegaard, H., Eikebrokk, B., Storhaug, R. 1999. Water Sci. Technol. 40, 37–46.
6. Jung, A. V., Chanudet, V., Ghanbaja, J., Lartiges, B. S., Bersillon, J. L. 2005. Water Res. 39,
3849–3862.
7. Randtke S. J. 1988. J. Am. Water Works Assoc. 80, 40–56.
8. Amirtharajah A, O’Melia C. R.1990. Coagulation processes: destabilization, mixing, and
flocculation. In: Water quality and treatment: a handbook of community water supplies, F. W.
Pontius (Ed.), 4th edition, New York, USA7 McGraw-Hill Inc. pp. 269–365.
9. Standards Methods for the Examination of Water and Wastewater 1998 20th Edition, APHA,
AWWA, AWPCF, Washington, DC, USA.
10. Collins, M. R., Amy, G. L., Steelink, C. 1986. Envir. Sci. Technol. 20, 1028–1032.
11. Piccolo, A., Nardi, S., Cancheri, G. 1996. Eur. J. Soil. Sci. 47, 319–328.
12. Piccolo, A., Nardi, S., Cancheri, G. 1996a. Chemosphere 33, 595–600.
496
Influence of Tropical Humic Substances and Copper on the Survival and Reproduction of Tropical Cladocerans (Daphnia similis and Ceriodaphnia silvestrii)
Domingos S. Barbosa1, Eny M. Vieira2, Danilo S. Barbosa1, Evaldo L. G. Espíndola1,
Geoffroy R. P. Malpass2 1Universidade de São Paulo-EESC/SHS/CRHEA/NEEA PPG Ciências da Eng. Ambiental Av.
Trabalhador Sancarlense 400 CP 292 São Carlos-SP Brazil, [email protected] 2Universidade de São Paulo- IQSC
Keywords: humic substances, copper, Daphnia similis, Ceriodaphnia silvestrii
1. INTRODUCTION
Humic substances are recognized as influencing the toxicity of heavy metals (e.g. copper) towards the survival and growth of Cladocerans. However, information about the ecology of tropical humic acids is scarce when compared to those from other sources. In this work we evaluate the influence of tropical peat soil humic substances on the survival and growth of two Cladocerans species in presence of copper. The aim of this study was to investigate if tropical humic acid can reduce copper toxicity in both lethal and sub-lethal concentrations towards the Cladocerans Daphnia similis and Ceriodaphnia silvestrii, respectively. The influence of humic acids on survival and reproduction of these species was evaluated.
2. MATERIALS AND METHODS
Tropical humic substances were extracted from tropical humic soil (Mogi-Guaçu River basin, Brazil) using the recommendations of the IHSS protocol. The humic acids (HA) were purified using ion-exchange resins. All solutions were prepared using ASTM (1) soft water (hardness 40 mg L-1). Copper solutions (Cu) were prepared using Sigma Aldrich
AAS standard. A single concentration was used for both assays: 25 μg L-1. The final assay combinations for both species were SH, SH+Cu, Cu and Control. For acute toxicity assays five concentrations of HA (0.3; 0.5; 1.0; 3.0 and 5.0 mg L-1) were used and for chronic only 5.0 mg L-1 was used.
The organisms were cultured according to ABNT (2) (Brazilian standard) recommendations. The exposure time was 48h for acute toxicity assays using Daphnia similis and 192h for chronic assay using Ceriodaphnia silvestrii. All assays were conducted in triplicate. The results obtained were analyzed using statistical packages and the free copper the estimations were calculated using the BLM model from Hydroqual.
497
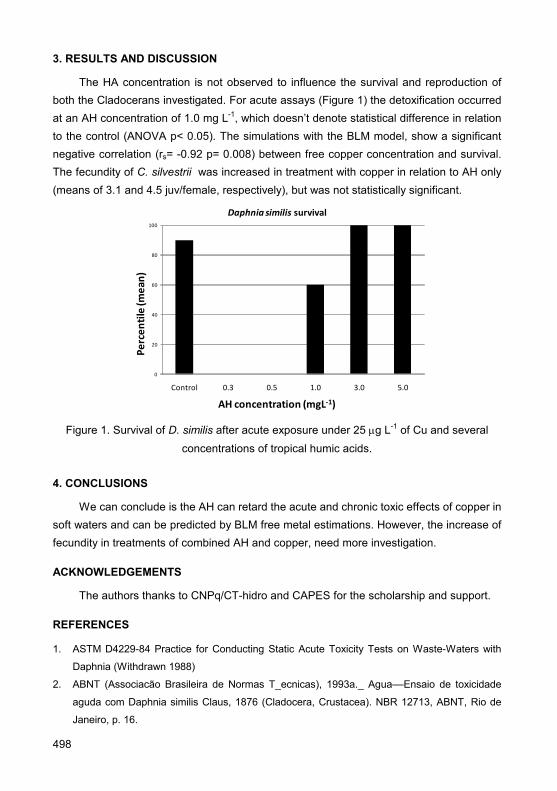
3. RESULTS AND DISCUSSION
The HA concentration is not observed to influence the survival and reproduction of both the Cladocerans investigated. For acute assays (Figure 1) the detoxification occurred at an AH concentration of 1.0 mg L-1, which doesn’t denote statistical difference in relation to the control (ANOVA p< 0.05). The simulations with the BLM model, show a significant negative correlation (rs= -0.92 p= 0.008) between free copper concentration and survival. The fecundity of C. silvestrii was increased in treatment with copper in relation to AH only (means of 3.1 and 4.5 juv/female, respectively), but was not statistically significant.
0
20
40
60
80
100
Control 0.3 0.5 1.0 3.0 5.0
Perc
enti
le (m
ean)
AH concentration (mgL-1)
Daphnia similis survival
Figure 1. Survival of D. similis after acute exposure under 25 μg L-1 of Cu and several
concentrations of tropical humic acids.
4. CONCLUSIONS
We can conclude is the AH can retard the acute and chronic toxic effects of copper in soft waters and can be predicted by BLM free metal estimations. However, the increase of fecundity in treatments of combined AH and copper, need more investigation.
ACKNOWLEDGEMENTS
The authors thanks to CNPq/CT-hidro and CAPES for the scholarship and support.
REFERENCES
1. ASTM D4229-84 Practice for Conducting Static Acute Toxicity Tests on Waste-Waters with
Daphnia (Withdrawn 1988)
2. ABNT (Associacão Brasileira de Normas T_ecnicas), 1993a._ Agua––Ensaio de toxicidade
aguda com Daphnia similis Claus, 1876 (Cladocera, Crustacea). NBR 12713, ABNT, Rio de
Janeiro, p. 16.
498

Buffer Properties of Humic Acids in the System with Phosphate Ions
Patrycja Warchulska, Zofia Sokołowska Institute of Agrophysics Polish Academy of Science, Department of Physical Chemistry of Porous
Materials, ul. Doświadczalna 4, 20-290 Lublin, Poland, phone: +48 817445061,
Keywords: buffer capacity, humic acids, potentiometric titration, phosphate ions
1. INTRODUCTION
Among many methods of getting information on properties of acidic groups, potentiometric titration is frequently used. A back titration method has been applied for the determination of qualitative and quantitative analysis: the dependence of variable surface charge Q versus pH, functions of apparent surface dissociation constants distribution versus pKapp and also quantity of particular functional groups. Electrochemical measurements can be also used to buffer properties analysis of soil components.
The issue of buffering in the system of soil organic matter – phosphates seems be interesting for ecological reasons. Humic acids and their salts fulfil function as natural soil buffers, whereas phosphates higher presence in the soil, which also have strong buffer properties, results from human intervention. Natural contents of phosphates in soils ranges between 40 and 1000 ppm (1). However increasing consumption of phosphate fertilizers in the last years produces the result of increasing phosphates presence in the soils and groundwater. Apart from great amount negative consequences which can be caused by phosphate ions, they can also in significant manner modify and increase of natural buffer properties of soils. It can be reason for change of acid – base equilibrium. Determination of buffer pH ranges of each investigated system can let define of component influence on environment and also enable calculating of increasing of natural environment buffer capacity after phosphates adding.
The aim of this study is to determine the buffer capacity of natural humic acids samples and to compare these characteristics with buffer capacity of commercial humic acid (Aldrich HA) as well as to investigate the influence of phosphate ions on buffer properties of studied humus extracts. In this case potentiometric titration method was used at a wide range of pH (3-10).
2. MATERIALS AND METHODS
The study was conducted on a few muck samples (Terric Histosols). The samples
were collected at 5-20 cm depth from terrains located in a low moor area of the Wieprz-
499
Krzna Canal (Polesie Lubelskie) and Biebrza River in Poland. The selected properties of
the investigated soil samples are presented in Table 1.
Table 1. Selected properties of the investigated mucks
Nr W1 Ash (% d.m) Bulk density (g cm-3) Porosity (% obj.) pH H2O pH KCl
1 0,44 22,7 0,21 88,5 5,1 4,5
2 0,55 17,6 0,25 84,6 5,5 5,2
3 0,65 18,9 0,31 80,9 5,5 5,0
4 0,72 18,0 0,36 77,8 5,0 4,5
5 0,82 22,3 0,39 78,7 5,5 5,0
Within next step humic acids (HA) were extracted from mucks by Schnitzer method
(2). From the obtained extracts, suspensions of 400 ppm of HA with different
concentrations of phosphate (V) ions (0-600 ppm) were prepared on the basis of 1 M
sodium chloride solution. High ionic strength gave lower electrostatic interactions in the
solution and made the surface more easily charged. All investigations were carried out
using Titrino 702 (Metrohm) apparatus. Samples were titrated using 0,1 M sodium
hydroxide solution based on 1 M sodium chloride solution in wide range of pH (3-10). From
the obtained potentiometric titration curves, buffer capacities of humic acids with different
phosphate additions, were calculated using equation no. 1, where: Δn – amount of added
moles of strong base and ΔpH – change of pH caused by strong base adding
pHn
dpHdn
ΔΔ≈=β (1)
3. RESULTS AND DISCUSSION
Buffer capacity of investigated systems was described as function of the pH.
Exemplary curves of β vs. pH were shown in figure 1 and 2. The buffering curves of
particular soil humic acid extracts without phosphates addition, differ from each other
(Figure 1). Significant discrepancies are clearly seen at the dissociation range of strong
acid carboxylic groups. Buffer capacity at that pH range is the highest and reaches
maximum at pH ~ 4.
500

0.00000.00050.00100.00150.00200.00250.0030
3 5 7 9pH
B [m
ol]
4
5
3
1
2
standard
1M NaCl
Figure 1. Exemplary curves of β vs. pH of humic acid extracts
without phosphate (V) ions addition.
0.00000.00100.00200.00300.00400.00500.0060
3 5 7 9pH
B [m
ol]
4
3
1
2
1M NaCl,600 ppm P
Figure 2. Exemplary curves of β vs. pH of humic acid extracts
with phosphate (V) ions addition (600 ppm).
The discrepancies which occur at low pH values can be a result of different
secondary transformation degree of organic matter (Table 1). Extract samples with the
highest W1 degree showed lower buffer capacity at low pH than buffer capacity of samples
with lower W1 degree. It is probably connected with altered oxidation and decomposition
degree of investigated organic matter. Commercial humic acid had the lowest buffer
capacity in comparison to natural extracts which can indicate high degree of secondary
transformation or presence of ash in the commercial reagent, because the COOH groups
may be complexed with silicate impurities of ash. Maximal β for Aldrich HA was wider and
flatter than for the natural samples (pH ~ 4-6) which can denote vast influence either o-
COOH type groups or simple carboxylic groups (COOH). For the natural extracts, o-
carboxylic groups are predominating. The peaks observed at the pH range 8-10 are
assigned to phenolic groups, eventually to secondary or tertiary amines which can be
titrated together with phenols (4). It can be also referred to total content of nitrogen in the
501
investigated material. The differences in buffer capacities at that pH range are not so
significant. Addition of phosphates does not cause visible changes in structure of humic
acids (It is noticeable in the functions of apparent surface dissociation constants
distribution versus pKapp which were also obtained). Such behaviour is most probably
caused by washing up multivalent cations (during Schnitzer extraction) which in natural
conditions fulfil function of bridges connecting phosphates with humic acids. On the other
hand, phosphates strongly buffer at the range of pH 5-8. Phosphate presence increases
buffer capacity of natural humic acids at the range of pH ~ 5-7, so that in pH range of most
soils. Functional groups from pH 5 to 7 are the most significant in soil because they are
completely ionized and contribute to soil buffering capacity presence (3). Thus, increased
presence of phosphates can have considerable impact on acid – base equilibrium and
homeostasis state retaining.
4. CONCLUSIONS
On the base of above investigations their following conclusions may be drawn:
– humic acid shows the highest buffer properties at low pH, reaches maximum at
pH ~ 4;
– phosphate ions reveal buffer properties at pH range 4,5-8,0 with maximum at
pH ~ 6,8 increasing directly proportional with phosphate concentration;
– the discrepancies which occur on the β – curves at low pH values, can be a result
of different secondary transformation degree of organic matter. With increasing W1, β
decreases at low pH ranges;
– phosphate presence increases buffer capacity of natural humic acids at the range
of pH ~ 5-7, so that in pH range of most soils;
– presence of phosphates can be significant for acid – base equilibrium and
environment homeostasis retaining;
– phosphates in natural conditions apart from increasing of buffer capacity of soils,
can also connect to humic acids by cation bridges and structure of humic acid can be
changed.
REFERENCES
1. Bohn H., McNeal B., O’Connor G., Soil Chemistry, John Wiley & Sons, New York, Chichester,
Brisbane, Toronto, 1979.
2. Przewodnik metodyczny do badań materii organicznej gleb, PTG Warszawa 1990.
3. Aleixo L., Godhino O., da Costa W., Anal. Chim. Acta, 257 (1982) 35 – 39.
4. Campitelli P., Velasco M., Ceppi S., J. Chil.Chem. Soc., v.48 n.3, 2003.
502
Population of Humic Acid Degrading Microorganisms under Different Soil Types and Vegetation Types
Yukiko Yanagi1, Kaori Yoda2, Kazuhiko Ogura2, Nobuhide Fujitake3 1Faculty of Horticulture, Minamikyushu University, Minamitakanabe 11609, Takanabe, Miyazaki
8840003, JAPAN, [email protected] 2Graduate School of Science and Technology and 3Graduate School of Agricultural Science, Kobe
University, Rokkodai 1, Nada, Kobe, Hyogo 6578501, Japan
Keywords: humic substances, degradation, decolorization, fungi, bacteria
1. INTRODUCTION
Humic substances participate in the global carbon cycle and are regarded as being
rather resistant to biological influences, owing to their peculiar molecular structure;
however, they are known to be degraded by microorganisms. Therefore, studies of the
mechanisms by which humic biotransformation take place, and the organisms responsible,
are important for understanding terrestrial carbon dynamics.
Since the 1960s, a number of microbial isolates that degrade humic substances have
been obtained. The structural changes that occur during the transformation of these
substances by microorganisms have also been investigated. However, no detailed study
has been performed on the distribution and density of microorganisms capable of
degrading humic substances in the environment. This information will be essential for
developing a better understanding of humus biotransformation in various soil
environments.
The purpose of this study was to examine the effect of soil types and vegetation type
on the distribution of humus-degrading microorganisms. We measured the density of
microbes that degrade humic substances using the decolorization of humic acid as an
indicator of the ability to degrade humus.
2. MATERIALS AND METHODS
The study sites were three Andosol sites (GS, SN, TM) and three Cambisol sites (AJ,
MY, YS) in western Japan (Table 1). Each Andosol site had three different vegetation
types in adjacent locations: bamboo grassland (Gb), eulalia grassland (Ge), and
coniferous plantations (F). The vegetation type of the Cambisol sites was broad-leaf forest.
Soil samples were taken from each of the vegetation types at each site. Undisturbed soil
core samples were collected using a stainless steel core sampler (100 mL). For soil
503
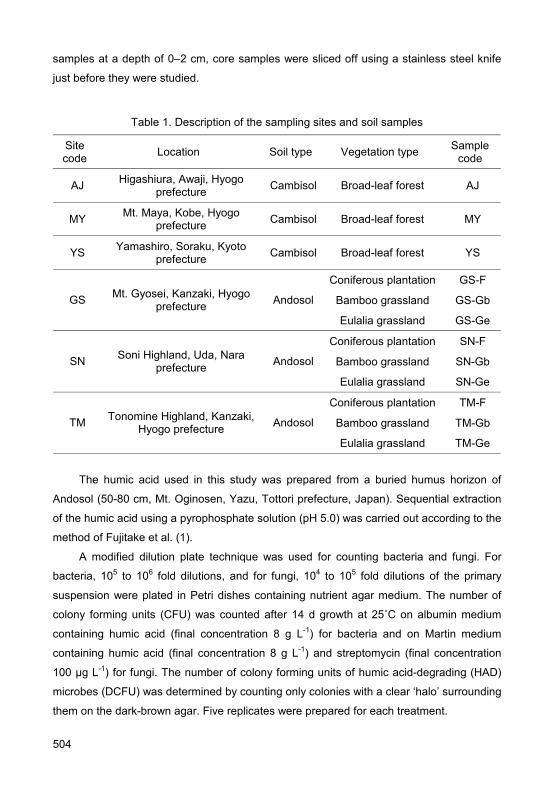
samples at a depth of 0–2 cm, core samples were sliced off using a stainless steel knife
just before they were studied.
Table 1. Description of the sampling sites and soil samples
Site code Location Soil type Vegetation type Sample
code
AJ Higashiura, Awaji, Hyogo prefecture Cambisol Broad-leaf forest AJ
MY Mt. Maya, Kobe, Hyogo prefecture Cambisol Broad-leaf forest MY
YS Yamashiro, Soraku, Kyoto prefecture Cambisol Broad-leaf forest YS
Coniferous plantation GS-F
Bamboo grassland GS-Gb GS Mt. Gyosei, Kanzaki, Hyogo prefecture Andosol
Eulalia grassland GS-Ge
Coniferous plantation SN-F
Bamboo grassland SN-Gb SN Soni Highland, Uda, Nara prefecture Andosol
Eulalia grassland SN-Ge
Coniferous plantation TM-F
Bamboo grassland TM-Gb TM Tonomine Highland, Kanzaki, Hyogo prefecture Andosol
Eulalia grassland TM-Ge
The humic acid used in this study was prepared from a buried humus horizon of
Andosol (50-80 cm, Mt. Oginosen, Yazu, Tottori prefecture, Japan). Sequential extraction
of the humic acid using a pyrophosphate solution (pH 5.0) was carried out according to the
method of Fujitake et al. (1).
A modified dilution plate technique was used for counting bacteria and fungi. For
bacteria, 105 to 106 fold dilutions, and for fungi, 104 to 105 fold dilutions of the primary
suspension were plated in Petri dishes containing nutrient agar medium. The number of
colony forming units (CFU) was counted after 14 d growth at 25˚C on albumin medium
containing humic acid (final concentration 8 g L-1) for bacteria and on Martin medium
containing humic acid (final concentration 8 g L-1) and streptomycin (final concentration
100 µg L-1) for fungi. The number of colony forming units of humic acid-degrading (HAD)
microbes (DCFU) was determined by counting only colonies with a clear ‘halo’ surrounding
them on the dark-brown agar. Five replicates were prepared for each treatment.
504

3. RESULTS AND DISCUSSION
The bacterial and fungal density data for nine Andosol samples and three Cambisol
samples are shown in Table 2. The density of total bacteria varied, ranging from 30.0 to
214.9 106 cfu g-1 soil. The density of HAD bacteria ranged from 0.1 106 cfu g-1 soil for
SN-Gb to 7.5 106 cfu g-1 soil for AJ. AJ had significantly higher values for HAD bacterial
density than the others. However, there seemed to be no clear relationship between the
density of either total bacteria or HAD bacteria and vegetation type or soil type.
The total fungal density also varied, ranging from 63.9 to 362.3 104 cfu g-1 soil. The
HAD fungal density ranged from 3.6 104 cfu g-1 soil at SN-Gb to 24.8 104 cfu g-1 soil at
MY and SN-Ge. The samples for Cambisol had significantly higher values for HAD fungal
densities than the samples for Andosol except SN-Ge and TM-Ge. These two soils were
maintained for grassland vegetation by annual burning in early spring.
Table 2. Total microbial density (CFU cfu g-1 soil) and density of humic acid
degrading microorganisms (DCFU cfu g-1 soil) in different soil samples
Samples Bacteria Fungi
CFU
( 106)
DCFU
( 106)
(DCFU/CFU)
100
CFU
( 104)
DCFU
( 104)
(DCFU/CFU)
100
AJ 214.9 7.5 3.5 362.3 24.8 6.9
MY 22.9 0.3 1.4 101.5 16.2 15.9
YS 30.0 0.9 3.2 63.9 12.0 17.0
GS-F 50.4 1.9 3.5 77.8 4.5 6.0
GS-Gb 68.7 0.6 1.0 200.4 4.8 5.3
GS-Ge 82.6 0.7 0.8 217.3 5.9 4.9
SN-F 184.2 0.5 0.3 147.9 7.8 2.4
SN-Gb 61.8 0.1 0.2 109.0 3.6 3.3
SN-Ge 163.6 2.8 1.8 214.4 24.8 3.7
TM-F 157.4 2.1 1.4 160.2 7.6 2.8
TM-Gb 121.9 2.0 1.8 163.5 6.0 11.4
TM-Ge 38.9 0.3 0.6 117.8 14.7 12.5
505
The percentages of total bacteria or fungi that were able to degrade humic acid (i.e.
(DCFU/CFU) 100) at each site are also shown in Table 2. The percentages of HAD
bacteria were rather low, and there were no significant differences between sites. There
were greater percentages of HAD fungi than bacteria, with values ranging from 2.4 to
17.0%. The soil samples classified as Cambisol except AJ showed higher values than
those for Andosol samples. Among Andisol samples, the percentages of HAD fungi were
significantly higher for SN-Ge and TM-Ge than for the other sites (11.4% and 12.5%,
respectively).
In our study, microorganisms that degrade humic acid were found in all soil samples.
These results suggest that HAD microorganisms are widely distributed in surface soils.
Low densities of HAD bacteria were detected at every site and for each soil type and
vegetation type, and the overall percentages of bacteria able to degrade humic acid were
low. In contrast to the bacteria, the densities of HAD fungi differed among the twelve soil
samples. Greater densities and percentages of HAD fungi were detected in Cambisols
than in Andosols, except for SN-Ge and TM-Ge. It is considered that these differences are
probably related to the differences in soil type and vegetative cover. At the eulalia
grasslands at SN and TM, which had higher percentages of HAD fungi than the other
Andisol samples, annual burning is carried out in early spring to maintain the eulalia
vegetation. At the eulalia grassland at GS, on the other hand, burning was previously
applied, but unscheduled cutting is now used. The GS-Ge site had HAD fungal percentage
similar to those at the bamboo grasslands sites, which were also maintained by cutting,
but had considerably lower values than the SN-Ge and TM-Ge sites. Our results suggest
that the proportion of fungi that degrade humic acid is also influenced by grassland
management regimen, and that burning results in an increase in the proportion of HAD
fungi.
REFERENCES
1. Fujitake, N., Kusumoto , A., Tsukamoto, M. Kwahigashi, M., Suzuki, T., Otsuka, H. Soil Sci.
Plant Nutr. 44, 253-260.
506

Section IV
Nature- and man-made design of humic materials and their properties

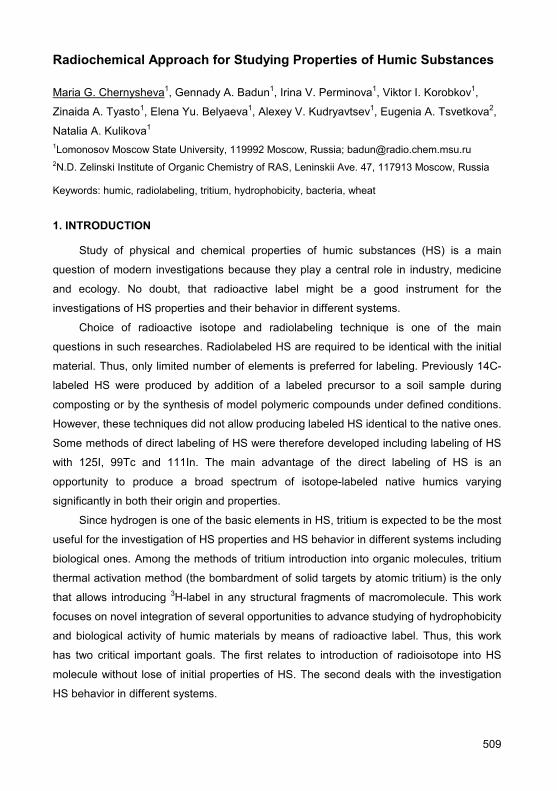
Radiochemical Approach for Studying Properties of Humic Substances
Maria G. Chernysheva1, Gennady A. Badun1, Irina V. Perminova1, Viktor I. Korobkov1,
Zinaida A. Tyasto1, Elena Yu. Belyaeva1, Alexey V. Kudryavtsev1, Eugenia A. Tsvetkova2,
Natalia A. Kulikova1 1Lomonosov Moscow State University, 119992 Moscow, Russia; [email protected] 2N.D. Zelinski Institute of Organic Chemistry of RAS, Leninskii Ave. 47, 117913 Moscow, Russia
Keywords: humic, radiolabeling, tritium, hydrophobicity, bacteria, wheat
1. INTRODUCTION
Study of physical and chemical properties of humic substances (HS) is a main
question of modern investigations because they play a central role in industry, medicine
and ecology. No doubt, that radioactive label might be a good instrument for the
investigations of HS properties and their behavior in different systems.
Choice of radioactive isotope and radiolabeling technique is one of the main
questions in such researches. Radiolabeled HS are required to be identical with the initial
material. Thus, only limited number of elements is preferred for labeling. Previously 14C-
labeled HS were produced by addition of a labeled precursor to a soil sample during
composting or by the synthesis of model polymeric compounds under defined conditions.
However, these techniques did not allow producing labeled HS identical to the native ones.
Some methods of direct labeling of HS were therefore developed including labeling of HS
with 125I, 99Tc and 111In. The main advantage of the direct labeling of HS is an
opportunity to produce a broad spectrum of isotope-labeled native humics varying
significantly in both their origin and properties.
Since hydrogen is one of the basic elements in HS, tritium is expected to be the most
useful for the investigation of HS properties and HS behavior in different systems including
biological ones. Among the methods of tritium introduction into organic molecules, tritium
thermal activation method (the bombardment of solid targets by atomic tritium) is the only
that allows introducing 3H-label in any structural fragments of macromolecule. This work
focuses on novel integration of several opportunities to advance studying of hydrophobicity
and biological activity of humic materials by means of radioactive label. Thus, this work
has two critical important goals. The first relates to introduction of radioisotope into HS
molecule without lose of initial properties of HS. The second deals with the investigation
HS behavior in different systems.
509

2. MATERIALS AND METHODS
Humic materials used in this study were humic (HA) and fulvic acids (FA) isolated
from soil and peat and also included preparations of HA and hymatomelanic acids (HMA)
from brown coal. All the HS were characterized by methods of elemental analysis, size-
exclusion chromatography (SEC) and 13C NMR spectroscopy.
Preparation of tritium-labeled HS. In the present study, we applied a new developed
technique for radioactive labeling of HS using thermal activation method (1). The method
implied bombardment of the target HS with atomized tritium followed by equilibrium
dialysis to purify the labeled product from labile tritium and low molecular weight fractions.
To prove the developed technique of HS labeling with tritium, parent HS and obtained
samples of 3H-HS was analyzed by SEC with radioactivity and UV detection.
Characterization of hydrophobicity and surface activity of HS. To characterized
hydrophobic and surface activity properties of HS under study, the obtained 3H-HS
samples of corresponding initial humic materials were used. Hydrophobic properties of HS
used were characterized using common logarithm of octanol-water coefficient lgKOW
determined directly following the distribution of HS between octanol and water phase by a
scintillation phase method according to (2). To characterize surface activity of target HS, a
parameter reflecting maximum adsorption of HS in the toluene-water interface Γmax was
used as described in (ibid.).
Study of HS interaction with bacteria. Experiments on 3H-HS interaction with bacteria
were conducted by growing E. coli cells overnight at 37°C in M9 medium supplied with
labeled HS at concentrations of 5-50 mg l-1 After overnight cultivation, the cells were
harvested by centrifuging (5000 rpm, 30 min), and the radioactivity of supernatant was
measured. The value obtained was assigned to the equilibrium concentration of HS. Then
the supernatant was replaced with the equal amount of M9 media, the cells were re-
suspended, and radioactivity of the suspension was measured. That value corresponded
to the amount of HS taken up by the cells, i.e. a sum of HS adsorbed on the surface of the
cells and HS penetrated into the cells. To determine the amount of HS penetrated into the
cells, cell lysis was performed using chloroform followed by centrifugation (5000 rpm,
30 min) to separate debris. The radioactivity of the supernatant was assigned to the
amount of HS penetrated the cells. Bioconcentration factor (BCF) was calculated as a
slope of the HS taken up by E. coli cells vs. HS equilibrium concentration.
Study ob HS interaction with higher plants. Plants of wheat Triticum aestivum L. (var.
Inna) were used for the experiments. Wheat seeds were germinated at 24°C in the dark for
510

72 h followed by transferring seedlings into the 0.5 l tanks containing Knopp nutrition
solution. After another 72 h plants were transferred into the vials containing HS at
concentration 5-50 mg l–1. After 24 h plants were harvested, weighted and subjected to
autoradiography. To estimate HS uptake by plants, radioactivity of HS solutions before and
24 h of plant growing was measured using liquid scintillation method.
3. RESULTS AND DISCUSSION
Preparation of tritium-labeled HS and comparative analysis of parent and 3H-HS.
Obtained results demonstrated that developed approach allowed synthesis of 3H-HS of
high specific radioactivity and yield. For the studied HS value of specific radioactivity
varied from 0.14 to 0.63 TBq g-1; yield ranged from 23 to 87% depending HS labeled.
Parent HS and obtained samples of 3H-HS were subjected to SEC analysis with
radioactivity and UV detection. It was demonstrated that parent and labeled HS were
characterized with the similar UV SEC profiles what was evident for the absence of
significant alteration of HS structure due to either tritium introduction or dialysis. On the
other hand, similarity of UV and radioactivity SEC profiles of 3H-HS confirmed that
introduced tritium was uniformly distributed among HS fractions of different molecular
sizes. Therefore, the developed technique of the radioactive labeling of HS with tritium by
thermal activation method can be used for the labeling of a broad spectrum of HS of
different origin and composition.
Hydrophobicity and surface activity of HS. Determined values of partition coefficients
of HS in octanol – water system lgKow for the studied HS varied from -2.98 to -1.95
indicating slight hydrophobicity of HS. At that soil FA were characterized with the lowest
hydrophobic properties whereas peat HA possessed the highest values of lgKow. It should
be noted that direct determination of HS hydrophobicity was performed for the first time.
Surface activity of HS also depended greatly on HS origin. Among studied HS the
most surface active HS was obtained to be peat HA and FA whilst soil FA was showed to
possessed negligible surface activity.
The preformed experiments demonstrated clearly that 3H-HS are useful in study of
both HS hydrophobicity and surface activity.
Study of HS interaction with bacteria. Obtained results indicated that HS adsorption
onto bacterial surfaces can be extensive, and that the sorption behavior depended on a
preparation used. HS adsorption onto bacterial surfaces was the highest in case of peat
HA, and decreases to negligible amounts of adsorption in case of soil FA. Observed
values of bioconcentration factor of HS by E. coli varied in the range 0.9-13.1 l kg-1
511

depending considerably on the HS preparation. Performed experiments demonstrated also
that HS could penetrate into the bacterial cells. Measured amounts of HS penetrated into
the cells were 23-167 mg kg-1 what were at least 20% of totally sorbed HS and reached
maximum of 100% in case with FA. Therefore, the obtained 3H-HS were demonstrated to
be a promising approach for study of bacteria-HS interaction.
Study of HS interaction with higher plants. HS uptake by wheat seedlings was
characterized by smooth, nonsaturating curves for all the studied HS. The obtained curves
of concentration-dependent HS accumulation by wheat seedlings were fitted to Michaelis-
Menten kinetics equation allowing determination of Michaelis constant Km and rate of
accumulation Vmax. Among the HS studied, the highest Michaelis constant was observed
for HMA derived from coal, which was characterized with the lowest molecular weight and
the highest contents of quinoic and ketonic groups. On the other hand, a minimum value of
Km was also recorded for coal HMA possessing the lowest C/N ratio. Rate of
accumulation for the studied HS varied in the range 6-54 mg kg-1 h-1 and had its maximum
in case of peat HA with the highest observed molecular weight.
Performed autoradiography analysis of wheat seedlings treated with 3H-HS
demonstrated that roots of the plants were characterized with homogeneous distribution of
signal intensity. Distribution of HS within the shoots was also relatively homogeneous
except for the tips of the leaves where local increase of signal density was observed. It
could be concluded that HS could be taken up through plant roots and moved al least in
the xylem with transpiration stream to areas of new growth.
4. CONCLUSIONS
The developed technique of the radioactive labeling of HS with tritium by thermal
activation method can be used for the labeling of a broad spectrum of HS of different origin
and composition. The obtained labeled HS may be useful for the study of HS behavior in
the environment and biological systems.
ACKNOWLEDGEMENTS
This work was financially supported by the Russian Foundation for Basic Research
(#06-03-33036 and #06-04-49017-а).
REFERENCES
1. Badun G.A., Pozdnyakova V.Yu. et al. 2003. Bulgarian J. of Ecol. Sci. 2(3-4), 26-27.
2. Badun, G.A., Chernysheva M. G. et al. 2005. Radiochemistry. 47(6), 584-588.
512

Oxidative Degradation of Chlorophenol by Iron-Porphyrin Catalyst Bound to Humic Acid via Formaldehyde Polycondensation
Masami Fukushima, and Satoko Shigematsu Hokkaido University, Sapporo 060-8628, Japan, [email protected]
Keywords: humic acid, chlorophenol, catalytic oxidation, iron-porphyrin, polycondensation
1. INTRODUCTION
Iron(III)-porphyrin catalysts have been known to be inactivated by self-degradation in
the presence of peroxides, such as KHSO5. We reported that oxidative degradation of
pentachlorophenol (PCP) by tetrakis(p-sulfonatophenyl)porphineiron(III) (FeTPPS) was
enhanced in the presence of humic acids (HAs) (1). This effect can be attributed to the fact
that self-degradation of FeTPPS in the presence of KHSO5 is suppressed by the formation
of supramolecular complexes via hydrophobic interactions between HA and the
sulfonatophenyl groups in FeTPPS (2). However, the extent of supramolecular complex
formation may be dependent on the type of HA, because the degree of hydrophobic
interactions varies significantly, depending on the polar groups in HAs. Recently,
hydroquinone groups were covalently introduced into HA using formaldehyde
polycondensation to enhance the reducing abilities of HA (3). The introduction of functional
groups into HA is a novel trend in current humic technology. Covalent binding of the
iron(III)-porphyrin catalyst to HA would be advantageous, as it would prevent dissociation
of the catalyst from the supramolecular complex. Thus, in the present study, FeTPPS was
covalently introduced into HA via formaldehyde polycondensation. In addition, the self-
degradation kinetics and catalytic activity of the prepared catalysts were examined.
2. MATERIALS AND METHODS
Synthesis of catalysts: An HA sample was isolated from a Shinshinotsu peat soil by a
method approved by the International Humic Substances Society. After introducing a
hydroxyl group into tetraphenyl porphyrin, this compound was sulfonated in the presence
of concentrated H2SO4. FeTPPSOH in scheme 1 was obtained by the metalation of FeSO4
in aqueous solution. The formaldehyde polycondensation reaction between HA and
FeTPPSOH is shown in Scheme 1. In general, formaldehyde polycondensation using
alkaline catalyst can produce the resol-type phenol resin. Thus, we call the FeTPPSOH-
HA catalyst in Scheme 1, “resol”. The resol samples prepared were deionized by
ultrafiltration (1000 Da), followed by dialysis (500 Da). Finally, powdered samples were
513
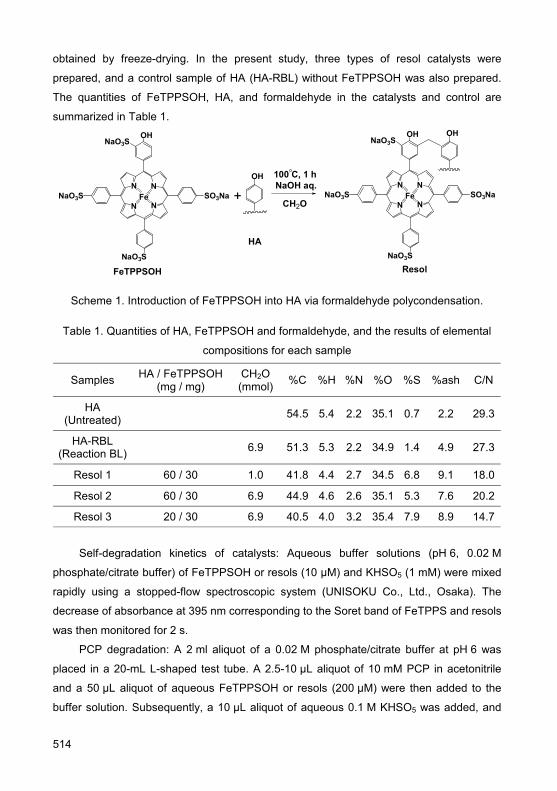
obtained by freeze-drying. In the present study, three types of resol catalysts were
prepared, and a control sample of HA (HA-RBL) without FeTPPSOH was also prepared.
The quantities of FeTPPSOH, HA, and formaldehyde in the catalysts and control are
summarized in Table 1.
NN
N N
OH
SO3NaNaO3S
NaO3S
NaO3S
FeCH2O
OH
NN
N N
OH
SO3NaNaO3S
NaO3S
NaO3S
Fe
OH
+
FeTPPSOH
HA
Resol
NaOH aq.100 C, 1 h
Scheme 1. Introduction of FeTPPSOH into HA via formaldehyde polycondensation.
Table 1. Quantities of HA, FeTPPSOH and formaldehyde, and the results of elemental
compositions for each sample
Samples HA / FeTPPSOH (mg / mg)
CH2O (mmol) %C %H %N %O %S %ash C/N
HA (Untreated) 54.5 5.4 2.2 35.1 0.7 2.2 29.3
HA-RBL (Reaction BL) 6.9 51.3 5.3 2.2 34.9 1.4 4.9 27.3
Resol 1 60 / 30 1.0 41.8 4.4 2.7 34.5 6.8 9.1 18.0
Resol 2 60 / 30 6.9 44.9 4.6 2.6 35.1 5.3 7.6 20.2
Resol 3 20 / 30 6.9 40.5 4.0 3.2 35.4 7.9 8.9 14.7
Self-degradation kinetics of catalysts: Aqueous buffer solutions (pH 6, 0.02 M
phosphate/citrate buffer) of FeTPPSOH or resols (10 μM) and KHSO5 (1 mM) were mixed
rapidly using a stopped-flow spectroscopic system (UNISOKU Co., Ltd., Osaka). The
decrease of absorbance at 395 nm corresponding to the Soret band of FeTPPS and resols
was then monitored for 2 s.
PCP degradation: A 2 ml aliquot of a 0.02 M phosphate/citrate buffer at pH 6 was
placed in a 20-mL L-shaped test tube. A 2.5-10 μL aliquot of 10 mM PCP in acetonitrile
and a 50 μL aliquot of aqueous FeTPPSOH or resols (200 μM) were then added to the
buffer solution. Subsequently, a 10 μL aliquot of aqueous 0.1 M KHSO5 was added, and
514
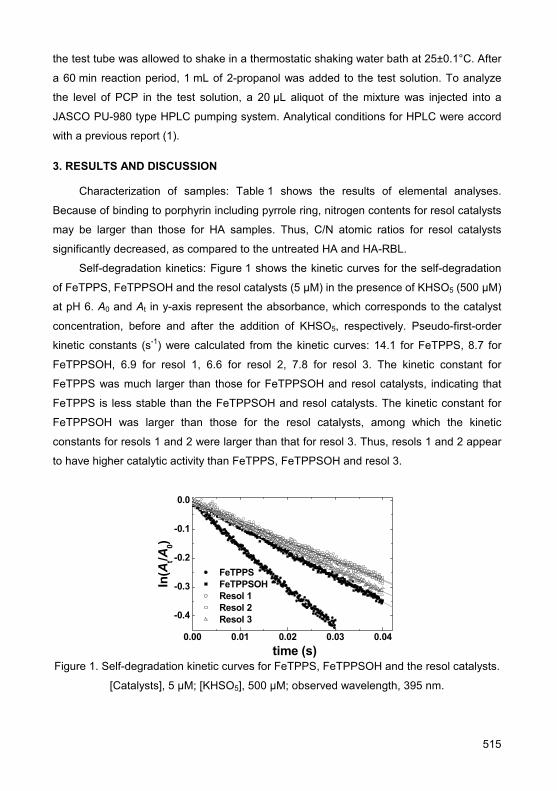
the test tube was allowed to shake in a thermostatic shaking water bath at 25±0.1°C. After
a 60 min reaction period, 1 mL of 2-propanol was added to the test solution. To analyze
the level of PCP in the test solution, a 20 μL aliquot of the mixture was injected into a
JASCO PU-980 type HPLC pumping system. Analytical conditions for HPLC were accord
with a previous report (1).
3. RESULTS AND DISCUSSION
Characterization of samples: Table 1 shows the results of elemental analyses.
Because of binding to porphyrin including pyrrole ring, nitrogen contents for resol catalysts
may be larger than those for HA samples. Thus, C/N atomic ratios for resol catalysts
significantly decreased, as compared to the untreated HA and HA-RBL.
Self-degradation kinetics: Figure 1 shows the kinetic curves for the self-degradation
of FeTPPS, FeTPPSOH and the resol catalysts (5 μM) in the presence of KHSO5 (500 μM)
at pH 6. A0 and At in y-axis represent the absorbance, which corresponds to the catalyst
concentration, before and after the addition of KHSO5, respectively. Pseudo-first-order
kinetic constants (s-1) were calculated from the kinetic curves: 14.1 for FeTPPS, 8.7 for
FeTPPSOH, 6.9 for resol 1, 6.6 for resol 2, 7.8 for resol 3. The kinetic constant for
FeTPPS was much larger than those for FeTPPSOH and resol catalysts, indicating that
FeTPPS is less stable than the FeTPPSOH and resol catalysts. The kinetic constant for
FeTPPSOH was larger than those for the resol catalysts, among which the kinetic
constants for resols 1 and 2 were larger than that for resol 3. Thus, resols 1 and 2 appear
to have higher catalytic activity than FeTPPS, FeTPPSOH and resol 3.
0.00 0.01 0.02 0.03 0.04
-0.4
-0.3
-0.2
-0.1
0.0
ln(A
t/A0)
time (s)
FeTPPS FeTPPSOH Resol 1 Resol 2 Resol 3
Figure 1. Self-degradation kinetic curves for FeTPPS, FeTPPSOH and the resol catalysts.
[Catalysts], 5 μM; [KHSO5], 500 μM; observed wavelength, 395 nm.
515

Catalytic activity: Figure 2 shows the influence of substrate concentration ([PCP]0) on
the percent PCP disappearance. For all catalysts, the percent PCP disappearance
decreased with increasing [PCP]0. At [PCP]0 = 25, 37.5 and 50 µM, PCP disappearance
was enhanced with the resol catalysts, although this effect was less with resol 3 than with
resols 1 and 2. These results can be attributed to the fact that self-degradation of
FeTPPSOH is retarded by binding to HA via formaldehyde polycondensation.
10 20 30 40 5040
50
60
70
80
90
100
PCP
disa
ppea
ranc
e (%
)
[PCP]0 (μM) Figure 2. Influence of substrate concentration ([PCP]0) on %PCP disappearance.
[Catalysts], 5 μM; [KHSO5], 500 μM; pH 6.0; and reaction time, 60 min.
Symbols: ○ Resol 1, □ Resol 2, ∆ Resol 3, ■ FeTPPSOH, ● FeTPPS
4. CONCLUSIONS
FeTPPSOH was introduced into HA via formaldehyde polycondensation. The
prepared resol catalysts exhibited retarded self-degradation, compared with degradation in
FeTPPSOH alone. Percent PCP disappearance, an index of catalytic activity, was 5-10%
greater with the resol catalysts. Thus, resol catalysts effectively enhanced catalytic activity
because of the reduced self-degradation.
REFERENCES
1. Fukushima, M., Sawada, A., Kawasaki, M., Ichikawa, H., Morimoto, K., Tatsumi, K., Aoyama,
M. 2003. Environ. Sci. Technol. 37, 1031-1036.
2. Fukushima, M., Tatsumi, K. 2006. J. Mol. Catal. A: Chem. 245, 178-184.
3. Perminova, I.V., Kovalenko, A.N., Schmitt-Kopplin, P., Hatfield, K., Hertkorn, N., Belyaeva,
E.Y., Petrosyan, V.S. 2005. Environ. Sci. Technol. 39, 8518-8524.
516

Biorefinery Chars as Potential Sources of Soil Humics
Daniel J. Hayes Department of Chemical and Environmental Sciences, University of Limerick, Ireland,
Keywords: Biorefining, char, humified char, levulinic acid, formic acid, NMR
1. INTRODUCTION
The reliance of the transport sector on petroleum-derived fuels is well documented.
However, the fact that more than 95% of all industrial chemicals are oil-sourced is of even
greater importance since we have now passed ‘peak oil’. That is of particular relevance to
Ireland whose modern economy has been driven by a thriving pharmaceutical sector. It is
important therefore that we take advantage of our national assets, principally our soils and
climatic conditions that have a huge potential for the production of the lignocellulose
biomass that provides the raw materials for second generation biorefining technologies.
Sugars, from carbohydrate components in woody plants (ca 45% cellulose and 25%
hemicellulose), are liberated by these technologies and their fermentation, or their
degradation as in the Biofine process (Biofine Technologies Inc, Walton, MA, USA),
provides platform chemicals that serve as starting materials for the synthesis of fuel
additives, and a wide range of industrial products such as furfural, hydroxymethyl furfural,
levulinic acid (LA), formic acid, and solid biorefining residuals. This contribution focuses on
biorefinery residuals that can give rise to chars and humified chars in soil.
The Biofine Process:
Biofine Inc. has developed a high temperature, dilute acid hydrolysis process for the
fractionation of abundantly available lignocellulosic biomass into highly versatile platform
chemicals (1). The primary “fractions” of the process are levulinic acid (LA) – a five carbon
keto-acid [CH3C(O)CH2CH2COOH], and formic acid (HCOOH). LA is a highly versatile
platform chemical that can be converted to a wide range of environmentally acceptable
chemicals and fuel additives. Its derivatives range from petroleum and diesel oxygenates
to biodegradable pesticides, plastics and solvents, and solid carbonaceous residual
materials (products of secondary reactions formed during the degradation processes and
from the altered lignin, tannins, cutins, cutans, waxes and other non-carbohydrate
components of plants) suitable for gasification to a high quality synthesis gas. The solid
residual material from the gasification process will be a char product that can have soil
ameliorating properties similar to those attributed to the chars responsable for the fertility
517

associated with the Amazonian Dark Earths (ADE) or the Terra Preta (TP) soils of the
Amazon region. The first commercial Biofine plant is operational at Caserta, Italy.
2. MATERIALS AND METHODS
Biofine biorefinery residuals from the processing of wheat straw (Triticum aestivum L)
and of paper sludges were analyzed by solid-state CPMAS 13C NMR spectroscopy, FT-IR,
and thermogravimetric (TG) analyses. The NMR experiments used a VARIAN INOVA
spectrometer at 13C and 1H frequencies of 100.5 and 400.0 MHz, respectively. Cross-
polarization times of 1 ms, acquisition times of 13 ms, and recycle delays of 500 ms were
used. and by thermogravimetric analyses. For comparisons, NMR spectra are given for
charred mosses, and for deposits from the chimney of an oil fired domestic heater, and
thermograms are presented also for lignin and miscanthus (a promising lignocellulosic
biorefinery feedstock).
3. RESULTS AND DISCUSSION
Product yields from previous technologies for LA production were low (around 3% by
mass). The Biofine process, with an efficient reactor system and the use of polymerisation
inhibitors, achieves from cellulose LA yields of 70-80% of the theoretical maximum. That
translates to the conversion of ca 50% of hexose sugars to LA, 20% to formic acid, and
30% to biorefinery residuals. The mass yield of furfural from pentose sugars is also ca
70% of the theoretical value of 72.7%, equivalent to 50% of the mass. The remainder is
incorporated in the residuals.
The FT-IR spectra (not presented) showed that some features of lignin were
preserved in the straw residuals, and these were absent from the products from paper
sludge. The NMR spectrum of the residuals from the wheat straw confirm that some
features of lignin structures survived the biorefining process (as evidenced by the
resonances at ca 56 ppm – for methoxyl, and at ca 145 ppm – for O-aromatic
functionality). The spectrum for the paper sludge residuals indicates that aromatic
functionalities were formed in the biorefining process, and there is evidence for O-aromatic
functionality. Surprisingly a considerable amount of aliphatic hydrocarbon was formed. The
resonance at ca 75 ppm suggests that a small amount of carbohydrate survived the
degradation.
The NMR spectrum for the hydrocarbon fuel clearly shows the symmetrical
resonance peak characteristic of chars, as seen for the spectra for the coarse and fine
moss chars.
518
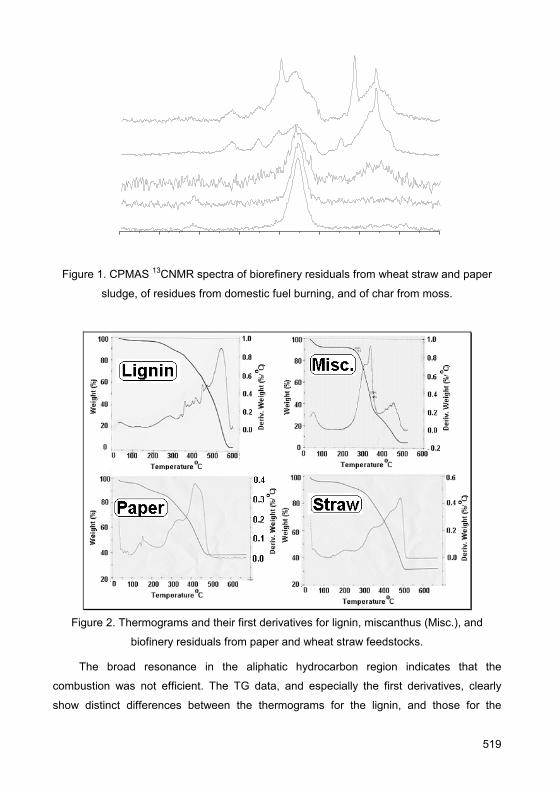
Figure 1. CPMAS 13CNMR spectra of biorefinery residuals from wheat straw and paper
sludge, of residues from domestic fuel burning, and of char from moss.
Figure 2. Thermograms and their first derivatives for lignin, miscanthus (Misc.), and
biofinery residuals from paper and wheat straw feedstocks.
The broad resonance in the aliphatic hydrocarbon region indicates that the
combustion was not efficient. The TG data, and especially the first derivatives, clearly
show distinct differences between the thermograms for the lignin, and those for the
519
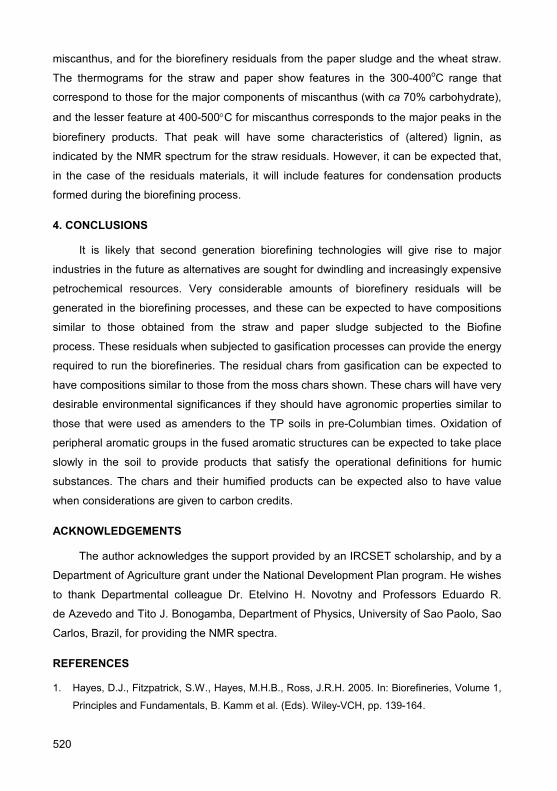
miscanthus, and for the biorefinery residuals from the paper sludge and the wheat straw.
The thermograms for the straw and paper show features in the 300-400oC range that
correspond to those for the major components of miscanthus (with ca 70% carbohydrate),
and the lesser feature at 400-500°C for miscanthus corresponds to the major peaks in the
biorefinery products. That peak will have some characteristics of (altered) lignin, as
indicated by the NMR spectrum for the straw residuals. However, it can be expected that,
in the case of the residuals materials, it will include features for condensation products
formed during the biorefining process.
4. CONCLUSIONS
It is likely that second generation biorefining technologies will give rise to major
industries in the future as alternatives are sought for dwindling and increasingly expensive
petrochemical resources. Very considerable amounts of biorefinery residuals will be
generated in the biorefining processes, and these can be expected to have compositions
similar to those obtained from the straw and paper sludge subjected to the Biofine
process. These residuals when subjected to gasification processes can provide the energy
required to run the biorefineries. The residual chars from gasification can be expected to
have compositions similar to those from the moss chars shown. These chars will have very
desirable environmental significances if they should have agronomic properties similar to
those that were used as amenders to the TP soils in pre-Columbian times. Oxidation of
peripheral aromatic groups in the fused aromatic structures can be expected to take place
slowly in the soil to provide products that satisfy the operational definitions for humic
substances. The chars and their humified products can be expected also to have value
when considerations are given to carbon credits.
ACKNOWLEDGEMENTS
The author acknowledges the support provided by an IRCSET scholarship, and by a
Department of Agriculture grant under the National Development Plan program. He wishes
to thank Departmental colleague Dr. Etelvino H. Novotny and Professors Eduardo R.
de Azevedo and Tito J. Bonogamba, Department of Physics, University of Sao Paolo, Sao
Carlos, Brazil, for providing the NMR spectra.
REFERENCES
1. Hayes, D.J., Fitzpatrick, S.W., Hayes, M.H.B., Ross, J.R.H. 2005. In: Biorefineries, Volume 1,
Principles and Fundamentals, B. Kamm et al. (Eds). Wiley-VCH, pp. 139-164.
520

Synthesis of Alkoxysilylated Humic Derivatives with Different Modification Rate Capable of Self-Adhering to Mineral Surfaces Leonid A. Karpiouk1, Irina V. Perminova1, Sergey A. Ponomarenko2,
Aziz M. Muzafarov2, Kirk Hatfield3 1Department of Chemistry, Lomonosov Moscow State University, 119992, Moscow, Russia,
[email protected] 2Institute of Synthetic Polymer Materials, Profsoyuznaya str., 70, 117393, Moscow, Russia 3Department of Civil and Coastal Engineering, University of Florida, 365 Weil Hall , Gainesville,
FL-32611, USA
Keywords: organosilans, humic, silica gel, modification, barrier
1. INTRODUCTION
The effective method to purify ground water is installation of Permeable Reactive
Barrier (PRB). A PRB is a subsurface wall of reactive permeable media emplaced across
the flow path of a contaminant plume. The plume is allowed to migrate passively through
the PRB and in the process contaminants are precipitated, sorbed, or degraded. A typical
PRB is costly to install but economical to maintain. Much of the installation cost is related
to the excavation of aquifer material that is then replaced with reactive porous media;
furthermore, these systems are typically over-designed to address uncertainties in
groundwater flow and to accommodate an anticipated loss of treatment efficiency with
time. Humic-based materials show considerable promise as refractory and inexpensive
reactive components for PRB. Due to a wide variety of functions, humic substances (HS)
can bind both heavy metals and organic contaminants. The contaminants bound into
humic complexes become non-toxic that causes a net reduction in toxicity of polluted
environments. The humic-coatings immobilized on the surface of granular support could
provide a very promising medium for sequestering contaminants dissolved in the ground
water. However, the naturally occurring HS do not produce covalent bonding with granular
aquifer support.
The goal of this work was to prepare the water-soluble derivatives of HS that have
been specifically modified to adhere to the mineral matrices which would facilitate in-situ
installation of humic barrier. A new approach was used for this purpose. It is aimed at
modification of carboxyl groups available within HS with 3-amino-propyltrimethoxy-silane
(APTS). To keep intact the intrinsic reactivity of HS with respect to metals, the derivatives
with different modification rates of carboxyl groups were obtained. Their capability to
adhere to the surface of silica gel was investigated.
521

2. MATERIALS AND METHODS
Leonardite humic acids – the main commercial source of humic acids - were used for
all modifications. They were isolated from the commercial potassium humate (Powhumus,
Humintech Ltd., Germany) and designated CHP. 3-amino-propyltrimethoxy-silane (APTS)
was used for treatment of CHP. The choice of APTS was provided by the presence of
reactive amino groups in its structure which can yield amide bonds upon reaction with
carboxyl and carbonyl groups (1, 2).
A weight of HA (1 g) was stirred with dry dimethyl formamide (DMF) and the
calculated amounts of silylation agent (APTS) were added to this mixture under continued
stirring to yield the derivatives with 5, 10, 20, 50, 100 and 200% modification degree. The
necessary amounts of APTS were calculated based on the content of carboxyl groups in
the CHP, which accounted for 3.5 mmol/g. Given the molecular weight of APTS of
180 g/mol, to obtain the derivatives with different modification degree, 0.05, 0.1, 0.2, 0.5,
1.0, 2.0 g APTS per one gram of CHP were used. The reaction was carried out at 120°C
for 20 hours. Then, DMF was evaporated and the derivative was dried in vacuum under
heating at 40°C. The obtained derivatives were designated as CHP-APTS-X, where X – is
a modification rate.
The sorption of modified HS on mineral support was studied using silica gel as
example of mineral support. For this purpose, the solutions of obtained derivatives in water
at concentration of 5 g/l were prepared and aliquots of 10 mL were added to 0.1 g of silica
gel. A decrease in derivative concentration in solution was measured using UV-vis
spectrophotometry. The carboxylic acidity was determined using calcium acetate method.
3. RESULTS AND DISCUSSION
The obtained derivatives were characterized using elemental analysis, titrimetric
techniques, SEC, 13С NMR and FTIR spectroscopy. FTIR spectra of the obtained
derivatives are shown in Fig. 1. They were normalized to the intensity of –CH2- peaks
(2920 cm-1) to provide for better comparison. It can be seen that along with an increase in
the modification degree, the intensity of COOH-peaks (1720 cm-1) decreased, whereas the
intensity of amide bonds (1690 cm-1) increased. This shows that the developed approach
allows to incorporate into the HA structure controllable amount of the alkoxysilyl groups.
The content of COOH groups in the original and modified HS are presented in Fig. 2.
The content of COOH groups is a particularly important parameter for APTS-modified
humic materials as it provides a direct estimate for the amount of residual carboxyl groups
522

non-reacted with APTS. Hence, it can be used to calculate the modification degree as a
ratio of the carboxyl-group reacted with APTS to the total amount of carboxyl groups.
Figure 1. FTIR spectra of APTS modified CHP with different modification grade.
Figure 2. The concentration of COOH groups in original and modified HA.
The sorption of the obtained derivatives onto silica containing minerals was studied
using batch experiments. It was shown that the sorption on silica gel depended on the
modification rate of CHP-APTS. The amount of immobilized CHP (mg) on 1 g of SiO2 is
shown in Fig. 3. It can be seen that the sorption affinity of the derivatives increased
drastically starting with the modification degree of 20% and reached its maximum value at
the modification degree of 100%.
523
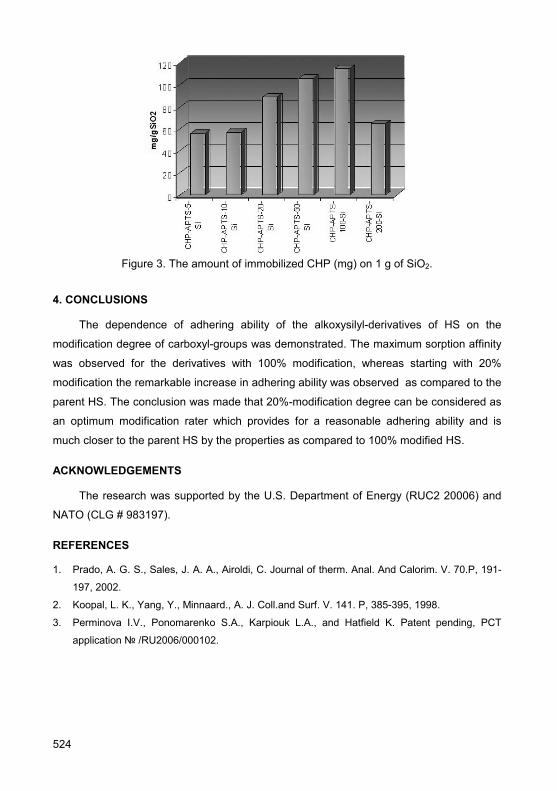
Figure 3. The amount of immobilized CHP (mg) on 1 g of SiO2.
4. CONCLUSIONS
The dependence of adhering ability of the alkoxysilyl-derivatives of HS on the
modification degree of carboxyl-groups was demonstrated. The maximum sorption affinity
was observed for the derivatives with 100% modification, whereas starting with 20%
modification the remarkable increase in adhering ability was observed as compared to the
parent HS. The conclusion was made that 20%-modification degree can be considered as
an optimum modification rater which provides for a reasonable adhering ability and is
much closer to the parent HS by the properties as compared to 100% modified HS.
ACKNOWLEDGEMENTS
The research was supported by the U.S. Department of Energy (RUC2 20006) and
NATO (CLG # 983197).
REFERENCES
1. Prado, A. G. S., Sales, J. A. A., Airoldi, C. Journal of therm. Anal. And Calorim. V. 70.P, 191-
197, 2002.
2. Koopal, L. K., Yang, Y., Minnaard., A. J. Coll.and Surf. V. 141. P, 385-395, 1998.
3. Perminova I.V., Ponomarenko S.A., Karpiouk L.A., and Hatfield K. Patent pending, PCT
application № /RU2006/000102.
524

Hybrid Sorbents on the Basis of Magneto-Active Nanoparticles and Humic Substances
Anar Zaripova1, Kamila Kydralieva1, Gulzhian Dzhardimalieva2, Svetlana Pomogailo2,
Nina Golubeva2, Anatolii Pomogailo2, Sharipa Jorobekova1 1Institute of Chemistry and Chemical Technology, National Academy of Sciences Kyrgyz Republic,
Chui pr. 267, 722071, Bishkek, Kyrgyzstan, [email protected] 2Institute of Problems of Chemical Physics Russian Academy of Sciences Ac. Semenov ave, 1,
Chernogolovka, Moscow region, 142432
Keywords: humic acids, magneto-active nanoparticles, magnetite, sorbent
1. INTRODUCTION
Problem of selective binding chemical and radiochemical contaminations became
especially urgent during last decades. Nowadays, the most efficient way of the binding
exo-toxicants of different chemical origin and radio-nuclides is using selective sorbents of
inorganic or polymeric origin. Introduction of inexpensive and active agents into the places
of storage or formation the wastes, should be one of the methods for the cleaning of the
environment. Lately, nano-structural materials find a wider application in the processes of
waste processing and decontamination (1, 2). In order to develop the sorbents with the
specified properties, it is rather prospective to use humic substances (HS) and their
derivatives. The prospects for practical application of HS and their derivatives as sorbents
is determined by huge resources of humus-containing materials, which include brown coal,
peat, sapropel and other causto-biolytes. The aim of the work is to prepare and
characterize of nanohybrid sorbents on the basis of HS and magneto-active nanoparticles.
2. MATERIALS AND METHODS
Commercially available potassium humate (Powhumus) produced by Humintech Ltd,
Germany as well as sodium humate (from the Sakhalin coal, pH of water solution 9.5) and
as humic acids after electrodialysis (nonsoluble in water) were used to obtain hybrid
magnetic active nanocomposites.
Mossbauer spectra were recorded on a spectrometer (WISSEL) with a Co57(Rh)
source in the constant acceleration regime. The calibration by rates was performed relative
to the spectrum of metallic α-Fe. The phase composition analysis of the nanocomposites
obtained was performed using X-ray diffractometry on a DRON-UM-2 diffractometer using
525

Cu(Kα) radiation. Characterization of samples by transmission electron microscopy (TEM)
was carried out by using a Hitachi H-7000 microscope.
3. RESULTS AND DISCUSSION
We have investigated several approaches for the preparation of magneto-active
nano-hybrid composite, including i) ex situ method which consists of the precipitation of
magnetic particles from Fe(II) and Fe(III) salts by addition of NH4OH followed by their
incorporation into the HS matrix and ii) a chemical precipitation method in situ when the
magnetic particles are grown within the HS matrix. According to X-ray diffractometry
studies the major phase formed during a chemical coprecipitation in the presence of humic
acid in situ is a magnetite Fe3O4 (Fig. 1). As it is well-known HS have strong affinity to the
surface of metal oxide particles (3). The absorption of humic acid on magnetic particles
surface leads to an enhanced electrostatic and steric stabilization of particles due to the
absorbed layer of highly charged macromolecular compounds. These syntheses reliably
produced systems that were stable in dry and colloidal state over periods of more than 3
months as evidenced by the consistency in their magnetic properties and a lack of
observable precipitation.
We have synthesized in the first time the Fe3O4 nanoparticles and humic acid hybrid
nanocomposite using mechanochemical method. The advantage of such approach is that
mechanochemical technique is particularly suitable for mass production because it is a
simple and inexpensive process. The average crystal size of the nanoparticles calculated
from diffraction peak half-widths according to Scherrer’s equation for the Fe3O4
nanoparticles and nanocomposites obtained was 16 nm. These results were agreed with
the Mossbauer data (Fig. 2) and electron microscopy studies (Fig. 3).
The humic acid macromolecule binds to the particles just after nucleation of the
Fe3O4 nanoparticles preventing further growth. The small size of the nanoparticles results
in a very large exposed surface area for heavy metals absorption that is achieved without
use of porous materials that introduce a high mass transfer resistance.
Some magnetic characteristics for the Fe3O4 – HS hybrid nanocomposites are
presented in Table 1. The hysteresis loops are closed and symmetrical versus origin of the
coordinate system. Shape of the loops evidences the ferromagnetic character of the
material desirable for their application to separation.
526

a b
Figure 1. XRD patterns of (a) the Fe3O4 nanoparticles-humic acids nanocomposite obtained by chemical coprecipitation method in situ and (b) the Fe3O4 nanoparticles-humic
acids nanocomposite obtained by mechanochemical method.
a b
Figure 2. Mossbauer spectra of (a) the Fe3O4 nanoparticles, (b) the Fe3O4 nanoparticles-humic acids nanocomposite obtained by mechanochemical method.
a
b
Figure 3. TEM images of the humate – Fe3O4 hybrid nanocomposite obtained by a
chemical precipitation (a) and electron diffraction (b).
50 nm
527
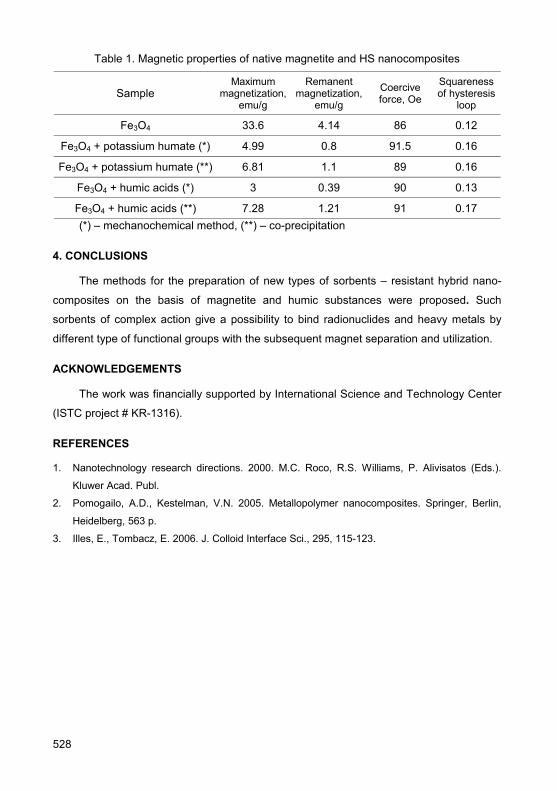
Table 1. Magnetic properties of native magnetite and HS nanocomposites
Sample Maximum
magnetization, emu/g
Remanent magnetization,
emu/g
Coercive force, Oe
Squareness of hysteresis
loop
Fe3O4 33.6 4.14 86 0.12
Fe3O4 + potassium humate (*) 4.99 0.8 91.5 0.16
Fe3O4 + potassium humate (**) 6.81 1.1 89 0.16
Fe3O4 + humic acids (*) 3 0.39 90 0.13
Fe3O4 + humic acids (**) 7.28 1.21 91 0.17 (*) – mechanochemical method, (**) – co-precipitation
4. CONCLUSIONS
The methods for the preparation of new types of sorbents – resistant hybrid nano-
composites on the basis of magnetite and humic substances were proposed. Such
sorbents of complex action give a possibility to bind radionuclides and heavy metals by
different type of functional groups with the subsequent magnet separation and utilization.
ACKNOWLEDGEMENTS
The work was financially supported by International Science and Technology Center
(ISTC project # KR-1316).
REFERENCES
1. Nanotechnology research directions. 2000. M.C. Roco, R.S. Williams, P. Alivisatos (Eds.).
Kluwer Acad. Publ.
2. Pomogailo, A.D., Kestelman, V.N. 2005. Metallopolymer nanocomposites. Springer, Berlin,
Heidelberg, 563 p.
3. Illes, E., Tombacz, E. 2006. J. Colloid Interface Sci., 295, 115-123.
528

Preparation and Characterization of Biodiesel Industry Waste Partially Carbonized Material in Order to Produce an Organic Soil Conditioner
Antonio S. Mangrich1, Etelvino H. Novotny2,3, Keller P. Nicolini1, Tito J. Bonagamba4,
André A. de Souza4, Eduardo R. deAzevedo4, Fernando Wypych1 1UFPR – CD, Curitiba, PR, Brazil, CEP - 81.531-990, [email protected] 2Embrapa Solos, Rio de Janeiro, Brazil 3Department of Chemical and Environmental Sciences, University of Limerick, Ireland 4Instituto de Física de São Carlos-Universidade de São Paulo, São Carlos, Brazil
Keywords: Biodiesel industry waste, partly carbonized material, soil organic conditioner
1. INTRODUCTION
This work seeks to determine the best methods of production of partly carbonized
waste of biodiesel industry – castor (Ricinus communis) meal – aimed at obtaining
material comparable to organic matter of soils Terras Pretas de Índios to be used as a soil
conditioner. The subject Terras Pretas de Índios has aroused interest in the international
scientific community that in recent years several articles and letters of Nature and Science
were devoted to the subject (e.g. 1, 2, 3) and The American Association for the
Advancement of Science (AAAS) organized a symposium in their annual meeting in 2006
with the title: Amazonian Dark Earths: New Discoveries.
This work corresponds to chemical studies in the sense of scientific knowledge and
technological development and innovation in the use of organic by-products, especially
from the biofuels industries, seeking the excellent performance of the so-called Terras
Pretas de Índios of the Amazon (4). In these work the carbonized materials were obtained
by controlled heating of different mixture of biodiesel industry tort with glycerol, starch as
industrial Brazilian by-product, and potassium sulfate (K2SO4) as a macronutrient
addictive. The obtained products were analyzed by EPR, NMR, and DRUV-Vis
spectroscopy.
2. MATERIALS AND METHODS
Samples preparation. In a closed furnace the samples were heating from the room
temperature (~300 K) to 773 K with the heating velocity of 1 0C min-1, and lifted at 773 K
for two hours. After returned to the room temperature the samples were recovered, milled
in a pot mill and sieved in an 80 meshes sieve. Details about the sample composition can
be found in the Table 1.
529
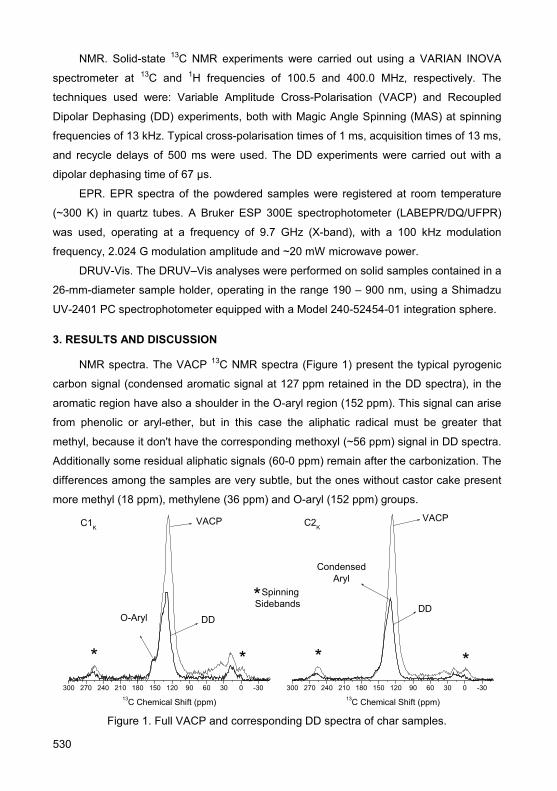
NMR. Solid-state 13C NMR experiments were carried out using a VARIAN INOVA
spectrometer at 13C and 1H frequencies of 100.5 and 400.0 MHz, respectively. The
techniques used were: Variable Amplitude Cross-Polarisation (VACP) and Recoupled
Dipolar Dephasing (DD) experiments, both with Magic Angle Spinning (MAS) at spinning
frequencies of 13 kHz. Typical cross-polarisation times of 1 ms, acquisition times of 13 ms,
and recycle delays of 500 ms were used. The DD experiments were carried out with a
dipolar dephasing time of 67 µs.
EPR. EPR spectra of the powdered samples were registered at room temperature
(~300 K) in quartz tubes. A Bruker ESP 300E spectrophotometer (LABEPR/DQ/UFPR)
was used, operating at a frequency of 9.7 GHz (X-band), with a 100 kHz modulation
frequency, 2.024 G modulation amplitude and ~20 mW microwave power.
DRUV-Vis. The DRUV–Vis analyses were performed on solid samples contained in a
26-mm-diameter sample holder, operating in the range 190 – 900 nm, using a Shimadzu
UV-2401 PC spectrophotometer equipped with a Model 240-52454-01 integration sphere.
3. RESULTS AND DISCUSSION
NMR spectra. The VACP 13C NMR spectra (Figure 1) present the typical pyrogenic
carbon signal (condensed aromatic signal at 127 ppm retained in the DD spectra), in the
aromatic region have also a shoulder in the O-aryl region (152 ppm). This signal can arise
from phenolic or aryl-ether, but in this case the aliphatic radical must be greater that
methyl, because it don't have the corresponding methoxyl (~56 ppm) signal in DD spectra.
Additionally some residual aliphatic signals (60-0 ppm) remain after the carbonization. The
differences among the samples are very subtle, but the ones without castor cake present
more methyl (18 ppm), methylene (36 ppm) and O-aryl (152 ppm) groups.
300 270 240 210 180 150 120 90 60 30 0 -30300 270 240 210 180 150 120 90 60 30 0 -30
DD
VACP
CondensedAryl
**
13C Chemical Shift (ppm)
C2K
*
VACP
DDO-Aryl
**
C1K
13C Chemical Shift (ppm)
SpinningSidebands
Figure 1. Full VACP and corresponding DD spectra of char samples.
530

Table 1. EPR parameters obtained of the studied samples
Sample Spins g-1 g-factor ΔH (mT)
C1 (starch : glycerol, 7:3) 5.59 x 10¹⁸ 2.0040 0.54
C2 (starch : glycerol : castor cake, 7:3:1) 6.17 x 10¹⁸ 2.0044 0.43
C1K (starch : glycerol : K2SO4, 7:3:1) 2.95 x 10¹⁸ 2.0044 0.53
C2K (starch : glycerol : castor cake : K2SO4, 7:3:1:1) 5.05 x 10¹⁸ 2.0042 0.40
Castor cake 6.34 x 10¹⁵ 2.0049 0.70
The non charred castor cake sample presents a typical organic free radical signal
(Figure 2) and the concentration of these organic free radicals, as determined by EPR
analysis, increases sharply (three magnitude orders greater) with the carbonization (Table
1). The values obtained in the charred samples are in the range of those already reported
for soil HA with large humification degree. On the other hand, the g-factor and peak-peak
linewidth decrease with the carbonization. The greater linewidth of non charred sample is
partially due to occurrence of two slightly different organic free radical centers
(unsymmetrical signal and second derivative – Figure 2).
346.0 346.5 347.0 347.5 348.0 348.5 349.0 349.5 350.0
**
2nd Der.CastorCake
CastorCake
C1
Magnetic Field (mT) Figure 2. EPR spectra of castor cake and char samples. The two partially overlapped
signals in the castor cake sample are star marked in the second derivative spectra.
531
The samples with K2SO4 (C1K and C2K) presented a smaller organic free radical
concentration than the corresponding samples without this salt; this could be explained by
their greater ash content causing a diluting effect. On the other hand, the samples with
castor cake in the mixture (C2 and C2K) presented a greater organic free radical
concentration.
The DRUV-Vis spectrum (data not showed) of the castor cake sample suggests the
existence of aryl-hydroxyl pigments, such as anthocyanins (reflectance bands at 219 and
264 nm (5)). The carbonization produces a very black char, with an almost equivalent
reflectance in the whole visible spectra. This feature can be attributed to the condensed
aromatic structure of pyrogenic carbon, as indicated by the NMR data showed.
4. CONCLUSIONS
The controlled heating of the mixture of industrial Brazilian by-products, biodiesel
industry castor cake, with glycerol and starch produced a material with some
characteristics of organic soil conditioner. EPR, NMR and DRUV-Vis spectroscopy, as
spectroscopic technique to analyze solid state samples, were vital to the obtained product
characterization.
ACKNOWLEDGEMENTS
The Irish Research Council for Science, Engineering and Technology (IRCSET) and
the Brazilian National Council for Scientific and Technological Development (CNPq) are
thanked for providing postdoctoral and research fellowships to E.H.N., T.J.B., E.R.A and
A.S.M.
REFERENCES
1. Harder B. 2006. Smoldered-Earth Policy: Created by ancient Amazonian natives, fertile, dark
soils retain abundant carbon. Science News 169: 133.
2. Marris E. 2006. Putting the carbon back: Black is the new green. Nature 442: 624-626.
3. Hayes MHB. 2006. Biochar and biofuels for a brighter future. Nature 443, 144
4. Novotny, E.H., deAzevedo, E.R., Bonagamba, T.J., Cunha, T.J.F., Madari, B.E., Benites, V.M.,
Hayes, M.H.B. 2007. Studies of the Compositions of Humic Acids from Amazonian Dark Earth
Soils. Environ. Sci. Tech., 41, 400-405.
5. Jaffé, H.H., Orchin, M. 1962. Theory and Applications of Ultraviolet Spectroscopy. New York,
pp. 242-258.
532

Interaction of Modified Humic Substances with Np(V): Influence of Monomer Nature on Redox Properties of Humic Substances
Natalia S. Shcherbina, Irina V. Perminova, Anna Bolkova, Anton N. Kovalenko,
Stepan N. Kalmykov, V.S. Petrosyan Department of Chemistry, Lomonosov Moscow State University, Leninskie Gory 1/3, Moscow
119991, Russia, [email protected]
Keywords: neptunium, humic, hydroquinone, modification, reduction, kinetics
1. INTRODUCTION
The complexation of radionuclides with humic substances (HS), which are ubiquitous
in the environment, is recognized as an important factor for the safety assessment of
geological disposal of radioactive wastes. HS possess a whole variety of functional groups
with prevailing contribution of carboxyls and hydroxyls. This provides for their redox and
complexation properties. As a result, HS impact substantially speciation of heavy metals
and radionuclides in the contaminated environments. Interactions of HS with neptunium
(Np) are of particular concern due to high radiotoxicity and long half-life of this actinide.
The most stable oxidation state of neptunium is (V) presented by dioxocation NpO2+. The
latter has a low ion charge which results in high migration ability of these species.
Interactions with mineral phases, complexation with different ligands and redox
transformation can strongly affect transport of Np(V). Besides inorganic ligands such as
carbonate, sulfate and phosphate, HS play an important role in speciation of Np in the
environment. Most of the models of HS–metal ion interaction assume that carboxylic
groups act as major complexing sites for metal ions (1, 2). At the same time, phenolic and
quinonoid groups are considered to be responsible for redox properties of HS (3). In our
previous publication (4) we have demonstrated that incorporation of additional
hydroquinone groups into backbone of leonardite humic acids (HA) resulted to a
substantial increase in reducing ability of the humic materials with respect to NpO2+.
The goal of this research was to find out if the kinetics of this reaction can be
improved by changing structure of the quinonoid center, nominally, by using methyl-
substituted hydroquinone.
The idea behind using the substituted hydroquinone for improving kinetics was the
known fact that the presence of methyl-substituent in the hydrioquinone ring hinders
formation of quinhydrone (5). The stability of quinhydrone slows down substantially
reactions with participation of non-substituted hydroquinones.
533

2. MATERIALS AND METHODS
All experiments were performed in Milli-Q-water (Milli-RO/Milli-QSystem, Millipore,
France) and in a glove box filed with nitrogen (99,9%). All reagents were of analytical
grade. The methods of HS modification and further characterisation have been previously
described in details by Perminova et al. (6). Oxidative polymerization with hydroquinone
and 2-methyl-hydroquinone was used to prepare hydroquinone- and 2-methyl-
hydroquinone derivatives of HS. Leonardite HA was used as parent humic material.
Study of Np(V) reduction under anoxic conditions was performed according to
method published elsewhere (4). Np(V) stock solution was prepared by dilution of the
NpO2NO3 solution (RIAR, Dimitrovgrad, Russia). Absorption spectra were collected using
UV/Vis-NIR spectrophotometer (Cary-50, Varian) outside the glove box in the wavelength
range between 950÷1030 nm. Absorption maxima for free neptunoyl and complexed form
were detected at 980,9 ± 0.2 nm and 987 nm, respectively (7).
The experimental concentrations of Np(V) and HS were maintained constant
6,62·10-5 M and 0,5 g/L, respectively; pH values was kept constant to 4.4±0.1.
3. RESULTS AND DISCUSSION
For the derivative characterization the methods of elemental analyses (C, H, N),
acidic group analyses, capillary zone electrophoresis, IR- and NMR-spectroscopy were
used. To quantify redox properties of HS redox capacities of HS were determined using
ferricyanide as a oxidizing agent (8). Results of HS redox capacity determination are
shown in Table 1. Among modified HS sample CHP – HQMe was of maximal redox
capacity that decreases in the following order: CHP-HQMe > CHP-HQ > CHP. From this
point of view we expected sample CHP-HQMe to be the most effective towards Np(V)
reduction.
Table 1. Redox properties of HS
Humic Substances Redox capacity, mmol/g Residual of Np(V), %
CHP 0.20 70
CHP–HQ 1.32 35
CHP–HQMe 1.55 45
Figure 1 represents kinetic curves for Np(V) reduction by humic derivatives. Np(V)
content reduces in time for all HS, even for parent HA. We tried to estimate the reaction
order of Np(V) reduction. The best approximation has been got for the kinetics of first order
reaction with respect to neptunoyl-cation. In frames of this approximation, concentration of
534
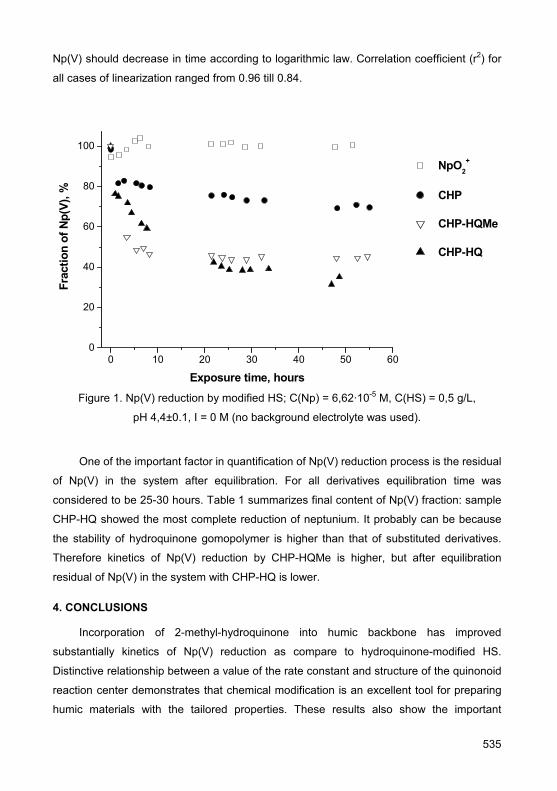
Np(V) should decrease in time according to logarithmic law. Correlation coefficient (r2) for
all cases of linearization ranged from 0.96 till 0.84.
0 10 20 30 40 50 600
20
40
60
80
100
Frac
tion
of N
p(V)
, %
Exposure time, hours
NpO2+
CHP
CHP-HQMe
CHP-HQ
Figure 1. Np(V) reduction by modified HS; C(Np) = 6,62·10-5 M, C(HS) = 0,5 g/L,
pH 4,4±0.1, I = 0 M (no background electrolyte was used).
One of the important factor in quantification of Np(V) reduction process is the residual
of Np(V) in the system after equilibration. For all derivatives equilibration time was
considered to be 25-30 hours. Table 1 summarizes final content of Np(V) fraction: sample
CHP-HQ showed the most complete reduction of neptunium. It probably can be because
the stability of hydroquinone gomopolymer is higher than that of substituted derivatives.
Therefore kinetics of Np(V) reduction by CHP-HQMe is higher, but after equilibration
residual of Np(V) in the system with CHP-HQ is lower.
4. CONCLUSIONS
Incorporation of 2-methyl-hydroquinone into humic backbone has improved
substantially kinetics of Np(V) reduction as compare to hydroquinone-modified HS.
Distinctive relationship between a value of the rate constant and structure of the quinonoid
reaction center demonstrates that chemical modification is an excellent tool for preparing
humic materials with the tailored properties. These results also show the important
535

application of specifically customized HS as a redox-agents in remediation technologies
concerning redox sensitive metal ions and organic contaminants.
ACKNOWLEDGEMENTS
This work was supported by joint research program of the U.S. DOE and Russian
Academy of Science (project RUC2-20006) and International Science and Technology
Centre (project KR-964).
REFERENCES
1. Marquardt, C.M., Kim, J.I. 1998. Radiochim. Acta 80, 129-137.
2. Nurmi, J.T, Tratnyek, P.G. 2002. Envir. Sci. Technol. 36, 617-624.
3. Sachs, S., Bernhard, G. 2005. Radiochim. Acta 93, 141-145.
4. Shcherbina, N.S., Perminova, I.V., Kalmykov, S.N., Kovalenko, A.N., Haire, R.G., Novikov,
A.P. 2007. Envir. Sci. Technol. 41(20), 7010-7015.
5. Cassidy, H.G., Kun K.A. 1965. Oxidation-reduction polymers (redox polymers). Wiley-.
Interscience, New York.
6. Perminova, I.V., Kovalenko, A.N., Schmitt-Kopplin, P., Hatfield, K., Hertkorn, N., Belyaeva,
E.Y., Petrosyan, V.S. 2005. Environ. Sci. Technol. 39(21), 8518-8524.
7. Keller, C. 1971. In: The Chemistry of the Transuranium Elements. Kernchemie in
Einzeldarstellungen. Vol. 3 (Leiser, K.H., ed.) Verlag Chemie GmbH, Weinheim.
8. Matthiessen, A. 1995 Vom Vasser 84, 229-235.
536

Microbial Oxidation of Humic Substances: Agricultural Consequences
James Ian Van Trump1, Nastassia N. Jones2, Laurie A. Achenbach2, John D. Coates1
1University of California, Berkeley, 271 Koshland Hall, 94720 Berkeley, CA, USA,
[email protected] 2Southern Illinois University, 1012 LSIII, 62901 Carbondale, IL, USA
Keywords: redox, nitrate, bacteria
1. INTRODUCTION
Humic substances (HS) are a ubiquitous, recalcitrant, and structurally diverse class
of organic material arising from degradation and condensation of plant and microbial
biopolymers. Previous studies have discovered a number of bacteria capable of catalyzing
the oxidation of reduced functional moieties within HS to their oxidized state, thereby
providing electrons for anaerobic respiratory processes (1). Hydroquinone moieties,
oxidized to their corresponding quinones, have been implicated as the main mediators of
such reactions (1-3). Microbial oxidation of model hydroquinone-containing compounds
and HS has been shown to support anaerobic respiratory processes such as reduction of
nitrate to dinitrogen gas (denitrification) and reduction of perchlorate to chloride (1,2). In all
cases, respiratory electrons are garnered from oxidation of hydroquinones to quinones,
rather than degradation of organic molecules.
The redox interplay between reduced HS and microorganisms is likely important in
agricultural soils where fixed nitrogen retention is critical and HS are prevalent. On the one
hand, microbial oxidation of HS may support loss of nitrate from agricultural soils via
respiratory denitrification reactions. On the other hand, microbial oxidation of HS impacts
the oxidation state of the humic molecule, which in turn influences the ability of HS to bind
chemicals of interest, such as organic pollutants and heavy metals (3). Given frequent
treatment of agricultural soils with pesticides and herbicides, it may be important to study
the redox transitions of HS in such environments, which may influence the fate, transport,
bioavailability, and bioaccumulation of these common environmental pollutants. In this
work, we illustrate the prevalence of HS-oxidizing, denitrifying bacteria in various
agricultural soils. Dynamic, flow-through column systems were used to model microbial
oxidation of HS under anaerobic, denitrifying conditions. Resulting geochemical data
indicated that redox state of HS within columns could be tracked as a function of space
and time, and corresponded stoichiometrically with observed levels of nitrate reduction
performed by mixed microbial communities. Similar columns containing model
537

hydroquinones as an electron donor indicate that the structure of microbial communities
undergoing hydroquinone oxidation differs from those oxidizing electron donors such as
acetate. This data suggests that HS oxidizing microbial communities may be distinct from
communities oxidizing other electron donor sources.
2. MATERIALS AND METHODS
All media and media components were prepared as previously described (1). Column
studies were performed with N2-sparged, phosphate-buffered water as a mobile phase.
For HS media, Aldrich humic acids were added to media in question, and chemically
reduced where noted (1, 3). Hydroquinone-containing media were generated by chemical
reduction of 2,6-anthraquinone disulfonate (AQDS) to the hydroquinone (AHDS) (1, 2).
Most probable number (MPN) series for HS-oxidizing bacteria in agricultural soils were
prepared as described in (1). All upflow columns were constructed with electron donor and
acceptor containing media being continually injected. Anions, redox state of HS or AHDS
(1-3), and other parameters were measured at sample ports spaced out along the column
length (1 being closest, 4 being furthest away from donor point source). At the end of the
experiment, columns were deconstructed and sectioned for subsequent microbial
community analysis. AHDS columns constructed from a sand matrix and inoculated with
10% w/w Strawberry Creek water were provided with nitrate and perchlorate as respiratory
electron acceptors. Electron acceptor utilization profiles were compared between acetate
and AHDS electron donor treatments. Humic columns were constructed from a glass bead
matrix, and inoculated 10% w/w with soil from a corn plot used in MPN analysis. Nitrate
was the only amended electron acceptor. Columns treated with acetate, oxidized HS,
reduced HS, and lacking electron donor amendment were compared.
3. RESULTS AND DISCUSSION
Soils collected from a Nebraska farm illustrated that hydroquinone-oxidizing, nitrate
reducing bacteria were prevalent in soils collected from all crop treatments. Results from
MPN analysis indicated that hydroquinone oxidizing, nitrate reducing bacteria were
present in soils from bluegrass fields (104 cells-g) and native wooded areas (106 cells-g), as
well as in plots of corn (106 cells-g), and soybean treated (106 cells-g) and un-treated (105
cells-g) with pig slurry. HS-oxidizing microbial isolates were collected from the MPN series
of each tested source soil, and were phylogenetically/physiologically characterized (data
not shown). Upflow columns were constructed utilizing soil from the corn plot of the MPN
series as inoculum. All columns were shown capable of nitrate reduction, including column
538
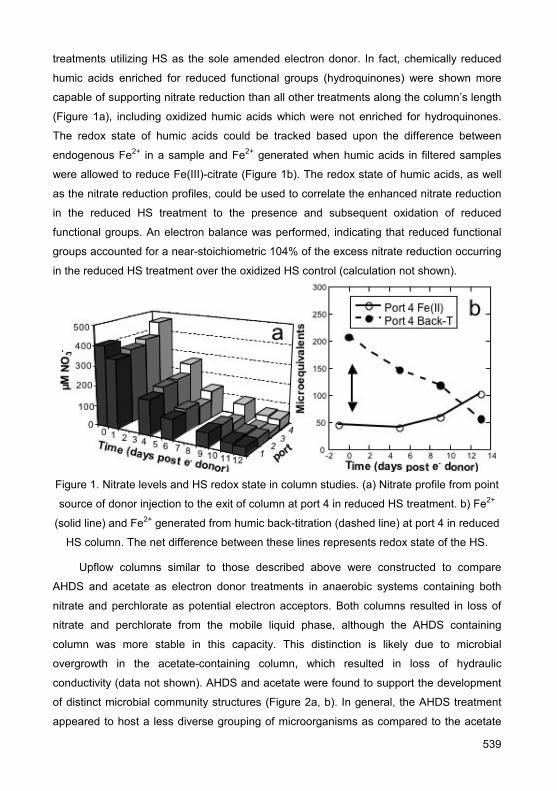
treatments utilizing HS as the sole amended electron donor. In fact, chemically reduced
humic acids enriched for reduced functional groups (hydroquinones) were shown more
capable of supporting nitrate reduction than all other treatments along the column’s length
(Figure 1a), including oxidized humic acids which were not enriched for hydroquinones.
The redox state of humic acids could be tracked based upon the difference between
endogenous Fe2+ in a sample and Fe2+ generated when humic acids in filtered samples
were allowed to reduce Fe(III)-citrate (Figure 1b). The redox state of humic acids, as well
as the nitrate reduction profiles, could be used to correlate the enhanced nitrate reduction
in the reduced HS treatment to the presence and subsequent oxidation of reduced
functional groups. An electron balance was performed, indicating that reduced functional
groups accounted for a near-stoichiometric 104% of the excess nitrate reduction occurring
in the reduced HS treatment over the oxidized HS control (calculation not shown).
Figure 1. Nitrate levels and HS redox state in column studies. (a) Nitrate profile from point
source of donor injection to the exit of column at port 4 in reduced HS treatment. b) Fe2+
(solid line) and Fe2+ generated from humic back-titration (dashed line) at port 4 in reduced
HS column. The net difference between these lines represents redox state of the HS.
Upflow columns similar to those described above were constructed to compare
AHDS and acetate as electron donor treatments in anaerobic systems containing both
nitrate and perchlorate as potential electron acceptors. Both columns resulted in loss of
nitrate and perchlorate from the mobile liquid phase, although the AHDS containing
column was more stable in this capacity. This distinction is likely due to microbial
overgrowth in the acetate-containing column, which resulted in loss of hydraulic
conductivity (data not shown). AHDS and acetate were found to support the development
of distinct microbial community structures (Figure 2a, b). In general, the AHDS treatment
appeared to host a less diverse grouping of microorganisms as compared to the acetate
539

treatment, including a strong enrichment of the Dechloromonas genera. Although acetate
treatments supported development of communities of the delta sub-class proteobacteria,
these were never present with AHDS as the electron donor. These results suggest that
hydroquinone and acetate donor treatments support development of different overall
microbial community structures, and that hydroquinones exhibit more selective pressure
on the final community make-up.
Figure 2. 16s rDNA clone libraries of microbial community structures near column exit
ports in acetate oxidizing (a) and AHDS oxidizing columns (b).
4. CONCLUSIONS
Bacteria capable of oxidizing HS or model hydroquinones were found to be prevalent
in agricultural soils. The activities of these microorganisms, including their oxidation of
reduced humic functional groups, could be tracked in flow-through systems.
Hydroquinones were furthermore found to support development of microbial community
structures distinct from those developing from acetate treatments.
ACKNOWLEDGEMENTS
We would like to thank Lonnie Spies and Karrie A. Weber for providing farm soil
samples
REFERENCES
1. Coates, J.D., Cole, K.A., Chakraborty, R., O'Conner, S.M., Achenbach, L.A. 2002. Appl.
Environ. Microbiol. 68. 2445-2452.
2. Thrash, J.C., Van Trump, J.I., Weber, K.A., Miller, E., Achenbach, L.A., Coates, J.D. 2007.
Environ. Sci. Technol. 41. 1740-1746.
3. Coates, J.D., Chakraborty, R., O'Conner, S.M., Schmidt, C., Thieme, J. 2001. Acta Hydrochim.
et Hydrobio. 28. 420-427.
540

TG Study of the γ-irradiation Effect on PVA with Addition of Sodium and
Ammonium Salts of Humic Acids
Barbora Bakajová1, Miloslav Pekař1, Michal Ilčin2, Jiří Kučerík1 1Institute of Applied and Physical Chemistry, Faculty of Chemistry, Brno University of Technology,
Purkyňova 118, 612 00 Brno, Czech Republic, [email protected] 2Slovak University of Technology, Radlinského 9, 812 37 Bratislava, Slovak Republic
Keywords: lignite humic acids, antioxidants, stability
1. INTRODUCTION
Due to increasing price of oil and its limited deposits, the availability of synthetic
antioxidants is becoming a potential barrier in development of products necessary for
sustainable way of life. From this point of view, the technological potential of lignites (low
rank coals with deposits all over the word and rich in humic substances) as a chemical raw
material has been up to now rather overlooked. Lignite humic acids consist of a mixture of
different organic molecules, while unsaturated fatty acids and polyphenols (having the
profound antioxidant effect) represent their major part (1). Thus, industrial application of
lignites or their humic components seems to be of a great interest in the near future.
Antioxidants in polymers can assure longer preservation of the initial structure by
acting as oxygen scavengers. Proper dose is important, because over dosage can be
detrimental. In our recent work we have demonstrated the antioxidant and pro-oxidant
potential of humic acids and its salts (2). In fact, addition of HA and their ammonium salts
in several concentrations caused an increase in polymer oxidation stability. In contrast,
when the degradation processes have already started, the presence of humic acids
supported faster degradation. As a result, using humic substances as additives, a material
with specific properties and stability can be developed. Further, environmental or
agriculture applications of humic substances in polymer materials seem to be promising
with respect to their natural origin. Due to their profound influence on soil properties, they
can serve as a kind of stable carbon-rich soil conditioner after the polymer life time
expiration.
The thermo-analytical methods have been extensively used to study stability of
various materials. They represent probably the easiest, most sophisticated and quickest
way to evaluate the influence of additives on polymer matrix properties. Generally, the
employment of thermo-analytical methods enables to predict stability and kinetics of
degradation of (not only) polymer materials. By means of a mathematical treatment the
541

non-isothermal data can be converted into isothermal values which can be simply used for
estimation of material durability at specified conditions.
In this work the effect of γ-irradiation on stability and degradability of PVA with
addition of sodium and ammonium lignite humates was investigated by TG measurements.
The aim of this work was, using γ-radiation pre-treatment, to adjust the stability of
humic/polymeric mixture to have required lifetime in natural system.
2. MATERIALS AND METHODS
Polymer/humic blends were prepared as reported earlier (2). Briefly, salts of lignite
humic acids were mixed with polyvinyl alcohol. Polymer blends were prepared at final
concentrations of humic acids sodium and ammonium salts (w/w) 0.5, 1, 1.5, 2, 5 and 10
%. γ-irradiation treatment was used to decrease the stability of polymer blends (exposure
from 22 to 140 days). As a source of gamma rays 60Co gamma-emitter with dose rate 0.26
kGy h-1 was employed. Thus, corresponding doses which were the samples exposed are
137, 524 and 873 kGy. The aim of this work was to monitor changes in stability of such
pre-treated blends by means of thermogravimetry and evaluate potential antioxidant effect
of humates after the γ-radiation treatment.
3. RESULTS AND DISCUSSION
Degradation of pure polyvinyl alcohol blend without addition of humates showed a
dramatic decrease of stability after γ-irradiation pre-treatment. In fact, γ-irradiation with
exposure dose 806 kGy caused the shift in the onset of degradation from 220°C to
approximately 100°C.
Examples of thermogravimetric records of thermo-oxidative degradation of sample
PVA enriched by 2% NH4HA irradiated by doses 127, 484 and 806 kGy during 22, 84 and
140 days, respectively, are given in Fig.1. Basically, within 100-250°C, the temperature, at
which a sudden decrease of weight was observed, was used as a measure of stability of
PVA. As we reported earlier the 2% ammonium humate enriched PVA blend is stable up to
245°C, therefore, the γ-irradiation causes the decrease in stability of PVA blends already
after 22 days (127 kGy) of exposure.
As reported earlier by Šimon (3) the onset temperature of degradation can be used
for the calculation of material stability at required temperatures. As one can see, the
sample which was exposed to lower dosage of γ-irradiation is stable up to 220°C, while
that with higher dosage to 130°C. According to literature data, such significant shift in
temperature to lower values means a dramatic decrease in durability of a material. In other
542
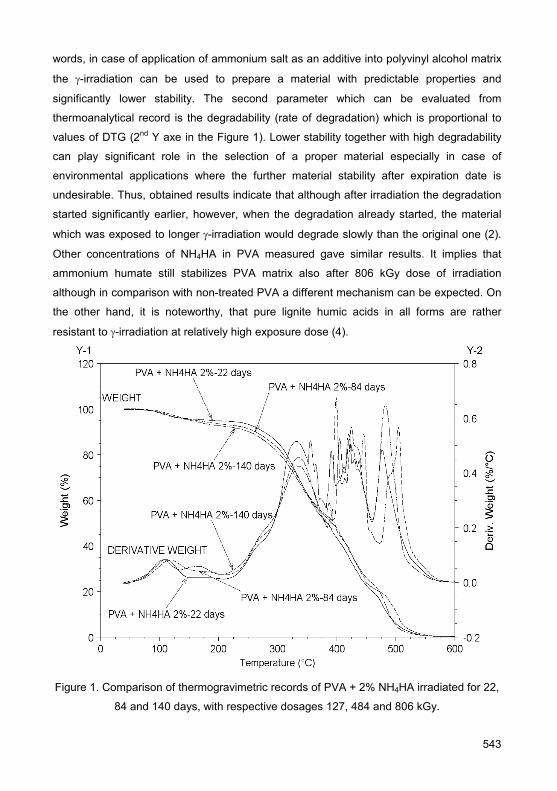
words, in case of application of ammonium salt as an additive into polyvinyl alcohol matrix
the γ-irradiation can be used to prepare a material with predictable properties and
significantly lower stability. The second parameter which can be evaluated from
thermoanalytical record is the degradability (rate of degradation) which is proportional to
values of DTG (2nd Y axe in the Figure 1). Lower stability together with high degradability
can play significant role in the selection of a proper material especially in case of
environmental applications where the further material stability after expiration date is
undesirable. Thus, obtained results indicate that although after irradiation the degradation
started significantly earlier, however, when the degradation already started, the material
which was exposed to longer γ-irradiation would degrade slowly than the original one (2).
Other concentrations of NH4HA in PVA measured gave similar results. It implies that
ammonium humate still stabilizes PVA matrix also after 806 kGy dose of irradiation
although in comparison with non-treated PVA a different mechanism can be expected. On
the other hand, it is noteworthy, that pure lignite humic acids in all forms are rather
resistant to γ-irradiation at relatively high exposure dose (4).
Figure 1. Comparison of thermogravimetric records of PVA + 2% NH4HA irradiated for 22,
84 and 140 days, with respective dosages 127, 484 and 806 kGy.
543

In our previous work (2) we showed that at certain concentrations the presence of
sodium humate can lead to the destabilization of PVA blend and increase the kinetics of
degradation processes. In the presented work sodium humates behaved in the same way
as ammonium humates did.
4. CONCLUSIONS
We demonstrated the potential of lignite humic acids salts to have an antioxidant
effect in PVA stabilization after γ-irradiation in comparison with pure PVA. Obtained results
indicate that humic acids salts were not influenced largely by the long term exposure of γ-
irradiation and they can still, or at least partly, stabilize the polymer material. Changes in
stability are promising with regards to the development of materials used in environment
and agriculture with predictable life time durability and degradability.
ACKNOWLEDGEMENTS
The financial support of Ministry of Education of the Czech Republic, project
MSM 0021630501 is acknowledged.
REFERENCES
1. Peuravuori, J., Žbánková, P., Pihlaja K. 2006. Fuel Process. Technol. 87, 829-839.
2. Kučerík, J., Bakajová, B., Pekař, M. 2008. Env. Chem. Lett. DOI: 10.1007/s10311-007-0129.
3. Šimon, P. 2006. J. Therm. Anal. Cal. 84, 263-270.
4. Bakajová B., Kučerík J. Unpublished results.
544

In vivo Algae Growth Monitoring in Sea Water Containing Production Water Treated with Humic Compounds
Raul A. Nunes1, Marcos H. de P. Mauricio1, Gloria M. Mauricio1, Eduardo de A. Brocchi1,
Marlise A.V. Araújo1 1Pontifícia Universidade Católica do Rio de Janeiro, DCMM, 22453-900 Rio de Janeiro, Brazil,
Keywords: laser fluorescence, production water, image analysis.
1. INTRODUCTION
In Brazil the most oil production is offshore. In this activity one important
environmental issue is the disposal of production water (PW). The PW is used to pump the
oil from reservoirs and, at the end of the process, it contains many different organic
compounds. More recently, the Brazilian Environmental Regulatory Agency has not
allowed direct disposal of the PW at the ocean. Nowadays, it is necessary to bring a large
amount of PW to a wastewater treatment plant on the coast, miles apart from the offshore
platforms, increasing the whole production costs.
Years ago, in an environmental monitoring scientific expedition, an increase of
fluorescence sign (∝ concentration) of chlorophyll close to offshore facilities (1) was
detected by a LIDAR (Light Detection and Ranging) system. This unexpected
phenomenon could have different causes, including euthrophication impact on the
analyzed region. To better understand it, a laboratorial study was proposed. This work
intended to survey the growth of a particular marine microalgae population, which is
frequently found in the Brazilian subtropical offshore ecosystems, in presence of
production water and production water treated with humic compounds. The main goal was
to evaluate the production water impact on marine water through microcosm simulations.
We were also interested to study the viability of the use of humic compounds as a pre-
treatment, before the final disposal of production water.
2. MATERIALS AND METHODS
A microcosm experiment was set up with the aim to monitor the growth of the
chlorophycea Tetraselmis gracilis during 17 days in different water conditions.
2.1 – Experimental design
30L of open sea water were previously filtered at 0.45 μm, autoclaved by 15 minutes
and leaved to cool down to room temperature. Supplemented sea water (SSW) medium
545

was prepared adding growth factors (P, K, vitamins, metal traces and Si) for optimal algae
growth.
Test tubes with 2L were used to support the different microcosm compositions as
described bellow:
1- Blank sample (blank): supplemented sea water and the algae culture.
2- Sample 1 (PW): blank sample + production water 2% (v/v)
3- Sample 2 (PW+humics): blank sample + production water treated with humic
substance 2% (v/v)
The microcosms were inoculated with a Tetraselmis gracillis culture, on exponential
phase, diluting the initial aliquot to reach a concentration of 5.10E3 cells. Each microcosm
was prepared in triplicate. All they were exposed to light 12hrs/day at 100±10 r and the
room temperature was kept at 25oC. The samples were constantly aerated and the test
tubes were covered with sterile gauze to avoid any external contamination.
2.2 – In vivo growth measurement
A LIDAR system was used to measure the fluorescence of each sample once a day
along the experiment. The LIDAR system consists of a Nd:YAG laser, with its 2nd harmonic
(532nm) used as the emission line source. The fluorescence response is captured using a
Newtonian telescope, which directs the light to a polychromator, followed by an image
intensifier and a linear CCD. The obtained fluorescence spectrum is proportional to the
chlorophyll a concentration.
2.3 – Cell density evaluation
At the beginning and at 8th day of the experiment, 1 mL of each sample was taken.
These were fixed using a phormol solution. From this solution an aliquot of 0.1 mL was
used for cell density evaluation with a fully motorized optical microscope. One hundred
images of each sample were taken and, applying a homemade image analyzing (2) script
in AxioVision software (3), the cells were counted and their size measured.
3. RESULTS AND DISCUSSION
The fluorescence measurements through LIDAR show an increase in chlorophyll a
concentration along the first 7 days, the start of the senescence, for all samples as can be
seen in Figure 1. It also can be noted that chlorophyll a concentration increases at higher
rates for samples 1 and 2. Both samples achieve higher values at senescence, with the
sample treated with humic substance presenting the highest concentration.
546

0 2 4 6 8 10 12 14 16 180
10
20
30
40
50
60
70
Inte
nsity
(a.u
.)
Time (days)
PWPW + humic
blank
0 2 4 6 8 10 12 14 16 180
10
20
30
40
50
60
70
Inte
nsity
(a.u
.)
Time (days)
PWPW + humic
blank
PWPW + humic
blank
Figure 1. Fluorescence intensity of chlorophyll a of the samples.
By optical microscopy and image analysis, the number of cells per volume and the
area of each cell were measured. In Figure 2 are shown images taken of (a) blank sample
and (b) sample 2 and the corresponding results of image processing (c and d). In Table 1
are summarized the obtained results for the number of algae per volume and the mean
area of each alga at the beginning and at the 8th day. Sample 2, which contained humic
substance, showed a strong increase in the number of algae per volume and also in their
size when compared with the blank, confirming the fluorescence results.
(a) (c)
(b) (d) Figure 2. Typical images of Blank Sample (a) and Sample 2 (b) after 8 days; Binary mask
images (c and d).resulting from image processing of original images.
547

Table 1. The number of algae and the mean area of a single alga at the beginning and at
the 8th day, for the 3 samples
Sample Density of algae(number of cells/volume) Area (μm2)
At start 2977 158±43
blank 1856 176±45
1 1803 236±67
2 4366 261±83
4. CONCLUSIONS
Both the fluorescence results and the microscopy analysis confirm an increase of the
total biomass in the samples with production water (1) and with production water treated
with humic substance (2) when compared with the sample only with supplemented sea
water (BS). In the case of sample 2, an increase of almost three times in chlorophyll a
concentration was determined. This can be explained by 50% increase of the algae
population and an enlargement of 100% of the alga mean size observed by microscopy.
So it becomes clear that the presence of humic substances aided significantly the algae
growth.
Through these results, it might be possible to explain the phenomenon of
concentration increase of chlorophyll a nearby the offshore platforms by the disposal of
production water in the ocean. It is possible that the organic compounds, present in
production water, increase the availability ov nutrients in the marine ecosystem.
ACKNOWLEDGEMENTS
The authors would to thank FINEP (Brazilian Agency for Studies and Projects) for
financial support and Dr. Sergio Lourenço from UFF for the supply of the algae culture.
REFERENCES
1. Barbosa, P. C. C.; Nunes, R. A.; Tabares, R. H.; Paciornik, S.; Fluorescence bands from
georeference LIDAR spectra of marine water mapped as RGB images. In: Remote Sensing,
Wessex Inst. of Tech. (Org.).Southampton, UK: Comput. Mech. Public., 1998, p. 143-152.
2. Paciornik, S. and Mauricio, M. H. P.; Digital Imaging. In: ASM Handbook, Volume 9,
Metallography and Microstructures. Voort, George Vander. (Org.). Materials Park, 2004, p.
368-402.
3. Axiovision v. 4.3 Carl Zeiss MicroImaging GmbH
548
New Mechanochemical and Cavitations Technology and Products Deep Chemical Modification of Peat
Maxim Efanov1, Alexander Galochkin2, Pavel Chernenko1, Vladimir Novozhenov1 1Altai State University, Avenue Lenin 61, 656049 Barnaul, Russia, [email protected] 2Ugorsky State University, Street Chekhova 16, 628012 Khanty-Mansiysk, Russia
Keywords: peat, humic acids, fulvic acids, oxide humates, technology deep chemical modification
1. INTRODUCTION
Complex use of peat is one of urgent tasks of a modern peat industry. Optimal in this
direction the way of deep chemical processing of all bioweight of peat is with the purpose
of reception directly from him (without division into separate components) various
polymeric materials (1). Significant interest in the applied plan represents oxide humates of
substance, which are recommended for application in quality humus stimulators of growth,
of fertilizers and is superficial - active substances. In work (2) it is offered to receive oxide
humates from peat by his oxidation of hydrogen peroxide in alkaline environment in rather
severe constraints at 125°С within 4 hours at the presence of salts cobalt and cuprum as
catalysts. Such ways allow receiving humus of fertilizer with an output 75-93% from
organic weight of peat containing connected cobalt and cuprum as microelements. One of
perspective methods of activation of peat for his chemical modifying is cavitations the
processing in water environment in cavitations devices (3). The peat subjected cavitations
processing in various environments, changes the chemical structure that results in his
activation.
Agrochemical the value of peat is determined in basic his organic part (humic and
fulvic acids) and contents of nitrogen in his structure. However owing to small availability of
organic substance the initial peat poorly shows properties of fertilizer. The activator of
organic substance of peat can be water ammonia, which takes humus of substance as
water solution humates of ammonium (2). The way of reception nitrogen contains of
organic fertilizer - ammonization of peat is known by processing peat of the certain
humidity by water ammonia. The basic lacks of a known way ammonization of peat are his
duration, which results in losses of ammonia, and also low contents of the connected
nitrogen in nitrogen contains of peat (1).
The way of reception stimulator of growth of plants from peat is developed by his
processing of hydrogen peroxide in environment of water ammonia at the hydro module
9,5:1, at the contents of ammonia 20-50% and contents hydrogen peroxide 20-30% on
549
absolutely dry weight of peat at 120°C during 4 h. This way has essential technological
lacks: high temperature of realization of process (120°C), duration up to 4 h, two stages of
process (4).
By us is developed new mechanochemical a way of reception nitrogen contains of
organic fertilizers by oxidation of peat hydrogen peroxide in water-ammoniac environment
with reception humus derivative with a quantitative output (5). However of works on regular
study of oxidation and oxidizing ammonolyse of peat in various environments in conditions
mechanochemical and cavitations of processing in the literature it is not revealed. In the
present message we submit development new mechanochemical and cavitations of
technologies of reception nitrogen contains humus of fertilizers and oxides humates from
peat.
2. MATERIALS AND METHODS
As initial raw material for mechanochemical oxidizing ammonolyse used top peat a
deposit of Tomsk Territory by humidity 60% containing 2.2% of general nitrogen, 13.8%
humic and 18.5% fulvic acids. As initial raw material for cavitation oxidizing used bottom
peat of a deposit of Altai Territory with a degree of decomposition 25%, zole 22.1%,
humidity 50% containing 2.1% of general nitrogen, 24.6% humic and 23.4% fulvic acids.
Mechanochemical synthesis nitrogen contains polymeric humic of preparations from
peat carried out by the following way. In cylindrical reactor vibro mill in capacity 300 cm3
wich 15 Steel cores of 10×100 mm (industrial vibrator, frequency 2800 mines- 1) load of
peat of weight 5.0 g, fill in 25% a water solution of ammonia (at the rate of 0.25-0.5 g
NH3/g peat), then add 30% a water solution of hydrogen peroxide (at the rate of 0.1-0.6 g
H2O2/g peat) also subject to intensive mechanical crushing during 0.5-3 h. Temperature in
the reactionary chamber –25°C. Further received products unload from a mill, separate
from mill of bodies and dry up on air before disappearance of a smell of ammonia. The
contents of general nitrogen and his forms defined on techniques given in a manual (6).
Cavitations processing of peat at the presence of an oxidizer (H2O2) and water alkali
carried out as follows. Sample initial of peat by humidity 50% of weights 2.0 kg previously
process 2-10% by a solution NaOH in cylindrical tubular reactor in capacity 10 litres,
connected with rotor cavitator by the device (frequency of rotation of a rotor 3000 rev/min)
at the hydromodule 1:2-4 during 15 mines at 60°C. Then in reactor add 50% a water
solution of hydrogen pxeroxide (at the rate of 0.025-0.2 kg of H2O2/kg of absolutely dry
peat) and received water suspense subject cavitations processing at temperature 60°C
during 15-60 minutes. Further received suspense pour out in 10 liter polyethylene
550

capacities. For the analyses received liquid himic of fertilizers take tests in capacity in
volume 1 litres. A deposit fugation, separate a liquid phase (target product) and in it define
the contents of general organic carbon, of carbon humic and fulvic acids by the modified
method Turin (6).
3. RESULTS AND DISCUSSION
In the table 1 the data on influence of duration mechanochemical of synthesis on the
contents of the connected nitrogen, humic and fulvic acids in products of oxidation top of
peat of hydrogen peroxide in water-ammoniac environment are given.
Table 1. Influence of duration mechanochemical treatment on composition nitrogen
contains of fertilizers from peat
The contents, % Sample Duration of crushing, h The contents of
general nitrogen, % humic acids fulvic acids
Initial top peat - 2.2 13.8 18.5
1 0.5 2.9 15.3 22.9
2 1.0 3.8 18.3 25.4
3 1.5 4.7 - -
4 2.0 4.9 18.2 27.1
5 2.5 5.1 - -
6 3.0 5.3 18.7 31.1 The note: humidity of peat - 60%, weight peat - 5.0 g, quantity of hydrogen peroxide -
0.1 g/g peat, quantity of ammonia - 0.25 g/g peat.
As show results of the carried out experiments (tab. 1), to increase of duration of
vibrating crushing of peat at the presence of ammonia and oxidizer (of hydrogen peroxide)
there is a natural increase of the contents humic and fulvic acids in structure of peat. The
increase of the contents of the connected nitrogen in 2.5 times for 3 h mechanochemical of
synthesis testifies to course of reaction oxidizing ammonolyse of organic substance of
peat.Influence of duration cavitations of processing also is investigated at 600C on an
output water solution of organic substances from the bottom peat. The results of research
are given in the table 2. As show results of the carried out experiments, at increase of
duration cavitations of processing of peat at 60 0C at presence of hydrogen peroxide in
water-alkaline environment, there is a natural increase of concentration water solution of
organic substances in the received extracts from 22 up to 39 g/l. For 60 mines of oxidation
551

of peat in conditions cavitations processing the output water solution of organic
substances make 39 g/l.
Table 2. Influence of duration cavitations of processing on an output water solution of
organic substances at oxidation of peat of hydrogen peroxide in a water solution NaOH*
Sample Duration of oxidation in conditions cavitations of processing, mines
The contents ofgeneral carbon,
g/l
The contents of general carbon humic acids, g/l
The contents of general carbon fulvic acids, g/l
Initial bottom peat – 80.5 41.2 39.3
1 15 22.3 12.2 10.1
2 30 26.4 15.2 11.2
3 45 32.5 19.3 13.2
4 60 39.3 22.2 17.1 *Duration preliminary alkaline cavitations of processing - 15 mines, quantity H2O2 -
5% from weight of absolutely dry peat, concentration of a solution NaOH - 2%;
temperature – 60°C.
4. CONCLUSIONS
Thus, the offered way for the account mechanochemical and cavitations of
processing provides intensification of technological process, reception of the highest
output water solution of organic substances in a target product with more simple and less
power-intensive way in comparison with analogues. Thus, is established, that the received
products of oxidation of peat of hydrogen peroxide in water-alkaline and ammonia
environment in conditions cavitations of processing are effective stimulators of growth of
plants.
REFERENCES
1. Gorovaya, A. Humus of substance. 1995. Kiev, 304p.
2. Naumova, G. Peat in biotechnology. 1987. Minsk, 158p.
3. Petrakov, A., Galochkin A., Efanov M. Patent of Russian Federation № 2296731. 2007.
Bulletin № 10.
4. Kasimova, L. Patent of Russian Federation № 2213452. 2003. Bulletin № 28.
5. Efanov, M., Galochkin, A., Antropov, L. Patent of Russian Federation № 2291138. 2007.
Bulletin № 1.
6. Orlov D.S., Grichina L.A. Practical work on biochemistry of humus. 1969. Moscow, 278p.
552
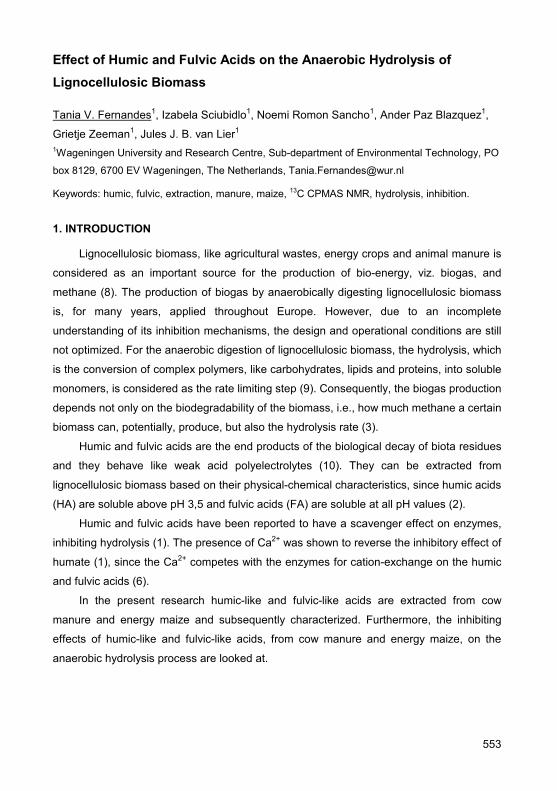
Effect of Humic and Fulvic Acids on the Anaerobic Hydrolysis of Lignocellulosic Biomass
Tania V. Fernandes1, Izabela Sciubidlo1, Noemi Romon Sancho1, Ander Paz Blazquez1,
Grietje Zeeman1, Jules J. B. van Lier1 1Wageningen University and Research Centre, Sub-department of Environmental Technology, PO
box 8129, 6700 EV Wageningen, The Netherlands, [email protected]
Keywords: humic, fulvic, extraction, manure, maize, 13C CPMAS NMR, hydrolysis, inhibition.
1. INTRODUCTION
Lignocellulosic biomass, like agricultural wastes, energy crops and animal manure is
considered as an important source for the production of bio-energy, viz. biogas, and
methane (8). The production of biogas by anaerobically digesting lignocellulosic biomass
is, for many years, applied throughout Europe. However, due to an incomplete
understanding of its inhibition mechanisms, the design and operational conditions are still
not optimized. For the anaerobic digestion of lignocellulosic biomass, the hydrolysis, which
is the conversion of complex polymers, like carbohydrates, lipids and proteins, into soluble
monomers, is considered as the rate limiting step (9). Consequently, the biogas production
depends not only on the biodegradability of the biomass, i.e., how much methane a certain
biomass can, potentially, produce, but also the hydrolysis rate (3).
Humic and fulvic acids are the end products of the biological decay of biota residues
and they behave like weak acid polyelectrolytes (10). They can be extracted from
lignocellulosic biomass based on their physical-chemical characteristics, since humic acids
(HA) are soluble above pH 3,5 and fulvic acids (FA) are soluble at all pH values (2).
Humic and fulvic acids have been reported to have a scavenger effect on enzymes,
inhibiting hydrolysis (1). The presence of Ca2+ was shown to reverse the inhibitory effect of
humate (1), since the Ca2+ competes with the enzymes for cation-exchange on the humic
and fulvic acids (6).
In the present research humic-like and fulvic-like acids are extracted from cow
manure and energy maize and subsequently characterized. Furthermore, the inhibiting
effects of humic-like and fulvic-like acids, from cow manure and energy maize, on the
anaerobic hydrolysis process are looked at.
553

2. MATERIAL AND METHODS
Fresh cow manure and silage energy maize were air-dried at 40°C and grinded to
particles smaller than 2 mm by a cutting mill (Retsch Muhle; type sm1). The samples were
further used for humic and fulvic acids extraction according to the methods developed by
the International Humic Substances Society (4). HA-like were sequentially extracted with
HCl and NaOH under nitrogen atmosphere. After the last acidification the HA-like
precipitate was dialyzed (Spectra/Por, MWCO 1000) against distilled water and finally
freeze-dried. FA-like were extracted with XAD-8 resin, purified with H+ saturated cation
exchange resin (Bio-Rad AG-MP-50) and finally freeze dried. All extracted humic-like
substances were stored in a desiccator.
Solid-state 13C Nuclear Magnetic Resonance (NMR) spectra were recorded using
Cross Polarization Magic Angle Spinning (CPMAS) on a wide-bore AMX 300 spectrometer
(Brucker, Karlsruhe, Germany) operating at 75.47 MHz of 13C frequency. The spinning
speed was 5 kHz, the acquisition time was 33 ms, the 13C 90° pulse length was 4 μs, the
contact time was 0.8 ms, the recycle delay was 1 s and the line broadening was 50 Hz
(11). For each spectrum, 800 to 1200 scans were recorded. The resulting spectra were
analyzed quantitatively according to (11), where the NMR spectrum is divided into four
types of carbon: alkyl (0-50 ppm), O-Alkyl (50-110 ppm), aromatic (110-160 ppm) and
Carbonyl (160-220 ppm). From the four types of carbon relative areas, four bio-
macromolecules were calculated: Aliphatics (lipids, biopolymers and fatty acids),
polysaccharides (cellulose and hemicellulose), proteins and lignins. The results were
presented in g bio-macromolecule per kg of volatile solids (VS). These four
biomacromolecules represent most of the organic matter produced by plant material (7)
3. RESULTS AND DISCUSSIONS
The extraction yields of humic-lke acids from cow manure and energy maize were
respectively 12,2 and 5,2% of VS and the extraction yields of fulvic-like acids from cow
manure and energy maize were respectively 1,4 and 0,7% of VS. Manure showed to have
higher yield of HA-like than maize. The relation between FA-like and HA-like remains
analogous for both lignocellulosic biomasses, being 0.12 for cow manure and 0.14 for
maize.
FA-like showed to have higher lignin content than HA-like from both manure and
maize, as shown in Table 1. Conversely, the polysaccharides from the HA-like were
almost four times higher than for the FA-like from both manure and maize. It is also
noticeable that the polysaccharides from the HA-like from manure were almost half of the
554
HA-like from maize, probably indicating their anaerobic degradation in the digestive track
of the cow. The content of aliphatics, viz., lipids and fatty acids, were low for the HA-like
and inexistent for the FA-like from both manure and maize, confirming the lignocellulosic
characteristics of this type of biomass.
Table 1. Lignin, polysaccharide, protein and aliphatic contents of HA-like and FA-like
extracted from cow manure and maize in g.kg volatile solids (VS)-1, obtained by 13C
CPMAS NMR. Data expressed as mean ± standard deviation
Lignin Polysaccharide Protein Aliphatic
HA-like from cow manure 353,8 ± 3,7 171,9 ± 2,0 450,9 ± 10,6 23,5 ± 6,3
HA-like from maize 233,2 ± 27,0 339,4 ± 73,9 345,3 ± 36,8 82,2 ± 10,3
FA-like from cow manure 406,5 ± 50,1 48,7 ± 21,8 591,9 ± 69,2 0
FA-like from maize1 553,6 86,6 425,8 0 1no duplicates analyzed.
Results of preliminary research show an increase of the hydrolysis rate of cellulose,
in the liquid fraction of digested cow manure medium, at increasing calcium addition.
The inhibitory effect of oxygen containing functional groups, viz., COOH and OH,
from extracted humic-like and fulvic-like acids of cow manure and energy maize, on the
hydrolysis is being evaluated and results will be included in the presentation for this
international meeting.
4. CONCLUSIONS
Cow manure has higher humic-like and fulvic-like acids than ensiled energy maize.
Cow manure has higher lignin content than ensiled energy maize.
Humic-like and fulvic-like acids might inhibit the anaerobic hydrolysis of
lignocellulosic biomass.
ACKNOWLEDGEMENTS
The authors would like to acknowledge SenterNovem, The Netherlands, for the
financial support.
555
REFERENCES
1. Brons, H. J., Field, J. A., Lexmond, W. A. C. & Lettinga, G. (1985). Influence of humic acids on
the hydrolysis of potato protein during anaerobic digestion. Agricultural Wastes, 13, 105-114.
2. Chen, C. L. and X. K. Wang (2007). Influence of pH, soil humic/fulvic acid, ionic strength and
foreign ions on sorption of thorium(IV) onto [gamma]-Al2O3. Applied Geochemistry 22(2), 436-
445.
3. El-Mashad, H. E.-M. H. (2003). Solar Thermophilic Anaerobic Reactor (STAR) for Renewable
Energy Production. Ph.D. Thesis, Wageningen University. Wageningen, pp. 238.
4. IHSS. 2007. International Humic Substances Society, Isolation methods for IHSS samples,
Isolate humic and fulvic acids from solid-phase source materials, Isolation of IHSS Soil Fulvic
and Humic Acids. http://www.ihss.gatech.edu/
5. Ladd, J. N. & Butler, J. H. A. (1970). Inhibition by soil humic acids of native and acetylated
proteolytic enzymes. Soil Biol. Biochem., 3, 157-160.
6. Nelson, P. N. and J. A. Baldock (2005). "Estimating the molecular composition of a diverse
range of natural organic materials from solid-state 13C NMR and elemental analyses."
Biogeochemistry V72(1): 1.
7. Reith J H, Wijffels R H , Barten H (2003). Biomethane and biohydrogen-status and perspective
of biological methane and hydrogen production, Dutch biological hydrogen foundation, The
Netherlands, pp118-125.
8. Sanders, W. T. M. (2001). Anaerobic hydrolysis during digestion of complex substrates. Ph. D.
Thesis, Wageningen University. Wageningen. pp. 101.
9. Stevenson, F. J. (1994). Humus Chemistry: Genesis, composition, Reactions. 2nd ed. John
Wiley & Sons, New York.
10. Veeken, A. H. M., Adani, F., Nierop, K. G. J., de Jager P. A., Hamelers, H. V. M. (2001).
Degradation of biomacromolecules during high-rate composting of wheat straw-amended
feces. Journal of Environmental Quality 30: 1675 – 1684.
556

Pyrolysis of Biomass and the Genesis and Oxidations of the Chars
Mike Jordan, Witold Kwapinski, Liam Leahy, Michael H.B. Hayes
Chemical and Environmental Sciences Department, University of Limerick, Limerick, Ireland
Keywords: char, pyrolysis, biomass
1. INTRODUCTION
The thermal conversion of biomass, under the complete or partial exclusion of
oxygen, gives rise to the production of biochar, bioenergy, and other bioproducts. Slow
pyrolysis technologies tend to favour the formation of char from lignocellulosic biomass.
Most of the remaining mass gives rise to non-condensable gases that are mostly utilised
for heat. There is growing interest in the potential value of the char from such processes.
The process of slow pyrolysis has been observed to give rise to desirable agronomic
properties of the chars that are attributable, in part at least, to the char ultrastructure.
A survey of the literature indicates that applications of biochar improve soil fertility.
This is partially attributable to the slow biological oxidation to carboxyl functionalities of
peripheral aromatic groups of the fused aromatic structures. The resulting humic acid-type
properties give rise to cation-exchange and moisture retention capabilities. Moreover, the
transformation, through the formation of char, of labile plant organic matter into stable C
pools reduces the release of greenhouse gas because charcoal is very slowly mineralized
in the soil environment. Biochar from fallow vegetation and organic wastes can readily be
produced by farmers and with economic benefits.
We are investigating experimentally the influences of various slow pyrolysis
procedures on the compositions and properties of chars. Biochar is generated in a
pyrolyser in oxygen restricted environments under controlled (time, moisture content,
temperature and pressure) conditions.
2. MATERIALS AND METHODS
Biochar was formed in O2 restricted environments under controlled temperatures
using bamboo as the biomass substrate. The biochar (provided by Robert Flanagan,
SAFFE, Hangzhou, China) was produced at temperatures of 400, 450, 500, 550 and
600°C. The reactions were carried slowly, and the temperature readings were taken using
Raytek infrared rather then the conventional method of reactor wall temperature. During
the course of the reaction the biomass was constantly moved around the reactor using a
557

paddle, and so it was crushed as it was being charred. The product was a dark powder-
like substance.
Three different agents, nitric acid, sodium hypochlorite, and hydrogen peroxide were
used for controlled chemical oxidations of the chars.
Humic and fulvic-type acids have been isolated from the controlled oxidations of the
char samples and the functional groups in these were characterized by Fourier transform
infrared (FT-IR) and by solid-state 13C nuclear magnetic resonance (NMR) spectroscopy.
Our FT-IR interpretations were based on contributions by Stevenson (1), and by
MacCarthy and Rice (2). Potentiometric titrations were carried out on the char samples
before and after the oxidations. The most comprehensive oxidations were obtained from
the treatment with nitric acid. Only results obtained from nitric acid oxidation of the char
obtained at 500°C are outlined in this communication.
3. RESULTS AND DISCUSSION
Figure 1. FT-IR of 500°C char before chemical oxidation.
The FT-IR range was 4000 to 400cm-1 and the scan rate was 11 scans per minute.
The FT-IR spectra of all samples showed an intense broad band around 3450-3350cm-1
attributed to O-H stretching of various functional groups, but most likely from water that
sorbed on the char surface. There is clear evidence for aromatic functionality in the cases
of the oxidised and control chars (Figures 1 and 2). The band at ~1538cm- in association
with that at ~1342cm-1 indicates that nitration of the char structures (3) had occurred
(Figure 2). There is clear evidence for the formation of carboxyl groups, based on the
carbonyl band at 1717 cm-1. This was also indicated by the titration data.
558
Figure 2. FT-IR of 500°C char after oxidation with HNO3 (4 hr).
The NMR spectra, before and after oxidation, show the typical symmetrical aromatic
resonances (centred around 125 ppm) characteristic of char material. The peak at 160-
175 ppm is from carboxylic acids formed as the result of the oxidation that gave rise to the
genesis of carboxylic acids. The shoulder at 145-150 ppm and the resonance between 50
and 60 ppm in the case of the char material before oxidation suggests that traces of lignin
had survived the char-making process. However, any such materials were oxidized by the
nitric acid treatment.
Figure 3. NMR Spectra Char 500°C before and after 4hr chemical oxidation by NHO3.
The NMR spectra clearly indicate that the core fused aromatic structures survive the
nitric acid oxidation process, and the oxidation was likely to involve only the peripheral
aromatic structures. As slow oxidation of char takes place in soil carboxylic acids will form
from the peripheral aromatic groups. These will confer cation-exchange properties
559

characteristic of indigenous soil humic and fulvic acids. In addition the persistence of the
char confers carbon sink properties to the char added to soil. Our ongoing studies are
investigating the surface areas and porosities of chars. Porosity is considered to be an
important feature of chars, and pore sizes may well be functions of the materials used in
their genesis, and of the methods of preparation employed. The pores are considered to
provide a refuge for microorganisms, such as Arbuscular mycorrhizal fungi. These form
symbiotic relationships with plant roots and extend the abilities of roots to take up soil plant
nutrients, and to improve moisture retention properties.
4. CONCLUSIONS
The research reported in this communication indicates that the essential features of
char can be retained when char materials are chemically oxidised with nitric acid. Because
N is incorporated in the char structures during the nitric acid treatment it may be possible
to include the N in this way and provide a source of slow release N. The research
programme will be extended to detailed investigations of the surface properties of chars
made from different substrates and under different conditions, and the microbial
colonisation and agricultural effectiveness of the products will be investigated in green
house and field plot experiments. Because of the inevitable introduction of second
generation biorefining technologies it will be important to study the properties of the chars
formed during the gasification of biorefinery residuals. These materials are likely to provide
valuable soil amenders. It will be important to investigate the agricultural effectiveness and
the economic viability of biochar as a soil ameliorant in parallel with investigations of the
bioenergy products from the pyrolysis of biomass and biorefinery residuals.
ACKNOWLEDGEMENTS
The work is part of a project supported by the Charles Parsons Initiative of the
Department of the Marine and Natural Resources. We acknowledge the assistance in
NMR provided by Etelvino H. Novotny.
REFERENCES
1. Stevenson, F.J. (1994) Humus Chemistry: Genesis, Composition, Reactions. Wiley, NY.
2. MacCarthy, P., Rice, J. A. (1985) In: Humic Substances in Soil, Sediment, and Water:
Geochemistry, Isolation, and Characterization. Wiley, NY, p 527-559
3. Trompowski, P. M., Benites, V., Madari, B. E., Pimenta, A. S., Hockaday, W. C., Hatcher, P.
G., (2005) ‘Characterisation of humic like substances obtained by chemical oxidation of
eucalyptus charcoal’
560

Retention of Plutonium on Model Kaolin-Humic Complexes
Vladimir Kholodov1, Alexander Novikov2, Tatiana Goriachenkova2, Irina Kozinskaja2,
Irina Perminova3 1Dokuchaev Soil Institute, Pyzhevskiy per. 1, 119017 Moscow, Russia, [email protected] 2Vernadskiy Institute of Geochemistry and Analytical Chemistry, Kosygina str. 19, 119991,
Moscow, Russia, 3Chair of Organic Chemistry, Department of Chemistry, Moscow State University, Leninskie gory,
119992, Moscow, Russia
Keywords: kaolin-humic complexes, plutonium, adsorption, desorption
1. INTRODUCTION
In terrestrial environments a substantial fraction of humic substances (HS) exists as
humic-clay colloids. Kaolinite is the most abundant clay mineral. Actinides transported
through soil horizons and aquifers can sorb onto colloids containing humics. Evaluation of
actinide retention onto humic-clay colloids is important for estimating actinide fate and
transport in the subsurface environment, as the presence of HS in groundwater may alter
the mobility sorbed actinides.
The goal of this work was to investigation the effect dissolved HS in groundwater on
the plutonium retention to kaolin a humic complex.
2. MATERIALS AND METHOD
A kaolin-humic adsorption complex was used as a model for humic-clay colloids.
Humic acid (HA) from brown coal were adsorbed to a suspension kaolinite colloid with
particle sizes <1 μm. Kaolinite (Kaolin CF 70) was obtained from Caminauer Kaolinwerk
GmbH, Germany. Particles <1 μm were obtained by ultrasonic treatment and separated by
centrifugation. The kaolinite suspension was then washed and saturated with Ca2+ in
0.001 M CaCl2 at pH 5.5. Commercially available potassium humate (Humintech Ltd,
Germany) was used to isolate humic acids (HA) of leonardite. Humic-kaolinite complexes
were created by adsorping HA onto kaolinite followed by subsequent sequential desorption
of weakly bound HS in 0.001 M CaCl2 at pH 5.5. 239Pu(V) was used for these experiments. Sorption of Pu(V) onto the model colloids
was studied using ultrafiltration through 30 kDa membranes. 0.001 M CaCl2 solution was
equilibrated with Pu(V) hydroxide during several weeks. Before ultrafiltration, colloids were
added to solutions containing plutonium and then diluted giving a respective colloid and
561

Pu(V) concentrations of 50 mg/L and 1.55×10⁻⁹ M. The strength of plutonium sorption was
estimated using fivefold washing of membranes with colloids using solutions of 0.001 M
CaCl2 and HA from brown coal in concentrations 0, 10, 25 and 50 ppm.
3. RESULTS AND DISCUSSION
Model colloids were saturated with Pu(V) and then washed with different HA -CaCl2
solutions as shown on Figure 1.
0
1
2
3
1 2 3 4 5
0102550
HA concentration, ppm
Des
orpt
ion,
% fr
om in
itial
so
rbed
Pu(V
)
Washing steps Figure 1. Desorption of Pu(V) from colloids wash in different HA-CaCl2 solutions.
Each HA solution of a given concentration desorbed approximately the same
quantity of Pu(V) for each washing step. This fact suggests colloid-Pu(V) systems were in
equilibrium. Generally Pu(V) desorption was limited (0.1-3 % from quantity sorbed Pu(V)).
The percent of Pu(V) desorped increased with increasing of HA concentration. Pu(V)
complexation with HA facilitated Pu(V) desorption from colloids. However, in the absence
of HA, 0.001 M CaCl2 desorped the most Pu(V). Probably in absence of HA Pu(V) is
partially displace by Ca2+ but in presence its Ca2+ is bounded of HA.
4. CONCLUSIONS
In this study, give evidence of Pu(V) desorption from kaolinite-humic colloids
occurring via effect of HA or Ca2+.
ACKNOWLEDGEMENTS
This work was supported by the U.S. Department of Energy (DOE Project: RUC2-
20006).
562

Synthesis, Biological Activity and Detoxifying Properties of Carbonylated Humic Substances
Sergey Li1, Kamila Kydralieva1, Natalia Kulikova2, Irina Perminova2, Sharipa Jorobekova1 1Institute of Chemistry and Chemical Technology, NAS KR, Chui pr. 267, 720071, Bishkek,
Kyrgyzstan, [email protected] 2Lomonosov Moscow State University, Moscow, Russia
Keywords: humic substances, carbonylation, detoxification
1. INTRODUCTION
It is known that functionally enriched humic substances possess high binding ability
in respect to heavy metals (1). The promising approach for enhancing detoxifying ability of
humic derivatives (HD) with respect to heavy metals is incorporation of C=O-groups into
the structure of humics. The objectives of this study were to synthesize and characterize
structure carbonylated humic materials and to estimate biological and detoxifying ability of
the obtained HD with respect to copper. It was expected that introduction of additional CO-
groups in the structure of humics would enhance their complexing and/or redox properties
and, hence, would lead to an increased detoxifying ability of humic derivatives with respect
to heavy metals.
2. MATERIALS AND METHODS
Humic acids (HA) of oxidized brown coal of two Kyrgyz deposits (Kara-Keche and
Kyzyl-Kiya) were used as parent material for subsequent modifications. Carbonylation was
performed by the treatment of HA by formic acid (Hatterman-Koch reaction). Elemental
analyses (C, H, N) were performed on a Carlo Erba Strumentazione elemental analyzer.
Oxygen contents were calculated as a difference. The H/C and O/C atomic ratios were
derived from the contents of the elements calculated on ash- and water-free basis. The
data of chemical analysis and molecular-mass distribution are presented in Table 1.
Size-exclusion chromatography (SEC) analysis was performed according to a
previous report (2). Redox capacity of humic materials was determined using ferricyanide
as oxidizing agent as described in previous issue (3). Biological activity of the preparations
was estimated by bioassay technique with seedlings. Seedlings of wheat Triticum
aestivum L. were used as a target, and a root length was used as a response.
563

Table 1. Elemental and functional group composition of the carbonylated derivatives
Content of elements on ash-free basis, % (mass) Content of functional groups, mmol/g
Sample C H N O H/C O/C Total
acidity COOH Ar-OH Ar-CHO
Humate Kara - Keche 65.5 3.9 1.0 29.6 0.71 0.33 7,54 3,84 3,70 1,70
Humate Kyzyl-Kiya 64.3 4.0 1.1 30.4 0.73 0.35 7.63 4.21 3.42 1.61
Carbonylated Kara - Keche 63.0 4.2 0.8 32.0 0.40 0.91 7,69 4,27 3,42 2,19
Carbonylated Kyzyl-Kiya 65.2 2.5 0.9 31.2 0.46 0.34 7.62 4.18 3.44 2.17
3. RESULTS AND DISCUSSION
0 10 20 30 40
Humate Kara-KecheCarbonylated Kara-KecheHumate Kyzyl-KiyaCarbonylated Kyzyl-Kiya
V, ml
Absorbance, a.u.
Figure 1. SEC-profiles of the parent humic material and carbonylated derivatives.
Chromatograms of all the parent humic materials and humic derivatives exhibited a
sharp single symmetric peak. This finding confirms that the SEC-fractionation was
conducted under conditions appropriate for the substances under study, as no artifacts
such as ionic exclusion or specific adsorption were observed (2). That was also indicative
for complete suppression of the surface negative charge of HA (ibid.).
Calculated values of molecular weight for all humic preparations are given in Table 2.
The HD were characterized with higher molecular weight Mw comparing with the
parent humic material. This finding was evident for the partial polymerization occurred.
The values for redox capacity of the parent humic materials were 0.20, for
Carbonylated Kara-Keche and Carbonylated Kyzyl-Kiya humics are 0.28 and 0.32 mmol/g
respectively. All the HD possessed redox capacity considerably exceeding that of the
564

parent humic materials. This finding was evident for increase in reducing capacity of humic
derivatives comparing initial samples.
Table 2. Peak molecular weight Mp, number-average molecular weight Mn, weight-
average molecular weight Mw, and polydispersity Mw/Mn of humic parent materials and
obtained derivatives
Derivative Cipher Mp, kD Mn, kD Mw, kD Mw/Mn
Humate Kara-Keche 6.9 1.5 8.2 5.5 Humate Kyzyl-Kiya 8.5 1.9 12.9 7.0
Carbonylated Kara-Keche 8.1 0.8 9.5 11.9 Carbonylated Kyzyl-Kiya 9.2 0.9 13.7 14.3
The results on detoxifying ability activity of the humic derivatives are given in Figure
2.
0
30
60
90
120
150
0 10 20 30 40 50
Humate Kara-Keche
Carbonylated Kara-Keche
Humate Kyzyl-KiyaCarbonylated Kyzyl-Kiya
Root length, % of control
Concentration of humic material, mg/l
b
Figure 2. Dose-response relationships in the presence of 1 mg/L of copper(II) for the
parent humic materials and carbonylated derivatives.
All the humic preparations studied significantly decreased toxicity of copper (Fig. 2).
At their concentrations 30-50 mg/L no copper toxicity was registered. At low
concentrations of HA (5-15 mg/L) the tendency was equal or slightly higher than that of the
parent sample was observed.
The calculated values of the toxicological binding constants of the humic materials
studied with copper(II) are given in Table 3.
It should be noted, however, that in all the cases of the carbonylated derivatives
examined strongly pronounced toxicity was observed (Figure 3) what made incorrect
calculations of toxicological binding constant KOCtox.
565

Table 3. The toxicological constants of copper binding to CHP-K+ and its derivatives
Derivative Cipher KOCtox, L/kg
Humate Kara-Keche 3.0×10⁵
Humate Kyzyl-Kiya 8.7×10⁵
Carbonylated Kara-Keche 4.0×10⁵
Carbonylated Kyzyl-Kiya 5.0×10⁵
0
30
60
90
120
0 10 20 30 40 50
Humate Kara-KecheCarbonylated Kara-KecheHumate Kyzyl-KiyaCarbonylated Kyzyl-Kiya
Root length, % of control
Concentration of humic material, mg/l
b
Figure 3. Dose-response relationships for the parent humic materials and HD.
4. CONCLUSIONS
The unknown phenomenon of humics biological activity was observed when
carbonylated derivatives served as copper antagonist. Both copper and humic derivatives
showed marked toxicity towards plant seedling when applied solely, while combined
application of the above substances resulted in pronounced beneficial effect on plant
growth.
ACKNOWLEDGEMENTS
This work was supported by grant of the International Science and Technology
Center (ISTC Project #KR-964).
REFERENCES
1. Perminova, I.V., et al. 2005. Design of quinonoid-enriched humic materials with enhanced
redox properties. Environ. Sci. Technol. 39, 8518-8524.
2. Perminova I.V., et al. 1998. Development of a predictive model for calculation of molecular
weight of humic substances, Wat. Res. 32, 872-881.
3. Matthiessen A. 1995. Determining the redox capacity of humic substances as a function of pH.
Vom Wasser 84, 229-235.
566

Extraction and Characterization of Organic Fractions isolated from a China Ball Clay Quarried in Devon South West England
Raymond McInerney1, John Stuart2, Etelvino Henrique Novotny1,3,
Michael Hilary B. Hayes1, Kevin Young2 1Department of Chemical and Environmental Sciences, University of Limerick, Ireland,
[email protected] 2WBB Minerals, Stoke on Trent, England 3Embrapa Solos, R. Jardim Botânico 1024, CEP 22460-000, Rio de Janeiro, Brazil
Keywords: China Ball Clay, organic fraction, humic, NMR
1. INTRODUCTION
China Ball clay has been used for centuries in the tiling and pottery-ware industry.
Because it is much finer than the other components in the casting slip the ball clay
dominates the particle-particle interactions. Therefore, the ball-clays give the cast its
plasticity and cohesion. The clay under investigation is a dark slightly sandy china ball
(DSSCB) clay with a high content of finely divided kaolinite and is mixed with other
substances for casting. Because of its surface area properties and its associated organic
matter it has an important influence on the cohesiveness and visco-elastic properties of
the clay bodies used in manufacturing pottery ware. The fine particles in the ball clays
have an important influence on the rheology of the wholebody, and stabilise the flow and
casting properties of the slip.
A number of analytical procedures have been used in this study in order to gain a
better understanding of the clays and their associated organic materials. Identification of
the amount and nature of the active organic fraction and of its mode of action is important.
The work described here is part of a larger project that investigates the chemical
properties and compositions of the clay and lignite materials, and the nature of clay-humic
complexes and of lignite materials in clay and lignite deposits.
2. MATERIALS AND METHODS
The ball clay was pre-washed with 1 M HCl acid followed by washing with distilled
water until the conductivity approached 200 µS. The ball clay was first exhaustively
extracted with 0.5 M NaOH from which one fulvic acid and two humic acid fractions were
isolated (samples FA1, HA1 and HA2), then (exhaustively) with 0.1 M NaOH plus 6 M urea
to give a ‘urea humic acid’ fraction (sample HAU). All extractions were in an atmosphere of
567
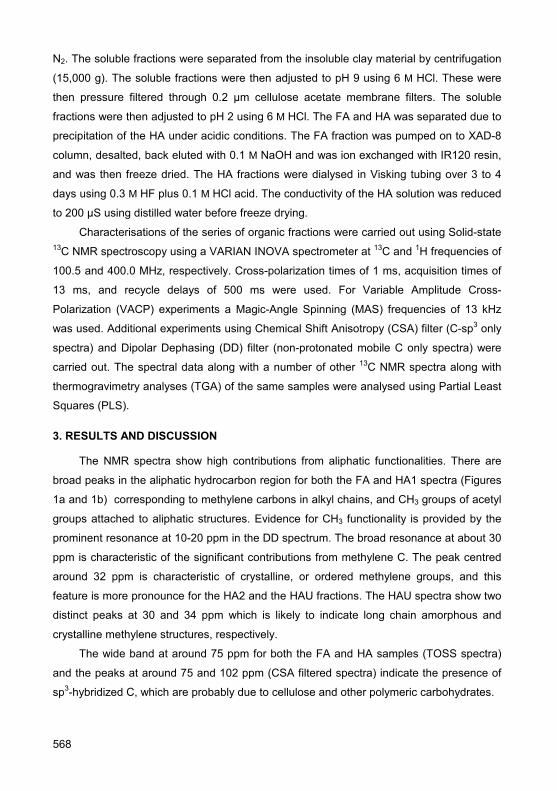
N2. The soluble fractions were separated from the insoluble clay material by centrifugation
(15,000 g). The soluble fractions were then adjusted to pH 9 using 6 M HCl. These were
then pressure filtered through 0.2 µm cellulose acetate membrane filters. The soluble
fractions were then adjusted to pH 2 using 6 M HCl. The FA and HA was separated due to
precipitation of the HA under acidic conditions. The FA fraction was pumped on to XAD-8
column, desalted, back eluted with 0.1 M NaOH and was ion exchanged with IR120 resin,
and was then freeze dried. The HA fractions were dialysed in Visking tubing over 3 to 4
days using 0.3 M HF plus 0.1 M HCl acid. The conductivity of the HA solution was reduced
to 200 µS using distilled water before freeze drying.
Characterisations of the series of organic fractions were carried out using Solid-state 13C NMR spectroscopy using a VARIAN INOVA spectrometer at 13C and 1H frequencies of
100.5 and 400.0 MHz, respectively. Cross-polarization times of 1 ms, acquisition times of
13 ms, and recycle delays of 500 ms were used. For Variable Amplitude Cross-
Polarization (VACP) experiments a Magic-Angle Spinning (MAS) frequencies of 13 kHz
was used. Additional experiments using Chemical Shift Anisotropy (CSA) filter (C-sp3 only
spectra) and Dipolar Dephasing (DD) filter (non-protonated mobile C only spectra) were
carried out. The spectral data along with a number of other 13C NMR spectra along with
thermogravimetry analyses (TGA) of the same samples were analysed using Partial Least
Squares (PLS).
3. RESULTS AND DISCUSSION
The NMR spectra show high contributions from aliphatic functionalities. There are
broad peaks in the aliphatic hydrocarbon region for both the FA and HA1 spectra (Figures
1a and 1b) corresponding to methylene carbons in alkyl chains, and CH3 groups of acetyl
groups attached to aliphatic structures. Evidence for CH3 functionality is provided by the
prominent resonance at 10-20 ppm in the DD spectrum. The broad resonance at about 30
ppm is characteristic of the significant contributions from methylene C. The peak centred
around 32 ppm is characteristic of crystalline, or ordered methylene groups, and this
feature is more pronounce for the HA2 and the HAU fractions. The HAU spectra show two
distinct peaks at 30 and 34 ppm which is likely to indicate long chain amorphous and
crystalline methylene structures, respectively.
The wide band at around 75 ppm for both the FA and HA samples (TOSS spectra)
and the peaks at around 75 and 102 ppm (CSA filtered spectra) indicate the presence of
sp3-hybridized C, which are probably due to cellulose and other polymeric carbohydrates.
568
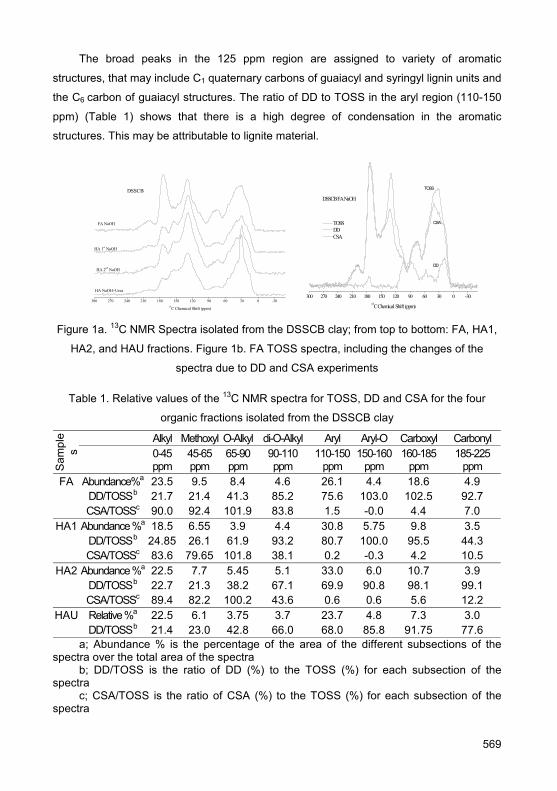
The broad peaks in the 125 ppm region are assigned to variety of aromatic
structures, that may include C1 quaternary carbons of guaiacyl and syringyl lignin units and
the C6 carbon of guaiacyl structures. The ratio of DD to TOSS in the aryl region (110-150
ppm) (Table 1) shows that there is a high degree of condensation in the aromatic
structures. This may be attributable to lignite material.
300 270 240 210 180 150 120 90 60 30 0 -30
DSSCB
HA NaOH+Urea
HA 2nd NaOH
HA 1st NaOH
FA NaOH
13C Chemical Shift (ppm)
300 270 240 210 180 150 120 90 60 30 0 -30
CSA
DD
TOSS
DSSCB FA NaOH
13C Chemical Shift (ppm)
TOSS DD CSA
Figure 1a. 13C NMR Spectra isolated from the DSSCB clay; from top to bottom: FA, HA1,
HA2, and HAU fractions. Figure 1b. FA TOSS spectra, including the changes of the
spectra due to DD and CSA experiments
Table 1. Relative values of the 13C NMR spectra for TOSS, DD and CSA for the four
organic fractions isolated from the DSSCB clay
Alkyl Methoxyl O-Alkyl di-O-Alkyl Aryl Aryl-O Carboxyl Carbonyl
Sam
ple
s
0-45ppm
45-65 ppm
65-90ppm
90-110 ppm
110-150ppm
150-160ppm
160-185 ppm
185-225 ppm
FA Abundance%a 23.5 9.5 8.4 4.6 26.1 4.4 18.6 4.9 DD/TOSS b 21.7 21.4 41.3 85.2 75.6 103.0 102.5 92.7 CSA/TOSSc 90.0 92.4 101.9 83.8 1.5 -0.0 4.4 7.0
HA1 Abundance %a 18.5 6.55 3.9 4.4 30.8 5.75 9.8 3.5 DD/TOSS b 24.85 26.1 61.9 93.2 80.7 100.0 95.5 44.3 CSA/TOSSc 83.6 79.65 101.8 38.1 0.2 -0.3 4.2 10.5
HA2 Abundance %a 22.5 7.7 5.45 5.1 33.0 6.0 10.7 3.9 DD/TOSS b 22.7 21.3 38.2 67.1 69.9 90.8 98.1 99.1 CSA/TOSSc 89.4 82.2 100.2 43.6 0.6 0.6 5.6 12.2
HAU Relative %a 22.5 6.1 3.75 3.7 23.7 4.8 7.3 3.0 DD/TOSS b 21.4 23.0 42.8 66.0 68.0 85.8 91.75 77.6
a; Abundance % is the percentage of the area of the different subsections of the spectra over the total area of the spectra
b; DD/TOSS is the ratio of DD (%) to the TOSS (%) for each subsection of the spectra
c; CSA/TOSS is the ratio of CSA (%) to the TOSS (%) for each subsection of the spectra
569

There are a number of similarities throughout, although some differences are apparent. The DD to TOSS ratio in the carbonyl group between the HA1 and HA2, 44.3 and 99.1 %, respectively, may indicate some protonated carbons in mobile macromolecules in the HA1 sample. The low CSA values in the aryl and O-aryl regions of the four spectra indicate that the peaks present in these regions are due to aromatic moieties.
The latent variable (60% of the variance from NMR data and 36% of TGA data) (Figures 2a and 2b) show the correlation between labile compounds and the thermal
events at 352, 360, 386 and 407°C respectively. The latent variable from NMR have positive and negative signals, the positive signals are probably due mainly to crystalline polymethylene and carbohydrates which have a positive correlation with the exothermic thermal events and negative signals indicating a negative correlation with carboxyl and aryl groups present.
-50 0 50 100 150 200 250 300-0.14
-0.12
-0.1
-0.08
-0.06
-0.04
-0.02
0
0.02
0.04
13C Chemical Shift (ppm)
100 200 300 400 500 600 700 800 900
Der
iv. W
eigh
t
Temperature (oC) Figures 2 a and 2 b showing the latent variance from 60% of NMR data
and 36% of TGA data
4. CONCLUSIONS 13C NMR has indicated compositional characteristics of the organic matter associated
with the clay matrix in DSSCB, and in combination with TGA in the PTS given insights into
their thermal properties.
ACKNOWLEDGEMENTS
We express our thanks to WBB Minerals, Stoke –on Trent, England for their support
for this work.
REFERENCES
1. Keeler, C. and G. E. Maciel, 1999. 13C NMR spectral editing of humic material
2. Konta,1995. Clay and man: clay raw materials in the service of man. Applied Clay Science,
10(4), 275-335.
570
Efficiency of Lignite as an Antioxidant for Polyolefines
Miloslav Pekař, Barbora Bakajová, Jiří Kučerík Institute of Physical and Applied Chemistry, Faculty of Chemistry, Brno University of Technology,
Purkyňova 118, 612 00 Brno, Czech Republic, [email protected]
Keywords: lignite, antioxidants, thermal analysis, stability
1. INTRODUCTION
A perusal of literature shows many scattered applications of humic substances or
humified substrates. Due to the high content of polyphenols and unsaturated fatty acids
these materials may exhibit an antioxidant effect when added to various polymeric
materials. Therefore it is reasonable to apply these materials as additives in polymers
used in specific applications.
In this work, we used thermal analysis to determine the antioxidant efficiency of
humic-rich South Moravian lignite applied as an additive at different concentrations in
polypropylene (PP) and high and low density polyethylene (HDPE and LDPE,
respectively).
2. MATERIALS AND METHODS
HDPE, LDPE and PP were melted and mixed (in an extruder) with milled lignite
having particle size up to tens of micrometers to obtain concentrations 0.5; 1; 2; 5; 10; 20;
30 % (w/w). The various mixtures were analyzed at seven different heating rates under the
oxygen flow by differential scanning calorimetry to assess their thermo-oxidative stability.
To estimate stability, the onset temperatures of degradation were measured.
Isoconversional methods allowing for induction period determination were used to
determine the stability of investigated material at 100°C (1). For this purpose three
different approaches were evaluated using Arrhenius and non-Arrhenius equations to
describe temperature effects (2). Obtained results were compared with that for the pure
polymer.
3. RESULTS AND DISCUSSIONS
Obtained results can be summarized in the following statements:
• Application of different temperature functions to fit the data gave slightly different
results regarding to the stability of polymers under study. The most reliable data
were obtained using the non-Arrhenius temperature function.
571

• Lignite added to HDPE, LDPE and PP showed a stabilizing effect at any
concentration, with some concentrations of lignite being more efficient. The
highest efficiency for PP was shown at a concentration around 5%, for HDPE at
10% and for LDPE at 30%.
• At the above-mentioned concentrations, the presence of lignite increased the
durability of HDPE 3 times, for LDPE 15 times and for PP 46 times.
• The composition of lignite also affected the physical structure of investigated
polymers. Application of antioxidants above a concentration around 5-10% is
quite rare in polymer industry and changes were observed in polymer physical
properties, mainly in their rigidity and elasticity.
4. CONCLUSIONS
Lignites represent raw materials with unique composition and high content of humic
substances. Up to now, however, they are used almost exclusively as a source of energy
in thermal power stations. Results of this work show one potential non-fuel application of
lignite – as a polymer additive. Lignite affects thermo-oxidative stability of common large-
scale polymers which can be attributed to its polyphenolic and unsaturated structures. In
agricultural practice, lignite-filled polymers could be used for production of multifunctional
mulching foils.
ACKNOWLEDGEMENTS
The financial support of Ministry of Education of the Czech Republic, project
MSM 0021630501 is acknowledged.
REFERENCES
1. Válková, D., Kislinger, J., Pekař, M., Kučerík, J. 2007. J. Therm. Anal. Cal. 89, 957-964.
2. Šimon, P. 2006. J. Therm. Anal. Cal. 84, 263-270.
572

Mitigating Activity of Humic Substances and their Si-enriched Derivatives in relation to Wheat Seedlings under Salt-Stress Condition
Olga I. Philippova1, Natalia A. Kulikova1, Leonid A. Karpiouk2, Galina F.Lebedeva1,
Irina V. Perminova2 1Department of Soil Science, Lomonosov Moscow State University, 119992, Moscow, Russia,
[email protected] 2Department of Chemistry, Lomonosov Moscow State University, 119992, Moscow, Russia
Keywords: humic, bioactivity, silicium, stress
1. INTRODUCTION
Humic substances (HS) are known to possess bioactivating properties in relation to
plants. Mitigating activity of HS is observed under various stress conditions including both
biotic and abiotic ones, therefore non-specific action of HS towards plants can be
hypothesized. The main non-specific damage induced by all the stresses is the plant cell
injury. As silicon is responsible for cell wall stability, artificial enrichment of HS with silicon
could results in increase in their mitigating activity.
This study was aimed to estimate bioactivating properties of coal humic acids and
their derivatives enriched in silica under salt stress conditions induced by 0.15 M NaCl.
2. MATERIALS AND METHODS
Leonardite humic acids were obtained by desalting of the commercial potassium
humate Powhumus – CHP-Pow (Humintech Ltd., Germany) and used for modification with
3-amino-propyltrimesthoxy-sylane (APTS) according to (1). Obtained derivatives were
designated as CHP-APTS-5, CHP-APTS-20, CHP-APTS-50, CHP-APTS-100, CHP-APTS-
200 and contained 2.58, 3.24, 6.44, 7.89, 11.27% of Si respectively.
To estimate mitigating activity of the CHP-Pow and produced derivatives, bioassay
technique with seedlings was applied. Seedlings of wheat Triticum aestivum L. were used
as a target object, and a length and weight of shoot was used as a response. Ten wheat
seeds were placed in Petri dishes with solutions containing 10 mL of 5, 10, 25, 50 mg/L of
parent humic material or humic derivatives. Distilled water was used for blank.
The stock solutions of humic materials were prepared by dissolution of a certain
amount of the sample in a small volume of 1M NaOH. Values of pH of all the solutions
were adjusted to 5.5-5.9 using 0.1M HCl. Seeds were grown for 72 hours at 25°C in the
dark. Then 5 seedlings from every dish were transferred to plastic pots containing 0.5 l of
573

Knopp’s nutrition solution for 96 hours. Salt stress was induced by sodium chloride
(0.15 M) when required. Then wheat seedlings were harvested and shoots’ and roots’
length and weight were measured. Based on the data obtained, length increase as a
difference between final and initial lengths was calculated. The experiment was performed
in duplicate.
3. RESULTS AND DISCUSSION
The obtained data demonstrated that introduction of 0.15 M NaCl resulted in
decrease in wheat seedlings growth. When seedlings were germinated in the presence of
both parent and modified humic materials, they were more resistant to the salt stress as
compared to those germinated in distilled water. At that, mitigating activity of used humic
materials was more pronounced in relation to the shoots rather than roots.
The results of bioassay experiments are presented in Figures 1 and 2.
0
10
20
30
40
50
60
70
0 10 20 30 40 50 60
CHP-PowCHP-APTS-5CHP-APTS-20CHP-APTS-50CHP-APTS-100CHP-APTS-200
Shoots length increase, % of blank
HS concentration, mg/l Figure 1. Concentration dependent wheat shoots’ length increase in the presence of
parent humic material CHP-Pow and its silicon derivatives under salt stress condition.
As it can be seen from the Figure 1, the most marked effect for CHP-Pow was
registered at concentration 10 mg/l and was 49.6% of blank. That value exceeded
significantly negative control (0.15 M NaCl), where increase of length was 37.6% of blank
value. Derivatives CHP-APTS-5 and CHP-APTS-50 demonstrated maximal beneficial
574

effect in relation to the shoots of wheat seedlings at concentrations of 5-10 mg/l (56.6-
61.7% and 56.6-52% of blank respectively). Responses of wheat shoots to treatment with
humic material CHP-Pow and its silica enriched derivatives at 25 mg/l gave no significant
difference. The exception was CHP-APTS-100, where the length increase was 55%. When
HS concentration was increased to 50 mg/l the maximum values were registered for CHP-
APTS-50 (50% of blank) and CHP-APTS-100 (55% of blank).
To reveal relationship between mitigating activity of HS and contents of silicon, data
on shoots’ length increase and weight at HS concentration of 50 mg/l were compared
(Figure 2). The highest values of both parameters were observed in case with CHP-APTS-
100 containing 7.89% of silicon.
20
30
40
50
60
0 2 4 6 8 10 12
Shoots length increase, % of blank
Si contents, %
20
30
40
50
60
0 2 4 6 8 10 12
Shoot weight,% of blank
Si contents, %
Figure 2. The influence of parent humic material CHP-Pow and its Si-enriched derivatives
of different silica contents on wheat shoots’ weight and length increase.
Therefore, Si-enriched humic derivatives were demonstrated to mitigate salt stress
injury of wheat seedlings. At that himic derivative with silicon content of about 8 % was
seemingly the most efficient.
4. CONCLUSIONS
The bioassay experiments with wheat seedlings aimed to estimate mitigating activity
of coal humic acids and their derivatives enriched in silica under salt stress conditions
induced by 0.15 M NaCl were performed.
The obtained results showed that both parents and Si-enriched humic materials
mitigated salt stress damage of wheat seedlings. Among studied HS, derivative CHP-
APTS100 with silicon content of about 8 % was seemingly the most efficient preparation.
575
Our findings indicated clearly that Si-enriched derivatives are the promising humic
preparations for the further research in the field of development of agricultural humic-
based materials.
ACKNOWLEDGEMENTS
The research was supported by Russian Foundation for Basic Researches (#06-04-
49017-a) and Interdisciplinary Scientific Program of Lomonosov Moscow State University
(project “Green chemistry and molecular descriptors of complex systems” in 2008).
REFERENCES
1. Leonid A. Karpiouk, Irina V. Perminova, Sergey A. Ponomarenko, Kirk Hatfield, 2006 In:
Humic substances - linking structure to functions, Frimmel F.H., Abbt-Braun G. (Eds.),
Proceedings of the 13th Meeting of the International Humic Substances Society, July 30 to
August 4, 2006, pp. 1033-1036.
576

Evaluation of the Quality Assurance of Ultrafiltration Separation for Humic Substances by Chemical Probes
Alex D. Revchuk1, I.H. (Mel) Suffet2 1Doctoral Student, University of California, Los Angeles, Room 46-081 CHS, Box 951772, UCLA,
Los Angeles, CA 90095-1772, [email protected] 2Professor, University of California, Los Angeles, Room 46-081 CHS, Box 951772, UCLA, Los
Angeles, CA 90095-1772, [email protected]
Keywords: ultrafiltration, membrane, probe, characterization, polyethylene glycols, dextrans,
polystyrene sulfonates, dyes
1. INTRODUCTION
The characterization of the molecular size of natural organic matter (NOM) is a
valuable tool when assessing the effect of this material on the performance of water
treatment systems as well as its geochemical origin (1). Size fractionation is usually
accomplished by size exclusion chromatography (SEC) or Ultrafiltration (UF). The UF
separation uses membranes with different cutoffs (e.g., 1, 5 and 10 kDa). Unfortunately,
membrane manufacturing generates a range of pore sizes and many membrane
manufacturers use molecular weight cutoff (MWCO) metrics based on a 90% retention of
given solute after specified duration of filtration (2). Present calibration studies are
incomplete and differ by manufacturer: usually a single brand of membranes and a limited
number of shaped and charged molecular probes are used (3-6). Thus, MWCOs are
subjective and depend upon the shape and charge properties of the solutes used.
The objective of this study was to characterize the MilliporeTM ultrafiltration
membranes YM 1 (1 kDa), PB 5 (5 kDa), YM 10 (10 kDa) with neutral and charged
molecules of various sizes and shapes. Polyethylene glycols (PEGs), dextrans,
polystyrene polysulfonates (PSSs) and highly charged dyes were chosen to be studied
under natural water quality conditions of pH and ionic strength. The goal is to develop, a
calibration curve to ascertain which fractions of NOM are retained by the membranes.
2. MATERIALS AND METHODS
In this study, Millipore YM 1000 and 10000 MWCO, and PB 5000 MWCO
membranes were used. PEGs were purchased from J.T. Baker, dextrans from Fluka,
polystyrene sulphonates from Polymer Standards Services and dyes from Fisher. Dyes
used in the study include bromocresol green (BCG), congo red (CR), methyl red (MR) and
577
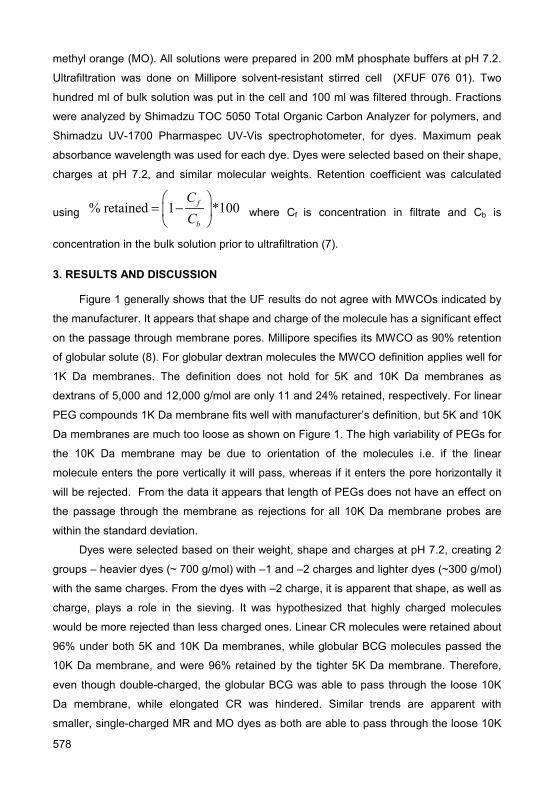
methyl orange (MO). All solutions were prepared in 200 mM phosphate buffers at pH 7.2.
Ultrafiltration was done on Millipore solvent-resistant stirred cell (XFUF 076 01). Two
hundred ml of bulk solution was put in the cell and 100 ml was filtered through. Fractions
were analyzed by Shimadzu TOC 5050 Total Organic Carbon Analyzer for polymers, and
Shimadzu UV-1700 Pharmaspec UV-Vis spectrophotometer, for dyes. Maximum peak
absorbance wavelength was used for each dye. Dyes were selected based on their shape,
charges at pH 7.2, and similar molecular weights. Retention coefficient was calculated
using % retained 1 *100f
b
CC
⎛ ⎞= −⎜ ⎟
⎝ ⎠ where Cf is concentration in filtrate and Cb is
concentration in the bulk solution prior to ultrafiltration (7).
3. RESULTS AND DISCUSSION
Figure 1 generally shows that the UF results do not agree with MWCOs indicated by
the manufacturer. It appears that shape and charge of the molecule has a significant effect
on the passage through membrane pores. Millipore specifies its MWCO as 90% retention
of globular solute (8). For globular dextran molecules the MWCO definition applies well for
1K Da membranes. The definition does not hold for 5K and 10K Da membranes as
dextrans of 5,000 and 12,000 g/mol are only 11 and 24% retained, respectively. For linear
PEG compounds 1K Da membrane fits well with manufacturer’s definition, but 5K and 10K
Da membranes are much too loose as shown on Figure 1. The high variability of PEGs for
the 10K Da membrane may be due to orientation of the molecules i.e. if the linear
molecule enters the pore vertically it will pass, whereas if it enters the pore horizontally it
will be rejected. From the data it appears that length of PEGs does not have an effect on
the passage through the membrane as rejections for all 10K Da membrane probes are
within the standard deviation.
Dyes were selected based on their weight, shape and charges at pH 7.2, creating 2
groups – heavier dyes (~ 700 g/mol) with –1 and –2 charges and lighter dyes (~300 g/mol)
with the same charges. From the dyes with –2 charge, it is apparent that shape, as well as
charge, plays a role in the sieving. It was hypothesized that highly charged molecules
would be more rejected than less charged ones. Linear CR molecules were retained about
96% under both 5K and 10K Da membranes, while globular BCG molecules passed the
10K Da membrane, and were 96% retained by the tighter 5K Da membrane. Therefore,
even though double-charged, the globular BCG was able to pass through the loose 10K
Da membrane, while elongated CR was hindered. Similar trends are apparent with
smaller, single-charged MR and MO dyes as both are able to pass through the loose 10K
578

Da membrane, while elongated MO is retained 94% and globular MR 41% on the tighter
5K Da membrane. Dyes were not tested at 1K Da membranes as the rejections were quite
high for looser 5K and 10K Da membranes. Dyes of about 700 g/mol with –1 charges will
be run to establish which parameter, shape or charge is more dominant during
ultrafiltration.
To simulate elongated highly charged NOM molecules, PSSs with high –1 charge
densities throughout the polymer were used. PSSs of similar sizes to the MWCOs were all
100% rejected by their respective membranes, as compared to neutral PEGs which were
able to partially pass through if properly oriented with respect to the pore. This result is
expected since dye molecules, which are at least an order of magnitude smaller than the
shortest PSS polymers, and with only a single –1 charge were retained by the membrane.
Figure 1 shows the “calibration curves” for the probes. The calibration curves indicate
that PEGs and dextrans cannot be used to define MWCOs whereas PSSs with their
evenly distributed negative charges follow the stated MWCOs of the membranes.
Although humics do not have an even charge distribution, they do contain charges and a
variety of polar and non-polar functional groups that make humics more comparable to
PSSs than to PEGs or dextrans. A variety of biomolecules with similar characteristics will
be used in future studies to characterize the membranes. Currently, a polarity rapid
assessment method (PRAM) is being developed which will be able to characterize NOM
by polarity and would be utilized in conjunction with UF, since charge and polarity together
play a significant role in the UF sieving process (9).
There is consistent reproducibility of the analysis especially for the 1 and 5 K Da.
Therefore the primary value of UF is completing comparative analysis of temporal or
spatial variation or between input and output of a water treatment process, and whether
there is a difference between 2 locations in a reservoir. SEC with the same polymer
probes is being studied to determine the relationship to MWCOs and if there is any
relationship between the gel and UF methods for size of samples.
4. CONCLUSIONS
The study shows that UF is not only a mechanical sieving process, but that charges on the
membrane and the constituent groups play a significant role in the rejection process.
Uncharged molecules larger than specified MWCOs are able to pass through pores, while
small charged molecule do not pass. Thus, fractionated NOM samples will contain a mix
quite different than what is expected by simple mechanical sieving. PSSs were found to be
representative of specified MWCOs while PEGs and dextrans were not.
579

01 02 03 04 05 06 07 08 09 0
1 0 0
0 1 0 0 0 2 0 0 0 3 0 0 0 4 0 0 0 5 0 0 0 6 0 0 0 7 0 0 0
M W (D a )
% R
ejec
tion
P E G s D e x t ra n s P S S s B C G C R M R M O
01 02 03 04 05 06 07 08 09 0
1 0 0
0 5 0 0 0 1 0 0 0 0 1 5 0 0 0 2 0 0 0 0 2 5 0 0 0
1 0 K M e m b r a n e
% R
ejec
tion
01 02 03 04 05 06 07 08 09 0
1 0 0
0 1 0 0 0 2 0 0 0 3 0 0 0 4 0 0 0 5 0 0 0 6 0 0 0 7 0 0 0
5 K M e m b r a n e
% R
ejec
tion
1 K M e m b r a n e6 0
6 5
7 0
7 5
8 0
8 5
9 0
9 5
1 0 0
0 5 0 0 1 0 0 0 1 5 0 0 2 0 0 0 2 5 0 0
M W (D a )
% R
ejec
tion
Figure 1. Rejection of probe solutes for 10, 5 and 1 kDa UF membranes.
ACKNOWLEDGEMENTS
Partial financial support of the City of Ft Collins, CO and project officer Judy Billica.
REFERENCES
1. Gerringer, F. W.; Rosario, F.; Suffet, I. H. J. of Env. Eng. and Management, In Press, 2008.
2. Fournier, R.L. Basic Transport Phenomena in Biomedical Engineering. Taylor & Francis 1999.
3. Van der Bruggen, B., et al., J Membrane Sci. 156, 29-41, 1999.
4. Causser and, C, et al., J. Membrane Sci. 238, 177-190, 2004.
5. Pedersen, J., et al., Env. Sci. & Tech. 1388-1397, 1999.
6. Akbari, A., et al., Chem. Eng. and Processing 41, 601-609, 2002.
7. Cherkasov, A.N., J. Membrane Sci. 110, 79-82,1996.
8. Millipore Corp., Ultrafiltration Disc Membranes for Stirred Cells and Micropartition System,
Tech Notes TN1000ENUS.
9. Rosario-Ortiz, F., Snyder, S. and Suffet, I. H., Env. Sci. & Tech. 41(14), 4895, 2007.
580

Results of a Study on Obtaining of the Humic Containing Plasticizers and Their Influence on the Physic-Mechanical Properties for the Cement and Concrete Mixtures
Radnaasediin Sanjaasuren1, E. Nordov1, Ts. Erdenebat1, S. Norjinbadam1 1Research Centre of Chemistry and Technology for New Materials, Faculty of Chemistry, National University of Mongolia, Ulaanbaatar, Mongolia, [email protected]
Keywords: plasticizer, humic substances, cement, concrete
INTRODUCTION
In the modernization of the technology on concrete the important significance has physical chemistry and colloid chemical ideas about mechanism and to the kinetics of the processes of structure formation in the dispersal systems and questions on the influence of different chemical additives, regulated performance properties of concrete. The chemical additives of the organic and inorganic origin, which are introduced into the composition of concrete they contribute to a change in the kinetics of forming of micro-, the macrostructure concrete mixtures due to the adsorptive modification of hydrated phases, formed in the initial setting time and hardening of the binding materials, decrease water-requirements, increase mobility and fluidity of concrete mixture, increase frost resistance and strength indices of concrete.
In recent years, for purposes of the modernization of the technology of concrete the new chemical additives superplasticizers, which are actually surface-active synthetic polymeric substances, widely are used. The countries of superplasticizers, in the industrially developed countries of superplasticizers obtain, in essence, from the individual chemical substances, such, as naphthenic acid, sulfonated naphthalene, melamine-formaldehyde oligomers, polycarboxylates, in connection with which, the cost of these supers-plasticizer is sufficiently high, which limits their uses in practice on a wide scale.
For the Mongolia when, almost they are absent the production of chemical substances, the development of the method of obtaining the plasticizers of high efficiency on the basis of natural organic raw material has great practical value for the production of concretes of different designation. By the purpose of this work is the experimentally substantiation of the method of obtaining the strongly acting plasticizer from the oxidized brown coal high the content of humic substances.
2. MATERIALS AND METHODS
The highly oxidized brown coal of Mongolia served as the starting material of experiment. The proximate analysis of the all-level sample from Baga-Nuur coal deposit face layer as oxidized brown coal, used in this work showed that the output of volatile substances composed about 50,0%, ash content -15,0%, humidity 11,3%. They composed
581
the element composition of all-level sample (to the combustible mass): C 65,34%, N 4,62%, N 1,27%, O 28,47% (by the weight difference).
The content of the humic acid, extracted by 1% solution of NaOH from this test composed approximately - 60% on the initial dry coal. With the well-known method of obtaining the sulfur-coal cationites on an industrial scale the sulfonation is achieved by an action of the concentrated sulfuric acid or by 20% solution of oleum. In this work for the sulfonation of the humus substances of brown coal was used, on an example of Kulgrena*, soft method sulfonation with the application of the sodium salts: NaHSO3, Na2SO3.
Presence of different functional groups in (- SO32-, COO-, CH3, CH; OH, SO2-, C=C-,
> C=O and other) for the end product were studied by the method of IR spectroscopic studies.
A quantity of chemically bound SO3 in the end product they were determined by the Eshka method and the average content SO3 in it was equal to 4,5-4,8%. The influence of the end product of synthesis sulfohumic formaldehyde condensate, in abbreviated form as SHFC on the kinetics structure formation of cement test were studied with the aid of conical plastometer of the construction of MSU. The effects of dosage SНFС on the setting time and after spreading cement test, and also water requirements and the strength of the concrete mixtures were studied by standard methods.
3. RESULTS AND DISCUSSION
It is established that the most suitable time of the process of the sulfonation of the oxidized brown coal (OBC) should be considered 12-14 hours, at a temperature of 120-130oC. The most rational quantity of components, for reacting of sulfonation and polycondensation were as following weitgh percent: OBC 14,75; Sodium sulfite 3,68; Sodium hydrosulfite 7,37; Formaldehyde 0,48; H2O the rest.
The proximate scheme of the reactions for obtaining sulfohumic-formaldehyde condensate it is possible to describe as follows:
1. Stage of the sulfonation: n (Ar- H) + n (NaHSO3 + Na2SO3) of → n [Ar (SO3Na)], where Ar - is the aromatic nucleus of humus substances in OBC. 2. Stage of polycondensation with formaldehyde:
Studies of surface activity δ= f (C SHFC) showed that the surface tension of aqueous solutions SHFC gradually is reduced and with CSHFC ~ 09% the surface tension of water it decreases to ~ 68 erg/cm2 (with the future with the increasing of the concentration of aqueous solution SHFC surface tension it barely changes).
The dependence of the kinetics of the increase of the plastic strength (rheological characteristic) of cement test on the dosage of additive SHFC (%) is represented in Fig.1
582

0
50
100
150
200
250
300
350
400
0 20 40 60 80 100
120
140
t, min
Pm, кг/с
м3
12345
Figure 1. Dependence of the increase of the plastic strength of cement test on the dosage of additive SHFC (%). 1 without the additive it is; 2 0,1% of SHFC; 3 0,9% SHFC; 4 1,5%
of SHFC; 5 0,5% of SHFC.
It is evident from Fig. 1 that during 10-15 minutes from the beginning of mixing with the concentrations of the additive SHFC=0.1, 0.9, 1.5 values of plastic strength are lower than in the system without the additive SHFC; beginning 30-40 minutes in the given systems it is observed the acceleration of an increase in the plastic strength in comparison with the system without the additive. When the concentration of addition SHFC =0,5%-Pm is noticeably more than in model without the additive SHFC.
Table 1, presents data on testing of the influence SHFC of lignosulfonate of sodium (obtained by us) and number of imported plasticizers on the strength indices of concrete mixtures.
Table 1. Results of the tests of influence SHFC, LST- SC and imported plasticizers for the concrete pressure strength*
Type of additives
Cement, kg
Sand, кg
Gravel, kg,
5-10 мм
Gravel, kg,
10-20 мм
Dosage of additive, g
Water, kg w/c
Compression strength,
28 day, mPa Control 3,6 4,6 4,7 4,7 0,0 1,16 0,30 32 SHFC 3,6 4,6 4,7 4,7 33 0,97 0,27 59
LST-SC 3,6 4,6 4,7 4,7 33 0,97 0,27 68 LS
Russian 3,6 4,6 4,7 4,7 33 0,97 0,27 74
LS Chinese 3,6 4,6 4,7 4,7 33 0,97 0,27 74
*Study was conducted by cubes of 100x100x100 mm, aqueous storage with the standard conditions; SHFC ~0,91% of the weight of cement. It is evident from Tabl.1 that the chemical products obtained by us LST- SC, SHFC increase the strength of concrete 1,8-2,1 in comparison with the strength of concrete without the additive. The strength of concrete with the additives SHFC is approximately on 10 mPa lower than with the use of
583
imported LST, but this fact apparently related with that circumstance that this dosage of additive for SHFC is not optimum, and also imported plasticizers have more complex composition in the plan of the content of additional chemical constituents.
4. CONCLUSIONS
1. Shown the possibility of obtaining sulfohumic - formaldehyde condensate, by being appeared as surfactant anion, from the oxidized brown coal with the high content humic containing of products by their sulfonation by the mixture of sulfites of sodium (Na2SO3+NaHSO3) and subsequent polycondensation with formaldehyde with the relatively soft conditions.
2. The infrared-spectroscopic studies SHFC showed that in this end product are contained such functional groups, as - COO-, SO2-, -OH, -SO3
2-, and structural elements as =CH-, -C=C-, -CH2-, -CH3.
3. SHFC, obtained by us they are characterized by high surface activity and adsorptivity on the surfaces of the finely dispersed particles of the basic cement minerals (C3A, C4AF).
4. Tests on the influence SHFC on the rheological, physic-mechanical properties of cement test and concrete mixtures showed that its application in the technology of concrete of the described
a. to decrease the water-required in concrete 15-20%; b. increases the mobility of cement test and concrete to 10 times; c. to increase the strength of studied test and concrete 1,5-1,8 times. 5. It is established that [SGFK], obtained from the oxidized brown coal, which are the
withdrawal of coal industry, satisfy basic technical requirements by that presented to the highly active plasticizers of group of chemical additives to the technology of concrete.
REFERENCES
1. Hannel C., et al., Interaction between cements and superplasticizers, proceeding of 12th Inter.Cong. on the Chemistry of Cement, 2007, Montreal, Canada
2. Bajhenov, U.M., Technology for concrete, -M.: ACB, 2003, -500p 3. Andreeva A.B., Plasticizing and hydrophobic additives to concrete, Moscow, 1998 4. Making superplasticizer by naphthalene containing raw material, Coke and chemistry, #2,
1991, p22-24 5. Additives doe concrete, Reference book, -M.: Stroiizdat, Trans from Engl., 1988, -575p 6. Lishtvan I.I., Cruglizkii N.N., Tretinnik V.U., Physic-chemical mechanics of Humic substances,
Moscow, “Science and technique”, 1976 7. Louis E, W, Edwin S.D, Wood chemistry, St.book, Moscow-Leningrad, 1959, p. 268
584

Humic Substances as Stabilizing Agents for Superparamagnetic Nanoparticles
Anastasia Chekanova1, Tatiana Sorkina2, Alexander Dubov1, Evgeny Goodilin1,
Natalia Kulikova3, Irina Perminova2 1Department of Material Science, Lomonosov Moscow State University 119992, Moscow, Russia 2Department of Chemistry, Lomonosov Moscow State University, 119992 Moscow, Russia,
[email protected] 3Department of Soil Science, Lomonosov Moscow State University, 119992 Moscow, Russia
Keywords: humic, biocompatible magnetic nanoparticles, γ-Fe2O3
1. INTRODUCTION
Magnetic fluids are stable colloidal suspensions usually containing ferrite-based
(MFe2O4) magnetic nanoparticles dispersed in organic or inorganic liquid carriers.
Magnetic fluids stable under physiological conditions are of great interest for potential
biomedical applications as contrast agents for magnetic resonance imaging (MRI) or
colloidal mediators for cancer magnetic hyperthermia. However, magnetic nanoparticles
without additional coating often tend to aggregate in water or tissue fluid limiting the range
of their applications (1). To prevent nanoparticles aggregation, modification of iron-oxide
nanoparticles by humic acids has been studied in the proposed research for the first time.
2. MATERIALS AND METHODS
Humic acids (HA) of brown coal derived from commercially available potassium
humate of leonardite were used for stabilization of oxide nanoparticles. The composite of
γ-Fe2O3-NaCl was obtained using aerosol spray pyrolysis method (ASP) as described in
(2). Sodium chloride was used to encapsulate nanoparticles. The aerosol stream was
burned in furnace at 650°-700°C. The as-prepared samples were examined by XRD, TEM,
Mössbauer spectrometry, magnetic measurements and dynamic light scattering (DLS). For
modification with HA, 2% solution of composite was prepared in 100 ppm HA solution at
pH 7 using ultrasonic bath. Stability of colloid obtained was monitored using DLS
measurements. Iron content in precipitate and fractions of different particle size was
determined using spectrophotometry analysis with o-phenantroline after oxidative
digestion of organic matter.
585

3. RESULTS AND DISCUSSION
The composite particles of γ-Fe2O3-NaCl obtained by ASP represent hollow
nanostructured microspheres consisting of ~50 nm nanoparticles. Mössbauer spectra
measured in the range of 300-16K proved the presence of metastable phase of
maghemite γ-Fe2O3. The isomer shift relative to α-Fe and quadruple splitting at 16K were
0.46 and 0.04 mm/s, respectively. The magnetic measurements illustrate the
superparamagnetic behavior of the particles. According to DLS results, the obtained
humic-composite colloid was composed of particles with a peak size at 145±60 nm
preserved within ten days of observation. According to the chemical analysis iron content
exceeds 4 mg per liter for the refined fraction of modified nanoparticles after ten days of
ageing.
02468
101214
1 10 100 1000 10000
Intensity, %
d, nm
Figure.1 Particles size distribution for magnetic nanoparticles obtained at 650oC and
stabilized by HA as measured by dynamic light scattering (DLS); (D=145±60 nm).
4. CONCLUSIONS
The prospects of novel applications of humic substances as stabilizing agents for
γ-Fe2O3 superparamagnetic nanoparticles in aqueous solutions were demonstrated.
REFERENCES
1. Pankhurst Q.A., Connolly J., Jones S.K., Dobson J.//J. Phys. D: Appl. Phys. 2003, 36, R167.
2. Widiyastuti W., Wang W.-N., Purwanto A., Lenggoro I.W., Okuyama K.//J. Am. Ceram. Soc.,
2006, 90(12), 3779.
586

Sorption of Np(V) onto Hybrid Clay-Based Materials: Montmorillonite-Melanoidin
Víctor Vicente Vilas1, Sabrina Rubert de la Rosa1, Jens Volker Kratz1 1Institute of Nuclear Chemistry, University of Mainz, Fritz-Straßmann-Weg 2, D-55128,
Keywords: melanoidin, neptunium, sorption, montmorillonite, composite, hybrid clay-based
materials
1. INTRODUCTION
Humic substances may be found in the interlayers of swelling clays (1). There are
many laboratory evidences of defined organic compounds absorbed into the interlayers of
clay minerals, but little is known about the existence of those complexes in natural soils,
due to the extraction methods, which are able to destroy the silicates. There is evidence
for the interlayer sorption of fulvic acids at pH below 5.0 (2), but the higher weight humic
acids may be too large to penetrate the interlamellar spaces (1). In order to simulate
natural conditions, a different approach has to be followed, i.e. the preparation of hybrid
clay-based materials (HCM) may throw new light on the problem as humic-clay-complexes
are likely to be formed in statu nascendi of the humic substances (3).
Melanoidins are polymers obtained after the condensation and dehydration of amino
acids and sugars; they were first described by Louis Camille Maillard (4) in 1912 and are
the products of a chemical reaction between an amino acid and a reducing sugar, usually
requiring the application of heat. The use of melanoidins as natural analogues has been
reported for the last years, in order to understand the reactions of humic substances with
the actinides. The most successful approach was the synthesis of the melanoidin M42,
which has similar properties to Aldrich Humic Substances (5).
Neptunium will become a major contributor to the radiation inventory in nuclear waste
due to the long half-life of its isotope 237Np (2.14•106 years). It can exist in the oxidation
states III – VII, but the cation NpO2+ dominates the aqueous speciation under a wide range
of environmental conditions.
The negative charge of smectites make this group of clay minerals extremely reactive
in soils, they are responsible for most of the swelling properties of soils. They are widely
distributed throughout the world, and montmorillonites and beidellites are the most
commonly found. Due to the little amount of iron, we chose the Texas montmorillonite STx-
1 for our investigations.
587

2. MATERIALS AND METHODS
The montmorillonite (STx-1) sample was supplied by the Clay Minerals Society; no
treatment was done with the montmorillonite before the synthesis. L-Glutamic Acid, L-
Tyrosine, and D(+)-Xylose (Merck, Darmstadt, Germany), were used for the synthesis of
the melanoidins and hybrid clay-based materials. The hybrid clay-based materials were
synthesized in a batch experiment starting from 16.5 g xylose, 13.5 g L-tyrosine or 11 g
glutamic acid, 3.2 g montmorillonite STx-1 and 150 mL of water. After reflux boiling
(100°C, 90 h) for L-tyrosine and (80°C, 90h) for glutamic acid (5). A brown solid was
formed, after centrifugation the solid product was ground with ethanol and ether (Acros
Organics), and again centrifuged. This solid was stirred with 150 mL 2 M NaOH (Merck) 8
hours under N2. After centrifugation the solid was again stirred with 100 mL 2 M NaOH
(Merck). After centrifugation the HCM were isolated, dialyzed using dialysis tubes
(Spectrum Laboratories Inc., exclusion limit MWCO <1000) against purified water and then
lyophilized.
The samples were pre-equilibrated at least 3 days; the equilibrium with CO2 was
accelerated by adding NaHCO3 and Na2CO3 (Merck). The pH was daily controlled and if
necessary readjusted with HClO4, or NaOH (Merck). The contact time with Np was 3 days,
after that, phases were separated using a Beckmann Coulter Avanti J-30I High
Performance Centrifuge (108 800g, 1 hour). For the determination of the organic
substances in the supernatant of the samples UV/vis-spectroscopy was used. 239Np(V) stock solution was produced by irradiation of 238U (UO2(NO3)2 x 6 H2O) at
the TRIGA Mainz research reactor at 100 kW for 6 h, followed by separation from uranium
and other fission products via anion-exchange chromatography (6). Higher neptunium
concentrations can be achieved with 237Np, which is also separated from fission products
using anion-exchange chromatography (6). 239Np can be determined by γ-spectroscopy
(lines 106.12 keV and 103.76 keV), 237Np is determined using Liquid Scintillation Counting
(LSC).
3. RESULTS
The yields for the reaction, concerning the HCM, are very similar for the synthesis
with L-tyrosine and with L-glutamic acid, indicating no preference in the reaction for any
reactant, e.g., L-tyrosine or L-glutamic acid. Similar yields were obtained while forming a
caramel-clay nanocomposite under MW irradiation (8). The composites were characterized
using NMR, XPS, SEM, STXM and DTA (9).
588
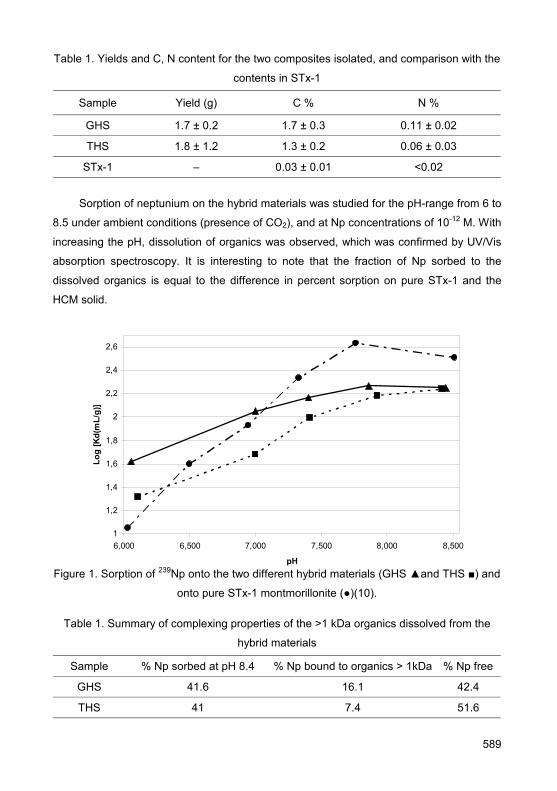
Table 1. Yields and C, N content for the two composites isolated, and comparison with the
contents in STx-1
Sample Yield (g) C % N %
GHS 1.7 ± 0.2 1.7 ± 0.3 0.11 ± 0.02
THS 1.8 ± 1.2 1.3 ± 0.2 0.06 ± 0.03
STx-1 – 0.03 ± 0.01 <0.02
Sorption of neptunium on the hybrid materials was studied for the pH-range from 6 to
8.5 under ambient conditions (presence of CO2), and at Np concentrations of 10-12 M. With
increasing the pH, dissolution of organics was observed, which was confirmed by UV/Vis
absorption spectroscopy. It is interesting to note that the fraction of Np sorbed to the
dissolved organics is equal to the difference in percent sorption on pure STx-1 and the
HCM solid.
1
1,2
1,4
1,6
1,8
2
2,2
2,4
2,6
6,000 6,500 7,000 7,500 8,000 8,500
pH
Log
[Kd(
mL/
g)]
Figure 1. Sorption of 239Np onto the two different hybrid materials (GHS ▲and THS ■) and
onto pure STx-1 montmorillonite (●)(10).
Table 1. Summary of complexing properties of the >1 kDa organics dissolved from the
hybrid materials
Sample % Np sorbed at pH 8.4 % Np bound to organics > 1kDa % Np free
GHS 41.6 16.1 42.4
THS 41 7.4 51.6
589
4. CONCLUSIONS
In situ polymerization of melanoidins in the presence of montmorillonite lead to hybrid
materials. The sorption of neptunium on those materials was investigated. The presence of
melanoidins in montmorillonite reduces the sorption of neptunium above pH 7 in
comparison with pure montmorillonite, due to the release of organic material from the
hybrid material into the aqueous phase. Below pH 7, the sorption on the HCM is
increased. This behavior assembles that of the sorption of actinide metal ions on kaolinite
in the presence of Aldrich humic acid (11).
The dissolution of organic material from the HCM samples points to the formation of
aggregates of organic material on the surface of the montmorillonite.
ACKNOWLEDGEMENTS
This work was supported by the DFG Interdisciplinary Research Training Group
“Trace Analysis of Elemental Species: Development of Methods and Applications” (GRK
826).
REFERENCES
1. Stevenson, F.J. 1982. Humus Chemistry; Genesis, Composition, Reactions, New York, Wiley-
Interscience, 443 p.
2. Schnitzer, M. and Kodama. 1967. H. Soil Sci. Soc. Amer. Proc., 31, 632.
3. Ziechmann, W. 1993. Humic Substances. Mannheim, Wissenschaftsverlag, 225 p.
4. Maillard L.C. 1912. C. R. Acad. Sci., 154, 66-68.
5. Pompe, S., Brachmann, A., Bubner, M., Geipel, G., Heise, K.-H., Bernhard, G., Nitsche, H.
1998. Radiochimica Acta, 82, 89-95.
6. Seibert, U.A. 1999. PhD Thesis, University of Mainz.
7. Kim, J.I., Buckau, G., Bryant, E., Klenze, R. 1989. Radiochim. Acta 48, 135.
8. Darder, M. & Ruiz-Hitzky, E. 2005. J.Mater.Chem. 15, 3913-3918.
9. Vicente Vilas, V., Drebert, J., Huth, J., Mathiasch, B., Ölcer, A., Reich, T., Rubert de la Rosa,
S., Schäfer, T., Kratz, J.V. 2007. Org. Geochem. in preparation.
10. Dierking, S. personal comunication
11. Buda, R.A., Banik, N.L., Kratz, J.V., Trautmann, N., Radiochim. Acta, submitted.
590

Section V
Industrial production, standardization and innovative application of humic materials

Primary Energy Production by Photoreduced Humic Materials
J. Ian Van Trump and John D. Coates University of California, Berkeley, 271 Koshland Hall, 94720 Berkeley, CA, USA,
Keywords: photoreduction, redox, bacteria
1. INTRODUCTION
Many bacteria are capable of generating energy for cell maintenance and growth by
oxidizing electron donors such as Fe(II) or hydroquinones within reduced humic
substances (HS) under nitrate-reducing conditions. Organisms capable of these
respiratory forms are prevalent in the environment, existing at up to 106 cells/g soil or
sediment in some environments (1, 2). However, the production of reduced humic material
or Fe(II) in relatively high-redox, nitrate-rich environments is poorly understood. Data
presented here indicates that exposure of HS to incident radiation can generate humic-
born hydroquinones and/or reduced functional groups capable of reacting with Fe(III) to
Fe(II). These results suggest that photoreduction of HS may act as a form of primary
energy production via two mechanisms. Firstly, generation of hydroquinones by the
photoreduction of HS represents a conversion of light energy into reducing equivalents
directly suitable for supporting respiratory processes such as nitrate reduction. Secondly,
indirect production of Fe(II) by the reaction of reduced HS functionalities such as
hydroquinones, semiquinones, or semiquinone radicals with Fe(III) offers an alternative
route for light energy to be converted to a bioavailable electron donor.
Quinones represent a major class of redox-active functional groups within HS (1). A
wide variety of model quinone compounds can be reduced to hydroquinones,
semiquinones, or semiquinone radicals in the presence of light (3, 4). Suitable electron
donors for these reactions include organic compounds, as well as inorganic compounds
such as H2O (3, 4). In this work, photoreduction of humic acids, as well as model
quinones, by full spectrum, UV, and gamma photons derived from isotopic decay is
observed. Photoreduced quinones are found to be directly bioavailable as electron donor
sources for model nitrate-reducing microorganisms. Further, photoreduced HS and
quinones were capable of chemically reacting with Fe(III) upon its introduction to the
solution in the absence of light, generating Fe(II). Although HS are known to
photosensitize the reduction of Fe(III), this work demonstrates that photoreduction of
humic material can lead to Fe(III) reduction in the absence of co-illumination.
593

2. MATERIALS AND METHODS
Anoxic solutions of Aldrich humic acids and/or 2,6-anthraquinone disulphonate
(AQDS) were prepared by dissolving the solute into 10mM phosphate-buffered nanopure
water containing 0.1g/L KCl, which was boiled and cooled under N2, anoxically dispensed
into serum bottles, and then autoclaved. Filtered (11μm pore size filters) creek water was
substituted for nanopure water where noted. Phosphate-buffered (10 mM) artificial
groundwater medium lacking bicarbonate (1) was also used where noted. For
photoreduction reactions, solutions were anoxically transferred to glass or fused quartz
tubing, gassed out with N2, and capped with thick butyl-rubber stoppers. Photoreductions
were carried out in light chambers equipped with full-spectrum or UV fluorescent lights
(ambient temperature varied between 35 and 45 degrees C). Photoreduction was also
achieved by exposing humic solutions dispensed in anoxic glass vials to gamma radiation
derived from decay of a Cs-137 source (total exposure of approximately 4.8 kGy).
Reducing equivalents from photoreduced HS or AQDS were quantified by iron back-
titration as previously described using ferric citrate, FeCl3, or synthetic amorphous ferric
(hydr)oxides as a titrant (1). Production of Fe(II) was monitored via the ferrozine assay.
Microbial experiments with Azospira suillum were performed under growth conditions as
previously described (1).
3. RESULTS AND DISCUSSION
Initial photoreduction experiments were conducted in anoxic glass tubes. Artificial
groundwater medium amended with 5mM AQDS underwent a gradual color change from
yellow to red over an 8-hour period when exposed to full-spectrum light. A back-titration of
the photoexposed AQDS solution with Fe(III)-citrate led to the generation of Fe(II)
(Figure 1). Fe(II) production was not observed in controls foregoing light treatment,
indicating that light catalyzed development of reduced-redox active species. Likewise,
exposure of artificial groundwater medium lacking AQDS to light did not lead to reduced
species capable of reducing Fe(III)-citrate. After the photoreduction reaction was halted.
Azospira suillum strain PS was added to photoreduced medium in the presence of nitrate
as an electron acceptor. Microbial oxidation of photoproduced reduced quinoid species
was apparent, as observed by back-titration analysis. This result indicated that strain PS
was able to directly access and oxidize the reduced product generated from the exposure
of AQDS to light.
594

Figure 1. Photoreduction and subsequent re-oxidation by strain PS of artificial groundwater
medium containing AQDS exposed to full-spectrum light.
Photoreduction of quinone solutions was much more efficient when glass tubing was
replaced with fused quartz. Photoreduction was also accelerated by replacing the full-
spectrum light source with a UV source bulb (maximum output = 254nm). Although
photoreduction of AQDS to reduced species was achieved in the absence of any other
solute other than AQDS and buffering components, photoreduction was further enhanced
in the presence of buffered 11micron-filtered creek water (data not shown) or when AQDS
solutions were mixed with humic acid suspensions (1.25 mM AQDS, 0.1 g/L HA) (Fig 2a).
The AQDS/humic acid mixture was able to rapidly reduce synthetic Fe(III) hydr(oxides).
After 4 days, the Fe(II) generated in this reaction remained unaltered within the standard
deviation of the initial reading, indicating the Fe(II) was relatively stable as a function of
time (data not shown). Similarly, when phosphate-buffered 0.1 g/L humic acids solutions
alone were exposed to UV light in quartz tubing, reduced species were formed which
readily reacted with Fe(III) to generate Fe(II) (Fig 2b).
Figure 2. Photoreduction of AQDS/HA mixtures by exposure to UV for 2.3 h (a) as
indicated by reduction of introduced Fe(III). Photoreduction of HA alone under the same
conditions was achieved with an 18 h illumination period (b).
595

Glass bottles containing anoxic, phosphate buffered solutions of humic acid (1g/L)
were placed in a gammator fitted with a Cs-137 gamma source. Exposure of humic acid
solutions to radioactive decay products resulted in production of redox-active species
capable of reducing Fe(III)-citrate to Fe(II) (Fig 3). Controls not exposed to radiation did
not exhibit an increase in the reducing capacity of the humic acid solution.
Figure 3. Recovery of Fe(II) after titrating gamma-irradiated HA solutions
with Fe(III)-citrate.
4. CONCLUSIONS
Photoreduction of humic substances and quinones yields two potential electron
donating compounds capable of supporting microbial respiration: reduced quinone species
and Fe(II). Photoreduction of humic substances therefore represents a potential mode of
primary energy production in some environments by converting incident light to a
bioavailable format.
REFERENCES
1. Coates, J.D., Cole, K.A., Chakraborty, R., O'Conner, S.M., Achenbach, L.A. 2002. Appl.
Environ. Microbiol. 68. 2445-2452.
2. Weber, K.A., Achenbach, L.A., Coates, J.D. 2006. Nature Reviews Microbiology 4. 752-764.
3. Algeria, A.E., Ferrer, A., Sepulveda, E. 1997. Photochemistry and Photobiology. 4. 436-442.
4. Ci, X., Silveira da Silva, R., Nicodem, D., Whitten, D.G. 1989. J. Am. Chem. Soc. 111. 1337-
1343.
596
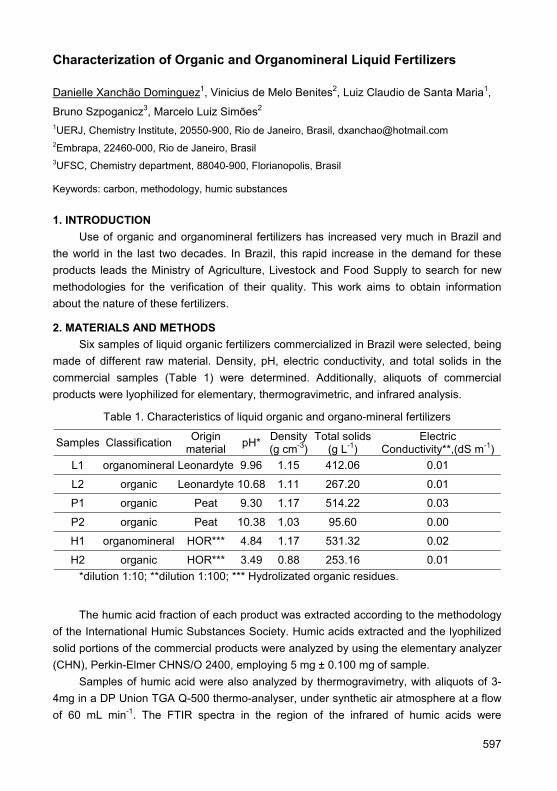
Characterization of Organic and Organomineral Liquid Fertilizers
Danielle Xanchão Dominguez1, Vinicius de Melo Benites2, Luiz Claudio de Santa Maria1,
Bruno Szpoganicz3, Marcelo Luiz Simões2 1UERJ, Chemistry Institute, 20550-900, Rio de Janeiro, Brasil, [email protected] 2Embrapa, 22460-000, Rio de Janeiro, Brasil 3UFSC, Chemistry department, 88040-900, Florianopolis, Brasil
Keywords: carbon, methodology, humic substances
1. INTRODUCTION Use of organic and organomineral fertilizers has increased very much in Brazil and
the world in the last two decades. In Brazil, this rapid increase in the demand for these products leads the Ministry of Agriculture, Livestock and Food Supply to search for new methodologies for the verification of their quality. This work aims to obtain information about the nature of these fertilizers.
2. MATERIALS AND METHODS Six samples of liquid organic fertilizers commercialized in Brazil were selected, being
made of different raw material. Density, pH, electric conductivity, and total solids in the commercial samples (Table 1) were determined. Additionally, aliquots of commercial products were lyophilized for elementary, thermogravimetric, and infrared analysis.
Table 1. Characteristics of liquid organic and organo-mineral fertilizers
Samples Classification Origin material pH* Density
(g cm-3)Total solids
(g L-1) Electric
Conductivity**,(dS m-1) L1 organomineral Leonardyte 9.96 1.15 412.06 0.01
L2 organic Leonardyte 10.68 1.11 267.20 0.01
P1 organic Peat 9.30 1.17 514.22 0.03
P2 organic Peat 10.38 1.03 95.60 0.00
H1 organomineral HOR*** 4.84 1.17 531.32 0.02
H2 organic HOR*** 3.49 0.88 253.16 0.01 *dilution 1:10; **dilution 1:100; *** Hydrolizated organic residues.
The humic acid fraction of each product was extracted according to the methodology of the International Humic Substances Society. Humic acids extracted and the lyophilized solid portions of the commercial products were analyzed by using the elementary analyzer (CHN), Perkin-Elmer CHNS/O 2400, employing 5 mg ± 0.100 mg of sample.
Samples of humic acid were also analyzed by thermogravimetry, with aliquots of 3-4mg in a DP Union TGA Q-500 thermo-analyser, under synthetic air atmosphere at a flow of 60 mL min-1. The FTIR spectra in the region of the infrared of humic acids were
597
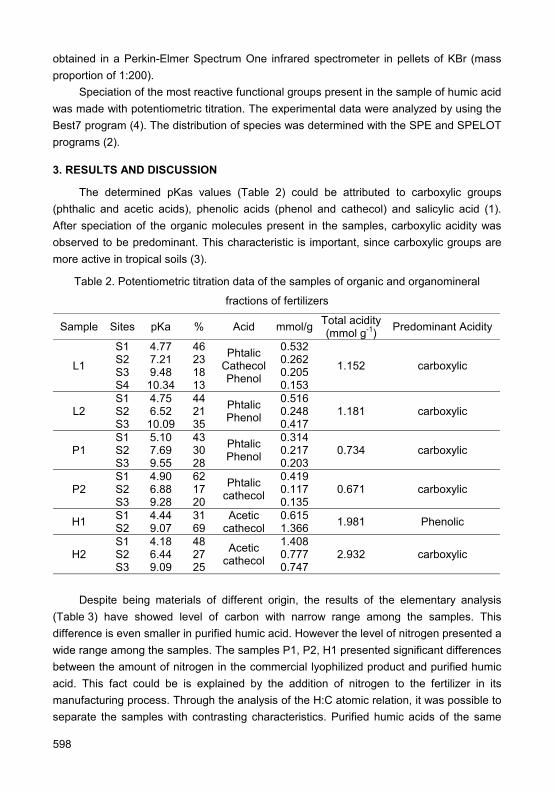
obtained in a Perkin-Elmer Spectrum One infrared spectrometer in pellets of KBr (mass proportion of 1:200).
Speciation of the most reactive functional groups present in the sample of humic acid was made with potentiometric titration. The experimental data were analyzed by using the Best7 program (4). The distribution of species was determined with the SPE and SPELOT programs (2).
3. RESULTS AND DISCUSSION
The determined pKas values (Table 2) could be attributed to carboxylic groups (phthalic and acetic acids), phenolic acids (phenol and cathecol) and salicylic acid (1). After speciation of the organic molecules present in the samples, carboxylic acidity was observed to be predominant. This characteristic is important, since carboxylic groups are more active in tropical soils (3).
Table 2. Potentiometric titration data of the samples of organic and organomineral
fractions of fertilizers
Sample Sites pKa % Acid mmol/g Total acidity (mmol g-1) Predominant Acidity
L1
S1 S2 S3 S4
4.77 7.21 9.48
10.34
46 23 18 13
Phtalic CathecolPhenol
0.532 0.262 0.205 0.153
1.152 carboxylic
L2 S1 S2 S3
4.75 6.52
10.09
44 21 35
Phtalic Phenol
0.516 0.248 0.417
1.181 carboxylic
P1 S1 S2 S3
5.10 7.69 9.55
43 30 28
Phtalic Phenol
0.314 0.217 0.203
0.734 carboxylic
P2 S1 S2 S3
4.90 6.88 9.28
62 17 20
Phtalic cathecol
0.419 0.117 0.135
0.671 carboxylic
H1 S1 S2
4.44 9.07
31 69
Acetic cathecol
0.615 1.366 1.981 Phenolic
H2 S1 S2 S3
4.18 6.44 9.09
48 27 25
Acetic cathecol
1.408 0.777 0.747
2.932 carboxylic
Despite being materials of different origin, the results of the elementary analysis (Table 3) have showed level of carbon with narrow range among the samples. This difference is even smaller in purified humic acid. However the level of nitrogen presented a wide range among the samples. The samples P1, P2, H1 presented significant differences between the amount of nitrogen in the commercial lyophilized product and purified humic acid. This fact could be is explained by the addition of nitrogen to the fertilizer in its manufacturing process. Through the analysis of the H:C atomic relation, it was possible to separate the samples with contrasting characteristics. Purified humic acids of the same
598

raw material present a similar atomic ratio. Leonardyte and Peat-based fertilizers presented low H:C relation while hydrolysed-based fertilizers showed a high H:C relation. This higher H:C ratio is related with aliphatic chains and this is usually related to a higher biodegradability of these substances. It was also observed a high C:N ratio in the purified humic acids of the samples of fertilizers with leonardyte as the origin material.
Table 3. Amount of carbon, hidrogen and oxigen of the commercial lyophilized product and
in the corresponding humic acid determined by the elementary analysis
Lyophilized commercial Product Purified Humic Acid Sample C% H% N% H:C C:N C% H% N% H:C C:N
L1 33.79 4.52 0.93 1.61 36.33 54.19 4.64 0.69 1.03 91.63L2 42.74 5.39 0.75 1.51 66.48 64.43 5.24 1.05 0.98 71.59P1 23.74 5.43 24.44 2.74 1.13 54.19 4.75 2.37 1.05 26.68P2 29.07 4.56 13.81 1.88 2.46 57.66 3.94 1.75 0.82 38.44H1 32.51 6.83 23.25 2.52 1.63 47.96 6.28 8.02 1.57 6.98 H2 29.41 5.89 4.54 2.40 7.56 49.30 8.90 6.15 2.17 9.35
Hydrolysed-based fertilizers had a predominance of organic composts
thermodegradable below 200°C. On the other hand, the samples of leonardyte and peat-
based fertilizers had thermal decomposition of their composts at temperatures between
400 and 500°C, hence explaining a higher recalcitrance of these compounds (Figure 1).
100 200 300 400 500 6000,0
0,1
0,2
0,3
0,4
0,5100 200 300 400 500 600
0,0
0,5
1,0
1,5100 200 300 400 500 600
0,0
0,5
1,0
1,5
2,0
DTG
Temperature, oC
H1 H2
DTG
L1 L2
DTG
P1 P2
Figure 1. Thermogravimetric curves of the first derivative of HA extracted from fertilizers
based of leonardyte (L1 e L2), peat (P1 e P2) and hydrolysed composts (H1 e H2).
The infrared spectra of these samples of fertilizers of the same origin material presented similar characteristics. Peat-based samples presented peaks characteristic of carboxylic and aromatic groups; and predominance of hydroxyl. The hydrolysed-based samples presented characteristic peaks of aliphatic compounds (2940; 2840; 1470 cm-1),
599
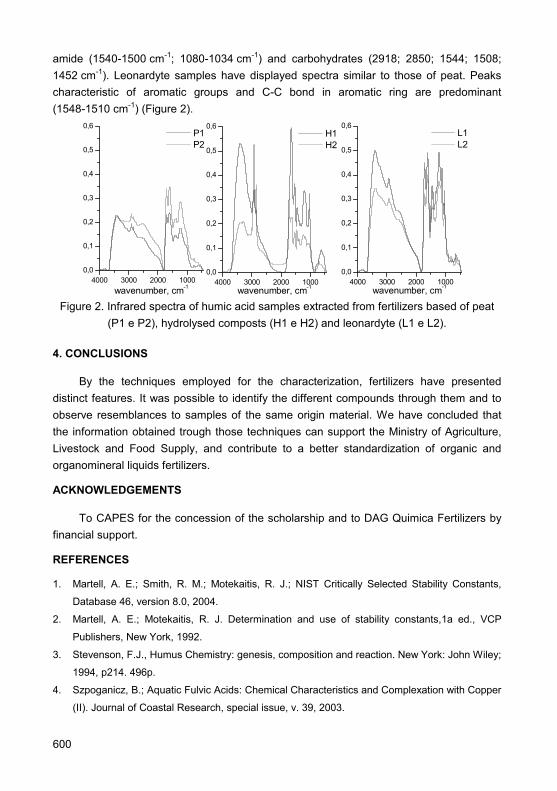
amide (1540-1500 cm-1; 1080-1034 cm-1) and carbohydrates (2918; 2850; 1544; 1508; 1452 cm-1). Leonardyte samples have displayed spectra similar to those of peat. Peaks characteristic of aromatic groups and C-C bond in aromatic ring are predominant (1548-1510 cm-1) (Figure 2).
4000 3000 2000 10000,0
0,1
0,2
0,3
0,4
0,5
0,6
4000 3000 2000 10000,0
0,1
0,2
0,3
0,4
0,5
0,6
4000 3000 2000 10000,0
0,1
0,2
0,3
0,4
0,5
0,6
wavenumber, cm-1
P1 P2
wavenumber, cm-1
H1 H2
wavenumber, cm-1
L1 L2
Figure 2. Infrared spectra of humic acid samples extracted from fertilizers based of peat
(P1 e P2), hydrolysed composts (H1 e H2) and leonardyte (L1 e L2).
4. CONCLUSIONS
By the techniques employed for the characterization, fertilizers have presented distinct features. It was possible to identify the different compounds through them and to observe resemblances to samples of the same origin material. We have concluded that the information obtained trough those techniques can support the Ministry of Agriculture, Livestock and Food Supply, and contribute to a better standardization of organic and organomineral liquids fertilizers.
ACKNOWLEDGEMENTS
To CAPES for the concession of the scholarship and to DAG Quimica Fertilizers by financial support.
REFERENCES
1. Martell, A. E.; Smith, R. M.; Motekaitis, R. J.; NIST Critically Selected Stability Constants,
Database 46, version 8.0, 2004.
2. Martell, A. E.; Motekaitis, R. J. Determination and use of stability constants,1a ed., VCP
Publishers, New York, 1992.
3. Stevenson, F.J., Humus Chemistry: genesis, composition and reaction. New York: John Wiley;
1994, p214. 496p.
4. Szpoganicz, B.; Aquatic Fulvic Acids: Chemical Characteristics and Complexation with Copper
(II). Journal of Coastal Research, special issue, v. 39, 2003.
600
Standardization and Legislative Regulations of Commercial Humic and Humic-Based Products
Paolo Sequi1, Claudio Ciavatta2 1Research Centre for the Soil-Plant System, ARC - Agricultural Research Council, Via della
Navicella n° 2-4, I-00184 Roma, Italy, [email protected] 2Department of Agro-Environmental Science and Technology, Alma Mater Studiorum University of
Bologna, Viale Fanin n°40, I-40127 Bologna, Italy
Keywords: legislative regulations, humic substances, organic carbon
1. INTRODUCTION
Humic substances (HS) are complex, heterogeneous mixtures of polydisperse
components formed by biochemical and chemical reactions during the humification
processes. The HS are major components of natural organic matter in soil and water as
well as in organic rich geological deposits such as lake sediments, peats, brown coals and
shales. The HS are involved in many processes in soils and natural waters, e.g. soil
weathering, plant nutrition, pH buffering, trace metal mobility and toxicity, bioavailability,
degradation and transport of hydrophobic organic chemicals, formation of disinfection by-
products during water treatment, and heterotrophic production in blackwater ecosystems
(web-site http://www.ihss.gatech.edu/ of the International Humic Substances Society).
In agriculture HS and HS-based products (solid and liquid) are generally used in
plant nutrition: their role in increasing bioavailability of nutrients and biological activities is
well supported in scientific literature (1, 2). For a proper use of HS it’s fundamental to know
their elemental composition as well as some basic features. This information is basically
included and well described in scientific papers.
In commercial products such data are often lacking. The main reason is that at a
national and, especially, international level (3) the specific rules neglected HS. In fact, it
must be kept in mind that even the recent European Regulation 2003/2003 (3) has
completely neglected organic and organic-based fertilizers and amendments. At the best
the existing rules require the declaration of total content of organic and humic carbon (4).
Among others, the Italian Legislative decree 217/06 (5) is one of the most advanced in
Europe from this point of view.
The need of standardization and regulations of commercial humic and humic-based
products is imperative in a modern agriculture and for a market globalization.
601

Table 1. Some parameters to be declared in organic amendments containing humic
substances according to the Italian Law of fertilizers (5)
Product Compulsory statements Requested content
Humified peat
Organic matter (OM) Humified/extractable OM(a) Total organic carbon (TOC) Humification rate HR(b) = (HA+FA)/TOC•100
40% min. (dry weight) 60% min. ≥ 20% (d.w.) ≥ 50%
Leonardite
Total organic carbon (TOC) Organic matter (OM) Humified/extractable OM(a) Humification rate HR(b) = (HA+FA)/TOC•100
≥ 30% (d.w.) not stated not stated ≥ 60%
Lignite Total organic carbon (TOC) Humified carbon (HA+FA) Degree of humification DH(b) = (HA+FA)/TEC•100
≥ 30% (d.w.) ≥ 15% (d.w.) ≥ 50%
Humic extracts(c)
Total organic carbon (TOC) Humification rate HR(b) = (HA+FA)/TOC•100
≥ 30% (d.w.) ≥ 60%
Soluble humates(c)
Solids
Water soluble organic carbon (WSOC) Humification rate HR(b) = (HA+FA)/TOC•100 Fluids
Water soluble organic carbon (WSOC) Humification rate HR(b) = (HA+FA)/TOC•100
≥ 19.5% ≥ 90% ≥ 2.8% ≥ 90%
(a)OM extracted with 0.1M NaOH + 0.1M Na4P2O7. (b)See Ciavatta et al. (6). (c)Isoelectric focusing technique is recommended to recognise the matrix (peat, leonardite, lignite, etc.).
REFERENCES
1. Nardi, S., Concheri, G., Dell’Agnola, G. 1996. In: Humic Substances in Terrestrial Ecosystems,
A. Piccolo (Ed.), Elsevier, Amsterdam, pp. 361–406.
2. Nardi, S., Pizzeghello, D., Muscolo, A., Vianello, A. 2002. Soil Biol. Biochem. 32, 1527-1536.
3. Regulation (EC) n° 2003/2003 of the European Parliament and of the Council of 13 October,
2003 relating to fertilisers. 21.11.2003 EN, Off. J. European Union, L 304/1.
4. Ministerio de la Presidencia. 12378 Real Decreto 824/2005, de 8 de julio, sobre productos
fertilizantes. Martes 19 julio 2005, BOE n. 171.
5. Legislative Decree 29 aprile 2006 n. 217. Revisione della disciplina in materia di fertilizzanti.
Official Journal of the Italian Republic n. 141 of the 20 June 2006 – Suppl. Ord. n. 152.
6. Ciavatta, C., Vittori Antisari, L., Sequi, P. 1988. Agrochimica 32, 510-517.
602

A Perspective on Over a Decade of On-Farm Research on the Influence of Humates Products on Crop Production
Mir-M. Seyedbagheri University of Idaho Elmore Extension Center, 535 E. Jackson, Mountain Home, Idaho 83647, [email protected]
Keywords: humates, crop production
1. INTRODUCTION
Since 1900, soil organic matter has declined drastically in America’s farmlands and
around the world as a result of carbon turnover and cropping systems. Soil is a living
system: When organic matter enters the community of soil organisms known as “the soil
food web,” it is degraded through chemical, physical, and biological pathways. Humic
substances, major constituents of soil organic matter, have long been known to have
properties such as chelation, mineralization, buffer effect, clay mineral-organic interaction,
and cation exchange. Since 1990, we evaluated commercial humic acid products derived
from lignite and leonardite in different cropping systems. The results of these evaluations
differed as a result of the source, concentration, processing, quality, types of soils and
cropping systems.
2. MATERIALS AND METHODS
Research trials were established between the years 1990 and 2007, to evaluate the
efficacy of different humate products in potatoes, sugar beets and alfalfa in western Idaho,
USA. For each research trial, humic acid treatments were arranged in a randomized
complete block design with four replications. The products were applied as a foliar, side-
dressed, or top-dressed. For the top-dressed, the hills were opened above the potato
seeds prior to application of the products for pre emergence treatments. Liquid humic
products were applied with solo pack sprayers to the opened furrow. Furrows were closed
immediately after application of different treatments. In different trials, granular humates
were weighed (40.48 kg ha-1) and spread as evenly as possible to treated rows, according
to block design randomizations. Liquid humic products were applied according to
manufacturers’ recommendations. At the end of crop season, potato, sugar beet and
alfalfa plots were harvested, graded, weighed, and quality parameters were evaluated.
603

3. RESULTS AND DISCUSSION
Data from humic acids trials conducted over a seventeen-year period showed that
different products responded differently in relation to yield and quality. The important
qualifying factors were: a) source; b) concentration; c) processing; d) chelating or
complexing capacity of the humic acid products; e) functional groups (Carboxyl -CO2H;
Phenol -Ohp; Hydroxyl -Oha; Ketone -C=O; Ester O=C-O-R; Ether –C-O-C-; Amine –NH2,-
NH,-N); f) rotation and soil quality factors; i) consistency of the product in enhancing yield
and quality of crops; j) mineralization effect; and k) influence on fertilizer use efficiency.
A comparison of statistical analysis of field data to determine the efficacy of twenty
different humic acids products has shown that, in general, good-quality products
consistently showed significant yield results. Under our research, crop yield increased from
a minimum 9.4 percent to a maximum 35.8 percent. Also, the use of good-quality humates
with complexing macro- and micronutrients in the solution enhanced fertilizer use
efficiency and potato quality.
Overall, we did more research on potato fields than on sugar beet fields. Collectively,
the consistent use of good quality products in our replicated research plots in different
years resulted in a yield increase from 11.4 percent to the maximum of 22.3 percent.
Humic acid products enhanced nitrogen mineralization in early season by an average of
9.6 percent. I must note that caution should be taken to evaluate the C:N ratio early in the
season, to prevent higher mineralization after mid-June. This will help to maintain low
conductivity and high sugar level by the end of the crop season. Alfalfa research plots had
yield increases from a minimum of 8.2 percent to the maximum of 20.9 percent.
4. CONCLUSIONS
In the past decade, there has been a drastic increase in the quality of research and
development of organic and humic acids by some well-established manufacturers. Our
experimentations with these products showed an increase in the yield and quality of crops.
We have emphasized IHSS findings and quality factors in hundreds of presentations,
workshops, seminars and applied research field days that we have given. As a result,
humic acid companies have been establishing sound applied research summaries for the
use of their different products on different crops. We highly recommend that the growers
and other users review each manufacturer’s crop research profiles for results and
economic outcomes.
604

Organogenic Waste Materials as Promising Metal Sorbents
Irena Twardowska, Krystyna Janta-Koszuta, Ewa Miszczak, Sebastian Stefaniak
Polish Academy of Sciences, Institute of Environmental Engineering, M. Sklodowska-Curie St. 34,
41-819 Zabrze, Poland, [email protected]
Keywords: humics-rich waste, metal binding, sorption efficiency
1. INTRODUCTION
Studies on metal binding onto NOM (peat) from strongly acidic electroplating waste in batch and flow-through systems showed high potential of organic matter for metal removal from polymetallic solutions (1). The increasing need for efficient metal sorbents for pollution prevention and control in a variety of bulk applications, as well as a limited availability of peat in many regions and requirements of wetland protection, directs increasing attention to abundant and easy-to-use organogenic wastes such as sewage sludge as potential sorbents of metal cations.
2. MATERIALS AND METHODS
In these studies, a representative sample of air-dried stabilized sewage sludge (SS) from the Zabrze-Downtown Sewage Treatment Plant (Poland) was used. Its physicochemical characteristics and selected parameters pertinent to sorption, such as pH, content and composition of mineral fraction, organic fraction, HA/FA, HS/insoluble organic ratio, CEC0 and its composition, specific surface and initial metal content were determined. Complex sorption studies comprised laboratory, bench and pilot-scale batch and flow-through experiments with use of mono-, binary and polymetallic solutions at pH 1.5-4.0. Here, the efficiency of SS as a metal sorbent is exemplified in selected results, and major general conclusions are presented.
3. RESULTS AND DISCUSSION
Studied SS appeared to be environmentally problematic due to the high initial content of PTE – Potentially Toxic Elements (Table 1) enriched in mobile and mobilizable fractions. This material though showed a sorption capacity for metal cations, which in monometallic batch systems was comparable with NOM (peat) and was similarly influenced by the kind of dominant anion (2). The sorption capacity of SS for metals (in mass units) represented ascending sequences Ni<Cd<Zn<Cu<Cr<Pb for Me-Cl and Ni<Zn<Cd<Cu<Cr<Pb for Me-SO4 systems and was several orders of magnitude higher than the initial content of these ions in SS (Table 1). In equivalent units, the sequences for both systems were the same: Cd<Ni<Zn<Cu<Pb<Cr.
605
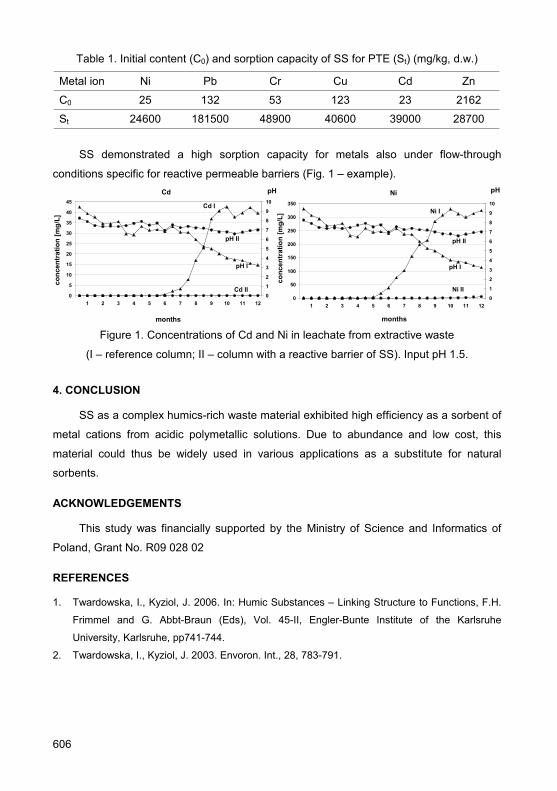
Table 1. Initial content (C0) and sorption capacity of SS for PTE (St) (mg/kg, d.w.)
Metal ion Ni Pb Cr Cu Cd Zn
C0 25 132 53 123 23 2162
St 24600 181500 48900 40600 39000 28700
SS demonstrated a high sorption capacity for metals also under flow-through
conditions specific for reactive permeable barriers (Fig. 1 – example). Cd
0
5
10
15
20
25
30
35
40
45
1 2 3 4 5 6 7 8 9 10 11 12
months
conc
entr
atio
n [m
g/L]
0
1
2
3
4
5
6
7
8
9
10
pH
pH I
pH II
Cd I
Cd II
Ni
0
50
100
150
200
250
300
350
1 2 3 4 5 6 7 8 9 10 11 12
months
conc
entr
atio
n [m
g/L]
0
1
2
3
4
5
6
7
8
9
10
pH
pH I
pH II
Ni I
Ni II
Figure 1. Concentrations of Cd and Ni in leachate from extractive waste
(I – reference column; II – column with a reactive barrier of SS). Input pH 1.5.
4. CONCLUSION
SS as a complex humics-rich waste material exhibited high efficiency as a sorbent of
metal cations from acidic polymetallic solutions. Due to abundance and low cost, this
material could thus be widely used in various applications as a substitute for natural
sorbents.
ACKNOWLEDGEMENTS
This study was financially supported by the Ministry of Science and Informatics of
Poland, Grant No. R09 028 02
REFERENCES
1. Twardowska, I., Kyziol, J. 2006. In: Humic Substances – Linking Structure to Functions, F.H.
Frimmel and G. Abbt-Braun (Eds), Vol. 45-II, Engler-Bunte Institute of the Karlsruhe
University, Karlsruhe, pp741-744.
2. Twardowska, I., Kyziol, J. 2003. Envoron. Int., 28, 783-791.
606
Commercial Humates: The Origin of Organic Matter and Its Environmental Role
Olga Yakimenko1, Andrei Lapenis2, John Aranson2 1Soil Science Department, Moscow State University, 119991, Moscow, Russia, [email protected] 2Dept of Earth and Atmospheric Sciences, SUNY-Albany, USA, [email protected]
Keywords: humate
1. INTRODUCTION
One of challenges in the transition to sustainable agriculture is the development of environmentally friendly, and cost-effective natural fertilizes, plant growth stimulators, and soil conditioners. One of the most promising natural tools is the use of humic substances (HS). Since the beneficial role of HS in environment is well known, today many companies all over the world produce commercial humates (HUM) from organic raw materials and promote them as soil conditioners, plant growth stimulators, for the remediation of degraded soils, and the sequestration of toxicants (1).
The biochemical mechanism behind the effects of humates on plants growth can be linked to specific features of HS molecules, which in turn depend on origin of organic matter. In this study a possible connection between the origin of organic matter, and the ability of HUM to stimulate plant growth was investigated.
2. MATERIALS AND METHODS
A detailed chemical analysis was conducted on available humate-based products (50 samples) for commercial humates produced from variety of organic deposits in U.S., Canada and Europe. In vitro experiments were conducted with plants treated with and without HUM. Reddish seeds (Raphanus sativis L.) have been soaked in solutions or water suspensions of HUM at concentrations giving 5-500 mg water-soluble C per liter,
and germinated at dark at 27°C for 72 h. The physiological activity of HUM was estimated as a change in primary root length of seedlings.
3. RESULTS AND DISCUSSION
Since HS are complex, stochastic molecules, chemical analyses of HUM were performed at 3 different levels of details, starting from simple basic parameters and continuing to advanced investigations of molecular structure. Results are discussed in presentation. In brief, molecular structure for the majority of HUM tested was enriched in aromatic moieties and close to HS of Mollisols, whereas other soil humic acids together with lignin and plant residues defined other groups (Fig. 1).
607
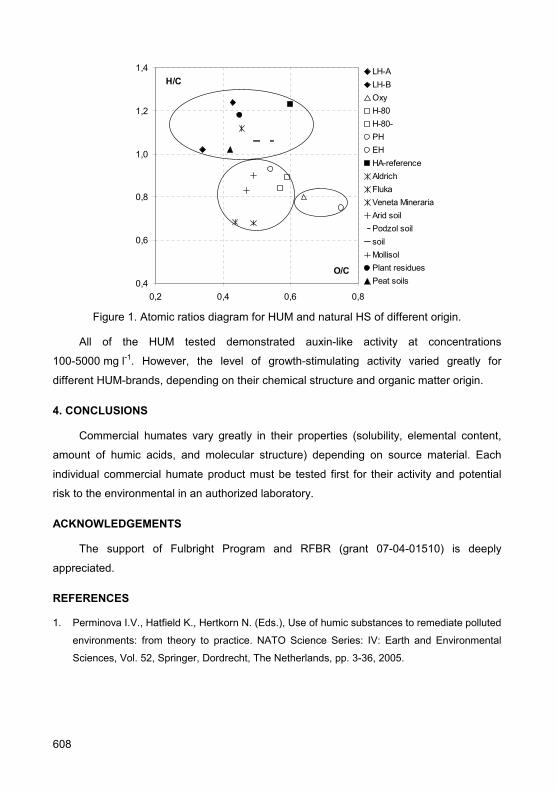
0,4
0,6
0,8
1,0
1,2
1,4
0,2 0,4 0,6 0,8
O/C
H/CLH-ALH-BOxyH-80H-80-PHEHHA-referenceAldrichFlukaVeneta MinerariaArid soilPodzol soilsoilMollisolPlant residuesPeat soils
Figure 1. Atomic ratios diagram for HUM and natural HS of different origin.
All of the HUM tested demonstrated auxin-like activity at concentrations
100-5000 mg l-1. However, the level of growth-stimulating activity varied greatly for
different HUM-brands, depending on their chemical structure and organic matter origin.
4. CONCLUSIONS
Commercial humates vary greatly in their properties (solubility, elemental content,
amount of humic acids, and molecular structure) depending on source material. Each
individual commercial humate product must be tested first for their activity and potential
risk to the environmental in an authorized laboratory.
ACKNOWLEDGEMENTS
The support of Fulbright Program and RFBR (grant 07-04-01510) is deeply
appreciated.
REFERENCES
1. Perminova I.V., Hatfield K., Hertkorn N. (Eds.), Use of humic substances to remediate polluted
environments: from theory to practice. NATO Science Series: IV: Earth and Environmental
Sciences, Vol. 52, Springer, Dordrecht, The Netherlands, pp. 3-36, 2005.
608

Greenhouse Experiment on the Effect of Humic Substances on Solubilization of Ogun Phosphate Rock
Olusola Olajumoke Adesanwo1, John Norman Dunlevey2, Michael Tunde Adetunji3,
Sitapha Diatta4, Olu Osiname4, Julius Kolawole Adesanwo5, Ayo Kolawole6 1Department of Soil Science, Obafemi Awolowo, Ile-Ife, Nigeria, [email protected] 2School of Geological Sciences, University of KwaZulu natal, Durban, South Africa 3University of Agriculture, Abeokuta, Nigeria 4Africa Rice Center, International Institute of Tropical Research, Ibadan, Nigeria 5Department of Chemical Sciences, Olabisi Onabanjo University Ago Iwoye, Nigeria 6Department of Chemistry, University of Zululand, Zululand, South Africa
Keywords: Ogun phosphate rock, humic substances, phosphorus
1. INTRODUCTION
Sustainability of human life on earth depends on sustainable agriculture (1).
Phosphorus (P) is one of the major essential nutrients needed to ensure this sustainability.
Presently in Nigeria, high cost and scarcity of mineral P fertilizers (single superphosphate
and triple superphosphate is shifting attention to direct use of indigenous phosphate rock
as viable alternative to mineral fertilizers. The aim of this experiment is to determine
influence of humic substances on solubilization of Ogun phosphate rock.
2. MATERIALS AND METHODS
Greenhouse experiment was conducted at International Institute of Tropical
Agriculture, Ibadan, to monitor the effect of humic substances from decomposition of
legume biomass on solubilization of Ogun Phosphate Rock (OPR). Soil samples taken to
the depth of 20 cm was collected from three experimental sites (International institute of
Tropical agriculture, Institute of Agricultural Research and Training (IAR&T) and University
of Agriculture Abeokuta) in South Western Nigeria (Table 1).
Four rates of Ogun phosphate rock (0,30, 60 and 90 kg P ha-1) along with
40 kg P ha-1 as Triple superphosphate (TSP) was mixed with 1 kg soil in a 2 kg plastic
pots arranged in complete randomized block design in three replicates with and without
legume biomass. Mucuna and cowpea were used as green manure while newly released
rice (Oryza sativa) variety NERICA 1 was used as test crop.
609

Table 1. Chemical properties of soil samples taken at soil depth 0-20 cm from the three
experimental sites
Parameters Ibadan (IITA)
Ikenne (IAR&T)
Abeokuta (UNAAB)
pH (H2O) 1:1 5.8 6.6 6.2
C (g kg-1) 1.21 1.23 0.96
N (g kg-1) 0.11 0.11 0.08
P (mg kg-1) 54.36 7.34 10.18
Exchangeable cations (cmol kg-1)
Ca 2.77 2.91 2.96
Mg 0.70 1.18 0.68
K 0.77 0.17 0.23
Na 0.10 0.06 0.05
Micronutrients (kg ha-1)
Fe 138.9 98.8 95.9
Mn 236.44 202.88 246.43
Zn 2.39 1.08 1.83
Cu 1.41 1.65 1.35
Particle size (%)
%Sand 74 68 80
%Clay 12 10 8
%Silt 14 22 12
3. RESULTS AND DISCUSSION
Highly significant treatment effect was observed on dry matter yield and P uptake in
the plant tissue (2) with soil samples from all the three sites according to Fisher’s LSD at
0.05 probability level (Table 2). Highest value (2.58 g kg-1) in dry matter yield was with pots
treated with mucuna and TSP. Treatment combination of cowpea and OPR at 90 kg P ha-1
biomass significantly increased rice dry matter yield (2.19 g kg -1) by 16% over pots treated
with cowpea biomass alone and 42% over control pot (no legume biomass &no OPR). Soil
available P increased significantly as rate of OPR increases with pots treated with green
manure (Table 2). Reactivity of phosphate rock on soils that are slightly acidic to slightly
alkaline (Table 1) could be effectively enhanced through the action of humic substances
(3).
610

Table 2. Effects of treatment on dry matter yield of Rice in the greenhouse at 9 weeks after
planting using soil samples from the three sites
Treatment Dry matter yield (g kg-1)
Legume P rates, kg ha-1 IITA IAR&T UNAAB
0 1.54 0.80 1.01
30 1.68 0.92 1.1
60 1.72 1.07 1.27
90 1.38 1.14 1.52
No Legume
TSP 2.30 1.38 1.40
0 1.89 0.98 1.11
30 1.94 1.02 1.27
60 2.02 1.23 1.36
90 1.69 1.55 1.71
Mucuna
TSP 2.58 1.56 2.10
0 1.89 1.14 1.27
30 2.19 1.27 1.36
60 2.02 1.16 1.60
90 2.06 1.34 1.71
Cowpea
TSP 2.49 1.38 2.15
L *** *** ***
P *** *** *** LSD(p≤0.05)
L x P *** *** ***
4. CONCLUSIONS
Results from the greenhouse experiment showed that humic substances produced
as a result of decomposition of legume biomass enhanced rate of release of phosphorus
from phosphate rock to rice plant on slightly acidic soils to slightly alkaline soils.
ACKNOWLEDGEMENTS
African Rice Center, Cotonuo, in collaboration with University of Hohenheim,
Germany for fellowship to carry out doctoral Research.
611

REFERENCES
1. Fardeau, J.C. 1993. Nutrient Cycling in Agroecosystems, 45(3): 91-100.
2. Khasawneh, F.E and Doll, E.C. 1978. Advances in Agronomy, 30; 159 – 206.
3. Akintokun, O.O, Adetunji; M.T., Akintokun, P.O. 2003. Nutrient Cycling in Agoecosytems, 65;
35–42.
612

Structural Components and Biological Activity among Humic Substances of Low-mineralized Silt Sulphide Muds
Nadezda Petrovna Avvakumova, Alina Valitovna Zhdanova The Samara State Medical University, Chapaevskaya 89, 443099, Samara, Russia,
Keywords: fulvic acids, hymatomelanic acids, humic acids, humin acids, humic substances,
biological activity, pelotherapy
1. INTRODUCTION
Health resort treatment by native muds faces the number of challenges among which
there is exhaustion of conditioned muds resources, muds dirtyness by products of
anthropogenic origin (1). In spite of broad popularity of traditional mud therapy, it is
unacceptable because of medical indications for some categories of patients (2, 4).
Scientists make attempts to extract biologically active fraction from peloids and to
build peloid-specimen on basis of peloids, which without yielding in therapeutic activity
allow to reduce the amount of contraindications, make therapy dosated, enhance the
possibility of combined application both with medications and with physical agents to
lighten the medication transportation and storage, improve work conditions of medical
staff, make therapy more available to solve above-named problems. It is the opinion of
some authors that muds application in the form of medications is more adequate stimulus
in comparison with traditional pelotherapy (3).
Listed factors are the foundations to search biologically active peloids preparations
and their introduction into health-care service practice.
The aim of research. To study structure functional properties, to disclose biologically
significant effects and to ascertain the most active fractions of humic substances of low-
mineralized peloids.
2. MATERIALS AND METHODS
Low-mineralized silt sulphide muds being the object of our research are compound
multicomponent combination of substances. Unlike the soil and peats, biochemical
processes which inherent to silt sulphide muds formation, take place in them at high
values of biological activity period, in the presence of easy-to-assimilate organic
substances, soluble sulphides and appropriate microflora by microorganisms. Humin acids
613

of peloids form and exist under anaerobic conditions, which is reflected in their structure
and chemical activity. All-round description of humin acids function-group mixture, biogeotransformation
degree, time history of group mixture according the seasons of the year are described on
the basis of research methods combination both classical and modern. Element structure
of macromolecules and properties describing their structure are determined at
submolecular level. Functional groups contents are quantitatively described which are
responsible for acid-base properties.
The influence of fulvic acids, himatomelanic acids, humic acids and summary
medication on a chronic inflammation dynamics was studied by experimental model of
adjuvant-induced arthritis. Activity of pro- and antioxidative systems was estimated
according the activity of catalase and superoxide scavenger, the intensity of diene
conjugation of unsaturated higher fatty acids and concentration of malonic dialdehyde.
3. RESULTS AND DISCUSSION
On the whole humin acids are presented by more or less coloured high-molecular,
polycoupled, polydisperse, polycondensat organic compounds of acid nature having
electron-donor and electron-acceptor properties. They have community of structure but
differ from each other according the degree of listed properties manifestation as well as
molecular weights, particles sizes, amphiphile, configuration, conformation, adsorption
property, particle mobility in solution. Such properties lead to appearance different
biological activity of humic acids.
Toxicity absence of humic substances is experimentally proved. Negative
manifestations were not discovered after enteral introduction of drug dose at 15 g/kg mass
of experimental animals. The comparative effect analysis of physiological solution and
humic acids have showed activation of monocytic-macrophage system and descent of
reaction evidence under emotional-painful stress of healthy experimental animals during
the influence of peloid medication.
The research of biological activities of fulvic acids, hymatomelanic acids, humic acids
and summary medication in wide concentration range on the model of acute inflammation
discovered polymodal dependence of all the medications actions from doses. Comparison
antiinflammatory activity with influence of 2,5% diclofenac sodium solution showed more
apparent action of humic peloid preparation.
Behavior of immunological blood values during medical treatment of acute
inflammation by humin acid allows to make a conclusion that antiphlogistic effect is
614

determined by influence on functional-metabolic activity of neutrophilic granulocytes and
monocytes. Such activity is described by humin acids capability to reversible inhibit the
epactal interleukin by 1β overactivity macrophages, to level strengthen issue of
neutrophilic granulocytes from marrowy depot into blood, to reduce oxygen demand by
activated phagocytes with posterior reduction of oxygenous radical generation, which
leads to reduction of inflammatory reactions intensity as a result. The most biological
activity is discovered in humic acids.
The results were received during the system multifactorial analysis on 19 quantity
indicators describing change in cellular blood structure, functional activity of monocytic-
macrophage system. They have shown that introduction of test substances at the time of
inflammation development considerably changes the degree of integrated parameters
deviation of blood system functional condition from specified values.
The received results are evidence of complex polymodal influence of all the peloids
preparations from the humuc series on various stages of inflammatory process. Organism
reaction under separate components of humic acids in investigated dozes is ambiguous
but all the studied connections forward normalization of general balance of redox
processes in an organism. Change dynamics of hematologic and immunologic parameters
under animal introduction of humic acids with developed adjuvant-induced polyarthritis
shows the intensity decrease of inflammatory process with autoimmune component here
the therapeutic effect intensified with course dose increasing. The research of humic acids
influence on activity of inflammatory process and animals immunologic status with
experimental polyarthritis caused by Freund's adjuvant introduction has shown apparent
immunocorrected effect of present peloids preparation.
Anti-inflammatory and immunotropic action of humic acids was expressed in blood
leukogram normalization, functional-metabolic properties of monocytic- phagocytal system,
disbalance levelling of immunoregulatory Т-lymphocyte subpopulations, that, apparently,
was an evidence of activity decrease of autoimmune reactions under the condition of
experimental joints affect of animals.
The histologic feature is an evidence of developing apparent pathologic changes
such as parenchyma and stroma edema, sclerosis, vessels hyalinosis and others during
rats rheumatoid joint inflammation in peripheral immunogenesis organs (spleen and
regional lymph nodes) simulation. Peloid preparations in terms of hymatomelanic, humic,
humin acids develop obvious protective effect according to the morphological feature. We
research preparations on the basis of fulvic acids according to the morphological
characteristics which do not have influence on rats immune inflammation model. The more
615
coupling system is shown in macromolecules of humic peloid preparations the more their
biological activity is expressed.
High reparative activity of argentum humate in the form of ointment on hydrophilic
basis is experimentally determined. The therapeutic effect of humic acids is proved when
hemolytic anemia of laboratory animals are treated. Electrophoretic introduction of humic
and humin acids were effective during rheumatoid joint inflammation treatment at the stage
of remission. Suppositories on the basis of humic acids have shown high efficiency during
chronic prostatitis treatment. The complex dynamical system of humin acids sustains an
internal homeostasis of biosystems at organismal, cellular and subcellular levels,
forwarding restoration of physiological functions at pathological states and in extreme
cases.
4. CONCLUSIONS
Highly effective peloid preparations obtaining has pantobiological significance in
studying biotransformation laws of organic substances as well as it will forward the
efficiency increasing of pelotherapy, the economy of mud resource depletion and the
preservation of ecological biogeocenosis equilibrium from natural zones.
ACKNOWLEDGEMENTS
Authors would like to thank management of university and central research
laboratory for the moneyed assistance during this work.
REFERENCES
1. Butkova O.L. Influence of pesticides in agriculture on the peloids deposits within the bounds of
ecosystem // Materials of international research and practical conference «natural resources»,
Truskavets, 1999. – page 121-123.
2. Karpuhin I.V., Serebryakov I.V., Bogomolny V.A. Integrated application of pelotherapy,
ultrasound and sinusoidal simulated currents at chronic prostatitis and proctosigmoiditis // The
questions of balneology, physiotherapy and exercise therapy. – 2000 – page 26-27.
3. Tereshin S. Y. Influence of physical factors on the penetrability of skin of white rats in normal
conditions and at modeling some of pathological processes // The questions of balneology,
physiotherapy and exercise therapy. – 2000 – page 50-53.
4. Shustov L.P. Extracts of silt sulphide muds and justification of its application at clinical practice
// The questions of balneology, physiotherapy and exercise therapy. – 1999 – page 35-37.
616

Beneficial Effects of the Complex Humic Microfertilizer Applied to the Ornamental Plum Hessei
Olga S. Bezuglova1, Irina V. Perminova2, N.M. Neganova1 1South Federal University, Rostov-on Don, Russia, [email protected] 2Lomonosov Moscow State University, Department of Chemistry, 1119992 Moscow, Russia
Keywords: complex microfertilizer, humic, plum Hessei, beneficial effects
1. INTRODUCTION
There is a whole variety of industrial humic-based products on the market, which
includes humates produced from peat, lignites, sapropel, and organic wastes. Many
humate producers incorporate nutritional elements into the commercial products. These
elements are usually introduced as water soluble salts, e.g., iron(II) sulphate, or a broad
spectrum of salts is mixed with the humate as in case of Humate+7 product (Irkutski
Gumat Ltd., Russia). The objective of this work was to test the efficiency of the new
complex humic microfertilizer containing Fe(III), Zn(II), Mn(II), Cu(II), and B in the field
conditions. The major difference of the tested humic microfertilizer from the industrial
humic preparations currently available on the market is a high total content of the
nutritional elements (up to 9 % mass) which makes it comparable to the artificial chelates
(e.g., DTPA, EDTA, EDDHA).
2. MATERIALS AND METHODS
The plants of the ornamental plum Hessei were used. The experiments included: 1)
blank (no microfertilizers added), 2) soil application of the commercial iron(II) humate
(Humiron) – Humintech Ltd. (Germany), 3) soil application of artificial Fe(III) chelate in the
form of EDDHA complex, 4) soil application of the synthesized complex humate enriched
with Fe(III), Mn(II), Zn(II), Cu(II), and B, 5) soil application of the sodium humate (Sakhalin
Humate, Russia), 6) foliar application of microelements without humates (Fe, Mn, Zn, Cu,
B); 7) foliar application of the synthesized complex humate (Fe(III), Mn(II), Zn(II), Cu(II),
and B).
Two years old plants of plum Hessei grown on the common carbonate chernozem
were used in these experiments. The amount of plants used for each experiment was from
30 to 34. The plants from the blank experiment did not receive additional microelements.
The plants from the humate experiments were treated three times per season with 0.5%
humate solution. At the same time the foliar application was conducted for the appropriate
617
experiments using microelement mixtures and complex humate solution at concentration
of 0.05%.
Efficiency of the microfertilizers used was estimated by measuring stem diameter,
size of the plant, and increase in size of the plant. The latter was calculated by multiplying
the length of new branches with their amount.
3. RESULTS AND DISCUSSION
All experiments were conducted during three months. The obtained results are
described below: the “stem diameter” has increased up to 205% for blank and sodium
humate experiments and it has reached 216% for the complex humate experiment. Foliar
application of the complex humate also did not influence this parameter – it accounted for
207%. An increase in the plant size characterizing the growth intensity of the plant foliage,
was 335 % for the blank experiment, and 408% for the experiment with the complex
humate. Of importance is that the complex humate not only improved the growth of the
foliage, but its quality as well. The trees looked much prettier with a thick, uniformly
developed foliage. The pure microelements did not provide the difference in the foliage
quality observed for the complex humate.
4. CONCLUSIONS
The conducted research has revealed beneficial effects of the application of the
complex humate tested on the conditions of the young plants of the ornamental Hessei
plum. The observed beneficial effects were the most distinct for the quality of the plants
foliage. The conclusion can be made of the promising potential of the application of the
humic-based microfertilizers in the organic agriculture.
ACKNOWLEDGEMENTS
This research was supported by the ISTC (project KR-964).
618

Use of Natural and Modified Materials to Minimize Influence of Sulfide Tailings
Anna Bogush1, Vladimir Voronin2 1Institute of Geology and Mineralogy SB RAS, Koptyug Pr. 3, 630090 Novosibirsk, Russia,
[email protected] 2Planeta-Ra Ltd., Lazurnay str. 4/3, 630133 Novosibirsk, Russia, [email protected]
Keywords: mine waste treatment, peat-humic agent, organic-mineral complex
1. INTRODUCTION
The huge amount of waste has been collected in the world during the last century as
a result of industrial activity. Most hazardous wastes were produced by the ore mining-
processing industry as they contain high concentration of heavy metals. Various reagents
(carbonaceous rocks, activated carbon, zeolites, iron hydroxides, cellulose and others),
different protective screens (6, 12, 14, etc.), microbial populations (1, 7, 9, etc.) are used
for area decontamination of the mining industry. In the given work effective treatment ways
of liquid and solid waste have been developed on the basis of natural (clay, peat,
limestone, etc.) and modified materials (peat-humic agent (PHA), organic-mineral
complex, etc.).
2. MATERIALS AND METHODS
The following materials were used in experiments: 1) kaolinite clay (“Dorogino”
deposit, Novosibirsk region); 2) peat (“Krugloe” deposit, Kochenevski area, Novosibirsk
region); 3) peat-humic agent which has been produced on the basis of peat from “Krugloe”
deposit by Planet-RA Ltd.; 4) limestone (“Chernorechensk” deposit, Iskitim area,
Novosibirsk region). Laboratory researches were carried out in analytical center of the
Institute of geology and mineralogy SB RAS.
3. RESULTS AND DISCUSSION
Exploration of sorption conditions of chosen elements (Zn, Cd, Pb, Cu) on the natural
and modified materials (clay and peat) has been carried out in the first series of
experiments. Adsorption isotherms are constructed from experiment results. It was shown,
that the clay modified by PHA (organic-mineral complex) has increased sorption capacity
in 1.5-2.5 times comparing to natural clay and expanded рН interval approximately to
5-8 (4). Binding of potentially toxic elements with humic acids usually goes via the
619
exchange mechanism (interaction of a carboxyl group with metal ions is prevailed) with
formation of poorly soluble humates. Formation of organic-mineral complex mainly
happens due to the formation of hydrogen bond (-OH…H), COO-…HO-Al bonds, and in a
sample with sorbed elements also with R1-COO-Me-OOC-R2 bonding. During this process
solid particles are getting bigger, easily settling out from a solute, and also sorb metals
more completely. Virtually all studied elements are badly desorbing into a solution (the
degree of element desorption is less than 3%). It is significant, that metals are most
strongly bonded to the organic-mineral complex.
Some ways of waste treatment have been devised basing on the data obtained.
Sulfide tailings are oxidized under the action of atmospheric oxygen and as a result acid
mine drainages (AMD) with high concentration of SO42-, Fe, Zn, Cu, Cd, Pb and other
elements are generated. According to static experiments it is possible to use quite simple
methods for neutralization of technogenic waters. For waters with the рН 4-5, small
additives of limestone (5-10 g/l) and peat-humic preparation (1-2 ml PHA/l) are enough to
alkalize medium up to subacidic and about neutral рН (3). For strong-acid drainage
waters, the positive effect increases with small additives of sodium bicarbonate or
simultaneous use of limestone and peat-humic agent. All used compounds (clay, peat,
limestone, PHA, sodium bicarbonate) and their combinations are applicable for treatment
of AMD with high contents of potentially toxic elements. The greatest purification efficiency
achieved by modified clay (with the addition of sodium bicarbonate (1%) in case of strong-
acid technogenic waters) and peat with limestone in the ratio 10:1-2:1, accordingly.
The method of drainage water treatment with the use of peat-humic agent is based
on the properties of humic acids (8, 10, 11, 15, etc.). The peat-humic agent is a good
metal sorbent and can alkalize acid and especially subacid drainage waters. Required
addition of the peat-humic agent depends on water composition. For example, the good
results were obtained using A2 ratio (see Table 1) for mine drainage of Belovo hydraulic-
mine dump (Kemerovo region, Russia). Subsequently formed flaky sediment can be
removed by filtration through activated coal and haydite sand. Activated coal is better to
use for afterpurification of strong-acid mine drainage. From the financial point of view it is
better to use haydite sand especially for subacid mine drainage as it is relatively cheap
material. Acid mine drainage of old sulfide tailings is often spread without any control into
environment and pollute rives, reservoirs, and soils. In that case it is possible to use the
following method of drainage water treatment. Firstly, it is required to dig out a trench
around sulfide tailings for AMD collection. The peat-humic agent is added to a trench with
certain concentration. Then it is necessary to put bags with haydite sand in drainage
620

streams or special deepening for filtration of acid mine drainage mixed with the peat-humic
agent. Suggested method will help to decrease harmful effect of mine wastes onto
environment.
Table 1. The pH and element concentration in drainage water and treated drainage
waters, mg/l
Sample pH Fe Zn Cd Cu Ni Co Б1 4.8 0.22 112 1.2 270 0.68 0.6 A1 6.4 <0.005 24 1.1 3.2 0.53 0.47 A2 7.1 <0.005 4.3 0.29 1.9 0.27 0.26 A3 8.2 <0.005 <0.005 <0.005 1.8 0.08 0.037
MPC (13) – 0.3 5.0 0.001 1.0 0.1 0.1 А1 – PHA:AMD ratio = 1:1000; А2 – PHA:AMD ratio = 1:500; А3 – PHA:AMD ratio = 1:100; B1 – Belovo hydraulic-mine dump; MPS – maximum permissible concentration.
The next experiments leaded to a decrease of technogenic influence of sulphide
wastes which occupy huge territories in the form of tailing piles. The eolian transportation
of tailings particles is a potentially hazardous process. Particles of thin fraction are
transferred on adherent territories: woods, reservoirs, arable lands, fields, and courtyards
of local residents. Some solutions of this problem existed before, e.g. the tailings could be
covered by break stone or clay. We propose alternative solution in this article: the covering
of sulphide tailings by peat-humic agent. In the carried out experiments we separated
shallow fractions of substance (particle size is 0.16-0.25 mm and less 0.16 mm) which
gave the greatest contribution to particle size distribution of investigated wastes
(approximately 50-60%), and also to process of waste dusting. It is recommended to use a
solution of peat-humic agent in the ratio PHA:water = 1:500 for prevention of tailings
dusting. It is shown, that particle-size distribution of tailings material was changed (2).
Fraction of large particles was increased to approximately 50-80%. On the basis of
experiment series it is possible to offer following methods of conservation of tailings with
the use of peat-humic agent. Acidity of medium was decreased to subacidic and perineural
values by using peat-humic agent with small additives of sodium bicarbonate
(0.2-1.2 mass. %) or limestone (4-6 mass. %). The purification efficiency was sharply
increased along with рН due to loading of soda and limestone. There are quite complex
processes going on in the given system which influence on retention of elements. The
complex geochemical barrier is formed. Poorly soluble humates of heavy metals, iron
621

oxyhydroxides and poorly soluble carbonates of some elements were formed onto barrier
(5).
4. CONCLUSIONS
The proposed cost-effective method of area decontamination will allow quickly
improving ecological situation nearby industrial facilities. A wide distribution of raw
materials required for sorbents (clay minerals, peat, etc.) in various regions of Russia and
usage of modified materials will allow applying the given methods at many industrial
enterprises.
ACKNOWLEDGEMENTS
This work was supported by grant of the RFBR № 06-05-65007.
REFERENCES
1. Benner, S., Gould, W., Blowes, D. 2000. Chemical Geology. 169, 435-448.
2. Bogush, A., Voronin, V., Galkova, O., Maskenskaya, O. 2007. Herald of the KazNU. №5(49),
250-251.
3. Bogush, A., Letov, S., Miroshnichenko, L. 2007. Geoecology. №5, 413-420.
4. Bogush, A., Moroz, T., Galkova, O., Maskenskaya O. 2007. Ecology of industrial production.
№2, 63-69.
5. Bogush, A., Trofimov, A. 2005. Chemical industry. Vol. 82. №3, 153-158.
6. Doncheva, A., Pokrovski, S. 1999. The principles of ecological production engineering,
Moscow, MSU, 108 p.
7. Foucher, S., Battaglia-Brunet, F., Ignatiadis, I., Morin, D. 2001. Chem. Eng. Sci. 56, 1639-
1645.
8. Gerasimov, I., Chichagova, S. 1971. Soil Science. № 10, 3 11.
9. Halford, K. 1999. Miner. Resour. Eng. Vol. 8. №4, 419-452.
10. Holin, Y. 2001. Universitates Journal. №4, 21-25.
11. Orlov, D., Osipova, N. 1988. Infra-red spectra of soil and soil components, Moscow, 92 p.
12. Sandstrom, A., Mattsson, E. 2001. International Journal of Mineral Processing. 62, 309-320.
13. Sanitary regulations and standards. 2.1.4.559-96 (drinking water).
14. Sergeev, V., Shimko, T., Kuleshova, M., Maximovich, N. 1996. Wat. Sci. Tech. 34, 383-387.
15. Varshal, G., Velyuhanova, T., Baranova, N. 1984. Geochemistry. № 2, 279-283.
622

Humic Acids of Brown Coals of the Russia South Far East: Extraction and Complexing Properties toward Gold, Platinum, and Palladium
Svetlana Bratskaya1, Alexandra Volk1, Vladimir Ivanov2, Svyatoslav Sukhoverkhov1,
Valentin Avramenko1
1Institute of Chemistry, Far Eastern Branch, Russian Academy of Sciences, 159, ave 100-letiya
Vladivostoka, Vladivostok 690022, Russia, [email protected] 2Far East Geological Institute, Far Eastern Branch, Russian Academy of Sciences, 159, ave 100-
letiya Vladivostoka, Vladivostok 690022, Russia
Keywords: humic, brown coal, precious metals, gold, chromatography
1. INTRODUCTION
In the last decades brown coals attract high interest as promising unconventional raw materials for industrial production of rare and precious metals. According to literature data, 85-88% of germanium world reserves are concentrated in coals; besides, the content values of rare and precious metals in coals is often higher than in the ores of non-ferrous metals. Brown coals of Primorsky Territory (South Far East of Russia) are characterized as low-calorie fuel, which is not economically suitable for power plants but can rather be used with higher efficacy as raw materials for extraction of gold and metals of platinum group. Here we discuss preliminary data on the possibility to extract precious metals with brown coal humic substances and selectively separate metal-rich and metal-depleted humic fractions, the latter of which can be further applied as agricultural products.
2. MATERIALS AND METHODS
The brown coals studied were collected in different parts of the Khanka, Partizansk and Bikin-Ussuriysk coal basins and South Primorye coal district. Alkaline extracts of coal humic acids were obtained at solid/liquid ratio 1:50 under constant stirring at 60°C during 4h and then filtered through blue ribbon filter paper. 0.1 M and 1 M NaOH, and 0.1 M NaOH / 0.4% H2O2 were used as extractants. The extraction degree of organic matter varied from 30 to 68% (taking into account the ash content).
Humic acids of brown coals were obtained from 0.1 M NaOH extracts by precipitation at pH 1, centrifugation at 10000 rpm for 10 minutes. Triplicate re-precipitation was used to purify samples. Ash content of the studied humic acids was less than 5%.
The atomic absorption spectroscopy was applied for the analysis of gold, platinum
and palladium content in brown coal alkaline extracts after decomposition of organic
matter with nitrohydrochloric acid.
623

Alkaline extracts of humic acids containing ions of gold, platinum and palladium were
fractionated using a chromatographic column packed with Toyopearl 65 with distilled water
as an eluent. HLPC was performed on a column Shodex Asahipak GS-520 HQ (Showa
Denko, Japan) by means of Shimadzu LC-20A Prominence (Japan) with refractometric
detector RID-10A and diode matrix detector SPD-M20A. Elemental compositions of humic
acids were determined using the CHNS-O analyzer EuroEA3000 (Eurovector, Italy).
Potentiometric titrations of humic acids were performed in a PC-controlled system under
constant argon flow. 6-10 mg of air-dried sample was dissolved in 10 ml of 0.1 M KCl
adjusted to pH 10 by addition of 0.1 M KOH to allow complete solubilization. Prior to
titration soltions were readjusted to pH 2.5 with 0.1 M HCl to attain complete protonation of
functional groups. The results of potentiometric titration were processed using the density
function method (1) which yields pK-spectra of humic acids.
3. RESULTS AND DISCUSSION
Characterization of extracts by means of HPLC revealed that increase of alkaline
concentration or addition of oxidizing agent promoted the extraction of humic fractions with
higher molecular weights and facilitated the recovery of precious metals. However, the
effect of increasing NaOH concentration from 0.1 M to 1 M was comparable with addition
of H2O2 (0.4%) that allows reduction of alkaline consumption in the presence of oxidizing
agent.
CH1 CH2 PV SH BK RK LCH1 LCH20,000,020,040,060,080,100,120,140,160,18
con
ten
t, g
/t o
f co
al
extract coal
Figure 1. Efficacy of gold recovery with extracts of humic substances from brown coals of
Pavlovsky (PV), Shkotovsky (SH), Bikinsky (BK), Cherny-shevsky (CH), Luchegorsky
(LCH) and Rakovsky (RK) coal fields.
Analysis of precious metal bulk content in brown coal and in related humic extracts
showed that gold can be extracted with efficiency of 20-69% (Fig. 1), the reliable
evaluation of extraction degree for palladium and platinum was complicated by low bulk
624
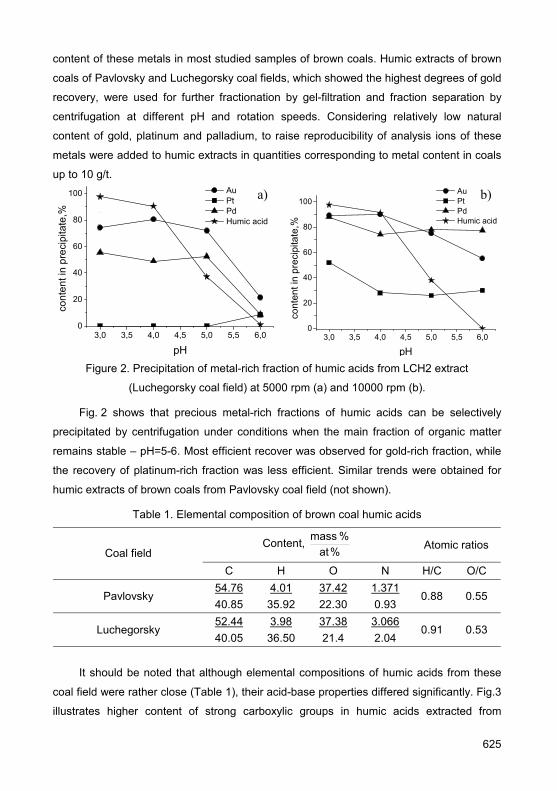
content of these metals in most studied samples of brown coals. Humic extracts of brown
coals of Pavlovsky and Luchegorsky coal fields, which showed the highest degrees of gold
recovery, were used for further fractionation by gel-filtration and fraction separation by
centrifugation at different pH and rotation speeds. Considering relatively low natural
content of gold, platinum and palladium, to raise reproducibility of analysis ions of these
metals were added to humic extracts in quantities corresponding to metal content in coals
up to 10 g/t.
3,0 3,5 4,0 4,5 5,0 5,5 6,00
20
40
60
80
100
cont
ent i
n pr
ecip
itate
,%
рН
Au Pt Pd Humic acid
3,0 3,5 4,0 4,5 5,0 5,5 6,00
20
40
60
80
100
cont
ent i
n pr
ecip
itate
,%
Au Pt Pd Humic acid
рН
a) b)
Figure 2. Precipitation of metal-rich fraction of humic acids from LCH2 extract
(Luchegorsky coal field) at 5000 rpm (a) and 10000 rpm (b).
Fig. 2 shows that precious metal-rich fractions of humic acids can be selectively
precipitated by centrifugation under conditions when the main fraction of organic matter
remains stable – pH=5-6. Most efficient recover was observed for gold-rich fraction, while
the recovery of platinum-rich fraction was less efficient. Similar trends were obtained for
humic extracts of brown coals from Pavlovsky coal field (not shown).
Table 1. Elemental composition of brown coal humic acids
Content, %at
%mass Atomic ratios Coal field
C H O N H/C O/C
Pavlovsky 54.76 40.85
4.01 35.92
37.42 22.30
1.371 0.93
0.88 0.55
Luchegorsky 52.44 40.05
3.98 36.50
37.38 21.4
3.066 2.04
0.91 0.53
It should be noted that although elemental compositions of humic acids from these
coal field were rather close (Table 1), their acid-base properties differed significantly. Fig.3
illustrates higher content of strong carboxylic groups in humic acids extracted from
625

Pavovsky brown coal that can explain higher overall colloid stability of humic acid fractions
and lowering pH of efficient separation of metal-rich fraction.
0 2 4 6 8 10 12 140
2
4
6
8
10 ρ 104
pKa
LCH2 PV
40 60 800,00
0,01
0,02
0,03
0,04
0,05
0,06
0,07
0,0
0,2
0,4
0,6
0,8
1,0
1,2
1,4
1,6
met
al c
once
ntra
tion,
a.u
.
V, ml
Au Pd Pt
D470
Humic acid
Figure 3. pK-spectra of humic acids from
brown coals of Pavlovsky (PV) and
Luchegorsky (LCH2) coal fields.
Figure 4. Distribution of gold, platinum and
palladium between humic fractions (gel-
filtration chromatography on Toyopearl 65).
The distinguished efficiency of the gold-rich humic fraction separation by
centrifugation suggests the lowest colloidal stability of gold-rich fraction, possibly, due to
reduction of Au(III) to Au(0) and formation of nanoparticles. Indeed, Fig. 4 shows that gold
was predominantly eluted with the high molecular weight fraction, while significant amount
of platinum and palladium were eluted with the low molecular weight fraction or remained
unbound. The lowest binding degree to humic acids observed in sorption experiments for
platinum explains very poor efficiency of platinum recovery by centrifugation.
4. CONCLUSIONS
Here we have shown that gold and palladium can be recovered from brown coals
with extracts of humic substances. Due to predominant binding of gold to less colloid-
stable high molecular weight fraction and possible formation of Au(0) nanoparticles
selective recovery of gold-rich fractions with efficacy up to 80% can be reached by
centrifugation at pH 5-6.
REFERENCES
1. Bratskaya, S., Golikov, A. 1998. J. Anal. Chem. 53, 234-239.
626
Influence of Humics Containing Materials on Poinsettia Hydroponics
Konstantin Chakalov, Todorka Popova, Valentin Savov, Gergana Angelova ROMB, 2 “Aboba” str., Sofia, Bulgaria, Sofia, Bulgaria; [email protected]
Keywords: humic, nutrition, poinsettia
1. INTRODUCTION
The poinsettia nutrition by subirigation with hydroponical solution creates danger of
nitrate tactility (1). Some producers use urea-rich fertilizers in combination with humic
substances.
The possibility of biological humification of lignites for production of leonardite-type
humus, suitable for bioremediation of polluted sites and for application as anti stress agent
in the reclamation of problematic anthropogenic substrate was observed in our previous
study
The aim of this study is observation and determination of the influence of humic acid
from biologicaly humified lignite on poinsettia (Euphorbia pulcherima) cultivation.
2. MATERIALS AND METHODS
The test was carried out with poinsettia variety Already Red in 4 variants and 4 plants
per variant. The plants were potted in 11 cm standard pot in neutralized sphagnum peat
with supplemental 5% clay. Irrigation was performed with commercial hydroponical
solution products of ADVANCED NUTRIENTS Canada with high urea content.
Supplemental humic acid was 12 ml/L per treated variant. The final EC of solution was
2300 μS/cm with humic acids and 2100 μS/cm in standard solution for the first 5 weeks
and 3200 and 2800 μS/cm on 5th-10th weeks. At the end of cultivation all plants were
irrigated with standard nutrient solution as during the first week.
Ornamental quality of the plant was observed – number of leaves, bract, and height
in cm, stem diameter, total leaf area, and number of red leaves.
The standard analyses of plant tissue were conducted on well developed leaves in
the initial phase of color development.
Experimental scheme was as follows: 1. Control; 2. Treatment with 5% solution of
humic substances isolated from Biotransfotmed lignite; 3. Treatment with 5% solution of
humic substances isolated from Biotransfotmed lignite+ poliacrilamid gel (0,5 g/dm3 coal);
4. Treatment with biotransfotmed lignite – 1g/pot. The method for humic substances
preparation was reported in our previous work (2).
627
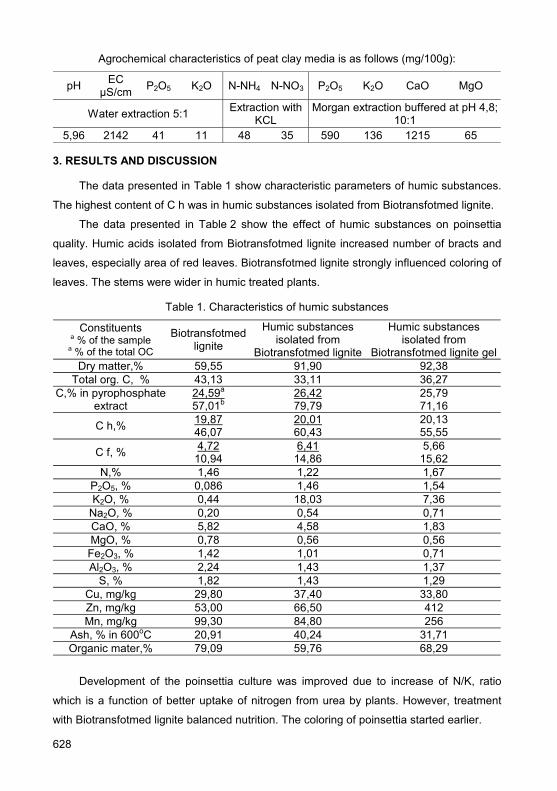
Agrochemical characteristics of peat clay media is as follows (mg/100g):
pH EC μS/cm P2O5 K2O N-NH4 N-NO3 P2O5 K2O CaO MgO
Water extraction 5:1 Extraction with KCL
Morgan extraction buffered at рН 4,8; 10:1
5,96 2142 41 11 48 35 590 136 1215 65
3. RESULTS AND DISCUSSION
The data presented in Table 1 show characteristic parameters of humic substances.
The highest content of C h was in humic substances isolated from Biotransfotmed lignite.
The data presented in Table 2 show the effect of humic substances on poinsettia
quality. Humic acids isolated from Biotransfotmed lignite increased number of bracts and
leaves, especially area of red leaves. Biotransfotmed lignite strongly influenced coloring of
leaves. The stems were wider in humic treated plants.
Table 1. Characteristics of humic substances
Constituents a % of the sample
a % of the total OC
Biotransfotmed lignite
Humic substances isolated from
Biotransfotmed lignite
Humic substances isolated from
Biotransfotmed lignite gelDry matter,% 59,55 91,90 92,38
Total org. С, % 43,13 33,11 36,27 С,% in pyrophosphate
extract 24,59а 57,01b
26,42 79,79
25,79 71,16
С h,% 19,87 46,07
20,01 60,43
20,13 55,55
С f, % 4,72 10,94
6,41 14,86
5,66 15,62
N,% 1,46 1,22 1,67 P2O5, % 0,086 1,46 1,54 K2O, % 0,44 18,03 7,36
Na2O, % 0,20 0,54 0,71 CaO, % 5,82 4,58 1,83 MgO, % 0,78 0,56 0,56 Fe2O3, % 1,42 1,01 0,71 Al2O3, % 2,24 1,43 1,37
S, % 1,82 1,43 1,29 Cu, mg/kg 29,80 37,40 33,80 Zn, mg/kg 53,00 66,50 412 Mn, mg/kg 99,30 84,80 256
Ash, % in 600оС 20,91 40,24 31,71 Organic mater,% 79,09 59,76 68,29
Development of the poinsettia culture was improved due to increase of N/K, ratio
which is a function of better uptake of nitrogen from urea by plants. However, treatment
with Biotransfotmed lignite balanced nutrition. The coloring of poinsettia started earlier.
628

Diameter = 1/ (0, 0616 + 0, 0559 / (N /K));
Diameter = exp (1, 603 + 0, 180*N)
Red leaves = 1/ (0, 047 - 0, 0225/ (N /K))
Table 2a. Biometrical data of treated poinsettia plants
Variant Bract Bract, % to control Leaves Leaves, %
to controlRed
leaves Red leaves, %
to control H, cm Н, % to control
1 6,33 100 62 100 30 100 24 100 2 7,17 113 78 127 30 99 29 119 3 6,00 95 67 108 30 101 25 104 4 5,67 89 62 101 37 122 27, 112
Table 2b. Biometrical data of treated poinsettia plants
Variant Red leaves in plant, %
Leaves area, cm2
cm2/pl, %to control
Red leaves area, cm2/pl
Red leaves, % to control
Stem D, mm
Stem D, % to control
1 50,20 2410 100 809 100 9,26 100 2 38,11 2507 104 979 121 11,66 1256 3 45,99 2333 97 1087 134 11,55 125 4 62,69 2788 115 1197 148 9,36 101
Table 3. Macroelements in leaf tissue, % of dry mater
Variant N P K Ca Mg N / P N / K 1 3,56 0,35 2,75 1,04 0,29 10,26 1,29 2 4,20 0,31 2,73 1,23 0,51 13,68 1,54 3 3,94 0,32 2,29 0,98 0,55 11,35 1,72 4 4,00 0,35 2,84 1,22 0,50 11,30 1,41
The photo presented in Figure 1 shows ornamental quality of treated plants.
Figure 1. The treated Poinsettia plants view: from left to right var. 1, 2, 3 and 4.
629

4. CONCLUSIONS
Treatment of poinsettia with humic substances from Biotransfotmed lignite improved
nitrogen nutrition with urea. The ornamental quality of the culture became better.
ACKNOWLEDGEMENTS
This work was supported by the National Innovation Fund, Bulgaria and ADVANCED
NUTRIENTS, Canada.
REFERENCES
1. Blom, T., Brown W., 2006. In: The University of Guelph Cyberconference Water quality
http://www.greenbeam.com/cyberconference/subirr-points.html
2. Popova, T., Chakalov, K., Mitov, K.,Savov, V.,2006. In Proc. XXIII International Mineral
Processing Congress, G. Onal et al. (Eds.),Istanbul, Turkey 3-8 September 2006, Vol.2 pp.
1226-1230.
630
Thermal Analysis of Standard Humic Acids
Daniela Montecchio, Ornella Francioso, Paola Gioacchini, Claudio Ciavatta Department of Agro-Environmental Science and Technology, viale Fanin n. 40, 40127 Bologna,
Italia, [email protected]
Keywords: IHSS standards, humic acids, TG-DTA, DRIFT
1. INTRODUCTION
Humic substances (HS) play an important role in many environmental processes in
soils, sediments and water (1). Their chemical structure has been discussed from different
viewpoints including molecular conformation, molecular aggregation, supramolecular
characteristics and many others (2). The International Humic Substances Society (IHSS,
http://www.ihss.gatech.edu/) has collected a number of reference HS originated from
specified locations, and all samples have been extracted using recommended and
supervised procedures. Thus, these materials can be considered a representative pool of
overall HS.
Among analytical techniques, thermal analysis is considered an important tool to
understand how functional group composition and different origin can influence the thermal
behaviour of HS (3-6).
In the present paper we have compared the thermal behavior of soil, peat, and
leonardite standard IHSS humic acids (HA) with those HA extracted from the respective
IHSS bulk solid sources and purified using dialysis procedure.
2. MATERIALS AND METHODS
The following standard IHSS samples were used: Elliott soil standard HA 1S102H (E-
HA), Pahokee peat standard HA 1S103H (P-HA), Leonardite standard HA 1S104H (L-HA);
and the respective bulk solids from Elliot silt Loam Soil (1BS102M), Pahokee Peat Soil
(2BS103P) and Gascoyne Leonardite (1BS104L).
Humic acids from bulk solids were extracted according to IHSS procedure until
precipitation of HA to pH <1 and then the HA were dialyzed against distilled water (cut-off
14,000 Da). The soil (S-HA-D), peat (P-HA-D) and leonardite (L-HA-D) HA obtained were
freeze-dried before analysis.
TG-DTA analyses were carried out simultaneously using a TG-DTA92 instrument
(SETARAM, France) as described in a previous paper (5).
631

The infrared spectra were recorded with a Bruker TENSOR series FT-IR
Spectrophotometer (Madison, WI) equipped with an apparatus for diffuse reflectance
(Spectra-Tech. Inc., Stamford, CT) (5).
3. RESULTS AND DISCUSSION
In general, the thermograms of standard HA were characterized by an unique strong
exothermic reaction at around 500°C as showed by TG curves (Figure 1, a). This
decomposition reaction was mainly produced by combustion of aromatic structures and
cleavage of the C–C bond (7). DTA curves showed also a slight shoulder at lower
temperature suggesting the presence of functional groups and aliphatic chain as confirmed
by DRIFT data (7, 9). Despite of the different origin of HA the thermal changes seem to be
due to the slight temperature shifts of the same exothermic reaction. On the contrast the
thermal profiles of S-HA-D, P-HA-D and L-HA-D (Figure 1, b) were significantly different
than those of respective standard-HA. In particular, two well defined exothermic reactions
characterize the DTA curves.
200 300 400 500
T (°C)
200 300 400 500
T (°C)
200 300 400 500
T (°C)
Soil Peat441
470
Leonardite373
399
423295
436
305
442521
a
b
Figure 1. TG-DTA curves of IHSS standard HA (a) and
HA extracted from IHSS bulk solid sources (b).
The first exothermic peak was considered to be the result of thermal combustion of
polysaccharides, decarboxylation of acidic groups and dehydration of hydroxylate aliphatic
structures (8). The mass losses related to the presence of these compounds were 37%,
40.1% and 51.8% (ash free) for S-HA-D, P-HA-D and L-HA-D, respectively. The intense
combustion reaction of the second peak might be due to the cracking of higher molecular
weight polynuclear systems (10). The temperature of combustion reactions related to first
and second exothermic peaks were lower in S-HA-D and P-HA-D than in L-HA-D. The
observed differences are unequivocally related to their humification rank. However the
noteworthy changes of thermal profiles between these and standard HA samples depend
on purification processes applied.
632
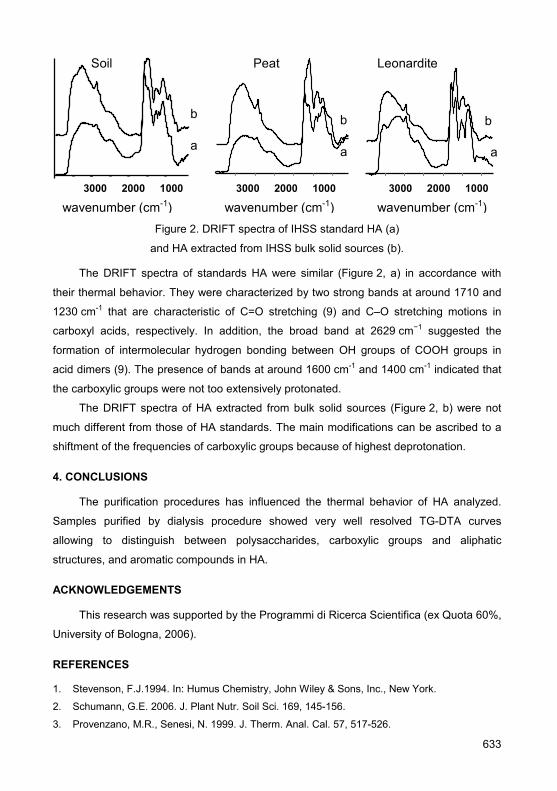
wavenumber (cm-1)
Soil Peat
a
b
a
b
1000
Leonardite
a
b
2000 3000 1000 2000 3000 1000 2000 3000
wavenumber (cm-1) wavenumber (cm-1) Figure 2. DRIFT spectra of IHSS standard HA (a)
and HA extracted from IHSS bulk solid sources (b).
The DRIFT spectra of standards HA were similar (Figure 2, a) in accordance with
their thermal behavior. They were characterized by two strong bands at around 1710 and
1230 cm-1 that are characteristic of C=O stretching (9) and C–O stretching motions in
carboxyl acids, respectively. In addition, the broad band at 2629 cm−1 suggested the
formation of intermolecular hydrogen bonding between OH groups of COOH groups in
acid dimers (9). The presence of bands at around 1600 cm-1 and 1400 cm-1 indicated that
the carboxylic groups were not too extensively protonated.
The DRIFT spectra of HA extracted from bulk solid sources (Figure 2, b) were not
much different from those of HA standards. The main modifications can be ascribed to a
shiftment of the frequencies of carboxylic groups because of highest deprotonation.
4. CONCLUSIONS
The purification procedures has influenced the thermal behavior of HA analyzed.
Samples purified by dialysis procedure showed very well resolved TG-DTA curves
allowing to distinguish between polysaccharides, carboxylic groups and aliphatic
structures, and aromatic compounds in HA.
ACKNOWLEDGEMENTS
This research was supported by the Programmi di Ricerca Scientifica (ex Quota 60%,
University of Bologna, 2006).
REFERENCES
1. Stevenson, F.J.1994. In: Humus Chemistry, John Wiley & Sons, Inc., New York.
2. Schumann, G.E. 2006. J. Plant Nutr. Soil Sci. 169, 145-156.
3. Provenzano, M.R., Senesi, N. 1999. J. Therm. Anal. Cal. 57, 517-526.
633
4. Francioso, O., Montecchio, D., Gioacchini, P., Ciavatta, C. 2005. Appl. Geochem. 20, 537-544.
5. Montecchio, D., Francioso, O., Carletti, P., Pizzighello, D., Chersich, S., Previstali, F., Nardi, S.
2006. J. Thermal Anal. Calorim. 83, 393-399.
6. Kucerik. J., Kovar. J., Pekar. M. 2004. J. Thermal Anal. Calorim. 76, 55–65.
7. Peuravouri, J, Paaso, N., Pihlaja K. 1999, Thermochim. Acta 325, 181-193.
8. Dell’Abate, M.T., Canali, S., Trinchera, A., Benedetti, A., Sequi, P. 2000. J. Thermal Anal.
Calorim. 61, 389- 395.
9. Francioso, O., Sànchez-Cortés, S., Canarini. D., Garcia-Ramos. J.V., Ciavatta, C., Gessa, C.
2002. J. Mol. Struct. 609, 137-147.
10. Sheppard, J.D., Forgeron, D.W. 1987. Fuel 66, 232-236.
634
Photoremediation Properties of Dissolved Organic Matter Extracted from Compost
Christian Coelho1, Alexandra Ter Halle1, Ghislain Guyot1, Claire Richard1, Luciano
Cavani2, Claudio Ciavatta2 1Laboratoire de Photochimie Moléculaire et Macromoléculaire, UMR n°6505 CNRS-Université
Blaise Pascal 63177 Aubière Cedex, France, [email protected] 2Dipartimento di Scienze e Tecnologie Agroambientali, Alma Mater Studiorum – University of
Bologna, Viale G. Fanin, 40 Piano terzo, I-40127 Bologna, Italy
Keywords: humic-like acids, water extractable organic matter, photoinduction
1. INTRODUCTION
There are two main stages in the composting procedure. The first stage of aerobic
biodegradation by thermophilic bacteria occurs during the first month in order to eliminate
pathogens. Next follows the curing stage where organic matter is stabilized. It has been
shown that during this stage lasting from 2 months to 6 months, organic matter evolutes.
When composting time increases, the part of hydrophobic fraction increases while that of
water extractable organic matter decreases (1).
In agriculture, compost is mostly used as an organic amendment or as a mulch.
These two applications lead respectively to soil fertilization or to improving of soil structure
and texture. Other compost applications are also possible. Organic matter from compost
can absorb sunlight and photosensitize organic pollutant degradation. It was recently
shown that humic- and fulvic-like substances and water soluble fractions from compost
can promote pollutants degradation under light excitation (2, 3).
The aim of this study is to compare photoinductive properties of various extracts:
humic-like acids (HLAs) and water extractable organic matter (WEOMs).
2. MATERIALS AND METHODS
Two different composts were chosen for this study : Green Manure (GM) and Urban
Biowaste (UB). They are made of green manure, trimming and crop residues for GM and
of a 60:40 (w:w) blend of green manure and municipal wastes for UB. For each compost,
three different times of composting were collected. Each sample was sieved at 5 mm and
air-dried for two weeks. The dried sample was milled and sieved at 0.5 mm. GM060,
GM120, GM180 correspond to composts obtained after 60, 120 and 180 days,
respectively. UB030, UB045 and UB090 correspond to composts obtained after 30, 45 and
90 days, respectively. WEOMs were obtained by extracting 50.0 g (oven dry equivalent) of
635
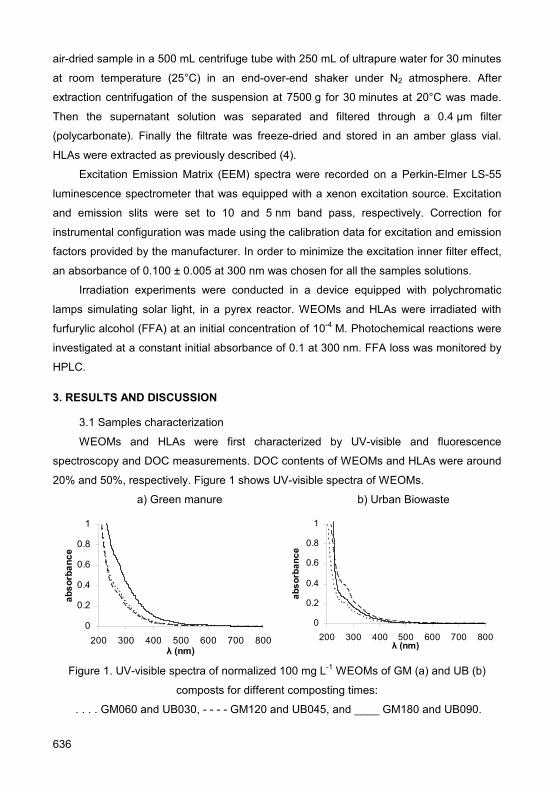
air-dried sample in a 500 mL centrifuge tube with 250 mL of ultrapure water for 30 minutes
at room temperature (25°C) in an end-over-end shaker under N2 atmosphere. After
extraction centrifugation of the suspension at 7500 g for 30 minutes at 20°C was made.
Then the supernatant solution was separated and filtered through a 0.4 µm filter
(polycarbonate). Finally the filtrate was freeze-dried and stored in an amber glass vial.
HLAs were extracted as previously described (4).
Excitation Emission Matrix (EEM) spectra were recorded on a Perkin-Elmer LS-55
luminescence spectrometer that was equipped with a xenon excitation source. Excitation
and emission slits were set to 10 and 5 nm band pass, respectively. Correction for
instrumental configuration was made using the calibration data for excitation and emission
factors provided by the manufacturer. In order to minimize the excitation inner filter effect,
an absorbance of 0.100 ± 0.005 at 300 nm was chosen for all the samples solutions.
Irradiation experiments were conducted in a device equipped with polychromatic
lamps simulating solar light, in a pyrex reactor. WEOMs and HLAs were irradiated with
furfurylic alcohol (FFA) at an initial concentration of 10-4 M. Photochemical reactions were
investigated at a constant initial absorbance of 0.1 at 300 nm. FFA loss was monitored by
HPLC.
3. RESULTS AND DISCUSSION
3.1 Samples characterization
WEOMs and HLAs were first characterized by UV-visible and fluorescence
spectroscopy and DOC measurements. DOC contents of WEOMs and HLAs were around
20% and 50%, respectively. Figure 1 shows UV-visible spectra of WEOMs.
a) Green manure b) Urban Biowaste
0
0.2
0.4
0.6
0.8
1
200 300 400 500 600 700 800λ (nm)
abso
rban
ce
0
0.2
0.4
0.6
0.8
1
200 300 400 500 600 700 800λ (nm)
abso
rban
ce
Figure 1. UV-visible spectra of normalized 100 mg L-1 WEOMs of GM (a) and UB (b)
composts for different composting times:
. . . . GM060 and UB030, - - - - GM120 and UB045, and ____ GM180 and UB090.
636
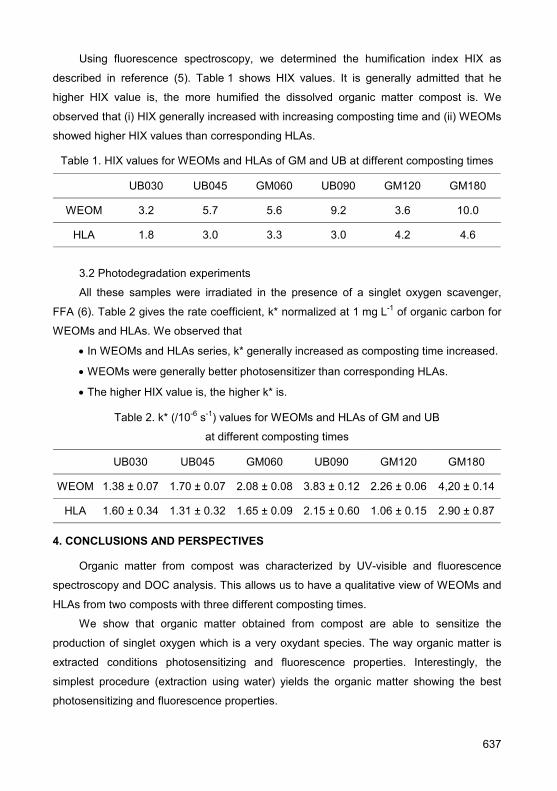
Using fluorescence spectroscopy, we determined the humification index HIX as
described in reference (5). Table 1 shows HIX values. It is generally admitted that he
higher HIX value is, the more humified the dissolved organic matter compost is. We
observed that (i) HIX generally increased with increasing composting time and (ii) WEOMs
showed higher HIX values than corresponding HLAs.
Table 1. HIX values for WEOMs and HLAs of GM and UB at different composting times
UB030 UB045 GM060 UB090 GM120 GM180
WEOM 3.2 5.7 5.6 9.2 3.6 10.0
HLA 1.8 3.0 3.3 3.0 4.2 4.6
3.2 Photodegradation experiments
All these samples were irradiated in the presence of a singlet oxygen scavenger,
FFA (6). Table 2 gives the rate coefficient, k* normalized at 1 mg L-1 of organic carbon for
WEOMs and HLAs. We observed that
• In WEOMs and HLAs series, k* generally increased as composting time increased.
• WEOMs were generally better photosensitizer than corresponding HLAs.
• The higher HIX value is, the higher k* is.
Table 2. k* (/10-6 s-1) values for WEOMs and HLAs of GM and UB
at different composting times
UB030 UB045 GM060 UB090 GM120 GM180
WEOM 1.38 ± 0.07 1.70 ± 0.07 2.08 ± 0.08 3.83 ± 0.12 2.26 ± 0.06 4,20 ± 0.14
HLA 1.60 ± 0.34 1.31 ± 0.32 1.65 ± 0.09 2.15 ± 0.60 1.06 ± 0.15 2.90 ± 0.87
4. CONCLUSIONS AND PERSPECTIVES
Organic matter from compost was characterized by UV-visible and fluorescence
spectroscopy and DOC analysis. This allows us to have a qualitative view of WEOMs and
HLAs from two composts with three different composting times.
We show that organic matter obtained from compost are able to sensitize the
production of singlet oxygen which is a very oxydant species. The way organic matter is
extracted conditions photosensitizing and fluorescence properties. Interestingly, the
simplest procedure (extraction using water) yields the organic matter showing the best
photosensitizing and fluorescence properties.
637

ACKNOWLEDGEMENTS
This work has been supported by INTAS within the framework of the project 8055.
REFERENCES
1. Said-Pullicino, D., Erriquens, F.G., Gigliotti, G. 2007. Biores. Technol. 98, 1822-1831.
2. Khodja, A.A., Trubetskaya, O., Trubetskoj, O., Cavani, L., Ciavatta, C., Guyot, G., Richard, C.
2005. Chemosphere. 62, 1021-1027.
3. Khodja, A. A., Richard, C., Lavedrine, B., Guyot, G., Trubetskaya, O., Trubetskoj, O. 2006.
Environ. Chem. Let. 3, 173-177.
4. Ciavatta, C., Govi M.J. 1993. J. of Chromatogr. A. 643, 261-270.
5. Zsolnay, A., Baigar, E., Jimenez, M., Steinweg, B., Saccomandi, F. 1999. Chemosphere. 38,
45-50.
6. Halladja, S., Ter Halle, A., Aguer, J.-P., Boulkamh A., Richard, C. 2007. Environ. Sci. Technol.
41, 6066-6073.
638

Potentials of Technical Lignins for Application as Soil Amendments: Free Radical Scavengers and Biological Activity
Tatiana Dizhbite1, Galina Telysheva1, Oskars Bikovens1, Olga Mutere2, Anna Andersone1
1Latvian State Institute of Wood Chemistry, Dzerbenes Street 27, LV-1006 Riga, Latvia,
[email protected] 2Institute of Microbiology & Technology, University of Latvia, Kronvalda Avenue 2, LV-1010, Riga,
Latvia
Keywords: lignin, antioxidant activity, biological activity
1. INTRODUCTION
The role of antioxidants in human and animal physiology and healthcare has been good recognized owing to studies carried out for at least 50 years. In recent years, research into antioxidant properties of naturally occurring polyphenols has drawn increasing attention. Polyphenols have shown many favorable effects on human health (1-4) and are well-known to be effective antioxidants for food lipids (5). In plants and soil biology impact of reactive free radicals, in particular reactive oxygen species, and the antioxidants that control them, is the subject of much recent researches aimed at understanding of mechanisms of the processes involved in soil organic matters (SOM) dynamics and of the chemical stabilization of SOM in particular (6).
A natural phenolic polymer lignin in plants serves to affect water transport, protect plant tissue against chemical and biological attack, and provide structural integrity. In its turn, lignins isolated from plant tissue, so called technical lignins – co-products of wood and agricultural plants chemical processing are intensively investigated as antioxidants for various materials. It was reported that kraft lignin was as effective as vitamin E as an antioxidant of corn oil (7). Lignin functions as an effective radical scavenger to prevent autoxidation and depolymerization of cellulose in pulps and papers (8). Incorporation of lignin into synthetic polymer systems can stabilize the material against photo- and thermal oxidation (9,10). As a major component in dietary fibres, lignin can inhibit the activity of enzymes related to the generation of superoxide anion radicals and obstruct the growth and viability of cancer cells (11).
The main objective of this study was to investigate the radical scavenging activity of the 12 lignin preparations obtained by alkaline delignification of deciduous and coniferous wood species, agricultural plants and waste from their processing, identifying the structural features of the lignin most important for its antiradical efficiency and to search relationship between lignin antioxidant and biological activities.
639

2. MATERIALS AND METHODS
In the present work, lignin preparations obtained by alkaline deignification (pulping) of
spruce (Picea abies), aspen (Populus tremula), birch (Betula pendula), grey alder (Alnus
incana), ash-tree (Fraxinus excelsior) wood, flax (Linum usitatissimum), hemp (Cannabis
sativa), abaca (Musa textiles), sisal (Agave sisalana), jute (Corchorus capsularis), wheat
(Triticium Vulgarae) straw and bagasse were characterized as potential antioxidants and
their biological activity was assessed. Rutin, epicatechin and ethanol extract from bee
propolis were tested in order to assess the efficacy of lignin preparations as antioxidants.
The key structural features governing antioxidant activity of lignin molecules, in
particular functional groups and polyconjugated sub-structures (12, 13), were determined
by relevant chemical and physico-chemical analytical methods described in (14, 15).
The procedures widely used to test the antioxidant properties of polyphenolic
molecules, namely assays with stable free radical DPPH (12), radical cation ABTS (16)
and superoxide radical-anion generated in the system hypoxantine/xanthine oxidase (17),
were applied. The kinetics and mechanisms of the interaction between lignins and the
DPPH radical was investigated by EPR spectroscopy.
Antimicrobial effects of lignin preparations were tested using 24 isolates of soil Gram
negative bacteria and 1 yeast culture (four types of agarized medium, i.e. modified M8*
medium with two different amendments, Tryptone Glucose Yeast Extract Milk Agar Plate
Count Agar with Skimmed Milk (TGA, SIFIN), and Eosyne Methylene Blue Agar (EMB,
SIFIN) as well as pure culture of bacterium E. coli (yeast-peptone medium).
3. RESULTS AND DISCUSSION
The results of the present work (Table 1) indicated that all lignin preparations under
investigation possess antioxidant activity in all test systems used.
For some lignins the radical scavenging efficacy is close to that for natural low-
molecular antioxidants – bee propolis and flavonoids, applied in medicine and veterinary.
The most promising data were obtained for aspen and flax lignins. These samples could
be considered as prospective polymeric antioxidants of natural origin, able to compete with
low-molecular commercialized antioxidants.
The same preparations (aspen and flax lignins) also revealed good results in the test
on supression of growth of pathogenic microorganisms exemplified by pure culture of
E. coli (Fig. 1).
640

Table 1. Characterization of antioxidant activity of lignin preparations
Sample DPPH test, EC50
a Superoxide radical
anion test, IC50b
ABTS test, IC50
c Spruce alkaline lignin 40.2±2.1 35.2±1.9 44.4±2.9 Birch alkaline lignin 17.6±0.5 7.6±0.8 7.8±1.1
Aspen alkaline lignin 14.1±0.3 1.8±0.2 5.8±0.1 Alder lignin 22.6±1.1 8.6±1.0 5.7±0.2
Jute alkaline lignin 15.0±0.5 52.0±2.1 15.2±1.0 Sisal alkaline lignin 14.5±0.5 38.8±3.3 n.d. Flax alkaline lignin 16.0±0.5 1.9±0.2 6.1±0.1
Abaca alkaline lignin 16.2±0.3 20.2±2.1 n.d. Bagasse alkaline lignin 44.2±3.1 38.2±1.1 69.2±5.1
Hemp alkaline lignin 58.2±4.3 44.6±1.1 n.d. Wheat straw alkaline lignin 88.2±2.3 34.5±3.7 n.d.
Bee propoliss 41.7±1.7 1.7±0.2 7.1±0.2 Epicatechin 7.5±0.7 3.8±0.2 3.1±0.1
Rutin 41.8±2.0 12.4±1.5 12.6±0.1 athe concentrations of the sample, mg/L, needed to decrease the initial DPPH•
concentration by 50% bthe concentration, mg/L, of the sample, responsible for the 50% decrease in О2
•−
generation cthe concentration of the sample, mg/L, needed to decrease the ABTS•)
concentration by 50%
0 20 40 60 80 100
Control Straw Lignin
Spruce Lignin
Jute Lignin Bagasse Lignin
Hemp Lignin
Adler lignin
Abaca Lignin
Aspen Lignin
Flax Lignin
Colony forming units, % on control
Figure 1. Lignin preparations influence on bacteria E. coli development.
The antimicrobial effect in the tests with soil isolates strongly depended on
environmental conditions. Some bacteria species and yeast demonstrated resistance to all
tested lignin preparations. The significant nonlinear Pearson correlation at the 0.05 level
was found between development of polyconjugation system in lignin macromolecule in
641
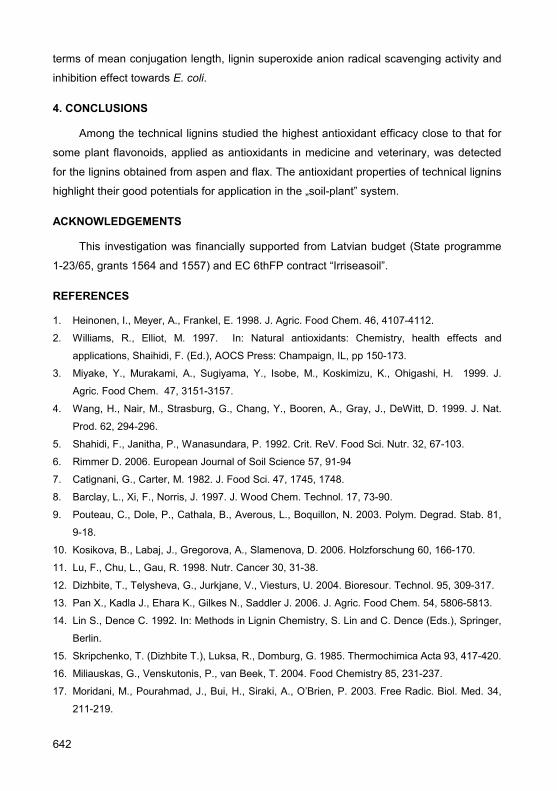
terms of mean conjugation length, lignin superoxide anion radical scavenging activity and
inhibition effect towards E. coli.
4. CONCLUSIONS
Among the technical lignins studied the highest antioxidant efficacy close to that for
some plant flavonoids, applied as antioxidants in medicine and veterinary, was detected
for the lignins obtained from aspen and flax. The antioxidant properties of technical lignins
highlight their good potentials for application in the „soil-plant” system.
ACKNOWLEDGEMENTS
This investigation was financially supported from Latvian budget (State programme
1-23/65, grants 1564 and 1557) and EC 6thFP contract “Irriseasoil”.
REFERENCES
1. Heinonen, I., Meyer, A., Frankel, E. 1998. J. Agric. Food Chem. 46, 4107-4112.
2. Williams, R., Elliot, M. 1997. In: Natural antioxidants: Chemistry, health effects and
applications, Shaihidi, F. (Ed.), AOCS Press: Champaign, IL, pp 150-173.
3. Miyake, Y., Murakami, A., Sugiyama, Y., Isobe, M., Koskimizu, K., Ohigashi, H. 1999. J.
Agric. Food Chem. 47, 3151-3157.
4. Wang, H., Nair, M., Strasburg, G., Chang, Y., Booren, A., Gray, J., DeWitt, D. 1999. J. Nat.
Prod. 62, 294-296.
5. Shahidi, F., Janitha, P., Wanasundara, P. 1992. Crit. ReV. Food Sci. Nutr. 32, 67-103.
6. Rimmer D. 2006. European Journal of Soil Science 57, 91-94
7. Catignani, G., Carter, M. 1982. J. Food Sci. 47, 1745, 1748.
8. Barclay, L., Xi, F., Norris, J. 1997. J. Wood Chem. Technol. 17, 73-90.
9. Pouteau, C., Dole, P., Cathala, B., Averous, L., Boquillon, N. 2003. Polym. Degrad. Stab. 81,
9-18.
10. Kosikova, B., Labaj, J., Gregorova, A., Slamenova, D. 2006. Holzforschung 60, 166-170.
11. Lu, F., Chu, L., Gau, R. 1998. Nutr. Cancer 30, 31-38.
12. Dizhbite, T., Telysheva, G., Jurkjane, V., Viesturs, U. 2004. Bioresour. Technol. 95, 309-317.
13. Pan X., Kadla J., Ehara K., Gilkes N., Saddler J. 2006. J. Agric. Food Chem. 54, 5806-5813.
14. Lin S., Dence C. 1992. In: Methods in Lignin Chemistry, S. Lin and C. Dence (Eds.), Springer,
Berlin.
15. Skripchenko, T. (Dizhbite T.), Luksa, R., Domburg, G. 1985. Thermochimica Acta 93, 417-420.
16. Miliauskas, G., Venskutonis, P., van Beek, T. 2004. Food Chemistry 85, 231-237.
17. Moridani, M., Pourahmad, J., Bui, H., Siraki, A., O’Brien, P. 2003. Free Radic. Biol. Med. 34,
211-219.
642
Influence of Selected Conditions on Chemical Properties of Humic Substances Formed during Composting of Municipal Solid Wastes (MSW)
Jakub Bekier1, Jerzy Drozd1, Maria Jerzykiewicz2 1Institute of Soil Sciences and Environmental Protection, Wroclaw University of Environmental and
Life Sciences, Poland 2Institute of Chemistry, Wroclaw University, Poland
Keywords: composting of MSW, IR spectra of HA, elementary composition of HA
1. INTRODUCTION
Biochemical processes occur during composting of Municipal Solid Wastes (MSW) lead to total decomposition of organic matter (mineralization) or its disintegration and resynthesis (humification) and formation of humic substances, like humic acids (HA). Problems connected with genesis, structure, chemical and physicochemical properties of HA are still a subjects of many researches and experiments. Despite of the development in analytical methods, the chemical structure and composition of HA is still unknown (1-2). However, in opinion of many authors the structure and composition of HA depends mainly on: properties of fresh material, composting conditions and time of composting (4-6). Observation of structural and chemical changes of HA during composting is considered as one of the best way to estimate direction of biotransformation and to determine compost maturity stage. The aim of experiment was determine the properties and elementary composition of HA extracted from MSW, composted according KKO – 100 technology in Zielona Gora (Poland) in period of five months.
2. MATERIALS AND METHODS
Material for research was collected from ten points, directly from composting piles and averaged to a representative samples. In sampling material, the following determinations were performed: temperature, humidity, TOC (total organic carbon), fractional composition of humic substances. Additionally, for humic acids extracted from every representative sample (method recommended by IHSS) elementary composition (Perkin – Elmer 2000) and FTIR spectra of HA (Bruker FTIR 113v) were measured.
3. RESULTS AND DISCUSSION
Intensity and direction of biotransformation processes during composting are limited by: an amount and character of organic substances, time of composting, water content
643

and the oxygen access. Figure 1 shows changes of value of composting parameters in time.
10
20
30
40
50
60
70
0 20 40 60 80 100 120 140 160Composting time (days)
tem
p (0 C
), hu
mid
ity(%
H 2O
)
temphumiditypile turnover
Fig. 1. Changes of temperature and humidity during composting of MSW in Zielona Gora.
The temperature and humidity of composting material was changed during
composting time and had very significant influence on direction and intensity of organic
matter transformation (Tab. 1). The contents of TOC, non humic fraction (CNHF) and
residual carbon (CR) decreased during composting time, but amount of CFA1, CHA1, and
CHA1/CFA1+2 ratio increased in more maturity compost.
Table 1. The contents of organic carbon in humic substances extracted from compost
CAC extracted (0.1 M HCl)
CALC extracted (0.1 M NaOH)
CFA1 CNHF CHA1 CFA2
Composting days TOC
g·kg-1
CR residual CHA1/CFA1+2
1 205.90 1,94 8.70 8.68 10.19 176.39 0.72
28 155.50 3.46 10.20 8.74 12.66 120.44 0 54
56 126.10 3.37 13.20 13.24 14.80 81.49 0.73
90 106.80 3.60 6.40 13.14 11. 90 71.76 0.85 149 87.80 3.26 3.57 12.89 9.82 58.26 0.99
Changes of organic carbon of humic substances (Tab. 1) proofs, that
biotransformation of organic matter in investigated material was caused mainly by
microbiological activity of composted MSW in mesophilic and termophilic phases. The
observation of presented parameters changes can be used as indicators of compost
maturity.
644

The results of elementary composition of extracted humic acids shows, that content
of C, N and O increases during composting time, while amount of H decrease (Tab. 2).
That results in H/C, C/N and O/C ratio changes which indicate aromatisation and
condensation of HA molecules during maturity of composted material.
Table 2. Changes of elementary composition of HA during composting of MSW
C H O N Composting days
atomic % H/C C/N O/C
1 33.27 47.88 15.67 3.18 1.44 10.47 0.47
28 34.20 44.06 18.09 3.65 1.29 9.38 0.53
56 33.71 43.92 18.53 3.83 1.26 8.80 0.55
90 36.73 38.36 20.87 4.03 1.04 9.11 0.57
149 40.18 29.77 25.60 4.44 0.74 9.05 0.64
Although FTIR of extracted humic substances are very typical and similar to each
other some changes in HA structures are noticeable (Fig. 2). Bands at 2920-2850 cm-1
attributed to aliphatic C-H stretch decrease in time of composting and confirm increase of
aromaticity of humic acids and consequently maturation of the compost.
4000 3500 3000 2500 2000 1500 1000 500d³ugoœæ [cm-1]
149
90
56
28
1
Figure 2. Changes of IR spectra of HA during composting of MSW in Zielona Gora.
645

The common features are bands at 1720 and 1650 cm-1 due to the C=O of carboxyl
and amide groups and 1540 cm-1 band due to the C-O stretch of polysaccharides.
Additionally, decrease of peak at 1720 cm-1 shows dissociation of carboxylic groups. The
1360, 1160 and 580 cm-1 bands were assigned as originating from sulfonyl units (7).
Although these spectra were not well resolved, they did provide structural information that
indicated the presence of aliphatic and aromatic components as well as degradation
products originating from proteins and polysaccharides.
4. CONCLUSIONS
All presented studies prove that composting processes leads to extend of aromatic
part of humic acids (C – HA) and directions and intensity of these changes are correlated
with composting conditions. Obtained results shows that during composting of MSW
changed significant properties synthesized humic substances.
REFERENCES
1. Drozd J., Jamroz E., Licznar M., Licznar E., Weber J. 1997. Organic Matter Transformation
and Humic Indices of Compost Maturity Stage During Composting of Municipal Solid Waste.
In: The Role of Humic Substances in the Ecosystems and in Environmental Protection. (Ed.
Drozd J. et al.), PTSH, Wrocław, 855 – 861.
2. Steintiford E. I., 1996. Composting Control: Principles and Practice. In: The Science of
Composting, (Ed. Bertoldi M., et al.), Blackie Academic & Professional, London, Glasgow,
Weinheim, New York, Tokyo, Melbourne, Madras, 49-59.
3. Mikki V., Senesi N., Hänninen K. 1997. Characterization of humic material formed by
composting of domestic and industrial biowastes. Chemosphere, Vol. 34, No 8, 1639 – 1651.
4. Chefetz B., Thatcher P. G., Hadar Y., Chen Y. 1996. Chemical and biological characterization
of organic matter during composting of municipal solid waste. J. Environ. Qual. 25, 776 – 785.
5. Castaldi P., Alberti G., Merella R., Melis P. 2005. Study of the organic matter evolution during
municipal solid waste composting aimed at identifying suitable parameters for the evaluation of
compost maturity. Waste Management 25, 209 – 213.
6. Chang J. I., Tsai J. J., Wu K. H. 2006. Thermophilic composting of food waste. Bioresource
Technology 97, 116 – 122.
7. Sposito G., Holtzclaw K. M. 1980. Interpretation of the infrared spectrum of fulvic acids
extracted from sewage sludge. Soil Sci. Soc. Am. J. 44, 177-178.
646

Effect of Potassium Humate on Advanced Potato Cultivars for Water Deficit Tolerance in Ardabil Region, Iran
Davoud Hassanpanah1, Elshad Gurbanov2, Aladdin Gadimov3, Reza Shahriari4 1Agricultural and Natural Resources Research Centre of Ardabil, Iran,
[email protected] 2Baku State University, Faculty of Biology, Baku, Azarbayjan 3Azerbaijan National Academy of Sciences, Institute of Botany, Baku, Azarbayjan 4Islamic Azad University, Ardabil branch, Iran
Keywords: potassium humate, potato, water deficit
1. INTRODUCTION
Water deficit is a common stress in potato cultivation. Because of potato’s high
susceptibility to water stress (4), preparing sufficient water is very important for increasing
potato quality and quantity. Climatic changes were occurred at the in recent years in the
Ardabil region. These changes caused differences in precipitation dispersion, river flowing,
and wells water. Therefore, we have to identify agronomic characters and water need of
new potato varieties and extra improvement of their quality and quantity. Potassium
humate is an active hormone with natural origin that extracts from plants and animal
remains exist in the bottom of marshes. This material is formed from N, P, K and
microelements namely Mo, Cu, Zn, B, Co, Mg (5). Potassium Humate increases
accumulation of chlorophyll, sugar, amino acids and more improves the efficiency of
nitrogen utilization, allowing for reduced fertilizer rates, the plant’s ability to withstand the
stresses of heat, drought, cold, disease, insect and other types of environmental or cultural
pressures and also increases general plant productivity, in terms of yield, as well as plant
stem strength (2). Using of Potassium Humate increased root system, tuber yield, tuber
number per plant (1), root number (3) and pea numbers and weight per plant and
decreased nitrate amounts in leaves and roots (5) and decreased nitrate accumulation in
potato tubers (6).
2. MATERIALS AND METHODS
This experiment was done on three potato varieties namely Agria (susceptible),
Satina (semi-tolerant) and Ceaser (tolerant to water deficit) in 2007 and three irrigation
treatments (after 30 mm evaporation from basin class A, after 60 mm evaporation +
647

spraying by Potassium Humate, and after 60 mm evaporation) used. Experimental design
was split plot with three replications. Potassium Humate spraying with 250 ml in volume of
300 lit water per ha were done in the three stages of emergence, before tuberization and
after tuberization. Plants were measured for main stem number, plant height, tuber
number and weight in plant, total tuber yield and marketable tuber yield and dry matter
percent, marketable tuber number and weight per plant in the growth period and after
harvesting. Analysis of variances were done and comparison of means made by LSD
(Least significant difference) test.
3. RESULTS AND DISCUSSIONS
Results showed that there were significant differences in irrigation treatments for
tuber yield, marketable tuber yield, dry matter percent, tuber number and weight per plant,
and marketable tuber weight per plant. There were significant differences between
cultivars for dry matter percent, plant height and main stem number. Interaction of cultivars
× irrigation treatments was significant for tuber yield, marketable tuber yield and tuber
weight in plant.
Comparison of means for irrigation treatments showed that spraying by Potassium
Humate in stress condition induced increase of tuber yield, marketable tuber yield, dry
matter percent, tuber number and weight in plant, and marketable tuber number and
weight per plant and main stem number (Table 1). The highest tuber yield, marketable
tuber yield, dry matter percent, tuber number and weight per plant and marketable tuber
number and weight per plant and main stem number were made at 30 mm evaporation
and after 60 mm evaporation + spraying by Potassium Humate (Table 1). Spraying by
Potassium Humate in water deficit condition increased tuber yield 15.87 ton/ha,
marketable tuber yield 17.06 ton/ha, dry matter 2.69 %, tuber number per plant 2.72
number, tuber weight per plant 270.76g, marketable tuber number 2.58 numbers and
marketable tuber weight per plant 287.95g (Table 1).
Caesar (tolerant to water deficit) had the highest tuber yield, marketable tuber yield,
marketable tuber number, weight per plant and plant height (Table 2).
Correlation between tuber yield with marketable tuber yield and marketable tuber
number and weight per plant was positively significant.
648

Table1. Mean of different traits on different irrigation treatments
Irrigation treatments
Total tuber yield (t/ha)
Marketable tuber yield
(t/ha)
Tuber number
per plant
Tuber weight
per plant(g)
Main stem
number
Plant height(cm)
Dry matter percent
Marketable tuber
number per plant
Marketable tuber
weight per plant (g)
after 30 mm evaporation 48.85 a 46.10 a 8.54 a 870.04 a 4.25 a 53.53 a 19.92 b 6.78 a 847.57 a
after 60 mm evaporation
+ spraying by Potassium
Humate
45.79 a 44.80 a 8.68 a 858.64 a 4.56 a 52.62 a 21.56 a 7.07 a 839.97 a
after 60 mm evaporation 29.92 b 27.74 b 5.95 b 567.88 b 3.99 a 54.90 a 18.87 b 4.45 b 552.02 b
Table2. Mean of different traits on different cultivars
Cultivars
Total tuber yield (t/ha)
Marketable tuber yield
(t/ha)
Tuber number
per plant
Tuber weight
per plant(g)
Main stem
number
Plant height(cm)
Dry matter percent
Marketable tuber
number per plant
Marketable tuber
weight per plant (g)
Ceaser 42.42 a 40.24 a 7.45 a 779.43 a 2.71 b 59.87 a 20.51 a 6.04 a 763.50 a
Agria 40.89 a 39.02 a 8.08 a 767.45 a 4.95 a 55.63 a 20.85 a 6.42 a 746.82 a
Satina 41.24 a 39.38 a 7.64 a 749.67 a 5.14 a 45.56 b 18.99 b 5.88 a 729.24 a
4. CONCLUSIONS
Spraying by Potassium Humate in water deficit condition increased tuber yield 15.87
ton/ha, marketable tuber yield 17.06 ton/ha, dry matter 2.69 %, tuber number per plant
2.72 number, tuber weight per plant 270.76g, marketable tuber number 2.58 numbers and
marketable tuber weight per plant 287.95g.
REFERENCES
1. Anonymous. 2007b. The effects of Humates on crops. Focus on form: Retrieved 2007, from
http://www.teravita.com
2. Anonymous. 2008. A New, High Performance Proprietary Potassium Humate. Focus on form:
Retrieved 2008, from http://www.horticulturalalliance.com
3. Baraldi, R., Malavasi F.F.F., Predieri S. and Castagneto M. 1991. Effect of potassium humate
on apple cv. ‘Golden Delicious’ cultured in vitro. Plant Cell, Tissue and Organ Culture.
27(3):187-191.
4. Foti, S., Mauromicale G., Lerna, A. 1995. Influence of irrigation regimes on growth and yield of
potato C.V Spunta. Potato Res. 38,307-318.
649

5. Gadimov, A.G., Ahmedova A.N. and Alieva R.C. 2007. Simbiosis nodules bacteria Rhizobium
leguminosarum with Peas (Pisum sativum) nitrate reductase, salinification and potassium
humus. Transaction of the Institute of Microbiology of Azerbaijan National Academy of
Siences.Baku. 4:158-163.
6. Hassanpanah D., Gurbanov E., Gadimov A. and Shahriari R. 2007. Reduction of nitrate
accumulation in potato by use of Potassium Humate for human safety. Iranian Biomedical
Journal. 11(1):461.
650

Effect of Potassium Humate and Kadostim on Plantlets of Advanced Potato CVs
Davoud Hassanpanah1, Elshad Gurbanov2, Aladdin Gadimov3, Reza Shahriari4 1Agricultural and Natural Resources Research Centre of Ardabil, Iran,
[email protected] 2Baku State University, Faculty of Biology, Baku, Azarbayjan 3Azerbaijan National Academy of Sciences, Institute of Botany, Baku, Azarbayjan 4Islamic Azad University, Ardabil branch, Iran
Keywords: potassium humate, kadostim, potato, plantlet
1. INTRODUCTION
Kadostim is an organic cell pathway synthesized bio-stimulator that enhancing potassium leaf nutrient complex characteristics such as liquid formula with free amino acids and biologically active oligo-peptides developed for use in the post flowering stage and ripening of fruits. Products like as bio-stimulators and bio-fertilizers have effects and benefits for plants growth and development such as enhancing the process of seed germination, activating the formation of root system, stimulating the assimilation of micronutrients, accelerating the formation and growth of leaves, impacts over leaf stoma to control and regulate moisture, light, temperature, salinity and gas, activating the photosynthesis process of nutritional and substances and reserves, favors the formation of flowers, their capacity of fecundates, reducing the effects of stress and shock by transplantation, adverse weather (frost, drought and hailstorm) and chemical agents, facilitating the regeneration of damaged tissues, improving the absorption of all agrochemical products, stimulating the acquired immunology, increasing the resistance of the plants and yield and enhancing size, sorting and quality of the fruit, increasing the yield and fruit shelf life after harvest (1) (Table 3).
Potassium humate is an active hormone with natural origin that extracts from plants and animal remains exist in the bottom of marshes (Table 3). This material is formed from N, P, K and microelements namely Mo, Cu, Zn, B, Co, Mg (5). Potassium Humate increases accumulation of chlorophyll, sugar, amino acids and more improves the efficiency of nitrogen utilization, allowing for reduced fertilizer rates, the plant’s ability to withstand the stresses of heat, drought, cold, disease, insect and other types of environmental or cultural pressures and also increases general plant productivity, in terms of yield, as well as plant stem strength (3). Using of Potassium Humate increased root system, tuber yield, tuber number per plant (2), root number (4) and pea numbers and weight per plant and decreased nitrate amounts in leaves and roots (5) and decreased nitrate accumulation in potato tubers (6).
651
This experiment was conducted for evaluation of effect of two biological complexes namely Kadostim and Potassium Humate on meristem culture of potatoes.
2. MATERIALS AND METHODS
Experiment was done in biotechnology laboratory and greenhouse of Villkej Company in Ardabil Province, Iran in 2007. In this experiment, plantlets produced from meristem culture of Agria, Advanced Clone 397007-9, Marfona, Sante, Satina and Ceaser propagated by single node cuttings. Experimental design was factorial on the basis of complete randomized block design in ten replications. Factor A was plantlets produced from meristem culture of six advanced cultivars (Agria, Marfona, Sante, Satina, Ceaser and Advanced Clone 397007-9) and factor B was seven treatments (four concentrations of Potassium Humate as 0.5, 1, 1.5 and 2 ml, one concentrations of Kadostim as 1 ml, compound concentration of Potassium Humate and Kadostim as 1 ml/1MS medium (7) and without them as Control). After planting, plantlets reached to enough growth after about 30 days in 18-22 centigrade temperature and 16/8 photoperiod with 5000 lux intensity light. The days to transplantation, stem strength and rhizo-genesis measured. Analysis of variance was done and means compared by LSD (Least significant difference) test. Then, plantlets cultured in planting beds of Pitmass (Biolan) with punce (1:1 v/v) in a greenhouse. Experimental design was factorial on the basis of complete randomized block design in three replications. All of plantlets irrigated after planting by normal water. Macro and micro nutrients were used to provide for nutrition of plantlets. All of practices such as irrigation and control of weeds, pests and diseases were done regularly during growth period. Control of pests and fungus diseases were done respectively by use of 250cc per ha Confidor and 400 g/ha Equation-Pro. Mini-tubers harvested after about two months. Then some of traits measured such as average weight and number of mini-tuber per plant. Analysis of variance was done and means compared by LSD test.
3. RESULTS AND DISCUSSION
Results of analysis of variance showed significant differences between effect of Kadostim and Potassium Humate and advanced cultivars for transplantation to greenhouse, stem solidity and rhizo-genesis. Transplantation days of plantlets from in vitro to the greenhouse decreased from 30 days (control) to 13 days in MS media culture with compound of Potassium Humate + Kadostim by concentration of 1 ml/l MS culture, to 15 days in MS media culture with Kadostim by concentration of 1 ml/l MS culture and to 22 days in MS culture with Potassium Humate by concentration of 1 and 1.5 ml/l MS media culture and plantlets had the highest stem solidity and better rhizo-genesis in all of treatments. Agria, Sante and Marfona transplanted to the greenhouse earlier and Ceaser later than others.
Results of Analysis of variance in greenhouse showed significant differences between effect of Kadostim and Potassium Humate and advanced cultivars, for average of
652

mini-tuber weight per plant and number and weight of mini-tuber per plant. Compound concentration of Potassium Humate and Kadostim with 1 ml/1 MS media culture had the highest number of mini-tubers per plant (2.56 tubers). Potassium Humate 0.5 ml/1 MS and Kadostim 1 ml/1 MS had the highest mini-tuber weight per plant (3.09 and 2.89 g) and average of mini-tuber weight per plant (1.74 and 1.62 g) (Table 1). Agria had the highest number (2.84 tubers) and average weight of mini-tubers per plant (4.87 g) (Table 2). Potassium Humate 0.5 ml/1 MS on Satina, Kadostim 1 ml/1 MS on Marfona and Potassium Humate + Kadostim 1 ml/1 MS on Agria produced the highest number of mini-tubers per plant.
The price of one mini-tuber is about 0.25$ in Iran. In our study Potassium Humate and Kadostim increased the number of mini-tubers per plant (with mean of 1). Therefore about 25$ increased for production of mini-tubers per square meter. Thus Potassium Humate and Kadostim caused the economic effects pay attention to results of this research.
4. CONCLUSIONS
The Potassium Humate and Kadostim decreased the days to transplantation of plantlets from in vitro to the greenhouse from 30 days to 13-22 days and increased number and average of mini-tuber weight per plant.
Table 1. Mean of traits on different levels of Potassium humate
and Kadostim in the greenhouse
Treatments Number of mini-tubers
Weight of mini-tubers
(g)
Average weight of
mini-tubers (g)Kadostim 1 ml /l MS (KA=0.001) 1.78 b 2.89 ab 1.62 a
Kadostim 1 ml+ Potassium Humate 1ml /l MS 2.56 a 2.59 ab 1.01 b Potassium Humate 2 ml /l MS (PH=0.002) 1.50 b 2.69 ab 1.79 a
Potassium Humate 1.5 ml /l MS (PH=0.0015) 1.67 b 2.16 b 1.29 b Potassium Humate 1 ml /l MS (PH=0.001) 2.00 ab 2.61 ab 1.30 b
Potassium Humate 0.5 ml /l MS (PH=0.0005) 1.78 b 3.09 a 1.74 a Control (C=0.0) 1.56 b 2.20 b 1.41 b
MS= Murashige and Skoog media culture; l= liter.
Table 2. Mean of traits for different cultivars in the greenhouse
Cultivars Number of mini-tubers
Weight of mini-tubers (g)
Average weight of mini-tubers
Agria 2.84 a 13.81 a 4.87 a Satina 2.70 a 9.381 b 3.47 b
Marfona 2.54 ab 10.10 b 3.98 b Ceaser 2.25 b 7.143 c 3.17 b
Advanced clone 2.67 a 10.03 b 3.75 b Sante 2.63 a 9.524 b 3.62 b
653
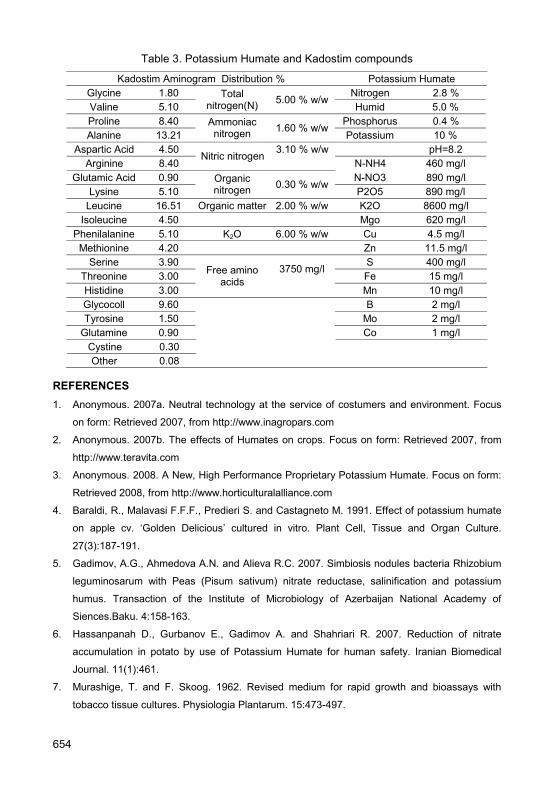
Table 3. Potassium Humate and Kadostim compounds
Kadostim Aminogram Distribution % Potassium Humate Glycine 1.80 Nitrogen 2.8 % Valine 5.10
Total nitrogen(N) 5.00 % w/w
Humid 5.0 % Proline 8.40 Phosphorus 0.4 % Alanine 13.21
Ammoniac nitrogen 1.60 % w/w
Potassium 10 % Aspartic Acid 4.50 3.10 % w/w pH=8.2
Arginine 8.40 Nitric nitrogen
N-NH4 460 mg/l Glutamic Acid 0.90 N-NO3 890 mg/l
Lysine 5.10 Organic nitrogen 0.30 % w/w
P2O5 890 mg/l Leucine 16.51 Organic matter 2.00 % w/w K2O 8600 mg/l
Isoleucine 4.50 Mgo 620 mg/l Phenilalanine 5.10 K2O 6.00 % w/w Cu 4.5 mg/l Methionine 4.20 Zn 11.5 mg/l
Serine 3.90 S 400 mg/l Threonine 3.00
3750 mg/l Fe 15 mg/l
Histidine 3.00
Free amino acids
Mn 10 mg/l Glycocoll 9.60 B 2 mg/l Tyrosine 1.50 Mo 2 mg/l
Glutamine 0.90 Co 1 mg/l Cystine 0.30 Other 0.08
REFERENCES 1. Anonymous. 2007a. Neutral technology at the service of costumers and environment. Focus
on form: Retrieved 2007, from http://www.inagropars.com
2. Anonymous. 2007b. The effects of Humates on crops. Focus on form: Retrieved 2007, from
http://www.teravita.com
3. Anonymous. 2008. A New, High Performance Proprietary Potassium Humate. Focus on form:
Retrieved 2008, from http://www.horticulturalalliance.com
4. Baraldi, R., Malavasi F.F.F., Predieri S. and Castagneto M. 1991. Effect of potassium humate
on apple cv. ‘Golden Delicious’ cultured in vitro. Plant Cell, Tissue and Organ Culture.
27(3):187-191.
5. Gadimov, A.G., Ahmedova A.N. and Alieva R.C. 2007. Simbiosis nodules bacteria Rhizobium
leguminosarum with Peas (Pisum sativum) nitrate reductase, salinification and potassium
humus. Transaction of the Institute of Microbiology of Azerbaijan National Academy of
Siences.Baku. 4:158-163.
6. Hassanpanah D., Gurbanov E., Gadimov A. and Shahriari R. 2007. Reduction of nitrate
accumulation in potato by use of Potassium Humate for human safety. Iranian Biomedical
Journal. 11(1):461.
7. Murashige, T. and F. Skoog. 1962. Revised medium for rapid growth and bioassays with
tobacco tissue cultures. Physiologia Plantarum. 15:473-497.
654

Effect of Potassium Humate on Production of Advanced Potato Mini-tuber CVs
Davoud Hassanpanah1, Elshad Gurbanov2, Aladdin Gadimov3, Reza Shahriari4 1Agricultural and Natural Resources Research Centre of Ardabil, Iran,
[email protected] 2Baku State University, Faculty of Biology, Baku, Azarbayjan 3Azerbaijan National Academy of Sciences, Institute of Botany, Baku, Azarbayjan 4Islamic Azad University, Ardabil branch, Iran
Keywords: potassium humate, minituber, potato, plantlet
1. INTRODUCTION
Potassium humate is an active hormone with natural origin that extracts from plants
and animal remains exist in the bottom of marshes. This material is formed from N, P, K
and microelements namely Mo, Cu, Zn, B, Co, Mg (4). Potassium Humate increases
accumulation of chlorophyll, sugar, amino acids and more improves the efficiency of
nitrogen utilization, allowing for reduced fertilizer rates, the plant’s ability to withstand the
stresses of heat, drought, cold, disease, insect and other types of environmental or cultural
pressures and also increases general plant productivity, in terms of yield, as well as plant
stem strength (2). Using of Potassium Humate increased root system, tuber yield, tuber
number per plant (1), root number (3) and pea numbers and weight per plant and
decreased nitrate amounts in leaves and roots (4) and decreased nitrate accumulation in
potato tubers (5).
2. MATERIALS AND METHODS
In this experiment, plantlets produced from meristem culture of Agria, Advanced
Clone 397007-9, Marfona, Sante, Satina and Ceaser propagated by single node cuttings.
Then, plantlets were cultured in planting beds of Pitmass (Biolan) with punce in a
volumetric form (1:1). Experimental design was factorial on the basis of completely
randomized block design in three replications. Potassium humate spraying was done with
two levels (0 and 250 ml in volume of 300 lit water per ha) and in the three growth periods
(plantlet with 5, 10 and 20 cm length). This experiment was done in biotechnology
laboratory and green house belonged to Villkej Company of Ardabil Province, Iran in 2007
year. All of plantlets irrigated after planting by normal water. Macro and micro nutrients
were used to provide for nutrition of plantlets. Plantlets reached to enough growth after
655

about 30 days in condition of 22-25 degrees centigrade temperature and 16 hours
photoperiod with 5000 lux intensity light. Spraying with potassium humate was done in
three growth stages (5, 10 and 20 cm in length of plantlets). All of practices such as
irrigation, weed out, pest and diseases control were done regularly during growth stages.
Control of pests and fungus diseases were done respectively by use of 250cc per ha
Confidor and 400 g/ha Equation-pro. Chlorophyll content was measured by CCM-200
made by OPTI-SCIENCES Company during of growth period and after spraying with
potassium humate. Minitubers were harvested after about two months. Then the number
and weight of mini-tubers per plant and average mini-tubers weight measured. Analysis of
variance was done for noted traits and means compared on the basis of LSD (Least
significant difference) test.
3. RESULTS AND DISCUSSION
Results showed that there were significant differences at probability level of 1 %
between cultivars, potassium humate levels and their interaction for Chlorophyll Content
Index, the number and weight of minituber per plant.
The highest Chlorophyll Content Index, the number and weight of mini-tuber per
plant, and average weight of mini-tuber per plant was made by 250 ml/ha potassium
humate treatment. Potassium humate caused to increase 4.76 Chlorophyll Content Index,
1.84 number of mini-tuber per plant, 17.15g weight of mini-tuber per plant, 2.04g average
mini-tuber weight per plant (Table 1).
The highest Chlorophyll Content Index and number of mini-tuber per plant was
belonged to Agria; weight of mini-tuber per plant to Sante and average mini-tuber weight
per plant to Satina and Sante, when treated by 250 ml/ha potassium humate (Table 2).
The most uniformity of produced mini-tubers was observed in 250 ml/ha Potassium
humate treatment. Potassium humate were caused increase of yield and crop quality in all
of the plants (1, 2 and 6). Use of potassium humate in potato causes them to produce
more than 70 % tubers with 35–55 mm seed size (2).
The price of one mini-tuber is about 0.25$ in Iran. In our study Potassium Humate
increased the number of mini-tubers per plant (with mean of 1.86 tubers). Therefore about
47$ increased for production of mini-tubers per square meter. Thus Potassium Humate
caused the economic effects pay attention to results of this research. On the other hand
we would like to apply results of this research for increase of production of mini-tuber per
plant, so decrease in production cost until farmers could buy cheaper mini-tubers.
656

4. CONCLUSIONS
Potassium humate caused to increase Chlorophyll Content Index, number of mini-
tuber per plant and average mini-tuber weight per plant. The most uniformity of produced
mini-tubers observed in 250 ml/ha Potassium humate treatment.
Table 1. Mean of different traits on different levels of Potassium humate
Potassium Humate
Chlorophyll Content Index
Mini-tuber number per plant
Mini-tuber weight per plant (g)
Average mini-tuber weight (g)
250 mlit/ha 32.10 a 4.92 a 36.12 a 7.48 a
0 mlit/ha 27.34 b 3.08 b 18.97 b 5.44 b
d 4.76 1.84 17.15 2.04
Table 2. Mean of different traits on potato CVs. and different levels of Potassium humate
Potassium Humate
Cultivars Chlorophyll
Content Index
Mini-tuber number per
plant
Mini-tuber weight per plant (g)
Average mini-tuber weight (g)
Sante 34.06 b 4.50 bcd 40.68 a 9.03 a
Ceaser 30.90 d 5.33 ab 36.40 c 6.82 cd
Advancd Clone 24.36 h 4.66 bc 30.17 e 6.44 de
Marfona 32.63 c 5.00 b 39.31 b 7.85 b
Agria 36.66 a 6.00 a 33.32 d 5.52 f
K-H
umat
e
250
ml/h
a
Satina 34.00 b 4.00 cde 36.86 c 9.21 a
Sante 27.63 ef 3.00 f 22.17 g 7.36 bc
Ceaser 25.43 g 3.67 def 26.73 f 6.31 def
Advancd Clone 25.33 g 3.00 f 19.36 h 3.00 g
Marfona 28.33 e 2.00 g 13.78 i 6.75 cd
Agria 30.33 d 3.50 ef 13.03 i 3.64 g
K-H
umat
e
0 m
l/ha
Satina 27.00 f 3.33 ef 18.73 h 5.58 ef
REFERENCES
1. Anonymous. 2007. The effects of Humates on crops. Focus on form: Retrieved 2007, from
http://www.teravita.com
657

2. Anonymous. 2008. A New, High Performance Proprietary Potassium Humate. Focus on form:
Retrieved 2008, from http://www.horticulturalalliance.com
3. Baraldi, R., Malavasi F.F.F., Predieri S. and Castagneto M. 1991. Effect of potassium humate
on apple cv. ‘Golden Delicious’ cultured in vitro. Plant Cell, Tissue and Organ Culture.
27(3):187-191.
4. Gadimov, A.G., Ahmedova A.N. and Alieva R.C. 2007. Simbiosis nodules bacteria Rhizobium
leguminosarum with Peas (Pisum sativum) nitrate reductase, salinification and potassium
humus. Transaction of the Institute of Microbiology of Azerbaijan National Academy of
Siences.Baku. 4:158-163.
5. Hassanpanah D., Gurbanov E., Gadimov A. and Shahriari R. 2007. Reduction of nitrate
accumulation in potato by use of Potassium Humate for human safety. Iranian Biomedical
Journal. 11(1):461.
6. Welch, M. 2003. Technologies for improved human health. IFA-FAO. Agricultural Conference,
Rome, Italy.
658
The Stimulation of Microorganisms Activity of Petropolluted Soils by Humic Preparations
Alexander Ivanov, Elizabeth Maltzeva, Natalya Yudina, Lydia Svarovskaya Institute of Petroleum Chemistry SB RAS, Akademichesky Avenue, 3, 634021, Tomsk, Russia,
Keywords: humic acids, hydrocarbon-oxidizing microorganisms, petropolluted soil
1. INTRODUCTION
Due to development of nature-protecting biotechnologies the interest to the study of
processes with participation of aerobic hydrocarbon-oxidizing microorganisms (HOM) has
increased. First of all it is concerned with the pollution of soil, surface and underground
waters by oil and oil products. The intensity and character of decomposition of oil
hydrocarbons in soil basically is defined by a functional activity of HOM, capable to
assimilate of oil as a unique source of carbon (1). The use of next ways for the
bioremediation of soils and waters from oil pollutions is possible: the entering into soil of
biological products on the basis of culture of active HOM and the stimulation of activity of
own native petroassimilating microflora of soil. One of such ways is the stimulation of
growth and activity of soil microflora by means of the entering of humic acids (HA) into the
polluted soil.
The purpose of the present work was to investigate the influence of features of
structure HA of different sources on dynamics of number and destructive activity of HOM
of petropolluted soil.
2. MATERIAL AND METHODS
The number and activity of soil microflora studied on the example of next
physiological groups: heterotrophs and actinomicetes. HA of low-moor wood peat of
«Klyukvennoe» field of the Tomsk Oblast (Russia) with a degree of decomposition of 25%
isolated by extraction of 0.1 N NaOH and used as a stimulating nutritious substratum. The
preparation HA1 from initial peat was the control. Preparations HA2 and HA3 are extracted
from a mechanoactivated peat (2). The mechanoactivation was carried out in the flow
vibrocentrifugal mill VCM-10 without additives (HA2) and in the presence of solid alkali
(3% NaOH) (HA3). HA4 – a commercial preparation of HA from brown coal (Aldrich).
For researches the oil in the concentration of 15 g/kg added in the soil to simulate
soil pollution. Solutions of HA added in the soil on 3 and 5-th days of the cultivation. The
659

doze of entering of the nutritious substratum on 100 g of the soil was 2 ml of a solution of
HA in the concentration 5 g/l.
Fractions of paraffin-naphthene hydrocarbons have been analysed by means of gas
chromatography with mass spectrometry (GC/MSD).
3. RESULTS AND DISCUSSIONS
Results of researches have shown that the addition of HA isolated from a
mechanoactivated peat under the cultivation of microorganisms in petropolluted soils has
the stimulating effect on the development of soil microflora, including HOM. The maximal
growth of number of heterotrophs and actinomicetes – the basic destructors of oil, has
noted after the addition of HA3 received from the mechanoactivated peat with alkali in the
petropolluted soil (fig. 1).
Figure 1. Number of heterotrophs and actinomicetes in the pure and petropolluted soil
after the addition of HA on 30 days of growth.
S - soil; S+HA1 - soil+HA from initial peat; S+HA2 - soil+HA from mechanoactivated peat
without additives; S+HA3 - soil+HA from mechanoactivated peat in the presence of alkali 3
% NaOH; S+HA4 - soil+HA from brown coal (Aldrich); S+O - soil+oil; S+HA1+O - soil+HA
from initial peat+oil; S+HA2+O - soil+HA from mechanoactivated peat without
additives+oil; S+HA3+O - soil+HA from additives peat in the presence of alkali 3 %
NaOH+oil; S+HA4+O - soil+HA from brown coal (Aldrich)+oil.
The mechanoactivation of peat can cause the increase of the availability of separate
components and parts of HA molecules, including micro-and macroelements, which are
used as food by soil microorganisms. It was shown that the soil microflora, stimulated by
HA, possesses an increased destructive oxidizing activity in relation to oil – additives of HA
660
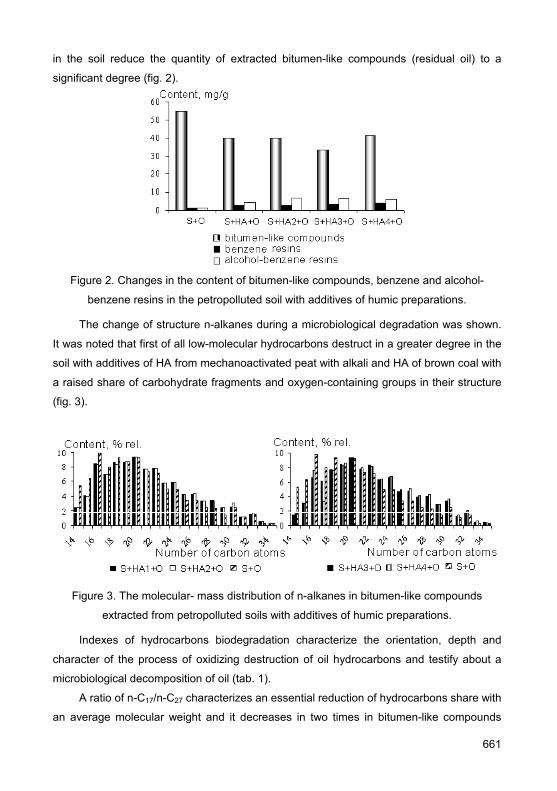
in the soil reduce the quantity of extracted bitumen-like compounds (residual oil) to a
significant degree (fig. 2).
Figure 2. Changes in the content of bitumen-like compounds, benzene and alcohol-
benzene resins in the petropolluted soil with additives of humic preparations.
The change of structure n-alkanes during a microbiological degradation was shown.
It was noted that first of all low-molecular hydrocarbons destruct in a greater degree in the
soil with additives of HA from mechanoactivated peat with alkali and HA of brown coal with
a raised share of carbohydrate fragments and oxygen-containing groups in their structure
(fig. 3).
Figure 3. The molecular- mass distribution of n-alkanes in bitumen-like compounds
extracted from petropolluted soils with additives of humic preparations.
Indexes of hydrocarbons biodegradation characterize the orientation, depth and
character of the process of oxidizing destruction of oil hydrocarbons and testify about a
microbiological decomposition of oil (tab. 1).
A ratio of n-С17/n-С27 characterizes an essential reduction of hydrocarbons share with
an average molecular weight and it decreases in two times in bitumen-like compounds
661

from samples with additives of HA3 and HA4. An index and-С19/н-С17 characterizes an
increase of branching and testifies about deeper processes of oil biodegradation in
variants with the application of preparations of HA3 and HA4. A coefficient of oddness
defined from the formula of Philippi Кo = 2С29/С28+С30 are a third index of oil
biodestruction (3). The value of Ko is close 1 for oil and slightly decreases in samples with
additives of HA. It means that high-molecular n-alkanes are subjected to destruction to a
lesser degree for the present level of microbiological oxidation.
Table 1. Indexes of hydrocarbons biodegradation in bitumen-like extracts of the soil and oil
Indexes of hydrocarbons biodegradation Objects
n-С17/n-С27 i-С19/i-С17 2С29/С28+С30
Soil+oil 3.3 0.13 1.1
Soil+oil +HA1 2.1 0.19 0.8
Soil+oil + HA2 2.0 0.19 0.8
Soil+oil + HA3 1.6 0.25 0.8
Soil+oil + HA4 1.5 0.24 0.8
4. CONCLUSIONS
Thus, results of researches have shown, that the addition of HA isolated from
mechanoactivated peat in petropolluted soils has a stimulating effect on the development
of soil microflora, including hydrocarbon-oxidizing microorganisms with an increased
destructive oxidizing activity in relation to oil.
ACKNOWLEDGEMENTS
This work was supported by Siberian Division of the Russian Academy of Science,
Interdisciplinary integration project № 4.
REFERENCES
1. Doff, W., Stelof, M. 1989. Forsch. actnell. V.6. P. 24-26.
2. Ivanov, A., Yudina, N., Lomovsky ,O., Mathies, E. 2006. In: Humic Substances – Linking
Structure to Functions. Proceedings of the 13th Meeting of the International Humic
Substances Society, July 30 to August 4, 2006, Universität Karlsruhe (TH). Band 45-I.
Karlsruhe. pp. 341-344.
3. Philippi, G.T. 1965. Geochim. Cosmochim. Acta. 29. pp. 1021-1049.
662

Coal Biodegradation by Basidiomycetes for Production of Biofertilizers and Soil Conditioners
Olga Klein1, Elena Stepanova1, Natalia Kulikova1,2, Olga Koroleva1 1A.N. Bach Institute of Biochemistry Russian Academy of Sciences, Leninskii 33, 119071,Moscow,
Russia, [email protected] 2Department of Soil Science, Lomonosov Moscow State University, Leninskie Gory, 119992,
Moscow, Russia
Keywords: coal degradation, Coriolus hirsutus, biofertilisers, humic-like substances
1. INTRODUCTION
Coal is a traditional energy source for many countries and its use will not be reduced
in the nearest future in spite of environmental damage by this energy source. Therefore
great attention is paid for development of technological approaches to convert hard coal or
lignite to a clean, cost effective energy source or to product value added products (1). The
technological approaches focusing on conversion of coal slime and sludge as wastes of
coal industry is also of great importance For Russian Federation.
The most perspective for conversion of coal slime considered to be biotechnological
approaches based on microbial and/or enzymatic treatment (1, 2). These approaches are
environmentally safe, cost efficient (carrying out at moderate pressure and temperature)
and resulted in production of bioactive compounds.
The aim of the present study was to develop an approach for conversion of coal
slime by Basidiomycetes and characterize the products formed during biotransformation.
2. MATERIALS AND METHODS
Pure culture of Basidiomycete Coriolus hirsutus 075 (Wulf. Ex. Fr) Quel. was used in
this study. The samples of brown coal from Sonzevskoy deposit (Sakhalin, Russia) were
used. For the experiments, the coal sample was air-dried, grinded and sieved through
1 mm sieve.
The strain was surface-cultivated in 250-ml flasks containing 50 ml of full or poor
(without a favored carbon source glucose) nutrition medium, porcelain beads and
inoculum. Full nutrition medium was prepared using following compounds (g/l): glucose
(10.0), peptone (3.0), KH2PO4 (0.6), ZnSO4·2H2O (0.001), K2HPO4 (0.4), FeSO4·7H2O
(0.0005), MnSO4·7H2O (0.05), MgSO4·7H2O (0.5) at pH 6.0. Inoculum was prepared
663

according to (3). When required, 5 g of coal was added to the flask. Coal samples were
sterilized by heating to 120°C for 1 h. Surface cultivation lasted for 30 days.
During the cultivation biomass of Coriolus hirsutus mycelium was monitored. At the
end of cultivation coal was separated from the nutrition media by filtration, dried at 50°C,
and weighted.
To estimate biological activity of the residual nutrition medium after fungi cultivation,
bioassay experiments were conducted using seedlings of wheat Triticum aestivum L. as
target object. Seeds were germinated in the residual nutrition medium for 72 h at 24°C.
Then length of shoots and roots were measured and used as response.
3. RESULTS AND DISCUSSION
Coal biotransformation can be considered as complex process including enzymatic,
non-enzymatic and enzyme mediated stages. The strain Coriolus hirsutus grew rather well
both on poor and rich nutrition media under static conditions. The introduction of coal in
the media resulted in significant increasing of fungal biomass. The most profound effect
has been observed during the growth of fungus on rich medium with coal sample: the
amount of fungal biomass has increased in 60 folds compared with blank (rich media
without coal). During the growth on poor media containing coal, a 14,5 fold increase in
fungal biomass has been determined. Analysis of the obtained data allowed concluding
the ability of basidiomycetes namely C. hirsutus to utilize coal as nutrient source.
The cultivation of C. hirsutus on both media with introduced coal resulted in decrease
in coal weight. Obtained results are presented in Table 1. The most drastic decrease (up
to 83% of initial weight of coal) was observed when poor medium was used. The latter
indicated for the coal utilization Basidiomycetes as a carbon source confirming our
assumption.
Table 1. Losses of coal during liquid surface cultivation of Coriolus hirsutus 075
(Wulf. Ex. Fr) Quel. under full and poor nutrition media conditions.
Variant Weight of coal, % of initial
Blank, poor medium 100
Poor medium 83
Blank, full medium 100
Full medium 90
The comparative study of biological activities of residual cultural liquids after fungus
cultivation has been carried out. The data are presented in Fig. 1. Obtain results
664

demonstrated that among the variants studied, the full nutrition medium after fungi
cultivation in the presence of coal possessed pronounced stimulating effect in relation to
both wheat shoots and roots growth. That finding indicated that basidiomycetes Coriolus
hirsutus 075 produced some bio-solubilized compounds from coal that possessed
physiological activity towards seedlings. Therefore, it can be concluded that residuary full
nutrition media after basidiomycetes Coriolus hirsutus cultivation in the presence of coal
could be recommended for further study for its biological activity.
0
5
10
15
20
25
30
35
40
45
Length, mm
1 2
Control
Media withcoal andfungy
A
0
5
10
15
20
25
30
35
40
45
Length, mm
1 2
Control
Media withcoal andfungy
B
Figure 1. Influence of residuary nutrition media (A - poor media and B – rich media) on
growth of shoots (1) and roots (2) of wheat Triticum aestivum L.
Analyzing the data it can be seen that limitation of carbon source (poor media)
induced coal biotransformation with production of compounds utilized by fungi for biomass
production. However growth on rich media resulted in enhance production of bioactive
compounds. The further study will be focused on characterization of these compounds and
their biological activity.
665

4. CONCLUSIONS
The performed experiments on Corioulus hirsutus cultivation demonstrated the ability
of basidiomycetes to utilize coal as nutrient source under the surface cultivation. Among
the variants studied (liquid surface cultivation conditions on full and poor media) the most
pronounced decrease of coal weight was registered for the variant of liquid surface
cultivation using poor nutrition medium. The most significant increase in fungal biomass
production was observed during cultivation using rich nutrition medium.
Our findings indicated that basidiomycetes Coriolus hirsutus 075 produced some bio-
solubilized compounds from coal that possessed physiological activity towards wheat
seedlings. Residuary poor nutrition media after basidiomycetes Coriolus hirsutus 075
cultivation was seemingly not so effective as compared to full medium. Residuary full
medium after basidiomycetes Coriolus hirsutus 075 cultivation possessed the greatest
stimulating activity in terms of growth of both shoots and roots. This by-product of coal bio-
solubilization could be therefore recommended for further study for its biological activity.
ACKNOWLEDGEMENTS
This research was supported by the International Science and Technology Center
(#KR-993.2).
REFERENCES
1. Fakoussa, R.M., Hofrichter, M. 1999. Appl. Microbiol. Biotechnol. 52, 25-40.
2. Glaser, B., Lehmann, J., Zech, W. 2002. Biol. Fertil Soils. 35, 219-280.
3. Koroljova (Skorobogat'ko), O., Stepanova, E., Gavrilova, V., Morozova, O., Lubimova, N.,
Dzchafarova, A., Jaropolov, A., Makower, A. 1998. J. Biotechnol. Appl. Biochem. 28, 47-54.
666
Influence of Humic Substances on the Foam Formation and Cytotoxicity of Detergents
Hans-Peter Kloecking1, Ralf Junek2, Renate Kloecking2, Juergen I. Schoenherr2
1Institute of Pharmacology and Toxicology/Working Group Erfurt, University of Jena, Nordhäuser
Str. 78, D-99089 Erfurt, Germany, [email protected] 2Research Institute for Peat and Natural Products, Hochschule Zittau/Görlitz (FH) – University of
Applied Sciences, Friedrich-Schneider-Str. 26, D-02763 Zittau, Germany
Keywords: detergents, humic substances, foam formation, cytotoxicity
1. INTRODUCTION
Humic substances (HS) are known to interact with a variety of organic and inorganic
substances which makes them an important regulatory factor in the environment (1). Along
with the use of particular peat layers for the production of humic-rich bath additives the
question of possible physicochemical and toxicological changes of the bath medium due to
HS became relevant. The objective of the present study is therefore to examine
interactions between HS and detergents intended to be used for manufacturing of body
care products. In particular, foam formation, foam stability, changes in cytotoxicity as well
as other parameters of interest were analysed.
2. MATERIALS AND METHODS
Detergents: The anionic surfactant sodium dodecyl sulfate (SDS, Ferak, Berlin), the
non-ionic surfactants Plantacare® 2000 (PC-2000, Henkel KGaA, Düsseldorf) and Triton
X-100 (TX-100, Ferak, Berlin), and the amphoteric surfactant cocamidopropylbetain
(TEGO® Betain CKD, Th. Goldschmidt AG, Essen) were used.
Humic substances: Water-soluble parts of the Original Altteich® Bath Concentrate
(BC) (BNS GmbH, D-02956 Rietschen, Germany) and the sodium salt of humic acids
(sodium humate), extracted with 0.2 mol/l NaOH from the Altteich peat deposit at pH 9
were used for the experiments.
Foam height determination: The determination of foaming properties of detergents
was carried out according to the ASTM (American Society for Testing and Materials)
Standard D 1173 – 53 (re-approved 1997). The equipment consists of a calibrated 200 ml
pipette and a 100 cm long glass tubing as the receiver. Detergents with and without HS
were used as 0.1% (w/v) solutions in distilled water preheated at 49°C. The foam height
667

formed during running out the detergent solution from the pipette into the receiver is
measured every five minutes during a total period of 45 minutes.
Cells: Human promonocytic U937 cells (ATCC CRL 1593) were cultivated in RPMI
1640 medium containing 10% foetal bovine serum and 5% CO2. They were split every two
days at a ratio of 1:3 and used for the experiments two days after passaging.
Cytotoxicity: The surfactants were tested for cytotoxicity singly and in combination
with humic substances 1h after addition to the cells. The cytotoxicity was measured by
means of the tetrazolium reduction assay WST-1 (Roche Diagnostics GmbH, Mannheim,
Germany).
3. RESULTS AND DISCUSSIONS
The foam height after 0.1% SDS dropped continuously from 15 cm in the beginning
to 2 cm within 45 min. A mixture of 0.1% SDS and peat included bath concentrate (1:60)
Promote the foam formation within 10 min after the start (about 5 cm higher than SDS
alone). The foam formation curve crosses the SDS curve at 15 min, and a 2 cm deeper
foam height course was registered (Fig. 1).
0
5
10
15
20
0 10 20 30 40 50
Time (min)
Foam height (cm)
SDS 0.1% SDS 0,1% + TS 1:600 SDS 0,1% + TS 1:60
Figure 1. Influence of peat bath concentrate (BC) on foam formation and foam stability of
the detergent sodium dodecyl sulfate (SDS).
Triton X-100 proved to be a weak foam producer developing very short-living foam.
Already after 20 min the foam height dropped down from 13 cm at the beginning to <2 cm
at the endpoint (45 min). BC 1:60 and BC 1:600, respectively, had no influence on the
foam formation of triton X-100 (data not shown).
668

0
5
10
15
20
0 10 20 30 40 50
Time (min)
Foam height (cm)
PC-2000 0.1% PC-2000 0.1% + BC 1:600 PC-2000 0.1% + BC 1:60
Figure 2. Influence of the peat bath concentrate (BC) on foam formation and foam stability
of the detergent Plantacare® 2000 (PC-2000).
The detergent Plantacare® 2000 produced voluminous and very stable foam. BC 1:60
slightly increased the foam height in the first 10 minutes and decreased it markedly 15
minutes after measurements started. In contrast, BC 1:600, the foam height decrease in
combination with Plantacare was less pronounced (Fig. 2).
0
5
10
15
20
0 10 20 30 40 50
Time (min)
Foam height (cm)
TB 0.1% TB 0.1% + BC 1:600 TB 0.1% + BC 1:60
Figure 3. Influence of bath peat concentrate (BC) on foam formation and foam stability of
the detergent TEGO®-Betain (TB).
669
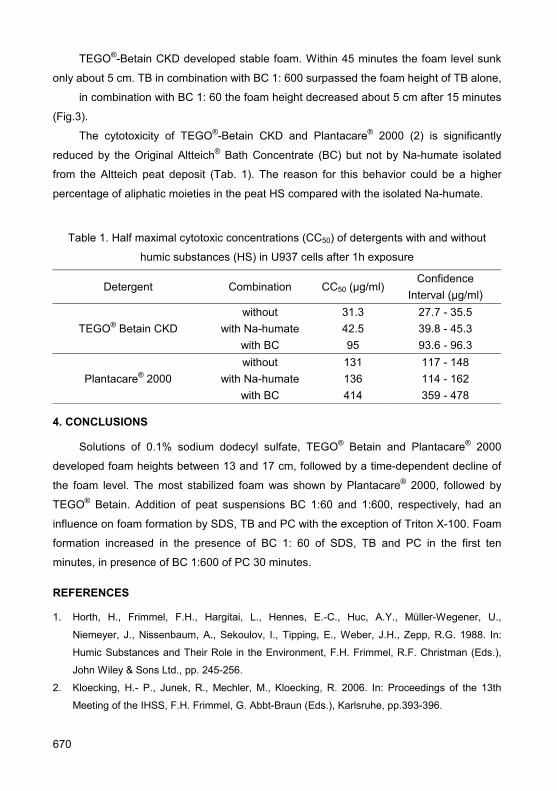
TEGO®-Betain CKD developed stable foam. Within 45 minutes the foam level sunk
only about 5 cm. TB in combination with BC 1: 600 surpassed the foam height of TB alone,
in combination with BC 1: 60 the foam height decreased about 5 cm after 15 minutes
(Fig.3).
The cytotoxicity of TEGO®-Betain CKD and Plantacare® 2000 (2) is significantly
reduced by the Original Altteich® Bath Concentrate (BC) but not by Na-humate isolated
from the Altteich peat deposit (Tab. 1). The reason for this behavior could be a higher
percentage of aliphatic moieties in the peat HS compared with the isolated Na-humate.
Table 1. Half maximal cytotoxic concentrations (CC50) of detergents with and without
humic substances (HS) in U937 cells after 1h exposure
Detergent Combination CC50 (µg/ml)Confidence
Interval (µg/ml)
TEGO® Betain CKD without
with Na-humate with BC
31.3 42.5 95
27.7 - 35.5 39.8 - 45.3 93.6 - 96.3
Plantacare® 2000 without
with Na-humate with BC
131 136 414
117 - 148 114 - 162 359 - 478
4. CONCLUSIONS
Solutions of 0.1% sodium dodecyl sulfate, TEGO® Betain and Plantacare® 2000
developed foam heights between 13 and 17 cm, followed by a time-dependent decline of
the foam level. The most stabilized foam was shown by Plantacare® 2000, followed by
TEGO® Betain. Addition of peat suspensions BC 1:60 and 1:600, respectively, had an
influence on foam formation by SDS, TB and PC with the exception of Triton X-100. Foam
formation increased in the presence of BC 1: 60 of SDS, TB and PC in the first ten
minutes, in presence of BC 1:600 of PC 30 minutes.
REFERENCES
1. Horth, H., Frimmel, F.H., Hargitai, L., Hennes, E.-C., Huc, A.Y., Müller-Wegener, U.,
Niemeyer, J., Nissenbaum, A., Sekoulov, I., Tipping, E., Weber, J.H., Zepp, R.G. 1988. In:
Humic Substances and Their Role in the Environment, F.H. Frimmel, R.F. Christman (Eds.),
John Wiley & Sons Ltd., pp. 245-256.
2. Kloecking, H.- P., Junek, R., Mechler, M., Kloecking, R. 2006. In: Proceedings of the 13th
Meeting of the IHSS, F.H. Frimmel, G. Abbt-Braun (Eds.), Karlsruhe, pp.393-396.
670
Effect of Different Physiologically Active Substances in Conditions of Greenhouse Industrial Production
Andrey Komarov1, Valery Karpenco, Nadezhda Naida2 1Agrophysical Research Institute, 14 Grazhdansky pr., 195220, Saint-Petersburg, Russia,
[email protected] 2Saint-Petersburg State Agrarian University, 2 Petersburgskoye shosse, 196660, Saint-Petersburg
Keywords: humic, lignin-humus acids, greenhouse industrial production
1. INTRODUCTION
Growing of greenery plants under industrial conditions defines the economy of this
industry. When producing vegetables under conditions of artificial lightning the problem of
increased accumulation of nitrates in vegetables is faced. Different physiologically active
substances become more and more popular as means for correction of bioproductive
process.
The aim of investigation was to evaluate physiologically active substances of different
origins (humates and ethylene-producers) under greenhouse conditions.
2. MATERIALS AND METHODS
In industrial conditions of greenhouse company “Leto” experiments with humic (GA-
Na), humus likely substances LGA-Na (lignin-humus product extracted from aspen) and
ethylene producer “Regrost” (obtained on the base of calcium carbide) were conducted.
The experiments were carried out in pots on the hydroponics installation produced by
companies Agro-forest-group and VEFI. The experimental crops were dill, lettuce, parsley,
spice and cucumber.
The concentration of nitrates was measured by potentiometric method with ion-
selective electrode. Yield of the crops was determined as biomass of the main output at
the regulated dates of harvesting. Average sample number for each treatment was from 40
up to 540 pots.
Doses of substances were optimized according to their physiological efficiency.
Humus substances were used in concentrations 10….10-4%. In some cases the seeds
were treated, in some cases the treatments were carried out on leaves.
671

3. RESULTS AND DISCUSSIONS
All investigated substances positively influenced on crops, but the efficiency of their
influence was different for different crops. Thus, more effective for dill plants was LGA-Na
(leaves were treated by LGA-Na in concentration of 10-5%). For the treatment of 540 pots
with dill plants 4 g of “Regrost” were used. As a result there were 34 % less of ill plants
and nitrates concentration decreased on 226 mg kg-1. The growth rate of plants increases
on 5-8 days after treatments with those substances.
The efficiency of the substances on lettuce was nearly the same. After treatments
with LGA-Na and Regrost the increase in fresh biomass was nearly 40%. The
improvement in yield quality was observed.
The most effective substance for parsley plants was Regrost. Nearly double increase
of the biomass was observed after treatments with this substance. The percentage of ill
plants was lower. After treatments with LGA-Na preparation the biomass increased by
40% and less than 4% were wastes.
The experiments showed that treatments with humic substances not only positively
influence yield of the crops, but also decrease content of nitrates in plants. In lettuce, dill,
parsley the concentrations of nitrates decreased more than two times (from 582 to 294 mg
kg-1) when ГК-Na was applied and more than 3 times (from 582 to 143 mg kg-1) when
LGA-Na preparations were used. The same relationship was observed in the variants with
cucumber. Concentrations of nitrates decreased from 464 to 222 mg kg-1 in the treatments
with GA-Na and to 133 mg kg-1 when LGA-Na preparations were applied.
4. CONCLUSIONS
The investigated substances considerably influenced bioproductivity and quality of
greenery crops and significantly corrected economical and ecological indexes of
greenhouse production.
To evaluate the effect of these concentrations 10…10-10% several peaks of
stimulated and inhibited influence of different gradients of the concentrations have a wave
character.
Humic substances and ethylene producers are not only activators of growth
processes. They might be used as means of management of quality of crops yield. It is
especially important for the production of dietetic foodstuff.
672

Efficacy of Silicious Lignin Products Application for Biological Agriculture Exemplified by Experiments with Red Clovers
Galina Lebedeva1, Galina Telysheva1, Livija Tiltina2, Alexander Volperts1 1LV Institute of Wood Chemistry, 27 Dzerbenes str., Riga, LV-1006, Latvia, [email protected] 2LLU Agency: Agriculture Research Institute, 7 Zemkopibas inst. Str., Skriveri-1, Aizkraukles
district, LV-5126, Latvia, [email protected]
Keywords: lignosilicon, organic farming, red clover, green mass yield and quality, soil fertility
1. INTRODUCTION
Lignosilicons (LSi) belong to the group of the biologically active, ecologically safe
compounds for the farming, which has been synthesized in the Institute of Wood
Chemistry. They are derived from the different lignocellulosic materials and are used as
growth activators for the cereals cultivation (oats, wheat, maize). LSi showed favorable
influence on the plants development, increased their productivity and improved quality of
the plants and soils, both. Earlier results of the LSi testing indicated its perspectives for the
oats and winter rye the biological farming with red clover undersow (1, 2). Small LSi
dosages (40-120 kg/ha) were added during sowing alongside with oats and clover seeds
and have activated root system development for both types of plant species (2). In the
case of clover not only root volume, but also root mass and number of tubercles increased.
Harvest of oats with red clover undersow was considerably higher than in the case of
control.
Aim of current work is to evaluate LSi influence on the clover green mass harvest, its
qualitative parameters and soil fertility as well.
2. MATERIALS AND METHODS
LSi is the powder-like compound with 5% silicon contents. It is being synthesized on
the base of ethanol production wastes using sulfur acid percolation hydrolysis of wood.
Tested species: two varieties of red clover Trifolium pratense L., Latvian selection:
fusariosis and cancer resistant brand “Divaja”, and brand “Jancis”, which is known for high
seeds productivity, cold resistance and ability to grow on non fertile soils for the 2-3 years.
Vegetation and field tests were done in the soil corresponding to Orthieurtic Mollic Gleysol
with organic matter content 3.9%, pHKCl 5.3-5.6, medium content of mobile K2O and P2O5.
For the evaluation of LSi influence on the agrochemical soil parameters soil samples were
taken using probe almost twice per vegetation period. The following data were acquired:
673

pHKCl, organics content (C, %), total nitrogen contents (%), nitrates content (NO3, mg kg-1),
K2O, P2O5 and Ca contents (mg kg-1). Analysis of plants for the macro and micro elements
contents has been performed as well. Root system was tested using calibrated scanner
Epson STD-1600+ and Win Rhizo 2002 C software package.
Microfield experiments in the years 2004-2007 were made at the certified biological
field. Plot size – 5 m2, distance between rows – 15 cm. LSi was manually introduced into
rows before the sowing in 40 kg/ha, 120 kg/ha and 240 kg/ha dosages. Mineral fertilizers
were not used. Normalized seeds consumption – 20 kg/ha (10 g per plot). For the plant
material sampling frame (0.5 x 0.5 m) was used. Each sample was taken four times.
Vegetation experiments were carried out in 6.5 l vessels, filled with screened soil taken
from the biological fields. Vegetation pots were placed on open air close to experimental
biological fields.
3. RESULTS AND DISCUSSION
Results of the vegetation experiments in the 6.5 l vessels and in the open fields have
shown that considerable differences in the development of the red clovers “Divaja” and
“Jancis” on the background of the LSi and without additional introduction of the mineral
fertilizers can be observed in 40-70 days after sowing and depend on the weather
conditions. Results of the microfield red clover “Jancis” experiments (July 7, 2004 – July
21, 2005) have shown that LSi did not influence on the seeds germination (70-72%, the
same result as in control). Differences in the plants development appeared 40 days after
sowing. The best development was observed in the case of 240 kg/ha LSi addition –
average green raw mass of single plant was up to 1.5 times higher than control, tubercles
amount was 28% higher than in control. Scanning of roots has shown 30% increase in
total roots length, 26% increase in roots volume and increase in forks and tips numbers.
After 70 days amount of tubercles in the samples grown on the background of 240
kg/ha LSi addition was 37% higher than in control, total root length – 65%, roots volume –
63%, tips and forks amount was more that two times higher. These results indicate that
LSi exhibits activating influence on red clover root system development, especially taking
in the view fact, that for control month after the first test root system additional growth was
insignificant, whereas on the background of the LSi it was higher than after first 40 days. In
the conditions of microfield experiment introduction of 40 kg/ha LSi into the upper soil layer
did not influence on harvest. On the background of 120 and 240 kg/ha LSi addition
increase of raw green mass of clover “Jancis” was 5% and 13%, correspondingly (16%
and 22% on dry matter). In the case of 240 kg/ha LSi amount of protein was 29% higher
674

than in control, and in the green mass of this clover plants the share of leaves and flowers
increased comparing to control (Table 1).
Table 1. Influence of the different LSi dosages on green mass “Jancis” clover harvest and
its quality, 2 hay-crops. Microfield experiment (July 7, 2004 – July 21, 2005)
Harvest, t ha-1 Botanic anylsis of green mass, %Variant
LSi dosage, kg ha-1
Green mass Dry mass
Protein harvest,
t ha-1 Leaves + flowers stem
Control 0 57.8±1.3 13.4±1.2 1.4±0.2 35±1 65±1 LSi 40 57.6±1.5 13.1±1.2 1.4±0.1 33±4 67±4 LSi 120 60.7±1.4 15.5±0.9 1.6±0.1 40±3 60±3 LSi 240 65.3±1.2 16.4±1.0 1.8±0.2 39±2 61±2
Soil analysis was performed in the spring of year 2005, 10 months after „Jancis”
clover sowing. Amount of organic matter in soil has increased from 4.7% to 5.0% and
5.1% correspondingly for the variants with 120 and 240 kg/ha LSi introduction.
Results of microfield experiments with „Divaja” red clover (July 7, 2005 – September
25, 2007) have shown that considerable differences in the plant development are being
observed 40-50 days after sowing, as in case of „Jancis” clover.
The highest results were obtained on the background of 240 kg/ha LSi addition: yield
of green and dry mass were 30% and 50% higher than in control, correspondingly, protein
amount was 60% higher. On the background of 120 kg/ha LSi addition yield of for green
and dry biomass, as well as protein, were 22%, 27% and 31% higher, correspondingly.
Clover seeds harvest in the year 2007 September was 18% (120 kg/ha) and 27% (240
kg/ha) higher than for control, so clover plants grown on the LSi background are
characterized with higher reproductive ability.
Macroelemental content in the “Divaja” clover biomass did not change on the
background of LSi addition, but considerable changes are being observed in the
microelements contents. Iron contents in leaves and flowers increased up to 30-40%, and
boron – 40% comparing to control. It should be noted 3-5 times increase of iron and 2-3
times increase of silicon in roots. Increase of iron and molybdenum contents in roots can
be explained by nitrogen fixation activation on the background of LSi. It is also being
proved by total increase of organics and total nitrogen contents in soil, as well as protein
contents in green mass of plants. Soil analysis was performed in the spring of year 2006,
10 months after sowing. It has shown increase of organic matter from 3.9% up to 4.4%
(120 kg/ha) and 5.1% (240 kg/ha). Total nitrogen content increased from 0.17% up to
675
0.23% and 0.25%, NO3 decreased from 33.7 mg kg-1 to 20.0 mg kg-1 and 23.3 mg kg-1 for
120 kg/ha and 240 kg/ha LSi dosages, correspondingly.
Soil analysis performed in the fall of year 2007, after seed harvesting, showed
favorable and prolonged LSi influence: 2.2 years after sowing organic mater in the soil
increased from 3.9% up to 4.3% in control and up to 5.3% for 240 kg/ha LSi dosage.
4. CONCLUSIONS
According to the results of microfield experiments LSi showed favorable influence on
the plants development, increased their productivity and improved qualitative parameters
of the plants and soils, both. The best results for the biomass harvest and seeds (2.2 years
after sowing), as well as increase in organic matter in soil, were observed for the LSi
dosage 240 kg/ha, introduced once into the upper soil layer before clover sowing. On the
background of LSi the share of leaves and flowers in green mass increased.
Increase of “Jancis” and “Divaja” red clover dry mass harvest was from 22% to 50%,
and increase of protein content was from 29% to 60%, for control and 240 kg/ha LSi
dosage, correspondingly.
Activity of microflora in soil is being increased on the background of LSi, as well as
nutrients and microelements uptake from soil and their transport into the plant.
Prolonged influence of LSi can be observed over two years – after 2.2 years after
sowing organic mater in the soil increased from 3.9% up to 4.3% in control and up to 5.3%
240 kg/ha LSi dosage. Clover seeds harvest was 18% (120 kg/ha) and 27% (240 kg/ha)
higher than control.
ACKNOWLEDGMENTS
This investigation was financially supported from Latvian Republic budget (Grants
1564 and 1557) and EC 6thFP contract “Irriseasoil”.
REFERENCES
1. Serge, I., Biteniece, G., Teliševa, G., Lebedeva, G., Lielpetere, A. 2003, June 26-28. In: Proc.
4th Intern. Scientific and Practical Conference, Latvia, Rezekne, pp. 238-24
2. Sparnina, M., Rancane, S., Lebedeva, G., Telysheva, G. 2005, June 16-18. In: Proc. 5th
International Scientific Conference “Environment. Technology. Resources“, Latvia, Rezekne,
pp. 123-128.
676
Inhibitory Action of New Organic Substrates for Ornamental Plants and Their Humic Fractions on the Growth of the Phytopathogenic Fungus Pythium ultimum
Elisabetta Loffredo, Mariagrazia Berloco, Nicola Senesi Dipartimento di Biologia e Chimica Agroforestale ed Ambientale, University of Bari, Via Amendola
165/A, 70126 Bari, Italy, [email protected]
Keywords: organic substrates, humic fractions, ornamental plants, compost, phytopathogenic
fungi, Pythium ultimum
1. INTRODUCTION
The production of ornamental plants is a relevant segment of worldwide agriculture,
and it has great economical importance in Italy. Peat and coconut fibres are considered
conventional organic growing media in container cultivation of these plants. Nevertheless,
new organic substrates which include composts have been recently used for at least
partial replacement of traditional plant growing matrices. In the last years, a number of
investigations have demonstrated the effectiveness of composts of various origin and their
humic-like fractions in suppressing soil-borne plant pathogens (1-3), and their application
to soil has been proposed to control many different diseases. Numerous fungal species
such as Pythium ultimum can cause severe damages to horticultural and ornamental
plants, especially at early growth stage and in greenhouse conditions. The organic fraction
is definitely the main component of growing substrates, and the major responsible of the
pathogenic-suppressive properties of these matrices. Few recent studies report a
significant action of humic and humic-like fractions in the growth inhibition of different
fungal species (4-6). The mechanisms by which composts or their humic fractions inhibit
plant pathogens are not fully understood, even if an evident relationship occurs between
physical, chemical and biological properties of these materials and their capacity to
suppress pathogenic fungi.
The objectives of this work were to test: (i) different new organic growing substrates
on the pathogenic activity in vivo of P. ultimum on plants of Impatiens walleriana; and (ii)
the humic and humic-like acids (HAs) isolated from these substrates, at two
concentrations, on the growth in vitro of the fungal mycelium.
677

2. MATERIALS AND METHODS
Plants of I. walleriana were grown for 14 weeks in a climatic chamber using a peat
(P) or a coconut fibres (CF) as conventional substrates, and a compost (C) or mixtures at
20, 40 and 60% (v/v) of C with P (C20+P, C40+P and C60+P) or C with CF (C20+CF,
C40+CF and C60+CF) as new organic substrates. During the growth period, the fungus
was inoculated three times in the substrates and pathogenicity was monitored by
observing the apparent symptoms of plant suffering and by measuring plant biometric
parameters, such as height, number of leaves and the length of the main leaf vein at 10,
12 and 14 weeks after transplanting.
In a second set of experiments, the HAs extracted from the 9 substrates by
conventional methods (7) were tested at concentrations of 50 and 300 mg/L on the growth
in vitro of P. ultimum on PDA (potato dextrose agar) medium according to the procedure
previously reported (5). All in vivo and in vitro experiments were replicated 6 times and
data obtained were statistically analysed by one-way analysis of variance (ANOVA), and
and the means of treatments separated by the least significant differences (LSD) test.
3. RESULTS AND DISCUSSIONS
The various substrates caused differentiated plant growth response. The treatments
with C alone or its mixtures at 40 and 60% with P or CF resulted lethal for plants even
before the first fungal inoculation (6 weeks after transplanting). The substrates C20+P and
C20+CF resulted the most effective in controlling the fungus and increasing the growth of
I. walleriana. In fact, the number of leaves per plant, plant height, and the average length
of the main vein increased respectively of 234, 95, and 33% for C20+P with respect to P
alone, and 192, 136 and – 3% for C20+CF with respect to CF alone (Fig. 1).
In the in vitro experiments, no morphological changes were observed for the fungal
mycelium as a function of the presence of any HA at 50 and 300 mg/L in the growing
medium, with respect to the control (PDA alone). However, the presence of the various
HAs in the PDA medium produced different specific growth responses by the fungus. The
higher dose of HAs isolated from C and P showed the maximum inhibitory effect on the
growth of P. ultimum, with respect to the control, causing a general decrease of the radial
growth of mycelium during the entire experimental time with a maximum of 55 and 39%,
respectively, at 18 h after inoculation (Fig. 2). Similar results were obtained in recent
studies (3, 5-6) that showed that composts or their HA-like fractions inhibited significantly
the growth of some soil-borne plant pathogenic fungi. In general, HAs isolated from all
678
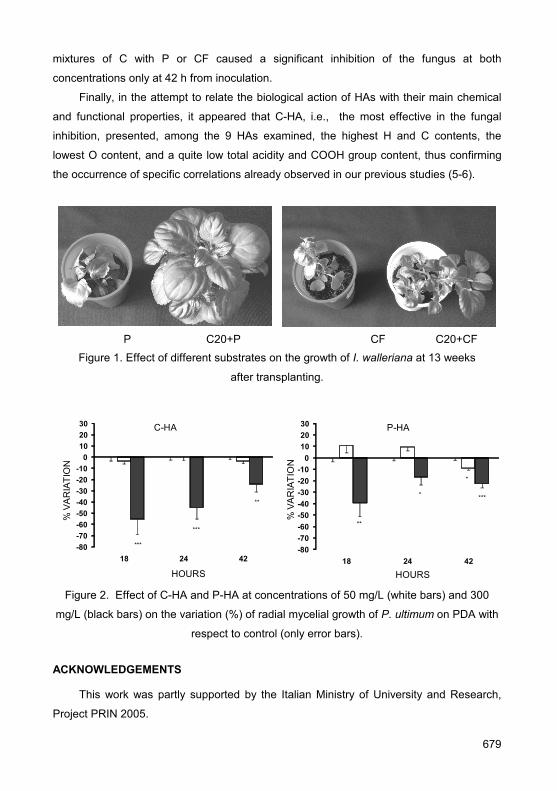
mixtures of C with P or CF caused a significant inhibition of the fungus at both
concentrations only at 42 h from inoculation.
Finally, in the attempt to relate the biological action of HAs with their main chemical
and functional properties, it appeared that C-HA, i.e., the most effective in the fungal
inhibition, presented, among the 9 HAs examined, the highest H and C contents, the
lowest O content, and a quite low total acidity and COOH group content, thus confirming
the occurrence of specific correlations already observed in our previous studies (5-6).
P C20+P CF C20+CF Figure 1. Effect of different substrates on the growth of I. walleriana at 13 weeks
after transplanting.
-80-70-60-50-40-30-20-10
0102030
18 24 42
% V
AR
IATI
ON
HOURS
C-HA
***
***
**
-80-70-60-50-40-30-20-10
0102030
18 24 42
% V
AR
IATI
ON
HOURS
P-HA
**
* ***
*
Figure 2. Effect of C-HA and P-HA at concentrations of 50 mg/L (white bars) and 300
mg/L (black bars) on the variation (%) of radial mycelial growth of P. ultimum on PDA with
respect to control (only error bars).
ACKNOWLEDGEMENTS
This work was partly supported by the Italian Ministry of University and Research,
Project PRIN 2005.
679
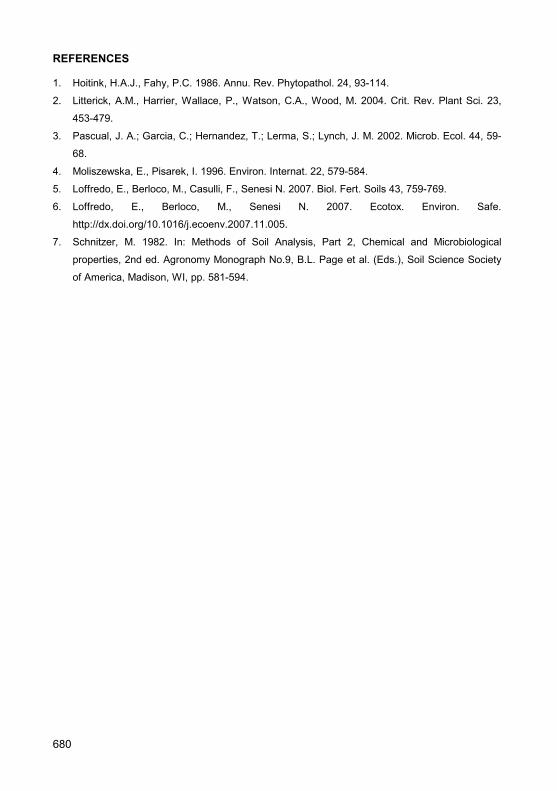
REFERENCES
1. Hoitink, H.A.J., Fahy, P.C. 1986. Annu. Rev. Phytopathol. 24, 93-114.
2. Litterick, A.M., Harrier, Wallace, P., Watson, C.A., Wood, M. 2004. Crit. Rev. Plant Sci. 23,
453-479.
3. Pascual, J. A.; Garcia, C.; Hernandez, T.; Lerma, S.; Lynch, J. M. 2002. Microb. Ecol. 44, 59-
68.
4. Moliszewska, E., Pisarek, I. 1996. Environ. Internat. 22, 579-584.
5. Loffredo, E., Berloco, M., Casulli, F., Senesi N. 2007. Biol. Fert. Soils 43, 759-769.
6. Loffredo, E., Berloco, M., Senesi N. 2007. Ecotox. Environ. Safe.
http://dx.doi.org/10.1016/j.ecoenv.2007.11.005.
7. Schnitzer, M. 1982. In: Methods of Soil Analysis, Part 2, Chemical and Microbiological
properties, 2nd ed. Agronomy Monograph No.9, B.L. Page et al. (Eds.), Soil Science Society
of America, Madison, WI, pp. 581-594.
680
Artificial Humic Substances as Possible Compensators of the Destroyed Links in Carbon Cycle
Marina Nadporozhskaya1, Elena Fedoros1,2, Valery Shipov2 1Biological and Soil Science Faculty of St. Petersburg State University, Oranienbaum Road, 2,
Staryi Petergof, Saint Petersburg, Russia, [email protected] 2Nobel LLC, Himichesky per, 1, St. Peterburg, Russia, [email protected]
Keywords: humic substances, carbon, soil organic matter, ecological solution
1. INTRODUCTION
One of the global ecological problems is the depletion of humus in intensively
exploited soils. Soil humic substances (HS) are important depot of carbon, which is
comparable to depot of oil and coal, but unlike the latter two, humic substances are
renewable. From the ecological point of view, to prevent further destruction of the
environment, optimal organic fertilizers must be produced not from natural resources, but
from materials already included into anthropogenic carbon cycle, such as organic wastes
and garbage, and cattle manure. Necessity of optimal utilization of wastes is
unquestionable. Previously use of cattle manure was good, until it became the problem in
Europe due to the lack of interaction between farms, producing manure, and end users.
Collection, storage and composting of animal wastes causes emission of large amounts of
greenhouse gases. The oxidative-hydrolytic destruction (OHD) technology was developed
by Biocorrection A/S to accelerate processes of humification of biogenic wastes and
prevent formation of CO2, CH4, NH4 and N oxides. This is extremely important, as carbon,
preserved in the stable soil organic matter, does not come into atmosphere. The matter in
OHD reactor is exposed to oxidative-hydrolytic destruction under high pressure and
temperature. Product, resulting from the OHD reaction, is represented by liquid part (BioC-
HS) and solid part with non-hydrolyzed residues (in ratio 10:1-2). BioC-HS is chemically
close to natural HS. The object of this research was to show physiological activity of BioC-
HS preparations, potential and limiting factor of their application.
2. MATERIALS AND METHODS
Laboratory experiments were conducted at constant temperature, optimal moisture
and in the absence of light. Analyzed soil samples comprised: humus-free mineral
materials (sand and loam, pHKCl 4.9 and 6.0, C 0.6 and 0.3%, correspondingly) and
materials from A1 horizon of soddy-podzolic loamy soil (pHKCl 4.0, C 3.9%). Cucumber
681

plant seeds were used for bio-indication. HS were used in two modifications: Na and Ca
forms (Na-, Ca-HS) produced from cow manure by the OHD method with addition of
NaOH and Ca(OH)2 correspondingly. .We used reagents of 50 mg HS / ml. HS consist of
85% of humic acids and fulvic acids were the rest. Microbial activity was estimated by
photo film application method. Soil aggregate waterproof was estimated by their
destruction in water (Standard method).
3. RESULTS AND DISCUSSION
Experiment 1
Physiological activity was tested on cucumber seeds, which were germinated in Petri
dish at 27ºC, wetted with excess concentration of BioC-HS (Na) solutions (fig. 1). The
observed results were similar to that of the activity of natural HS. The highest effect was
registered at 100 mg/l of HS, the lower and higher concentrations were not as effective.
The wider is the range of effective concentrations, the more usable is the product in
practical applications. That is why it is important to study further application of different
forms of HS in various plants.
0102030405060708090
100
Н2О 25 100 190 340 680
HS concentration, mg/l
Ger
min
atio
n, %
2 days3 days
Figure 1. Germination of cucumber seeds wetted with BioC-HS solutions.
Experiment 2
The BioC-HS (Ca) was applied to loam A1, loam and sand soils in doses equivalent
to 10 and 50 t/ha. BioC-HS (Ca) was found to reduce acidity of substrates and increase
total content of C and N. BioC-HS (Ca) increased microbial activity, when applied in the
dose of 10 t/ha and decreased the same, when applied in dose of 50 t/ha (fig 2). High
dose (corresponding to 50 tons per hectare) exhibited inhibiting effect. Correspondingly,
high doses of humic preparations will be quite efficient on early stages of remediation of
682

humus-free soil, since they inhibit activity of destructors, which eventually promotes
accumulation of organic matter in the soil.
Table 1. Chemical properties of 1 month-old composts
Variant рНН2О рНKCl C total, % N total, % C/N А1 4.96±0.01 3.97±0.02 3.44±0.01 0.37±0.01 9.44±0.09
А1+10 t/hа 5.13±0.01* 4.10±0.01 3.48±0.01 0.38±0.01 9.23±0.14 А1+50 t/hа 5.26±0.01 4.33±0.01 3.55±0.02 0.42±0.01 8.47±0.21
Loam 6.69±0.03 5.68±0.03 0.53±0.01 0.09±0.00 6.27±0.08 Loam +10 t/hа 7.06±0.01 6.14±0.01 0.66±0.01 0.04±0.00 15.5±0.58 Loam +50 t/hа 7.06±0.01 6.24±0.01 0.78±0.01 0.12±0.01 6.81±0.17
Sand 7.02±0.03 6.45±0.01 0.30±0.01 0.04±0.00 7.38±0.24 Sand +10 t/hа 7.07±0.01 6.73±0.01 0.35±0.01 0.04±0.00 8.75±0.32 Sand +50 t/hа 7.16±0.01 6.75±0.01 0.43±0.01 0.06±0.00 7.83±0.31
* Values in bold have significant difference with control on the level of 95%.
0102030405060708090
100
А1
А1 10 t/h
a
А1 50 t/h
aLoam
Loam10 t
/ha
Loam 50 t/h
aSand
Sand 10 t/h
a
Sand 50 t/h
a
Tota
l mic
robi
al a
ctiv
ity, %
Figure 2. Total microbial activity in Experiment 2.
The most promising results, in terms of structure of the soil, were registered in the
groups treated with BioC-HS (Ca). Used light loamy soil (variant “Loam”) in control group
had an unfavorable blocky structure, with prevalence of fractions with size larger than
10mm. Application of the humic preparation dramatically reduced the amount of block
aggregates larger than 10mm and thus improved the share of agriculturally important
fractions (from 10 to 0,25mm). The effect was more pronounced in groups, treated with
large amounts of BioC-HS humic substance preparation (corresponding to 50 tons per
hectare). As it is shown on the diagram (figure 3), BioC-HS (Ca) preparation had a
significant effect on water-stability of clay aggregates: the index increased from 13 to 70%
approaching that of park soil (90-92%).
683

0,0
20,0
40,0
60,0
80,0
100,0
А1 А1 10 t/ha А1 50 t/ha Loam Loam 10 t/ha
Loam 50 t/ha
Figure 3. Waterproof aggregates, %.
4. CONCLUSIONS
1. Application of HS preparation, produced by BioCorrection A/S aided in
accumulation of nitrogen and carbon in soils, stabilization of pH near neutral values. This
attests increased stability of the soil organic matter and, correspondingly, reduced
emission of greenhouse gases from the soils.
2. Prevalence of calcium humates within the BioC-HS (Ca) preparation provides
substantial improvement of the structure of clay soils. Water-stability of aggregates is seen
substantially improved, opening wide perspectives for application of the BioC-HS in
remediation of this type of soils.
3. It was revealed that biological activity of preparations is to a large degree
dependent on the dosage: low concentrations of the preparation may be inefficient,
average – can have stimulating effect and high may possess inhibiting properties. Thus,
humic substance preparations may be used both for inhibition and stimulation of soil
processes, related to activity of microorganisms; that is why selection of dosages and
administration regimens is an important task for researchers, conducting investigation of
applied aspects of utilization of humic substances.
ACKNOWLEDGEMENTS
This research was conducted with support from BioCorrection A/S (Denmark).
Authors are sincerely thankful to the company for mutually fruitful cooperation.
684

Isolation of Humic Substances from Underground Brine Water of Chiba, Southeast Japan
Nakayasu Ken, Ebata Hideki, Yamaguchi Tatsuaki 1Chiba Institute of Technology, 2-17-1, Tsudanuma, Narashino, Chiba 275-0016 Japan,
Keywords: underground brine, fulvic acid, electrodialysis
1. INTRODUCTION
The underground brine water is the fossil seawater confined to Pliocene-Pleistocene
stratum with sedimentary and diastrophisms. The largest hydropressured natural gas field
in Japan is the Minami-Kanto gas field, in Chiba prefecture, South-Eastern Japan. The
brine contains humic substances (HS), other than methane and iodine. These precious
natural resources, CH4 and I, are used for commercial purpose (the production of I2
accounts for 30% of the world), but HS, including fulvic acid (FA) at a concentration of 40-
70 mgL-1 in brine, are not utilized effectively as yet (1).
The physiological functions of FA on plants, especially as plant growth stimulations,
root stimulation, nutrient absorption and photosynthesis ability for embryo plant have been
examined (2-4). In addition, FA have various additional functions, including redox and
complexation abilities for metal ions (5-6) and hygroscopicity (7) caused by carboxylic
and/or other functional groups.
There are various procedures to isolate HS from natural water, of which the IHSS
method (8) is regarded as a de-facto standard procedure for isolation of HS. However, it
involves a considerable amount of hydrochloric acid and sodium hydroxide for the elution
from the resin column. Furthermore, it is not suitable for brine because of its high salinity
and iodine content.
Therefore, electrodialysis was applied to desalination and recovery of HS from high
salinity brine water. This alternative method is able to reduce the environmental loads, and
can be regarded as a “green process”.
2. MATERIALS AND METHODS
The FA from brine was prepared by the electrodialysis method. The electrodialyzer
used was the micro-acilyzer S1 equipped with a NEOSEPTA ion-exchange cartridge
(ASTOM, Japan). The molecular weight cut-off (MWCO) of this ion-exchange membrane
was 300 Dalton. The FA were characterized by elemental analysis and functional group
685

contents. Furthermore, the plant physiological activities of the FA were studied with
flowering kale (Brassica oleracea L. var. acephala DC. f. tricolor Hort) cultivated by
hydroponics with various concentration of FA and heavy metal ions (Cu, Cr) in cultivation
medium.
3. RESULTS AND DISCUSSION
During the progress of the electrodialysis (Figure), the FA concentration in the
desalination stream remained almost constant, while virtually all of the chloride anion was
removed from the desalination stream. These FA from brine have aliphatic structure from
the results of characterization.
It was observed in hydroponics, both of shoot and root of plant growth inhabitations
and chlorosis caused by exposure free heavy metal ions or metals with FA. While in case
of exposure metal-FA complex, extracted from brine water, it was observed no chlorosis
and inhibition of plants.
0 20 40 600
1
2
3
4(a)
FA [m
gC]
Time [min]
0 20 40 600
100
200
300
400
500
Time [min]
Cl- [m
g]
(b)
Figure. Variation of the content of FA (a) and chloride (b) in desalination (dot) and
concentration (circle) streams as a function of time.
REFERENCES
1. Yamaguchi, T., Sato, T. 2005. Report of Chiba Institute of Technology, 52, 109-115.
2. Sato, T. et al. 2006. The 13th Meeting of the International Humic Substances Society.
3. Yamaguchi, T., Chiba, S. 2006. Report of C.I.T., 53, 99-105.
4. Yamaguchi, T., Nakayasu, K., Moriyama, H. 2007. Report of C.I.T., 54, 35-46.
5. Nakayasu, K., Fukushima, M., Sasaki, K., Tanaka, S., Nakamura, H. 1999. Environ. Toxicol.
Chem. 18, 1085-1090.
6. Fukushima, M., Nakayasu, K., Tanaka, S., Nakamura, H. 1995. Anal. Chim. Acta, 317, 195-
206.
7. Sasaki, O., Kanai, I., Yazawa, Y., Yamaguchi, T. 2007. Ann. Environ. Sci. 1, 17-22.
8. Thurman, E.M., R.L. Malcolm. 1981. Environ. Sci. Technol. 15, 463-466.
686

Biotic Control of Humic Substances Ecotoxicity and their Remediation Effect in Contaminated Environment
Vera Terekhova1, Tatiana Poputnikova2, Elena Fedoseeva3, Anna Rakhleeva2, Valeria
Vavilova2, Maxim Kaniskin2, Mikhail Timofeev2, Inna Ibatullina2, Alexander Yakovlev2
1Institute for Ecology and Evolution RAS, Leninskii pr., 33, 117071, Moscow, Russia,
2Moscow State University, Soil Science Department, Leninskie Gory, 119992 Moscow, Russia,
3Irkutsk State University, Lenina str., 3, 664003, Irkutsk-3, Russia, [email protected]
Keywords: bioassay, detoxication, test-organisms, humic substances, water and soil remediation,
ecological standardization, certification
1. INTRODUCTION
The elaboration of program for biotic control of ecosystems is a crucial question in
ecology. The indexes of toxicant concentrations as well as any other chemical and
physical parameters are only symptoms, but not reasons for determination of good health
or «unhealth» of ecosystem. The modern biotic conception of environmental control is
based on the evaluation of disturbance in biota.
There are different approaches to evaluation of environmental deterioration
depending on the directions for use of territories in agricultural, industrial, house-building
or reserves purposes. These approaches consider different biodiagnostic systems and
special lists of biotic responses. The biodiagnostic includes the methods of bioindication in
situ and bioassays in laboratory.
The Russian State Register of Environment Methodologies includes the list of about
10 standard ecotoxicological methods recommended for biological control of environment
contamination and waste safety. It inscribes the most commonly used acute toxicity tests
with Daphnia magna and Ceriodaphnia affinis, very popular luminescent bacterial Microtox
(R) bioassay. Green algae Chlorella vulgaris or Scenedesmus quadricauda are also
recommend as test-organisms in experiments on bio-testing to analyze the population cell
number in respect to the control performing direct counting with Goryaev camera as well
as using less labor-intensive biophysical technique of spectral measurements, etc.
Official statements strongly recommend including at least two biotest-systems for
environmental purpose. The responses of two test-organisms from different taxonomic
groups must be considered in ecological certificate and decision of a commission of
687
experts in Russian Federation. The aqueous extracts from wastes and soils are
recommended by state institutions to test for eco-toxicological control. The tests are
carried out with the use of aquatic organisms (Criteria for determination of harmful level of
dangerous waste…, The Order of Russian Ministry of Natural Resources # 511, 2001).
However there is a big problem in control of ecotoxicity because the sensitivity of
test-organisms is very flexible and often ambiguous depending on kind of toxicants [8].
In this paper we attract attention to two aspects of laboratory bio-assays: 1) control of
humic substances toxicity and selective sensitivity of biotest-systems 2) control of
remediating effects in contaminated environment.
2. MATERIALS AND METHODS
Different biotest-systems are used in our laboratory (Laboratory for Soils
Ecotoxicological Analysis of MSU, Certificate # РОСС RU.0001.513050, www.letap.ru).
They include the following types of organisms: (1) hydrobionts - Daphnia magna,
Ceriodaphnia affinis, Paramecium caudatum, Scenedesmus quadricauda and Artemia
salina, which are officially recommended for natural ecosystems and waste biotic control,
(2) plants, which are usually used to control pesticides in agrocoenosis, and (3) soil habitat
microorganisms, which are represented by micromycetes. In experiments were compared
their sensitivity to dissolved humic substances.
We investigated the interactions of hazardous–waste chemicals with humic
substances. Laboratory experiments were performed to estimate the detoxication effect of
commercial dissolved humic-mineral concentrate (HMC) on toxicity of phosphogypsum by
mixing two substances in ratios 1:1 and 1:10. In special experiments the reactions of
different pigmentation microscopic fungi on potassium humate Powhumus (Humintech Ltd)
were studied. It was tested in concentrations of 0.1 and 0.02%. To analyze the growth and
spectral characteristics of micromycetes the humic substance was added in the nutrient
Chapek-medium.
3. RESULTS AND DISCUSSION
Humic substances are the main component of organic matter in all terrestrial and
aquatic ecosystems, comprising a variety of molecular structures and functional groups.
On one hand they bind different kind of pollutants, thereby decreasing the bioavailability
and consequently the toxicity of these substances in most instances. On the other hand
recent studies describe direct interactions and effects on organisms (4-6). We summarized
here the results of our studies in these directions.
688
The remediation effect of humate in polluted soils is measured with terrestrial and
aquatic organisms. Early our experiment indicated that phosphogypsum, as a chemical
waste belongs to IV dangerous class because of high concentrations of F- and P-content
toxic compounds (3). Detoxication of phosphogypsum upon addition of humic-mineral
concentrate (HMC) was shown using survival-tests performed on Daphnia magna and
growing seeds of radish Raphanus sativa and rice Orysa sativa. It was revealed that
mitigation toxic effect was stronger at lower concentrations of HMC. At the same time the
toxicity of mixture of two components increase with increased HMC concentrations.
The sensitivity of test-organisms depends on kind of toxicants. Our results showed
that for instance Paramecium caudatum are useless for ecotoxicity control of substrates
exposed to oil pollution (or polluting). It wasn’t appropriate to estimate the colored humic
substance toxicity using algae-fluorescence tests. It is difficult also to study toxicity of
humic substances using some species of organisms because their response to humic
substances depends on the adaptation process as well as functional and physiological
state of organisms. For instance hydrobionts living in oligotrophic waters have the best
sensitivity to presence of humate than any organisms from waters rich of organic matter
(1).
The estimation of the toxicity of humic substances on soil microorganisms showed
that microscopic fungi may be useful for elaboration of biotest-systems. Some species of
fungi, as it was reported earlier, are able to decompose humic substances. Micromycetes
showed different sensitivity to hymates in the nutrient medium depending on the
pigmentation of mycelium. Some decrease of fungal biomass for dark-colored strains of
micromycetes in liquid medium with potassium humate Powhumus was marked [2]. The
results showed that the investigated concentration of humate in Chapek-agar did not affect
the development of the non-colored (apigmented) Fusarium colonies - neither toxic nor
stimulation affect on the growth in solid medium, whereas the dark pigmented strains of
micromycetes change their growth and spectral characteristics in presence of humic
substances. Thanks to that phenomenon we recommend to use Fusarium as a test-culture
to estimate the toxicity in contaminated soil with different humus content (7). Phytotests in
the control of humate toxicity and its bioremediation effect by chemical pollution discover
good results (3, 6). The application plant as test-organisms makes a sense to include in
the list of effective bioassay methods.
689
4. CONCLUSIONS
To sum up the brief review our studies we should stress that the combination of
different tests including both aquatic and terrestrial test-organisms is required to get
precise result in many cases, especially by the ecotoxicological estimation of the
contaminated soils. We suppose that the situation with standard methods in ecological
legislation will progress more quickly. In future the range of authorized aquatic test-
systems will supplement with the test-systems based on the reaction of terrestrial
organisms at different levels of biota: microorganisms, plants, invertebrate and vertebrate
animals. The improvement bioassay for the evaluation of ecotoxicity of humic substances,
chemical waste and contaminated natural material is in full accordance with the biotic
conception of the environmental control. Step by step this conception put into practice and
replaces the sanitary-hygienic control regulations in preservation of the environment (8).
ACKNOWLEDGEMENTS
This research was supported by Russian Ministry of Natural Resources (projects
2002-2006) and the ITSC (grant #2216).
REFERENCES
1. Bandolina, E.V., Stom, D.I., Sherbakov, D.Yu. 2005. In: The IV Baikal Vereshaygin Conf.
Irkutsk, p. 15.
2. Fedoseeva, E.V., Menshenina, A.O., Patsaeva, S.V., Terekhova, V.A. 2007. In: The XV
Congr. of Europ. Mycologists, StP, Russia, pp. 165-167.
3. Kaniskin, M.A., Terekhova, V.A., Yakovlev A.S. 2007. Ecology and Industry in Russia. 3: 141-
157.
4. Meems, N, Steinberg, CEW, Wiegand, C. 2004. Science of the Total Environment. 319:123-
36.
5. Perminova, I.V., Kulikova, N.A., Zhilin, D.M. 2006. In: Viable Methods of Soil and Water
Pollution Monitoring, Protection and Remediation, I. Twardowska et al. (eds.), Springer.
Printed in the Netherlands. pp. 249–273.
6. Steinberg CEW, Paul A, Pflugmacher S, Meinelt T, Klocking R, Wiegand C. 2003. In:
Fresenius Environmental Bulletin;12:391-401.
7. Terekhova, V.A. 2007. Micromycetes in ecological evaluation of terrestrial and aquatic
ecosystems. M.: Nauka, 218 p.
8. Terekhova, V.A, Yakovlev, A.S. 2005. In: The 13th Int. Biodeterioration and Biodegradation
Symp. (IBBS-13) Madrid, Spain; p. 323.
690
Extraction and Exchange Behavior of Metal Species in Therapeutically Applied Peat Characterized by Competitive Extractants
Luciane P. C. Romão1, André H. Rosa2, Ângelo Augusto M. J. Silva2, Fabiana A. Lobo2,3,
Danielle Goveia2,3, Leonardo F. Fraceto2, Julio C. Rocha3, Peter Burba4 1Department of Chemistry, Federal University of Sergipe (UFS), 49100-000 São Cristovão,
SE/Brazil 2Department of Environmental Engineering (UNESP), 18087-180, Sorocaba, SP/Brazil,
[email protected] 3Departament of Analytical Chemistry (UNESP), 14800-900, Araraquara, SP/Brazil 4Institute of Analytical Sciences, 44139, Dortmund, Germany
Keywords: Balneological peat, metal extractants, extraction kinetics, dissolved organic matter
1. INTRODUCTION
Natural peats are continuously formed by complex microbiotic humification processes
of plant residues during thousands of years. There are about 500 million hectares of
peatlands in the world (nearly half of Europe area). Due their high content of humin, humic
acids (HA) and fulvic acid (FA), peats exhibit favorable chemical-physical properties
enabling their application in various technical areas, for instance wastewater treatment,
pollution monitoring, fuel production, enzyme immobilization, as well as in veterinary and
human medicine (1).
According to some speculations the medical and veterinary effects of peat are
probably associated to their high content of humic substances (HS) and humic-bound
metal species (2). As yet, the natural enrichment of metals in balneological peats (3) and
their possible (bio)-availability during peat therapy has scarcely been investigated,
excepted Beer et al. (4) having studied the possible uptake of heavy metals by patients
pre-treated by peat mush baths and peat tampons, respectively. At best, heavy metals in
medically applied peats and their aqueous extracts have occasionally been characterized
(5). For this purpose, improved metal speciation procedures, differentiating heavy metals
in balneological peats as a function of their extractability and availability, respectively, are
desired.
Therefore, in the present work the extraction behaviour of dissolved organic matter
(DOM) and metal species from therapeutically used peats (Großes Gifhorner Moor,
Sassenburg/North Germany) were characterized by means of a versatile analytical
approach. In particular, the availability and exchange behaviour of peat-bound metal
691

species towards both competitive chelators (DTPA, EDTA). In environmental science, the
chelators DTPA and EDTA, respectively, are conventionally used as extractants to assess
“(bio)available” metal fractions, for instance in soils and organic-rich sludge samples.
2. MATERIALS AND METHODS
The medical peat samples (Vitamoor®, H. Wulfes KG, Sassenburg/Germany) were
collected from "Großes Gifhorner Moor", Sassenburg/North Germany.
To characterize the peat, 100 g of the sample (wet) were suspended in 250 mL of
high-purity water and some mL of 2 mol/L NaOH solution were added to adjust a pH value
of 4.5. Then, the mixture was magnetically stirred (250-300 rotations per minute) in a room
temperature (23-25oC). The pH was maintained using a conventional glass electrode. After
different periods of time (5, 10, 15, 30, 60 and 120 minutes) small aliquots (about 50 mL,
each) of the peat suspension were filtered through a coarse paper filter and, finally,
through a 0.45 µm flat membrane to remove particles. The fractions collected this way
were characterized by their UV/VIS absorbance at 254 nm and 436 nm, respectively, as
well as by metal determinations using atomic spectrometry. Applying an analogous
extraction procedure and different extractors (0.01 mol/L CaCl2, 0.01 mol/L
ethylendiaminetetraacetic acid (EDTA) and 0.01 mol/L diethylenetriaminepentaacetic acid
(DTPA), respectively, were also studied. Before peat extraction the pH value of the EDTA
and DTPA solutions was adjusted to 5.0 by adding 2 mol/L NaOH solution. The standard
deviations of the metal extraction procedures applied were assessed from 5 different batch
runs extracting 100 g samples of peat (wet), 250 mL extractant, equilibration for 1 h; metal
determinations by ICP-OES and AAS, respectively.
3. RESULTS AND DISCUSSION
Typical metal exchange curves, obtained by EDTA and DTPA from medical peat as a
function of time, are presented in Figures 1 and 2. Both complexants exhibit more or less
comparable kinetics of metal and DOM remobilisation, respectively. The remobilisation
equilibria for the studied metals are approached within 60 minutes, except Al and Fe
needing up to 2 hours. The EDTA and DTPA solution have a similarly strong capability to
remobilize major fractions of heavy metals from peat. Most probably, the chemical
extraction mechanisms of both chelators are quite similar.
Therefore, EDTA and DTPA might be useful for a simple removal of undesired high
metal loads of peat prior to its therapeutic use. The UV absorbance A254nm of DOM, co-
extracted by EDTA and DTPA solutions, respectively, exhibits significantly higher but
692

similar values compared with those obtained by pure water as extractor (results not
shown). This raise is probably caused by an increasing mobilisation of HS molecules from
peat by these complexants.
Figure 1. Exchange of peat-bound metal species by EDTA solution.
Figure 2. Exchange of peat-bound metal species by DTPA solution.
693
4. CONCLUSIONS
DTPA and EDTA exert a strong, well comparable and reproducible extraction
capability towards peat-bound heavy metals, similar to the operational DTPA and EDTA
availability of metals in soils. All in all, the present study, based on a versatile extraction
approach, improves the knowledge of metal species and their chemical availability in
balneological peats. Additional medical investigations, however, are required to clarify in
more detail the positive and negative effects of metals in peat therapy.
ACKNOWLEDGEMENTS
FAPESP, CNPq and FUNDUNESP (Brazilian Agencies). Moreover, the authors
thank Dr. A. M. Beer, Institute of Balneology, Bad Kissingen/Bavaria, for providing selected
balneological peat samples.
REFERENCES
1. Beer, A.M., Lüttig, G, Lukanov, J. Moortherapie 2000 – Peat Therapy on it´s Way into the Next
Millenium, Conference Proceedings, Bad Kissingen, 2000
2. Klöcking, R., 1994. In: Humic Substances in the Global Environment and Implications on
Human Health, N. Senesi, T. Miano (Eds.), Elsevier, Amsterdam, pp. 1245-1257.
3. Naucke, W, 1980. Telma. 10, 227.
4. Beer, A.M., Lukanov, J., Sagorchev, P., 2000. Phytomedicine. 7, 407.
5. Burba, P., Beer, A.M., Lukanov, J., 2001. Fresen. J. Anal. Chem. 370, 419.
694

Study of the Parameters that Influence on the Process of Alkaline Extraction of Humic Substances from Peat
Ângelo Augusto M. J. Silva1, André H. Rosa2, João G. C. Duarte1, João P. Moretti1,
Fabiana A. Lobo1,2, Danielle Goveia1,2, Leonardo F. Fraceto1, Julio C. Rocha2,
Luciane P. C. Romão3 1Department of Environmental Engineering (UNESP), 18087-180, Sorocaba, SP/Brazil,
[email protected] 2Departament of Analytical Chemistry (UNESP), 14800-900, Araraquara, SP/Brazil 3Department of Chemistry, Federal University of Sergipe (UFS), 49100-000 São Cristovão,
SE/Brazil
Keywords: humic substances, humic acid, fulvic acid, extraction, structural characterization
1. INTRODUCTION
Humic substances (HS) are formed by biomolecules transformation during the
decomposition process of present vegetable and animals residues in the environment. To
understand the behavior in the environment, the HS has been studied under different
aspects: partial characterization of structures (1), determination of the equilibrium constant
of metal-HS species (2) and lability of metals (3). Meanwhile, the first step for these
studies is the extraction of HS and the future interpretations will depend on the
experimental conditions used in the extraction procedure. Therefore it is important the
development of analytical methods to extract HS from soils with minimal changes in the
originals structures, in relatively short time, high-income and low-contaminants.
The International Humic Substances Society (IHSS) recommends a procedure based
on four hours extraction with NaOH 0.1 mol L-1 solution at room temperature in the
soil/extractor ratio 1:10 (g/mL) under nitrogen atmosphere. However, according to (4),
several factors influence the extraction procedure and a lot of subjects are still for being
answered. Some authors have used softer extractors as sodium pyrophosphate, formic
acid and organic solvents while other authors prefer an extraction more complete of HS
using alkali. Then, this work studied the parameters that influence the alkaline extraction of
HS from peat as alkaline extractor type, concentration, time and peat/extractor ratio.
695

2. MATERIALS AND METHODS
The sample of peat was collected (30 cm depth) in an area located in the Ribeirão
Preto city, at Sao Paulo state-Brazil. After drying on air, the sample was grind in porcelain
grail and sieved in 2 mm (70 mesh).
The extractions were performed varying the extractor solutions (NaOH, KOH), and
their concentrations (0.1, 0.5 and 1.0 mol L-1), in four hours, peat/extractor ratio 1:10
(g/mL), room temperature (25-30°C), under nitrogen atmosphere and mechanical
agitation. After extraction the sample was centrifuged at 2000.g for 10 minutes to separate
the humin, insoluble fraction. The humic extract was concentrated in evaporator at 55 °C
to approximately 10 mL, moved for a Petri plate and dried in stove with air circulation. That
procedure was repeated varying the time of extraction between 1-8 hours.
The extractions were performed using KOH 0.5 mol L-1 solution, during four hours at
room temperature under nitrogen atmosphere and mechanical agitation with different ratio
peat/extractor: 1:5, 1:10, 1:20, 1:30, 1:40 and 1:50 (g/mL).
3. RESULTS AND DISCUSSION
In according to Figure 1 by reducing the concentration of alkali, the extraction of HA
increases and the FA reduces. These evidences were also characterized by viewing the
difference in color (brown, yellow, and almost colourless) of fulvic fraction extracted
according to the concentration of the solution used as extractor. This occurs due to the
alkali concentration increasing, that causes a disruption of intermolecular forces that
connect the FA to HA, such as hydrogen bridges or links-type ester (5).
Figure 1. Influence of extractor solution and concentration in the content of HA and FA
extracted from peat.
696

The amount of organic matter (OM) extracted with alkali solvents increases with the
extraction time (Figure 2) due to the slow depolymerization of complexes with high-
molecular weight. These complexes are part of humin and are associated with silicates.
Thus, the time needed for extraction depends on the rate of OM humification and the
characteristics of the inorganic material present in the matrix. In the sample used in this
study, the depolymerization of OM present in humin is verified up to 240 minutes, after that
time there is not a considerable increase in the content of extracted OM.
About the peat/extractor ratio, it was observed that the yield of organic material
extracted was higher in the ratio 1:20 (g/mL) (results not shown). In biggest proportions it
was just observed increase of the inorganic material content, but not of the organic
material.
Figure 2. Influence of extraction time in the content of extracted organic matter from peat.
4. CONCLUSIONS
The best conditions for extraction of humic substances in the studied peat sample
were: KOH extractor solution (0.5 mol/L), extraction time of 4 hours, peat/extractor ratio
1:20 (g/mL), nitrogen atmosphere and mechanical agitation. The KOH extractor solution
697

(0.5 mol L-1) showed advantages on NaOH for the studied sample, due to higher yield and
reduction of contaminants in the extraction process.
ACKNOWLEDGEMENTS
FAPESP, CNPq and FUNDUNESP (Brazilian Agencies).
REFERENCES
1. Hertkorn, N., Permin, A., Perminova, I., Kovalevskii, D., Yudov, M., Petrosyan, V. and Kettrup,
A. 2002. J. Environ. Qual. 31, 375-387.
2. Burba, P., Rocha, J. and Klockow, D. 1994. Fresen. J. Anal. Chem. 349, 633-937.
3. Rosa, A.H., Bellin, I.C., Goveia, D., Oliveira, L.C. de, Lourenço, R.W., Dias Filho, N.L. and
Burba, P. 2006. Anal. Chim. Acta 567, 152-159.
4. Parsons, J.W. 1988. In: Humic substances and their role in the environment, F.H. Frimmel and
R. F. Christman (Eds.), Wiley & Sons, Chichester, pp. 03.
5. Swift, R. S. 1996. In: Methods of soil analysis. Part 3. Chemical methods – SSSA Book series
no 5, Soil Science Society of America and American Society of Agronomy, Madison, 1996, pp.
1011.
698
Evaluation of Tropical Peat as a Potential Medium for Bioremediation of Vanadium
Bruno Barboza Cunha1, Amanda Maria Dantas de Jesus1, Iramaia Corrêa Bellin1,
Luciane Pimenta Cruz Romão1, André Henrique Rosa2 1Department of Chemistry, Federal University of Sergipe (UFS), 49100-000 São Cristovão,
SE/Brazil, [email protected] 2Department of Environmental Engineering (UNESP), 18087-180 Sorocaba, SP/Brazil
Keywords: Brazilian peat, vanadium, bioremediation
1. INTRODUCTION
Petroleum exploitation is the main economic activity of Sergipe State, in Northeast
Brazil, location of the country’s largest terrestrial oilfield. The industry generates diverse
by-products, such as volatile aromatic oil fractions, organic acids and metals (1).
Vanadium is recognized to be one of the most abundant metallic constituents of
petroleum, and can cause undesirable side effects in oil-fired power plants, as well as
potential environmental contamination (2). In recent years, interest has increased in the
use of low-cost adsorbents, such as peat, for environmental remediation purposes;
however application of this material for remediation of vanadium remains largely
unexplored. According to a Mineral Resources Research Centre report, Sergipe State
contains 21 peat deposits, distributed across almost the entire State, with an estimated
total resource of 800,000 t (dry ash) of peat. The present study evaluates some of the
parameters influencing bioremediation of vanadium using these tropical peats.
2. MATERIALS AND METHODS
A peat sample was collected from the Santo Amaro das Brotas region of Sergipe
State. The raw material was air-dried at room temperature, and then sieved through a 115-
mesh grid. Batch adsorption experiments were carried out as follows: 20 mL aliquots of
aqueous, 10 mg L-1 V (V), solution were added to 40 mg of peat, in stoppered polyethylene
flasks which were then shaken at a speed of 175 rpm for 74 h in a constant temperature
shaker bath at 25 ± 0.2 oC. Different initial pH values were employed (2.0, 3.0, 4.0, 5.0,
6.0, 7.0 and 8.0). After filtration through a 0.45 μm membrane filter, the concentrations of V
(V) in the supernatant solutions were determined by flame atomic absorption spectrometry.
For the adsorption isotherm experiments, the adsorbent (40 mg) was added to 20 mL of
699
different concentrations of V (V) solution (5, 10, 50 and 100 mg L-1), at pH 5.0. The bottles
were shaken at 25 ± 0.2 oC for an equilibration time of 50 h, after which the concentrations
of V (V) in the supernatant solutions were determined.
3. RESULTS AND DISCUSSION
Parameters that influence the adsorption of metal ions to peat include pH, contact
time and the metal ion concentration.
Figure 1 illustrates the removal of vanadium by peat (0–10 cm depth) at different pH
values (2.0, 3.0, 4.0, 5.0, 6.0, 7.0 and 8.0), after 72 hours, the time necessary to ensure
that equilibrium conditions had been reached. Data show that adsorption of vanadium
increased with pH, reaching a maximum at pH 5.0–7.0, at which the adsorption capacity
was 4.5 mg V g-1 of peat, with decreased adsorption at pH 8.0.
Adsorption results using different vanadium concentrations, at pH 5.0, are shown in
Figure 2. Equilibration times were 12 h (5 mg L-1 solution), 30 h (10 mg L-1 solution) and 48
h (50 and 100 mg L-1 solutions). The vanadium concentration influenced the contact time
required to reach equilibrium, and the adsorption capacity increased at higher vanadium
ion concentrations (3).
2 3 4 5 6 7 80
1
2
3
4
5
q (m
g va
nadi
um/g
pea
t)
pH
Figure 1. Effect of pH on vanadium adsorption (q) onto peat.
Conditions: 10 mg (V) L-1; T = 25 ± 0.2 0C; t = 72 h, m = 40 mg peat.
700
Figure 2. Influence of solution concentration on vanadium adsorption (q) onto peat.
Conditions: T= 25 ± 0.2 0C; pH = 5.0; m = 40 mg peat.
A pseudo-second order model for the adsorption of vanadium onto peat was adopted
from (3). The reaction rate expression can be described by t e
t 1 1 tq h q
= + (Figure 3), where
qe is the amount of metal ion adsorbed at equilibrium, qt is the amount of metal ion on the
surface of the adsorbent at any time, t , and h is the initial adsorption rate. The adsorption
rate constant ( k ) is given by 2eh=kq .
0 10 20 30 40 50 60 70 800
5
10
15
20
25
30
35 5 mg/L 10 mg/L 50 mg/L 100 mg/L
t/qt (
h g/
mg)
Time (h) Figure 3. Vanadium adsorption (t/qt) versus time (h), according to vanadium ion
concentration. T = 25 ± 0.2 0C; pH = 5.0; m = 40 mg peat.
701
The value of the rate constant, k, decreased from 7.4 x 10⁻² to 5.5 x 10⁻² g mg-1 h-1,
for 5 and 10 mg L-1, respectively. Subsequently, at 50 and 100 mg L-1, values of k were
constant at 2.2 x 10⁻² g mg-1 h-1.
The results demonstrate that the amount of vanadium adsorbed increases at higher
initial metal ion concentrations. At higher concentrations there is a more efficient utilization
of the adsorptive capacities of the peat, due to the greater driving force across a higher
concentration gradient.
4. CONCLUSIONS
Peat from Santo Amaro das Brotas, Brazil, has clear potential for removal of
vanadium from aqueous solutions. The results presented here can be used to optimize
pilot scale experiments on removal of the metal from aqueous by-products of the
petroleum industry.
ACKNOWLEDGEMENTS
The financial support of this work by CNPq is gratefully acknowledged.
REFERENCES
1. Dórea, H.S., Bispo, J.R.L., Aragão, K.A.S., Cunha, B.B., Navickiene, S., Alves, J.P.H., Romão,
L.P.C., Garcia, C.A.B., 2007. Microchem. J. 85, 234-238.
2. Amorim, F.A.C., Welz, B., Costa, A.C.S., Lepri, F.G., Vale, M.G.R., Ferreira, S.L.C., 2007.
Talanta. 72, 349-359.
3. Ho, Y.S., McKay, G., 2000. Wat. Res. 34, 3, 735-742.
702

Influence of Soybean Chelates on Chemical and Biochemical Properties of Humic Substances from Biotransformed Lignite
Valentin Savov1, Konstantin Mitov2, Konstantin Chakalov1, Todorka Popova1,
Gergana Angelova1
1ROMB, 2 “Aboba” str., Sofia, Bulgaria, [email protected] 2NIPRORUDA JSCo, 205 Al. Stamboliiski str., 1309 Sofia, Bulgaria
Keywords: chelate, humic, fungi
1. INTRODUCTION
The role of fungi in the degradation of complex carbon compounds such as starch,
cellulose, pectin, lignin, lignocelluloses, inulin, xylan, araban, etc., is well known.
Trichoderma ssp. are known to possess the complete set of enzymes required to
breakdown cellulose to glucose. Fungi are good in accumulation of heavy metals such as
cadmium, copper, mercury, lead and zinc. Certain low rank coals are partially solubilized
by fungi (1,2). Early research showed that lignin degrading fungi have the ability to
solubilize these coals and a substantial amount of the research interest is focused on the
role of lignin degrading enzymes in this process. Although some of the early researchers
suggested that extracellular oxidases produced by lignin degrading fungi have a role in
coal solubilization, it is now generally accepted that the main mechanism by which such
coals are solubilized involves chelation of metals in these coals by oxalate ion (and
possibly by other metal chelators). Chelation breaks the ionic linkages between coal
macromolecules (i.e., coal-derived humic acids and other materials) which are relatively
polar and soluble in water once these linkages are broken (3)
The aim of this study is to determine the influence of soybean chelates on some
chemical and biochemical properties of biotransformed lignite.
2. MATERIALS AND METHODS
Procedure for lignite treatment:
The soybean chelates were prepared as water solutions with a final content of
elements shown in Table 1. Lignite was treated with this 20% solution at a weight
proportion of -lignite:chelate solution = 100:5. Inoculation of Trichoderma viride was done
with suspension of conidia 5,2х107cells/ml - 10 ml /0,75 kg lignite, which was the only
carbon sourse for fungal development. Cultivation was done at 60% humidity of lignite in a
703

thermostat at a temperature of 33о С the first 3 days and 40оС until the end (14th day).
Magic Green is a commercial product of ROMB Ltd – an enzyme accelerator .
The samples were dried at 48оС before analyses. The organic carbon composition
was measured according to the method of Kononova-Belchikova (1966).
Polyphenoloxidase and peroxidase enzyme activities of the samples were also measured.
Table 1. Chelate forms used
Chelate Content of elements in chelate solution,% pH
Fe 0,60 2,75
Mn 0,96 5,3
Zn 1,19 4,6
Cu 0,96 4,9
Co 0,60 4,9
Ca 0,96 10,7
Mg 0,60 9,59
Magic Green 5ml/0,75 kg lignite
Composition 1-8 + Magic Green 0.84 5.6
3. RESULTS AND DISCUSSION
The data presented in Table 2 show that the humification is pH dependent with a
slight influence of acidity (Сh r = 91,5136 + 0,585984*pH; r=0.508; Сf r = exp(2,88597 -
0,269016*pH; r=-0.580). Ca and Mg chelates relatively inhibit T.viride and the formation of
total humic substances is low, but they are mainly in the form of humic acids form. Lignite
(brown coal) can be liquefied/solubilized with several fungi by different mechanisms. When
applied industrially, only catalytic mechanisms can compete with chemical methods. The
well-known fungal ligninolytic peroxidases show disadvantages such as they are relatively
expensive and hydrogen peroxide must be used as a cofactor (2). The catalytic function of
Cu- and Zn chelates influence more strongly coal biotransformation.
704
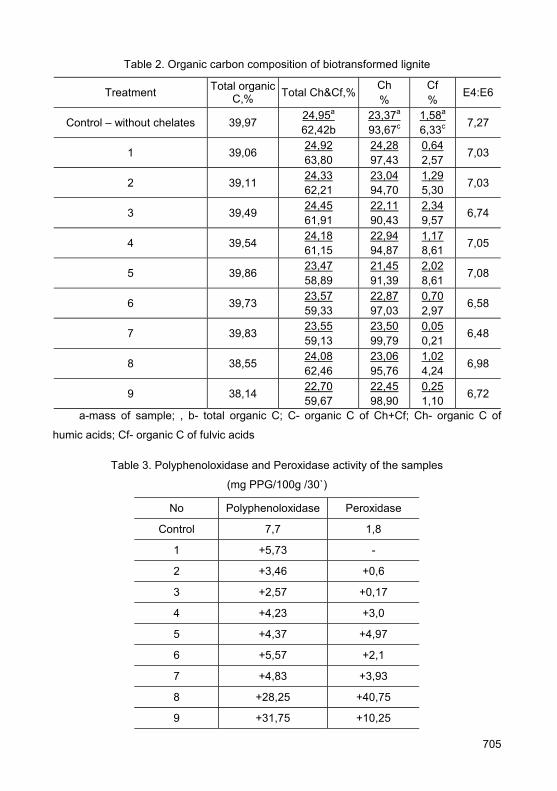
Table 2. Organic carbon composition of biotransformed lignite
Treatment Total organic С,% Total Ch&Cf,% Сh
% Сf % Е4:Е6
Control – without chelates 39,97 24,95a 62,42b
23,37a 93,67c
1,58a 6,33c 7,27
1 39,06 24,92 63,80
24,28 97,43
0,64 2,57 7,03
2 39,11 24,33 62,21
23,04 94,70
1,29 5,30 7,03
3 39,49 24,45 61,91
22,11 90,43
2,34 9,57 6,74
4 39,54 24,18 61,15
22,94 94,87
1,17 8,61 7,05
5 39,86 23,47 58,89
21,45 91,39
2,02 8,61 7,08
6 39,73 23,57 59,33
22,87 97,03
0,70 2,97 6,58
7 39,83 23,55 59,13
23,50 99,79
0,05 0,21 6,48
8 38,55 24,08 62,46
23,06 95,76
1,02 4,24 6,98
9 38,14 22,70 59,67
22,45 98,90
0,25 1,10 6,72
a-mass of sample; , b- total organic C; C- organic C of Ch+Cf; Сh- organic C of
humic acids; Сf- organic C of fulvic acids
Table 3. Polyphenoloxidase and Peroxidase activity of the samples
(mg PPG/100g /30`)
No Polyphenoloxidase Peroxidase
Control 7,7 1,8
1 +5,73 -
2 +3,46 +0,6
3 +2,57 +0,17
4 +4,23 +3,0
5 +4,37 +4,97
6 +5,57 +2,1
7 +4,83 +3,93
8 +28,25 +40,75
9 +31,75 +10,25
705
The polyphenoloxidase and peroxidase activity of the formed humic substances
show that Co and Ca increased twice the peroxidase activity, whereas the catalitic function
of Са, Mg, Fe chelates increased by 50% the polyphenoloxidase activity.
Сf inhibited the enzyme action and Ch favoured the polyphenoloxidase:
a) Influence of Cf on the polyphenoloxidase activity in chelate treated lignite
PPHA = exp(1,75785 - 0,263684*Cf t);r= -0,75195;
b) Influence of Ch on the peroxidase activity in chelate treated lignite
POA = exp(72,6148 - 3,22921*Ch t); r = -0,632509
Magic Green is shown to be a suitable activator of the measured enzymes. However,
the full chelate composition slightly depresses the peroxidase. The level of condensation
of humic substanses is better in these samples. The relative content of Cf increased in the
presense of Magic Green.
4. CONCLUSIONS
The chelates of Fe, Mn, Zn, Cu, Co, Ca, Mg favour the biotransformation of lignite
and increase the measured enzyme activity. Magic Green sharply activates the enzymes.
ACKNOWLEDGEMENTS
This work was supported by the National Innovation Fund – Bulgaria and by
ADVANCED NUTRIENTS - Canada.
REFERENCES
1. Fakoussa, R. M. 1994. The influence of different chelators on the solubilization/liquefaction of
different pretreated and natural lignites. Fuel Process. Technol. 40:183-192.
2. Fakoussa, R. M., and P. J. Frost. 1999. In vivo-coal decolorization of coal-derived humic acids
by laccase-excreting fungus Trametes versicolor. Appl. Microbiol. Biotechnol. 52:60-65.
3. Hofrichter, M., and W. Fritsche. 1997. Depolymerization of low-rank coal by extracellular
fungal enzyme systems. II. The ligninolytic system of the coal-humic-acid-degrading fungus
Nematoloma frowardii b19. Appl. Microbiol. Biotechnol. 47:419-424.
4. Kononova M.M. 1966. Soil Organic Matter. (2e). Pergamon, N.Y., p. 544.
706

In Vitro Effect of Potassium Humate on Terminal Drought Tolerant Bread Wheat
Reza Shahriari1, Elshad Gurbanov2, Aladdin Gadimov3, Davoud Hassanpanah4 1Islamic Azad University, Ardabil branch, [email protected] 2Baku State University, Faculty of Biology 3Azerbaijan National Academy of Sciences, Institute of Botany 4Agricultural and Natural Resources Research Centre of Ardabil, IRAN
Keywords: wheat, coleoptile, potassium humate, PEG 6000
1. INTRODUCTION
Water is the important limiting factor for crop production in arid and semi-arid areas of
the world. If sufficient water is not available, the use of fertilizers and high yielding crop
varieties are useless. Drought stress, in general, reduces nutrient uptake by roots and
transport from roots to shoots, because of restricted transpiration rates and impaired active
transport and membrane permeability resulting from reduced root-absorbing power.
Coleoptile length (CL) is of great importance when considering variable seeding depth, soil
surface temperature and moisture, which affect the coleoptile development, and in turn
seedling emergence and crop stand establishment. Coleoptile length is a highly heritable
character and could be efficiently used in programs designed to segregate generations at
early stages of plant development (3). The emergence capability of winter wheat was also
associated with coleoptile length and stand establishment (7). Water soluble Polyethylene
glycols (PEGs) have been widely used as inert, nonionic solutes in the study of water
relations for plants, fungi, and animals (5). PEGs are used extensively for the experimental
control of water stress in plants growing in nutrient solutions. It is frequently assumed that
plant water relations are similar whether the plants are growing in soil or in a PEG' solution
having an equal water potential (4). Potassium humate is an active hormone of natural
origin produced from the remains of plants and animals (2). Potassium humate increases
crop quality and plant tolerance to drought, salinity, cold, diseases and pests stresses (2
and 6). Treatment of tomato seeds with 0.01% Potassium Humate solution before planting
for 24 hours increased crop production 20-25%. Cucumber seed treated with 0.01%
Potassium Humate solution before planting for 24 hours and increased its production 38%.
Bostan et al. (1) investigated time and percentage of germination of hazel-nut seed in
three concentrations of Potassium Humate (0.01, 0.02 and 0.03 ml/seed) and for two
treatment periods (12 and 24 hours). Germination increased between 37.08 and 64.14%
707
with the highest germination percentage (53%) observed in a concentration of 0.02 relative
to control (43%).
In this study, we investigated effect of Potassium Humate solution on early growth of
wheat genotypes under PEG osmotic pressure as a drought factor.
Evaluation of important characters in early growth stages is necessary for selected
wheats under terminal drought of farm experiment in our area (Ardabil, Iran). Furthermore,
uses of Potassium Humate can help ours to know about its effect on decrease of drought
intensity in the most important stage of growth. So we tried to study about response of
wheat genotypes to this miraculous natural hormone.
2. MATERIALS AND METHODS
42 bread wheat genotypes were planted under two farm conditions, irrigated and
terminal drought stress, using a simple rectangular lattice with two replications in 2006-
2007. Seven genotypes were selected as tolerant to drought stresses (see results). To
evaluate germination, coleoptile length of these genotypes to that of a sensitive genotype,
the experiment was designed by factorial analysis on the basis of completely randomized
block in vitro. PEG 6000 was used to create osmotic pressure, and double distilled water
was the control. The A factor had three levels (-7 bar PEG; double distilled water; and
1ml/L K-humate + -7 bar PEG). The B factor was wheat genotypes. Ten seeds were
cultured in each Petri dish. Papers and Petri dishes were sterilized in an oven at 120
degrees centigrade for 1.5 hours, and seeds in 20% Sodium hypochlorite for 5 minutes.
After sterilization, seeds were washed with double distilled water, and then cultured
between papers in Petri dishes. The temperature of laboratory was about 24 degrees
centigrade during of experiment. Petri dishes were maintained in a dark place for 10 days.
Data gathered included number of seeds germinated and measured coleoptile lengths.
The total, maximum and mean coleoptile lengths were calculated.
3. RESULTS AND DISCUSSION
Analysis of variance showed significant differences between osmotic pressures for
coleoptile length and germinated seed number, between genotypes for mean and
maximum coleoptile length, and between interactions of genotypes × osmotic pressures
for mean and maximum coleoptile length. Mean comparisons showed the highest total,
mean and maximum coleoptile length in -7 bar PEG and 1ml/l Potassium Humate
treatments (Table 1). Genotypes Sardari and Sabalan had the highest amounts of total,
mean and maximum coleoptile length (Table 2). Examined closely were Interactions
708

between genotype × osmotic pressures, genotypes Sardari, Sabalan and 4057 in -7 bar
PEG and 1ml/lit Potassium Humate. In this study, potassium Humate increased the
drought tolerance of genotypes. These results were in accordance with the findings of
similar investigations (1). Genotypes that had the highest grain yield under normal and
terminal drought stress conditions were grouped as tolerant genotypes using tolerance
indices. The tolerant genotypes produced the largest total, mean and maximum coleoptile
length. Cultivars emerging rapidly are valuable because rainfall after sowing can result in a
soil crust that prevents the wheat coleoptile or first leaf to emerge. Additionally, early
emerging crops can maximize on water utilization leading to improved stand establishment
and grain yield. Variations in coleoptile length are primarily genetic; although, this trait is
significantly affected by genotype and environmental interactions (3).
4. CONCLUSIONS
Genotypes had different responses to Potassium Humate treatment. Potassium
Humate (1 ml/l) caused to superior tolerance of Sardari, Sabalan and 4057 genotypes than
others against drought (-7 bar PEG 6000) in early growth stages.
Table1. Mean and Maximum of Coleoptile and primary roots length in different conditions
Conditions Mean of Coleoptile Length
Maximum of Coleoptile Length (mm)
Maximum Length of Primary roots
Mean Length of Primary roots
control 4.01 4.51 17.20 13.83 Stress + K-humate 4.25 4.85 17.73 12.01 sterss 3.95 4.73 16.35 11.21
Table2. Mean and Maximum of Coleoptile and primary roots length in different cultivars
Cultivars Mean of Coleoptile Length
Maximum of Coleoptile Length (mm)
Maximum Length of Primary roots
Mean Length of Primary roots
Mv 17/Zrn 4.28 5.18 21.60 12.91
Viking/5/Gds/4/Anza 4.30 5.01 13.85 11.33
Apollo/Alvd/4/Spn.. 2.86 3.58 13.92 10.48
Gaskogen 3.11 3.72 12.88 10.89
Sardari 4.62 5.41 19.25 14.79
Sabalan 4.93 5.56 20.13 15.33
4057 4.76 5.23 16.11 12.69
5041 3.20 3.89 19.02 10.38
709

REFERENCES
1. Bostan, S.Z., Islam, A. and Yilmaz M .2004. Effect of Potassium Humate on hazelnut seed
germination. ISHS Acta Horticulturae. No: 556.
2. Gadimov, A.G., A.N. Ahmedova and R.C. Alieva. 2007. Simbiosis nodules bacteria Rhizobium
leguminosarum with Peas (Pisum Sativum) nitrate reductase, salinification and potassium
humus. Transaction of the institute of Microbiology of Azerbaijan National Academy of
Sciences, Baku. 4:158-163.
3. Hakizimana, F., Haley, S.D., Turnipseed, E.B. 2000. Repeatability and genotype x
environment interaction of coleoptile length measurements in winter wheat. Crop Sci. 40:1233-
1237.
4. Kaufmann, A., Eckard N. 1971. Evaluation of Water Stress Control with Polyethylene Glycols
by Analysis of Guttation. Plant Physiol. 47, 453-456.
5. Money. N. P. 1989.Osmotic Pressure of Aqueous Polyethylene Glycols' Relationship between
Molecular Weight and Vapor Pressure Deficit. Plant Physiol. 91, 766-769.
6. Nikolayeva, N., Petrushenko, V. and Ermolayeva, K. (1997) Balanced feeding roses under
conditions of north-western coast of Black Sea region as a method of raising disease
resistance. American J. Of Botany, 84:716.
7. Schillinger, W.F., Donaldson, E., Allan, R.E., Jones, S.S. 1998. Winter wheat seedling
emergence from deep sowing depths. Agron. J. 90:582–586.
710

The Effect of Bioaugmentation on the PCP Degradation in Soil Amended with Humic Acids
Marianna Skokanová, Katarína Dercová Department of Biochemical Technology, Institute of Biotechnology and Food Science, Faculty of
Chemical and Food Technology, Slovak University of Technology, Radlinského 9, 812 37
Bratislava, Slovak Republic, [email protected]
Keywords: biodegradation, humic acids, pentachlorophenol, lignite, oxyhumolite, soil
1. INTRODUCTION
Binding xenobiotics to humus constitutes one of the major reactions by which
anthropogenic compounds are transformed in nature (1, 2). Elimination of contaminants
through the sorption onto soil particles leads to reducing their mobility, thus their toxicity as
the contaminants become resistant in relation to the present microflora. They are firmly
fixed in the soil structure, i.e., they are immobilized, what may be a cause of a difficult
access to degraded molecules. Humic acids (HAs) appear to have a particular activity in
interaction with various organic and inorganic contaminants affecting their sorption,
mobility, bioavailability, degradation, and phytotoxicity (3-5). Peat, lignite, and oxidized
brown coal, so-called oxyhumolite, are the richest sources of HAs (up to 85%) (6, 7). The
positive effect of HAs on microorganisms during biodegradation experiments of organic
xenobiotics has already been investigated. It was claimed that the HAs are sorbed onto
the bacterial surface very quickly and easily. It was hypothesized that this layer protects
the cell against unfavourable environment conditions and so it enables the microflora to
grow and to degrade the xenobiotics gradually (8).
The aim of this study is a simulation of real conditions at pentachlorophenol (PCP)
degradation in soil using HAs addition as a possible alternative decontamination method.
Lignite and oxyhumolite were used as the representative sources of humic acids as they
both are of a natural origin.
2. MATERIALS AND METHODS
Microorganisms
A bacterial strain Comamonas testosteroni CCM 7350 is an isolate from wastewater
treatment sludge plant. It was identified and is stored at the CCM in Brno, Czech Republic.
Characteristics of soil, lignite, and oxyhumolite
711

Soil samples (Gleyic Fluvisol, Calcaro-haplic Chernozem, and Arenic Regosol) were
collected from topsoils of key monitoring sites of the Soil Monitoring System Slovakia.
They represent common soil types with a wide range of fundamental soil attributes. Lignite
and oxyhumolite were obtained from Czech Republic.
Biodegradation and analysis of PCP
Biodegradation of PCP in soil in the presence of natural soil microflora (NSM) or an
inoculum of C. testosteroni (5 g/kg) was performed under laboratory conditions in the
characterized soil samples with addition of lignite or oxyhumolite. The samples were
artificially contaminated with PCP, 10 and 100 mg/kg. After degradation, steam distillation
of PCP was carried out in soil samples after alkaline hydrolysis with NaOH. Samples were
extracted twice with 15 mL n-hexane. The solvent was completely evaporated on rotation
vacuum evaporator at 40-45°C and PCP was diluted in methanol and analyzed by HPLC.
3. RESULTS AND DISCUSSION
Natural soil attenuation varies according to soil types. The amount and quality of soil
organic matter, mainly HAs, play a key role in the elimination of soil contaminants (9, 10).
Sorption ability of HAs isolated from different soil types differs due to their different
chemical structure. HAs represent only a small part of arable soil compared with other soil
parts. Lignite and oxyhumolite were used because they have several times higher HAs
amount than agricultural soils. The main characteristics of used soils, lignite, and
oxyhumolite are shown in table 1.
Table 1. Characteristics of tested soils (corg) and data of CHN and NMR analyses of HAs
(C, H, N, O, COOH, Calif, Car, α) isolated from the tested soils, lignite, and oxyhumolite
Elemental analyses (atom. %) HA Corg (%)
C H N O
COOH (meq/g HA)
Calif (%)
Car (%)
α (%)
Calcaro-haplic Chernozem 1.16 47.8 29.5 3.4 19.5 4.2 33.7 42.2 55.6
Gleyic Fluvisol 1.43 39.9 40.7 3.3 16.1 2.5 46.9 32.8 41.1 Regosol 0.75 42.6 37.3 3.5 16.7 3.6 41.8 38.6 48.0 Lignite 27.5 51.1 28.8 1.1 19.0 4.5 34.7 44.0 55.9
Oxyhumolite 22.2 41.2 37.6 0.7 20.5 4.8 29.7 48.4 61.9
In Fluvisol without HAs addition, higher degradation values (up to 63%) were
observed in samples with NSM than in those with C. testosteroni. On the other hand, in
soils amended with lignite or oxyhumolite, higher degradation was determined in samples
with the C. testosteroni at both initial PCP concentrations. The highest value of
degradation in Fluvisol (91%) was recorded at the concentration of 10 mg/kg PCP in the
712
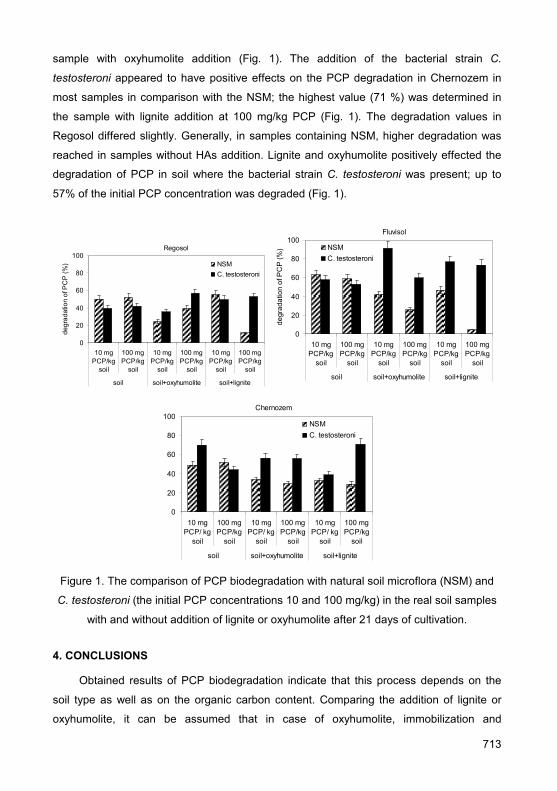
sample with oxyhumolite addition (Fig. 1). The addition of the bacterial strain C.
testosteroni appeared to have positive effects on the PCP degradation in Chernozem in
most samples in comparison with the NSM; the highest value (71 %) was determined in
the sample with lignite addition at 100 mg/kg PCP (Fig. 1). The degradation values in
Regosol differed slightly. Generally, in samples containing NSM, higher degradation was
reached in samples without HAs addition. Lignite and oxyhumolite positively effected the
degradation of PCP in soil where the bacterial strain C. testosteroni was present; up to
57% of the initial PCP concentration was degraded (Fig. 1).
Regosol
0
20
40
60
80
100
10 mgPCP/kg
soil
100 mgPCP/kg
soil
10 mgPCP/kg
soil
100 mgPCP/kg
soil
10 mgPCP/kg
soil
100 mgPCP/kg
soil
soil soil+oxyhumolite soil+lignite
degr
adat
ion
of P
CP
(%) NSM
C. testosteroni
Fluvisol
0
20
40
60
80
100
10 mgPCP/kg
soil
100 mgPCP/kg
soil
10 mgPCP/kg
soil
100 mgPCP/kg
soil
10 mgPCP/kg
soil
100 mgPCP/kg
soil
soil soil+oxyhumolite soil+lignite
degr
adat
ion
of P
CP
(%) NSM
C. testosteroni
Chernozem
0
20
40
60
80
100
10 mgPCP/ kg
soil
100 mgPCP/kg
soil
10 mgPCP/ kg
soil
100 mgPCP/kg
soil
10 mgPCP/ kg
soil
100 mgPCP/kg
soil
soil soil+oxyhumolite soil+lignite
NSMC. testosteroni
Figure 1. The comparison of PCP biodegradation with natural soil microflora (NSM) and
C. testosteroni (the initial PCP concentrations 10 and 100 mg/kg) in the real soil samples
with and without addition of lignite or oxyhumolite after 21 days of cultivation.
4. CONCLUSIONS
Obtained results of PCP biodegradation indicate that this process depends on the
soil type as well as on the organic carbon content. Comparing the addition of lignite or
oxyhumolite, it can be assumed that in case of oxyhumolite, immobilization and
713

degradation are more influenced, depend on the soil type and on the initial concentration
of PCP more than in experiments with addition of lignite. Biostimulation with lignite and
oxyhumolite proves that they had positive effects on biodegradation, mainly when the
bacterial strain Comamonas testosteroni CCM 7350 was present. Considering the
achieved results, in following experiments we will focus on the bioaugmentation of natural
soil microflora with allochthonous bacterial strain able to degrade chlorophenols in order to
reinforce indigenous microbial consortium and consequently to improve biodegradation.
ACKNOWLEDGEMENTS
Financial support from the Scientific Grant Agency of the Ministry of Education (Grant
no. 1/1309/04 and 1/4357/07) is gratefully acknowledged. The authors are grateful to
Assoc. Prof. M. Pekař, PhD., Technical University of Brno, for providing lignite and to MSc.
Lenka Wimmerová, PhD. Dekonta a.s., Czech Republic, for providing oxyhumolite.
REFERENCES
1. Agathos, S.N., Reineke, W. (Eds.). 2002. Biotechnology for the Environment: Soil
Remediation. Kluwer Academic Publishers, Dordrecht, The Netherlands, pp. 140.
2. Bollag, J.M. 2002. Immobilization of pesticides in soil through enzymatic reactions. In:
Biotechnology for the Environment: Soil Remediation, Vol. 3A. N. Aghatos, W. Reineke (Eds.),
Kluwer Academic Publishers, Dordrecht, The Netherlands, pp. 93-101.
3. Seki, H., Suzuki, A. 1995. J. Colloid Interf. Sci. 171, 490-494.
4. Taylor, M.D., Theng, B.K.G. 1995. Soil Sci. Plan. 26, 765-776.
5. Clapp, C.E., Hayes, M.H.B., Senesi, N., Bloom, P.R., Jardine, P.M. (Eds.). 2001. Humic
Substances and Chemical Contaminants, Soil Science Society of America, Madison, pp. 502.
6. Antošová, B., Kozler, J., Novák, J., Kubíček, J., Horová, D., Vondrová, I. 2005. ChemZi 1, 256.
7. Veselá, L., Kubal, M., Kozler, J., Innemanová, P. 2005. Chem. Listy 99, 711-717.
8. Feifičová, D., Čejková, A., Masák, J., Siglová, M. 2005. In: Abstract Book of the Conference
Sanační technologie VIII, J. Burkhard, O. Halousková (Eds.), Uherské Hradiště, Czech
Repiblic, pp. 123.
9. Senesi, N. 1992. Sci. Total Environ. 123-124, 63-76.
10. Zhang, M., Alva, A.K., Li, C., Calvert, D.V. 1997. Soil Sci. 162, 181-188.
714
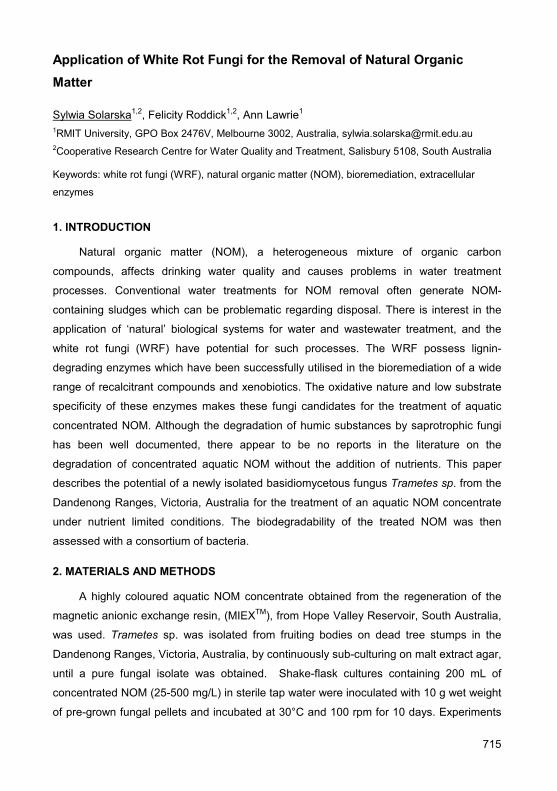
Application of White Rot Fungi for the Removal of Natural Organic Matter
Sylwia Solarska1,2, Felicity Roddick1,2, Ann Lawrie1 1RMIT University, GPO Box 2476V, Melbourne 3002, Australia, [email protected] 2Cooperative Research Centre for Water Quality and Treatment, Salisbury 5108, South Australia
Keywords: white rot fungi (WRF), natural organic matter (NOM), bioremediation, extracellular
enzymes
1. INTRODUCTION
Natural organic matter (NOM), a heterogeneous mixture of organic carbon
compounds, affects drinking water quality and causes problems in water treatment
processes. Conventional water treatments for NOM removal often generate NOM-
containing sludges which can be problematic regarding disposal. There is interest in the
application of ‘natural’ biological systems for water and wastewater treatment, and the
white rot fungi (WRF) have potential for such processes. The WRF possess lignin-
degrading enzymes which have been successfully utilised in the bioremediation of a wide
range of recalcitrant compounds and xenobiotics. The oxidative nature and low substrate
specificity of these enzymes makes these fungi candidates for the treatment of aquatic
concentrated NOM. Although the degradation of humic substances by saprotrophic fungi
has been well documented, there appear to be no reports in the literature on the
degradation of concentrated aquatic NOM without the addition of nutrients. This paper
describes the potential of a newly isolated basidiomycetous fungus Trametes sp. from the
Dandenong Ranges, Victoria, Australia for the treatment of an aquatic NOM concentrate
under nutrient limited conditions. The biodegradability of the treated NOM was then
assessed with a consortium of bacteria.
2. MATERIALS AND METHODS
A highly coloured aquatic NOM concentrate obtained from the regeneration of the
magnetic anionic exchange resin, (MIEXTM), from Hope Valley Reservoir, South Australia,
was used. Trametes sp. was isolated from fruiting bodies on dead tree stumps in the
Dandenong Ranges, Victoria, Australia, by continuously sub-culturing on malt extract agar,
until a pure fungal isolate was obtained. Shake-flask cultures containing 200 mL of
concentrated NOM (25-500 mg/L) in sterile tap water were inoculated with 10 g wet weight
of pre-grown fungal pellets and incubated at 30°C and 100 rpm for 10 days. Experiments
715

were performed in quadruplicate with appropriate controls and sampled (7 mL) every 10 to
12 hours. All samples were filtered and analysed for pH, decolourisation (colour measured
as absorbance at 446 nm, A446), presence of conjugated and aromatic bonds (A254), and
ligninolytic enzyme production at the pH of the culture at the time of sampling by the
methods of Tien and Kirk for Lignin peroxidase (LiP) (1), Wariishi et al. for Manganese-
dependent peroxidase (MnP) (2) and Coll et al. for Laccase (Lac) (3). High Performance
Size Exclusion Chromatography (HPSEC) was used to determine the changes in
molecular weight distribution of NOM. The biodegradability of the treated NOM was
assessed by change in dissolved organic carbon concentration after bacterial degradation
according to Volk et al. (4).
3. RESULTS AND DISCUSSION
Trametes sp. decolourised NOM as represented by the reduction in A446 (Figure 1).
Maximal decolourisation (50%) occurred at 100 mg C/L. For all NOM concentrations, there
was a high initial rate of NOM removal which could be due to initial adsorption or uptake of
NOM. This was later confirmed by light brown colouration of the pellets, which darkened
with increasing NOM concentration. ‘Negative decolourisation’ occurred shortly after
reaching maximal decolourisation for all NOM concentrations (Figure 1). This could be due
to fungal disintegration and the release of secondary extracellular proteases on lysis of the
cells (5), as indicated by increase in culture pH for all NOM concentrations.
0
10
20
30
40
50
60
0 100 200 300 400Time (hrs)
% D
ecol
ouri
satio
n
13mg/L 25mg/L 50mg/L100mg/L 300mg/L 500mg/L
0
10
20
30
40
50
60
13 25 50 100 300 500
Initial NOM concentration (mg C/L)
% D
ecol
ouris
atio
n, M
nP a
ctiv
ity
(µm
ol m
in-1
L-1
)
0
50
100
150
200
250
Lac
activ
ity (µ
mol
min
-1 L
-1)
MnP % Decolourisation Lac
Figure 1. Decolourisation of NOM by
Trametes sp.
Figure 2. Enzyme activity during NOM
decolourisation by Trametes sp.
716
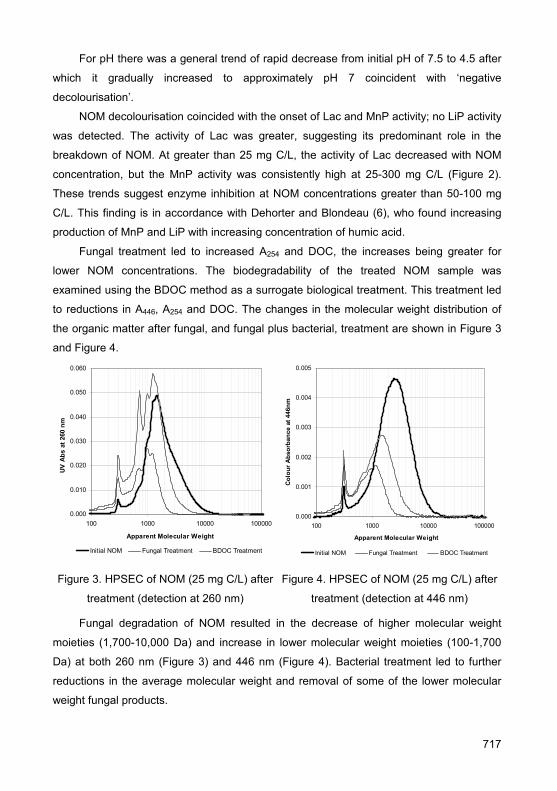
For pH there was a general trend of rapid decrease from initial pH of 7.5 to 4.5 after
which it gradually increased to approximately pH 7 coincident with ‘negative
decolourisation’.
NOM decolourisation coincided with the onset of Lac and MnP activity; no LiP activity
was detected. The activity of Lac was greater, suggesting its predominant role in the
breakdown of NOM. At greater than 25 mg C/L, the activity of Lac decreased with NOM
concentration, but the MnP activity was consistently high at 25-300 mg C/L (Figure 2).
These trends suggest enzyme inhibition at NOM concentrations greater than 50-100 mg
C/L. This finding is in accordance with Dehorter and Blondeau (6), who found increasing
production of MnP and LiP with increasing concentration of humic acid.
Fungal treatment led to increased A254 and DOC, the increases being greater for
lower NOM concentrations. The biodegradability of the treated NOM sample was
examined using the BDOC method as a surrogate biological treatment. This treatment led
to reductions in A446, A254 and DOC. The changes in the molecular weight distribution of
the organic matter after fungal, and fungal plus bacterial, treatment are shown in Figure 3
and Figure 4.
0.000
0.010
0.020
0.030
0.040
0.050
0.060
100 1000 10000 100000
Apparent Molecular Weight
UV A
bs a
t 260
nm
Initial NOM Fungal Treatment BDOC Treatment
0.000
0.001
0.002
0.003
0.004
0.005
100 1000 10000 100000
Apparent Molecular Weight
Col
our
Abs
orba
nce
at 4
46nm
Initial NOM Fungal Treatment BDOC Treatment
Figure 3. HPSEC of NOM (25 mg C/L) after
treatment (detection at 260 nm)
Figure 4. HPSEC of NOM (25 mg C/L) after
treatment (detection at 446 nm)
Fungal degradation of NOM resulted in the decrease of higher molecular weight
moieties (1,700-10,000 Da) and increase in lower molecular weight moieties (100-1,700
Da) at both 260 nm (Figure 3) and 446 nm (Figure 4). Bacterial treatment led to further
reductions in the average molecular weight and removal of some of the lower molecular
weight fungal products.
717

The ability of Trametes sp. to degrade NOM was probably due to the synergistic
action of MnP and Lac involved in the enzymatic breakdown of medium molecular weight
(500-2,000 Dalton) fulvic acids and high molecular weight (2,000-5,000 Dalton) humic
acids.
4. CONCLUSIONS
This research demonstrates the potential for the use of white rot fungi, as exemplified
by Trametes sp., as a source of ligninolytic enzymes for the decolourisation and
degradation of concentrated NOM wastes arising from potable water treatment without
nutrient addition, thus making these wastes more amenable to conventional biological
treatment.
ACKNOWLEDGEMENTS
The CRC for Water Quality and Treatment is acknowledged for providing financial
support for this project.
REFERENCES
1. Tien, M., Kirk, T.K. 1988. Methods Enzymol. 161, 238-249.
2. Wariishi, H., Valli, K., Gold, M.H. 1992. J. Biol. Chem. 267(33), 23688-23695.
3. Coll, P.M., Fernandezabalos, J.M., Villanueva, J.R., Santamaria, R., Perez P. 1993. Appl.
Environ. Microbiol. 59(8), 2607-2613.
4. Volk, C., Renner, C., Robert, C., Joret, J.C. 1994. Environ. Technol. 15, 545-556.
5. Moreira, M.T., Palma, C., Feijoo, G., Lema, J.M. 1998. J. Biotechnol. 66, 27-39.
6. Dehorter, B., Blondeau, R. 1992. FEMS Microbiol. Lett. 94, 209-216.
718

Synthesis and Use of Iron Humates for Correction of Iron Deficiency Chlorosis in Higher Plants
Tatiana A. Sorkina1, Natalia A. Kulikova2,3, Anna M. Necvetay1, Olga I. Philippova2,
Galina F. Lebedeva2, and Irina V. Perminova1 1Department of Chemistry, Lomonosov Moscow State University, 119992 Moscow, Russia 2Department of Soil Science, Lomonosov Moscow State University, 119992 Moscow, Russia 3A.N. Bach Institute of Biochemistry RAS, Leninskii 33, 119071,Moscow, Russia
Keywords: humic, iron humate, chlorosis, bioavailability
1. INTRODUCTION
Deficiency of bioavailable iron in soils leads to plant disease known as chlorosis. The
most efficient way to correct iron chlorosis is to use synthetic iron (III) chelates such as
DTPA and EDDHA. However, application of these chelates may bring about negative
consequences for environment as their migration along the soil profile. Therefore,
development of iron chelates based on a use of natural macroligands is of great
importance. From this prospective, humic substances (HS), which contain large amounts
of carboxyl and hydroxyl groups seem to be the most promising compounds. The objective
of this study was to develop humic-based iron chelates and to evaluate their efficiency for
use as chlorosis correctors.
2. MATERIALS AND METHODS
Iron Humates: Three samples of iron humates were prepared from commercially
available potassium humate derived from leonardite (Sakhalin HumateTM) and iron(II)
sulfate at different pH in the presence and absence of ascorbic acid. The insoluble part of
potassium humate was separated with centrifugation. Iron(II) sulfate with concentration
725 mmol/l was added to 5% solution of potassium humate at pH 11 and 9. The solution of
ascorbic acid (2%) was used for stabilization of Fe2+ oxidation state. The obtained solution
was dried on rotary evaporator. Iron content was determined spectrophotometricaly using
complexation with o-phenantroline after oxidative wet digestion. For determination of redox
state of iron species, the obtained samples were investigated using Mössbauer
spectrometry.
Bioassay: Wheat plants (Triticum aestivum L. var. Krestianka) were used as biotarget
and Knopp nutrient solution without iron was used as a control. Wheat seeds were
germinated in distilled water in the dark at 25°С for 72 hours. Seedlings were grown on
719

Knopp nutrient solution with iron supplied in the different forms at the concentration of 25
μmol/l. The commercially available chelate Sequestren Fe-EDDHA was used as a positive
control. Length of shoots and roots, mass of roots, iron and chlorophyll content in the
shoots were measured. Chlorophyll was extracted from shoots with acetone. The contents
of a and b chlorophyll were determined spectrophotometricaly. Iron content was
determined after oxidative digestion of dried shoots using o-phenantroline technique.
3. RESULTS AND DISCUSSION
The content of iron in all three preparations was 8.8±0.3%, solubility of samples
synthesized at pH 9 in the presence of ascorbic acid (AA) was 127±4 g/l, in the absence of
AA it was 52±4 g/l. The sample obtained at pH 11 turned out insoluble. Mössbauer spectra
of samples synthesized at pH 9 have shown that in the absence of AA, all iron present in
iron humate was Fe(III), whereas in the sample obtained in the presence of ascorbic acid,
Fe(III) accounted for 94% and Fe(II) - 6%.
The results of bioassay have shown that the both samples of iron humates obtained
at pH 9 caused stimulating effect on wheat seeds: the root weight for sample with AA was
112 ± 4 % of control and for sample without AA it was 109±4% of control. At the same
time, for Fe-EDDHA the value of this parameter was 106±4% of control. Both Fe-EDDHA
and all soluble iron humates promoted accumulation of chlorophyll in shoots. Another
indicator of the efficiency of the sample as chlorosis corrector is iron content in shoots. The
highest iron content was obtained for iron humate synthesized at pH 9 with AA (243±9
mg/kg that corresponds to 430% of control) and lesser content - for sample without AA
(170±7 mg/kg that corresponds to 250% of blank). Of importance is that both iron humates
outcompeted Fe-EDDHA: the iron content accounted for 117±6 that corresponds to 173%
of blank.
4. CONCLUSIONS
The soluble iron humates with content of iron >8% were prepared. Application of
ascorbic acid increased solubility of iron humate and facilitated iron accumulation by
plants. The obtained iron humates were shown to be efficient chlorosis correctors.
ACKNOWLEDGEMENTS
This work was supported by ISTC (KR-964) and Interdisciplinary Scientific Program
of the Lomonosov Moscow State University (MNP-4-2008).
720
Use of Soil Microorganisms for Producing Standard Samples of Humic Acids
Alexey Stepanov1, Dmitry Zviagyntsev1, Ludmila Lisak1, Alexander Shapovalov2,
Yury Putsykin2 1Faculty of Soil Science, Lomonosov Moscow State University, 119992 Moscow, Russia,
[email protected] 2Agrosynthezis Ltd., 2nd str. Mashinostroenya, 17A/1, Moscow, 115088, Office 5
Keywords: humic acids, standard samples, purification, soil microorganisms
INTRODUCTION
The high solubility of humic substances in alkali aqueous solutions is the basis for
their extraction from the soils and other sources such as peat, brown coal, sludges etc.
Precipitation (evidence of low solubility) in acid media is commonly used for additional
purification of humic substances. The humic substances are a mixture of organic
compounds of different chemical classes. The composition of this mixture depends on the
natural source from which they are extracted. The standards for humic substances
extracted from different sources were proposed by IHSS. These standards in particular
comprise data regarding the contents of various aminoacids, sugars and ash content, as
characteristics of such mixtures. The composition of humic substances includes various
compounds with unknown structure. For instance, the possibility that humic acids engage
in pH dependent reversible polymerization and depolymerization (1) was discovered by us
and has not been described earlier with regards other classes of organic compounds.
Unfortunately, even IHSS does not provide sufficiently definitive descriptions of differences
between terms like “humic substances” and “humic acids”. We believe that the term “humic
substances” includes all organic substances extracted by alkali water treatment of soil
samples and other natural sources. For the purposes of organizing commercial production
and application of humic substances, it is necessary to determine the chemical structure of
humic acids as the main component of humic substances, which predetermine their role in
soil-formation. The first stage to achieving this is the separation of humic acids from the
aggregate mass of humic substances. As we have described earlier, humic acids cannot
be quickly consumed by soil microorganisms as carbon and energy source. It may be
suggested that soil microorganisms have a specific mechanism for the “recognition” of
these chemical structures. The “recognition” apparently takes place at neutral pH when
humic acids have a form of specific polymer, since in alkali pH the polymer structure is
721

destroyed and microorganisms can use humic acids as a carbon source (2). It is,
therefore, possible to use soil microorganisms for the purpose of isolating humic acids
from natural sources. Here we suggest a method for isolating humic acids as a fraction of
humic substances resistant to transformation by soil microorganisms. Other organics
compounds included in humic substances are transformed by the microbial cultures to
CO2 and H2O (2).
RESULTS AND DISCUSSION
Our investigations demonstrate that samples of humic acids from different
environmental sources contain 20% of compounds degraded by soil microorganisms in
two weeks and which cannot qualify as humic acids. The comparative study of humic
substances and humic acids isolated by way of microbial treatment has shown that humic
acids (resistant to microbial transformation) are responsible for intensive absorption of light
in visible part of spectra (dark colored) and the formation of water-insoluble complexes
with heavy metals. At the same time, in the tests for growth-regulating activity (typical for
humic substances), including stimulation of grains germination and stimulations of plants
growth and development, humic acids isolated by microbiological method appeared to be
inactive. This means that growth-regulating activity of humic substances depends on the
part of such substances which is utilized by soil microorganisms.
CONCLUSIONS
Humic substances contain near 80% of humic acids resistant to microbial
transformation, which ensure their accumulation in soils. Having such specific features,
these compounds have a key role in pedogenesis. We believe that the term “humic acids”
should, therefore, comprise this specific group of compounds, standard samples of which
can be obtained with help of soil microorganisms.
REFERENCES
1. Putsikin Yu.G., Shapovalov A.A., Stepanov A.L., Zvyiagyntsev D.G., Lisak L.V. 2004,
Phytopedon, vol. 3, No. 1, p.61-66.
2. Zviagyntsev D.G., Putsikin Yu.G., Shapovalov A.A., Stepanov A.L., Lisak L.V. Bulankina M.A.
2004, Mosc.Univ.Bull./Soil Science, No. 2, p. 44-47.
722
Metabolic and Immune-Modulating Properties of Commercial Humic Preparations Produced from Peat
Liliya Stepchenko, Evgeniya Mihailenko
Dniepropetrovsk State Agrarian University, 25 Voroshilova str, Dniepropetrovsk, 49600
Ukraine, [email protected]
Keywords: humic preparations, poultry farming, resistance, productivity, mechanism of action
1. INTRODUCTION
Molecular mechanisms of biological activity of humic substances (HS) are at present
intensively studied. Peat humic products possess a wide spectrum of biological activity
and are widely applied in husbandry and poultry sector. They impact immunity of animals
by improving their adaptation to inside and outside environment.
2. MATERIALS AND METHODS
Experiments were carried on chicken-broilers (n = 10000) during five years using
different methods of physiology and biochemistry in poultry farms of Dnipropetrovsk region
(Ukraine). Commercial humic preparations produced from peat such as Huminate,
Hydrohumate, and Oxyhumate were used in the different experiments.
3. RESULTS AND DISCUSSION
The data obtained show that humic substances (HS) stimulate productivity and
increase resistance of chickens to different pathogens. In numerous trials conducted under
the conditions of poultry farms it has been demonstrated that addition of Huminate as well
as of Hydrohumate and Oxyhumate to the basal diet of the fast-growing chicks promoted
the protein synthesis and resulted in increased daily gain of the body mass. Changes in
amino acid composition were observed both in chick blood serum and in femoral and
pectoral muscular tissues. Changes in the content of different metabolites in chicken
tissues are shown in Table 1.
The increased contents of G, M, and A immunoglobulins were found using
monospecific (in respect to the certain immunoglobulins) antibodies. The level of G-
immunoglobulins, which are predominant in chickens, has changed much more as
compared to M- and A- immunoglobulins. Of particular importance is that the observed
increase in the total content of immunoglobulins characteristic of immunological status of
an organism did not exceed the physiological norm.
723
Table 1. Influence of humic substances on metabolism and immunology status
in chicken tissues
Observed changes in liver Changes in the blood serum Changes in the pectoral and
femoral muscles
↑ cAMP ↑ total protein Increased formation of bioproduction
↑ proteolysis ↑ fraction of protein as well as lipoprotein, gaptoglobin and
immunoglobulins
↑ free amino acids' pool
↑ the content of aminoacids in protein hydrolysate
↑ activity of cathepsin B ↑ IgG, IgM, IgA ↑ activity of cathepsin B
↑ inhibitor of cathepsin B ↑ fibronectin ↑ the content of aminoacids
stimulating the post-translation modification
of protein ↓ circulating immune complex ↓ the total lipid content
↓ free aminoacids ↓ the unbound water
4. CONCLUSIONS
The commercial humic preparations produced from peat were shown to be promising
food additives for poultry of different kind and age. They act as growth promoters, immune-
and stress- protectors and metabolism correctors.
REFERENCES
1. Stepchenko L. 2000. 11-th International Peat Congress, Quebec, Canada, pp. 921-927.
2. Stepchenko L. 2004. Naukoviy visnik NAU 78, 68-72.
724

Chemical and Plant Growth Stimulatory Properties of Lignohumate
Olga Yakimenko1, Oleg Gladkov2, Rodion Poloskin2 1Soil Sci. Dept, Moscow State University, 119991, Moscow, Russia, [email protected] 2A.E.T. Ltd. (RET Ltd Company ) St. Petersburg , Russia, [email protected]
Keywords: humate, lignohumate
1. INTRODUCTION
Commercial humates (HUM), derived from various natural sources have been
reported to be effective soil conditioners and materials for remediation of degraded and
polluted soils (1). Today the market of HUM is being actively developed. They are
produced by manufactures from various kinds of raw materials and differ considerably in
their composition, activity and documented cost. Currently, sufficient data do not exist
concerning HUM properties or the efficiency of production or processing as it relates to
source raw material and technologies used in production. Furthermore, differences in
chemical structure and properties between natural and industrial humates have received
limited study. In this paper the theoretical summary of probable mechanisms, due to which
HUM display their positive effect on soil and plants are presented. The properties of
Lignohumate, a HUM of the new generation, produced by oxidative-hydrolytic destruction
of lighosulfonates, are evaluated in comparison with other brands of HUM.
2. MATERIALS AND METHODS
Properties of several grades of Lignohumate are evaluated in comparison with other
brands of HUM and natural humic substances. Chemical properties and physiological
activity of Lignohumate and a number of other HUM are analyzed, using a standard HA as
a reference sample. Plant growth stimulating effect was evaluated in bioassay lab tests.
3. RESULTS AND DISCUSSION
Laboratory studies showed primary chemical parameters of Lignohumates (e.g.,
elemental content, functional groups, molecular weight, IR- and fluorescence spectra)
were more similar to soil humic acids, than HUM produced from peat and lignite. Plant
growth stimulating effects were evaluated using bioassay lab tests. From these tests
Lignohumate demonstrated biological effects over a wide range of concentrations, with
inhibition observed at higher levels as typical for humic substances. Results of field
725

experiments with Lignohumate application are also discussed. Physical and chemical
parameters of different Lignohumate samples are shown in the table.
Table 1. Characteristics of different grades of Lignohumate
Grades of Lignohumate Parameter АМ
sodium АМ
potassiumВМ
sodium ВМ
potassium
Appearance Dark brown scaly
powder with a weak special odor
Dark brown suspension with a weak special odor
Dry matter, % not exceed - 19 рН6% 8,5-10
Organic matter, % from dry matter 58-64 K, % from dry matter, not less 1 9 1 9
Na, % from dry matter, not less 9 Not regulated 9 Not
regulated Humic acids, % from OM 60-85
Acid-soluble fraction, % from OM 15-40 S, % from dry matter, not less 3
Optical density of 0,02 % solution D440 0,250-0,570 Microelements, % from dry matter:
Iron Manganese
Cоpper Zinc
Molybdenum Boron Cobalt
0,01-02
0,01-0,12 0,01-0,12 0,01-0,12
0,005-0,015 0,01-0,15 0,01-0,12
4. CONCLUSIONS
According to the chemical data set, Lignohumate can be produced as a Na or K
humate; however, due to its lignin-based origin, it possesses a number of special
properties, different from peat or coal humates. Lignohumates contain sulfur (more than
3%), a lignin-derived carbon backbone, a low-molecular acid-soluble fraction and humic
acid. This composition may serve as a source of plant pigments and hormone-like
substances that may in turn give Lignohumate a competitive advantage over other HUM.
REFERENCES
1. Iakimenko, O.: Commercial humates from coal and their influence on soil properties and initial
plant development. In: Perminova, I.V., et al. (Eds.) Use of humic substances to remediate
polluted environments. From theory to practice. NATO Sci. Books Ser., 365-379 (2004)
726

New Express Technique for Determination of Antioxidant Activity of Humic Substances
Alexander Ya. Yashin1, Petr A. Fedin, Irina V. Perminova2 1JSC “NPO “Himavtomatika”, 12a Selskohozyaistvennaya St, 129226 Moscow, Russia
[email protected] 2Department of Chemistry, Lomonosov Moscow State University, Leninskie Gory 1-3, 119992
Moscow, Russia
1. INTRODUCTION
Interest of analytical chemists to humic substances (HS) is instantly growing. First of
all, it is connected to the current trend in agriculture directed toward application of organic
and organic-mineral fertilizers and necessity in the corresponding quality control
techniques. Another reason is that humic substances bind toxicants and cause disturbing
impact on their determination in air, water, and soil. This research is devoted to a use of
amperometric technique for determination of humic and fulvic acid. These natural
compounds contain phenolic units that makes feasible amperometric detection.
2. MATERIALS AND METHODS
Standards. Quercetin (pure for analysis) was purchased from Fluka. Humic materials:
three IHSS standard samples of humic materials from Suwannee River were used
including fulvic acid (SR-FA), humic acid (SR-HA), and dissolved organic matter (SR-
DOM). Commercial humate was potassium humate (PowHumus) produced from leonardite
by Humintech Ltd (Germany). Peat sample was obtained from Likhoslavl (Russia) and
extracted with distilled water using volume ratio of 1:5.
Amperometric analysis. Amperometric detection (AD) is based on measuring
electrical current produced by oxidation of analyzed compound on the surface of working
electrode upon applying the certain electrode potential. Working electrode used was made
of glassy carbon, which is the most universal electrode for determination of polyphenolic
compounds. Electrode potential varied from 0 to 2 V. The signal was registered in the form
of differential curves. The obtained data were processed using the specially designed
software which enables calculation of peak areas, heights, and calibrations.
AD has a whole number of advantages for determination of antioxidants. First of all,
this is express method: excluding sample preparation, time of one analysis takes only few
minutes. Analysis (registration and data treatment) occurs during real time. Reproducibility
of analysis is high due to precise injection using six-channel valve. Minimum detectable
727
concentration of polyphenols using AD technique lays in the range of nano- and picograms
(1.10-9-1.10-12 g). The principal scheme of the device is given in Figure 1.
Thermo-controller
Peristalticpump Detector cell Current
amplifierAnalog-digital
convertor
Mobilephase Waste
Injectionvalve
Thermo-controller
Peristalticpump Detector cell Current
amplifierAnalog-digital
convertor
Mobilephase Waste
Injectionvalve
Figure 1. The block-scheme of the device Tswet-Yausa-01-AA.
The device represents a flow-injection system which enables express determination
of antioaxidant activity of HS. No other reagents except for standard are needed for this
analysis. Quercetin (Fluka) is usually used as a standard fir this determination.
RESULTS AND DISCUSSIONS
The results of antioxidant activity measurements are shown in Table 1. The samples
of standard and commercially produced humic substances were used as well as water
extract from peat.
Table 1. Antioxidant activity of humic materials and peat extract
Humic materials Antioxidant activity (by quercetin), mg/g SR-HA 15.4 SR-DOM 14.6 SR-FA 13.4 Potassium humate (PowHumus, Germany) 5.96 Water extract from Likhoslavl peat 0.50
The proposed method can be also used for express-determination of antioxidant
activity of water extracts from soil, peat, sapropel, etc. The quantitative determination is
feasible after calibration of the device using standard solutions of quercetin.
4. CONCLUSIONS
The amperometric technique is promising approach for automatic analysis of HS. The
device “Tswet Yausa -01-AA” in included into the State List of measuring devices #20706-
05, and the measuring protocol of HS is certified (# 31-07 from 04.05.2007).
728

The Metal Ions Sorption by the Humic-Containing Anion Exchangers
Andrey Mitchenko1, Tetiana Mitchenko2, Nataliia Makarova2, Helena Shevchuk2 1SPC “ECOSOFT”, Saksaganskogo Str. 123, Kyiv, 03056, Ukraine, [email protected] 2National Technical University of Ukraine “KPI”, Pr. Pobedy 37, Kyiv, 03056, Ukraine, [email protected]
Keywords: exhausted ion exchange resins, NOM, metal sorption
1. INTRODUCTION
As a result of exploitation of ion exchange resins in processes of water
demineralization a gradual deterioration of their structural, physical and chemical, and the
operational characteristics is occur. These changes are caused mainly due to
accumulation of natural organic matter (NOM) in a phase of the sorbents (1). Such ion
exchangers are unusable for the further operation in processes of water demineralization
and represent industrial wastes.
Our preliminary researches have shown that ion exchangers exhausted in water
demineralization processes in most cases not only keep quite satisfactory level of
operational and capacitive characteristics, but also acquire a number of new positive
properties which can be used in other areas of water treatment (2).
The purpose of the present work was the research of physical and chemical
properties of exhausted ion exchangers, and also the estimation of a presence of acquired
properties allowing to develop on their basis new multifunctional sorbents for purification of
water with various composition from undesirable impurity of metals. Such properties are
the ability to the contact coagulation and complexing with ions of metals. For an estimation
of these ones the comparative research of sorption of iron II and copper by fresh and
exhausted ion exchangers was carried out.
2. MATERIALS AND METHODS
Researches were spent on the samples of anion exchange resins with different term
of operation in processes of industrial water treatment and also on the same ones fresh.
Information about investigated ion exchangers and also the content of NOM
accumulated in exhausted sorbents are presented in the Table 1.
NOM content in exhausted ion exchangers was determined as permanganate
oxidability of a filtrate decanted after treating of ion exchanger by a solution containing 2%
NaOH + 10% NaCl at 45oC during the 24 hours under the thermostatic conditions.
729

Table 1. Information about investigated ion exchangers
Ion exchange
resin Type Matrix
Cross-linking,
%
Functional group
Bead size distribution
Term of usage, years
NOM contentin exhausted exchanger, mgO2
.mL-1
1 SBAE type I SDVB gel 2 Trimethyl
amine Poly-
disperse 7 7.0
2 SBAE type I SDVB gel 8 Trimethyl
amine Poly-
disperse 10 12.5
3 SBAE type II SDVB gel 8 Dimethyl–
ethanol amineMono-
disperse 3 2.7
4 SBAE SDVB gel microporous - Quaternary
amine Poly-
disperse 1 2.9
5 SBAE SDVB macroporous - Quaternary
amine Poly-
disperse 1 1.8
6 WBAE SDVB macroporous - Tertiary
amine Poly-
disperse 3 10.1
7 WBAE SDVB macroporous - Tertiary
amine Poly-
disperse 2 6.0
8 WBAE PEPA condensing -
Secondary and tertiary
amine
Poly-disperse 7 3.3
9 WBAE EPA condensing -
Secondary and tertiary
amine
Poly-disperse 8 4.2
10 WBAE PA gel - Tertiary amine
Poly-disperse 2 2.6
SBAE – strong base anion exchanger, WBAE – weak base anion exchanger,
SDVB –sterene-divinylbenzene, PEPA - polyethylen-polyamine, EPA– epoxy-amine,
PA – polyacrylic
For comparison of sorption characteristics of fresh and exhausted ion exchangers the
some series of dynamic experiments were conducted. 1000 specific volumes of model
solutions I or II were passed through each glass column filled by above-indicated ion
exchangers accordingly. Flow rate of a model solutions passing through sorbents were 20
BV per hour.
Model solutions were prepared on tap water, preliminary dechlorinated and purified
from natural organic matter, and had following composition on macrocomponents:
730
I – solution containing Cu2+ - 6.1 mg L-1; Na+ - 11 mg L-1; K+ - 2.9 mg L-1; Ca2+ - 73.6
mg L-1; Mg2 + - 10.8 mg L-1; HCO3- - 173.2 mg L-1; Cl- - 63.6 mg L-1; SO42- - 50 mg L-1; pH -
6.7.
II – solution containing Fe2+ - 6.0 mg L-1; Na+ - 11 mg L-1; K+ - 2.5 mg L-1; Ca2+ - 63.6
mg L-1; Mg2+ - 11.5 mg L-1; HCO3- - 202.5 mg L-1; Cl- - 12.3 mg L-1; SO4
2- - 65,7 mg L-1; pH -
7.2.
3. RESULTS AND DISCUSSION
Researches have shown that decrease in total exchange capacity of ion exchangers
correlates with a level of NOM accumulation in exhausted resins (Table 1, 2) and depends
on matrix nature, basicity, porous structure of anion exchangers.
Table 2. The change of sorption properties of exhausted resins
in comparison to initial ones*
Change of specific sorption capacity regarding to metals, % ** Ion exchange
resin
Specific NOM content, mg O2 per functional
group
Change of total exchange
capacity, % Cu Fe (total)
1 5.55 - 7.5 + 84.0 + 3.2
2 10.72 - 14.5 + 107.4 + 36.8
3 2.08 - 2.7 +14.8 + 11.0
4 2.38 -1.6 Not fixed + 57.0
5 1.53 -1.7 Not fixed + 26.6
6 5.16 - 15.3 + 111.8 + 8.7
7 3.51 -8.2 + 70.3 + 11.2
8 1.26 - 8.1 + 8.6 + 25.2
9 1.87 - 18.3 + 22.1 + 24.4
10 1.46 -2.2 - 0.1 + 0.1 * Initial and exhausted ion exchange resins were treated by 5 BV of NaCl.
** Specific volume of model solution passed through the ion exchangers was
1000 BV
Maximal decreasing of total exchange capacity for resins with NOM accumulation is
noted for anion exchangers with condensing polyamine matrix. Weak base and gel strong
base SDVB anion exchangers are subject to a "poisoning" by NOM to a lesser degree and
the minimal decreasing of capacity at NOM accumulation was observed for polyacrylic
weak base anion exchangers and strong base porous on the basis of SDVB.
731

The comparison of data about change of the specific sorption capacity in relation to
copper (Table 2) has shown that copper extraction by exhausted strong and weak base
SDVB ion exchangers, and also by condensing polyamine anion exchangers increases in
comparison with fresh ones, and that increasing correlates with growth of NOM-content in
a sorbent. At the same time, copper extraction by exhausted polyacrylic anion exchangers
practically didn’t change in comparison with fresh ones.
The increasing of iron II extraction by exhausted gel strong base and porous weak
base SDVB anion exchangers, and also by condensing polyamine anion exchangers
(Table 2) wasn’t so considerably as in a case of copper. At the same time for exhausted
SDVB anion exchangers with micro- and macroporous structure the substantial increasing
of iron extraction in comparison with the samples of fresh ones was marked. The sorption
of iron by exhausted polyacrylic anion exchanger practically didn’t change.
4. CONCLUSIONS
Investigations have shown that anion exchangers “poisoned” by natural organic
matter during water demineralization processes lose somewhat capacitive properties, but
increase ability to complexing with ions of transition metals and acquire properties of
contact coagulants. The acquired properties are most obviously shown in a case of
exhausted anion exchangers on the SDVB-base, to a lesser degree – in a case of
polycondensing polyamine anion exchangers and practically were absent for polyacrylic
resins. An ability to contact coagulation is most obviously shown in a case of strong base
porous anion exchangers on the basis of SDVB.
On the basis of exhausted anion exchangers exposed to certain treatment the
multifunctional sorbents suitable for high level of water purification from ions of heavy and
nonferrous metals can be developed.
REFERENCES
1. Slavinskaya, G., Selemenev V. 2001. Fulvoacids of nature waters, Voronezh, 63-88.
2. Makarova, N., Mitchenko, T. 2006. Proceedings of International Workshop on Frontiers and
Interfaces of ion Exchange, IEW 2006, Turkey, p.107.
732

Humic Acids of Pelosilt (Sapropel) as Prospective Biogenic Stimulators for Medicine and Cosmetology Use
Filipp A. Puntus, Alexander Puntus
ECO-SAPROPEL Ltd., P.O. Box180, Minsk, 220114. Belarus, [email protected], www.eco-
sapropel.ru
Keywords: pelosilt, sapropel, medicine, cosmetology
Carried out since the 1970s, the extensive researches of composition of the fresh-
water lakes sediments, i.e. sapropels, (with the content of organic matter (OM) up to
70-90%) have shown the sapropels to be perspective raw materials for the extraction of
biogenic stimulators of various compositions (2, 3).
The majority of biogenic stimulators (1) produced by the medical industry using
organic solvents are known to be the extracts of organic components from the seas,
estuaries, and salt lakes silts, poor in organic matter (2-5%). The medical biogenic
stimulators like FIBS, peloidodistillate, and Torfotum are the distillates of biogenic amines,
simple phenolic structures, and organic acids volatilizing with steam. The content of lipid
and humic fractions in silts makes only shares of a percent while the sapropels from the
lake Sudobl contain 8-9% of lipids and 10-30% of humic substances depending on the
degree of biochemical decomposition and transformation of the initial biomass in different
layers of the deposit (4, 20).
The comparative analysis of the chemical nature of HA of sapropels and HA of the
salt lakes, estuaries, and seas silts shows that they have the same structure being natural
specific new formations generated from the initial biomass of reservoirs, mainly from zoo-
and phytoplankton, algae and living organisms under oxygen deficit (6). The only
difference is that HA of sapropels being generated in fresh-water reservoirs (with water
mineralization up to 1 g/l) unlike HA generated in salt-water reservoirs don’t form so strong
organomineral complexes with metals. It allows preserving the stable solutions of HA of
sapropels in ampoules for more than 10 years.
Combination of chemical and instrumental research methods has shown (5) that
humic acids (HA) of sapropels differ from HA of soils, peats and coals. Humic acids of
sapropels basically consist of hydrolysable polypeptide-carbohydrate complex (16
aminoacids and 5 carbohydrates) in a combination of fatty compounds with low content of
simple aromatic units. Condensed aromatic structures such as those present in HA of soils
and coals are not found in HA of sapropels. This fact is proved by benz(a)pyrene testing
(the more condensed, the more carcinogenic the product is).
733
Humic acids of sapropels are the mixture of acid substances formed as a result of
biochemical transformation of the initial biomass of the reservoir. They represent a group
of amorphous polycarboxylic acids with various content of polyfunctional groups (amine,
amide, carbonyl, carboxyl, phenolic hydroxyl, etc.) soluble mainly in the alkaline solutions
and precipitated when the solution is acidified by mineral acids (down to pH 1) due to the
suppression of weak organic acids dissociation. Upon drying, HA make amorphous (or
pseudocrystalline) dark-brown or black powder. Because of high content of aliphatic
structures, the HA molecules are hyperhydrated and when dissolved, keep a lot of bound
water (up to 14-20 g/l). As a result, the system is transformed into paste when only 3-4%
of HA are condensed. If the concentration of HA increases, the solution stability needs the
medium reaction (pH) to be more than 3.0 for 1% solution, 6.0 for 2% solution, and 7.0 for
3% solution. Decreasing pH for the solutions of the above mentioned concentrations
transforms the solutions into the colloidal systems (7).
It has been proved that humic acids of sapropels have the properties of biogenic
stimulators (3 mg/kg); viz. they stimulate the macrophage defense reaction, promote
nervous tissue regeneration, stimulate tissue reparation, and produce anti-inflammatory
effect (8) in case of tissue burns and cornea diseases. They stimulate mitochondrial
respiration (9, 10) and inhibit free radicals. By their radioprotective properties various
fractions of HA of sapropels show the evident radioprotective effect (11). HA molecules are
polydispersed (molecular mass is 1000-100000). Certain part of them penetrate the
human skin by diffusion and electrophoresis (12, 13).
The results of clinical trials of a preparation made from the sapropels from the lake
Sudobl with 1% of HA content have proved that humic acids block the excess of
hyaluronidase resulting in improvement of joints’ covering surfaces right up to the full
recovery.
Application of the sapropel therapeutic muds with increased content of HA in the
solution (14) or taking baths with a water-soluble extract (where HA is the main reactant)
helps patients with skin diseases (psoriasis, lichen planus, atopic dermatitis, seborrhea,
acne vulgaris). The improvement (itch and desquamation disappear) can be observed
beginning from the 6th procedure (15). Applications of sapropel HA solutions in treatment
of patients with catarrhal gingivitis and mild periodontitis showed better results than
Propolis (1% solution) therapy (17).
Applications of the solutions of HA of sapropels to rabbits cause the changes in all
skin layers. In the samples of skin with hypodermic tissue the following changes can be
observed: loosening and thickening of the stratum corneum with increased desquamation;
734

moderate cells enlargement in the stratum granulosum; the stratum spinosum is
characterized by focal proliferation, reduced nuclei basophilia, and appearance of small
vacuoles in the cytoplasm; in the dermis, there is an increased number of dilated blood
vessels of the deep net including microcapillaries, hair bulbs are enlarged, and sebaceous
glands have signs of proliferation. All these signs are evidence of intensification of
proliferation processes and functional activity of the skin (14, 16).
The aim of our research was to get an effective biogenic stimulator for tissue therapy
which would excel its analogs both in efficiency and in a period of storage (up to 10 years)
with stable chemical structure and biological activity.
We have licenses for the exploitation of the ecologically clean deposit of the
therapeutic sapropel muds from the lake Sudobl (Minsk region) which is unique in Europe
(18). We also have licenses from the Public Health Ministry of Belarus for manufacturing of
products for medical and cosmetic use. We have patented (19, 20) the methods of
products preparation from the lake deposits, as well as the processes and equipment for
excavation of the raw material from the deposit (21). Having a research laboratory of our
own we have formulated and introduced new preparations on the basis of HA that are
widely used in spa institutions in Belarus and abroad. Nowadays, HA, both separate and
combined with other bio-active substances extracted from sapropel muds, are extensively
used in manufacturing of cosmetic products of new generation having proved their
effectiveness.
REFERENCES
1. Mashkovsky M.D. Biogenic Stimulators. Remedies. M.: Medicine; 1993, pp. 173-176.
2. Lopotko M.Z., Evdokimova G.A. Sapropels and their derivatives. Minsk; 1986.190p.
3. Puntus F.A. Theory of action of physiologically active substances. Dnepropetrovsk; 1983, pp.
151-155.
4. Bambalov N.N., Puntus F.A. Molecular structure and agricultural value of humic acids of
sapropels. Agicultural chemistry: M.; 1995. N1, pp. 65-71.
5. Puntus F.A. Study of chemical nature of humic acids of sapropels. Thesis of the candidate of
chemical science. M.: 1984. 149p.
6. Puntus F.A. et al. Effect of biological productivity and water reservoir flowage on the chemical
composition of humic acids and lipids of sapropels. Minsk: Nature management; 1998. N4, pp.
81-91.
7. Puntus F.A. et al. Effect of metal ions and medium reaction on the sedimentation stability of
solutions of humic acids of sapropels. Nature management; 1997. N3, pp. 6-7.
735

8. Degtyarenko T.V., Mokulkin R.F. Biogenic stimulators and immune reactivity. Odessa; 1997.
376p.
9. Sykorskaya I.S. On the study of the effect of sapropel extracts on mitochondrial respiration.
Minsk: Issues of Balneology; 1978, pp. 155-157.
10. Ioshchenko S.E. Issues of Balneology, Physiotherapy and Exercise therapy. M.; 1986. N5,
pp.29-32.
11. Public Health Ministry of the Republic of Belarus. Toxicity test report and radioprotective
properties test report of humic acids of sapropels. (not published).
12. Puntus F.A., Glazkova L.P., Ulashchik V.S. Issues of Balneology, Physiotherapy and Exercise
therapy. M.; 1984. N2, pp.21-24.
13. Dolidovich E.F., Puntus F.A. Peat and sapropels in medicine and balneology. Solid
combustible deposits in Belarus and issues of environmental protection. Minsk; 1992, pp.102-
109.
14. Puntus F.A. et al. The method of obtaining therapeutic muds. Author’s license N1796186
(1796186 A1. A61K35/00, 35/10).
15. Karpovich I. Effectiveness of sapropel muds application in the combined therapy for patients
with skin diseases at Kemeri resort (Latvia), 1990-1992. Scientific report.
16. Glazkova L.P., Bezzubik S.D. The experimental morphological study of biological effect of
humic acids of sapropels and of skin permeability. Peripheral nervous system. Minsk; 1985,
pp. 29-35.
17. Mozhar T.A. et al. Propolis and pelotherapy effectiveness in treatment of parodentium
diseases. Health of population of Belarus.1992. N7, pp.41-43.
18. Puntus A.F. Excavation results of theraputic muds and their preparation. Theraputic
hydromineral resources of Belarus. Minsk; 1996.
19. Puntus A.F. et al. The method of humic acids extraction from the natural humus-containing
compounds. Al 1721025.
20. Puntus A.F. Physical and chemical properties of the sapropels from the lake Sudobl.
Therapeutic hydromineral resources of Belarus. Minsk; 1996.
736

Author Index
volume I, 1 to 350
volume II, 351 to 736

A Abakumov, Evgeniy V. .......................171, 175
Abraham, Anuji ......................................... 181
Achenbach, Laurie A................................. 537
Adesanwo, Julius Kolawole....................... 609
Adesanwo, Olusola Olajumoke ................. 609
Adetunji, Michael Tunde............................ 609
Aguirre, María Jesús................................. 399
Alexandrova, M. .................................261, 299
Alidoost, M. ............................................... 117
Allen, Herbert E. ....................................... 391
Alliksaar, Tiiu ............................................ 269
Allpike, Bradley ........................................... 27
Almendros, Gonzalo ................................. 257
Álvarez, A.G.............................................. 223
Amblès, André .......................................... 295
Amery, Fien .............................................. 353
Andersen, Dag Olav.................................. 177
Andersone, Anna ...................................... 639
Angelova, Gergana....................449, 627, 703
Anselmi, Claudio......................................... 63
Antilén, Mónica ......................................... 399
Aranson, John........................................... 607
Araújo, Marlise A.V. .................................. 545
Arbelo, Carmen D. .................................... 235
Aso, Suzuka.............................................. 333
Avena, Marcelo........................................... 39
Avramenko, Valentin................................. 623
Avvakumova, Nadezda Petrovna .............. 613
B Badun, Gennady A.............................425, 509
Bakajová, Barbora .............................541, 571
Barbosa, Danilo S. .................................... 497
Barbosa, Domingos S. .............................. 497
Barrera Garcia, V. Daniela ........................ 413
Bellat, Jean Pierre..................................... 413
Bellin, Iramaia Corrêa ............................... 699
Belyaeva, Elena Yu................................... 509
Benites, Vinicius de Melo .................... 43, 597
Berloco, Mariagrazia ......................... 391, 677
Bertoni, Aldo ............................................. 411
Bezrukova, Marina .................................... 469
Bezuglova, Olga S. ........................... 319, 617
Bikovens, Oskars ...................................... 639
Bird, Jeffrey A. .......................................... 315
Bishop, Andrea G...................................... 435
Blazquez, Ander Paz................................. 553
Bloom, Paul............................................... 357
Bogush, Anna ........................................... 619
Bolkova, Anna........................................... 533
Bolsunovsky, A.................................. 261, 299
Bonagamba, Tito J. ................... 105, 311, 529
Bondareva, L..................................... 261, 299
Bratskaya, Svetlana Yu. .................... 431, 623
Bravo, Miguel ............................................ 219
Brechowskych-Jaworska, Nadija............... 279
Breider, Florian ......................................... 181
Brezonik, Patrick ....................................... 357
Briceño, Margarita..................................... 399
Brigante, Maximiliano.................................. 39
Brocchi, Eduardo Albuquerque............ 43, 545
Brukner-Wein, Alice .................................... 23
Budzinski, Hélène ..................................... 367
Burba, Peter.............................................. 691
Bursáková, Petra......................................... 47
Byrne, Corinna M. ....................................... 51
C Cabaniss, Steve............................................ 3
Cade-Menun, Barbara J. ............................. 87
Caldwell, Bruce ......................................... 291
Canales, Josefina...................................... 399
Cao, Tian-shu ........................................... 401
Casademont, Ernest ................................. 113
Cavani, Luciano .......................... 59, 461, 635
Cayot, Philippe.......................................... 413
738

Celi, Luisella ............................................. 185
Cerli, Chiara.............................................. 185
Chakalov, Konstantin .................449, 627, 703
Chanton, Jeff ............................................ 365
Chanudet, Vincent .................................... 151
Chapron, Yves ............................................ 75
Chassagne, David..................................... 413
Chekanova, Anastasia .............................. 585
Chen, Jenn-Shing ....................................... 55
Chen, Tsai-Huei........................................ 341
Chen, Yona..................................77, 149, 361
Chernenko, Pavel ..................................... 549
Chernysheva, Maria G. ......................425, 509
Cheyns, Karlien ........................................ 353
Chiou, Chyi-Rong...................................... 341
Chiu, Chih-Yu ............................................. 55
Christoforidis, Kostantinos ............................ 7
Chukov, Serafim ................................145, 175
Ciavatta, Claudio..........59, 461, 601, 631, 635
Coates, John D. .................................537, 593
Coelho, Christian ...................................... 635
Colnago, Luiz A. ....................................... 239
Comans, Rob N.J...................................... 485
Conant, R.................................................. 167
Cooper, William T. .......................95, 289, 365
Corrado, Giampetro .................................. 461
Cossa, Daniel ........................................... 439
Costa, Thiago G........................................ 481
Covaleda, Sara ......................................... 219
Čtvrtníčková, Anna...................................... 11
Cudini, Andrea .......................................... 411
Cui, Jun-Tao ......................................187, 401
Cunha, Bruno Barboza ............................. 699
D D’Andrilli, Juliana ...................................... 365
D’Orazio, Valeria........................199, 323, 327
da Silva, Marcos Rivail.............................. 481
da Silva, Wilson T.L. ..........................191, 371
Dalmolin, Ricardo S.D. .............................. 195
de Azêvedo, Eduardo R. ........... 105, 311, 529
De Jesus, Amanda Maria Dantas.............. 699
De la Rosa, Sabrina Rubert ...................... 587
De Nobili, Maria................................... 63, 411
de Perre, Chloé......................................... 367
De Souza, André A. .................................. 529
De Troyer, Inne ......................................... 353
Degryse, Fien............................................ 353
Deligiannakis, Yiannis ............................. 7, 69
Demin, Dmitrii V. ....................................... 125
Dercová, Katarína ..................................... 711
Desor, Michael ............................................ 15
Di Bernardo Dantas, Angela...................... 493
Di Bernardo, Luiz ...................................... 493
Di Toro, Dominic M. .................................. 391
Diatta, Sitapha .......................................... 609
Dick, Deborah Pinheiro ............................. 195
Dittmar, Thorsten ...................................... 289
Dizhbite, Tatiana ....................................... 639
Dobele, Galina ............................................ 73
Dominguez, Danielle Xanchão .................. 597
dos Santos, Jeniffer V. .............................. 281
Dou, Sen..................................... 65, 187, 401
Drastík, Martin............................................. 11
Drosos, Marios........................................ 7, 69
Drozd, Jerzy...................................... 203, 643
Duarte, João G. C. .................................... 695
Dubov, Alexander...................................... 585
Duguy, Beatriz .......................................... 207
Dunlevey, John Norman............................ 609
Dzhardimalieva, Gulzhian ......................... 525
E Efanov, Maxim .......................................... 549
Eglite, Linda ................................................ 73
Eldor .A. Paul ............................................ 167
Erdenebat, Ts. .......................................... 581
Espíndola, Evaldo L. G.............................. 497
739
F Fasurová, Naděžda................................... 457
Fatkhutdinova, Rimma .............................. 469
Fauskrud, Svanhild L. ............................... 249
Faustino, Adriana Soares.......................... 191
Fedin, Petr A............................................. 727
Fedoros, Elena ......................................... 681
Fedorova, E. ............................................. 261
Fedoseeva, Elena..................................... 687
Fekete, A. .................................................. 31
Feller, Christian......................................... 149
Feng, Liang-Wei ....................................... 187
Fernandes, Tania V. ................................. 553
Ferreira, Edney Joubert Bittencourt............. 43
Filcheva, Ekaterina ................................... 211
Filella, Montserrat ........................75, 151, 405
Firestone, Mary K...................................... 315
Follett, R.F. ............................................... 167
Fortuna, Ann-Marie ................................... 109
Fouchard, Samuel..................................... 215
Fraceto, Leonardo F. .........................691, 695
Francioso, Ornella................................59, 631
Freitag, Stéphanie..............................139, 215
Frimmel, Fritz H. ....................................... 383
Frommberger, M. ........................................ 19
Fujitake, N................................................. 171
Fujitake, Nobuhide.............................333, 503
Fukushima, Masami.................................. 513
G Gabelica, Zelimir ....................................... 139
Gadimov, Aladdin...............647, 651, 655, 707
Galceran, Josep........................................ 445
Galicia-Palacios, M.S................................ 223
Gallardo, Juan F. ...................................... 219
Galochkin, Alexander................................ 549
García-Calderón, Norma E. ...................... 223
García-Oliva, Felipe .................................. 219
Garmash, Andrey.............................. 103, 137
Garnier, Jean-Marie .................................. 181
Gáspár, András............................... 15, 23, 31
Gaviño, Rubén .......................................... 399
Gebefuegi, I. ............................................... 31
Georgi, Anett............................................. 409
Gerringer, Fredrick W................................ 121
Ghaemi, Negin .......................................... 411
Giannakopoulos, Evangellos ....................... 69
Gigliotti, Giovanni ...................................... 323
Gioacchini, Paola ................................ 59, 631
Gjessing, Egil T. ........................................ 337
Gladkov, Oleg ........................................... 725
Gleixner, G................................................ 227
Glowacki, Mariusz ............................. 231, 285
Golubeva, Nina ......................................... 525
González, M. Isabel .................................. 219
González-Pérez, José Antonio .................. 235
González-Pérez, Martha ........................... 239
González-Vázquez, Rocío......................... 235
González-Vila, Francisco J........................ 235
Goodilin, Evgeny....................................... 585
Gorecki, Tadeusz........................................ 95
Goriachenkova, Tatiana ............................ 561
Gougeon, Régis D..................................... 413
Goveia, Danielle................................ 691, 695
Graber, Ellen R. ........................................ 155
Grasset, Laurent ....................................... 295
Grinhut, Tzafrir ............................................ 77
Guggenberger, Georg ............................... 185
Guo, Jingheng........................................... 243
Gurbanov, Elshad ..............647, 651, 655, 707
Guyot, Ghislain ................................. 461, 635
H Haaland, Ståle .......................................... 249
Hadar, Yitzhak ............................................ 77
Hadj-Mebarek, Ahmed .............................. 139
Hammer, Heiko ......................................... 417
740

Hänninen, Kari .....................................81, 247
Harir, M....................................................... 31
Hassanpanah, Davoud ......647, 651, 655, 707
Hassen-Trabelsi, Aïda Ben ....................... 331
Hassouna, Mohammad............................. 181
Hatano, Ken-ichi ......................................... 83
Hatcher, Patrick G................................51, 129
Hatfield, Kirk ............................................. 521
Hayes, Daniel J......................................... 517
Hayes, Michael H.B. ...................51, 105, 311,
..................................................379, 567, 557
He, Yan..................................................... 387
He, Zhongqi ...........................................87, 91
Helbig, Bjoern ............................................. 95
Hertkorn, Norbert .............................19, 31, 77
Hideki, Ebata ............................................ 685
Hilscher, André ......................................... 159
Honeycutt, C. Wayne .....................87, 91, 109
Hongve, Dag............................................. 249
Horwath, William R. .................................. 315
Houston, Melanie ...................................... 421
Huang, P.M............................................... 387
Huc, Alain-Yves ........................................ 163
Huettel, Markus......................................... 289
Huguet, Arnaud......................................... 113
Hunt, James F. ........................................... 87
I Ibalot, Fabienne .................................113, 367
Ibatullina, Inna .......................................... 687
Ibraeva, Maria........................................... 345
Ilčin, Michal ............................................... 541
Ivanov, Alexander ..................................... 659
Ivanov, Vladimir ........................................ 623
J Jakub, Bekier ............................................ 643
Janta-Koszuta, Krystyna ........................... 605
Jerzykiewicz, Maria................................... 643
Joll, Cynthia ................................................ 27
Jones, Melinda.......................................... 365
Jones, Nastassia N. .................................. 537
Jordan, Mike ............................................. 557
Jorobekova, Sharipa ......................... 525, 561
Junek, Ralf ................................................ 667
Jurica, Lubomír ......................................... 457
Jurkjan, Vilhelmina ...................................... 73
K Kadziuliene, Z. .......................................... 307
Kagi, Robert ................................................ 27
Kaiser, Klaus............................................. 185
Kaljurand, Mihkel....................................... 133
Kalmykov, Stepan N.................................. 533
Kanavati, B.................................................. 31
Kaniskin, Maxim........................................ 687
Karle, Elly.................................................. 383
Kárpáti, Zoltán............................................. 23
Karpenco, Valery....................................... 671
Karpiouk, Leonid A............................ 521, 573
Kavoliute, Filomena................................... 307
Kechaikina, Irina........................................ 175
Ken, Nakayasu.......................................... 685
Kholodov, Vladimir .................................... 561
Khwaja, Abdul ........................................... 357
Kinne, Matthias ........................................... 95
Kirchmann, Holger .................................... 219
Kislinger, Jiří ............................................. 253
Kļaviņš, Māris...................................... 73, 303
Klein, Olga ........................................ 441, 663
Kleiner, Carola ............................................ 95
Klenov, Boris............................................. 257
Klochenko, Peter....................................... 489
Kloecking, Hans-Peter............................... 667
Kloecking, Renate ............................... 95, 667
Klučáková, Martina.............................. 99, 465
Knicker, Heike........................... 159, 195, 235
Knoblauch, Christian ................................. 349
741

Kodama, Hiroki ......................................... 333
Kolawole, Ayo ........................................... 609
Komarov, Andrey ...................................... 671
Kononikhin, Alexey ............................103, 137
Kopinke, Frank-Dieter ............................... 409
Korobkov, Viktor I...............................425, 509
Koroleva, Olga ...................................441, 663
Kosaki, T................................................... 171
Koslova, Veronika..................................... 481
Kostka, Joel .............................................. 289
Koulikov, Aleksandar ................................ 211
Kovács, Krisztina ........................................ 23
Kovalenko, Anton N. ................................. 533
Kozinskaja, Irina ....................................... 561
Krasilnikov, P. ........................................... 223
Kratz, Jens Volker..................................... 587
Kubota, Kenji .............................................. 83
Kučerík, Jiří..............11, 47, 99, 253, 541, 571
Kudryasheva, N. ................................261, 299
Kudryavtsev, Alexey V. ............................. 509
Kulikova, Natalia A....................425, 441, 509,
..................................561, 573, 585, 663, 719
Kunenkov, Erast V. ..............15, 103, 137, 425
Kusnetsov, Vyacheslav............................. 469
Kwapinski, Witold...................................... 557
Kydralieva, Kamila .............................525, 561
L Lajtha, Kate............................................... 291
Lapenis, Andrei......................................... 607
Lasso, T.A................................................. 223
Lawrie, Ann............................................... 715
Le Ménach, Karyn..................................... 367
Leahy, Liam .............................................. 557
Lebedeva, Galina F............................573, 719
Lebedeva, Galina...................................... 673
Leita, Liviana............................................... 63
Lepane, Viia.............................................. 269
Levshina, Svetlana.................................... 265
Li, Kai.......................................................... 65
Li, Sergey.................................................. 561
Liang, Yao................................................... 65
Liaudanskiene, Inga .................................. 307
Licznar, Michal .......................................... 203
Licznar, Stanislawa E. ............................... 203
Linnik, Peter .............................................. 427
Lisak, Ludmila ........................................... 721
Llopiz, Pierre ............................................. 215
Lobo, Fabiana A................................ 691, 695
Lock, Richard .............................................. 15
Loffredo, Elisabetta ........................... 391, 677
Lopp, Margus ............................................ 133
Luang, Wen-Wen ........................................ 55
Lubyanova, Alsu........................................ 469
Lucio, M. ..................................................... 31
Lutsenko, Tatiana N. ................................. 431
M Madaeni, Sayed S..................................... 411
Magrini, K.................................................. 167
Makarõtševa, Natalja ................................ 269
Makarova, Nataliia .................................... 729
Makhinov, Alexei N. .................................. 273
Makhinova, Alexandra F............................ 273
Malawska, Małgorzata....................... 277, 279
Malenovská, Miroslava.............................. 465
Malinovskaya, Lidiya ................................. 427
Malpass, Geoffroy R. P. ............................ 497
Maltzeva, Elizabeth ................................... 659
Mangrich, Antonio S.................. 195, 281, 529
Mao, Jingdong ...................................... 87, 91
Markich, Scott ........................................... 421
Marschner, Bernd...................................... 473
Martinazzo, Rosane .................................. 195
Martini, Mariane ........................................ 481
Martin-Neto, Ladislau ................ 191, 239, 371
Maryganova, Victoria ................................ 307
Mauricio, Gloria M. .............................. 43, 545
742

Mauricio, Marcos H. de P.......................... 545
Mayer, Georgi ........................................... 477
McDonald, Suzanne.............................27, 435
McInerney, Raymond................................ 567
Mertens, Jan............................................. 353
Mętrak, Monika ..................................277, 279
Mihailenko, Evgeniya ................................ 723
Milori, Débora M.P.B..........................239, 371
Miszczak, Ewa .......................................... 605
Mitchenko, Andrey .................................... 729
Mitchenko, Tetiana.................................... 729
Mitov, Konstantin ...............................449, 703
Mogil’naya, O.....................................261, 299
Montecchio, Daniela ............................59, 631
Mora, María de la Luz ............................... 399
Moretti, João P.......................................... 695
Morris, S.J................................................. 167
Mortimer, Robert ....................................... 391
Mouchel, Jean-Marie .........................375, 445
Muresan, Bogdan.......................375, 439, 445
Mutere, Olga............................................. 639
Muzafarov, Aziz M. ................................... 521
N Nadporozhskaya, Marina .......................... 681
Naida, Nadezhda ...................................... 671
Necvetay, Anna M..................................... 719
Neganova, N.M......................................... 617
Neunlist, Serge ..................................139, 215
Ng, Jack.................................................... 421
Nicolini, Keller P........................................ 529
Nikolaev, Eugene...............................103, 137
Nikolaev, Ilya ............................................ 441
Nogueira, Ana Rita de Araújo.................... 191
Noller, Barry.............................................. 421
Nordov, E.................................................. 581
Norjinbadam, S. ........................................ 581
Novák, František....................................... 253
Novikov, Alexander ................................... 561
Novotny, Etelvino H......51, 105, 311, 529, 567
Novozhenov, Vladimir ............................... 549
Nunes, Raul A..................................... 43, 545
Nurgalieva, Raisa...................................... 469
O Ogura, Kazuhiko ....................................... 503
Ohno, Tsutomu ..................................... 87, 91
Olk, Daniel C....................................... 91, 109
Osiname, Olu ............................................ 609
Otarov, Azimbay........................................ 345
P Parlanti, Edith.................................... 113, 367
Paschke, Albrecht ..................................... 417
Pekař, Miloslav............................ 99, 541, 571
Perdue, E. M. .............................................. 19
Pereira, Betânia F. ............................ 195, 281
Perminova, Irina V.......15, 103, 137, 425, 509,
..........................................521, 533, 561, 573,
...........................................585, 617, 719, 727
Pernet-Coudrier, Benoît ............ 375, 439, 445
Peschke, Rafael ........................................ 383
Petrosyan, V.S. ......................................... 533
Pfeifer, Hans-Rudolf .................................. 181
Pfeiffer, Eva-Maria .................................... 349
Philippova, Olga I. ............................. 573, 719
Pillon, Clenio N.......................................... 281
Pisarek, Izabella................................ 231, 285
Podgorski, David ................................. 95, 289
Poerschmann, Juergen ............................... 95
Pokorný, Eduard ....................................... 457
Polano, Maurizio ......................................... 63
Poloskin, Rodion ....................................... 725
Pomogailo, Anatolii ................................... 525
Pomogailo, Svetlana ................................. 525
Ponomarenko, Sergey A. .......................... 521
Popov, Alexander I.................................... 453
Popov, Igor........................................ 103, 137
743
Popova, Todorka........................449, 627, 703
Poputnikova, Tatiana ................................ 687
Porquet, Alain ............................................. 75
Pospíšilová, Ľubica ................................... 457
Pouliquen, Stéphanie.........................375, 445
Prat, Christian ........................................... 219
Prenzler, Paul D........................................ 435
Primavesi, Odo ......................................... 371
Průšová, Alena ........................................... 47
Puntus, Alexander F. ................................ 733
Puntus, Filipp A......................................... 733
Putsykin, Yury........................................... 721
Q Quentel, François...................................... 151
R Rakhleeva, Anna....................................... 687
Rasmussen, Janet .................................... 291
Revchuk, Alex D. ...................................... 577
Richard, Claire ...........................125, 461, 635
Riise, Gunnhild ......................................... 249
Robards, Kevin ......................................... 435
Rocha, Julio C. ..................................691, 695
Roddick, Felicity........................................ 715
Rodríguez, Antonio Rodríguez .................. 235
Romão, Luciane P.C..................691, 695, 699
Rosa, André H. ..........................691, 695, 699
Rosario-Ortiz, Fernando L......................... 121
Rousseva, Svetla ...................................... 211
Roux-de Balmann, Hélène ........................ 113
Rovira, Pere.......................................207, 295
Rozhko, Tatiana.................................261, 299
Rudich, Yinon ........................................... 155
Ruhl, Isaiah D. .......................................... 129
Ryumin, Alexander.................................... 175
S Said-Pullicino, Daniel ................................ 323
Sajgó, Csanád ............................................ 23
Sancho, Noemi Romon ............................. 553
Sanjaasuren, Radnaasediin ...................... 581
Santa Maria, Luiz Claudio de .................... 597
Sardashti, Alireza R. ................................. 117
Sastriques, Fernando Ortega .................... 149
Savov, Valentin ......................... 449, 627, 703
Schmitt-Kopplin, Philippe .....15, 19, 23, 31, 77
Schoenherr, Juergen I............................... 667
Schüürmann, Gerrit................................... 417
Sciubidlo, Izabela ...................................... 553
Sedláček, Petr........................................... 465
Segnini, Aline ............................................ 371
Senesi, Nicola ............199, 323, 327, 391, 677
Sequi, Paolo.............................................. 601
Seyedbagheri, Mir-M. ................................ 603
Shahriari, Reza ..................647, 651, 655, 707
Shakirova, Farida ...................................... 469
Shaloiko, Lubov A. .................................... 125
Shapovalov, Alexander ............................. 721
Shchegolikhina, Anastasia ........................ 473
Shcherbina, Natalia S................................ 533
Shevchuk, Helena..................................... 729
Shi, Zhenqing............................................ 391
Shigematsu, Satoko .................................. 513
Shipov, Valery........................................... 681
Siewert, Christian ...................................... 159
Silva, Ângelo Augusto M. J. .............. 691, 695
Simões, Marcelo Luiz................ 191, 371, 597
Šīre, Jānis ........................................... 73, 303
Skokanová, Marianna ............................... 711
Slepetiene, Alvyra ..................................... 307
Slepetys, Jonas......................................... 307
Sloboda, Eliane......................................... 493
Smolders, Erik........................................... 353
Sokolova, Irina .......................................... 477
Sokołowska, Zofia ..................................... 499
Solarska, Sylwia........................................ 715
Song, Guixue .................................... 105, 311
744

Sorkina, Tatiana A. ............................585, 719
Sparks, Donald L. ..................................... 391
Stefaniak, Sebastian ................................. 605
Steinbeiss, S............................................. 227
Stepanov, Alexey ...................................... 721
Stepanova, Elena...............................441, 663
Stepchenko, Liliya..................................... 723
Stom, D..................................................... 261
Stuart, John .............................................. 567
Stumpe, Britta ........................................... 473
Suffet, I.H. (Mel).................................121, 577
Sukhoverkhov, Svyatoslav ........................ 623
Suska-Malawska, Małgorzata ................... 345
Svarovskaya, Lydia................................... 659
Swift, Roger S........................................... 379
Szpoganicz, Bruna P. ............................... 481
Szpoganicz, Bruno.............................481, 597
T Tanokura, Masaru....................................... 83
Tarchitzky, Jorge....................................... 361
Tatsuaki, Yamaguchi ................................ 685
Tchaikovskaya, Olga................................. 477
Telysheva, Galina ........................73, 639, 673
Temperton, V.M. ....................................... 227
Ter Halle, Alexandra ..........................461, 635
Ter Haseborg, Eike ................................... 383
Tercero Espinoza, Luis A. ......................... 383
Terekhova, Vera ....................................... 687
Thieme, Juergen......................................... 35
Throckmorton, Heather M. ........................ 315
Tiltina, Livija .............................................. 673
Timofeev, Mikhail ...................................... 687
Tischenko, Svetlana. A. ............................ 319
Tombácz, Etelka ......................................... 23
Tõnno, Ilmar.............................................. 269
Traversa, Andreina ....................199, 323, 327
Trichet, Jean............................................. 331
Trubetskaya, Olga E. ...........59, 125, 129, 461
Trubetskoj, Oleg A. ..............59, 125, 129, 461
Tseng, Tsung-Yao..................................... 341
Tsuda, Kumiko .......................................... 333
Tsvetkova, Eugenia A. ...................... 425, 509
Tusseau-Vuillemin, Marie-Hélène ............. 445
Twardowska, Irena.................................... 605
Tyasto, Zinaida A. ............................. 425, 509
U Übner, Monika........................................... 133
V Válková, Dana............................................. 99
Vallejo, V. Ramón ..................................... 207
Van Dam, Rick .......................................... 421
Van der Sloot, Hans A............................... 485
Van Lier, Jules J. B. .................................. 553
Van Trump, J. Ian.............................. 537, 593
Van Zomeren, André................................. 485
Varrault, Gilles .......................... 375, 439, 445
Vasylchuk, Tetiana.................................... 489
Vavilova, Valeria ....................................... 687
Vicente Vilas, Víctor .................................. 587
Vidal-Torrado, Pablo ................................. 239
Vieira, Eny M..................................... 493, 497
Vladimirov, Gleb................................ 103, 137
Vogt, Rolf D............................................... 337
Voilley, Andrée.......................................... 413
Volk, Alexandra......................................... 623
Volperts, Alexander................................... 673
Voronin, Vladimir....................................... 619
Vydryakova, G. ................................. 261, 299
W Walter, Serge .................................... 139, 215
Wang, Haizhen ......................................... 387
Wang, Ming-Kuang ................................... 341
Wang, Qing-hai ........................................... 65
Wang, Ya-Nan .......................................... 341
Warchulska, Patrycja ................................ 499
745

Weber, Jerzy............................................. 203
Weber, Matthias........................................ 383
Weiner, Lev................................................... 7
Wiłkomirski, Bogusław .......................277, 345
Wu, Fengchang .......................................... 91
Wu, Jianjun............................................... 387
Wypych, Fernando.................................... 529
X Xu, Jianming ............................................. 387
Y Yakimenko, Olga................................607, 725
Yakovlev, Alexander ................................. 687
Yanagi, Yukiko.......................................... 503
Yashin, Alexander Ya. .............................. 727
Yeh, Hsun-Jung ........................................ 341
Yoda, Kaori ............................................... 503
Yonebayashi, Koyo ................................... 333
Young, Kevin ............................................ 567
Yudina, Natalia ..................................477, 659
Z Zanini, Graciela........................................... 39
Zaripova, Anar .......................................... 525
Zavarzin, Alexey........................................ 349
Zavarzina, Anna........................................ 349
Zeeman, Grietje ........................................ 553
Zeller, Fabienne ........................................ 215
Zhang, Wei........................................ 187, 401
Zhang, Xiaoshan....................................... 243
Zhang, Yi................................................... 243
Zhdanova, Alina V..................................... 613
Zubenko, Irina ........................................... 427
Zubko, Alexandr ........................................ 427
Zviagyntsev, Dmitry................................... 721
746