From Data to Signals to Screenshots: Recent Developments in NYCDOHMH ED Syndromic Surveillance. Marc...
34
From Data to Signals to Screenshots: Recent Developments in NYCDOHMH ED Syndromic Surveillance. Marc Paladini New York City Department of Health and Mental Hygiene
-
Upload
jean-preston -
Category
Documents
-
view
215 -
download
0
Transcript of From Data to Signals to Screenshots: Recent Developments in NYCDOHMH ED Syndromic Surveillance. Marc...
From Data to Signals to Screenshots: Recent Developments in NYCDOHMH
ED Syndromic Surveillance.
Marc Paladini
New York City Department of Health and Mental Hygiene
Questions
• What are we looking for?
• How are we looking for it?
• What do we need to find it?
• What do we do after we find it?
• How does this help us do our job more effectively?
Outline
• Introduction to NYC emergency department syndromic surveillance.– Analysis– Signal Investigation
• Data Visualization
• Future Directions

Analysis
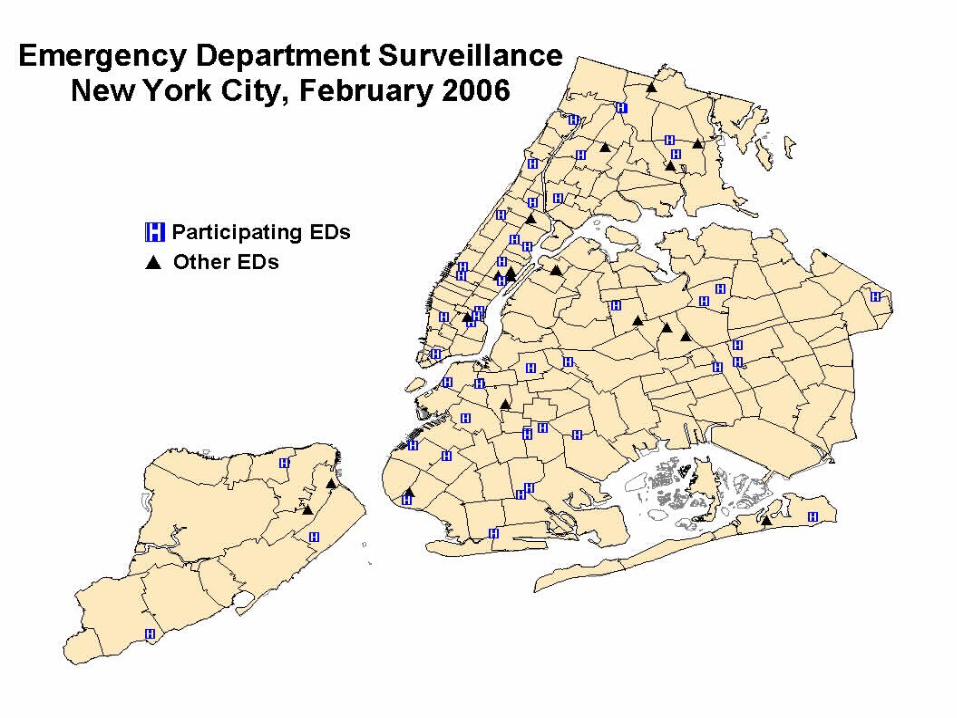
Hospital map
ED Syndromic Surveillance in NYC
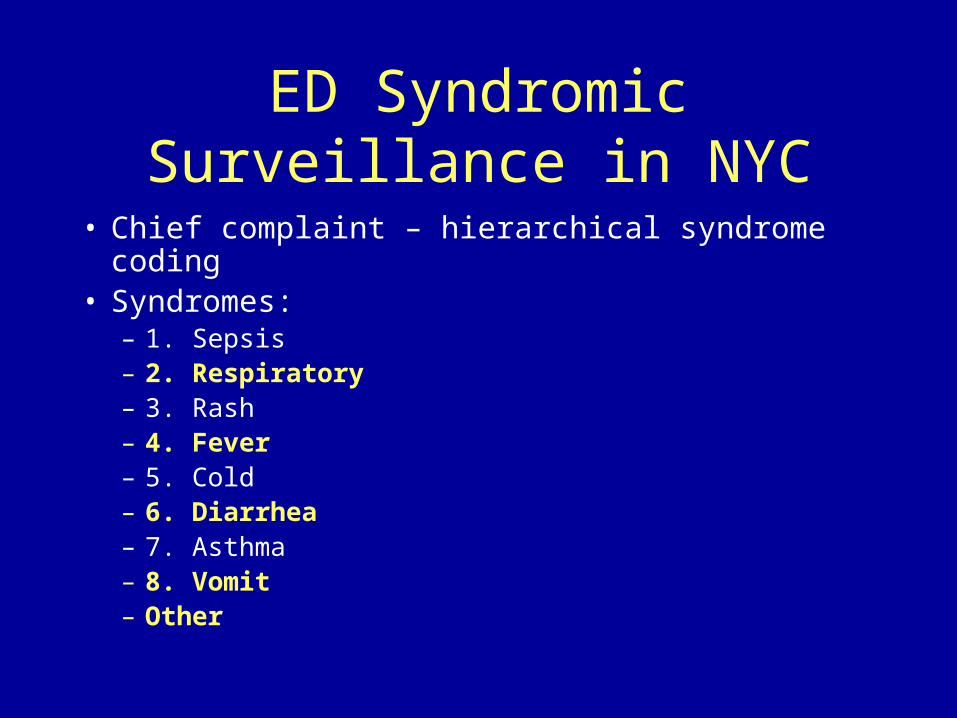
• Chief complaint – hierarchical syndrome coding• Syndromes:
– 1. Sepsis– 2. Respiratory– 3. Rash– 4. Fever– 5. Cold– 6. Diarrhea– 7. Asthma– 8. Vomit– Other
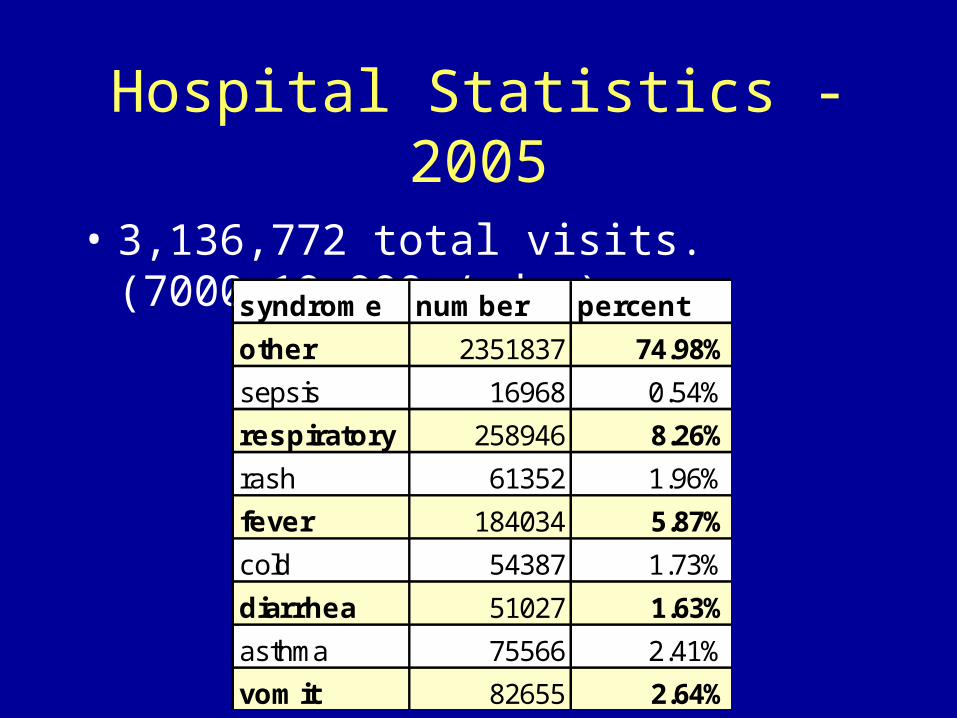
Hospital Statistics - 2005
• 3,136,772 total visits. (7000-10,000 / day)syndrome number percent
other 2351837 74.98%
sepsis 16968 0.54%
respiratory 258946 8.26%
rash 61352 1.96%
fever 184034 5.87%
cold 54387 1.73%
diarrhea 51027 1.63%
asthma 75566 2.41%
vomit 82655 2.64%
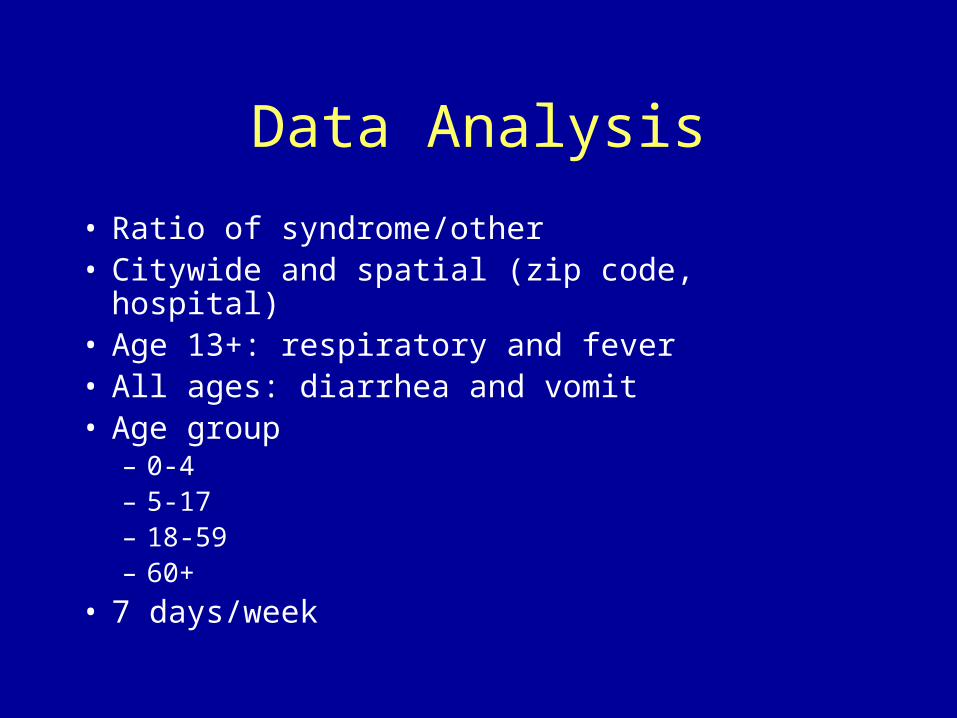
Data Analysis
• Ratio of syndrome/other• Citywide and spatial (zip code, hospital)• Age 13+: respiratory and fever• All ages: diarrhea and vomit• Age group
– 0-4– 5-17– 18-59– 60+
• 7 days/week
SIGNALS
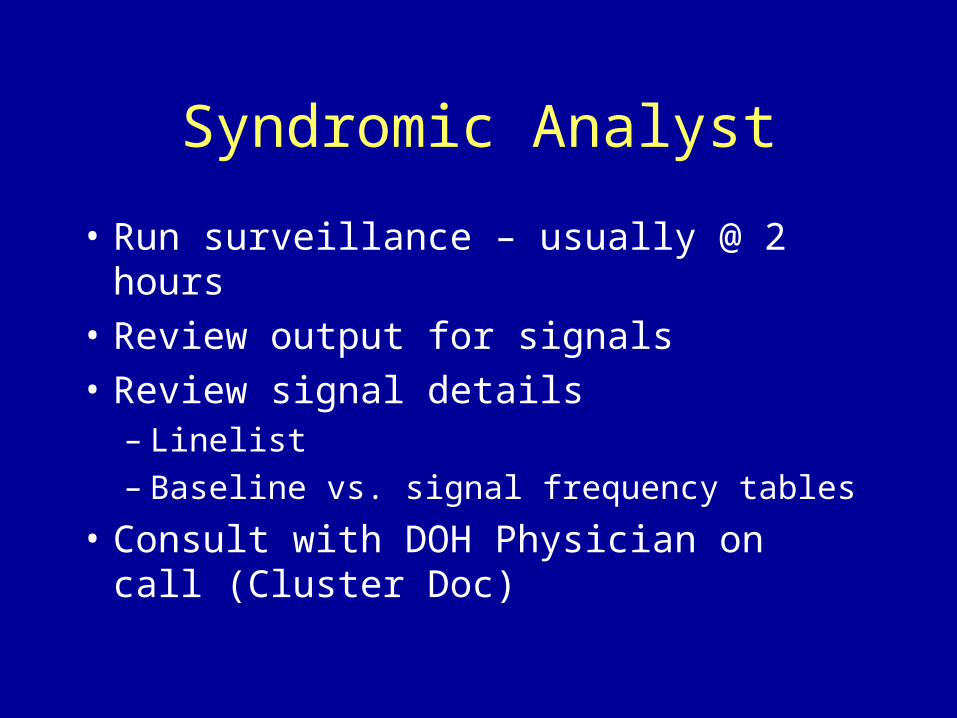
Syndromic Analyst
• Run surveillance – usually @ 2 hours
• Review output for signals
• Review signal details– Linelist– Baseline vs. signal frequency tables
• Consult with DOH Physician on call (Cluster Doc)
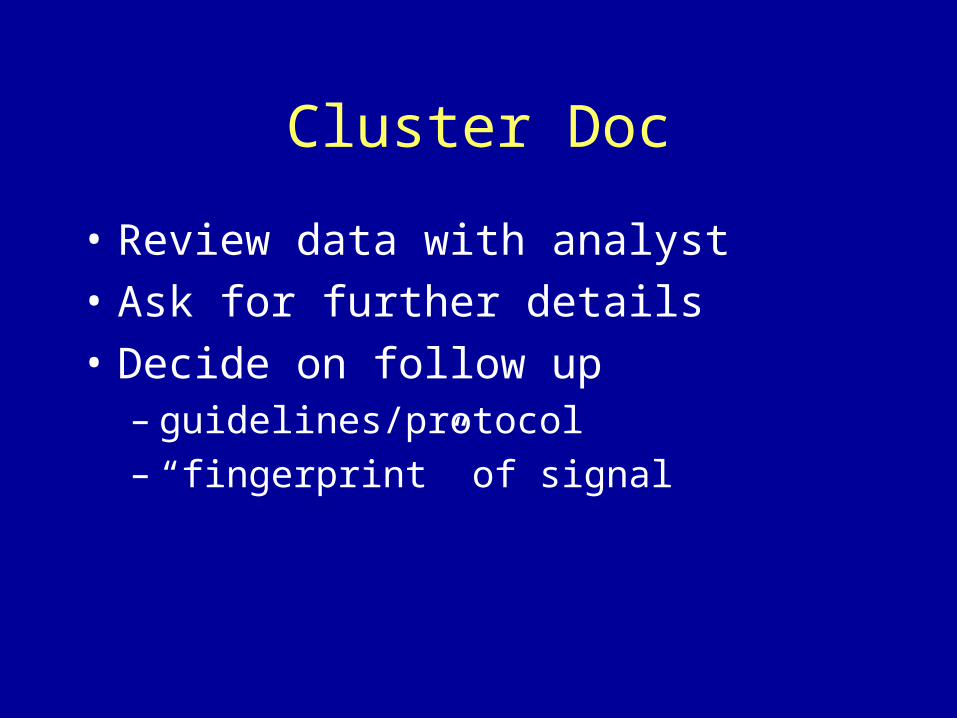
Cluster Doc
• Review data with analyst
• Ask for further details
• Decide on follow up– guidelines/protocol– “fingerprint” of signal
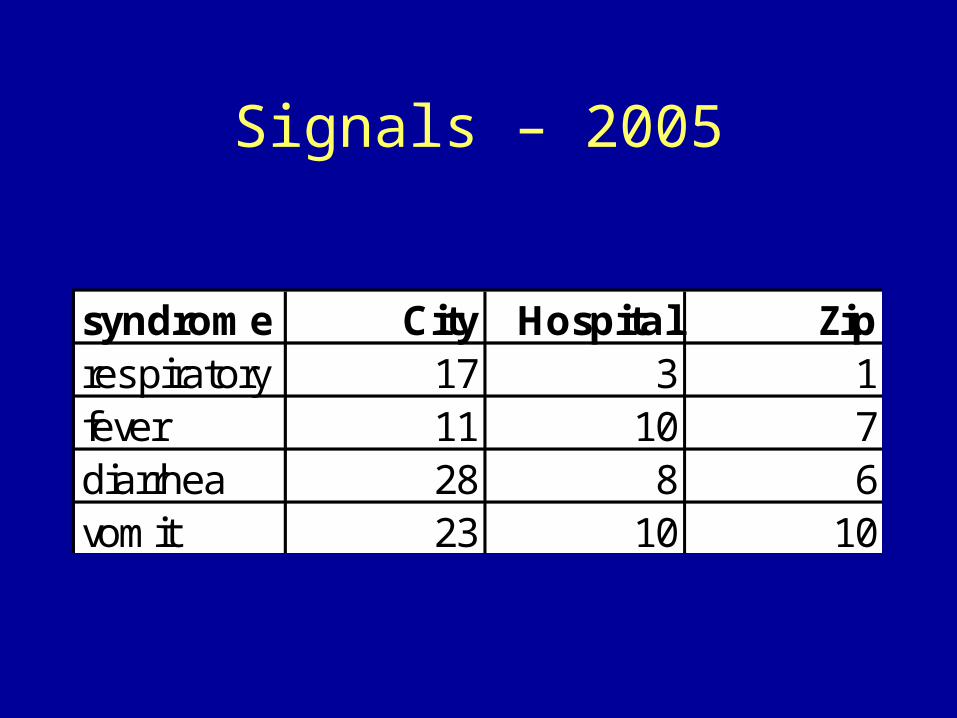
Signals – 2005
syndrome City Hospital Ziprespiratory 17 3 1fever 11 10 7diarrhea 28 8 6vomit 23 10 10
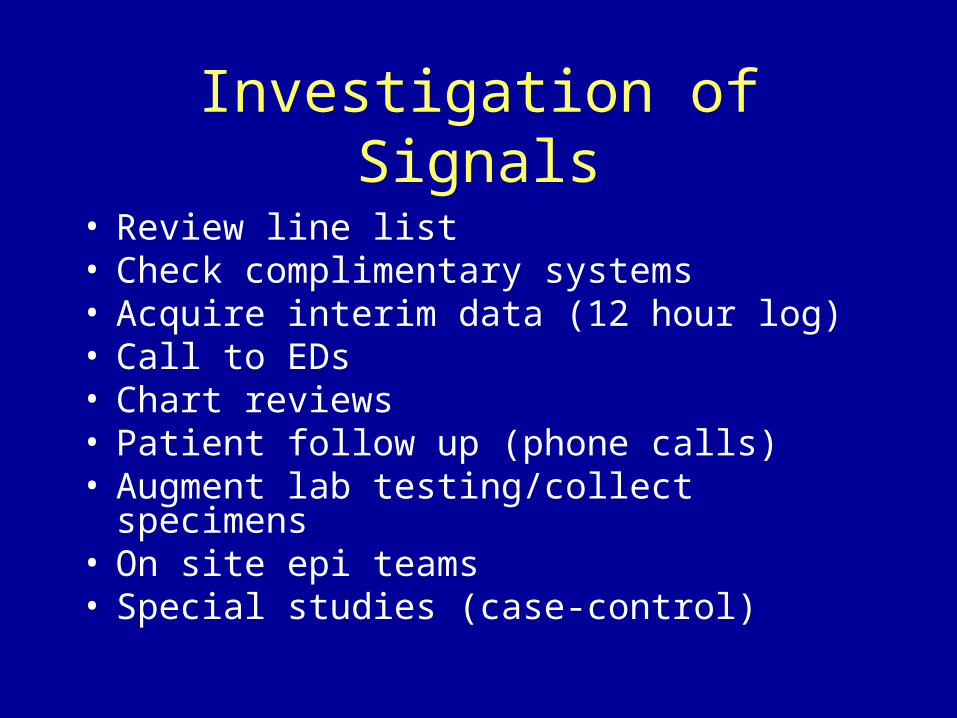
Investigation of Signals
• Review line list• Check complimentary systems• Acquire interim data (12 hour log)• Call to EDs• Chart reviews• Patient follow up (phone calls)• Augment lab testing/collect specimens• On site epi teams• Special studies (case-control)
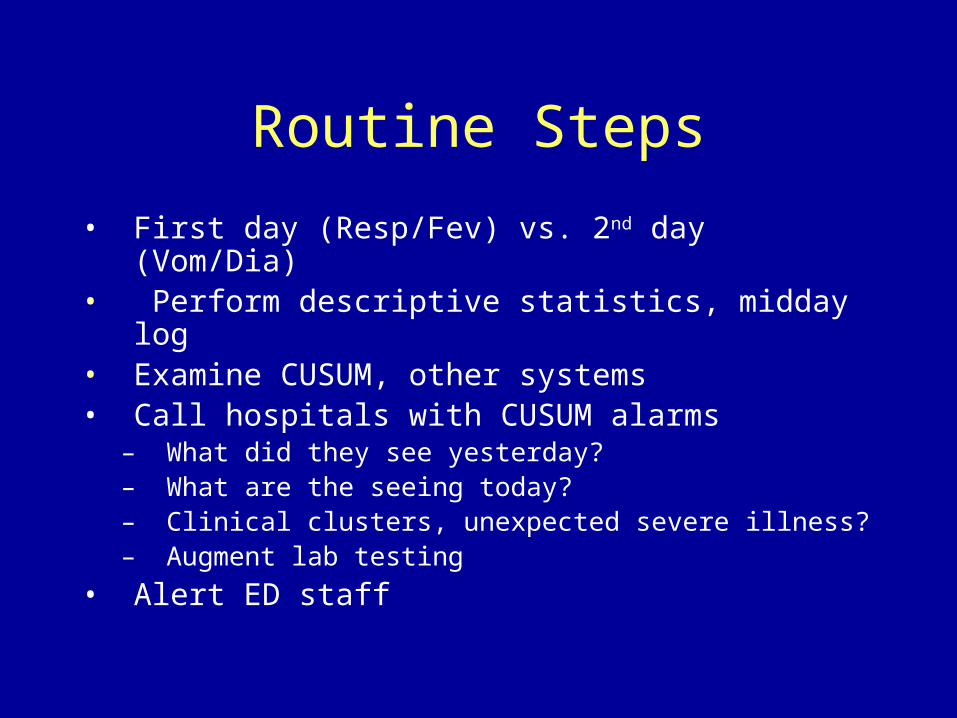
Routine Steps
• First day (Resp/Fev) vs. 2nd day (Vom/Dia)• Perform descriptive statistics, midday log• Examine CUSUM, other systems• Call hospitals with CUSUM alarms
– What did they see yesterday?– What are the seeing today?– Clinical clusters, unexpected severe illness?– Augment lab testing
• Alert ED staff
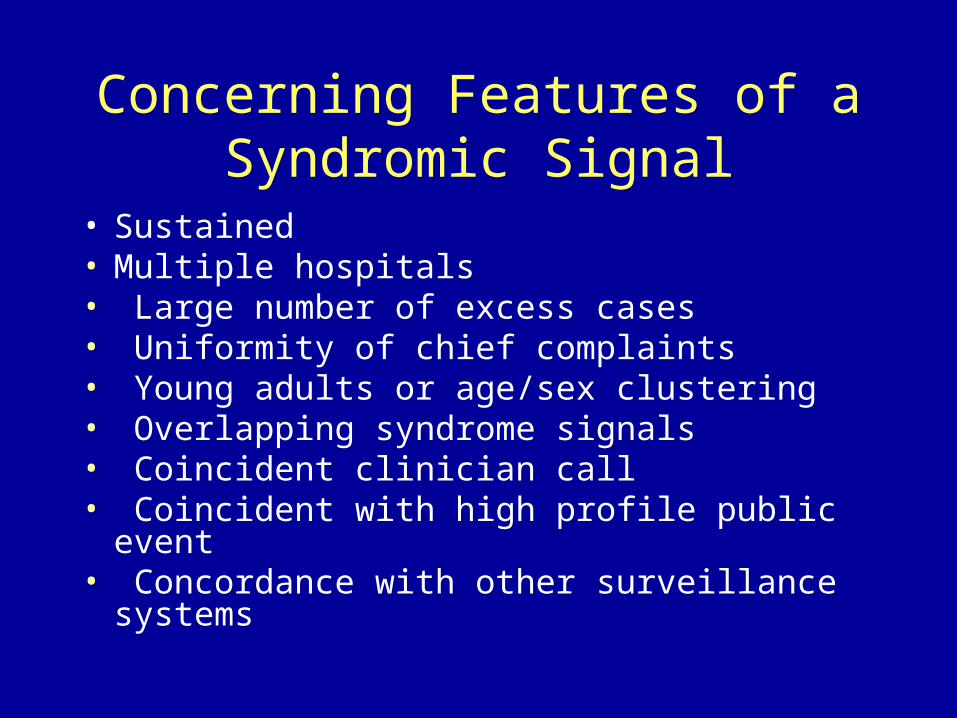
Concerning Features of a Syndromic Signal
• Sustained• Multiple hospitals • Large number of excess cases • Uniformity of chief complaints• Young adults or age/sex clustering • Overlapping syndrome signals • Coincident clinician call • Coincident with high profile public event• Concordance with other surveillance systems
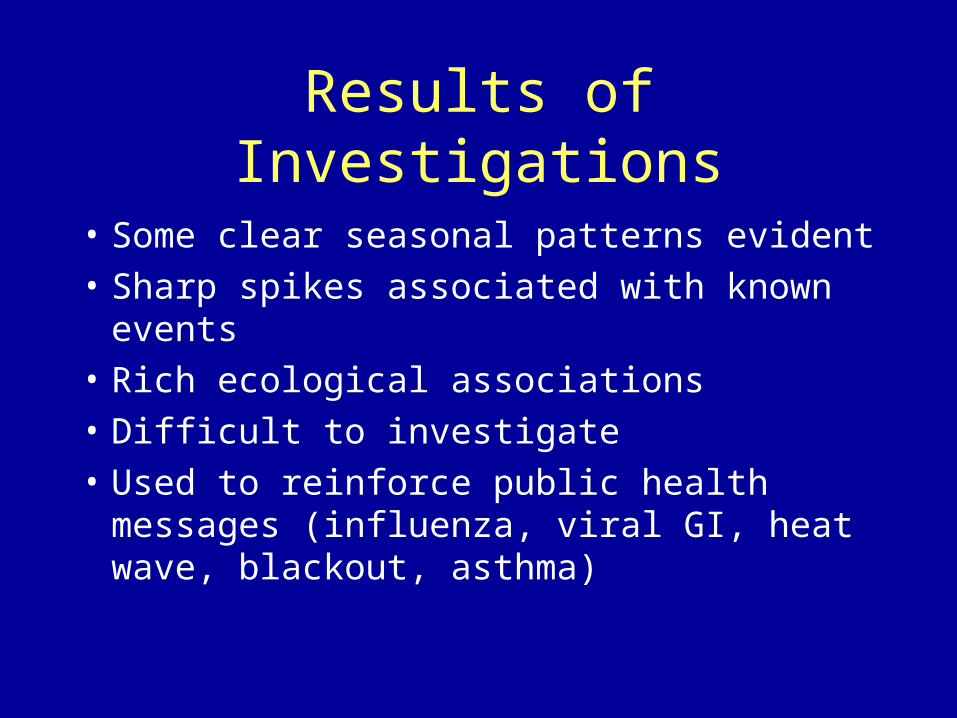
Results of Investigations
• Some clear seasonal patterns evident
• Sharp spikes associated with known events
• Rich ecological associations
• Difficult to investigate
• Used to reinforce public health messages (influenza, viral GI, heat wave, blackout, asthma)
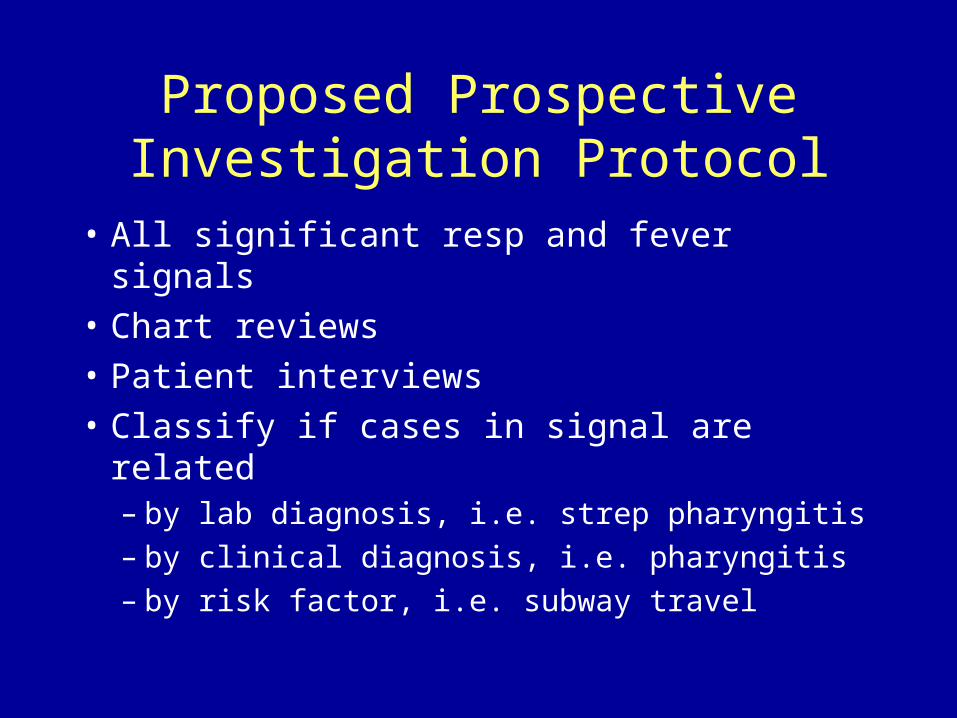
Proposed Prospective Investigation Protocol
• All significant resp and fever signals
• Chart reviews
• Patient interviews
• Classify if cases in signal are related– by lab diagnosis, i.e. strep pharyngitis– by clinical diagnosis, i.e. pharyngitis– by risk factor, i.e. subway travel
DATA VISUALIZATION
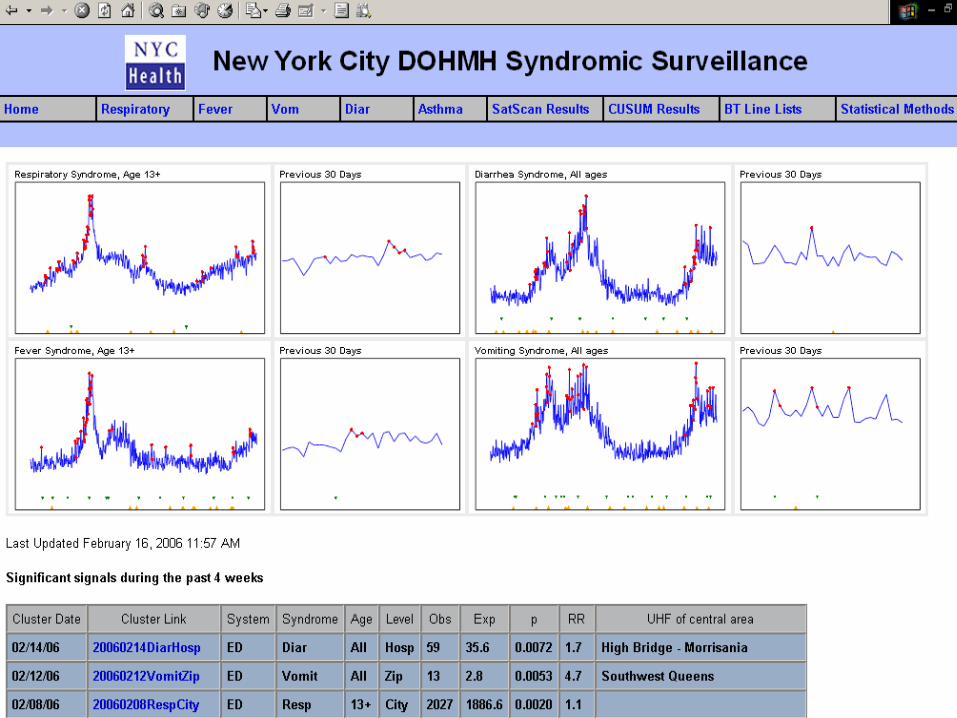
Intranet
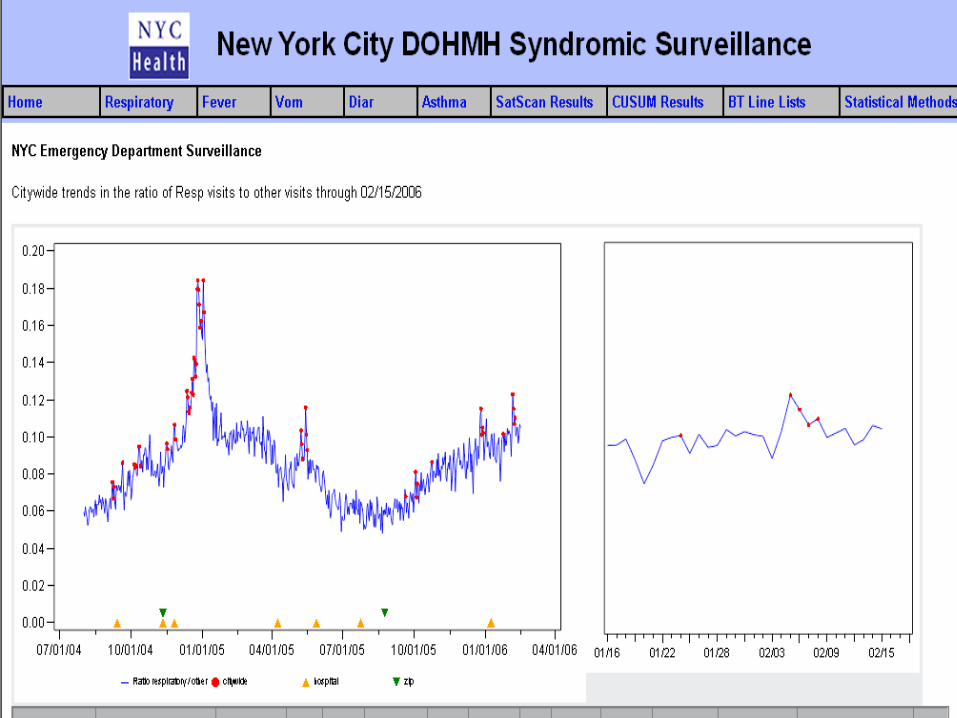
Respiratory intranet
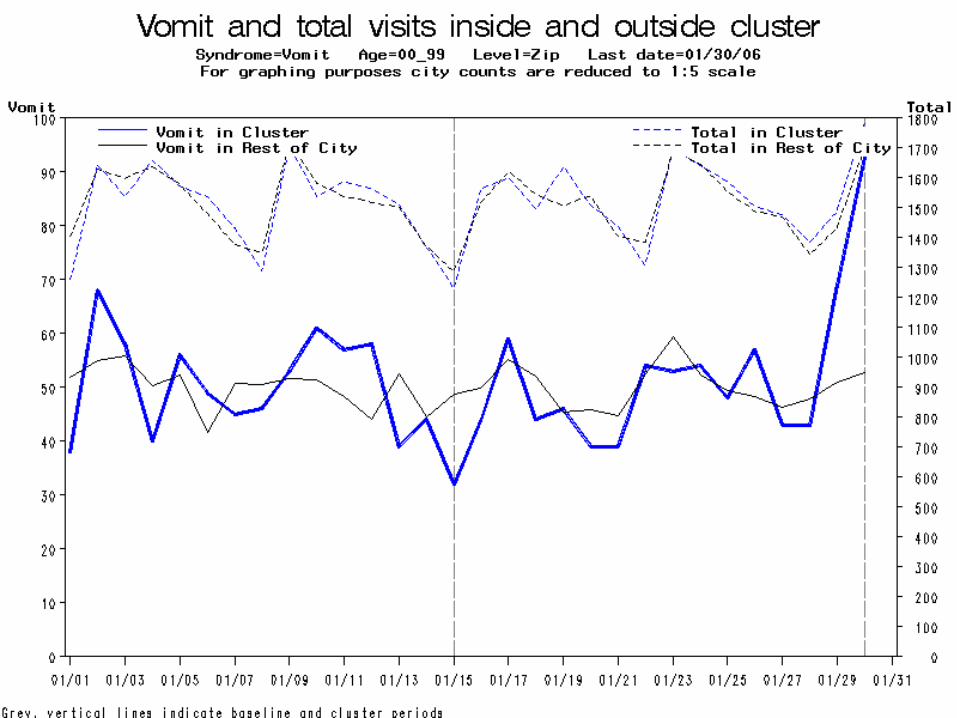
Signal details 1
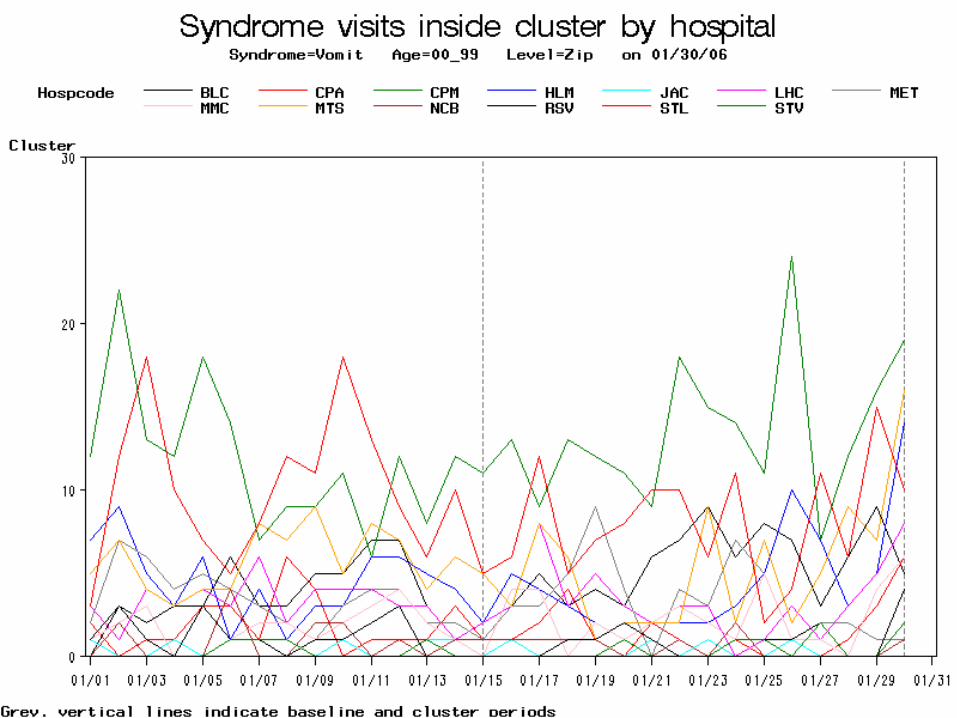
Signal details 2
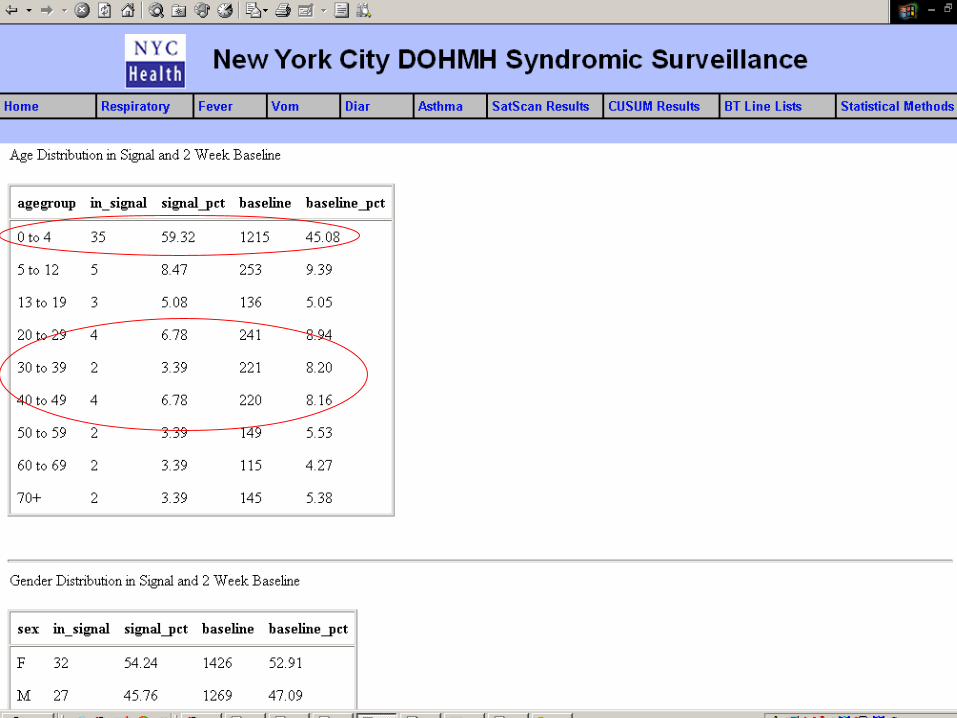
Signal details 3
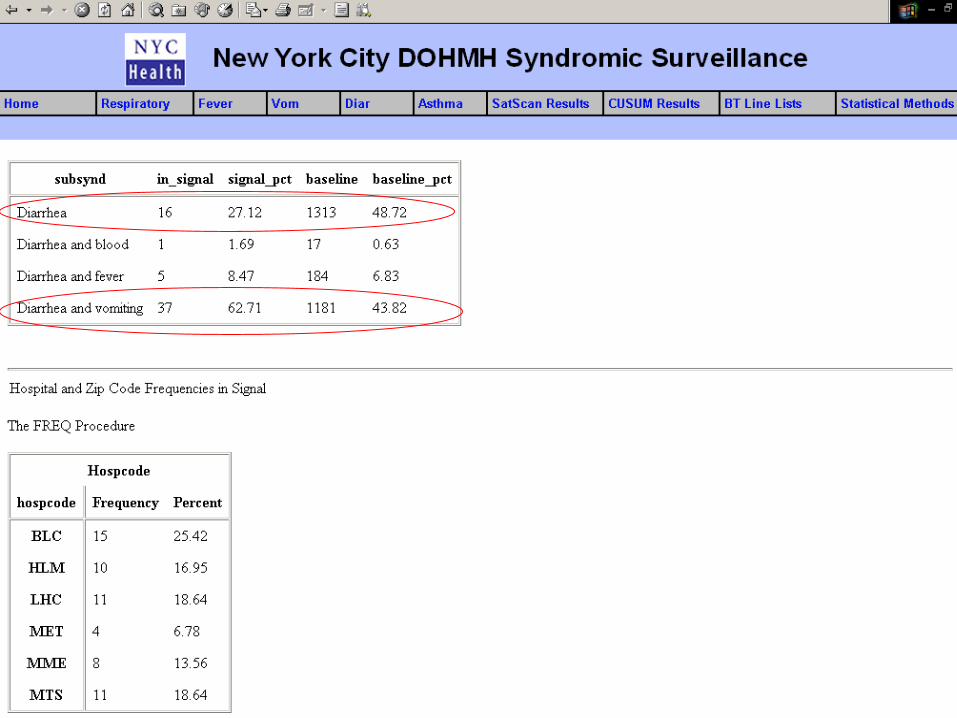
Signal details 4

FUTURE DIRECTIONS
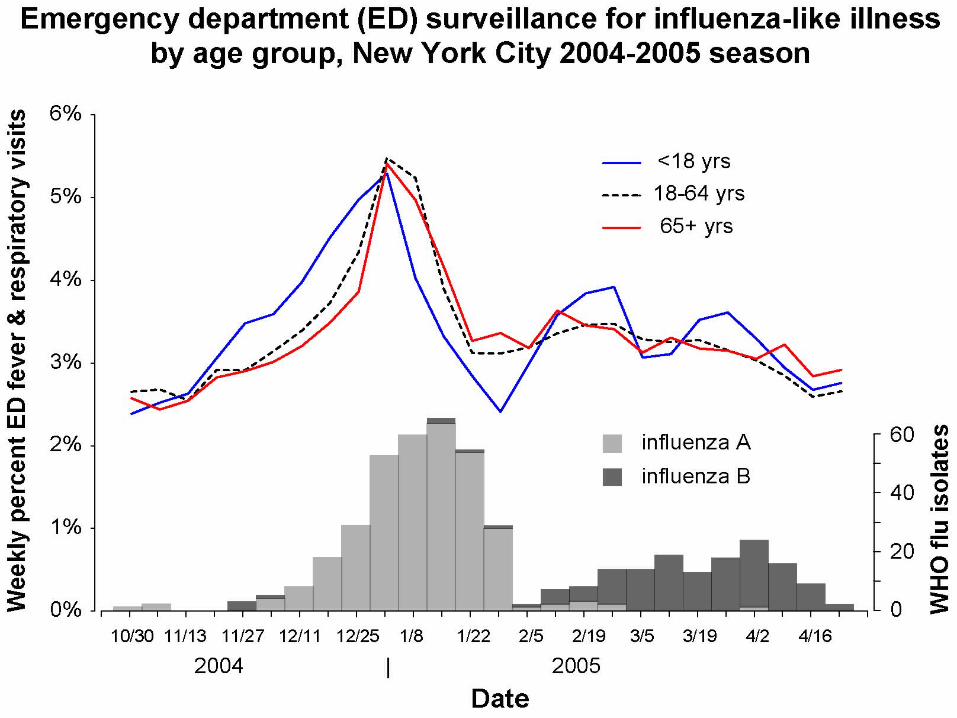
ILI age 1
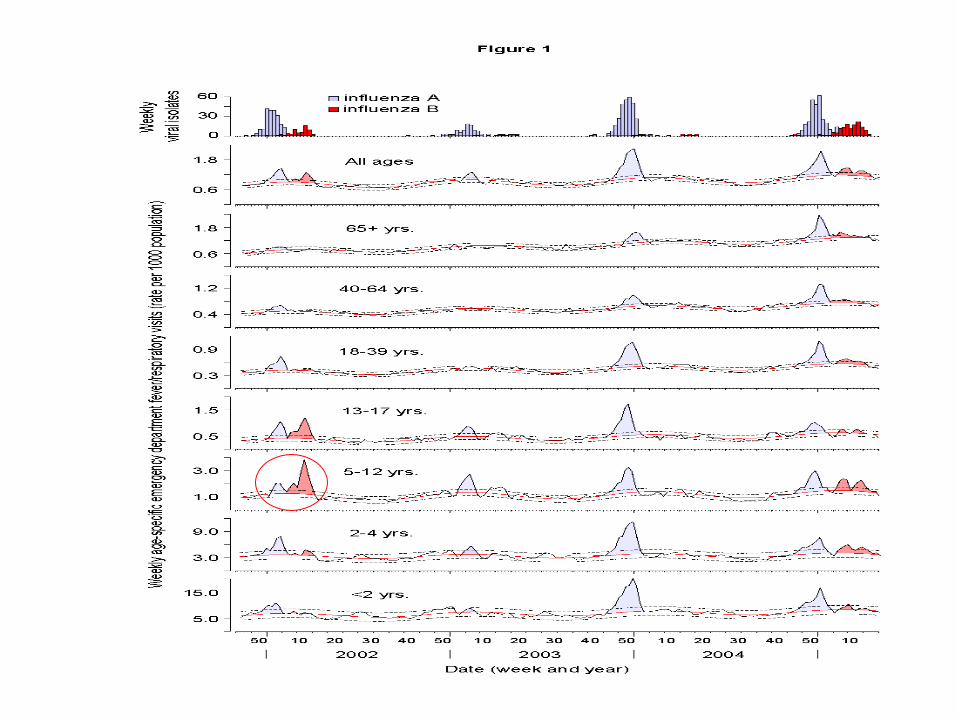
ILI age 2 - serfling
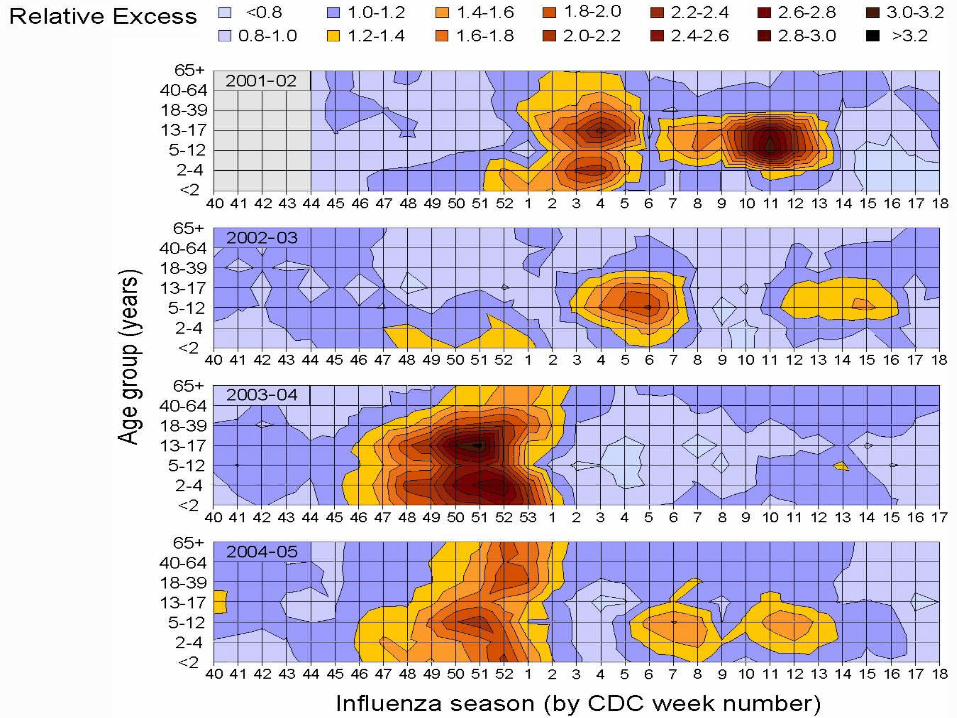
ILI age 3 - TERS
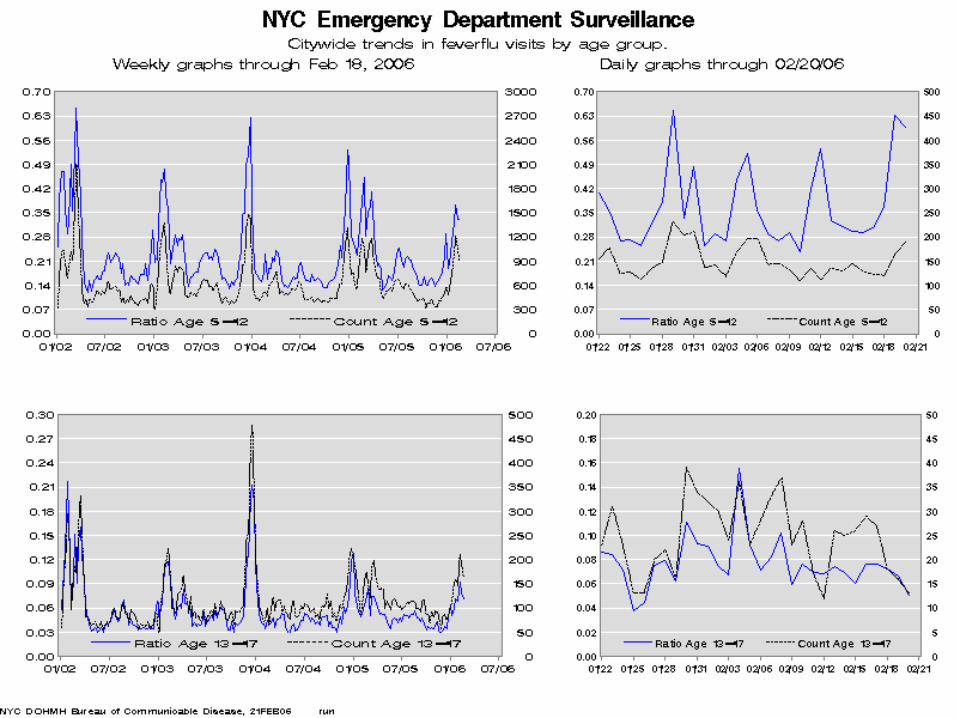
ILI age 4 - daily
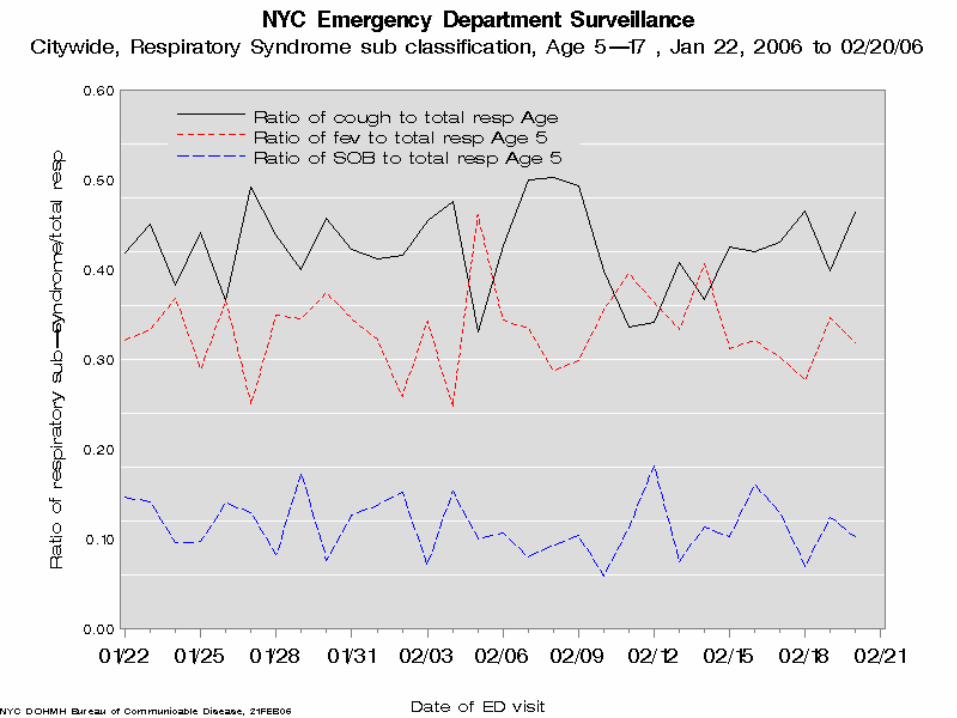
Resp CC
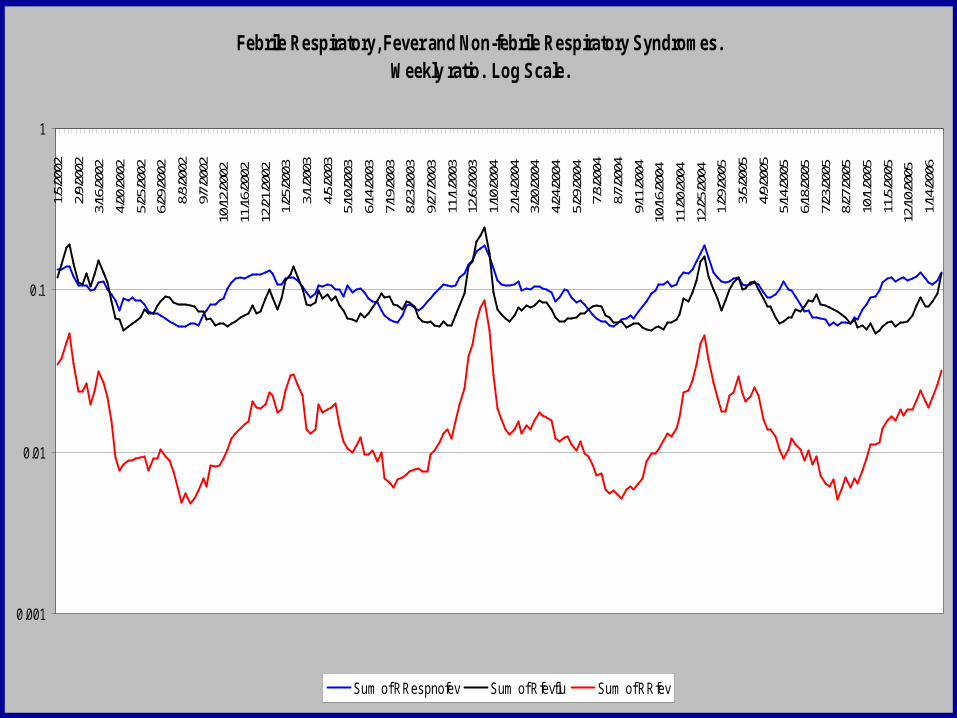
Fev/resp/resp non-feb
Febrile Respiratory, Fever and Non-febrile Respiratory Syndromes. Weekly ratio. Log Scale.
0.001
0.01
0.1
1
1/5/
2002
2/9/
2002
3/16
/200
24/
20/2
002
5/25
/200
26/
29/2
002
8/3/
2002
9/7/
2002
10/1
2/20
0211
/16/
2002
12/2
1/20
021/
25/2
003
3/1/
2003
4/5/
2003
5/10
/200
36/
14/2
003
7/19
/200
38/
23/2
003
9/27
/200
311
/1/2
003
12/6
/200
31/
10/2
004
2/14
/200
43/
20/2
004
4/24
/200
45/
29/2
004
7/3/
2004
8/7/
2004
9/11
/200
410
/16/
2004
11/2
0/20
0412
/25/
2004
1/29
/200
53/
5/20
054/
9/20
055/
14/2
005
6/18
/200
57/
23/2
005
8/27
/200
510
/1/2
005
11/5
/200
512
/10/
2005
1/14
/200
6
Sum of RRespnofev Sum of Rfevflu Sum of RRfev
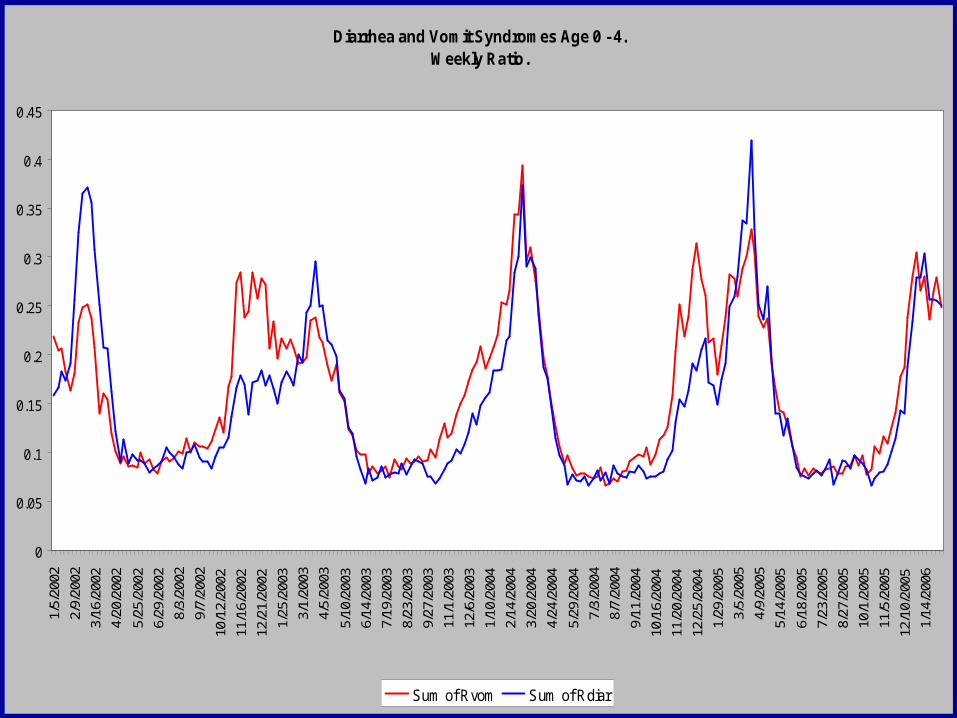
Diar/vom age 0-4
Diarrhea and Vomit Syndromes Age 0 - 4. Weekly Ratio.
0
0.05
0.1
0.15
0.2
0.25
0.3
0.35
0.4
0.45
1/5/
2002
2/9/
2002
3/16
/200
24/
20/2
002
5/25
/200
26/
29/2
002
8/3/
2002
9/7/
2002
10/1
2/20
0211
/16/
2002
12/2
1/20
021/
25/2
003
3/1/
2003
4/5/
2003
5/10
/200
36/
14/2
003
7/19
/200
38/
23/2
003
9/27
/200
311
/1/2
003
12/6
/200
31/
10/2
004
2/14
/200
43/
20/2
004
4/24
/200
4
5/29
/200
47/
3/20
048/
7/20
049/
11/2
004
10/1
6/20
0411
/20/
2004
12/2
5/20
041/
29/2
005
3/5/
2005
4/9/
2005
5/14
/200
5
6/18
/200
57/
23/2
005
8/27
/200
510
/1/2
005
11/5
/200
512
/10/
2005
1/14
/200
6
Sum of Rvom Sum of Rdiar
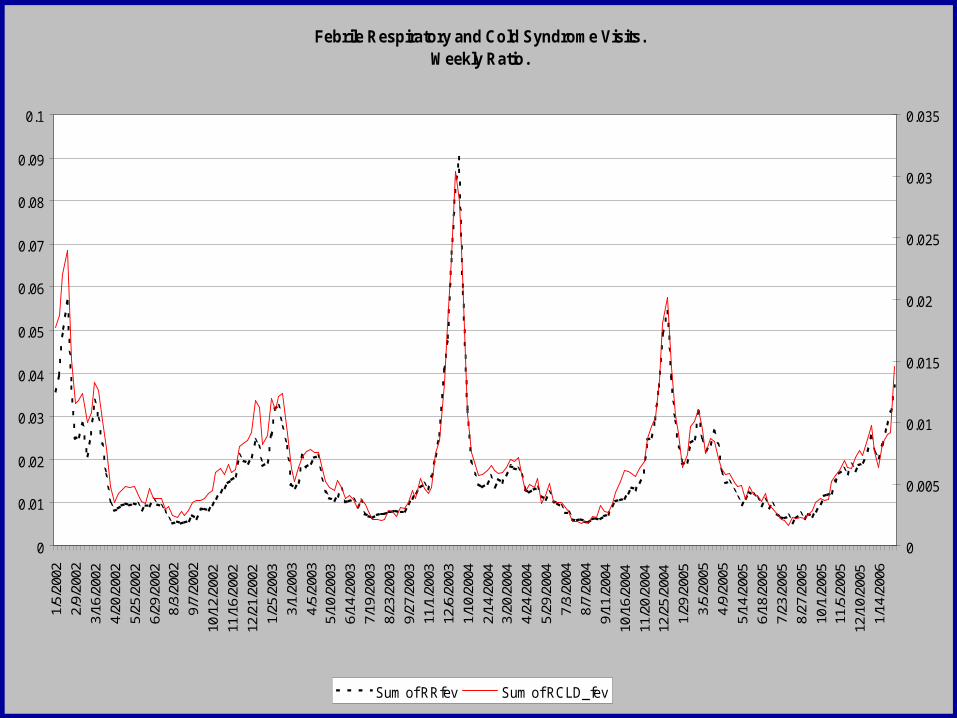
Fev resp/fev cold
Febrile Respiratory and Cold Syndrome Visits.Weekly Ratio.
0
0.01
0.02
0.03
0.04
0.05
0.06
0.07
0.08
0.09
0.1
1/5/
2002
2/9/
2002
3/16
/200
24/
20/2
002
5/25
/200
26/
29/2
002
8/3/
2002
9/7/
2002
10/1
2/20
0211
/16/
2002
12/2
1/20
021/
25/2
003
3/1/
2003
4/5/
2003
5/10
/200
36/
14/2
003
7/19
/200
38/
23/2
003
9/27
/200
311
/1/2
003
12/6
/200
31/
10/2
004
2/14
/200
43/
20/2
004
4/24
/200
45/
29/2
004
7/3/
2004
8/7/
2004
9/11
/200
410
/16/
2004
11/2
0/20
0412
/25/
2004
1/29
/200
53/
5/20
054/
9/20
055/
14/2
005
6/18
/200
57/
23/2
005
8/27
/200
510
/1/2
005
11/5
/200
512
/10/
2005
1/14
/200
6
0
0.005
0.01
0.015
0.02
0.025
0.03
0.035
Sum of RRfev Sum of RCLD_fev
Questions and Projects
• What are we looking for?• Are more fields better?
– Discharge diagnosis / ICD-9 code– Disposition– Recorded temperature
• Quantify effect of school closings• Day of Week• SaTScan mapping• Age as space