
From Big Smartphone Data to Worldwide Research:...
33
From Big Smartphone Data to Worldwide Research: The Mobile Data Challenge ✩ Juha K. Laurila a,1 , Daniel Gatica-Perez b,c , Imad Aad a,2 , Jan Blom a,3 , Olivier Bornet b , Trinh Minh Tri Do b , Olivier Dousse a,4 , Julien Eberle a,c , Markus Miettinen a,5 a Nokia Research Center, Lausanne, Switzerland b Idiap Research Institute, Martigny, Switzerland c EPFL, Lausanne, Switzerland Abstract This paper presents an overview of the Mobile Data Challenge (MDC), a large-scale research initiative aimed at generating innovations around smartphone-based research, as well as community-based evaluation of mobile data analysis methodologies. First, we review the Lausanne Data Collection Campaign (LDCC) – an initiative to collect unique, longitudinal smartphone data set for the MDC. Then, we introduce the Open and Dedicated Tracks of the MDC; describe the specific data sets used in each of them; discuss the key design and implementation aspects introduced in order to generate privacy- preserving and scientifically relevant mobile data resources for wider use by the research community; and summarize the main research trends found among the 100+ challenge submissions. We finalize by discussing the main lessons learned from the participation of several hundred researchers worldwide in the MDC Tracks. Keywords: mobile data challenge, smartphone data collection, human behavior analysis 1. Introduction Mobile phone technology has transformed the way we live, as phone adoption has increased rapidly across the globe [1]. This has widespread social implications. The phones themselves have become instruments for fast communication and collective par- ticipation. Further, different user groups are using them in creative ways. At the same ✩ Paper submitted to the Mobile Data Challenge Special Issue. Email addresses: [email protected] (Juha K. Laurila ), [email protected] (Daniel Gatica-Perez), [email protected] (Imad Aad), [email protected] (Jan Blom), [email protected] (Olivier Bornet), [email protected] (Trinh Minh Tri Do), [email protected] (Olivier Dousse ), [email protected] (Julien Eberle), [email protected] (Markus Miettinen) 1 J. K. Laurila is currently affiliated with Nokia Research Center, Helsinki, Finland. 2 I. Aad is currently affiliated with University of Bern, Switzerland. 3 J. Blom is currently affiliated with Google Zurich, Switzerland. 4 O. Dousse is currently affiliated with HERE, Berlin, Germany. 5 M. Miettinen is currently affiliated with CASED, Darmstadt, Germany. Preprint submitted to Pervasive and Mobile Computing August 15, 2013
Transcript of From Big Smartphone Data to Worldwide Research:...

From Big Smartphone Data to Worldwide Research: TheMobile Data Challenge I
Juha K. Laurilaa,1, Daniel Gatica-Perezb,c, Imad Aada,2, Jan Bloma,3, Olivier Bornetb,Trinh Minh Tri Dob, Olivier Doussea,4, Julien Eberlea,c, Markus Miettinena,5
aNokia Research Center, Lausanne, SwitzerlandbIdiap Research Institute, Martigny, Switzerland
cEPFL, Lausanne, Switzerland
Abstract
This paper presents an overview of the Mobile Data Challenge (MDC), a large-scaleresearch initiative aimed at generating innovations around smartphone-based research,as well as community-based evaluation of mobile data analysis methodologies. First,we review the Lausanne Data Collection Campaign (LDCC) – an initiative to collectunique, longitudinal smartphone data set for the MDC. Then, we introduce the Open andDedicated Tracks of the MDC; describe the specific data sets used in each of them; discussthe key design and implementation aspects introduced in order to generate privacy-preserving and scientifically relevant mobile data resources for wider use by the researchcommunity; and summarize the main research trends found among the 100+ challengesubmissions. We finalize by discussing the main lessons learned from the participationof several hundred researchers worldwide in the MDC Tracks.
Keywords:mobile data challenge, smartphone data collection, human behavior analysis
1. Introduction
Mobile phone technology has transformed the way we live, as phone adoption hasincreased rapidly across the globe [1]. This has widespread social implications. Thephones themselves have become instruments for fast communication and collective par-ticipation. Further, different user groups are using them in creative ways. At the same
IPaper submitted to the Mobile Data Challenge Special Issue.Email addresses: [email protected] (Juha K. Laurila ), [email protected] (Daniel
Gatica-Perez), [email protected] (Imad Aad), [email protected] (Jan Blom), [email protected](Olivier Bornet), [email protected] (Trinh Minh Tri Do), [email protected] (Olivier Dousse ),[email protected] (Julien Eberle), [email protected] (Markus Miettinen)
1J. K. Laurila is currently affiliated with Nokia Research Center, Helsinki, Finland.2I. Aad is currently affiliated with University of Bern, Switzerland.3J. Blom is currently affiliated with Google Zurich, Switzerland.4O. Dousse is currently affiliated with HERE, Berlin, Germany.5M. Miettinen is currently affiliated with CASED, Darmstadt, Germany.
Preprint submitted to Pervasive and Mobile Computing August 15, 2013

time, the number of sensors embedded in phones and the applications built around themhave exploded. In the past few years, smartphones started to carry sensors like GPS,accelerometer, gyroscope, microphone, camera and Bluetooth. Related applications andservices cover, for example, information search, entertainment, and healthcare.
The ubiquity of mobile phones and the increasing wealth of the data generated fromsensors and applications are giving rise to a new research domain across computing andsocial science. Researchers are beginning to examine issues in behavioral and socialscience from the Big Data perspective – by using large-scale mobile data as input tocharacterize and understand real-life phenomena, including individual traits, as well ashuman mobility, communication, and interaction patterns [2, 3, 4].
This research, whose findings are important to society at large, has been often con-ducted within corporations that historically have data sets, including telecom operators[5] or Internet companies [6], or through granted data access to academics in highly re-stricted forms [3]. Some initiatives, like [7], have collected publicly available data sets,which are to some extent limited in scope. Clearly, government and corporate regulationsfor privacy and data protection play a fundamental and necessary role in protecting allsensitive aspects of mobile data. From the research perspective, this also implies thatmobile data resources are scarce and often not ecologically valid to test scientific hy-potheses related to real-life behavior. By ecologically valid data, we mean everyday lifedata from users who actually use the sensing phone as their personal primary device.
The Mobile Data Challenge (MDC) by Nokia was motivated by our belief in the valueof mobile computing research for the common good – i.e., of research that can resultin deeper scientific understanding of human phenomena, advanced mobile experiences,and technological innovations. Guided by this principle, in January 2009 Nokia ResearchCenter Lausanne (NRC), Idiap Research Institute, and EPFL started an initiative tocreate large-scale mobile data research resources. This included the design and imple-mentation of the Lausanne Data Collection Campaign (LDCC), an effort to collect alongitudinal smartphone data set from nearly 200 volunteers in the Lake Geneva regionover 18 months. It also involved the definition of a number of research tasks with clearlyspecified experimental protocols. From the very beginning, the intention was to sharethese resources with the research community. This required the integration of holisticand proactive approaches on privacy according to the privacy-by-design principles [8, 9].
The MDC was the visible outcome of nearly three years of work in this direction. TheChallenge provided researchers with an opportunity to analyze a relatively unexploreddata set including rich mobility, communication, and interaction information. The MDCcomprised of two alternatives through an Open Research Track and a Dedicated ResearchTrack. In the Open Track, researchers were given the opportunity to approach the dataset from an exploratory perspective, by proposing their own tasks according to theirinterests and background. The Dedicated Track gave researchers the possibility to takeon up to three tasks to solve, related to prediction of mobility patterns, recognition ofplace categories, and estimation of demographic attributes. Each of these tasks hadproperly defined experimental protocols and standard evaluation measures to assess andrank all contributions.
This paper presents a description and analysis of the Mobile Data Challenge 2012.The paper is an extended version of the MDC overview paper originally presented in[10, 11]. In this paper, we expand our analysis of the submissions and the correspondingresults, and reflect on the MDC process and its outcomes. The paper is organized as
2
follows. Section 3 summarizes the LDCC data. Section 4 introduces the MDC tracksand tasks. Section 5 provides details on the specific data sets used for the MDC. Sec-tion 6 summarizes the MDC process schedule. With the goal of presenting a globalunderstanding of the participation of the research community in the Challenge, Section7 presents a brief analysis of the MDC contributed papers. On one hand, we summarizethe main research questions tackled by the papers contributed to the Open Track; onthe other one, we present a comparative analysis of the objective performance obtainedby the contributions in the Dedicated Track. A selection of these papers, in significantlyextended versions, conforms the current Special Issue. In Section 8, we reflect upon theMDC process and discussed the main lessons we learned along the way. We hope thatthese experiences can inform the design and implementation of future initiatives. Finally,Section 9 contains some final remarks.
2. Related work
This section presents an overview of mobile phone datasets used in previous studies.We divide them in two categories: mobile network operator (MNO) data and smartphonesensing data.
Call Detail Records (CDRs) are the main source of MNO data, and are collected forbilling and network traffic monitoring. In today’s mobile networks, each CDR may cor-respond to a voice call, video call, SMS, or other operator data services. Besides basicstatistics of a call event (e.g., caller ID, callee ID, time, duration), the ID of the celltower that the phone connects to is also available. As cell tower locations are knownby MNOs, their IDs indirectly provide the location traces of users with a coarse resolu-tion. MNO data are then useful for analyzing not only communication patterns but alsohuman mobility. As an example, Gonzalez et al. analyzed individual human mobilitypatterns from a proprietary dataset provided by a European MNO having roughly 6million customers [3]. The analysis was done on a subset of 100,000 anonymous usersover 6 months, showing that several fundamental properties of individual human mobilitycan be captured. A similar dataset, collected from hundreds of thousands of people inthe US, was used by AT&T researchers to characterize human mobility patterns with aparticular focus on practical applications, such as estimating carbon emissions [12]. Inboth datasets, privacy was carefully handled by anonymization and also by limiting thestudies to report aggregate results only.
Researchers worldwide had the opportunity to analyze MNO data via the Data forDevelopment (D4D) challenge, which was launched in late 2012 by Orange [13]. To getaccess to the dataset generated by about 5 million users over 5 months in Ivory Coast,each research team had to submit a short description of their openly defined researchproject, which was then reviewed by the organizers. Instead of giving raw CDR data,Orange provided four types of preprocessed data: location traces of 50,000 users withnative resolution (cell IDs), location traces of 500,000 users with coarse resolution (cellIDs were replaced by sub-prefecture IDs), hourly antenna-to-antenna communicationtraffic, and ego communication subgraphs of 5,000 randomly chosen users. The selectedand winning projects were presented in May 2013.
Targeting the machine learning and data mining communities, the KDD cup 2009 wasanother example of MNO data [14]. Based on a large marketing database of customers,the goal was to predict the propensity of customer to switch provider, buy new product
3

or services, or buy upgrades or add-ons proposed to them. The dataset consisted ofprecomputed attributes of customers, provided as a 100,000 × 15,000 customer-attributematrix, and the target values for the training set. In the dedicated tasks of MDC, wealso predefined specific prediction problems, but participants were free to exploit the rawsensor data for their prediction methods.
Regarding smartphone data, the large number of sensors and the possibility to run cus-tomized recording software have made smartphones a great option to collect data in anunprecedented quantity and granularity. Smartphone sensing has shown to be effectiveacross multiple scales: individuals [15], groups of people with shared interests (e.g., theGarbage Watch project [16]), and also at community/country scale (e.g., ParticipatoryUrbanism [17]). While energy remains the bottleneck for mobile devices, energy-efficientsensing techniques have opened the possibility of continuous sensing in daily life [18, 19].Smartphone data is currently being collected and analyzed by academic researchers,small companies, and large corporations. For example, the CitySense consumer appli-cation (developed by SenseNetworks) shows human hotspots in a city in real-time bycombining online data with billions of GPS points generated over a few years [20]. Mo-bile Millennium is a traffic-monitoring system that accumulates traffic information frommobile users and then broadcasts highway and arterial information in real-time [21]. Thismobile application was downloaded by more than 5000 users during one year. In anothersystem to estimate travel time, Thiagarajan et al. [22] collected a dataset of GPS andWiFi location samples from nearly 800 hours of actual commuter drives, gathered withiPhones and embedded in-car computers.
While smartphone sensing is very appealing, the available data open to the researchcommunity is very limited. The Reality Mining project pioneered this direction by re-leasing a dataset recorded with Nokia 6600 smartphones by 100 students over 9 monthsat MIT [23]. The data included call logs, Bluetooth devices in proximity, cell tower IDsand application usage. Inspired by the open-access idea of Reality Mining, the LDCCwas launched in Switzerland in 2009 and benefited from the lessons learned about thedesign of Reality Mining. Compared to Reality Mining, the population of LDCC is morediverse, with a mixture of students and professionals; the LDCC was also twice as long(18 months). Notably, the LDCC also included additional data types that are highlyrelevant such as GPS, WLAN, and accelerometer. Additionally, the LDCC data wascollected in Europe, and therefore it reflects the lifestyle of a European population.
Finally, in another effort to create large mobile data for research on activity recogni-tion, the HASC project created a shared corpus. The organizers provided the recordingsoftware and ask participants (mainly researchers who want to use the data) to contributetheir own data to the corpus [24]. In 2012, they reported to have data from 24 teams, 136subjects, and 4 data types: accelerometer, gyroscope, GPS, and magnetic field sensor.Note that this corpus consists of monitored (and labeled) records only, as opposed toLDCC in which data samples were recorded automatically in the phone’s background.
3. The Lausanne Data Collection Campaign (LDCC)
The LDCC aimed at designing and implementing a large-scale campaign to collectsmartphone data in everyday life conditions, grounding the study on a European cul-ture. The overall goal was to collect quasi-continuous measurements covering all sensoryand other available information on a smartphone. In this way, we were able to capture
4
phone users’ daily activities unobtrusively, in a setting that implemented the privacy-by-design principles [8, 9]. The collected data included a significant amount of behavioralinformation, including both individual and relational aspects. The intention was to en-able the investigation of a large number of research questions related to personal andsocial context, including mobility, phone usage, communication, and interaction. Allcontent, like image files and text messages, was excluded from recording as it was consid-ered too sensitive. Instead, log-files with metadata were collected both for imaging andmessaging applications. This section provides a summary on the LDCC implementationand captured data types. An initial paper introducing LDCC and its data types andstatistics appeared in [25]. Part of the material in this section has been adapted from it.
3.1. LDCC design
Nokia Research Center, Idiap, and EPFL partnered towards the LDCC since January2009. After the implementation and evaluation of the sensing architecture, and the re-cruitment of the initial pool of volunteers, the data collection started in October 2009.Over time, smartphones with data collection software were allocated to close to 200 vol-unteers in the Lake Geneva region. A viral approach was used to promote the campaignand recruit volunteers. This resulted in a population with social connections to otherparticipants, as well as greater variation in terms of demographic attributes compared toprevious initiatives [23]. This was a consequence of the fact that the participants wereguided to recruit further campaign members representing different social connections(like family member, colleague, neighbour, hobby mate, etc.) A key aspect of the successof the LDCC was the enthusiastic participation of volunteers who agreed to take partin the campaign and share their data mainly driven by selfless interest. The campaignconcluded in March 2011.
Data was collected using Nokia N95 phones and a client-server architecture that madethe collection process invisible to the participants. A seamless implementation of thedata recording process was key to make a longitudinal study feasible in practice – manyparticipants remained in the study for over a year. Another important target for the clientsoftware design was to reach an appropriate trade-off between quality of the collecteddata and phone energy consumption.
The collected data was first stored in the device and then uploaded automatically toa Simple Context server via WLAN. The server received the data, and built a databasethat could be accessed by the campaign participants. The Nokia Simple Context backendhad been developed earlier by the Nokia Research Center in Palo Alto. Additionally, adata visualization tool was developed to offer a “life diary” type of view for the campaignparticipants on their data. Simultaneously, an anonymized database was populated, fromwhich researchers were able to access the data for their purposes. Fig. 1 presents a blockdiagram of the data collection architecture.
3.2. Data characteristics
The LDCC initiative produced a unique data set in terms of scale, temporal dimension,and variety of data types. The campaign population reached 185 participants. Basicdemographics showed a bias towards male participation (62% male, 38% female), andconcentration on young individuals (the age range 22-33 year-old accounts for roughly twothirds of the population.) Clearly, the LDCC population is not a fair random sample of
5

Figure 1: LDCC data flow, progressing from mobile data from volunteers to anonymized data for research[25]).
the general population in French-speaking Switzerland. That said, the LDCC populationis diverse in terms of demographic attributes when compared to previous initiatives [23],where essentially all volunteers were related to a university community. In LDCC, thereis a proportion of users who do not have connections to the local universities, and whohave other professions and age ranges. This diversity gave the possibility of designingand implementing a task about predicting demographic attributes as part of MDC.
A bird-eye’s view on the LDCC in terms of data types is shown in Table 1. As can beseen, data types related to location (GPS, WLAN), motion (accelerometer), proximity(Bluetooth), communication (phone call and SMS logs), multimedia (camera, mediaplayer), application usage (user-downloaded applications in addition to system ones),and audio environment (optional) were recorded. The numbers themselves reflect acombination of experimental design choices (e.g., every user had the same phone) andspecific lifestyle choices (e.g., many participants use public transportation).
Due to space limitations, it is not possible to visualize multiple data types here. Acompelling example, however, is presented in Fig. 2, which plots the raw location data ofthe LDCC on the map of Switzerland for the volunteer population after 1 week, and thenafter 1, 3, 6, 12, and 18 campaign months. When considered in detail, the geographicalcoverage of the LDCC allows a reasonable tracing of the main routes on the map ofSuisse Romande – the French-speaking, western part of Switzerland – and partially alsoof other regions of the country.
In addition to contributing phone data, LDCC participants also agreed to fill a smallnumber of surveys during the data recording process. Two types of survey data wereimportant for the later development of the MDC: (1) a set of manual semantic labelsfor frequently and infrequently visited places for each user, and (2) basic demographicattributes. The relevant places for each user were first detected automatically with amethod discussed in [26]. After that, the campaign participants specified place categoriesfrom a fixed list of tags (home, work, leisure places, etc.). With respect to demographics,participants self-reported their attributes like gender, age group, marital status, job type,etc.
6

Data type Quantity
Calls (in/out/missed) 240,227SMS (in/out/failed/pending) 175,832Photos 37,151Videos 2,940Application events 8,096,870Calendar entries 13,792Phone book entries 45,928Location points 26,152,673Unique cell towers 99,166Accelerometer samples 1,273,333Bluetooth observations 38,259,550Unique Bluetooth devices 498,593WLAN observations 31,013,270Unique WLAN access points 560,441Audio samples 595,895
Table 1: LDCC main data types and amount of data.
Figure 2: LDCC location data (in black) plotted at the country level (outlined in green) after 1 week, 1month, 3 months, 6 months, 12 months, and 18 months of campaign. The data for each specific day isplotted in red.
7

3.3. Privacy
Privacy played an essential role in the design and implementation of the LDCC, giventhe nature and scale of the data shared by the participants. In order to satisfy the ethicaland legal requirements to collect data while protecting the privacy of the participants,the LDCC team implemented an approach based on multiple mechanisms complementingeach other. The approach can be summarized as follows (more details can be found in[25]):1. Communication with volunteers about privacy. Following Nokia’s general privacy
policy, we obtained written consent from each individual participating in the LDCC. Weexplicitly stated that data would be collected for research purposes. All participantswere informed about their data rights, including the right to access their own collecteddata and to decide what to do with it (e.g. to delete data entries if they opted to do so).The participants had also the opportunity to opt-out at any moment.2. Data security. The data was recorded and stored using the best industry practices
in this domain.3. Data anonymization. By design, the LDCC did not store any content information
(e.g. photo files or text messages). The major portion of the collected data consisted ofevent logs, and when sensitive data beyond logs was collected, it was anonymized usingstate-of-the-art techniques and/or aggregated for research purposes [9]. Examples includethe use of pseudonyms instead of identifiable data, and the reduction of location accuracyaround potentially sensitive locations. Apart from the core team directly involved withthe data collection/anonymization procedures, any other researchers were only grantedaccess to the anonymized data.4. Commitment of researchers to respect privacy. Privacy protection of the LDCC
data purely by automatic anonymization techniques is not possible so that the datavalue for research is simultaneously maintained. On one hand, technological approachesfor privacy are not 100% effective for all data types, as mobile privacy research hasoften shown. On the other hand, the degree of degradation of some data types (e.g.location accuracy) can make the data very limited in practice to investigate certainresearch hypotheses. Several measures were thus needed in order to maximize the valuefor research of the data. Regarding privacy, in addition to technical means, agreement-based countermeasures were necessary. A first set of trusted researchers was able towork with the LDCC data after agreeing in written form to respect the anonymity andprivacy of the volunteering LDCC participants. This practically limited the access tothe LDCC data to a small number of authorized partners. After this initial data sharingexperience, the next step was to outreach the mobile computing community at large,which motivated the creation of the MDC, discussed in detail in the next sections.
4. Overview of MDC tracks
The MDC proposed two alternatives through an Open Research Track and a DedicatedResearch Track. In the Open Track, researchers were given the opportunity to approachthe data set from an exploratory perspective, by proposing their own tasks according totheir interests and background. The Dedicated Track gave researchers the possibility totake on up to three tasks to solve, related with prediction of mobility patterns, recognitionof place categories, and estimation of demographic attributes.
8

MDC’s original intention was to be inclusive at a global scale. Other previous successfulevaluation initiatives in computing, like those organized by NIST in several areas [27, 28]or the Netflix challenge [29, 30] focused on either one or at most a small number of taskswith objective evaluation protocols. This was also a guiding principle for the MDC. Onthe other hand, the nature of mobile data is highly exploratory, so there was a clearbenefit in encouraging and welcoming novel ideas.
Learning from these past experiences, we decided that MDC would feature both openand pre-defined options to participate. With this idea in mind we created two tracks.The Open Track was designed to receive ideas directly proposed by the community. Onthe other hand, a set of challenges was given in the Dedicated Track, which definedthree classification/prediction tasks. These tasks covered different aspects related tothe characterization of mobile users and places. The Tracks targeted researchers withdifferent profiles.
4.1. The Open Track
This Track allowed participants to propose their own Challenge task based on theirinterests and background. Examples proposed to the participants included the discoveryof behavioral patterns through statistical techniques, the development of efficient mobiledata management methods, or the design of ways to visualize mobile Big Data.
4.2. The Dedicated Track
This Track gave the possibility of taking up to three concrete tasks, with properlydefined training and test sets, and evaluation measures used to assess and rank all thecontributions. The participants of the Dedicated Track were allowed to define their ownfeatures and algorithms. The three tasks of this Track followed a two-stage schedule. Inthe first stage, the training set (including raw data, labels, and performance measures)was made available to the participants, who were expected to design their features andtrain their models using this data set. In the second stage, the test set was made available,except for the labels which were kept hidden. Participants were allowed to submit upto five runs of results, and the evaluation of all methods was conducted by the MDCorganizers.
4.2.1. Task 1: Semantic Place Prediction
Inferring the meaning of the most significant places that a user visits is an importantproblem in mobile computing [5]. This has been an issue that, under slightly differentformulation, has been studied by a significant amount of literature. The semantic labelsattributed to places have typically included basic categories common to a population(home, work, restaurant) but could also be personalized (e.g. differentiating the mainand second homes of a user). The goal of the task was to predict the semantic meaningof these places for a number of users of the MDC data. Each place was represented by ahistory of visits over a period of time, for which other contextual information sensed bythe user’s smartphone was available. On one hand, participants had to extract relevantfeatures for predicting these semantic labels. On the other hand, specific methods for thistask had to be developed, given the particular type of input information (sequences ofvisits as opposed to geographic location). Importantly, it was decided that geo-locationwould not be provided as a feature for this task for privacy reasons, as some of the place
9

categories are privacy-sensitive (like home and work.) Several other types of phone datawere provided as features (see next Section). Semantic place labels (manually providedby the LDCC users through surveys) were given as part of the MDC training set.
4.2.2. Task 2: Next Place Prediction
Predicting the location of phone users has relevance for context-aware and mobilerecommendation systems [31]. This topic has been increasingly addressed in the literatureunder different definitions of the prediction task, including predicting the next locationgiven the current one; predicting a set of locations likely to be visited in a future timeinterval; and predicting the duration of future visits. The goal of the MDC task was topredict the next destination of a user given the current context, by building user-specificmodels that learn from user mobility history, and then applying these models to thecurrent context to predict where the users go next. In the training phase, the mobilityhistory of each user was represented by a sequence of visits to specific places, and severaltypes of phone data associated with these visits were made available. Furthermore, inthe testing phase, previously unseen data from the same set of users was provided, withthe goal of predicting the next place for each user given their current place and a shorthistory of places.
4.2.3. Task 3: Demographic Attribute Prediction
The knowledge of basic demographic attributes is an important aspect in user mod-eling that can find diverse applications, ranging from churn prediction in the context ofmobile operator preferences to informing social science studies, where phone data couldcomplement traditional survey-based methods [32]. The goal of the task proposed inMDC was to infer basic demographic groups of users based on behavioral informationcollected from the phones. As discussed earlier, some of the voluntarily-provided de-mographic information in the LDCC included self-reported gender, age group, maritalstatus, job type, and number of people in the household. This information was providedfor training and kept hidden for testing. Three subtasks, namely gender, marital status,and job prediction were formulated as classification problems, for which classificationaccuracy was used as evaluation measure. The two remaining attributes correspondedto regression problems, for which the root mean square error (RMSE) was used as eval-uation measure. Each subtask contributed equally to the final score which was definedas the average of relative improvements over baseline performance.
5. MDC data
This section presents an overview of the MDC dataset and the corresponding prepa-ration procedures. We first describe the division of the original LDCC data that wasneeded to address the different MDC tasks. We then summarize the data types thatwere made available. We conclude by discussing the procedures related to privacy anddata security.
5.1. Division of the dataset
The datasets provided to the participants of the MDC consisted of slices of the fullLDCC dataset. Slicing the data was needed to create separate training and test sets for
10

the tasks in the Dedicated Track, but was also useful to assign the richest and cleanestparts of the LDCC dataset to the right type of challenge. Four data slices were created:Set A: Common training set for the three dedicated tasks.Set B: Test set for demographic attribute and semantic place label prediction tasks.Set C: Test set for location prediction task.Open set. Set for all open track entries.The overall structure of the datasets is given in Figure 3. The rationale behind this
structure was the following. First, the participants of the LDCC were separated in threegroups, according to the quality of their data with respect to different criteria. The80 users with the highest-quality location traces were assigned to sets A and C. Set Acontains the full data for these users except the 50 last days of traces, whereas set Ccontains the 50 last days for which location data is available for testing.
In order to maximize the use of our available data, we reused Set A as a training setfor the other two dedicated tasks. A set of 34 further users was selected as a test set forthese tasks and appeared as Set B. In this way, models trained on the users of Set A canbe applied to the users of their most visited locations.
Demographic data and semantic labels, as explained in Section 3, were collectedthrough surveys. Since all steps of the LDCC participation were fully voluntary, a num-ber of users chose not to complete the surveys, or filled them only partially. Therefore,the participants for whom complete questionnaire data was not available were assignedto the last set, which was used for the Open Track. In total, 38 users were assignedto this dataset. Overall, with this data split, a total of 152 LDCC participants wereincluded in the MDC datasets.
Set A
(80 users, 20492 user-days)
Set C
(3881
user-days)
Set B (34 users, 11606 user-days)
Open Challenge dataset
(38 users, 8154 user-days)
Use
rs
Time
Figure 3: Division of the MDC dataset into four challenge subsets. For each set, the total number ofuser-days with data is also shown.
11

5.2. Data types
For both Open and Dedicated Tracks, most data types were released in a raw formatexcept a few data types that had to be anonymized. There are two main differencesbetween the Open Track data and the Dedicated Track data. First, the physical location(based on GPS coordinates) was available in the Open Track but not in the DedicatedTrack. We released a preprocessed version of the location data in the form of sequences ofvisited places for the Dedicated Track. This allowed to study performance of algorithmsin a location privacy-preserving manner. The second main difference was the availabilityof relational data between users. This included both direct contacts (e.g., when a usercalls another user) and indirect contacts (e.g., if two users observe the same WLANaccess point at the same time then they are in proximity). We decided to keep this datain the Open Track but removed it in the Dedicated Track since it could have potentiallyrevealed the ground truth to be predicted. In the anonymization algorithm, a commonhashing key was used for the users selected for the Open Track data sets. On the otherhand, we used a different hashing key for each user in the Dedicated Track.
Common data types. A table is associated to each data type in which each rowrepresents a record such as a phone call or an observation of a WLAN access point. UserIDs and timestamps are the basic information for each record. Specific information ofeach data type is detailed in Table 2.
Data types for Open Track only. Geo-location information was only available inthe Open Track. In addition to GPS data, we also used WLAN data for inferring userlocation. The location of WLAN access points was computed by matching WLAN traceswith GPS traces during the data collection campaign. The description of geo-locationdata is reported in Table 3.
Location data in Dedicated Track. Physical location was not disclosed in theDedicated Track. For each user in the dedicated track, the raw location data (basedon GPS and WLAN) was transformed into a symbolic space which captures most ofthe mobility information and excludes actual geographic coordinates. This was doneby first detecting visited places and then mapping the sequence of coordinates into thecorresponding sequence of place visits (represented by a place ID). A place was definedas a small circular region with 100-meter radius that had been visited for a significantamount of time. The place discovery process was done with a two-step approach [26].First, the sequence of coordinates was segmented into stay points and transitions, wherestay point was defined as a subsequence of the location trace for which the user stayedwithin a small circular region (radius=100 meters) for at least 10 minutes. In the secondstep, the detected stay points were grouped by a grid clustering algorithm which is basedon a uniform grid where each cell is a square region of side length equal to 30 meters.The algorithm starts with all stay points in the working set and an empty set for stayregions. At each iteration, the algorithm looks for the 5× 5-cell region that covers moststay points and removes the covered stay points from the working set. This process isrepeated until the working set is empty. Finally, the centers of 5×5-cell regions are usedto define circular stay regions that we called places. Note that the place extraction wasdone for each user separately, therefore places are user-specific. We also ordered placesby the time of the first visit (thus, the visit sequence starts with place ID=1). Althoughthe absolute coordinates of places were not provided, a coarse distance matrix betweenplaces was computed for each user and provided for the MDC participants of this track.
12

data type descriptionaccel.csv user ID, time, motion measure, and accelerometer samples.application.csv user ID, time, event, unique identifier of the application,
and name of the application.bluetooth.csv user ID, time, first 3 bytes of MAC address, anonymized
MAC address, anonymized name of the Bluetooth device.calendar.csv user ID, time, entry ID, status (tentative/confirmed), entry
start time, anonymized title, anonymized location, entrytype (appointment/event), entry class (public/private), lastmodification time of the entry.
callog.csv user ID, call time, call type (voice call/show message), SMSstatus (delivered, failed, etc.), direction (incoming, outgo-ing, missed call), international and region prefix of phonenumber, anonymized phone number, indicator if number isin phone book, call duration.
contacts.csv user ID, creation time, anonymized name, international andregion prefix of phone number, last modification time.
gsm.csv user ID, time, country code and network code, anonymizedcell id, anonymized location area code, signal strength.
mediaplay.csv user ID, time, album name, artist, track, track title, tracklocation, player state, track duration.
media.csv user ID, record time, media file time, anonymized mediafile name, file size.
process.csv user ID, record time, path name of running process.sys.csv user ID, time, current profile (normal, silent, etc.), battery
level, charging state, free drive space, elapsed inactive time,ringing type (normal, ascending, etc.), free RAM amount.
wlan.csv user ID, time, first 3 bytes of MAC address, anonymizedMAC address of WLAN device, anonymized SSID, signallevel, channel, encryption type, operational mode.
Table 2: Common data types of Open and Dedicated Tracks (in alphabetical order).
data type fieldswlan loc.csv user ID, time, first 3 bytes of MAC address, anonymized
MAC address, longitude, latitude.gps.csv user ID, record time, time from GPS satellite, geo-location
(altitude, longitude, latitude), speed, heading, accuracyand DOP, time since GPS system started.
Table 3: Specific data types for the Open Track.
13
5.3. Data anonymization
Various anonymization techniques were applied to the MDC data: truncation for lo-cation data, and hashing of phone numbers, names (such as contacts, WLAN networkidentifiers, Bluetooth device identifiers), and MAC addresses. This process is summarizedin this subsection.
5.3.1. Anonymizing location data
The detailed locations can indirectly provide personally identifiable information, there-fore risking compromising the privacy of the LDCC participants. A location that is reg-ularly used at night, for instance, could indicate the participant’s address, which couldthen potentially be reversed using public directories to find out the participant’s iden-tity. While all researchers participating in the MDC committed in writing to respect theprivacy of the LDCC participants, i.e. not trying to reverse-engineer any private data(see Section 3), we also took specific measures in terms of data processing.Anonymizing location data for Open Track. In order to provide enough privacy
protection while simultaneously keeping the data useful, we applied k-anonymity by trun-cating the location data (longitude, latitude) so that the resulting location rectangle, oranonymity-rectangle, contains enough inhabitants. That is, the exact location, consist-ing of longitude and latitude information, was replaced by a rectangular area of varyingsize, subsequently increasing the uncertainty of the given location. For instance, in citycenters anonymity-rectangles tend to be small, while in rural areas anonymity-rectanglescan be kilometers wide. This step required a considerable amount of manual work thatincluded visualizing the most visited places of the LDCC participants in order to cor-rectly set the size of the anonymity-rectangles. Once set, those anonymity-rectangleswere applied to all data from all users.
The data for the Open Track included also the WLAN based location informationwhich was passed through a similar anonymity-rectangle filtering process.Location data for Dedicated Track. As discussed earlier, geo-location data was
not used for the Dedicated Track. Visited places were represented by IDs which are pos-itive integers, intrinsically removing all personally identifiable information. The mobilityhistory of a given user is then represented as a sequence of place visits, characterizingby place ID and arrival/leaving timestamps. For the semantic place prediction task,place categories were provided for a small subset of the discovered places. We used thefollowing categories: home; home of a friend, relative or colleague; workplace/school;place related to transportation; workplace/school of a friend, relative or colleague; placefor outdoor sports; place for indoor sports; restaurant or bar; shop or shopping center;holiday resort or vacation spot.
5.3.2. Anonymizing MAC addresses, phone numbers, and text entries
Hashing was applied to a variety of text entries appearing in the MDC data, includingBluetooth names, WLAN network identifiers (SSID), calendar titles and event locations,first names and last names in the contact lists, and media filenames (such as pictures).
For anonymization of the WLAN and Bluetooth MAC addresses, we split them intotwo parts. First, the MAC prefix, also known as the “Organizationally Unique Identifier(OUI)” [33], was kept in clear text. Second, the rest of the MAC address was anonymizedby hashing, after concatenating it with secret key, and the userID for dedicated challenges.
14

hash(token) = sha256(token), where,token = (seckey1||information||seckey2), for open challenges,token = (userID||seckey1||information||seckey2), for dedicated challenges.
Note that, for the dedicated challenges, this anonymization method results in the sameMAC address appearing differently in different user data sets.
Phone numbers appearing in the call logs and contact lists were also split in two parts.First, the number prefix, which contains the country and region/mobile operator codes,was left as clear text. Then, the rest of the phone number was hashed as describedabove. The cell ID and the location area code (LAC) of the cellular networks were alsoanonymized using the hashing technique described above.
5.4. Watermarking
The release of the MDC data set to a large community of researchers motivated anadditional step in which each distributed copy of the data set was watermarked individ-ually in order to identify it if necessary. The watermarking process introduced negligiblealterations of the data that did not interfere with the results.
6. MDC schedule and participation
The MDC process started in summer 2011. We targeted to organize the MDC Work-shop, where methods and results would be presented, within one year. We decided tokeep the challenge open for all researchers with purely academic affiliation. The prospec-tive participants of the Open Track had to submit a short proposal with their concreteplan, and the participants of the Dedicated Track had to agree to participate at least onetask. While the MDC was by nature open, a series of steps was established for participantregistration. Importantly, this included signature of a Terms and Conditions agreement,in which each researcher explicitly committed to use the data only for research purposes,and to treat the data in an ethical and privacy-preserving manner (reverse engineer-ing of any portion of the MDC data to infer sensitive personal information was strictlyforbidden).
The MDC registration process was launched in early November 2011 and closed inmid-December 2011. The challenge was received enthusiastically by the research com-munity. In early January 2012, the MDC data was released to more than 500 individualparticipants as individually watermarked copies for more than 400 challenge tasks. Theparticipants were affiliated with hundreds of different universities and research institutes,with a worldwide geographic distribution (Asia 23%, USA 22%, Europe 51%, other re-gions 4%). Many leading universities in the field participated in the MDC tracks.
A total of 108 challenge submissions were received on mid-April 2012, correspondingto 59 entries for the Dedicated Track and 49 entries for the Open Track. All submittedcontributions were evaluated by a Technical Program Committee (TPC), composed ofsenior members of the mobile and pervasive computing communities. The TPC membersdid not participate in the MDC themselves to minimize possible conflicts of interest.
The criteria to evaluate entries for each Track were different. On one hand, the OpenTrack entries were evaluated according to a set of standard scientific criteria, includingthe novelty and quality of each contribution, and the paper presentation. All entries inthe Open Track were reviewed at least by two members of the TPC. On the other hand, all
15

entries in the Dedicated Track were evaluated using the objective performance as the onlycriterion to decide on acceptance to the MDC Workshop. Entries for all three dedicatedtasks were compared against standard baseline methods. In addition, all Dedicated Trackpapers were subject to review in order to verify basic principles of originality, technicalnovelty, experimental correctness, and clarity. Papers corresponding to entries whoseperformance did not outperform the baseline were reviewed by one member of the TPC.All other papers were reviewed at least by two members. The TPC evaluated all paperswithout knowledge of the performance obtained on the test set. While the reviews did notplay any role in the acceptance decision for the Dedicated Track, they helped to detecta few problems, and in every case they were passed on to the authors. In particular, thereviews served as guidelines to the authors of accepted entries to improve the presentationof their approach and achieved results. Final acceptance for all entries was decided duringa face-to-face meeting involving all MDC co-chairs, in which all papers were discussedand in some cases additional reviews were performed. In some cases, a shepherd wasassigned to accepted entries to ensure that the key comments from the reviewers wereimplemented. As a result of the reviewing process, 22 entries to the Open Track and 18entries to the Dedicated Track were accepted. For the Dedicated Track, we decided notto reveal the teams’ absolute performance scores and relative ranking before the MDCWorkshop. Finally, a number of awards was given to the top contributions, based on theentries’ performance for the Dedicated Track, and following the recommendations of anAward Committee specifically appointed for the Open Track.
7. Analysis of the MDC submissions
We were positively surprised by the diversity of ideas and technical approaches submit-ted to the Challenge. It was clear that many teams could produce promising results andoriginal approaches in a couple of months of work with the data. With two objectives inmind (drawing a thematic map of the interests of the MDC community participating inthe Open Track, and objectively comparing the performance of the methods addressingtasks of the Dedicated Track) we present an analysis of the MDC accepted submissions.We start with an analysis of the Open Track, and continue with a discussion about theDedicated Track.
7.1. Open Track: Diversity in Mobile Big Data Research
The papers related to the MDC Open Track exhibited a wide range of themes, rangingfrom visualization techniques to behavioural analysis to the practical application of net-working and connectivity technologies. This demonstrates broad opportunities relatedto rich mobile data. Despite of the diversity in terms of research questions and topics ex-plored, several commonalities emerged. Many papers underlined that the MDC datasetprovides an unique opportunity to validate a given model or research question. For in-stance, Schulz et al. [34] utilized the co-existence of cell ID and GPS traces to study thepotential of the former in deriving human mobility patterns. Another recurrent themewas the utilization of multiple data modalities; for instance, De Domenico et al. [35]analyzed the correlation between spatial and social patterns. Finally, the applied natureof several papers is worth noting. Consider, e.g., Frank et al. [36], whose method caninspire the design of novel interfaces for contextual services, or the paper by McGrath
16

et al. [37], whose method could constitute an alternative positioning method for cheapfeature phones, which lack GPS.
A total of 21 papers were accepted to be presented in the MDC workshop. The analysisof the papers led to three main categories: Big Data at Meta Level, Behavioural Analysis,and Networking & Connectivity. Separate sections will be devoted to describe each ofthese themes.
7.1.1. Big Data at Meta Level
The papers in this category reflected high-level Big Data issues. Several were associatedwith techniques for summarizing Big Data, e.g. from a visual perspective. A few entrieswere related to inspection and comparison of Big Data analysis techniques.
Summarizing Big Data. Hoferlin et al. [38] and Slingsby et al. [39] focused on systemsthat may be used for visualizing complex data sets. The former aimed to provide a toolfor open-ended, exploratory analysis, through the provisioning of complementing viewson the data. The authors underlined the importance of privacy-related considerationswhen it comes to generation of visual summaries of behaviour of individual participants.The latter paper, on the other hand, was focused on visualizing the spatial and temporalnature of social networks. This entry received the third price in the Open Track. TheMDC data set was shown to have some potential but importantly, the authors alsocalled for more comprehensive data sets, capturing more than just mobile phone basedcommunication. Skupin and Miller [40] built on methods related to traditional geographicatlases by presenting base map configurations on top of which thematic elements, suchas demographic aspects of commuting modalities of MDC participants were overlaid.The method is a proof-of-concept regarding visualization of high dimensional attributespaces in an intuitive way. The above papers are related to visualization. Frank etal. [36] described the process of translating contextual data collected through mobilephones to natural language sentences related to locations encountered by the individualsin the campaign. The applied value of the method can be easily seen: natural languagetechniques could be suitable for life logging services. This work was awarded the secondOpen Track price.
Improving the Analysis of Big Data. The geographic modalities in the MDC data setpertain both to GPS as well as GSM traces. Schulz et al. [34] utilized the co-existence ofthese two modalities to study the effectiveness of GSM mobility traces in deriving humanmobility patterns. GSM data was shown to be associated with weaknesses and strengths.Idrissov and Nascimento [41] used MDC data to show the quality of their trajectoryclustering method. Moving from large amounts of data to more simple representations,Hartmann et al. [42], on the other hand, aimed at reducing the number of states in usertraces. With the increasing popularity of location based services, both papers can havepractical value.
7.1.2. Behavioural Analysis
The papers belonging to this category were related to analysis of spatial and socialbehaviors. Some of the papers were also associated with contextual dependencies inmobile phone usage behaviour.
The entries by Niinimaki et al. [43], and Gustarini and Wac [44] bear relevance topsychological research. The former paper investigated if weather has an impact on mo-bility patterns of individuals. Two data sets were combined - the MDC data by Nokia
17

and meteorological data by MeteoSwiss. The latter paper tapped into the perception ofintimacy across various locations. Bluetooth encounters, ring tone status of the partici-pants as well as charging behavior were used as indicators of social density, type of socialconnections in one’s surroundings, as well as perceived level of safeness in regard to agiven location.
Two MDC entries were associated with examining the overlap between spatial andsocial behaviors. De Domenico et al. [35] showed that user movement forecasting can beimproved through exploiting the correlation between movements of friends and acquain-tances, an idea that was awarded the first price in the Open Track. Munjal et al. [45], onthe other hand, were interested in using the correlation between locations visited by userswho were socially interacting in making efficient routing decisions in mobile networks.
Muhammad and Van Laerhoeven [46], and McGrath et al. [37] were concerned withinferring social groups and locations, respectively, using indirect measures. The formerpaper found consistent results across a number of modalities, including shared contacts,shared IDs on the call lists, common WLAN MAC addresses seen by the users, and GPSclusters in close proximity in time and space to one another. The entry by McGrath etal., on the other hand, showed that the transitions between spatial habitats of individualswas predictable solely from daily routines and their smart phone usage habits.
McInerney et al. [47], Barmpounakis and Wac [48], and Tan et al. [49] focused onunderstanding mobile phone usage in different contexts. McInerney et al. establisheda connection between the instantaneous entropy of individuals, i.e., a measure of theirmomentary predictability, and the use of the mobile phone. In particular, almost allmobile applications showed an increased level of use when the individual behaves in anon-routine based way. Barmpounakis and Wac [48], on the other hand, investigatedconnectivity and application use patterns, with the aim of improving Quality of Service.Finally, Tan et al. [49] adopted an applied perspective through the investigation of amethod capable of real-time application usage predictions in a mobile context.
7.1.3. Networking and Connectivity
In several cases, the MDC dataset was utilized from the networking and connectivityperspective. Keller et al. [50] studied ad hoc file sharing over WiFi among individualswith similar musical taste. Also Wu et al. [51] also investigated opportunistic datatransfer. Their focus was on the use of smart phones to collect data from wireless sensornodes. Both papers yielded positive results based on data stemming from the MDC.
Van Syckel et al. [52] set out to study information dissemination in a delay toler-ant network. In low-density delay tolerant networks, the consistency in everyday usermovement was found to contribute significantly to the information distribution rate.
The entry by Michaelis et al. [53] was concerned with using MDC data to predictthe network cell IDs of a moving user, for the purposes of active load balancing. Thegenerated paths of MDC participants were used in order to predict the next cell. Forsome participants, the experiments exceeded 80% accuracy.
Wang et al. [54] investigated periodicity of encounter patterns between mobile devicesin order to improve communications in a mobile network setting. Strong weekly anddaily patterns emerged; the authors also showed how the persistence of such patterns gotinterrupted from time to time.
18

7.2. Dedicated Track, Task 1: Semantic Place Prediction
As stated earlier in this paper, the first task was the inference of the semantic labelsof the most significant places that a user visits. This task was a multi-class classificationproblem, but the training and testing sets were not distributed uniformly as Figure 4shows. As only the most visited places were labeled by the participants, it is quite naturalthat homes and workplaces are the most represented classes in the dataset. There wereonly small discrepancies between the training and test sets, but still guaranteeing enoughrepresentativeness in each class. Manual place labeling was a tedious task, and so to keepthe workload reasonable, only a small fraction of them (around 10%) was shown to theparticipants for labeling. Therefore, the training and test sets contained a large numberof unlabeled places.
0%
5%
10%
15%
20%
25%
30%
35%
dis
trib
utio
n o
f cla
sse
s
testing set
training set
Figure 4: Distribution of the classes in the training and testing sets for the dedicated task 1.
To get a first idea of the performance of the different submitted algorithms and to allowa pre-selection at submission, a baseline classification method was implemented. Usingonly time features and a naive Bayes classifier, the baseline achieved 53% of accuracy.From the submissions, the most popular features were based on time and frequency ofvisits, but also on accelerometer features. Many teams did also decompose the probleminto several binary classification problems.
The accuracy was computed as the number of correct predictions over the places inthe test set that were actually labeled. The other unlabeled places were just ignored.
According to this measure, all submissions below the baseline were attributed onereviewer and rejected by default, and the other ones had at least two reviews. Figure 5shows the distribution of the best submission for each team. As stated earlier, each teamwas allowed to submit blindly 5 results and the best one of them was kept for the ranking.Detailed analysis showed that the scores of the different submissions originating fromthe same team had a low variance and thus most likely resulted from tuning algorithmparameters rather than from generating random results.
Among the three best results, various methods were proposed and experimented.
In third position, Montoliu et al. [55] used “smart” binary classifiers using 1-vs-1 and1-vs-2 classes. The features that were selected most often were based on time, phone
19

0 2 4 6 8 10 12 14 16 180.4
0.45
0.5
0.55
0.6
0.65
0.7
0.75
rank
sco
re
dedicated challenge − task 1
baseline model
oral presentation
poster
rejected
Figure 5: Final result of Dedicated Task 1. Scores of the 17 best submissions, one per team.
profile, call-logs, SMS and WLAN. Moreover, they showed good performance of a novelMultiCoded class-based method as evaluation rule for the binary classifiers.
In second position, Huang et al. [56] proposed to use a multi-level classification wherethe decision tree was manually built to deal with the class imbalance and included somecommon sense knowledge. For each level of the tree, several classifiers were trained andthe features selected using χ2 were the following: accelerometer movements, missed-call,text-out, Bluetooth, and time of visit.
Finally in first position, Zhu et al. [57] focused on generating as many features aspossible (over two million), letting the feature selection algorithms do their job. They alsoconditioned the features by time intervals of 30 minutes and showed a great improvementof accuracy. The most useful features were based on time, Bluetooth and accelerometer.Several classifiers like Logistic regression, SVM, Gradient Boosting Trees, and RandomForest were evaluated.
It was interesting to notice that the top contributions reached a performance roughlyin the same range as the one that corresponds to the aggregated percentage for the threemost common categories in the dataset (see first three columns in Fig. 4.)
Overall, this task highlighted the great challenge of giving sense and semantic meaningto collected data, based purely on mobile data inputs that do not contain explicit ge-olocation. The promising result obtained by the top contribution (66% accuracy) showsthat this path is worth of more exploration.
20

7.3. Dedicated Track, Task 2: Next Place Prediction
The goal of this task was to predict the next destination of a user given the currentcontext, by building user-specific models that learn from the mobility history, and thenby applying these models to the current context to predict where the users will go next.
For the Dedicated Track, the raw location data was transformed into sequences of placevisits and the prediction task was defined in the symbolic space of place IDs. While thedefault minimum stay duration of visit was 10 minutes (see Section 5), we exceptionallyused a larger threshold for the next place prediction task. The motivation was to filterout short visits which are very challenging to predict. In Task 2, visits of less than 20minutes were removed, and all evaluations were done with the sequence of visits of at least20 minutes. The prediction context consisted of the current place ID, the arrival/leavingtimestamps of the visit, and the data recorded during the visit, and the 10 minutes beforearrival. The output to be predicted was the ID of the next destination.
In the training phase, the sequence of visits to places and several types of phone dataassociated with these visits were made available. Furthermore, in the testing phase,previously unseen data from the same set of users was provided. For each user, a numberof test data points were selected randomly from unseen transitions (e.g., transition fromcurrent place to the next place) with the restriction that there was at most one test datapoint per day. As described above, each test data point is associated with a time interval(the mobile phone data in the test set is only available within these time intervals), andthe ground truth is the next place the user visited after the time interval. As people keepvisiting new places over time, both the current place P and the next destination D canbe a new place that did not occur in the training set. In the ground truth, all new placesthat did not occur in the training set were processed by setting ID=0 by convention (thisspecial category occupies 8% of the ground truth data). Classification accuracy was usedas performance evaluation measure.
3ODFH�$ 3ODFH�%
WUXVWHG�WUDQVLWLRQ
3ODFH�$ 3ODFH�%
XQWUXVWHG�WUDQVLWLRQ
3ODFH�&
WUXVWHG�YLVLW
3ODFH�&
XQWUXVWHG�YLVLWFigure 6: Trusted transition and untrusted transition. Each dot represents available location data.
Due to the missing location data during the recording process, some actual visits mighthave not been detected, and some detected visits might be erroneous. In other words,the next place in the recorded sequence of visits might not be the actual next place. Forthis reason, we introduced the concept of trusted transition, which is trusted if there arelocation data points of the user every 10 minutes between the leaving time of the currentvisit and the arrival time of the next visit, as illustrated in Figure 6. By construction,next places of trusted transitions correspond to actual next places. In the data, we foundthat 57% of transitions are trusted, and this indicator of trustworthiness is also providedin the preprocessed location traces. Finally, we only considered trusted transitions in the
21

selection of test data points.
0 5 10 15 20 25
0.2
0.25
0.3
0.35
0.4
0.45
0.5
0.55
0.6
0.65
rank
sco
re
dedicated challenge − task 2
baseline model
oral presentation
poster
rejected
Figure 7: Final result of dedicated task 2. Accuracies of the 21 best submissions, one per team.
We received 21 valid submissions, in which 52% of the methods were reported to useonly spatial and temporal context (i.e., using only mobility data). While 71% of thesubmissions had proposed at least one dedicated probabilistic model for user mobility,the remaining 29% of the submissions employed only standard machine learning methodssuch as SVM or Random Forest. The final accuracy of submissions is shown in Figure 7in descending order, where the top 3 submissions were selected for oral presentation, andthe next 4 submissions were selected for poster presentation at the MDC workshop. Notethat each team had the right to submit 5 final prediction output files, and the best resultwas selected for each team. As a baseline method, we considered a simple method thatpredicted the most frequently visited place as the destination if the user is not currentlyat that place. If the current place is the most visited place, then the baseline method pre-dicted the second most frequently visited place as the destination. This baseline methodresults in 44% of accuracy on the test set. At the third place, Gao et al [58] reachedan accuracy of 52% by using a probabilistic framework that combines spatial historicaltrajectories with temporal periodic patterns. Wang and Prabhala [59] reached secondbest performance after investigating a periodicity model and SVM classifiers workingon time and location features. The winner of this task reached an accuracy of 56% bycombining a Dynamical Bayesian Network with two standard methods: Artificial NeuralNetwork and Gradient Boosted Decision Trees [60].
The final result shows that human mobility is relatively difficult to predict in theconsidered setting. One key challenge is to learn from limited number of observationsand to predict with limited contextual data. While many phone data types were provided,we found that the top 3 submissions only considered mobility data for predicting humanmobility. Our interpretation is that besides spatio-temporal context, other contextualcues may be too weak for learning a human mobility model from each user data separately.
22
We could expect that these additional contextual cues can be exploited more efficientlyby combining generic human mobility patterns with individual mobility patterns.
7.4. Dedicated Track, Task 3: Demographic Attribute Prediction
Many mobile applications could benefit from being able to adapt their behavior accord-ing to the type of user. This could enable the application to provide more appropriateservices or content to the user and adapt the way information is presented to the user. Astraightforward way for an application to acquire information about users is to ask themto specify attributes about themselves to the application. This however requires extraeffort from the user and the possibility to integrate the request of such information intothe usage flow of the application. These alternatives may not always be possible, so thatsettings related to the user may remain unanswered. An interesting question is whetherapplications could infer some of the user’s characteristics based on the contextual infor-mation traces that they can observe in order to facilitate appropriate adaptation of theirbehavior.
To investigate this question, Task 3 of the Dedicated Track was to develop methodsfor predicting certain demographic attributes of the users in the MDC dataset based onthe context traces provided for the users.
The demographic attributes in the dataset were self-reported by the participants andcovered the gender, age group, marital status, and job type of the user as well as thenumber of persons living in the user’s household. Apart from the binary gender attribute(female and male), the age groups were modeled by binning the ages of the participantsaged 16-44 years into bins of 5-6 years and providing one bin for persons older than 44years. Marital status was reported as one of three classes: “single or divorced”, “in arelationship”, or, “married or living together with my partner”. The job type involvedfour possible classes including “Training”, “PhD student”, “Employee without executivefunctions”, and, ”Employee exercising executive functions”. Finally, the number of per-sons living in the user’s household was modeled by five dedicated bins for one, two, three,four, and more than four persons.
The three prediction subtasks for the gender, marital status, and job type attributeswere formulated as classification problems, for which the prediction accuracy was usedas the evaluation measure. The prediction subtasks for age group and number of personsin the household were treated as regression problems, and the root mean squared error(RMSE) was used as the evaluation measure.
The training set consisted of context data traces from 80 distinct users, covering alto-gether 20492 user days. The demographic labels for users in this dataset were providedas part of the challenge data. The testing dataset contained data from 34 users, coveringaltogether 11606 user days. The demographic labels for users in the testing dataset werenot revealed to the challenge participants. The ranking of the challenge contributionswas based on the relative improvement that the submitted prediction results providedover the results obtained from very basic, dummy prediction models. The dummy pre-diction model used for the classification subtasks was such that it always predicted theclass with the highest number of occurrences in the training data. For the regressionsubtasks, the dummy model always predicted the average of the attribute values in thetraining data.
The basic evaluation measure for classification subtasks is the overall error rate, thatis the fraction of classifications made that were incorrect. For the regression problems,
23
root mean square error (RMSE) is used as the basic evaluation measure. The evaluationscore for each subtask was then calculated as the relative improvement of the submittedprediction over the dummy prediction. The final evaluation score for each challengesubmission was then determined by taking the average of evaluation scores of the fiveprediction subtasks.
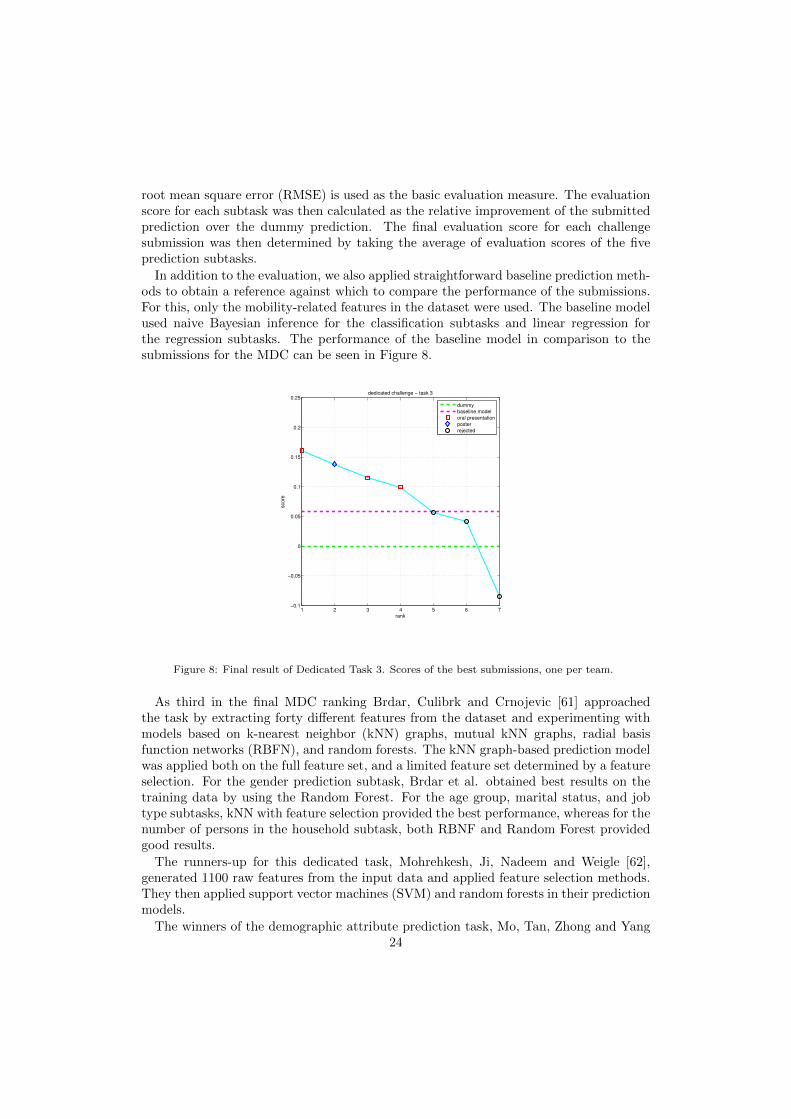
In addition to the evaluation, we also applied straightforward baseline prediction meth-ods to obtain a reference against which to compare the performance of the submissions.For this, only the mobility-related features in the dataset were used. The baseline modelused naive Bayesian inference for the classification subtasks and linear regression forthe regression subtasks. The performance of the baseline model in comparison to thesubmissions for the MDC can be seen in Figure 8.
1 2 3 4 5 6 7−0.1
−0.05
0
0.05
0.1
0.15
0.2
0.25
rank
sco
re
dedicated challenge − task 3
dummy
baseline model
oral presentation
poster
rejected
Figure 8: Final result of Dedicated Task 3. Scores of the best submissions, one per team.
As third in the final MDC ranking Brdar, Culibrk and Crnojevic [61] approachedthe task by extracting forty different features from the dataset and experimenting withmodels based on k-nearest neighbor (kNN) graphs, mutual kNN graphs, radial basisfunction networks (RBFN), and random forests. The kNN graph-based prediction modelwas applied both on the full feature set, and a limited feature set determined by a featureselection. For the gender prediction subtask, Brdar et al. obtained best results on thetraining data by using the Random Forest. For the age group, marital status, and jobtype subtasks, kNN with feature selection provided the best performance, whereas for thenumber of persons in the household subtask, both RBNF and Random Forest providedgood results.
The runners-up for this dedicated task, Mohrehkesh, Ji, Nadeem and Weigle [62],generated 1100 raw features from the input data and applied feature selection methods.They then applied support vector machines (SVM) and random forests in their predictionmodels.
The winners of the demographic attribute prediction task, Mo, Tan, Zhong and Yang24

[63] , used an approach in which they constructed a set of tens of thousands of rawfeatures representing conditional probabilities of user actions and applied feature filteringand dimensionality reduction to the feature set. The prediction models utilized includedC4.5, gradient boosted tree, random forest, SVM, logistic regression, RepTree, supportvector regression, Gaussian process, linear regression, and lasso.
8. Discussion
Nine months after the conclusion of the Challenge, we are in a position to reflectupon our initiative. This section provides a retrospective discussion on our motivations,design choices, issues regarding the concrete implementation of the challenge, and themain outcomes and limitations of the initiative.
8.1. Motivations to implement MDC
As described in earlier sections of this paper, before the MDC there was already asignificant investment behind the LDCC data collection on a level that is obviouslybeyond the capabilities of individual researchers or many research groups. The datacollection had initially a two-fold motivation. Such rich data was needed for researchwithin the groups behind this initiative and among their closest partners. But fromthe very beginning the intention was also to share this data with research community.Therefore, the campaign was also designed so that it was possible to address ratherdifferent research questions using the same multi-dimensional data set.
The wide sharing of this data asset was motivated by the spirit of open innovation, i.e.by thinking that sharing the data was a key to scale up the overall innovation processaround it. This also extended the coverage of innovation to research questions which didnot match the focus and competence profile of the research groups behind the LDCC andMDC. Therefore, our intention was to enable scientific advances on different disciplines.Open data sharing brought along many research teams which had needed competencies,but without access to advanced mobile data sets before the MDC.
From the research perspective, it was liberating and empowering to enable a researchcommunity by opening the data set for wider use. Before the MDC we regularly receivedquestions and requests regarding sharing of the LDCC data. However, it was necessaryto start the data usage in a smaller scale, and the extension of the community becamepossible only after previous knowledge of this particular data set had accumulated.
8.2. MDC design choices
Perhaps the key design choice was the decision to allow both open entries and specificentries. The overall result of this was a significant participation on both fronts. Theparticipation profile also shows that the Open and Dedicated Tracks attracted differentcommunities. The tasks chosen in the Dedicated Track proved to be challenging enough(which demonstrates the need for further research in this domain), while at the same timeattractive enough to motivate researchers to test advanced data mining methods. Thetasks in this Track were also diverse enough to generate interest either as individual tasksor collectively (for those teams who could target more than one). We anticipate that thedefinition of these tasks will result in future publications where improvements over the
25

best performance obtained so far will be reported. Finally, the dual Open/Dedicated for-mat resulted in a considerable additional effort for us as organizers, as a fully automatedway of assessing the entries was no longer possible.
The decision of having multiple tracks and tasks created the need to split the data.Obviously, this lead to trade-offs between the amount of data versus the number ofseparate tracks. This was also the decision that implied a significant amount of workuntil we achieved a satisfactory solution for splitting the overall data into sub sets withappropriate amount and quality. As shown in Figure 3 and discussed more in details inSection 5, the data split had to satisfy multiple time and population-related constraints.After careful inspection, the data of some LDCC users was deemed not useful for any ofthe tasks in the Challenge and was not distributed. This was mainly caused by the sparseor incomplete device usage of these particular users. Defining a single task or track wouldhave provided the maximum amount of data but would have reduced participation.
Another design choice (in this case of LDCC rather than of MDC) was the populationthat took part in the data collection initiative. As stated earlier, the LDCC populationdoes not exactly match the overall demographics of French-speaking Switzerland. On theother hand, it corresponds well to the consumer segment of real smartphone users. Thismakes it attractive to investigate consumer behaviour, using this particular data from theperspective of smartphone service concepts. We have also recently demonstrated thatsome large-scale mobility trends observed in the MDC data match patterns obtainedwith an independent larger-scale population and their mobility traces (Foursquare) [64].This proves the value of the MDC data as a snapshot of real European life, beyond thetasks we proposed.
The decision of not distributing geo-location data for the Dedicated Track was mo-tivated by our interest in promoting the development of techniques that are location-privacy sensitive. This was a critical factor for service concept creation by following thePrivacy by Design principles [8]. On the other hand, being aware of the huge interestof the community in having access to longitudinal location traces, we decided to releasethem as a part of the Open Track data set, with an additional location anonymizationstep performed for the sensitive, personal locations. When the location data sets forthe Dedicated Track were prepared, the parameters had to be carefully selected (e.g.retaining shorter or longer stays) so that the data was reliable but did not compromisethe amount of extracted places.
Further decisions were made related to the type of participation and the duration ofthe challenge. Most participants decided to work in groups. The maximum group sizewas an important parameter influencing the ambition level of the proposed ideas and thequality of their final implementation. We had no way of testing this a priori, and thereforedecided to target the challenge for small groups. Our intention was to encourage a tightintegration of effort. The same logic was used when the duration of the Challenge wasdecided. Three months were considered as a period that would allow seriously involvedpeople to achieve something significant, without resulting in a prohibitive period thatwould distract the participants from their main activities (counting on most of them beingstudents or postdocs). It was also considered beneficial to execute the whole Challengewithin less than a year to maintain the momentum throughout the whole initiative.
A final design issue was related to data distribution. Existing platforms, like Kaggleor Crawdad, are commonly used in research. But decided to keep the data distributionclose to the organizing team, in order to control all aspects of authorization, access,
26

individually watermarked copies, etc. This choice was a clear one: we owe this level ofcare to the volunteers in our study.
8.3. MDC implementation
While the above section relates to the design of MDC, we now discuss aspects relatedto the implementation of this initiative. The relevant themes are as follows: communityformation, privacy and legal aspects, as well as outcome analysis.
Community formation. The community accessing and analyzing the data evolved inthe course of the LDCC and MDC. As explained earlier, a core team was formed aroundthe data during the LDCC stage. The network became significantly wider during theMDC stage. The core team, which was involved throughout the process and facilitatedall stages, consisted of employees from NRC Lausanne and Idiap. In retrospect, we feelthat the continuity and long-term commitment of this small core team was one of themost critical factors enabling the scaling up of the community. The core team had aholistic responsibility both for LDCC and MDC, covering also the practicalities relatedto these initiatives. Various aspects had to be mastered, including hosting of the data,establishing a legal framework for data sharing, taking care of the privacy aspects, as wellas controlling the data access in regard to additional research groups joining in during thesubsequent stages. The Nokia and Idiap teams were located in proximity of one another,and they operated in a very seamless manner with a lot of collocated meetings. Theoverall MDC schedule was designed to be tight, and during many time critical phasesthe physical proximity was of particular importance.
From this well functioning core team, it was rather natural to scale up the communityto a larger level. Acquiring a strong familiarity with the dataset during the LDCC stageenabled critical aspects to be taken into account when starting to significantly increasethe community size during the MDC.
Privacy aspects. Privacy protection required extremely careful considerations due tomultimodality of the rich smartphone data. We already described the necessary counter-measures both when the smartphone data was originally collected and when it was laterreleased to the research community. In practice, this required both technical countermea-sures and agreement-based privacy protection. In that manner it was possible to achievean appropriate balance between the necessary privacy protection, while simultaneouslymaintaining the richness of the data for research purposes.
When it comes to lessons learned in respect to the privacy aspects of the process, twoissues are worth emphasizing. First, the workload associated with privacy protectionshould not be underestimated. For example, the manual location obfuscation processwas time-consuming and had to be split among all members of the core team. Second,we learned that despite serious attempts in adhering to the privacy protection principles,some of the research findings can nevertheless be associated with privacy issues. Forexample, when reviewing the challenge entries, some of the submissions had conductedanalysis at the level of individuals rather than at population level. Therefore, the coreteam has an important role to play not only when providing access to the data, butalso when inspecting the outcomes of the analysis across the various participating teams.Implementation of a privacy review process in regard to publications based on the mo-bility data is highly recommended to ensure maximal elimination of unintentional andaccidental privacy issues.
27

In addition to implementing this type of privacy review, we also learned that a specificphilosophy is needed when the responsibility that the core team has adopted toward thedata collection participants is transferred to the extended network of MDC researchers.All data users need to have an understanding of what is acceptable and they need to beresponsible and respect the underlying principles. Therefore, the core team has an essen-tial educative role in establishing such principles and guidelines, articulating clearly whatis acceptable from the privacy point of view. It is important to use concrete examples toillustrate the principles in a clear and understandable manner. Also, the guidelines haveto play a prominent role in the overall communications toward the participating teams.
Legal aspects. The collection of rich mobile data meant that severe responsibility to-wards the data collection campaign participants had been taken. Therefore, an appropri-ate legal framework had to be established to transfer this responsibility to the researchersusing the shared data. In our context, several data sharing frameworks were prepared:one for initial institutional data sharing partners before the MDC, one for MDC partici-pation, and finally one for extended use of the MDC data after the challenge itself. Thisall creates a significant burden of legal work which should not be underestimated whenfurther such initiatives are planned or prepared. As a consequence of global coverageof the initiatives and different legislation in different parts of the world, some organiza-tions came up with special wishes and modification requirements which easily leads toiterative interactions and high investment with respect to usage of legal resources. Suchinteractions, however, offer also one channel to communicate the related responsibilitiesand importance of underlying privacy matters. On the other hand, it is essential thatthe understanding about the responsibilities propagates among the involved researchers,not only in the legal teams of the organizations.
8.4. Other implications
Already so far the Mobile Data Challenge has produced interesting findings and multi-disciplinary scientific advances. The contributions to the MDC addressed various inter-esting angles from the perspective of mobile computing research, like investigations onpredictability of human behavior patterns or opportunities to share/capture data basedon human mobility, visualization techniques for complex data as well as correlation be-tween human behavior and external environmental variables, such as weather patterns.
On the other hand, the establishment of a community around this particular data sethas already been an achievement as such. It is too early to make a final assessmentregarding the overall scientific findings less than a year after the MDC. Many of theparticipating teams have continued their efforts, and extended outcomes and completenew research tracks will be reported in the open literature during the months and yearsto come.
However, one of the observations already at this point is that the range of topics as-sociated with the submissions was surprisingly wide and multidisciplinary, consequentlyimposing challenges on the review process. While the dedicated tasks were quite strictlyassociated with using machine learning techniques, the open challenge entries variedwidely. The reviewers needed, therefore, to assess a range of disciplines, from computerscience to social sciences, from visualization and HCI to geography. This requires multi-disciplinary review teams to ensure a fair and reliable review process independent of thescientific angle of the analysis.
28

We also noticed that most of the research was conducted at a theoretical level. Anapplied angle, especially in regard to user experience aspects, was less frequently encoun-tered. More specifically, not many challenge entries took a stance on what would be themanifestation of a given pattern based on mobility data, in terms of concrete applicationor service running on the mobile phone, and bringing concrete benefits to the end users.One way of supporting such applied, UX centric angle in the future would be to extendthe challenge more explicitly to design and HCI communities.
9. Conclusions
This paper described a systematic flow of research over four years, targeting to createand provide unique longitudinal smartphone data for wide use by the research community.In this paper we motivated our initiative and summarized the key aspects of the LausanneData Collection Campaign (LDCC) in which the rich smartphone data was collected fromaround 200 individuals over more than a year. We also described in further details theMobile Data Challenge (MDC) by Nokia, which was a data analytics contest making thisdata widely available to the research community. The data collection campaign run in2009-2011 whereas the challenge was organized in 2011-2012.
Collecting such data requires extensive effort and underlying investments, which oftenmeans that data sets are available for researchers only in the limited manner. This hasrecently generated discussions about the basic principles of science in connection withBig Data driven research. Verification of claimed scientific findings can be challenging ifaccess to data is limited. Protecting privacy of individuals behind the data is obviouslythe key reason for access and usage limitations of Big Data.
We demonstrated that data sharing with the research community and open innovationmomentum around common resource are both possible. Achieving that required a holisticapproach on privacy throughout the whole flow of design and execution of the LDCC andMDC initiatives. Privacy protection requires extremely careful considerations. In thispaper we described the necessary countermeasures both when the smartphone data wasoriginally collected and when it was later released to the research community. In practicethis required both technical countermeasures and agreement based privacy protection.
Running the LDCC and MDC required significant long-term commitment from theteams behind these initiatives. This commitment was a key to build extended initiativesfor data sharing by utilizing the knowledge accumulated over several years. Furthermore,the commitment related to this data and the community established around it remainsstrong. In practice, the dataset continues to be accessible both for MDC participants andnew users through a Data Sharing Agreement framework [65] (managed by Idiap sinceearly 2013). Based on our experience, if something similar is planned by other researchorganizations in the future, the overall effort required should not be underestimated inthe planning phase, and the long-term commitment of the organizing teams needs to beensured. Otherwise, the quality level of execution might be risked, which might haveundesired impact e.g. on privacy aspects.
If we started organizing the MDC initiative again, based on our experience today, wewould to a large extent repeat the same design choices and other decisions. But if westarted to design a successor initiative for the MDC now, taking into account the existingcommunity and past history, the expansion of the community towards new disciplineswould be an interesting option. In practice, this would be possible by scoping the new
29

challenge increasingly towards the HCI community. An Open Track format together withthe fresh angle of the new community could potentially lead to radically new innovationsaround the same data.
Already so far the Mobile Data Challenge has produced interesting findings and multi-disciplinary scientific advances. The contributions to the MDC addressed many angles inmobile computing. The materials presented in the MDC workshop are available in [11].Obviously the established community around this data will continue producing novelfindings. Therefore, we plan to maintain an updated list of the most important LDCCand MDC research outcomes in the future. The initiatives described in this paper createa solid basis for future innovation. This is not only because of open data sharing, butalso because the MDC provided a set of benchmarks with accurate documentation.
Finally, the momentum around MDC is expected to continue and expand. The MDCresources remain valid to analyze various research questions in the future, even though thedata was originally collected in 2009-2011. Many of the underlying behavioral patternscaptured by the data do not change quickly; Only the details related to application usagemight be more device-specific, and therefore outdate in a shorter time. The contestformat of the MDC limited the interactions among the participating teams during thecontest itself. On the other hand, now when the community continues their researcharound the same data, a community spirit is highly encouraged. In practice, this canmean early and open sharing of the research findings and shared tools for data processingand visualization. We could facilitate that kind of momentum by arranging the neededchannels.
In conclusion, we look forward to seeing further innovations from the community work-ing together.
10. Acknowledgments
We sincerely thank all the volunteers in the LDCC initiative for their participationand contributed data, and all the researchers who responded to our open invitationto sign up and participate in the MDC. We also thank Niko Kiukkonen for his keyrole with the arrangements of the Lausanne Data Collection Campaign. David Racz’spioneering work with the Nokoscope and Simple Context data collection systems is alsogratefully acknowledged. Additionally we thank Emma Doree, Antti Rouhesmaa, andvarious other people from Nokia for their contributions to the arrangements of the MobileData Challenge.
References
[1] P. Ross, Top 11 technologies of the decade, Spectrum, IEEE 48 (2011) 27–63.[2] N. Eagle, A. Pentland, D. Lazer, Inferring friendship network structure by using mobile phone data,
Proceedings of the National Academy of Sciences 106 (2009) 15274–15278.[3] M. C. Gonzalez, C. A. Hidalgo, A.-L. Barabasi, Understanding individual human mobility patterns,
Nature 453 (2008) 779–782.[4] G. Chittaranjan, J. Blom, D. Gatica-Perez, Mining large-scale smartphone data for personality
studies, Personal and Ubiquitous Computing 17 (2013) 433–450.[5] S. Isaacman, R. Becker, R. Caceres, S. Kobourov, M. Martonosi, J. Rowland, A. Varshavsky,
Identifying important places in people’s lives from cellular network data, in: Proc. Int. Conf. onPervasive Computing, San Francisco, 2011.
30

[6] L. Backstrom, E. Sun, C. Marlow, Find me if you can: improving geographical prediction withsocial and spatial proximity, in: Proc. World Wide Web Conf. (WWW), 2010.
[7] ”http://crawdad.cs.dartmouth.edu/”, 2012.[8] ”http://privacybydesign.ca/”, 2012.[9] I. Aad, V. Niemi, NRC Data Collection and the Privacy by Design Principles, in: PhoneSense,
2011.[10] J. Laurila, D. Gatica-Perez, I. Aad, J. Blom, O. Bornet, T.-M.-T. Do, O. Dousse, J. Eberle, M. Mi-
ettinen, The mobile data challenge: Big data for mobile computing research, in: Proc. Mobile DataChallenge by Nokia Workshop, in conjunction with Int. Conf. on Pervasive Computing, Newcastle,UK, 2012.
[11] ”http://research.nokia.com/mdc”, 2012.[12] R. Becker, R. Caceres, K. Hanson, S. Isaacman, J. M. Loh, M. Martonosi, J. Rowland, S. Ur-
banek, A. Varshavsky, C. Volinsky, Human mobility characterization from cellular network data,Communications of the ACM 56 (2013) 74–82.
[13] V. D. Blondel, M. Esch, C. Chan, F. Clerot, P. Deville, E. Huens, F. Morlot, Z. Smoreda, C. Ziem-licki, Data for development: the d4d challenge on bile phone data, arXiv preprint arXiv:1210.0137(2012).
[14] I. Guyon, V. Lemaire, M. Boulle, G. Dror, D. Vogel, Analysis of the kdd cup 2009: Fast scoring ona large orange customer database (2009).
[15] S. Consolvo, D. W. McDonald, T. Toscos, M. Y. Chen, J. Froehlich, B. Harrison, P. Klasnja,A. LaMarca, L. LeGrand, R. Libby, et al., Activity sensing in the wild: a field trial of ubifit garden,in: Proceedings of the SIGCHI Conference on Human Factors in Computing Systems, ACM, 2008,pp. 1797–1806.
[16] CENS/UCLA, Participatory sensing / urban sensing projects, ”http://research.cens.ucla.edu/”, 2012.
[17] I. Berkeley, Urban atmospheres, ”http://www.urban-atmospheres.net/”, 2012.[18] J. Paek, J. Kim, R. Govindan, Energy-efficient rate-adaptive gps-based positioning for smartphones,
in: Proceedings of the 8th international conference on Mobile systems, applications, and services,ACM, 2010, pp. 299–314.
[19] Y. Wang, J. Lin, M. Annavaram, Q. A. Jacobson, J. Hong, B. Krishnamachari, N. Sadeh, Aframework of energy efficient mobile sensing for automatic user state recognition, in: Proceedingsof the 7th international conference on Mobile systems, applications, and services, ACM, 2009, pp.179–192.
[20] ”https://www.sensenetworks.com”, 2012.[21] U. Berkeley/Nokia/NAVTEQ, Mobile millennium, ”http://traffic.berkeley.edu”, 2012.[22] A. Thiagarajan, L. Ravindranath, K. LaCurts, S. Madden, H. Balakrishnan, S. Toledo, J. Eriksson,
Vtrack: accurate, energy-aware road traffic delay estimation using mobile phones, in: Proceedingsof the 7th ACM Conference on Embedded Networked Sensor Systems, ACM, 2009, pp. 85–98.
[23] N. Eagle, A. Pentland, Reality mining: sensing complex social systems, Personal and ubiquitouscomputing 10 (2006) 255–268.
[24] N. Kawaguchi, H. Watanabe, T. Yang, N. Ogawa, Y. Iwasaki, K. Kaji, T. Terada, K. Murao,H. Hada, S. Inoue, et al., Hasc2012corpus: Large scale human activity corpus and its application,http://hasc.jp/en (2012).
[25] N. Kiukkonen, J. Blom, O. Dousse, D. Gatica-Perez, J. Laurila, Towards rich mobile phone datasets:Lausanne data collection campaign, in: Proc. Int. Conf. on Pervasive Services, Berlin, 2010.
[26] R. Montoliu, D. Gatica-Perez, Discovering human places of interest from multimodal mobile phonedata, in: Proc. Int. Conf. on Mobile and Ubiquitous Multimedia, Limassol, 2010.
[27] M. Przybocki, A. Martin, Nist speaker recognition evaluation-1997, in: Proceedings of RLA2C,1998, pp. 120–123.
[28] A. Smeaton, P. Over, W. Kraaij, Evaluation campaigns and trecvid, in: Proceedings of the 8thACM international workshop on Multimedia information retrieval, ACM, 2006, pp. 321–330.
[29] J. Bennett, S. Lanning, The netflix prize, in: Proceedings of KDD Cup and Workshop, volume2007, 2007, p. 35.
[30] R. Bell, J. Bennett, Y. Koren, C. Volinsky, The million dollar programming prize, Spectrum, IEEE46 (2009) 28–33.
[31] T. Do, D. Gatica-Perez, Contextual conditional models for smartphone-based human mobilityprediction, in: Proc. ACM Int. Conf. on Ubiquitous Computing, Pittsburgh, 2012.
[32] J. Blumenstock, D. Gillick, N. Eagle, Who’s calling? demographics of mobile phone use in rwanda,in: Proc. AAAI Artificial Intelligence for Development, AAAI, 2010.
31

[33] ”http://en.wikipedia.org/wiki/MAC_address”, 2012.[34] D. Schulz, S. Bothe, C. Korner, Human mobility from gsm data-a valid alternative to gps, in: Proc.
Mobile Data Challenge by Nokia Workshop, in conjunction with Int. Conf. on Pervasive Computing,Newcastle, UK, 2012.
[35] M. De Domenico, A. Lima, M. Musolesi, Interdependence and predictability of human mobilityand social interactions, in: Proc. Mobile Data Challenge by Nokia Workshop, in conjunction withInt. Conf. on Pervasive Computing, Newcastle, UK, 2012.
[36] J. Frank, S. Mannor, D. Precup, Generating storylines from sensor data, in: Proc. Mobile DataChallenge by Nokia Workshop, in conjunction with Int. Conf. on Pervasive Computing, Newcastle,UK, 2012.
[37] R. McGrath, C. Coffey, A. Pozdnoukhov, Habitualisation: localisation without location data, in:Proc. Mobile Data Challenge by Nokia Workshop, in conjunction with Int. Conf. on PervasiveComputing, Newcastle, UK, 2012.
[38] B. Hoferlin, M. Hoferlin, J. Rauchle, Visual analytics of mobile data, in: Proc. Mobile DataChallenge by Nokia Workshop, in conjunction with Int. Conf. on Pervasive Computing, Newcastle,UK, 2012.
[39] A. Slingsby, R. Beecham, J. Wood, Visual analysis of social networks in space and time, in: Proc.Mobile Data Challenge by Nokia Workshop, in conjunction with Int. Conf. on Pervasive Computing,Newcastle, UK, 2012.
[40] A. Skupin, H. J. Miller, Nokia MDC atlas: An exploration of mobile phone users, land cover, time,and space, in: Proc. Mobile Data Challenge by Nokia Workshop, in conjunction with Int. Conf. onPervasive Computing, Newcastle, UK, 2012.
[41] A. Idrissov, M. A. Nascimento, A trajectory cleaning framework for trajectory clustering, in: Proc.Mobile Data Challenge by Nokia Workshop, in conjunction with Int. Conf. on Pervasive Computing,Newcastle, UK, 2012.
[42] F. Hartmann, C. P. Mayer, I. Baumgart, Mobreduce: Reducing state complexity of mobility traces,in: Proc. Mobile Data Challenge by Nokia Workshop, in conjunction with Int. Conf. on PervasiveComputing, Newcastle, UK, 2012.
[43] M. Niinimaki, T. Niemi, Where do people go when it rains?, in: Proc. Mobile Data Challenge byNokia Workshop, in conjunction with Int. Conf. on Pervasive Computing, Newcastle, UK, 2012.
[44] M. Gustarini, K. Wac, Estimating people perception of intimacy in daily life from context data col-lected with their mobile phone, in: Proc. Mobile Data Challenge by Nokia Workshop, in conjunctionwith Int. Conf. on Pervasive Computing, Newcastle, UK, 2012.
[45] A. Munjal, T. Mota, T. Camp, Exploring social interactions via multi-modal learning, in: Proc.Mobile Data Challenge by Nokia Workshop, in conjunction with Int. Conf. on Pervasive Computing,Newcastle, UK, 2012.
[46] S. A. Muhammad, K. V. Laerhoven, Discovery of user groups within mobile data, in: Proc.Mobile Data Challenge by Nokia Workshop, in conjunction with Int. Conf. on Pervasive Computing,Newcastle, UK, 2012.
[47] J. McInerney, S. Stein, A. Rogers, N. R. Jennings, Exploring periods of low predictability in dailylife mobility, in: Proc. Mobile Data Challenge by Nokia Workshop, in conjunction with Int. Conf.on Pervasive Computing, Newcastle, UK, 2012.
[48] S. Barmpounakis, K. Wac, Deriving connectivity and application usage patterns from longitudinalmobile phone usage data, in: Proc. Mobile Data Challenge by Nokia Workshop, in conjunctionwith Int. Conf. on Pervasive Computing, Newcastle, UK, 2012.
[49] C. Tan, Q. Liu, E. Chen, H. Xiong, Prediction for mobile application usage patterns, in: Proc.Mobile Data Challenge by Nokia Workshop, in conjunction with Int. Conf. on Pervasive Computing,Newcastle, UK, 2012.
[50] B. Keller, P. von Bergen, S. Welten, On the feasibility of opportunistic ad hoc music sharing,in: Proc. Mobile Data Challenge by Nokia Workshop, in conjunction with Int. Conf. on PervasiveComputing, Newcastle, UK, 2012.
[51] X. Wu, K. N. Brown, C. J. Sreenan, Analysis of smart phone user mobility traces for opportunisticdata collection, in: Proc. Mobile Data Challenge by Nokia Workshop, in conjunction with Int.Conf. on Pervasive Computing, Newcastle, UK, 2012.
[52] S. VanSyckel, D. Schfer, G. Schiele, C. Becker, Evaluation of an epidemic information distributionscheme in mobile ad-hoc networks, in: Proc. Mobile Data Challenge by Nokia Workshop, inconjunction with Int. Conf. on Pervasive Computing, Newcastle, UK, 2012.
[53] S. Michaelis, N. Piatkowski, K. Morik, Predicting next network cell ids for moving users withdiscriminative and generative models, in: Proc. Mobile Data Challenge by Nokia Workshop, in
32

conjunction with Int. Conf. on Pervasive Computing, Newcastle, UK, 2012.[54] Z. Wang, M. A. Nascimento, M. MacGregor, On the analysis of periodic mobility behaviour, in:
Proc. Mobile Data Challenge by Nokia Workshop, in conjunction with Int. Conf. on PervasiveComputing, Newcastle, UK, 2012.
[55] R. Montoliu, A. Martinez-Uso, J. Martinez-Sotoca, Semantic place prediction by combining smartbinary classifiers, in: Proc. Mobile Data Challenge by Nokia Workshop, in conjunction with Int.Conf. on Pervasive Computing, Newcastle, UK, 2012.
[56] C.-M. Huang, J. J.-C. Ying, V. S. Tseng, Mining users behaviors and environments for semanticplace prediction, in: Proc. Mobile Data Challenge by Nokia Workshop, in conjunction with Int.Conf. on Pervasive Computing, Newcastle, UK, 2012.
[57] Y. Zhu, E. Zhong, B. Wu, Feature engineering for place category classification, in: Proc. Mo-bile Data Challenge by Nokia Workshop, in conjunction with Int. Conf. on Pervasive Computing,Newcastle, UK, 2012.
[58] H. Gao, J. Tang, H. Liu, Mobile location prediction in spatio-temporal context, in: Proc. Mo-bile Data Challenge by Nokia Workshop, in conjunction with Int. Conf. on Pervasive Computing,Newcastle, UK, 2012.
[59] J. Wang, B. Prabhala, Periodicity based next place prediction, in: Proc. Mobile Data Challengeby Nokia Workshop, in conjunction with Int. Conf. on Pervasive Computing, Newcastle, UK, 2012.
[60] V. Etter, M. Kafsi, E. Kazemi, Been there, done that: What your mobility traces reveal about yourbehavior, in: Proc. Mobile Data Challenge by Nokia Workshop, in conjunction with Int. Conf. onPervasive Computing, Newcastle, UK, 2012.
[61] S. Brdar, D. Culibrk, V. Crnojevic, Demographic attributes prediction on the real-world mobiledata, in: Proc. Mobile Data Challenge by Nokia Workshop, in conjunction with Int. Conf. onPervasive Computing, Newcastle, UK, 2012.
[62] S. Mohrehkesh, S. Ji, T. Nadeem, M. C. Weigle, Demographic prediction of mobile user from phoneusage, in: Proc. Mobile Data Challenge by Nokia Workshop, in conjunction with Int. Conf. onPervasive Computing, Newcastle, UK, 2012.
[63] K. Mo, B. Tan, E. Zhong, Your phone understands you, in: Proc. Mobile Data Challenge by NokiaWorkshop, in conjunction with Int. Conf. on Pervasive Computing, Newcastle, UK, 2012.
[64] E. Malmi, T. Do, D. Gatica-Perez, Checking in or checked in: Comparing large-scale manual andautomatic location disclosure patterns, in: Proc. Int. Conf. on Mobile and Ubiquitous Multimedia,Ulm, 2012.
[65] ”http://www.idiap.ch/project/mdc/”, 2013.
33