Frano Barbir - Ruđer Bošković Institute · PDF filelocal electrochemical impedance...
68
Transcript of Frano Barbir - Ruđer Bošković Institute · PDF filelocal electrochemical impedance...


Frano Barbir Pictorial Resume
energy partners

Diagnosis noun
Investigation or analysis of the cause or
nature of a condition, situation or problem
Diagnostic(s) noun
the art or practice of diagnosis

Diagnostics in fuel cell development process

design
fabricate
test
model
Knowledge:
materials
processes
interactions
requirements
diagnostics
Should
it work?
Does
it work?
Diagnostics in fuel cell development process
Diagnostics in control development process

Diagnostics in fuel cell development process
Diagnostics in control development process
Diagnostics in operation

controller
fuel cell
control
element
measurement
sensor/
transmitter
process
variable
manipulated
variable
controller
output
signal
measured
value
disturbances
error
set point
measured
process
variable
signal
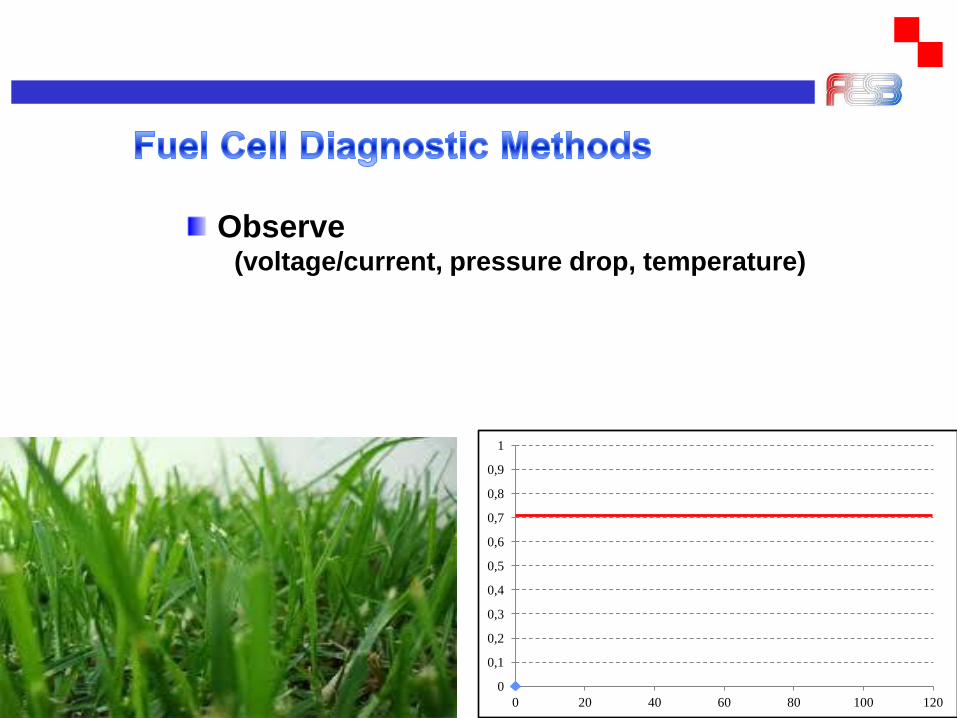
Observe (voltage/current, pressure drop, temperature)
0
0,1
0,2
0,3
0,4
0,5
0,6
0,7
0,8
0,9
1
0 20 40 60 80 100 120

Observe (voltage/current, pressure drop, temperature)
Change a parameter and compare

First fuel cell law:
One cannot change only one parameter in a fuel cell —
change of one parameter causes a change in at least
two other parameters, and at least one of them has an
opposite effect of the one expected to be seen.
F. Barbir, PEM Fuel Cells Theory and Practice, Elsevier/Academic Press, 2005

nm m mm m
Fuel cells: Problems at different scales
12700 km 12.7 km 12.7 m 12.7 mm
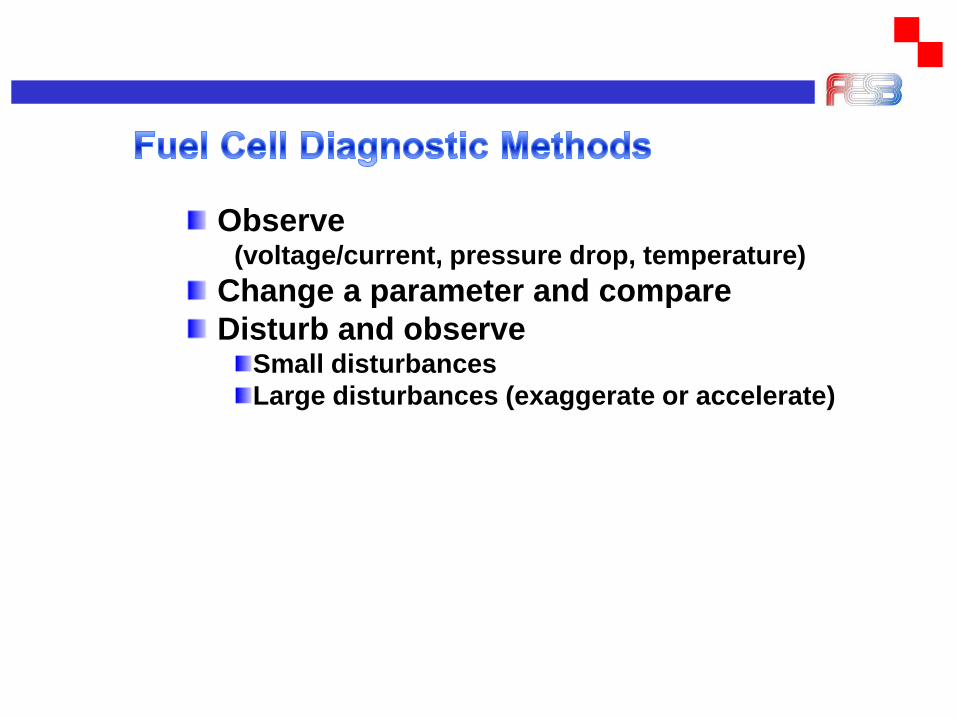
Observe (voltage/current, pressure drop, temperature)
Change a parameter and compare
Disturb and observe Small disturbances
Large disturbances (exaggerate or accelerate)

controller
fuel cell
control
element(s)
diagnostics
process
variable(s)
manipulated
variable(s)
controller
output
signal(s) controller
action
signal
desired/expected
state of health
diagnosis
measured
values
disturbances

Diagnostics in fuel cell development process
Diagnostics in control development process
Diagnostics in operation
Post mortem diagnostics

Online
Offline
Post mortem

Electrochemical techniques Polarization curve
Current interruption
Electrochemical Impedance
Spectroscopy
Cyclic Voltammetry
CO Stripping Voltammetry
Linear Sweep Voltammetry
Current Distribution Mapping Partial MEA
Segmented Cells
Species Distribution Mapping Pressure Drop Measurements
Gas Composition Analysis
Neutron Imaging
Magnetic Resonance Imaging
X-ray Imaging
Optically Transparent Fuel Cells
Embedded Sensors
Temperature Distribution Mapping IR Transparent Fuel Cells
Embedded Sensors

Polarization curve
Polarization curve hysteresis
Comparative polarization curves
Current interrupt
AC impedance spectroscopy
Pressure drop
Current density mapping
Temperature mapping
Flow visualization
Neutron/X-Ray imaging

0
0.2
0.4
0.6
0.8
1
1.2
0 500 1000 1500 2000
current density (mA/cm²)
cell
po
ten
tial
(V)
activation losses
resistance losses
mass transport
losses resulting V vs. i curve
theoretical (ideal) voltage

0
0.2
0.4
0.6
0.8
1
1.2
0 500 1000 1500 2000
current density (mA/cm²)
ce
ll p
ote
nti
al
(V)
normal polarization
curve
higher resistance
drying?
mass transport problems
flooding?
hgher activation losses

Data should be taken at multiple current or voltage points.
Typical points would be open circuit and 5 or 6 points between 600 mV/cell and
850 mV/cell,
15 minutes dwell at each point
The data from the last five (5) minutes should be averaged and then plotted as
average current versus average voltage.
Protocol on Fuel Cell Components Testing

Polarization curve sweep
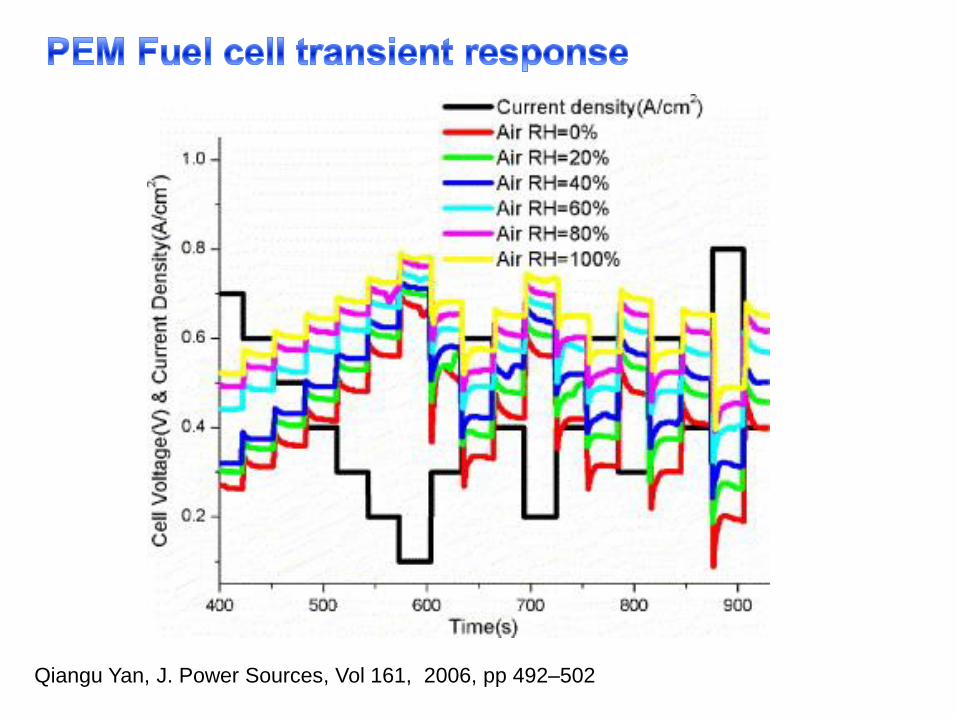
Qiangu Yan, J. Power Sources, Vol 161, 2006, pp 492–502

Presented at IECEC, Portsmouth, VA, August 12, 2003
Static Feed UNIGEN Cycle Test (Total 8/1/03 3:00 PM - 147 cycles)Electrolysis: 60 min @ 200 ASF; Fuel Cell: 40 min @ 300 ASF
160 F, 50-75 psig
0.50
0.70
0.90
1.10
1.30
1.50
1.70
1.90
2.10
2.30
2.50
50.00 50.50 51.00 51.50 52.00 52.50 53.00 53.50 54.00 54.50 55.00
Elapsed Time (hr)
Ce
ll V
olt
ag
e/D
iffe
ren
tia
l P
res
su
re
> 100 LEO cycles
Fuel Cell
40 min
Electrolysis
60 min

M. Weiland, Int. J. Hydrogen Energy,
2012, in print


Polarization curve
Polarization curve hysteresis
Comparative polarization curves
Current interrupt
AC impedance spectroscopy
Pressure drop
Current density mapping
Temperature mapping
Flow visualization
Neutron/X-Ray imaging

Polarization curve at cell temperature 80°C
anode/cathode humidifier temperatures 80/60°C
hydrogen/air, 30 psig, H2 stoich 1.5, air stoich 5.0
0.3
0.4
0.5
0.6
0.7
0.8
0.9
1
ce
ll p
ote
nti
al
(V
)
0 200 400 600 800 1000 current density (mA/cm²)

Polarization curve
Polarization curve hysteresis
Comparative polarization curves
Current interrupt
AC impedance spectroscopy
Pressure drop
Current density mapping
Temperature mapping
Flow visualization
Neutron/X-Ray imaging

Source: T.P. Ralph and M.P. Hogarth, Platinum Metals Review, Vol. 46, No. 1, pp. 3-14, 2002

Polarization curve
Polarization curve hysteresis
Comparative polarization curves
Current interrupt
AC impedance spectroscopy
Pressure drop
Current density mapping
Temperature mapping
Flow visualization
Neutron/X-Ray imaging

A
Current interrupt method for measurement of fuel cell resistance
Fuel cell Load
Digital osciloscope
voltage
time
Immediate rise in
voltage, VR
Slow rise to OCV
Vact
Time of current interrupt
Cell voltage before
current interrupt
OCV

Current interrupt method for measurement of fuel cell resistance
voltage
time
Immediate rise in
voltage, VR
Time of current interrupt
Cell voltage before
current interrupt
OCV
discrete points
extrapolated straight lines
ringing effect

Polarization curve
Polarization curve hysteresis
Comparative polarization curves
Current interrupt
AC impedance spectroscopy
Pressure drop
Current density mapping
Temperature mapping
Flow visualization
Neutron/X-Ray imaging


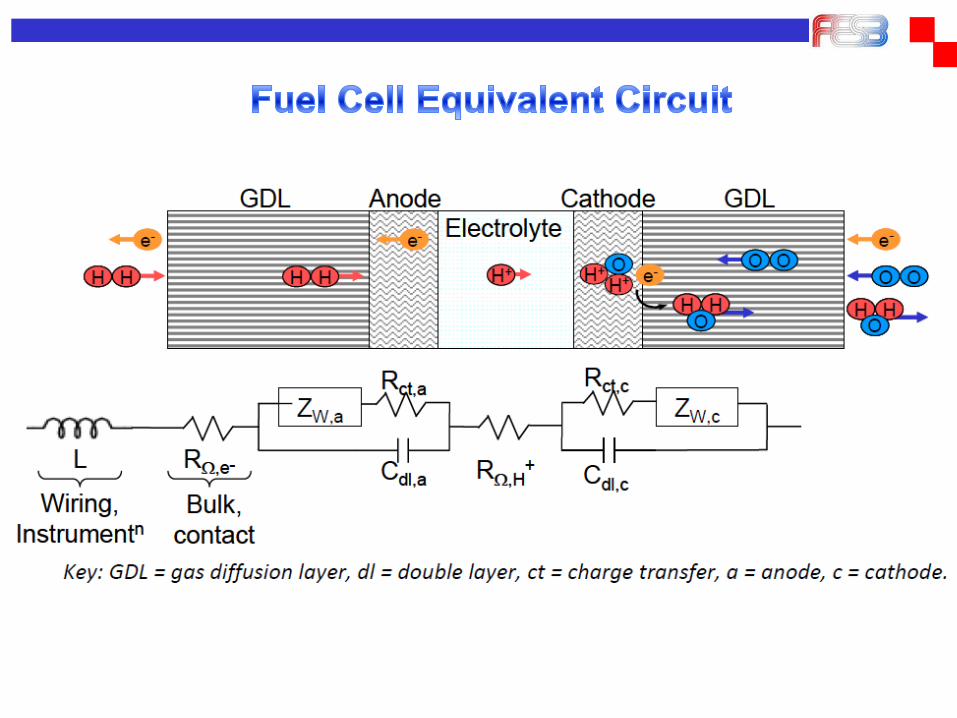

Nyquist and Bode plots

R
HF Resistance


Polarization curve
Polarization curve hysteresis
Comparative polarization curves
Current interrupt
AC impedance spectroscopy
Pressure drop
Current density mapping
Temperature mapping
Flow visualization
Neutron/X-Ray imaging

0.2
0.3
0.4
0.5
0.6
0.7
2000 2500 3000 3500 4000 4500 5000
Time (seconds)
Ce
ll P
ote
ntia
l (V
olts),
Re
sis
tan
ce
(m
iliO
hm
-cm
2),
Pre
ssu
re D
rop
(10
kP
a)
20
30
40
50
60
70
80
Te
mp
era
ture
(oC
)
Pressure Drop
Humidification
Temperature
Stack Temperature
Cell Voltage
Resistance
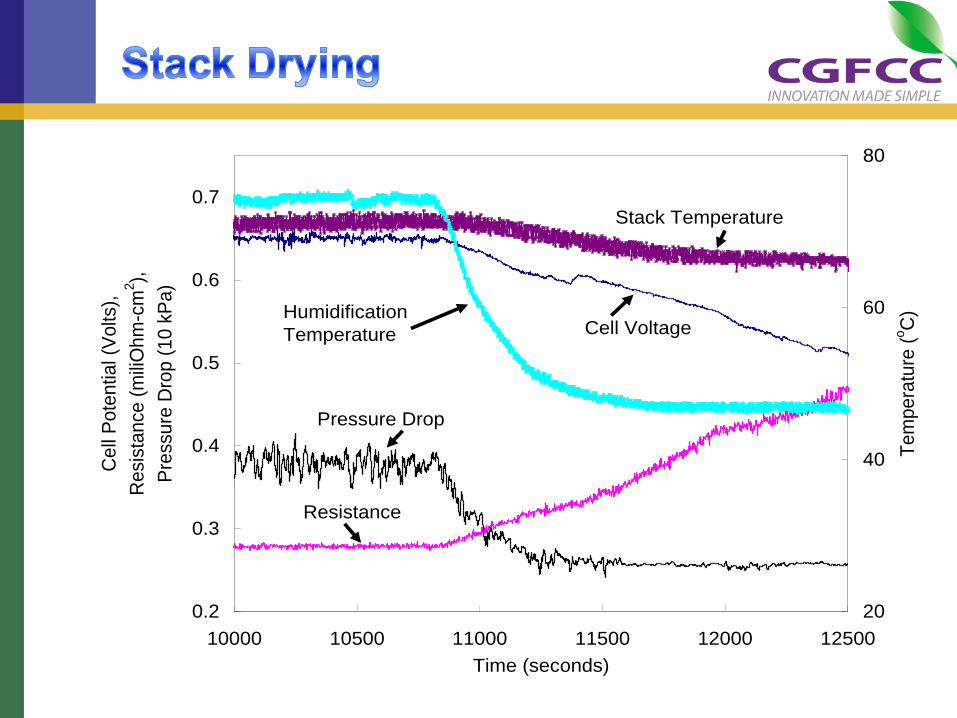
0.2
0.3
0.4
0.5
0.6
0.7
10000 10500 11000 11500 12000 12500
Time (seconds)
Cell
Pote
ntial (V
olts),
Resis
tance (
mili
Ohm
-cm
2),
Pre
ssure
Dro
p (
10 k
Pa)
20
40
60
80
Tem
pera
ture
(oC
)Humidification
Temperature
Stack Temperature
Cell Voltage
Pressure Drop
Resistance

Polarization curve
Polarization curve hysteresis
Comparative polarization curves
Current interrupt
AC impedance spectroscopy
Pressure drop
Current density mapping
Temperature mapping
Flow visualization
Neutron/X-Ray imaging

S.J.C. Cleghorn, C.R. Derouin, M.S. Wilson,
and S. Gottesfeld, A Printed Circuit Board
Approach to Measuring Current Distribution in
a Fuel Cell, J. Appl. Electrochem., 1997

L
o
k
a
l
e
M
e
s
s
u
n
g
e
n
local current density measurement
dynamic > 2000 measurement /s
local temperature measurement
local electrochemical
impedance spectroscopy (EIS)
4 mm

D. Derteisen et al., Int. J. Hydrogen Energy,
Vol 37, 2012, pp. 7736–7744

D. Derteisen et al., Int. J. Hydrogen Energy,
Vol 37, 2012, pp. 7736–7744

Polarization curve
Polarization curve hysteresis
Comparative polarization curves
Current interrupt
AC impedance spectroscopy
Pressure drop
Current density mapping
Temperature mapping
Flow visualization
Neutron/X-Ray imaging

iR camera

Temperature Mapping with iR Camera
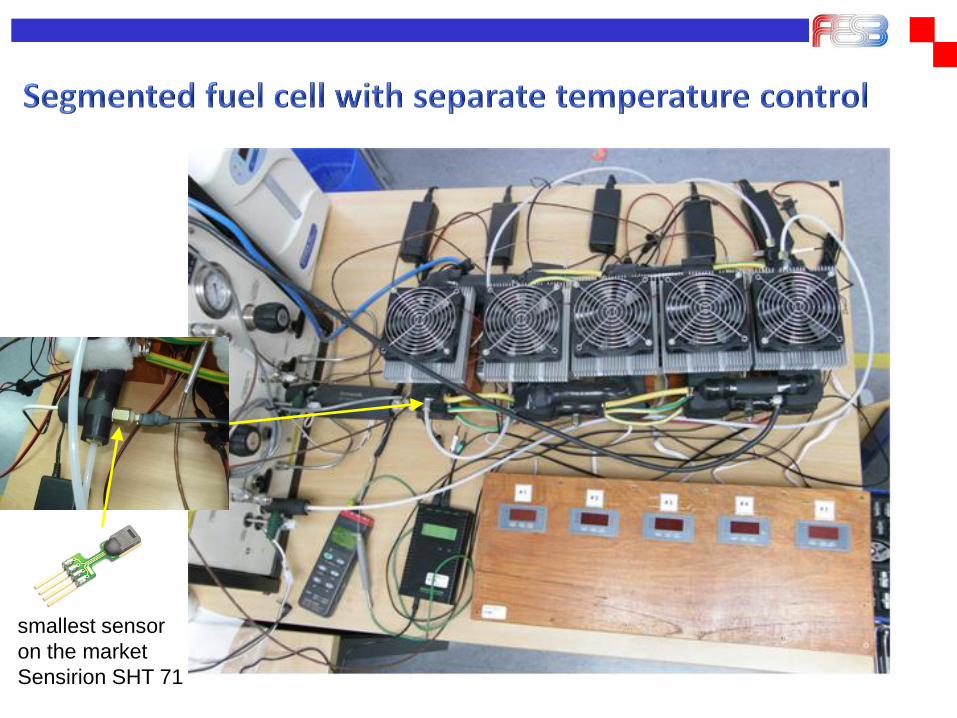
smallest sensor
on the market
Sensirion SHT 71

Polarization curve
Polarization curve hysteresis
Comparative polarization curves
Current interrupt
AC impedance spectroscopy
Pressure drop
Current density mapping
Temperature mapping
Flow visualization
Neutron/X-Ray imaging

X Liu, et al. Water flooding and two-
phase flow in cathode channels of
proton exchange membrane fuel cells,
Journal of Power Sources,
Straight Channels
Interdigitated Flow Field

D. Lee, J. Bae, Visualization of flooding in a single cell and stacks by using a newly-
designed transparent PEMFC International Journal of Hydrogen Energy, Vol. 37,
No.1, 2012, pp 422–435

S Basu et al., J Power Sources, Vol 162, 2006, pp 286–293

Inukai, J. et al. Direct Visualization of Oxygen Distribution in Operating Fuel Cells.
Angew. Chem. Int. Ed. 47, 2792–2795 (2008).
K Takada et al. J. Power Sources , Vol 196, 2011, Pages 2635–2639

Polarization curve
Polarization curve hysteresis
Comparative polarization curves
Current interrupt
AC impedance spectroscopy
Pressure drop
Current density mapping
Temperature mapping
Flow visualization
Neutron/X-Ray imaging

Real time detection
of liquid water inside
an operating fuel cell


A. Turhan, K. Heller, J.S. Brenizer and M.M. Mench, Passive control of liquid water storage and distribution
in a PEFC through flow-field design, Journal of Power Sources 180 (2) (2008), pp. 773–783.
at Penn State University

H. Markötter et al., Int. J. Hydrogen Energy,
Vol 37, 2012, pp. 7757–7761

P. Deevanhxay, Electrochemistry Comm., 2012
http://dx.doi.org/10.1016/j.elecom.2012.05.028,

Diagnostics – important aspect of fuel cell R&D
Limited number of diagnostic methods applicable
for fuel cell control purposes
Definition of optimum performance must include
life time
In order to achieve optimum performance diagnostics
is crucial for prognostics and health management
Conclusions

PEM Fuel Cells: Theory and Practice
More information about PEM fuel cells:
Frano Barbir
PEM Fuel Cells: Theory and Practice
Elsevier/Academic Press, 2005
ISBN 978-0-12-078142-3
Available from:
www.elsevier.com
www.amazon.com
www.barnesandnoble.com
Written as a textbook
for engineering students.
Used at hundreds of universities
In U.S., China, India, Korea, Iran,
Germany, Croatia …
New updated edition coming out 2012!