Fourth-Quarter & Full-Year 2020 Financial Results
25
Fourth-Quarter & Full-Year 2020 Financial Results Mark Costa, Board Chair & CEO Willie McLain, SVP & CFO January 28 th , 2021 1
Transcript of Fourth-Quarter & Full-Year 2020 Financial Results
Fourth-Quarter & Full-Year
2020 Financial Results
Mark Costa, Board Chair & CEO
Willie McLain, SVP & CFO
January 28th, 2021
1
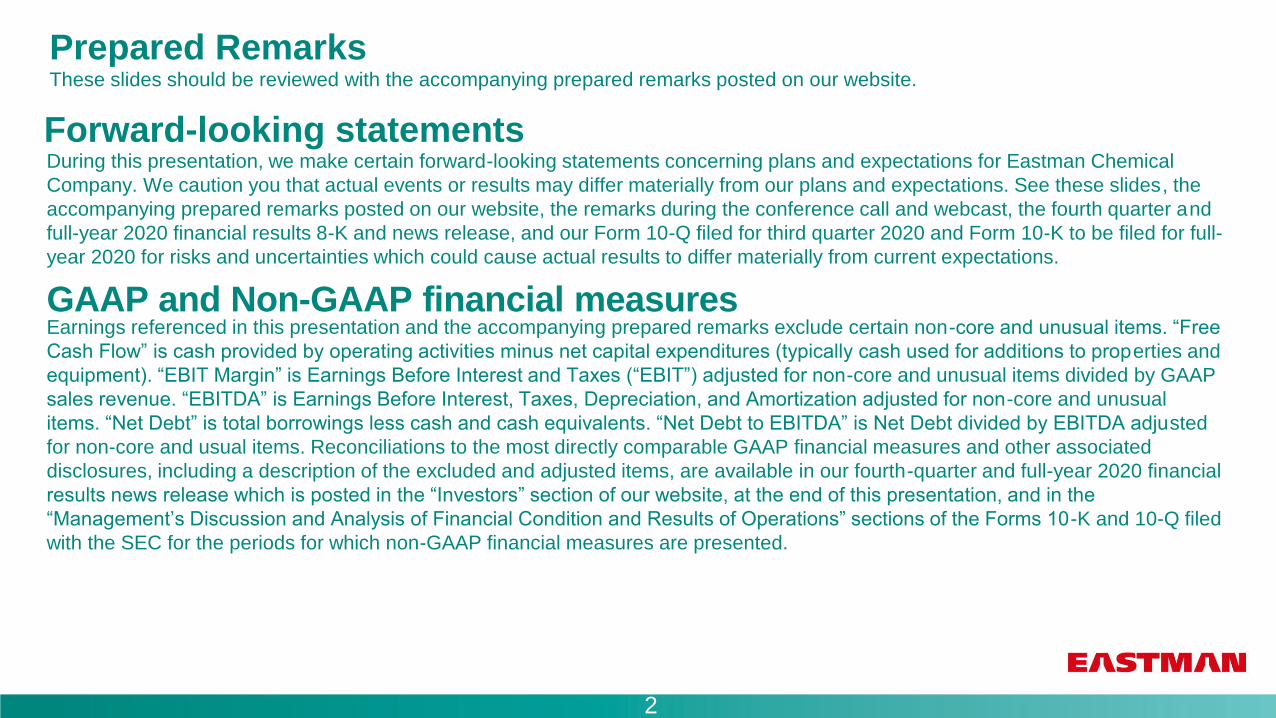
During this presentation, we make certain forward-looking statements concerning plans and expectations for Eastman Chemical
Company. We caution you that actual events or results may differ materially from our plans and expectations. See these slides, the
accompanying prepared remarks posted on our website, the remarks during the conference call and webcast, the fourth quarter and
full-year 2020 financial results 8-K and news release, and our Form 10-Q filed for third quarter 2020 and Form 10-K to be filed for full-
year 2020 for risks and uncertainties which could cause actual results to differ materially from current expectations.
Earnings referenced in this presentation and the accompanying prepared remarks exclude certain non-core and unusual items. “Free
Cash Flow” is cash provided by operating activities minus net capital expenditures (typically cash used for additions to properties and
equipment). “EBIT Margin” is Earnings Before Interest and Taxes (“EBIT”) adjusted for non-core and unusual items divided by GAAP
sales revenue. “EBITDA” is Earnings Before Interest, Taxes, Depreciation, and Amortization adjusted for non-core and unusual
items. “Net Debt” is total borrowings less cash and cash equivalents. “Net Debt to EBITDA” is Net Debt divided by EBITDA adjusted
for non-core and usual items. Reconciliations to the most directly comparable GAAP financial measures and other associated
disclosures, including a description of the excluded and adjusted items, are available in our fourth-quarter and full-year 2020 financial
results news release which is posted in the “Investors” section of our website, at the end of this presentation, and in the
“Management’s Discussion and Analysis of Financial Condition and Results of Operations” sections of the Forms 10-K and 10-Q filed
with the SEC for the periods for which non-GAAP financial measures are presented.
Forward-looking statements
GAAP and Non-GAAP financial measures
Prepared RemarksThese slides should be reviewed with the accompanying prepared remarks posted on our website.
2

2020 highlights
Fourth consecutive year of free cash flow greater than $1 billion
Recognized by several institutions as a leader in sustainability, diversity, and ethics
Launched bold new commitments in our 2020 sustainability report
Took decisive action to protect employees and preserve
operational integrity
Resilient performance driven by innovation portfolio, diverse
end-markets, and decisive cost actions
3
Tritan™ Renew named one of Popular Science’s Greatest Innovations of 2020
Accelerated progress on our circular economy platform
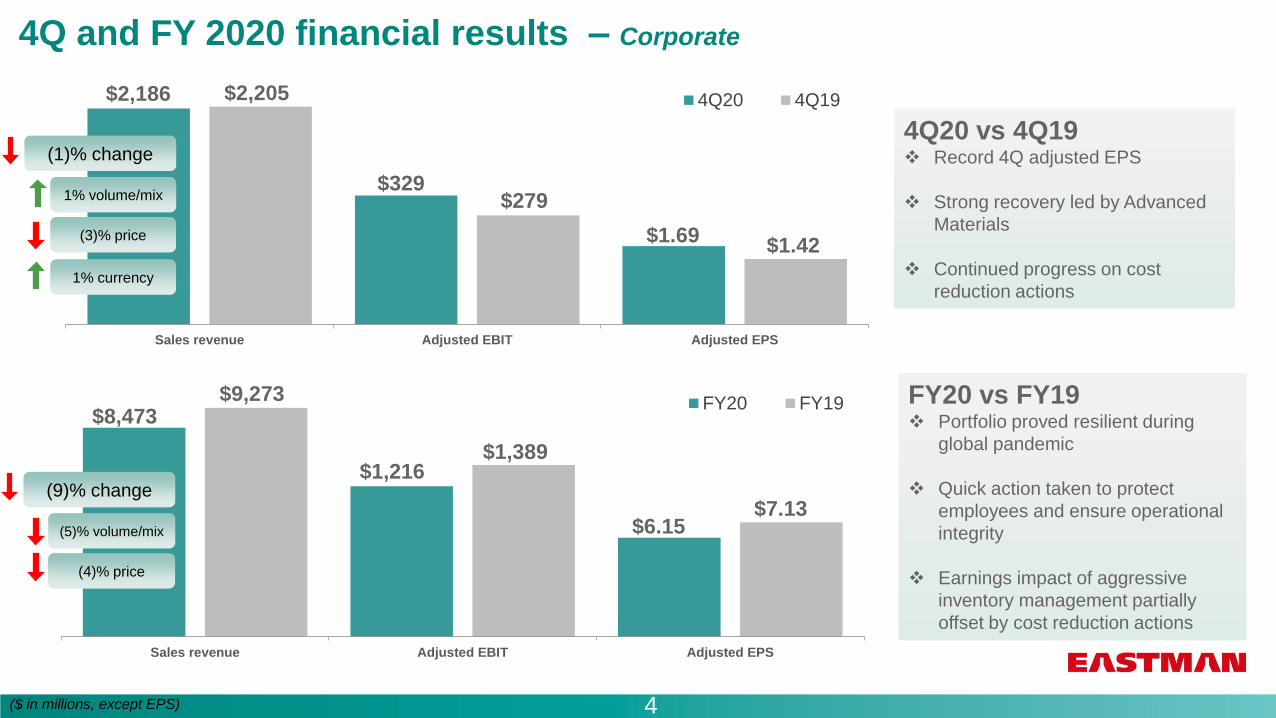
4Q and FY 2020 financial results – Corporate
Sales revenue Adjusted EBIT Adjusted EPS
FY20 FY19
Sales revenue Adjusted EBIT Adjusted EPS
4Q20 4Q19
($ in millions, except EPS) 4
$2,186 $2,205
$329$279
$1.69$1.42
$8,473$9,273
$1,216$1,389
$6.15$7.13
(1)% change
1% volume/mix
(3)% price
1% currency
(9)% change
(5)% volume/mix
(4)% price
4Q20 vs 4Q19❖ Record 4Q adjusted EPS
❖ Strong recovery led by Advanced
Materials
❖ Continued progress on cost
reduction actions
FY20 vs FY19❖ Portfolio proved resilient during
global pandemic
❖ Quick action taken to protect
employees and ensure operational
integrity
❖ Earnings impact of aggressive
inventory management partially
offset by cost reduction actions
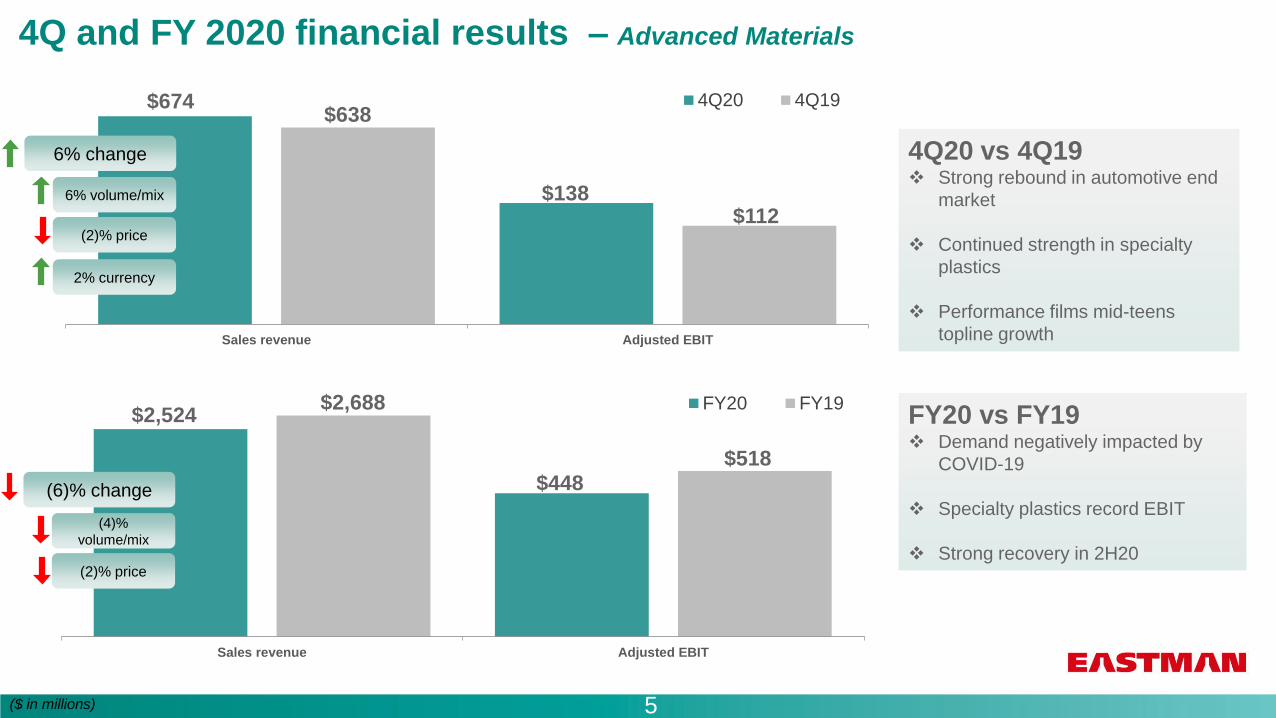
4Q and FY 2020 financial results – Advanced Materials
Sales revenue Adjusted EBIT
FY20 FY19
Sales revenue Adjusted EBIT
4Q20 4Q19
($ in millions) 5
$674$638
$138$112
$2,524$2,688
$448$518
6% change
6% volume/mix
(2)% price
2% currency
(6)% change
(4)%
volume/mix
(2)% price
4Q20 vs 4Q19❖ Strong rebound in automotive end
market
❖ Continued strength in specialty
plastics
❖ Performance films mid-teens
topline growth
FY20 vs FY19❖ Demand negatively impacted by
COVID-19
❖ Specialty plastics record EBIT
❖ Strong recovery in 2H20

4Q and FY 2020 financial results – Additives & Functional Products
Sales revenue Adjusted EBIT
FY20 FY19
Sales revenue Adjusted EBIT
4Q20 4Q19
($ in millions) 6
$773 $763
$118 $109
$3,022$3,273
$448
$550
1% change
2% volume/mix
(3)% price
2% currency
(8)% change
(4)%
volume/mix
(4)% price
4Q20 vs 4Q19❖ Recovery in transportation,
excluding aviation fluids
❖ Continued solid demand in building
and construction
❖ Care Chemicals double digit
topline growth
FY20 vs FY19❖ Care Chemicals 5 percent
volume/mix growth
❖ Transportation end market,
including aviation fluids, impacted
by COVID-19
❖ EBIT declined due to lower
volume/mix and lower capacity
utilization
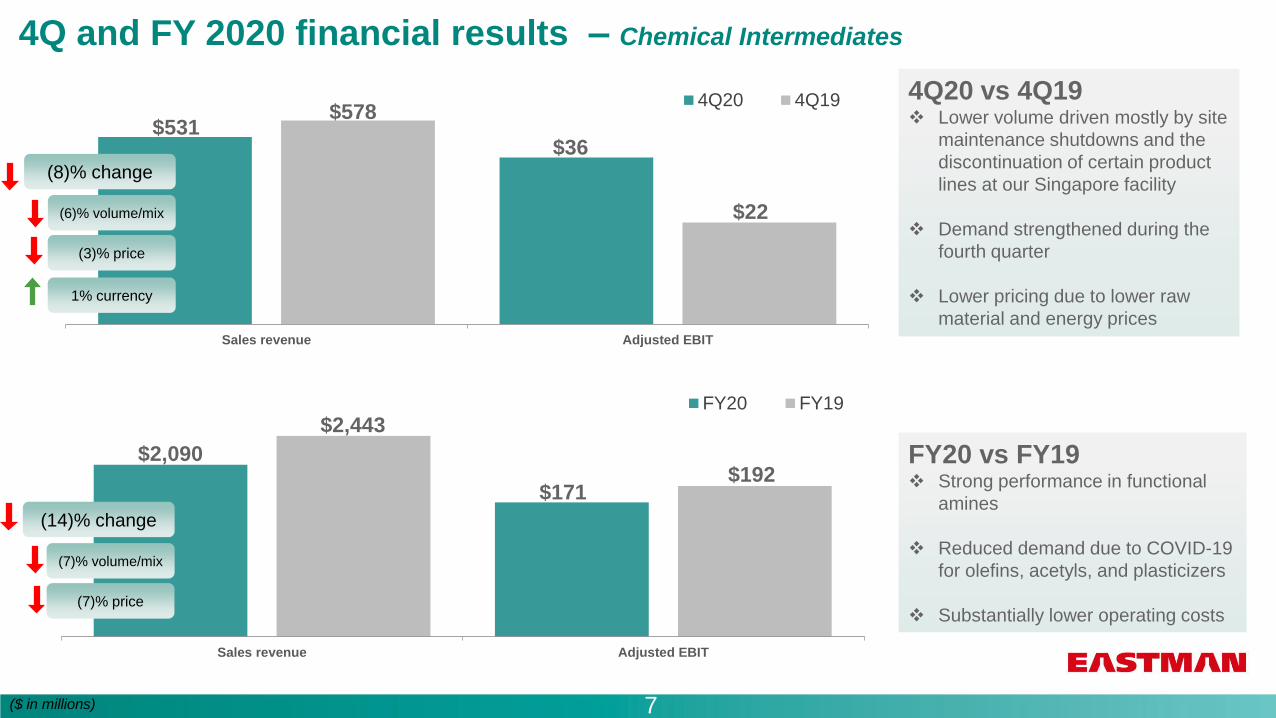
4Q and FY 2020 financial results – Chemical Intermediates
Sales revenue Adjusted EBIT
FY20 FY19
Sales revenue Adjusted EBIT
4Q20 4Q19
($ in millions) 7
$531$578
$36
$22
$2,090
$2,443
$171$192
(8)% change
(6)% volume/mix
(3)% price
1% currency
(14)% change
(7)% volume/mix
(7)% price
4Q20 vs 4Q19❖ Lower volume driven mostly by site
maintenance shutdowns and the
discontinuation of certain product
lines at our Singapore facility
❖ Demand strengthened during the
fourth quarter
❖ Lower pricing due to lower raw
material and energy prices
FY20 vs FY19❖ Strong performance in functional
amines
❖ Reduced demand due to COVID-19
for olefins, acetyls, and plasticizers
❖ Substantially lower operating costs
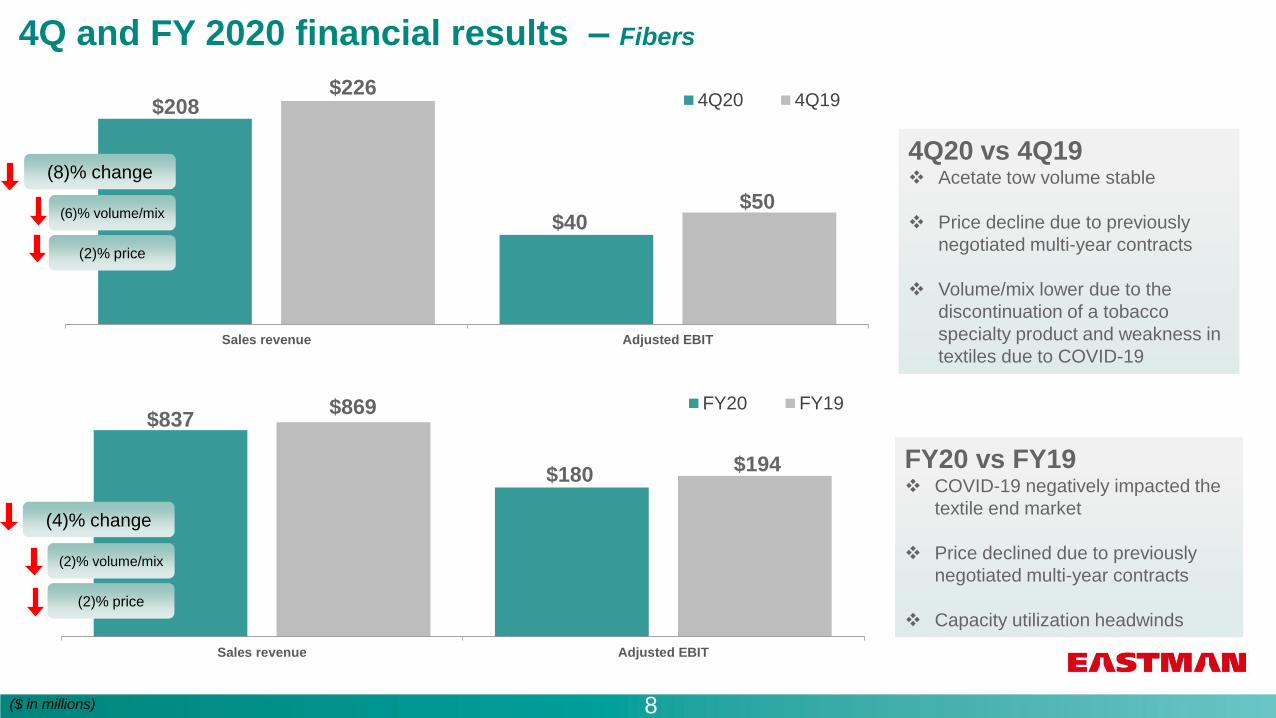
4Q and FY 2020 financial results – Fibers
Sales revenue Adjusted EBIT
FY20 FY19
Sales revenue Adjusted EBIT
4Q20 4Q19
($ in millions) 8
$208$226
$40$50
$837$869
$180$194
(8)% change
(6)% volume/mix
(2)% price
(4)% change
(2)% volume/mix
(2)% price
4Q20 vs 4Q19❖ Acetate tow volume stable
❖ Price decline due to previously
negotiated multi-year contracts
❖ Volume/mix lower due to the
discontinuation of a tobacco
specialty product and weakness in
textiles due to COVID-19
FY20 vs FY19❖ COVID-19 negatively impacted the
textile end market
❖ Price declined due to previously
negotiated multi-year contracts
❖ Capacity utilization headwinds
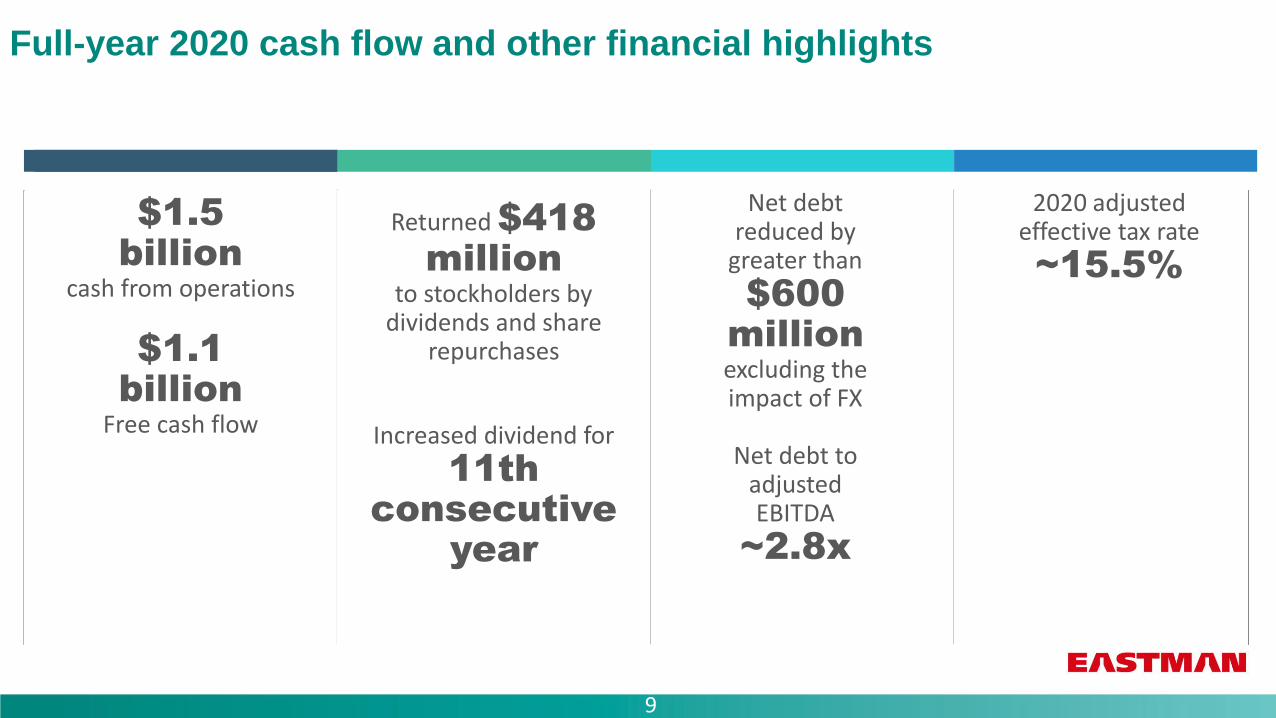
Full-year 2020 cash flow and other financial highlights
9
Returned $418 million
to stockholders by dividends and share
repurchases
Increased dividend for
11th consecutive
year
$1.5billion
cash from operations
$1.1billion
Free cash flow
Net debt reduced by
greater than
$600 million excluding the impact of FX
Net debt to adjusted EBITDA
~2.8x
2020 adjusted effective tax rate
~15.5%
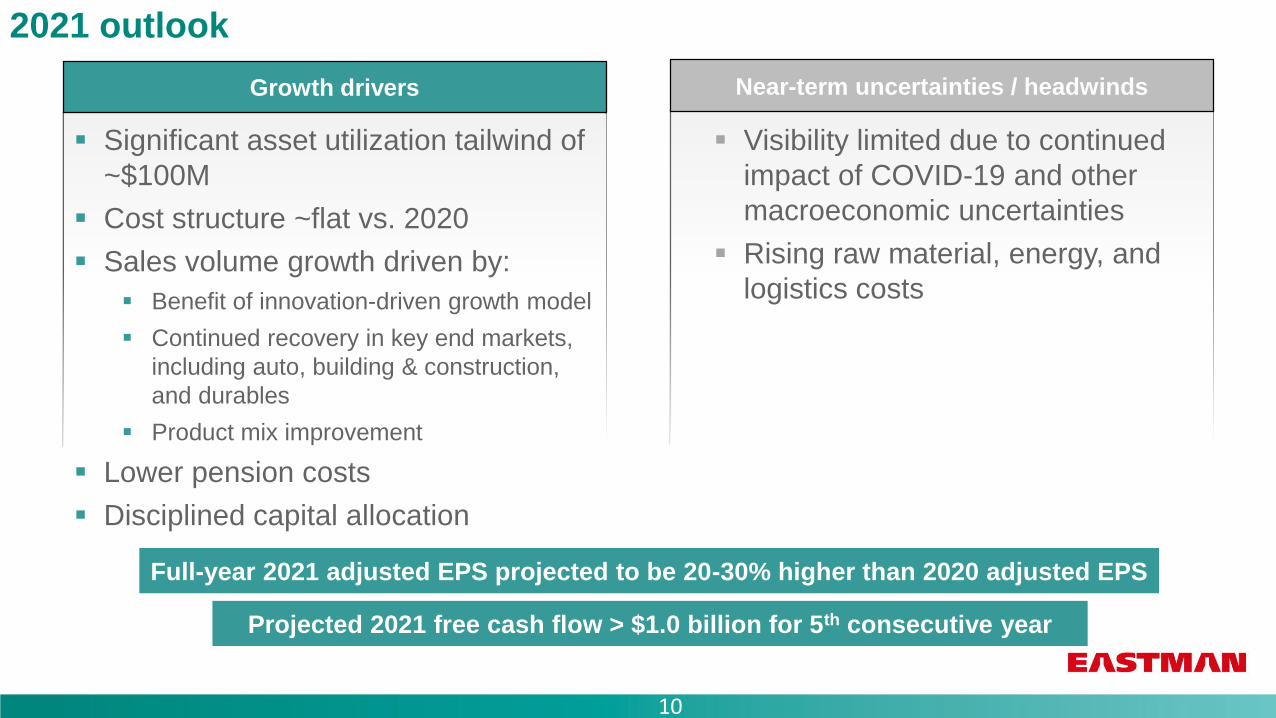
2021 outlook
10
Growth drivers
▪ Significant asset utilization tailwind of
~$100M
▪ Cost structure ~flat vs. 2020
▪ Sales volume growth driven by:
▪ Benefit of innovation-driven growth model
▪ Continued recovery in key end markets,
including auto, building & construction,
and durables
▪ Product mix improvement
▪ Lower pension costs
▪ Disciplined capital allocation
Near-term uncertainties / headwinds
▪ Visibility limited due to continued
impact of COVID-19 and other
macroeconomic uncertainties
▪ Rising raw material, energy, and
logistics costs
Projected 2021 free cash flow > $1.0 billion for 5th consecutive year
Full-year 2021 adjusted EPS projected to be 20-30% higher than 2020 adjusted EPS

11
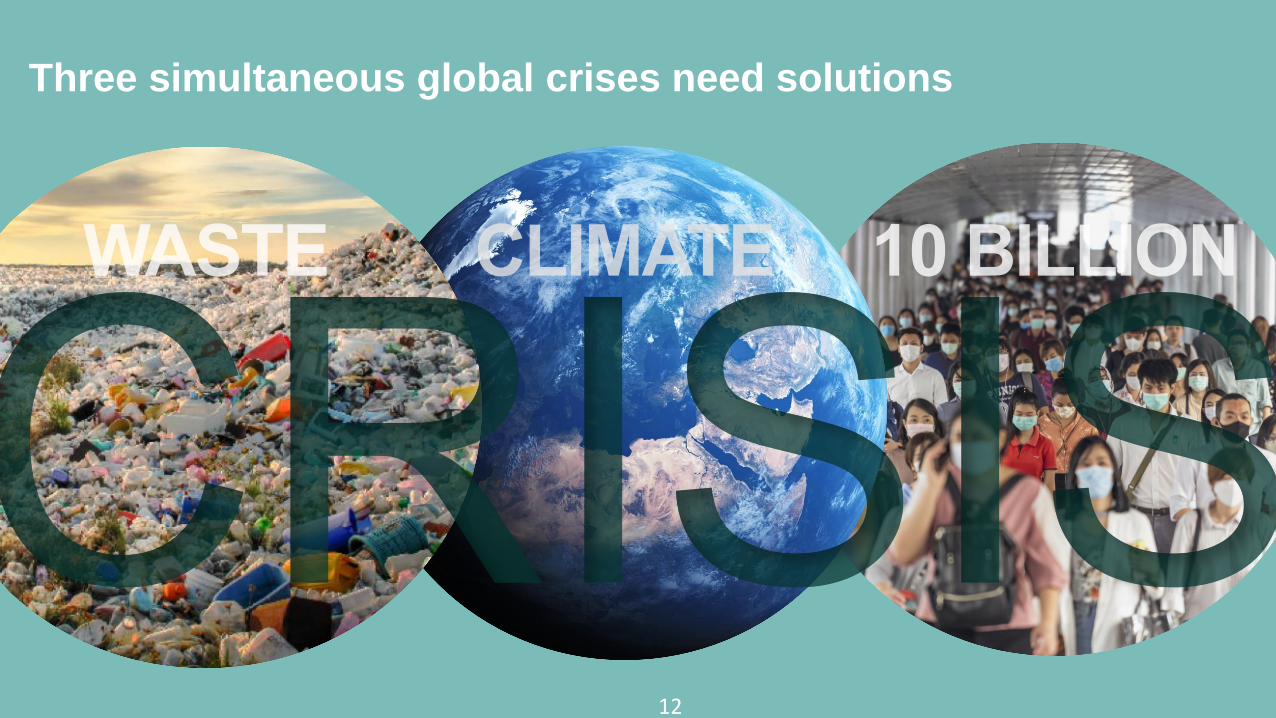
Three simultaneous global crises need solutions
12
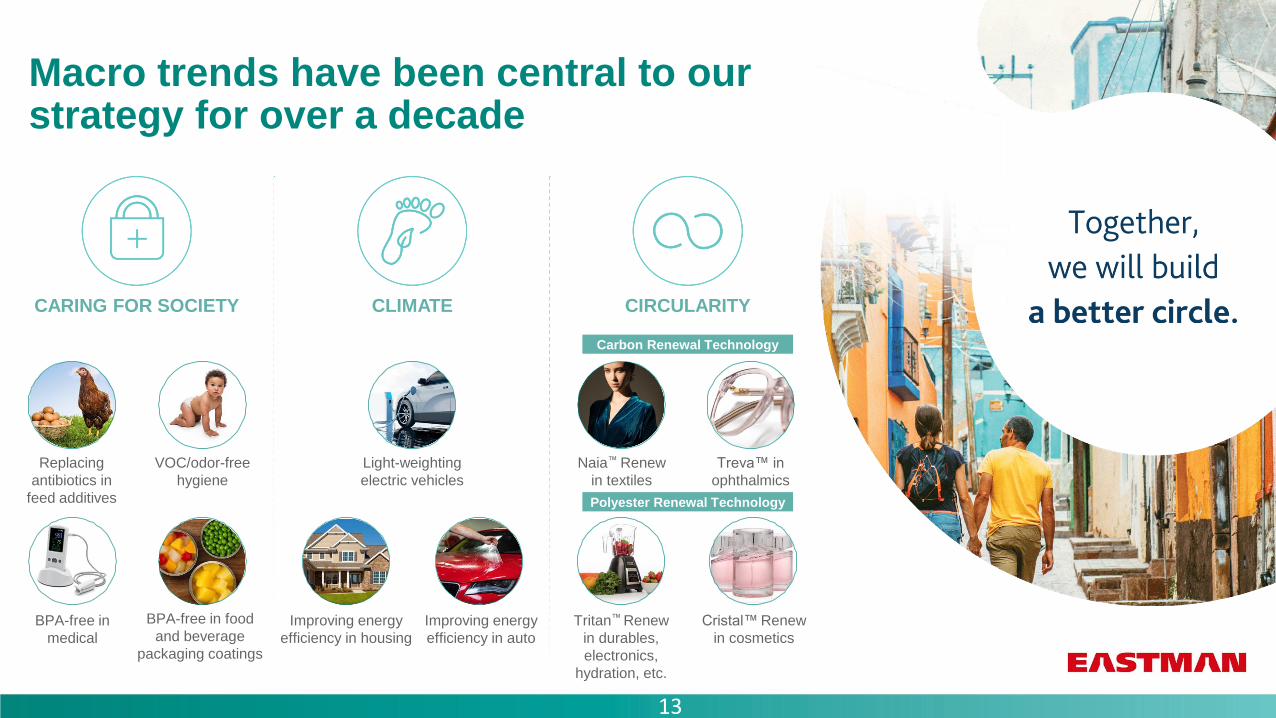
Macro trends have been central to our strategy for over a decade
CLIMATE CIRCULARITYCARING FOR SOCIETY
Replacing
antibiotics in
feed additives
BPA-free in
medical
VOC/odor-free
hygiene
Carbon Renewal Technology
Polyester Renewal Technology
Naia™ Renew
in textiles
Treva™ in
ophthalmics
Improving energy
efficiency in housing
Tritan™ Renew
in durables,
electronics,
hydration, etc.
Light-weighting
electric vehicles
BPA-free in food
and beverage
packaging coatings
Cristal™ Renew
in cosmetics
Improving energy
efficiency in auto
13
*Source: refed.com
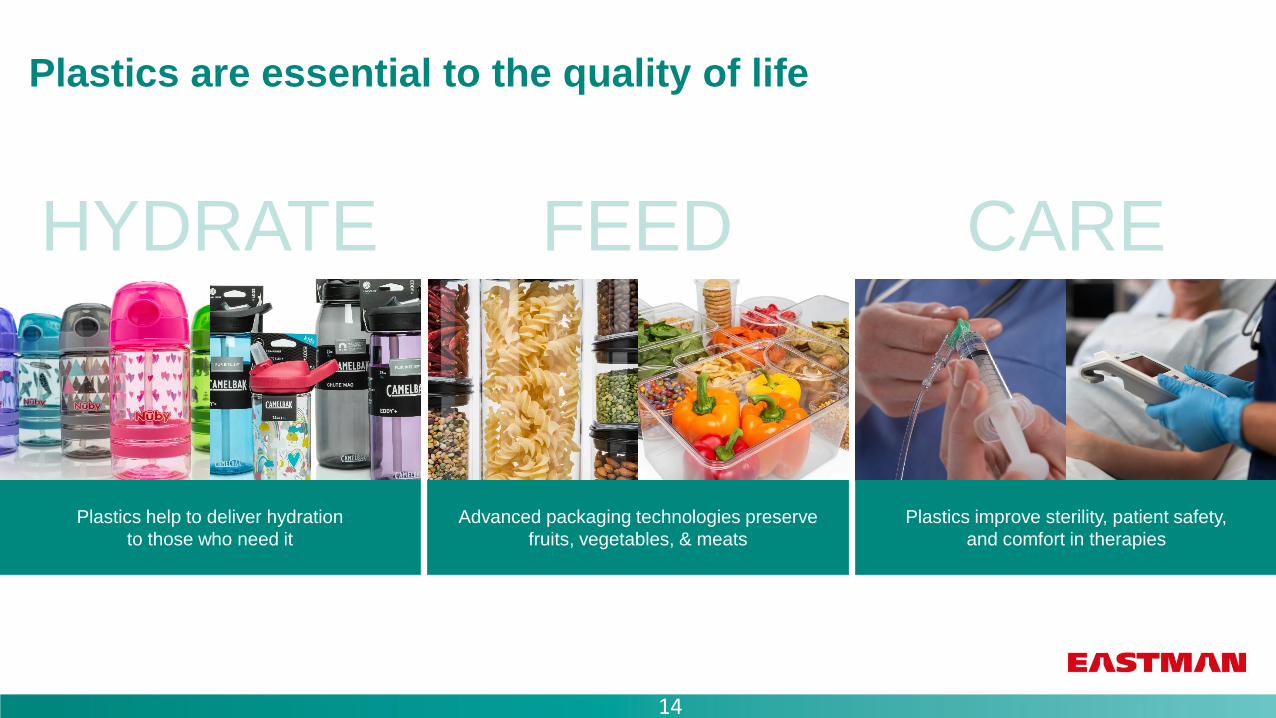
Plastics are essential to the quality of life
HYDRATE FEED CARE
Plastics help to deliver hydration
to those who need it
Advanced packaging technologies preserve
fruits, vegetables, & meats
Plastics improve sterility, patient safety,
and comfort in therapies
14
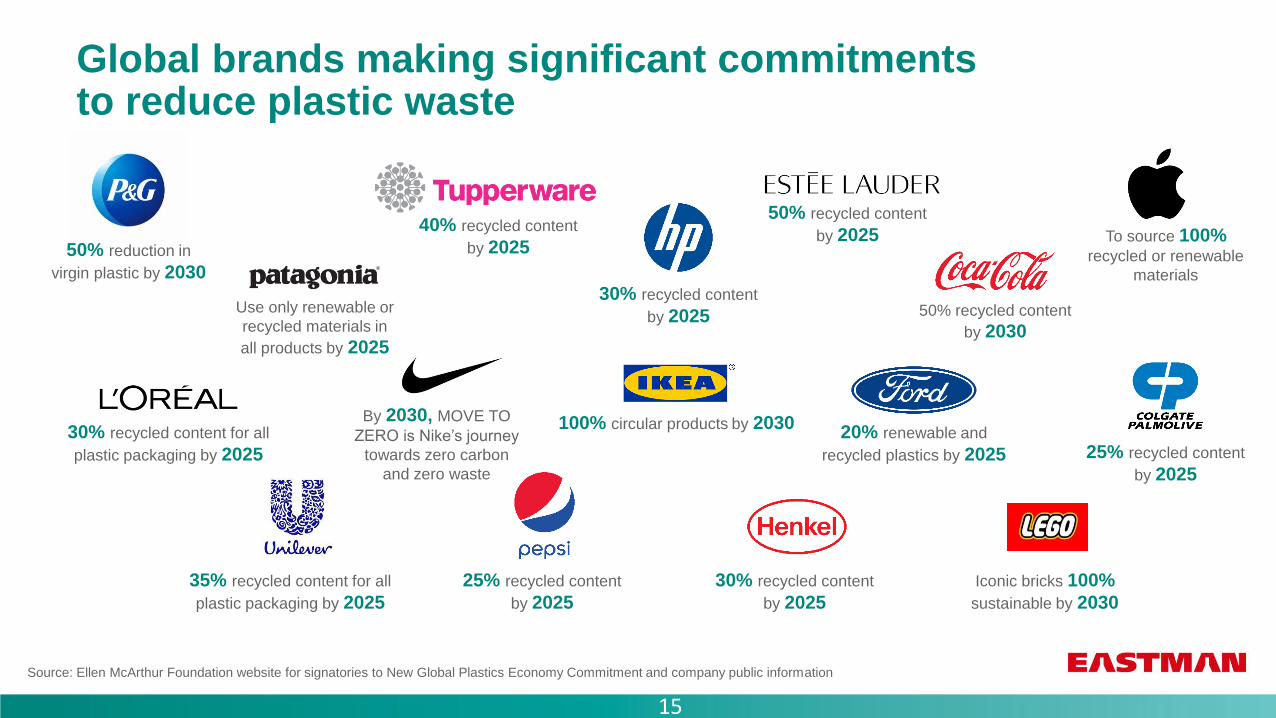
Global brands making significant commitmentsto reduce plastic waste
30% recycled content
by 2025
30% recycled content for all
plastic packaging by 2025
25% recycled content
by 2025
20% renewable and
recycled plastics by 2025
35% recycled content for all
plastic packaging by 2025
Iconic bricks 100%
sustainable by 2030
100% circular products by 2030
25% recycled content
by 2025
30% recycled content
by 2025
50% recycled content
by 2030
Source: Ellen McArthur Foundation website for signatories to New Global Plastics Economy Commitment and company public information
By 2030, MOVE TO
ZERO is Nike’s journey
towards zero carbon
and zero waste
Use only renewable or
recycled materials in
all products by 2025
50% recycled content
by 202540% recycled content
by 202550% reduction in
virgin plastic by 2030
To source 100% recycled or renewable
materials
15

MECHANICAL RECYCLING Most carbon efficient when possible
MOLECULAR RECYCLING TECHNOLOGY Necessary to renew material and avoid end of life
A+
Optimal GHG footprint, existing
infrastructure
Performance and quality limitations
Quality degrades with each cycle…eventually,
everything becomes waste
Limited to clean sources; majority must
be downcycled or not recycled at all
Enables infinite ability to recycle polymer for a truly
circular economy
No performance tradeoffs…upcycles the material
back to premium quality / performance
Can recycle materials that have little value or can
not be mechanically recycled
Eastman technologies deliver an improved GHG
footprint when compared to processes using fossil
feedstocks
Both mechanical and molecular recycling are required to
eliminate waste and create a truly circular economy
+
16
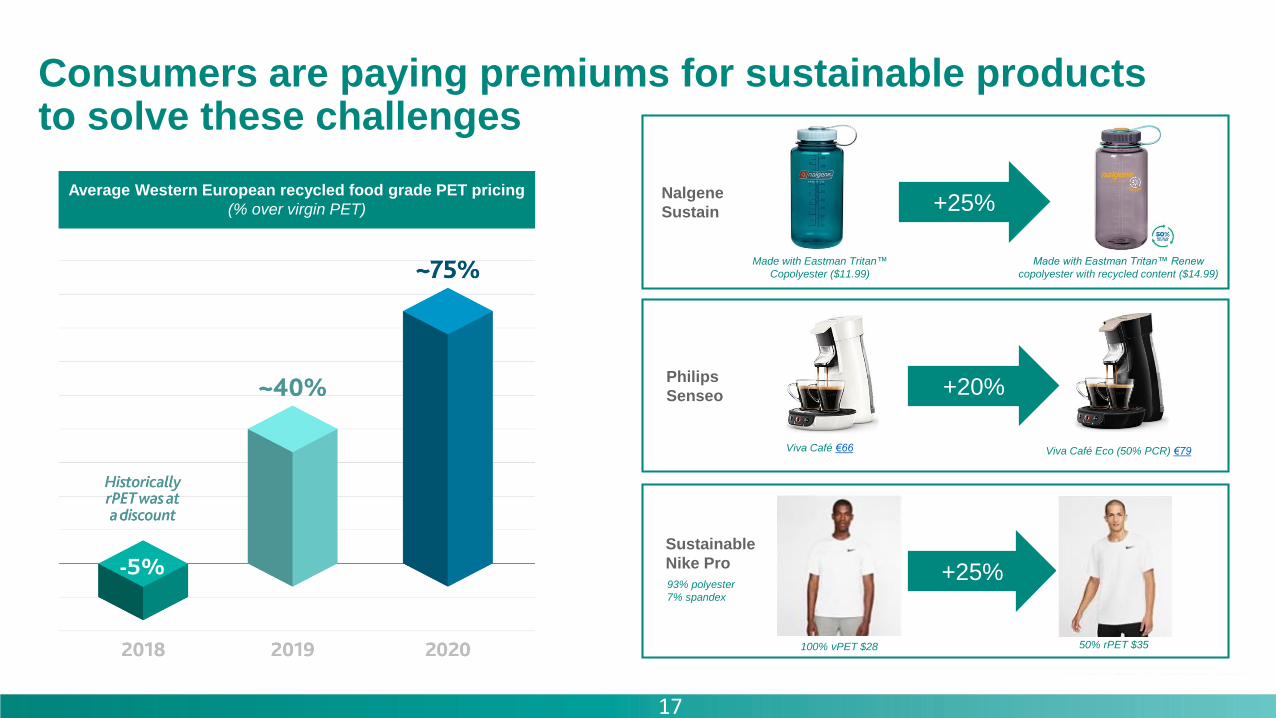
Consumers are paying premiums for sustainable products to solve these challenges
Average Western European recycled food grade PET pricing
(% over virgin PET)
Made with Eastman Tritan™
Copolyester ($11.99)
Made with Eastman Tritan™ Renew
copolyester with recycled content ($14.99)
+25%Nalgene
Sustain
Viva Café €66 Viva Café Eco (50% PCR) €79
Philips
Senseo +20%
Sustainable
Nike Pro
93% polyester
7% spandex
+25%
100% vPET $28 50% rPET $35
-5%
17

PET-only waste such as colored PET, films,
and fibers from textiles and carpets
Polyester renewal technology creates value from wasteEastman is providing technology solutions for the circular economy
Feedstocks End products
Our polyester renewal technology reduces greenhouse gas emissions
by 20-30% when compared to processes using fossil feedstocks
Polyester renewal technology (PRT)
18

Eastman to build one of the world’s largest plastic to plastic molecular recycling facilitiesTaking the next step on our circular economy journey
2021-2022: ~$250M capital investment ROIC >15%
• Begin construction
mid-year 2021
• Mechanical
completion expected
by year-end 2022
• Advantaged scale and
integration, including
carbon renewal
technology
• Product mix upgrade
over time
• Option to add capacity
as adoption gains
momentum
• Polymer intermediate
capacity to make 150
– 200 kmt of polymer
• Unique ability to use
low-quality / low-cost
feedstocks
Expect molecular recycling initiatives to contribute to
>$600M of new business revenue in the coming years
19
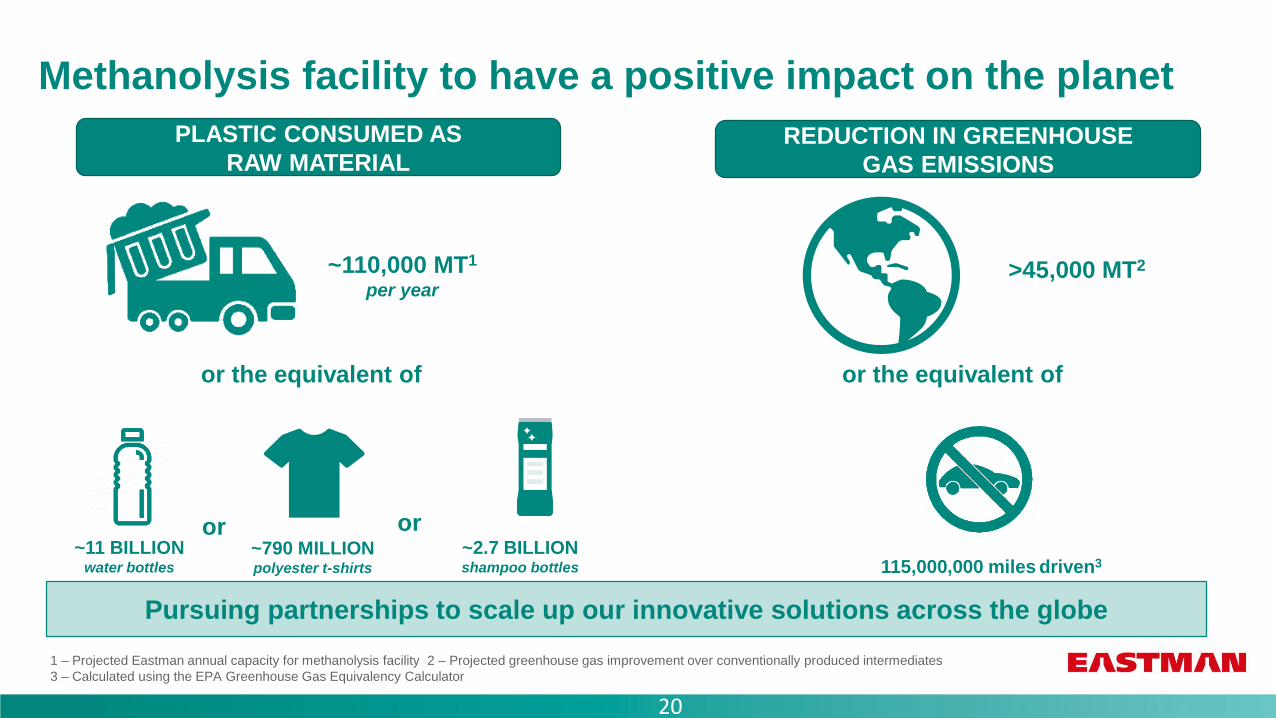
Methanolysis facility to have a positive impact on the planet
PLASTIC CONSUMED AS
RAW MATERIALREDUCTION IN GREENHOUSE
GAS EMISSIONS
or the equivalent of
~110,000 MT1
per year>45,000 MT2
115,000,000 miles driven3~790 MILLIONpolyester t-shirts
or or~2.7 BILLIONshampoo bottles
or the equivalent of
~11 BILLIONwater bottles
1 – Projected Eastman annual capacity for methanolysis facility 2 – Projected greenhouse gas improvement over conventionally produced intermediates
3 – Calculated using the EPA Greenhouse Gas Equivalency Calculator
Pursuing partnerships to scale up our innovative solutions across the globe
20
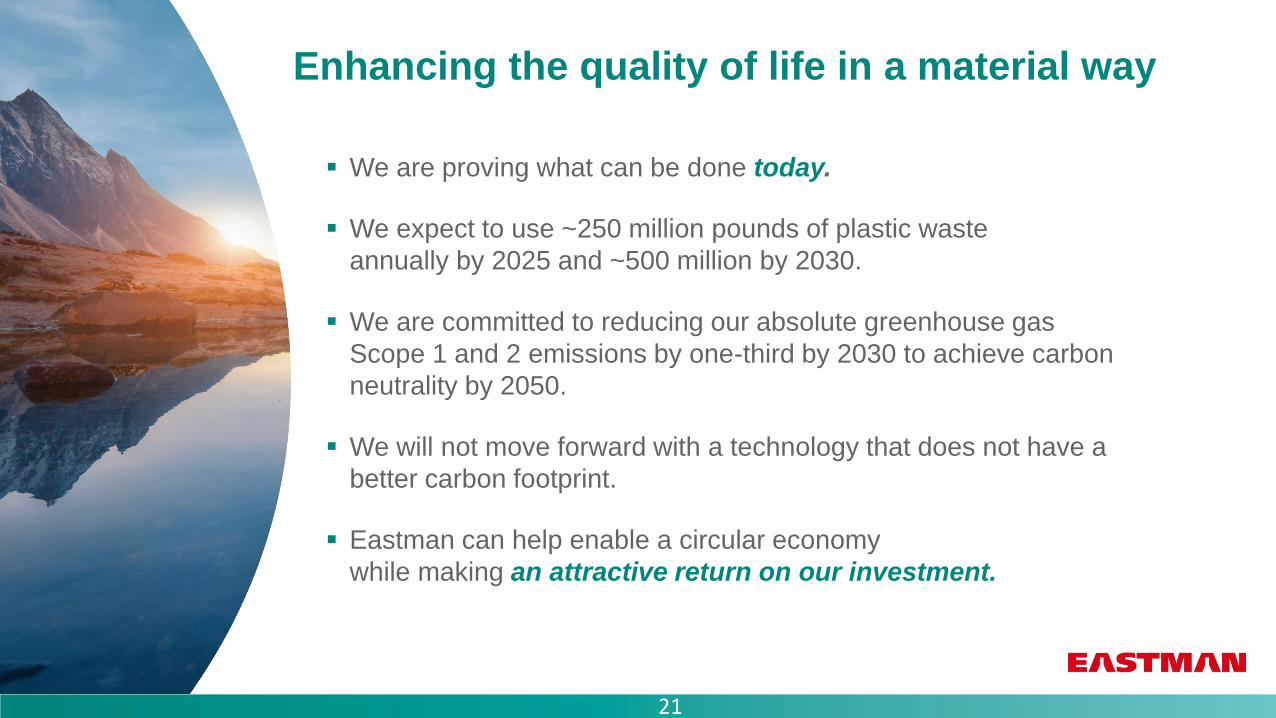
Enhancing the quality of life in a material way
▪ We are proving what can be done today.
▪ We expect to use ~250 million pounds of plastic waste
annually by 2025 and ~500 million by 2030.
▪ We are committed to reducing our absolute greenhouse gas
Scope 1 and 2 emissions by one-third by 2030 to achieve carbon
neutrality by 2050.
▪ We will not move forward with a technology that does not have a
better carbon footprint.
▪ Eastman can help enable a circular economy
while making an attractive return on our investment.
21
Appendix
22
23
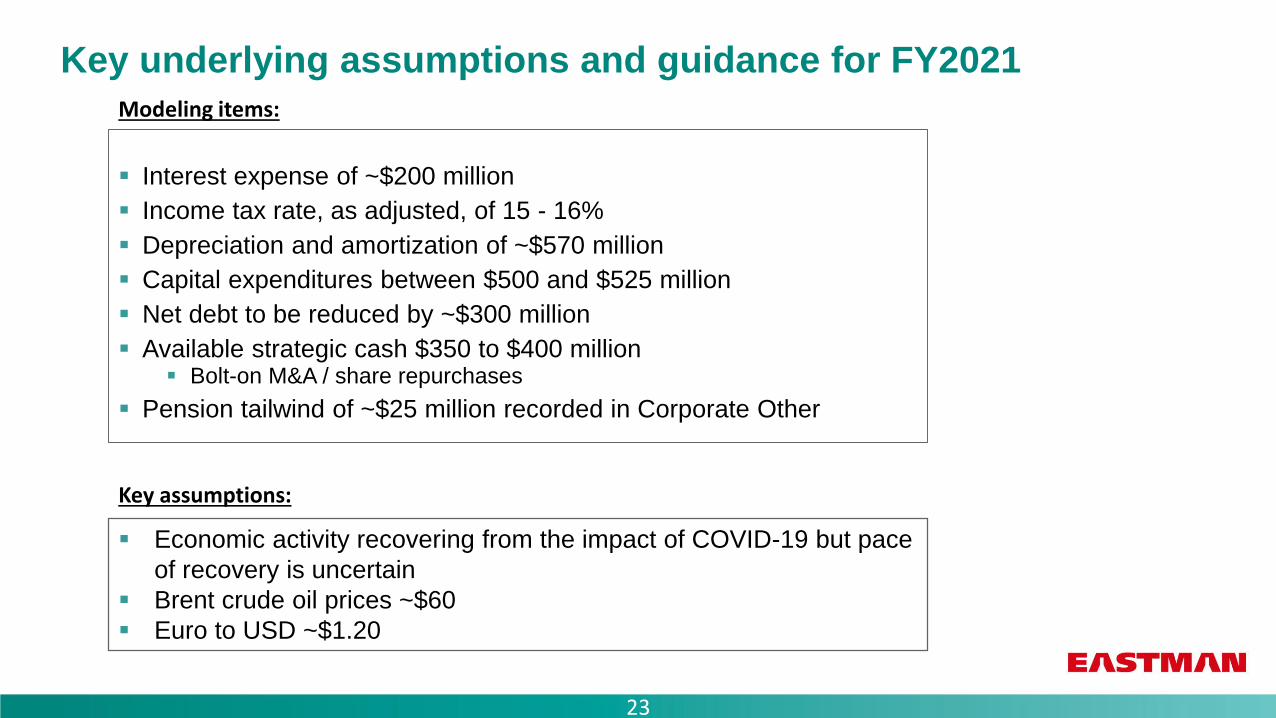
Key underlying assumptions and guidance for FY2021
▪ Interest expense of ~$200 million
▪ Income tax rate, as adjusted, of 15 - 16%
▪ Depreciation and amortization of ~$570 million
▪ Capital expenditures between $500 and $525 million
▪ Net debt to be reduced by ~$300 million
▪ Available strategic cash $350 to $400 million▪ Bolt-on M&A / share repurchases
▪ Pension tailwind of ~$25 million recorded in Corporate Other
▪ Economic activity recovering from the impact of COVID-19 but pace
of recovery is uncertain
▪ Brent crude oil prices ~$60
▪ Euro to USD ~$1.20
Key assumptions:
Modeling items:

24
2021 quarterly forecasted change in manufacturing maintenance shutdown cost by segment – year-over-year & sequential
Q121
y/y
Q221
y/y
Q321
y/y
Q421
y/y
FY21 vs
FY20
Q121 vs
Q420
Q221 vs
Q121
Q321 vs
Q221
Q421 vs
Q321
Advanced Materials - - - - - 10 (5) - -
Additives & Functional Products - (15) 5 5 (5) 5 (20) 15 -
Chemical Intermediates - (15) 5 5 (5) 5 (15) 15 -
Fibers - - - - - - (5) 5 -
Total - (30) 10 10 (10) 20 (45) 35 -
favorable/(unfavorable) approximate change in manufacturing maintenance shutdown period costs, in millions ($)
25
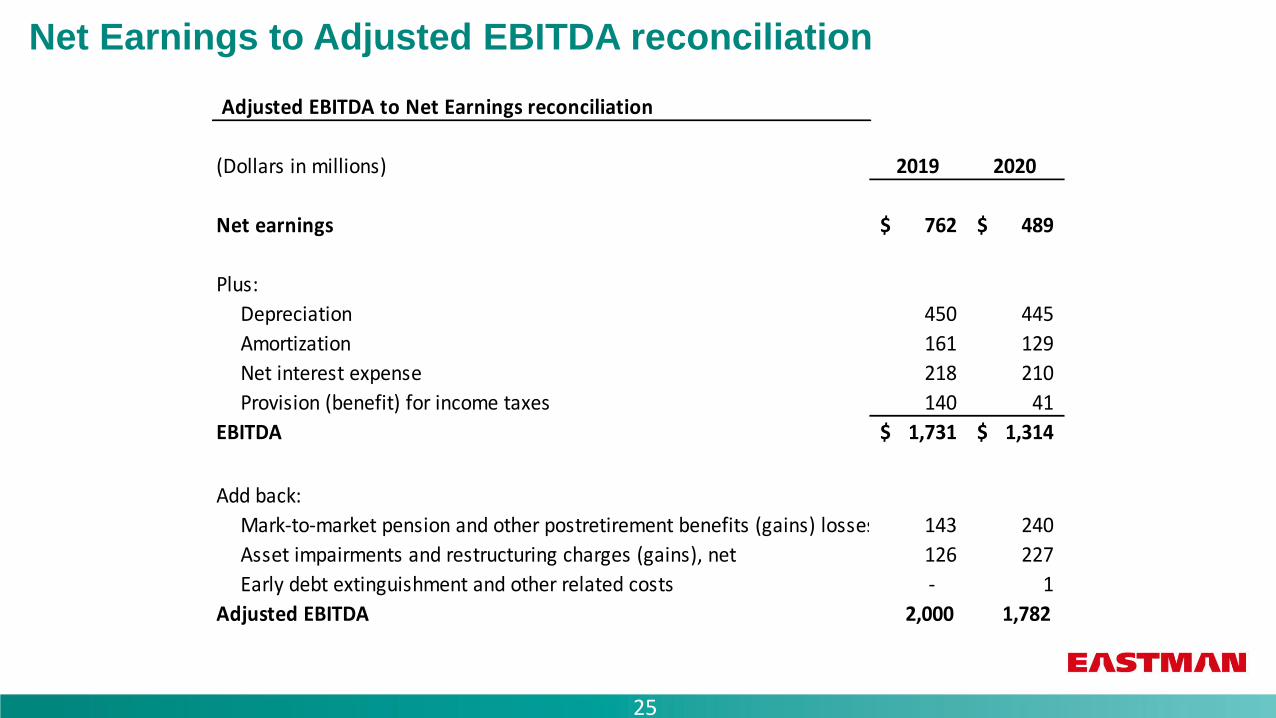
Net Earnings to Adjusted EBITDA reconciliation
Adjusted EBITDA to Net Earnings reconciliation
(Dollars in millions) 2019 2020
Net earnings 762$ 489$
Plus:
Depreciation 450 445
Amortization 161 129
Net interest expense 218 210
Provision (benefit) for income taxes 140 41
EBITDA 1,731$ 1,314$
Add back:
Mark-to-market pension and other postretirement benefits (gains) losses, net 143 240
Asset impairments and restructuring charges (gains), net 126 227
Early debt extinguishment and other related costs - 1
Adjusted EBITDA 2,000 1,782