Fourth quarter and full year 2019 results
25
Sample to Insight Fourth quarter and full year 2019 results February 5, 2020 Asha Palat and Brandon Mistretta, University of Houston in Texas
Transcript of Fourth quarter and full year 2019 results

Sample to Insight
Fourth quarter and full year 2019 resultsFebruary 5, 2020
Hannah Wardill, University Medical Center Groningen, NetherlandsAsha Palat and Brandon Mistretta, University of Houston in Texas

Sample to Insight
Forward looking and intended use statements
Q4 2019 results
Safe Harbor Statement: This presentation contains both historical and forward-lookingstatements. All statements other than statements of historical fact are, or may be deemed to beforward looking statements within the meaning of Section 27A of the U.S. Securities Act of 1933,as amended, and Section 21E of the U.S. Securities Exchange Act of 1934, as amended. To theextent that any of the statements contained herein relating to QIAGEN's products, launches,regulatory submissions, collaborations, markets, strategy, taxes or operating results, includingwithout limitation its expected net sales, net sales of particular products (including anticipatedsales of its QFT-Plus test for latent TB, its portfolio of next generation sequencing solutions andQIAstat-Dx), net sales in particular geographies, adjusted net sales, adjusted diluted earningsper share results, product launches (including anticipated launches of next generationsequencing solutions, the QIAstat-Dx syndromic testing platform, a gastrointestinal panel in theU.S., and a CE-IVD marked panel for meningitis), development of tissue-based companiondiagnostics for Amgen’s investigational new oncology therapy, placements of QIAsymphonymodular PCR instruments, improvements in operating and financial leverage, currencymovements against the U.S. dollar, plans for investment in our portfolio and share repurchasecommitments, plans to shift our Global Operations organization to a regional manufacturingstructure, our ability to grow adjusted earnings per share at a greater rate than sales, our abilityto improve operating efficiencies and maintain disciplined capital allocation, and plans to takefurther pre-tax charges in 2020 related to the project announced in Q3 2019, are forward-looking, such statements are based on current expectations and assumptions that involve anumber of uncertainties and risks. Such uncertainties and risks include, but are not limited to,risks associated with management of growth and international operations (including the effectsof currency fluctuations, regulatory processes and dependence on logistics); variability ofoperating results and allocations between customer classes; the commercial development ofmarkets for our products to customers in academia, pharma, applied testing and moleculardiagnostics; changing relationships with customers, suppliers and strategic partners;competition; rapid or unexpected changes in technologies; fluctuations in demand for QIAGEN'sproducts (including fluctuations due to general economic conditions, the level and timing ofcustomers' funding, budgets and other factors); our ability to obtain regulatory approval of ourproducts; difficulties in successfully adapting QIAGEN's products to integrated solutions andproducing such products; the ability of QIAGEN to identify and develop new products and to
differentiate and protect our products from competitors' products; market acceptance ofQIAGEN's new products and the integration of acquired technologies and businesses; actions ofgovernments, global or regional economic developments, weather or transportation delays, naturaldisasters, political or public health crises, or other force majeure events; and the other factorsdiscussed under the heading “Risk Factors” contained in Item 3 of our most recent Annual Reporton Form 20-F. For further information, please refer to the discussions in reports that QIAGEN hasfiled with, or furnished to, the U.S. Securities and Exchange Commission (SEC).
Regulation G: QIAGEN reports adjusted results, as well as results on a constant exchange rate(CER) basis, and other non-U.S. GAAP figures (generally accepted accounting principles), toprovide additional insight on performance. In this presentation, adjusted results include adjustednet sales, adjusted operating expenses, adjusted EBITDA, adjusted diluted EPS and free cashflow. Adjusted results are non-GAAP financial measures QIAGEN believes should be consideredin addition to reported results prepared in accordance with GAAP, but should not be considered asa substitute. QIAGEN believes certain items should be excluded from adjusted results when theyare outside of its ongoing core operations, vary significantly from period to period, or affect thecomparability of results with its competitors and its own prior periods. Please see the Appendixprovided in this presentation “Reconciliation of Non-GAAP to GAAP Measures” for reconciliationsof historical non-GAAP measures to comparable GAAP measures and the definitions of termsused in the presentation. QIAGEN does not reconcile forward-looking non-GAAP financialmeasures to the corresponding GAAP measures due to the high variability and difficulty in makingaccurate forecasts and projections that are impacted by future decisions and actions. Accordingly,reconciliations of these forward-looking non-GAAP financial measures to the corresponding GAAPmeasures are not available without unreasonable effort. However, the actual amounts of theseexcluded items will have a significant impact on QIAGEN’s GAAP results.
2

Sample to Insight
Introduction
John GilardiVP Corporate Communications and IR
Business and financial update
Q&A session
Agenda
Q4 2019 results
Thierry BernardInterim CEO
Roland SackersCFO
3
Hannah Wardill, University Medical Center Groningen Netherlands

Sample to Insight
Q4 and full-year 2019: Summary
Q4 2019 results
Q4 2019 results exceed outlook• $413.5 million net sales (+3% actual, +4% CER vs. ~+3% CER outlook)• Diluted EPS $0.19; adjusted EPS $0.48 ($0.48 CER vs. ~$0.45-0.46 CER
outlook)• Adjusted operating income margin rises to 33.5% of sales vs. 29.6% in Q4 2018
Refer to accompanying tables for reconciliation of reported to adjusted figures.(1) Weighted number of diluted shares (Q4 2019: 231.3 million, Q4 2018: 232.4 million; FY 2019: 232.4 million, FY 2018: 233.5 million).(2) Based on currency rates as of January 31, 2020
Q4 and FY net sales(In $ millions, at actual rates)
Q4 and FY adjusted EPS(1)
(In $ per share)
Q42018
FY2019
403.2 413.5
$0.48($0.48 CER)
$1.34
Outlook – As of February 4, 2020Q1 2020 FY 2020
Net sales growth (CER) ~ +2-3% ~ +3-4%
Anticipated currency impact(2) ~ −1-2 p.p. ~ −1 p.p.
Adj. diluted EPS (CER) ~$0.28-0.29 ~$1.52-1.54
Anticipated currency impact(2) ~ −$0.01 ~ −$0.01
Q42018
FY2018
Q42019
+4% CER
FY2018
$0.40
$1.43($1.46 CER)
Q42019
FY2019
+4% CER
1
2
3
4
4
1,526.41,501.8
CER – Constant exchange rates p.p. – percentage points CDx – Companion Diagnostics NGS – Next-generation sequencing
Full-year 2019 sales achieves outlook, exceeds adj. EPS• $1.53 billion net sales (+2% actual, +4% CER vs. ~4% CER outlook)• Net loss per share $0.18, adjusted EPS $1.43 ($1.46 CER, +9% CER)• Adjusted operating income margin at 27.6% of sales vs. 26.9% in 2018• Pre-tax charge of $301.8 million in operating results for October 2019
decisions on NGS instrument development and other measures
Full-year 2019 Sample to Insight portfolio developments• NGS portfolio sales exceed target for $180 million of annual sales• QIAsymphony tops end-2019 target for over 2,500 cumulative placement• QIAcube Connect successfully launched in 2019 with over 660 placements• QuantiFERON-TB up 10% CER, U.S. sales rise 17% CER and FDA
approves LIAISON automation solution with partner DiaSorin
2020 outlook• Continued expansion of Sample to Insight portfolio• Anticipate sales headwinds continuing from 2019 issues in China and
companion diagnostic co-development revenues due to NGS decisions
+9% CER
+20% CER

Sample to Insight
Q4 and full-year 2019: Financial review
Q4 2019 results
(1) Net sales (CER): Q4 2019 $417.9 million and full-year $1.566 billion.(2) Weighted number of diluted shares (Q4 2019: 231.3 million, Q4 2018: 232.4 million); (FY 2019: 232.4 million, FY 2018: 233.5 million).
Reported diluted EPS for FY 2019 based on basic shares of 226.8 million. (3) Q4 and full-year 2019 includes impact of $38 million in cash payments for restructuring measures announced in October 2019. (4) Balance sheet data as of December 31 for each year excluding restricted cash. CER – Constant exchange rates NM – Not meaningful(5) Leverage ratio is calculated on trailing four quarters as net debt / adjusted EBITDA. Refer to accompanying tables for reconciliation of reported to adjusted figures
(In $ millions, unless indicated)(Diluted EPS in $ per share)
Fourth quarter Full year
2019 2018 Change 2019 2018 ChangeNet sales(1) 413.5 403.2 3% / 4% CER 1,526.4 1,501.8 2% / 4% CEROperating income (loss) 80.0 88.3 -9% (26.1) 266.6 NMAdjusted operating income 138.6 119.4 16% 421.8 403.3 5%
Net income (loss) 44.9 60.9 -26% (41.5) 190.4 NM
Adjusted net income 110.1 93.7 18% 332.8 311.9 7%Tax rate 35% 11% 47% 16%Adjusted tax rate 18% 18% 19% 19%Diluted EPS / (Net loss per share) ($ per share)(2) $0.19 $0.26 ($0.18) $0.82Adjusted diluted EPS / Adjusted diluted EPS at CER(2) $0.48 / $0.48 $0.40 20% / 20% CER $1.43 / $1.46 $1.34 7% / 9% CER
5
Net cash provided by operating activities(3) 109.4 110.5 -1% 330.8 359.5 -8%Less purchases of property, plant and equipment (31.6) (37.4) (117.9) (109.8)Free cash flow(3) 77.9 73.1 7% 212.9 249.7 -15%
Group liquidity(4) 753 1,394
Net debt(4) 953 781
Leverage ratio(4)(5) 1.6x 1.4x

Sample to Insight
Molecular Diagnostics(1) $198 2% 3% 48% $737 1% 4% 48%
Life Sciences $216 3% 4% 52% $789 2% 5% 52%
Academia / Applied Testing $138 3% 3% 33% $487 2% 4% 32%
Pharma $78 4% 5% 19% $302 4% 6% 20%
Q4 and full-year 2019: Sales by product type, customer class and region
Q4 2019 results
(1) Companion diagnostic co-development sales (Q4 2019: $9 million, -55%, -54% CER; FY 2019: $42 million, -28%, -27% CER)(2) Asia-Pacific / Japan sales excluding China (Q4 2019: 0%, 0% CER and FY 2019: +2%, +4% CER)Top 7 EGM (Q4 2019: -1% / +2% CER / 18% of sales; FY 2019: +2% / +8% CER / 16% of sales), and top 7 EGM excluding China (Q4 2019: +8% / +12% CER / 10% of sales and FY 2019: +6% / +16% CER / 9% of sales)Rest of world (Q4 2019 and FY 2019: Less than 1% of net sales)Sales figures and sales contributions at actual FX rates Tables may contain rounding differences Percentage changes are to prior-year periods.
Q4 2019 net sales: $413.5 million FY 2019 net sales: $1.526 billionSales
(In $ m)%
change% CERchange
% of sales
Sales (In $ m)
% change
% CERchange
% of sales
Consumables and related revenues $364 6% 7% 88% $1,354 3% 6% 89%
Instruments $49 -17% -16% 12% $172 -8% -5% 11%
6
Americas $180 6% 7% 44% $722 4% 5% 47%
Europe / Middle East / Africa $146 2% 5% 35% $487 -1% 5% 32%
Asia-Pacific / Japan(2) $87 -4% -4% 21% $314 0% 2% 21%
Sales by customer class
Sales by region
Sales by product type

Sample to InsightQ4 2019 results 7
CDx – Companion diagnostics QCI – QIAGEN Clinical Insights
QIAsymphony surpasses >2,500 cumulative placements at end-2019
Instrument milestones
Q4 2019: Sample to Insight portfolio update
QIAstat-Dx approaching1,000 cumulative global placements
QIAcube Connect reaches >660 placements after early 2019 launch
Portfolio expansion
Launch of novel QIAseqpanels for DNA and RNA sequencing
QCI Precision Insightsfully incorporates N-of-One and now expands service from U.S. to Europe
Collaboration to develop KRAS companiondiagnostics in non-small cell lung cancer
Partnerships
FDA approval ofQuantiFERON-TB Gold Plus latent TB test on DiaSorin LIAISON systems
Agreement update to seven-year collaboration expands use of QCI platform to include Human Gene Mutation Database
Launch of new version of GeneGlobe Design & Analysis Hub, combining curated knowledge, content-based assays and analyses

Sample to Insight
Full-year 2020: Launching new digital PCR technology to build on Life Sciences leadership
Q4 2019 results 8
• On track for mid-2020 launch• Cost-effective technology allows conversion of any lab to dPCR• Pre-launch activities have generated significant customer buzz
◦ Already >500 sales prospects generated before launch◦ First orders received from major U.S. customers
QIAcuity: Differentiated new scalable digital PCR platformsQIAGEN digital PCR technology
addressing >$4.5 billion
combined PCR market
Nanoplate-based system
Microfluidic chambers
Specification QIAcuity instrumentsNanoplate digital PCR
Supplier B new systemDroplet digital PCR
Sample throughput: Low-, Mid- and High-throughput High-throughput
Time per run <2 hours 5 hours
Samples per 8-hour shift 120-1,344 480
Multiplexing capability 2- or 5-plex 4-plex
1, 4 and 8 plate capacity instruments
Enables time and cost savings over droplet digital technology
dPCR – digital PCR

Sample to Insight
Full-year 2020: Driving global expansion of QIAGEN solutions in Molecular Diagnostics
9
QuantiFERON-TB Access (QFT-Access)
No cold chain for consumables
No continuous power supply
needed
No computerneeded
(1) FDA approval granted late November 2019
On track for
H2 2020 CE-IVD launch
• Gastrointestinal panel submitted to FDA in late Q4 2019◦ Commercialization expected in H1 2020
• Meningitis panel CE-IVD on track for H1 2020 launch• Development planned for oncology, blood culture and
pneumonia panels
Reagent cartridge
• No sample or reagent preparation needed
• No electronic components
QIAstat-Dx: Additional CE-IVD and FDA approved tests
U.S. assay menu plans
MeningitisGastro
Respiratory2020
CE-IVD assay menu plans
MeningitisGastro
Respiratory
Available
• Expanding modern TB testing to low-resource, high-burden areas• Eliminates the need for an extensive laboratory infrastructure• Recognized at the United Nations Health Innovation Exchange as
a key innovation to drive conversion to modern testing
Q4 2019 results

Sample to Insight
(As of February 4, 2020) Q1 2020 outlook FY 2020 outlook
Net sales~+2-3% CER
(Prior year: $348.7 m)~+3-4% CER
(Prior year: $1,526 m)
Adjusted EPS(1) ~$0.28-0.29 CER(Prior year: $0.27)
~$1.52-1.54CER(Prior year: $1.43)
Adjustments to operating income (in $ millions):
Business integration and acquisition-related items ~$7 m ~$20 m
Restructuring-related items ~$10 m ~$20 m
Amortization of acquired intellectual property ~$20 m ~$80 m
Adjusted tax rate (In %) ~17-18% ~17-18%
Weighted average number of diluted shares outstanding (Based on $35.00 share price) ~232 million ~232 million
Q1 and full-year 2020: Outlook and assumptions
Q4 2019 results
CER – Constant exchange rates(1) QIAGEN reports adjusted results, as well as results on a constant exchange rate (CER) basis, and other non-U.S. GAAP figures to provide additional insight into its performance. These results include adjusted gross profit, adjusted operating
income, adjusted net income attributable to owners of QIAGEN N.V. and adjusted diluted EPS. Adjusted results are non-GAAP financial measures that QIAGEN believes should be considered in addition to reported results prepared in accordance with GAAP, but should not be considered as a substitute. QIAGEN believes certain items should be excluded from adjusted results when they are outside of ongoing core operations, vary significantly from period to period, or affect the comparability of results with competitors and its own prior periods. Furthermore, QIAGEN uses non-GAAP and constant currency financial measures internally in planning, forecasting and reporting, as well as to measure and compensate employees. QIAGEN also uses adjusted results when comparing current performance to historical operating results, which have consistently been presented on an adjusted basis.
Every $1.00 change in market price per share of common stock results in an ~200,000 increase / decrease in dilutive shares due to the call-spread overlay (CSO) as follows: above / below $38 for 2021 convertible notes, above $50.97 for the 2023 convertible notes and above $52.16 for the 2024 convertible notes.
10

Sample to Insight
Summary
Q4 2019 results 11
• Commitment to disciplined capital deployment
• Exceeded Q4 and full-year 2019 sales outlook, and exceeded adjusted EPS +9% CER in full-year 2019
• Taking a balanced approach to 2020 sales opportunities and risks while expecting solid earnings growth
• Improved profitability through NGS portfolio decisions and efficiency measures
Dr. Katja Saenger and Andrea Sauer, MVZ Laboratory, Leipzig

Sample to Insight
Appendix
George Mason University in Fairfax, Virginia
Sample to Insight
1.06 1.111.27 1.34
2015 2016 2017 2018 2019
Significant progress on profitability towards value creation
13
2015-2019: Adjusted diluted EPS trendsin $ per share
$1.43($1.46 CER)
Q4 2019 results

Sample to Insight
Three months ended Three months ended(In $ thousands, except share data) December 31, 2019 December 31, 2018Net sales 413,472 403,173Cost of sales:
Cost of sales 117,698 125,311Acquisition-related intangible amortization 16,209 13,108
Total cost of sales 133,907 138,419Gross profit 279,565 264,754Operating expenses:
Research and development 33,988 40,667Sales and marketing 98,316 97,876General and administrative 25,284 23,291Acquisition-related intangible amortization 5,827 9,436Restructuring, acquisition, integration and other, net 34,960 5,189Long-lived asset impairments 1,201 22
Total operating expenses 199,576 176,481Income from operations 79,989 88,273
Adjusted income from operations 138,575 119,449Other income (expense):
Interest income 4,197 5,764Interest expense (18,321) (20,183) Other income (expense), net 3,074 (5,421)
Total other expense, net (11,050) (19,840) Income before income taxes 68,939 68,433
Adjusted income before income taxes 134,728 114,355Income taxes 24,007 7,483
Adjusted income tax 24,655 20,678Net income 44,932 60,950
Adjusted net income 110,073 93,677Diluted net income per common share $0.19 $0.26
Adjusted diluted net income per common share $0.48 $0.40Diluted shares used in computing diluted net income per common share (in thousands) 231,346 232,357
Q4 2019: Consolidated Statements of Income (unaudited)
Q4 2019 results 14

Sample to Insight
FY 2019: Consolidated Statements of Income (unaudited)
Q4 2019 results
(1) Diluted net loss per share in the twelve months ended December 31, 2019, based on basic shares (FY 2019: 226,777)
15
Twelve months ended Twelve months ended(In $ thousands, except share data) December 31, 2019 December 31, 2018Net sales 1,526,424 1,501,848Cost of sales:
Cost of sales 449,651 444,165Acquisition-related intangible amortization 71,511 56,723
Total cost of sales 521,162 500,888Gross profit 1,005,262 1,000,960Operating expenses:
Research and development 157,448 161,852Sales and marketing 391,906 392,281General and administrative 112,262 104,568Acquisition-related intangible amortization 29,973 39,032Restructuring, acquisition, integration and other, net 199,778 28,659Long-lived asset impairments 140,031 7,987
Total operating expenses 1,031,398 734,379(Loss) income from operations (26,136) 266,581
Adjusted income from operations 421,792 403,315Other income (expense):
Interest income 22,113 20,851Interest expense (74,185) (67,293)Other income, net 432 5,598
Total other expense, net (51,640) (40,844)(Loss) income before income taxes (77,776) 225,737
Adjusted income before income taxes 409,558 385,450Income taxes (36,321) 35,357
Adjusted income tax 76,735 73,560Net (loss) income (41,455) 190,380
Adjusted net income 332,823 311,891Diluted net (loss) income per common share(1) ($0.18) $0.82
Adjusted diluted net income per common share $1.43 $1.34Diluted shares used in computing diluted net income per common share (in thousands) 232,420 233,456

Sample to Insight
In $ millions (Except EPS)(Unaudited)
Net sales
Gross profit
OperatingIncome (loss)
Pretax income (loss)
Income tax
Tax rate
NetIncome (loss)
Diluted EPS(1)
Fourth quarter 2019
Reported results 413.5 279.6 80.0 68.9 (24.0) 35% 44.9 0.19Adjustments
Business integration, acquisition and restructuring-related items (including litigation) 0.4 11.7 11.7 (3.2) 8.5 0.04
2019 restructuring measures 24.9 24.9 2.3 27.2 0.12Purchased intangibles amortization 16.2 22.0 22.0 (5.6) 16.4 0.07Non-cash interest expense charges 9.5 9.5 0.04Other special income and expense (2.2) 5.8 3.6 0.02
Total adjustments 16.6 58.6 65.9 (0.7) 65.2 0.29Adjusted results 413.5 296.2 138.6 134.7 (24.7) 18% 110.1 0.48
Full-year 2019
Reported results 1,526.4 1,005.3 (26.1) (77.8) 36.3 47% (41.5) (0.18)Adjustments
Business integration, acquisition and restructuring-related items (including litigation) 6.6 44.7 44.7 (12.1) 32.6 0.14
2019 restructuring measures 301.8 306.5 (72.4) 234.1 1.01Purchased intangibles amortization 71.5 101.5 101.5 (25.9) 75.6 0.33Non-cash interest expense charges 40.0 40.0 0.17Other special income and expense (5.4) (2.6) (8.0) (0.03)
Total adjustments 78.1 447.9 487.3 (113.0) 374.3 1.62Adjusted results 1,526.4 1,083.4 421.8 409.6 (76.7) 19% 332.8 1.43
Q4 and FY 2019: Reconciliation adjusted results
Q4 2019 results
(1) Reported Diluted EPS does not consider dilutive shares in the twelve months ended December 31, 2019 as those shares would be antidilutive. Basic shares for FY 2019 were 226.8 M. Impact of adjustments and Adjusted Diluted EPS were calculated using 231.3 M diluted shares for Q4 2019 and 232.4 M for FY 2019. Table may have rounding differences.
16
Sample to Insight
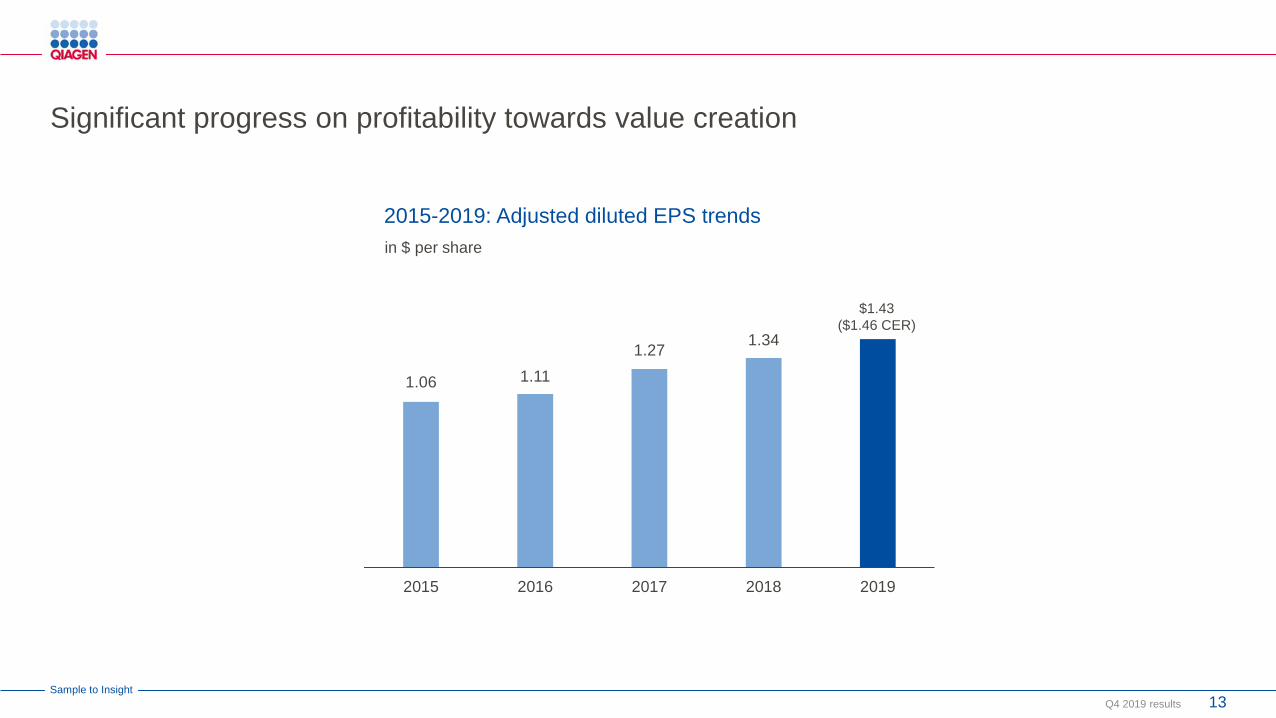
Q4 and FY 2019: Currency impact
Q4 2019 results
Net sales (In $ millions)
Net sales(CER)
Currency exposure(As % of CER sales)
Change(In $ millions)
Fourth quarter 2019
U.S. dollar 184.8 184.8 44% 0.0Euro 96.5 99.0 24% -2.5British pound 16.1 16.0 4% 0.1Japanese yen 13.7 13.2 3% 0.5Other currencies 102.4 104.9 25% -2.5Total net sales 413.5 417.9 100% -4.4
Full-year 2019
U.S. dollar 737.4 737.4 47% 0.0
Euro 315.8 331.8 21% -16.0
British pound 63.3 66.1 4% -2.8
Japanese yen 54.0 53.4 4% 0.6
Other currencies 356.0 376.9 24% -20.9
Total net sales 1,526.4 1,565.5 100% -39.1
CER - Constant exchange rates Table may have rounding differences.Other currencies include CAD, DKK, TRY, SEK, CHF, AUD, BRL, CNY, MYR, SGD, KRW, HKD, MXN, INR, TWD, RUB, THB and ZAR
17
Sample to Insight
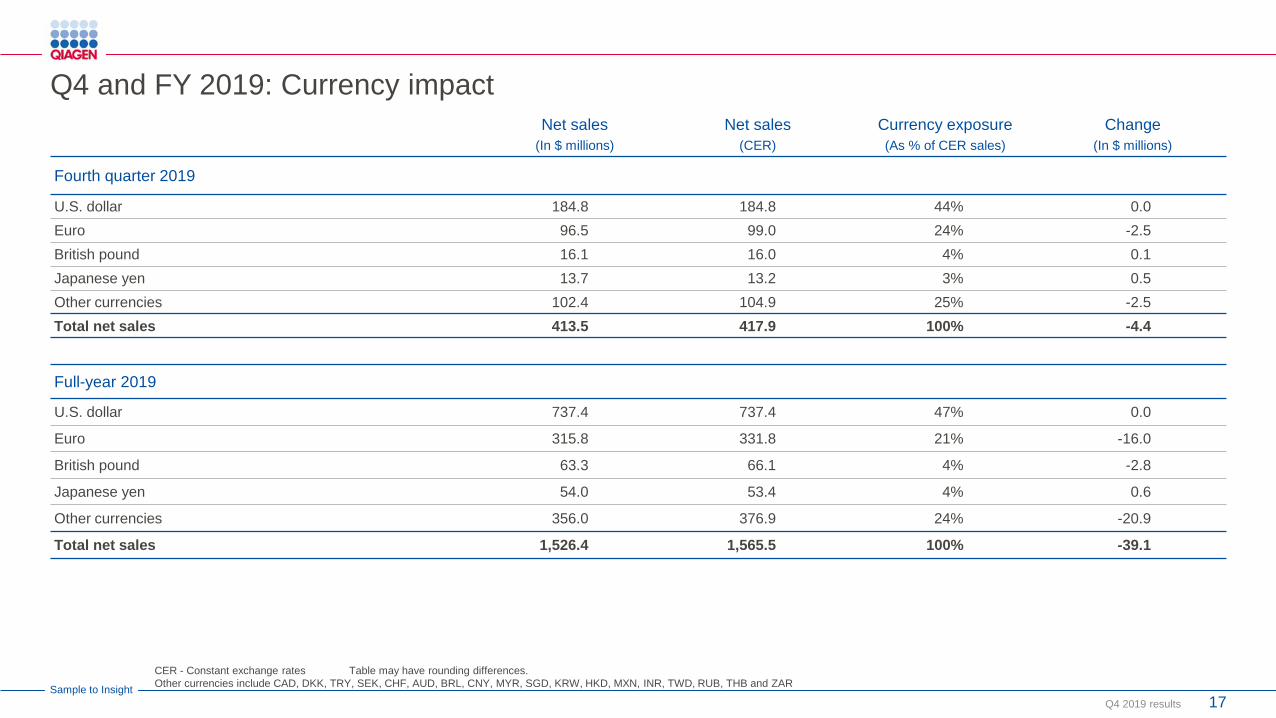
2019: Quarterly and full-year income statement summary
Q4 2019 results
(1) Reported diluted EPS for Q3 and FY 2019 based on basic shares of 226.5 million and 226.8 million, respectively. CER - Constant exchange rates Table may have rounding differences. Refer to accompanying tables for reconciliation of reported to adjusted figures.
(In $ millions, unless indicated)(Diluted EPS in $ per share) Q1 2019 Q2 2019 Q3 2019 Q4 2019 FY 2019
Net sales 348.7 381.6 382.7 413.5 1,526.4
Net sales (CER) 364.5 394.5 388.6 417.9 1,565.5
Gross profit 224.8 245.9 254.9 279.6 1,005.3
Gross profit margin 64% 64% 67% 68% 66%
Adjusted gross profit 243.2 270.2 273.8 296.2 1,083.4
Adjusted gross profit margin 70% 71% 72% 72% 71%
Operating income (loss) 41.2 60.2 -207.5 80.0 -26.1
Operating margin 12% 16% -54% 19% -2%
Adjusted operating income 77.9 99.1 106.2 138.6 421.8
Adjusted operating margin 22% 26% 28% 34% 28%
Tax rate -4% 14% 29% 35% 47%
Adjusted tax rate 20% 20% 18% 18% 19%
Net income (loss) 29.5 44.7 -160.6 44.9 -41.5
Adjusted net income 62.0 77.4 83.4 110.1 332.8
Diluted EPS(1) 0.13 0.19 -0.71 0.19 -0.18
Adjusted diluted EPS (CER) ($ per share) 0.27 (0.28) 0.33 (0.34) 0.36 (0.36) 0.48 (0.48) 1.43 (1.46)
Diluted shares outstanding for EPS calculation 233.6 232.7 232.0 231.3 232.4
18

Sample to Insight
2018: Quarterly and full-year income statement summary
Q4 2019 results
CER - Constant exchange rates Table may have rounding differences. Refer to accompanying tables for reconciliation of reported to adjusted figures.
(In $ millions, unless indicated)(Diluted EPS in $ per share) Q1 2018 Q2 2018 Q3 2018 Q4 2018 FY 2018
Net sales 343.6 377.2 377.9 403.2 1,501.8
Gross profit 225.7 253.8 256.8 264.8 1,001.0
Gross profit margin 66% 67% 68% 66% 67%
Adjusted gross profit 240.6 269.9 270.3 281.3 1,062.0
Adjusted gross profit margin 70% 72% 72% 70% 71%
Operating income 47.9 53.3 77.0 88.3 266.6
Operating margin 14% 14% 20% 22% 18%
Adjusted operating income 77.2 101.0 105.6 119.5 403.3
Adjusted operating margin 22% 27% 28% 30% 27%
Tax rate 17% 20% 16% 11% 16%
Adjusted tax rate 20% 20% 19% 18% 19%
Net income 32.3 36.8 60.3 60.9 190.4
Adjusted net income 59.6 77.2 81.5 93.7 311.9
Diluted EPS 0.14 0.16 0.26 0.26 0.82
Adjusted diluted EPS (CER) ($ per share) 0.26 0.33 0.35 0.40 1.34
Diluted shares outstanding for EPS calculation 232.5 233.8 235.2 232.4 233.5
19

Sample to Insight
2019: Total net sales overview
Q4 2019 results
(1) Rest of World contributed less than 1% of net sales in Q1 2019, Q2 2019, Q3 2019, Q4 2019 and FY 2019Tables may contain rounding differences 2019 results do not exclude sales of products affected by business portfolio changes
Net sales by customer class
(In $ millions at actual rates / change in actual, CER rates) Q1 2019 Q2 2019 Q3 2019 Q4 2019 FY 2019
Sales Act. CER Sales Act. CER Sales Act. CER Sales Act. CER Sales Act. CER
Molecular Diagnostics 168 4% 10% 188 1% 5% 183 -3% -2% 198 2% 3% 737 1% 4%
Life Sciences 181 -1% 3% 194 2% 5% 199 6% 7% 216 3% 4% 789 2% 5%
Academia / Applied Testing 110 -2% 2% 118 2% 5% 122 4% 6% 138 3% 3% 487 2% 4%
Pharma 71 1% 4% 76 2% 4% 77 9% 10% 78 4% 5% 302 4% 6%
Net sales by region
(In $ millions at actual rates / change in actual, CER rates) Q1 2019(1) Q2 2019(1) Q3 2019(1) Q4 2019(1) FY 2019(1)
Sales Act. CER Sales Act. CER Sales Act. CER Sales Act. CER Sales Act. CER
Americas 170 7% 8% 181 1% 1% 192 3% 4% 180 6% 7% 722 4% 5%
Europe / Middle East / Africa 109 -6% 4% 118 -2% 5% 114 3% 7% 146 2% 5% 487 -1% 5%
Asia-Pacific / Japan 69 2% 6% 83 8% 12% 76 -6% -5% 87 -4% -4% 314 0% 2%
20
Sample to Insight
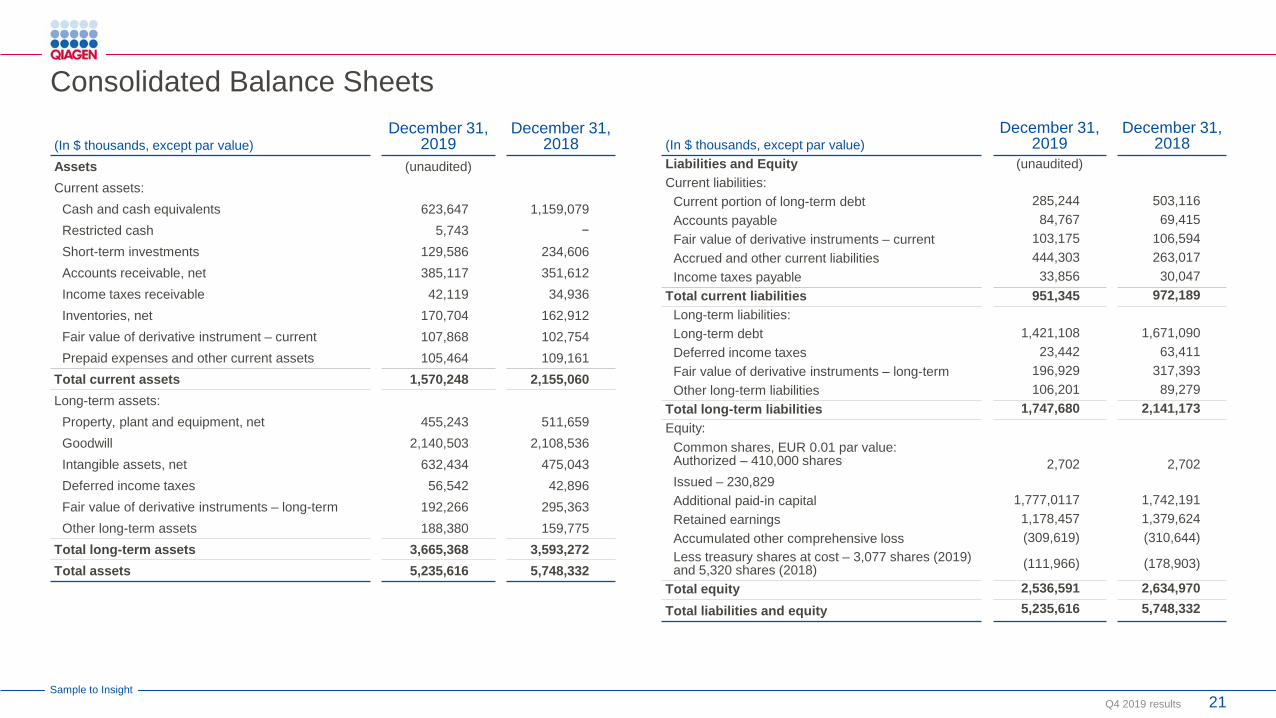
Consolidated Balance Sheets
Q4 2019 results 21
(In $ thousands, except par value)December 31,
2019December 31,
2018Assets (unaudited)Current assets:
Cash and cash equivalents 623,647 1,159,079Restricted cash 5,743 −Short-term investments 129,586 234,606Accounts receivable, net 385,117 351,612Income taxes receivable 42,119 34,936Inventories, net 170,704 162,912Fair value of derivative instrument – current 107,868 102,754Prepaid expenses and other current assets 105,464 109,161
Total current assets 1,570,248 2,155,060Long-term assets:
Property, plant and equipment, net 455,243 511,659Goodwill 2,140,503 2,108,536Intangible assets, net 632,434 475,043Deferred income taxes 56,542 42,896Fair value of derivative instruments – long-term 192,266 295,363Other long-term assets 188,380 159,775
Total long-term assets 3,665,368 3,593,272Total assets 5,235,616 5,748,332
(In $ thousands, except par value)December 31,
2019December 31,
2018Liabilities and Equity (unaudited)Current liabilities:
Current portion of long-term debt 285,244 503,116Accounts payable 84,767 69,415Fair value of derivative instruments – current 103,175 106,594Accrued and other current liabilities 444,303 263,017Income taxes payable 33,856 30,047
Total current liabilities 951,345 972,189Long-term liabilities:Long-term debt 1,421,108 1,671,090Deferred income taxes 23,442 63,411Fair value of derivative instruments – long-term 196,929 317,393Other long-term liabilities 106,201 89,279
Total long-term liabilities 1,747,680 2,141,173Equity:
Common shares, EUR 0.01 par value:Authorized – 410,000 sharesIssued – 230,829
2,702 2,702
Additional paid-in capital 1,777,0117 1,742,191Retained earnings 1,178,457 1,379,624Accumulated other comprehensive loss (309,619) (310,644)Less treasury shares at cost – 3,077 shares (2019) and 5,320 shares (2018) (111,966) (178,903)
Total equity 2,536,591 2,634,970Total liabilities and equity 5,235,616 5,748,332
Sample to Insight
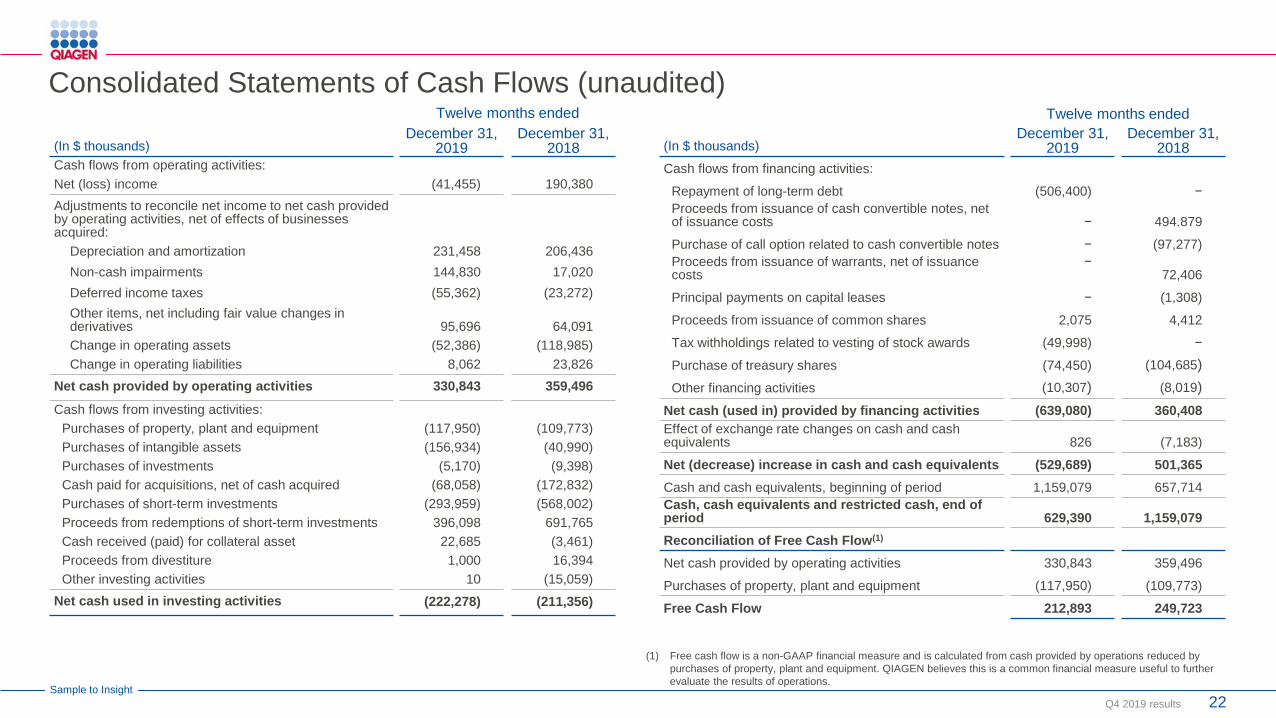
Consolidated Statements of Cash Flows (unaudited)
Q4 2019 results
Twelve months ended
(In $ thousands)December 31,
2019December 31,
2018Cash flows from operating activities:Net (loss) income (41,455) 190,380Adjustments to reconcile net income to net cash provided by operating activities, net of effects of businesses acquired:
Depreciation and amortization 231,458 206,436Non-cash impairments 144,830 17,020Deferred income taxes (55,362) (23,272)Other items, net including fair value changes in derivatives 95,696 64,091Change in operating assets (52,386) (118,985)Change in operating liabilities 8,062 23,826
Net cash provided by operating activities 330,843 359,496Cash flows from investing activities:
Purchases of property, plant and equipment (117,950) (109,773)Purchases of intangible assets (156,934) (40,990)Purchases of investments (5,170) (9,398)Cash paid for acquisitions, net of cash acquired (68,058) (172,832)Purchases of short-term investments (293,959) (568,002)Proceeds from redemptions of short-term investments 396,098 691,765Cash received (paid) for collateral asset 22,685 (3,461)Proceeds from divestiture 1,000 16,394Other investing activities 10 (15,059)
Net cash used in investing activities (222,278) (211,356)
(1) Free cash flow is a non-GAAP financial measure and is calculated from cash provided by operations reduced by purchases of property, plant and equipment. QIAGEN believes this is a common financial measure useful to further evaluate the results of operations.
Twelve months ended
(In $ thousands)December 31,
2019December 31,
2018Cash flows from financing activities:
Repayment of long-term debt (506,400) −Proceeds from issuance of cash convertible notes, net of issuance costs − 494.879
Purchase of call option related to cash convertible notes − (97,277)Proceeds from issuance of warrants, net of issuance costs
−72,406
Principal payments on capital leases − (1,308)
Proceeds from issuance of common shares 2,075 4,412
Tax withholdings related to vesting of stock awards (49,998) −
Purchase of treasury shares (74,450) (104,685)Other financing activities (10,307) (8,019)
Net cash (used in) provided by financing activities (639,080) 360,408Effect of exchange rate changes on cash and cash equivalents 826 (7,183)
Net (decrease) increase in cash and cash equivalents (529,689) 501,365Cash and cash equivalents, beginning of period 1,159,079 657,714Cash, cash equivalents and restricted cash, end of period 629,390 1,159,079Reconciliation of Free Cash Flow(1)
Net cash provided by operating activities 330,843 359,496
Purchases of property, plant and equipment (117,950) (109,773)
Free Cash Flow 212,893 249,723
22

Sample to Insight
Employees as of December 31, 2019
Q4 2019 results
AmericasEurope /
Middle East / AfricaAsia Pacific /Japan / ROW
Total Q4 2019
Total Q4 2018 Change
Production 252 777 135 1,164 1,067 9%
R&D 188 718 47 953 1,056 -10%
Sales 540 798 732 2,070 1,990 4%
Marketing 69 161 79 309 308 0%
Administration 83 366 151 600 531 13%
Total 1,132 2,820 1,144 5,096 4,952 3%
23

Sample to Insight
Abbreviations
Q4 2019 results 24
Adj AdjustedAIV Avian influenza virus ALK Anaplastic Lymphoma KinaseAML1 Acute Lymphoblastic LeukemiaASR Analyte Specific Reagent AUD Australian DollarBAALC Brain and Acute Leukemia, CytoplasmicBRCA Breast Cancer geneBCR-ABL Breakpoint cluster region-abelsonBRAF Serine/Threonine-Protein Kinase B-RafBRL Brazilian RealBKV BK VirusBVDV Bovine Virus DiarrheaC. Diff Clostridium DifficileCAD Canadian Dollar CDx Companion diagnosticsCE European Conformance MarkCER Constant Exchange RatesCHF Swiss Franc CLLU1 Chronic Lymphocytic LeukemiaCMV Cytomegalovirus CNY China Yuan Renminbi CRC Colorectal CancerCSFV Classical Swine Fever VirusCT Chlamydia TrachomatisDKK Danish KronaDNA Deoxyribonucleic acidEBITDA Earnings before Interest, Taxes,
Depreciation and Amortization
EBV Epstein-Barr virus EGFR Epidermal Growth Factor Receptor EGM Emerging Growth MarketsEPS Earnings per shareEU European UnionESBL Extended Spectrum BetaEUR EuroFDA Food and Drug AdministrationFX Foreign exchange GAAP Generally Accepted Accounting PrinciplesGAS Group A StreptococcusGBP British PoundGBS Group B Streptococcal SepticemiaGMO Genetically Modified OrganismHAV Hepatitis A VirusHBV Hepatitis B Virus HCV Hepatitis C virusHCMV Human cytomegalovirusHEV Hepatitis E VirusHIV Human Immunodeficiency Virus HSV Herpes Simplex VirusHPV Human PapillomavirusHSV 1/2 Herpes Simplex Virus 1 and 2IDH 1/2 Isocitrate Dehydrogenase 1 and 2Ifp Institute for Product QualityIVD In Vitro DiagnosticINR Indian RupeeIP Intellectual PropertyJAK2 Janus Kinase 2
JPY Japan YenKRAS Kirsten rat Sarcoma Viral Oncogene
Homolog KRW South Korean Won LATAM Latin AmericaLDT Laboratory Developed TestsLIS Laboratory information systemMG Mycoplasma genitaliumMGMT Methylguanine-methyltransferaseMg/Ms Mycoplasma Mg/MsMDx Molecular DiagnosticsMN1 Meningioma 1MP Mycoplasma PneumoniaMRSA Methicillin-Resistant Staphylococcus
AureusMTB Mycobacterium TuberculosisMPL Myeloproliferative leukemiaNG Neisseria GonorrheaeNGS Next Generation Sequencing NPM1 NucleophosminNIH National Institutes of HealthNM Not MeaningfulNRAS Neuroblastoma RAS-viralPCR Polymerase chain reactiondPCR Digital PCRPI3K Phosphoinostide 3-kinasePP&E Property, plant and equipmentQFT QuantiFERONQCI QIAGEN Clinical Insights
R&D Research & DevelopmentRoW Rest of WorldRGQ Rotor-Gene QRNA Ribonucleic Acid ROM Rupture of Fetal MembranesRSV Respiratory syncytial virusRUO Research Use Only SARS Severe Acute Respiratory SyndromeSBV Schmallenberg Virus STI Sexually transmitted infectionVZV Varicella-Zoster Virus TB Tubercle Bacillus THB Thai BahtTrich TrichomoniasisTRY Turkish New LiraUGT1A1 UDP-glucuronosyltransferase 1-1 USD U.S. DollarUU Ureaplasma UrealyticumWGA Whole Genome AmplificationZAR South African Rand
Sample to Insight
Share informationNYSE: QGEN
Frankfurt: QIA
ISIN / CUSIP: NL0012169213 / N72482 123
WKN: A2D KCH
CalendarQ1 2020 results May 2020
Annual General Meeting June 2020
Q2 2020 results July 2020
Your contacts
Q4 2019 results 25
E-mail: [email protected]: ir.qiagen.com
www.linkedin.com/company/qiagen
John GilardiVice President Corporate Communications and IR
Phone: +49 2103 29 11711 +1 240 686 2222
Mobile: +49 152 018 11711
E-mail: [email protected]
Phoebe LohAssociate DirectorInvestor Relations
Phone: +49 2103 29 11457Mobile: +49 152 018 11457
E-mail: [email protected]
Alexandra KoenigCoordinatorInvestor Relations
Phone: +49 2103 29 11709Mobile: +49 152 018 11709
E-mail: [email protected]/QIAGEN
twitter.com/QIAGEN
www.youtube.com/user/QIAGENvideos