
FOURTH NATIONAL COMMUNICATION ON …unfccc.int/resource/docs/natc/bgrnc4.pdfHPP Hydro Power Plant...
139
REPUBLIC OF BULGARIA FOURTH NATIONAL COMMUNICATION ON CLIMATE CHANGE UNITED NATIONS FRAMEWORK CONVENTION ON CLIMATE CHANGE SOFIA - 2006
Transcript of FOURTH NATIONAL COMMUNICATION ON …unfccc.int/resource/docs/natc/bgrnc4.pdfHPP Hydro Power Plant...

REPUBLIC OF BULGARIA
FOURTH
NATIONAL COMMUNICATION
ON CLIMATE CHANGE
UNITED NATIONS
FRAMEWORK CONVENTION ON CLIMATE CHANGE
SOFIA - 2006


LIST OF ABBREVIATIONS
a.s.l. above see levelBAS Bulgarian Academy of Sciences
DSSAT Decision Support System for Agrotechnology Transfer
EC European Commission
EE Energy Efficiency
EEA Energy Efficiency Agency
EPER European Pollutant Emission Register EU European Union
EU ETS European Union Emission Trading Scheme
ExEA Executive Environmental Agency
FCCC Framework Convention on Climate Change
FEC Final Energy Consumption
FEC Final Energy Consumption
GDP Gross Domestic Product
GEF Global Environmental Facility
GHG Green House Gases
GVA Gross Value Added HPP Hydro Power Plant
IMCCC Inter-Ministerial Committee on Climate Change
IPPC Integrated Pollution Prevention and Control ISPA, PHARE,SAPHARD European Union funds and programmes
IWG Interministerial Working Group
JI Joint Implementation
JISC Joint Implementation Steering Committee
KP Kyoto Protocol
LUCF Land use Change and Forestry MAF Ministry of Agriculture and Forestry. MEE Ministry of Economy and Energy
MES Ministry of Education and Science
MF Ministry of Finance
MFA The Ministry of Foreign Affairs
MOEW Ministry of Environment and Water
MRDPW Ministry of Regional Development and Public Works
NCCAP (NAPCC) National Climate Change Action Plan
NFD National Forestry Directorate
NGO Nongovernmental OrganizationNIMH National Institute of Meteorology and Hydrology
NPP Nuclear Power Plant
NSI National Statistical Institute
PEC Primary Energy Consumption
PRTR Pollutant Release and Transfer Register
R&D Research and Development
Fourth National Communication on Climate Change1
RES Renewable Energy Sources
SAF State Agricultural Fund
SC Steering Committee
SME small and medium-sized enterprisesTPP Thermal Power Plant UN United Nations
UNFCCC United Nations Framework Convention on Climate Change
Republic of Bulgaria, Ministry of Environment and Water2

TABLE OF CONTENTS
LIST OF ABBREVIATIONS 1TABLE OF CONTENTS 3EXECUTIVE SUMMARY 51 INTRODUCTION 152 NATIONAL CIRCUMSTANCES 172.1. Background and Institutional Setting 172.2. Government Structure 172.3. Geographic Profile 172.4. Climate Profile 182.5. Population Profile 192.6. Economic Profile 202.7. Privatization 232.8. Sectors 232.9. Biodiversity 252.10. Taxes and Charges. Tax Policy 262.11. Energy and Industrial Profile 272.12. Transport 282.13. Waste 303 INVENTORIES OF GREENHOUSE GAS EMISSIONS BY SOURCES AND REMOVALSBY SINKS 313.1. Introduction 313.2. Trends of Bulgaria’s Greenhouse Gas Emission 313.3. Summary of Methodology and Data Sources 323.4. Summary of the Key Sources of GHG Emissions 363.5. Sub-sector “Transport” 393.6. CH4 Emissions 403.7. HFCs, PFCs and SF6 Emissions 434 POLICIES AND MEASURES 474.1. Introduction 474.2. Institutional Organization 474.3. Policy Instruments 494.4. Sectoral Policies and Measures for Reducing GHG Emissions in Bulgaria 535 PROJECTIONS AND EFFECTS OF POLICIES AND MEASURES 635.1. Introduction 635.2. Projections 635.3. Methodology 845.4. Sectoral Analysis of the GHG Emission Projections 866 VULNERABILITY ASSESSMENT, CLIMATE CHANGE INFLUENCE AND ADAPTATION MEASURES 896.1. Background 896.2. Climate Change Scenarios 936.3. Vulnerability Assessment 976.4. Adaptation 1037 FINANCIAL RESOURCES AND TECHNOLOGIES TRANSFER 1097.1. Introduction 1097.2. The Joint Implementation Mechanism in Bulgaria 1097.3. List of the Approved Joint Implementation Projects 1107.4. List of Supported Project ideas for the Joint Implementation Mechanism 111
Fourth National Communication on Climate Change3

8 EDUCATION, TRAINING AND PUBLIC AWARENESS 1138.1. Introduction 1138.2. Education 1138.3. Ecotourism 1168.4. Contribution of MES in Sector “Household and services” in the Second National ClimateChange Action Plan 1169 RESEARCH PROJECTS AND SYSTEMATIC OBSERVATION 1199.1. Strategic Projects 1209.2. Current Projects with International Financing 1209.3. Financial Sources for Environmental Projects in Bulgaria 1229.4. Systematic Observation 12210 ANNEX 127
Republic of Bulgaria, Ministry of Environment and Water4

EXECUTIVE SUMMARY
S.1. Introduction
The United Nations Framework Convention on Climate Change (UNFCCC), thereon referred to as the Convention, is the first and major international legal instrument to address climatechange issues at a global scale. Acknowledging the importance of the climate change issue and the need for international cooperation to address this problem, Bulgaria signed the UNFCCC in Rio de Janeiro in June 1992 and the Parliament ratified it in March 1995. In compliance with Article 4.6 and 4.2(b) of the FCCC, Bulgaria as a country in transition has adopted 1988 as a base year for the implementation of the Convention instead of 1990. The First and SecondNational Communications of Bulgaria were elaborated by the Interministerial Committeesupported by independent organizations and experts. The work was coordinated by theMinistry of Environment and Water. The Third National Communication was a further step in elaborating and implementing the national climate change policy. It was delivered after the Kyoto Conference of the Parties and after the new commitments agreed by the Parties to the Convention. According to Annex B of the Kyoto Protocol† the quantified emission reduction commitment of Bulgaria for the first commitment period (2008-2012) is 8 % of the base year (1988) emissions.
The Fourth National Communication has been prepared by the Ministry of Environment and Water by assignment to the Energy Institute in cooperation with the, Ministry of Agriculture and Forestry, Ministry of Economy and Energy, Ministry of Economy and Energy, National Institute of Meteorology and Hydrology and Energy Efficiency Agency. It presents the main principles of the national policy on climate change. The structure and organization of this report follow the UNFCCC Guidelines (FCCC/CP/1999/7).
S.2. National Circumstances
Bulgaria is situated in the Southeast part of the Balkan Peninsula. The country has a territory of 110,993.6 sq. km., bordering Greece and Turkey to the South, FY Republic of Macedonia and Yugoslavia to the West. The River Danube separates it from Romania to the North. Its natural eastern border is the Black Sea. Bulgaria ranks fifteenth in size among the European countries. Bulgaria is dominated by rugged mountains, except for the Danube lowland in the north that it shares with Romania. The lay of Bulgaria is highly varied
The climate in Bulgaria is temperate Continental-Mediterranean. Due to the geographicalsituation and the varied landscape, the contrasts in the climate are distinct among regions. The climate is with four distinctive seasons and varies with altitude and location. The Black Sea coast features a milder winter as opposed to the harsher winter conditions in the central north plains. The air humidity is between 66 and 85% in the different regions of the country. There is a stable snow cover during the winter of about 20-200 cm. The average wind speed is 1.2 m/s (1.3 m/s inwinter time), while prevailing winds are west or northeast.
In the last few years the tendency is towards warmer and drier climate. 1998 had warm and dry winter, hot dry summer, cool dry spring, and cold and very rainy fall. Average precipitation in Bulgaria is about 630 millimetres per year. The demographic picture in Bulgaria is unfavourable at the beginning of the XXI century. It ranks the country amongst those in Europe with negative rate of natural increase, low birth rate,high adult mortality and child death rate, decreasing average age of population. Most of the
† The Kyoto Protocol was ratified by the Bulgarian Parliament on July 17, 2002.
Fourth National Communication on Climate Change5

population is concentrated in the urban areas. Sofia – the largest city and the capital of the country – has a population of over a million inhabitants.The relative share of the population in working age decreases. Currently every forth person in Bulgaria is a pensioner. The trends for the main demographic parameters – birth rate, death rate and natural increase are given in Figure S.1.
Figure S.1 Demographic parameters, ‰
Birth-rate Death-rate Natural growth
Population density is 70.3 per sq km at the end of 2003. Bulgaria’s population was 7 801.3 thousand people at the end of 2003. Due to more deaths than births, the population has decreased with 40 224 (or with 0.5%) for one year. The average age of the population for the country is 41.0 for 2003. The aging process is observed not only in the villages but also in the cities, while the average age for the villages is higher than in the cities. For the cities the index is 39.3 and for the villages it is 41.0 years. 5 431.8 thousand people live in cities in 2003, that is 70.0% of the population of the country, while 2 329.2 thousand (or 30.0%) live in villages.
Economic profile: The country has successfully achieved and continues to delivermacroeconomic stability after 1998. The introduced Currency Board, sound fiscal policy, limitedpay raise, etc. have been rules, administrative in their nature, which are in the basis of the macroeconomic and financial stability. After the introduction of the currency board and the denomination of the lev in 1999, a slow increase in GDP is witnessed in the country. GDP growth is at moderate, balanced pace with no sudden fluctuations, typical for past periods.During the last few years of the analysis, the pace of GDP growth is bigger due to favourable economic climate in the country. The registered average annual real rate of growth (4.4%) is far beyond the rate of the European economies, which facilitates Bulgaria becoming closer to the EU.
The agriculture is one of the most important sectors of the Bulgarian economy. Much of the Bulgarian population is occupied in it. The sector forms a relatively small share of the GDP. Cultivated agricultural land covers 48% of the total territory of the country. The favourableclimate for various cultures, the fertile soil and long standing traditions in the sector, low labourcost, the presence of colleges and high schools on modern farming training can support a promising development of this sector. Agriculture is in a crisis at present. Most of the farms aresmall and do not have at their disposal significant financial means. Various European funds are not enough efficiently used. The state must intervene to get out quickly of the crisis in this important structural sector of the Bulgarian economy.
Republic of Bulgaria, Ministry of Environment and Water6

Forestry is a traditional important economic sector for Bulgaria, where significant state investments for the last 40 years have created a potential for significant and sustainable logging in the future, when young plantations will grow and become suitable for felling.
The forests cover some 34% of the total area of the country, support valuable ecosystems and control erosion. A big share of these forests (39.8%) has special function – protective and rehabilitation. A potential problem in the sector is the slow pace of reforms and restructuring.
The objective of the tax policy is to reach macroeconomic stability, a sustainable economicgrowth, preparation of the country for EC membership and increase of social responsibility.
The objectives above cause reduction of the social security burden increase of indirect taxes, raising the threshold of the personal income amount not subject to taxation, profit tax reduction and raising the property tax assessment values. The Bulgarian government has declared its intention for lowering the corporate tax rates with several percentage points and also its intentions for new legislation on corporate tax and Value Added Tax.
Energy - Bulgaria imports 100% of the needed nuclear fuel, 99% of the oil, 99% of the natural gas and 44% of the coal. The structure of the Final Energy Consumption (FEC) for the Bulgarian economy predetermines a big share of secondary energies and necessity of transformation of asignificant quantity of energy resources, i.e. about 40% of the energy resources included in the Primary Energy Consumption (PEC) are lost in the transformation processes. The primaryenergy intensity of the GDP drops down continuously for the period 1997-2003 but the pace of reduction has decreased after 2003.
Industry - The Bulgarian industry has gone its difficult way from centralized planned economyto the open gates of EU. As an ex member country of Comecon, in a short period of time,Bulgaria was industrialized with low efficiency heavy industry, which was also great resource consumer. The private sector and the main manufacturing sectors in the Bulgarian industry havea significant share in the growth during the last few years.
Transport - The transport network is characterized by a poorly developed infrastructure in alltransport sectors. Bulgaria is drafting a concept for the development of transport infrastructureduring the period 2005-2015. The vehicle park in Bulgaria is changing its structure not only in quantity but also in quality for the last few years. The increased number of passenger cars comesfrom the big import of second hand cars mainly from Germany, Austria and the Netherlands. This determines their relative high average age. The vehicles are 2 652 556 on 31.12.2003 and the unfavourable proportion in regard to their age related to the year of their initial registration is being kept. More than 1/3rd of the total number of vehicles is older than 20 years, which causes increased emissions in the atmosphere on one hand and increased number of car incidents on the other.
Waste - Landfilled solid waste is one of the key contributors for GHG emissions in Bulgaria.
S.3. Inventories of Greenhouse Gas Emissions by Sources and Removals by Sinks
The GHG Inventory for the year 2003 revealed that the overall GHG emissions expressed inCO2–eqv. are 69 167 Gg not taking into account the sequestration in sector Land use Change and Forestry. The net emissions (including the sequestration from LUCF) are 62 111 Gg. In 2003 theCO2 emissions form the largest share of 75 % from the overall GHG emissions expressed in CO2-eqv.; the CH4 emissions are second with 15 % and the N2O emissions with a 10 % sharestand in the third place.
There can be seen that in the year 2003 the overall of the GHG emissions expressed in CO2-eqv.registered an increase. The emissions for the year 2003 are 50 % in comparison to the base year 1988 and they registered an increase with 9.2 % in comparison to the previous year 2002.
Fourth National Communication on Climate Change7
The “Energy sector” headed the list of emission sources in 2003 with the biggest share – 77 %. Sector “Waste” ranked the second place, and sector “Industrial processes” ranked the third place.
CO2 emissions from road transport were key source of GHG emissions. These emissions were 9 % of the overall country emissions in 2003
S.4. Policies and Measures
The main framework of the environmental policy in the country is the National EnvironmentalStrategy, which serves as a base for the activities in the environmental policy areas, including climate change.
Due to the forthcoming accession of Bulgaria to the European Union the country is harmonizingall the aspects of the environmental legislation with the EU legislation. Based on the legal acts the Government has approved set of secondary laws, regulations and methodologies of the MOEW and its subsidiaries, which are already operational. The harmonization of the legislationis ongoing and all the already approved and the future EU legislative initiatives in the field of climate change will find place within the Bulgarian legislation.
Institutional Organization
The Ministry of Environment and Water (MOEW) is the governmental institution authorized to develop and carry out the state policy related to protection of the environment. MOEW isresponsible for the preparation and reporting of the annual inventories of GHG emissions, as well as for the formulation and implementation of the policies and measures to mitigate climatechange.
The Inter-Ministerial Committee on Climate Change IMCCC was set up under theGovernmental decision to coordinate the implementation of the First Action Plan on ClimateChange in July 2000. The Committee consists of representatives from a majority of the ministries, the Energy Efficiency Agency and an observer from Sofia Municipality, and is chaired by Deputy Minister of MOEW.
The Steering Committee (SC) for Joint Implementation Projects is an evaluation body forJoint Implementation projects under the Kyoto Protocol. It consists of representatives from MOEW, the Ministry of Economy and Energy, the Ministry of Finance, the Ministry of Regional Development and Public Works, the Ministry of Agriculture and Forestry, the Executive Energy Efficiency Agency and the Bulgarian Investments Agency. The Committee is chaired by the Minister of MOEW. The SC evaluates proposed JI projects and advises the Minister of the Environment and Water in issuing / not issuing a Letter of Approval for each particular proposal.
The Interministerial Working Group for Development of the National Allocation Plan is composed of representatives of the MOEW, the MEE, the MRDPW, the MF, the NSI and representatives of NGOs: Bulgarian Chamber of Commerce and branch organizations of theindustrial branches that are covered by the Scheme – Bulgarian Association of the CementIndustry, Bulgarian Branch Chamber of the Energetic, Branch Chamber of the Pulp and Paper Industry, Branch Chamber of the Glass Industry, Branch Chamber of the Iron and Steel Industry, Branch Chamber of the Chemical Industry, Bulgarian Union of the Ceramics.
The Executive Environmental Agency within MOEW performs monitoring of the implementation of climate change-related measures. The agency deals with water and air qualitycontrol and receives data from the monitoring stations nationwide. It also carries out theprocedures on issuing the permits under the IPPC Directive. The Agency is responsible for the preparation of the GHG inventories, projections and registers. It carries out the procedures on issuing the GHG emission permits – considers the operators’ application forms and drafts the
Republic of Bulgaria, Ministry of Environment and Water8

permits. The National Administrator of the National Registry for issuing, possession, transferand cancellation of the GHG emission allowances.
The Energy Efficiency Agency within MEER – organizes the implementation of projects and measures in accordance with the national long- and short-term energy efficiency programs;approves projects for energy efficiency and controls their implementation; participates in thepreparation of legal regulations in the field of energy efficiency: proposes development and improvement of energy efficiency standards in order to achieve approximation to the EU norms and to encourage energy efficiency at the demand side; cooperates with central and regional governmental institutions, employers’ associations, branch organizations, consumer associations and NGOs on implementation of energy efficiency policies and measures; develops programs forimplementation and control of EE measures and programs for EE awareness rising; develops programs for implementation of EE on local (municipal) level; cooperates in implementing EE training.
Policy instruments
This section presents set of political instruments which could be applied in the Climate Change Policy. In functional plan, these instruments have an intersectoral impact and influence the economy and household in general.
Legal instruments and regulations comprise of multilateral and bilateral internationalagreements, the EU legislation in the field of climate change and the national legislation, which relate to the climate change:
Fiscal policy contains instruments to stimulate measures that reduce emissions of greenhouse gases and/or save energy.
Financing emission reduction projects was hindered by a lack of financial resources, mainlycaused by the economic situation of the country during the 1990s. Both private and public sector lack adequate financial resources to finance climate measures. It is expected that this situationwill not significantly change in the period 2005-2008. Below some of the options are listed:
- Energy efficiency funds - State Agricultural Fund (SAF) - Kyoto Protocol Mechanisms - Joint Implementation, International Emissions Trading
(Green Investment Scheme)- EU structural funds
Education, research and development and awareness raising and public information
National strategy for the Environment and Second National Action Plan 2005-2014
The Strategy was developed for the period 2005-2014 together with an Action Plan 2005-2009. The National Strategy for the Environment is consistent with the principles of the prevention andreduction of the human health risk, integration of the environmental protection policy in the sectoral policies on the development of the economy and awareness of the citizens on the state of the environment.
Second National Climate Change Action Plan (2005-2008)
The following four categories of actions are included in the updated Plan: Actions to implement mitigation policies and measures that result in GHG emissionreductions in the different economic sectors in Bulgaria;Actions to create the necessary conditions for implementation of the mitigation measures, forinstance institutional arrangements and awareness raising;
Fourth National Communication on Climate Change9

Actions related to the monitoring and registration of GHG gases and the systematicevaluation of emission trends and projections, including the evaluation of policies and measures;Actions for the implementation of the Joint Implementation and Emissions Trading schemes.
The NAPCC comprises mainly measures that do not require budget financing, since the economic situation in Bulgaria does not allow for the allocation of significant funding and other public resources for implementing climate change-related policies and measures. Nevertheless, the plan includes a set of “backup” measures which can be implemented in case when the GHGemissions grow faster than expected one or when the economic situation in Bulgaria allows theGovernment to participate more actively in this field.
Sectoral policies and measures for reducing GHG emissions in Bulgaria
The need for Bulgaria to undertake mitigation measures is limited given the current GHG emission level and the expected emission trend. Implementing climate change measures are,however, also driven by other factors. Firstly, the commitments under the Climate Convention, the Kyoto Protocol and the EU accession require an active attitude of the country to mitigategreenhouse gas emissions.
Secondly, national and EU regulation require specific actions such as the implementation of standards, the development of a Green Certificates Scheme under the Renewable Energy Directive and Emissions Trading Scheme. And last but not least various climate change measures will lead to an energy efficiency improvement and contribute to long-term cost savings. Measures are envisaged for the following sectors:
Energy sector
Industry
Residential and Commercial/Institutional Buildings
Transport
Agriculture
Waste Management
S.5. Projections and Effects of Policies and Measures
Decision making for GHG emission mitigation is closely related to the actual GHG emissions in the country as assessed by the inventories and the projections for their mid-term trends (i.e. until2020). GHG projections are elaborated taking in consideration the trends of key macro-economic, technological, demographic and other indicators that determine the economicdevelopment of the country.
Three scenarios for GHG emission projections until 2020 were developed, analysed and compared:
“without measures” scenario
“with measures” scenario
“with additional measures” scenario
The “without measures” scenario is based on the assumption for intensive economicdevelopment with emphasis on energy intensive technologies and limited application of energy efficiency improvement measures in industry and agriculture. This scenario was originally developed in 1994 (before Bulgaria ratified the UNFCCC).
The “with measures” projection encompasses currently implemented and adopted policies and measures, and those measures that are given in the energy sector. This scenario projects relevant measures in the energy sector, while the rest of the sectors rely on already applied measures.
Republic of Bulgaria, Ministry of Environment and Water10

The “with additional measures” scenario comprises planned policies and measures for GHG mitigation. While in the “with measures” scenario the measures are more generally referring to environmentally friendly development, this scenario is more concentrated on the specific GHG mitigation measures and policies in the power sector. It is based on the same key macroeconomiccharacteristics.
Fig.S.2. Aggregated GHG Emissions, CO2-eqv
Overall emission [CO2-eqv.]
55 00060 00065 00070 00075 00080 00085 00090 00095 000
100 000105 000110 000115 000120 000125 000130 000135 000140 000
1988 1990 1992 1994 1996 1998 2000 2002 2004 2006 2008 2010 2012 2014 2016 2018 2020
No M
Add M
M
Gg
First Commitment Period - Analysis of the projected emissions in Bulgaria during the 1st
commitment period 2008-2012 shows that if there were no certain measures taken already for rapid increase of the efficiency of the economy in Bulgaria, the country would not be able to fulfil its obligation. During the period, the emissions would have exceeded by 12% the Kyoto target. The measures already taken are guarantee that the country meets the commitment. In addition, a significant potential for emission trading appears. For the “with measures” scenario, this potential is estimated at over 34 million tons of CO2 equivalent on yearly basis. Should additional measures be implemented, the emission trading potential would reach about 41 million tons.
There is even a bigger potential for emissions reduction in Bulgaria, however it cannot be realized due to lack of investments. Yet the carrying out of Joint Implementation projects in the field of energy efficiency in the industry and building sectors, or projects for developing thenatural gas household network would eventually lead to additional emission reduction in theamount of 10-15 million tons CO2-equivalent.
S.6. Vulnerability Assessment, Climate Change Influence and Adaptation Measures
The observed warming in Bulgaria continued at the beginning of the 21st century. So far 2002 is the third warmest year for the last 15 years while 2004 was the seventh in a row after 1997 with temperatures higher than the annual average air temperatures (Figure S.3). Despite the fact that the annual average air temperatures in Bulgaria in 2005 were about ( 0.2°C) the climatic values,the observed slight warming since the beginning of the 1980-ies continued in some areas of the country in 2005.
Climate change scenarios are developed for 2015, for the 2020s, 2050s and 2080s and climatescenario for the end of the 21st century
Some of the climate models simulate an increase of the air temperature in Bulgaria from 2 to 5 Chaving a two-fold increase of the carbon dioxide concentration in the atmosphere. For mostclimatic scenarios, winter precipitation are projected to increase until the end of the present
Fourth National Communication on Climate Change11

century but precipitations will drop significantly for the warm half-year and mostly during the summer.
2001 2002 2003 2004Ãî äèí à
-1
-0.5
0
0.5
1À
íîì
àë
èèè
(î Ñ
)
Ñåâåðí à Áúëãàðèÿ
Þ æí à Áúëãàðèÿ
Year
North Bulgaria
South Bulgaria
Anom
alie
s, (
C)
Figure.S.3. Anomalies (2001-2004) of annual average air temperatures in north Bulgaria and south Bulgaria relative to the climatic norms (1961-1990) (source: NIMH-BAS)
Climatic scenarios reveal that an increased risk and vulnerability to soil droughts are expected – an increase in the occurrence, intensity and level of impact of the soil droughts in Bulgaria for the 21st century. The soils with low capacity of moisture preservation and the regions in south-east Bulgaria are most vulnerable to those changes, in which areas precipitations during the warm half-year are low, even at present climatic conditions.
During the climate change in Bulgaria in the 21st century, most vulnerable will be: a) spring agricultural crops, due to the expected precipitation deficit during the warm half-year; b) crops cultivated on infertile soils; c) crops on non-irrigated areas; d) arable lands in south-east Bulgaria where even during the present climate, precipitation quantities are insufficient for normalgrowth, vegetation and productivity of agricultural crops.
The climate change scenarios derived for Bulgaria were used to evaluate potential changes inforest vegetation. The altered temperature and precipitation databases corresponding to each of the climate change scenarios were used to run the Holdridge life zone classification model. The GAP model results show that in case of climate warming over the next 90 years, the following consequences could be expected: A. In the lowlands – Tree species diversity reduction. In spite of that, the biodiversity would be greater compared with the biodiversity in the mountain regions. The selected tree species guarantee increased bio-productivity. It could be considered that if proper selection is made,optimal bio-production could be released under changed climate conditions.B. In mountains – Increased tree biodiversity could be expected. It could be realized by means ofthe natural shifting of tree vegetation from lower to higher sites in the mountains. This processwould be combined with biomass production increase.C. Both in lowlands and mountains – Increased biomass productivity would be accompaniedby increased CO2 absorption.
Soil diversity in Bulgaria is enormous. Soils have different characteristics, fertility and vulnerability to climate change. The temperature rise will increase the water deficit in soils
Republic of Bulgaria, Ministry of Environment and Water12
with low precipitation rates that are prone to droughts. The most serious impacts will beobserved for soils with light mechanical content and bad water characteristics and partly forheavy clay soils. About 30% of the soils in Bulgaria are prone to wind erosion.
The objectives of adaptation measures in agriculture are to support and sustain the agriculturalproduction and to bring to minimum the impact of climate change by reducing the vulnerability of the agricultural crops. The adaptation to climate change will be carried out in various forms,including technological innovations, changes in arable land, changes in irrigation, etc. Technological innovations include the creation of new cultivars and hybrids, which have higher productivity during changes in the climate. Farmers can start growing other cultures or cultures, prone to drought and diseases. The sowing dates of spring crops in Bulgaria could shift under the GCM climate change scenarios in order to reduce the yield loss caused by temperature increase.Another option for adaptation is to use different hybrids and cultivars. There is an opportunity for cultivation of more productive, later or earlier-maturing, disease and pest tolerant hybrids and cultivars. Switching from maize hybrids with a long to a short or very short growing season projected an additional decrease of final yield under a potential warming in Bulgaria. However, using hybrids with a medium growing season would be beneficial for maize productivity. Technologicalinnovations, including the development of new crop hybrids and cultivars that may be bred to better match the changing climate, are considered as a promising adaptation strategy. However, the cost of these innovations is still unclear.
For the forests in the low parts of the country (under 800 m a.s.l.), where the most significant impact from climate change is expected, the strategic objective of the management must beadaptation towards drought and improving forest sustainability.
For the forests in the higher parts of the country, i.e. those above 800 m a.s.l., where expected changes are not likely to be drastic, the objectives are preservation of biodiversity, eco systemsustainability, multifunctional management, system of protected nature territories.
The natural and introduced forest wood and shrub species in Bulgaria have great potential for agood adaptation towards possible climate change in the present century.
S.7. Financial Resources and Technologies Transfer
Despite the fact that Bulgaria is an Annex I Party of the UN FCCC, as a country with economyin transition, it has no commitments to provide financial resources and technology transfer todeveloping countries. The country rather accepts financial and technological help, mainlywithin the framework of the Joint Implementation (JI) mechanism.
Through is flexible mechanisms, the Kyoto Protocol encourages the industrialized states to invest with clean, climate supporting technologies the countries with economies in transition as well as the developing countries. The Joint Implementation mechanism is an instrument, based on projects, aimed to encourage technology transfer for profitable greenhouse gases (GHG)emission reduction for Annex I countries.
The JI mechanism is a convenient and profitable way for Bulgaria to receive economic, technicaland expert help with GHG mitigation efforts.
The basic principles of the national policy on climate change were developed on the basis of Bulgaria’s good will to join the efforts of the international community to solve the climatechange problems according to the potential of the national economy and looking at theopportunity to attract foreign investments, which will facilitate their implementation.
As an implementation of the signed bilateral agreements, 12 projects have been approved and some of them have already started. The execution of those projects will lead to greenhouse gases emission reduction at more than 8 mln. tons carbon dioxide equivalent for the period 2008-2012.
Fourth National Communication on Climate Change13

S.8. Education, Training and Public Awareness
Public interest in climate changes has been significant. Various governmental, non-governmentaland social non-economic organizations have raised the issue on various occasions. However, the more serious problem is that a vast amount of people do not realize the increasing by the hour environmental threat for our planet. In this respect, each one of us, being direct or indirect component of the environment, can and must contribute to the protection of the environmentalbalance.
Bulgaria carried out a project for self assessment of the capacity of the country in the field of sustainable development in 2004. The results from the project in the section Environmentaleducation and public awareness in climate change problems allow to define the priority topic, theexplanation of which will improve not only the level of the educational system but also public awareness.
Three complexes and a number of specific reasons have been formulated as a reason for theunsatisfactory level of capacity. Specific objectives and tasks have been elaborated to improvethe situation and direct and indirect assets have been recognized that allow the tasks to be solved in a short period of time.
The topics of environmental protection and climate change are included in school syllabuses in the educational and cultural field “Natural science and environment”. They are studied in mostdetails in the “Geography” subject but also, even in lesser scale in “Environmental chemistry”and “Biology. In this context, one should add the necessity of introduction of compulsoryenvironmental lessons in primary schools and outdoor activities.
A “Specialized course on vocational training of chemistry teachers on environmental protection” was carried out in 2005. It was on 3 stages during the school year. All 50 participants – chemistry teachers have obtained a certificate. The participants in the course have been selectedfrom all over the country. The successful completion of the education can be used as a model forfuture training and elaboration of similar courses for training of teachers.
S.9. Research and Projects
The Bulgarian Academy of Sciences (BAS) carries out research and other activities on climatechange. The information for this research is so big that can not be summarized and analyzed within this document. Work is going on not only on planned tasks with national financing butalso in cooperation with research organizations from EU member countries within the SixthFramework Programme.
Comprehending the significance of this problem, BAS established a National Coordination Centre for Global Change. The Centre for Global Change carries out work in the followingdirections:
Organizational activity for strengthening of the Centre;
Publication of books, papers, and other materials on global change problems;
Participation in scientific conferences and discussions dedicated to global changes; Supporting the contacts of our scientists with foreign scientists, who work on the topics of global change;
Public awareness on those changes.
On national level the centre puts efforts to strengthen the cooperation amongst Bulgarian institutions and organizations. In regard to this, it organizes discussions about the Second National Action Plan on Climate Change and the policy of MOEW on climate change; on climate change and global change project implementation, etc.
Republic of Bulgaria, Ministry of Environment and Water14
1 INTRODUCTION
The United Nations Framework Convention on Climate Change (UNFCCC), thereon referred to as the Convention, is the first and major international legal instrument to address climatechange issues at a global scale. It was signed in June 1992 at the Rio de Janeiro Earth Summitby more than 150 countries; and entered into force on 21st March 1994. The ultimate goal of the Convention is to achieve stabilization of greenhouse gas concentrations in the atmosphere at a level that would prevent dangerous anthropogenic interference with the climate system. Such a level has to be achieved within a time frame sufficient to allow ecosystems to adaptnaturally to climate change; to ensure sufficient food production and to enable sustainableeconomic development.
Acknowledging the importance of the climate change issue and the need for international cooperation to address this problem, Bulgaria signed the UNFCCC in Rio de Janeiro in June 1992 and the Parliament ratified it in March 1995. In compliance with Article 4.6 and 4.2(b) of the FCCC, Bulgaria as a country in transition has adopted 1988 as a base year for theimplementation of the Convention instead of 1990. As an Annex I Party of the UN FCCC the Republic of Bulgaria adopted the target to stabilize emissions of greenhouse gases by 2000 at a level not exceeded that in 1988. The same year was used when comparing, evaluating and projecting greenhouse gas emissions.
The First and Second National Communications of Bulgaria was elaborated by theInterministerial Committee supported by independent organizations and experts. The work wascoordinated by the Ministry of Environment and Water.
The Third National Communication was a further step in elaborating and implementing thenational climate change policy. It was delivered after the Kyoto Conference of the Parties andafter the new commitments agreed by the Parties to the Convention. According to Annex B of the Kyoto Protocol† the quantified emission reduction commitment of Bulgaria for the firstcommitment period (2008-2012) is 8 % of the base year (1988) emissions.
The Kyoto Protocol (KP) was approved on the Third session of the Conference of the Parties inDecember 1997 in Kyoto, Japan. Until August 2004 KP was ratified by 159 countries, includingBulgaria which ratified it on August 15th, 2002. After its ratification by the Russian Federation in November 2004, the Kyoto Protocol entered into force on February 16th 2005.
The Third Communication was developed along the Guidelines adopted by the Second Conference of the Parties of the Convention. The Third National Communication of Bulgaria was elaborated by the Ministry of Environment and Water by assignment to the Energy Institute and under coordination of Interministerial Committee on Climate Change supported byindependent organizations and experts.
The main principles of the national policy on climate change are presented in the Fourth Communication. The structure and organization of this report follow the UNFCCC Guidelines(FCCC/CP/1999/7). As the Kyoto Protocol entered into force since the beginning of 2005, theCommunication reports also contain information in compliance with article 7.2 of the Protocol.
The nature of the GHG mitigation policies and measures in the country is set forth by the SecondNational Climate Change Action Plan 2005 – 2008 (NCCAP) adopted by the Bulgarian Government (decision No. 1012 / December 21, 2004).
† The Kyoto Protocol was ratified by the Bulgarian Parliament on July 17, 2002.
Fourth National Communication on Climate Change15

The three scenario presented in the Fourth Communication for GHG emission projections take into account the implemented and planned policies and measures from the Third Communication and the real GHG emission changes as in the annual inventories. The developed projectionsdiffer significantly from those in the Third Communication due to the dynamics of the characteristics of the problems on climate change in Bulgaria.
The institutional setup for implementation of the country’s climate change policy is represented by the Ministry of Environment and Water (MOEW) under the coordination of Inter-ministerialClimate Committee on Climate Change (IMCCC) established with the NCCAP. It monitors the overall implementation of the Action Plan; assesses the progress of the GHG emission reduction;adjusts the plan to the changing conditions in the country; tracks violations; and to develops compensatory measures to accomplish the objectives. The overall implementation of the plan is controlled by the MOEW.
The present report was prepared in parallel with the Report on demonstrable progress. Theinformation in the Fourth National Communication is much more comprehensive than the one in the Third National Communication, allowing to be adopted for a basis of the draft of the Reporton demonstrable progress.
The Fourth National Communication has been prepared by the Ministry of Environment and Water by assignment to the Energy Institute in cooperation with the, Ministry of Agriculture and Forestry, Ministry of Industry and Energy, Ministry of Economy and Energy, National Instituteof Meteorology and Hydrology and Energy Efficiency Agency.
The Communication presents the overall situation in the country for the period since the Third National Communication till the end of 2005.
Republic of Bulgaria, Ministry of Environment and Water16

2 NATIONAL CIRCUMSTANCES
2.1. Background and Institutional Setting
The Ministry of Environment and Water is responsible for the overall national environmental policy in Bulgaria including the climate change problems.
It is responsible for the applying the adopted legislation on national scale and conceiving newlegislation in the future. The problem for environmental protection is a global one and for this reason MOEW works together with almost all other ministries. The MOEW has the following subsidiarybodies: The Executive Environmental Agency, fifteen Regional Inspectorates for Environmentand Water, three National Parks and four Basin Directorates.
The following organizations support the activities of MOEW: The Ministry of Economy and Energy(MEE), The Energy Efficiency Agency (EEA), The Ministry of Agriculture and Forestry (MAF),The Ministry of Finance (MF), The Ministry of Regional Development and Public Works(MRDPW), The Ministry of Education and Science (MES), The Ministry of Foreign Affairs, as wellas The National Statistical Institute, The Bulgarian Academy of Sciences etc, which participate in the process of application, development and perfection of GHG mitigation measures, procedures andmechanisms. The coordination of climate change activities within interministerial working groupswas accepted as a Good Practice and now the following are functioning: Interministerial Committeeon Climate Change (IMCCC), Joint Implementation Steering Committee (JISC) and InterministerialWorking Group for Development of the National Allocation Plan (IWGNAP). In this way the efforts of all concerned Governmental Agencies, business and NGOs are united.
Bulgaria has already started work on the application of the Directive establishing a scheme forgreenhouse gas emission allowance trading (Directive 2003/87/EC). The emission trading scheme is the main EU instrument to fulfil the commitments under Kyoto Protocol. The Emissions Trading inthe EU started on 01.01.2005, and Bulgaria is to start on 01.01.2007 along with the EU membershipof the country.
2.2. Government Structure
The government type in Bulgaria is parliamentary democracy. Chief of state is President Georgi Parvanov and Vice President Angel Marin since 22 January 2002. They are elected on the sameticket by popular vote for five-year period.
The chairman of the Council of Ministers is the head of government – Mr. Sergey Stanishev since September 2005. The chairman of the Council of Ministers (the Prime minister) is nominated by the president and elected by the National Assembly.
The Bulgarian National Assembly (the Parliament) has 240 seats; members are elected by thepopular vote for four-year terms.
The government activities are divided among 15 ministries. The Ministry of Environment and Water carries out all activities and responsibilities on the environmental protection and climatechange problems.
2.3. Geographic Profile
Bulgaria is situated in the Southeast part of the Balkan Peninsula. The country has a territory of 110,993.6 sq. km., bordering Greece and Turkey to the South, FY Republic of Macedonia and
Fourth National Communication on Climate Change17

Yugoslavia to the West. The River Danube separates it from Romania to the North. Its natural eastern border is the Black Sea. Bulgaria ranks fifteenth in size among the European countries. Bulgaria is dominated by rugged mountains, except for the Danube lowland in the north that it shares with Romania. The lay of Bulgaria is highly varied. To the north there is rich farmland the Danube plane, 130 kilometres of sandy beaches on the Black Sea, and mountainous terrain characterizing some of the least densely populated parts of the country. To the south is the Balkan Mountain which slopes gently to the north and drop more abruptly to the south. Further to the south are the Rhodopes and to the west lies the highest mountain on the Balkan Peninsula – the Rila Mountain with the highest Bulgarian peak Mousala – 2,925 m. Bulgaria is scarce in water resources, despite that over 60 rivers flow trough the country. The Danube is the biggest one with total length of 470 km on Bulgarian territory. There are also 6 lakes with total area of 87 km² and water volume of 211 mln cubic meters, and 23 dams with total area of 376 km² and water volume of 4,571 mln cubic meters. Bulgaria has three National Parks – Pirin, Rila and Central Balkan. They have a total area of 193,049 hectares and comprise more than one-third of all protected areas in Bulgaria. The National Parks belong to the state. They are managed andadministered by Directorates, operating under the Ministry of Environment and Waters. The Bulgarian National Parks offer excellent opportunities for tourism, scientific research andeducation.
2.4. Climate Profile
The climate in Bulgaria is temperate Continental-Mediterranean. Due to the geographicalsituation and the varied landscape, the contrasts in the climate are distinct among regions. The climate is with four distinctive seasons and varies with altitude and location. The Black Sea coast features a milder winter as opposed to the harsher winter conditions in the central north plains.
Bulgaria has five climatic zones - Moderate Continental, Intermediate, Continental-Mediterranean, Maritime and Mountainous. The main factor distinguishing the first three zones is the latitude, the terrain for the mountainous and the Black Sea for the maritime.
The heating season varies between 160 and 220 days for different locations. An importantindicator describing the duration of the heating season and roughly the energy requirements for
heating is the number of degree days. The heating degree days for indoor temperatures of 20 Cvary between 2,100 and 3,500 for different regions in Bulgaria. For Sofia these are 2,500 on average annual basis.
The air humidity is between 66 and 85% in the different regions of the country. There is a stable snow cover during the winter of about 20-200 cm. The Thracian Plain and the north-eastern coastal area suffer from low rainfalls. The total annual quantity of precipitation measured at the 40 monitoring meteorological stations vary from 455 to 93 mm, which is 60% to 137% of the norm. The mean values in 1999 was 619 mm, which is 98.84% of the annual norm, by about 4.3% lower than the value for 1998, and by 6.4% lower than the value for 1997. The tendencies over the last years are: almost ubiquitous reduction of precipitation, especially in the mountainareas of the country; total annual quantities of precipitation in northeast Bulgaria, Black Sea coast, Upper Thrace Low-down, southwest Bulgaria, Vratza-Pleven and Sofia regions are lower; no change in the established annual rate of non-precipitation days.
The average wind speed is 1.2 m/s (1.3 m/s in winter time), while prevailing winds are west or northeast.
In the last few years the tendency is towards warmer and drier climate. 1998 had warm and dry winter, hot dry summer, cool dry spring, and cold and very rainy fall. These abrupt deviationsfrom the normal climatic conditions reflect increased climate instability. Thus, the temperature
Republic of Bulgaria, Ministry of Environment and Water18

amplitude recorded a maximum for the last decade. Significant are the amplitudes of the other climatic characteristics as well. 2000 was the warmest year in 30-year period, while the rainfalls were 60% less compared to standard values.
Considering its small area, Bulgaria has an unusually variable and complex climate. The country lies between the strongly contrasting continental and Mediterranean climatic zones. Bulgarian mountains and valleys act as barriers or channels for air masses, causing sharp contrasts in weather over relatively short distances. The continental zone is slightly larger, becausecontinental air masses flow easily into the unobstructed Danubian Plain. The continental influence, stronger during the winter, produces abundant snowfall; the Mediterranean influence increases during the summer and produces hot, dry weather. The barrier effect of the BalkanMountains is felt throughout the country: on the average, northern Bulgaria is about one degreecooler and receives about 192 more millimetres of rain than southern Bulgaria. Because the Black Sea is too small to be a primary influence over much of the country's weather, it only affects the immediate area along its coastline.
The Balkan Mountains are the southern boundary of the area in which continental air massescirculate freely. The Rhodope Mountains mark the northern limits of domination by Mediterranean weather systems. The area between, which includes the Thracian Plain, is influenced by a combination of the two systems, with the continental predominating.
Average precipitation in Bulgaria is about 630 millimetres per year. Dobrudja in the northeast, the Black Sea coastal area, and parts of the Thracian Plain usually receive less than 500 millimetres. The remainder of the Thracian Plain and the Danubian Plateau get less than the country average; the Thracian Plain is often subject to summer droughts. Higher elevations, which receive the most rainfall in the country, may average over 2,540 millimetres per year.
The many valley basins scattered through the uplands have temperature inversions resulting in stagnant air. Sofia is located in such a basin, but its elevation (about 530 meters) tends to moderate summer temperature and relieve oppressive high humidity. Sofia also is sheltered fromthe northern European winds by the mountains that surround its trough like basin. Temperaturesin Sofia average -2°C in January and about 21°C in August. The city's rainfall is near the country average, and the overall climate is pleasant. The coastal climate is moderated by the Black Sea, but strong winds and violent local storms are frequent during the winter. Winters along the Danube River are bitterly cold, while sheltered valleys opening to the south along the Greek and Turkish borders may be as mild as areas along the Mediterranean or Aegean coasts.
2.5. Population Profile
The demographic picture in Bulgaria is unfavourable at the beginning of the XXI century. It ranks the country amongst those in Europe with negative rate of natural increase, low birth rate,high adult mortality and child death rate, decreasing average age of population.
Table 2.1 Demographic data for the country 1960 1970 1980 1990 1994 1995 1996 1997 1998 1999 2000 2001 2002 2003
Birth rate
‰17.8 16.3 14.5 12.1 9.4 8.6 8.6 7.7 7.9 8.8 9.0 9.0 8.5 8.6
Natural
increase ‰9.7 6.0 3.4 –0.4 –3.8 –5.0 –5.4 –7.0 –6.4 -4.8 -5.1 -5.6 -5.8 -5.7
Marriage
rate‰8.8 8.6 7.9 6.9 4.5 4.4 4.3 4.2 4.3 4.3 4.3 4.0 3.7 3.9
Average
age of
population
32.4 34.4 35.8 37.5 38.5 38.9 38.8 39.2 39.4 39.6 39.9 40.4 40.6 40.8
Fourth National Communication on Climate Change19
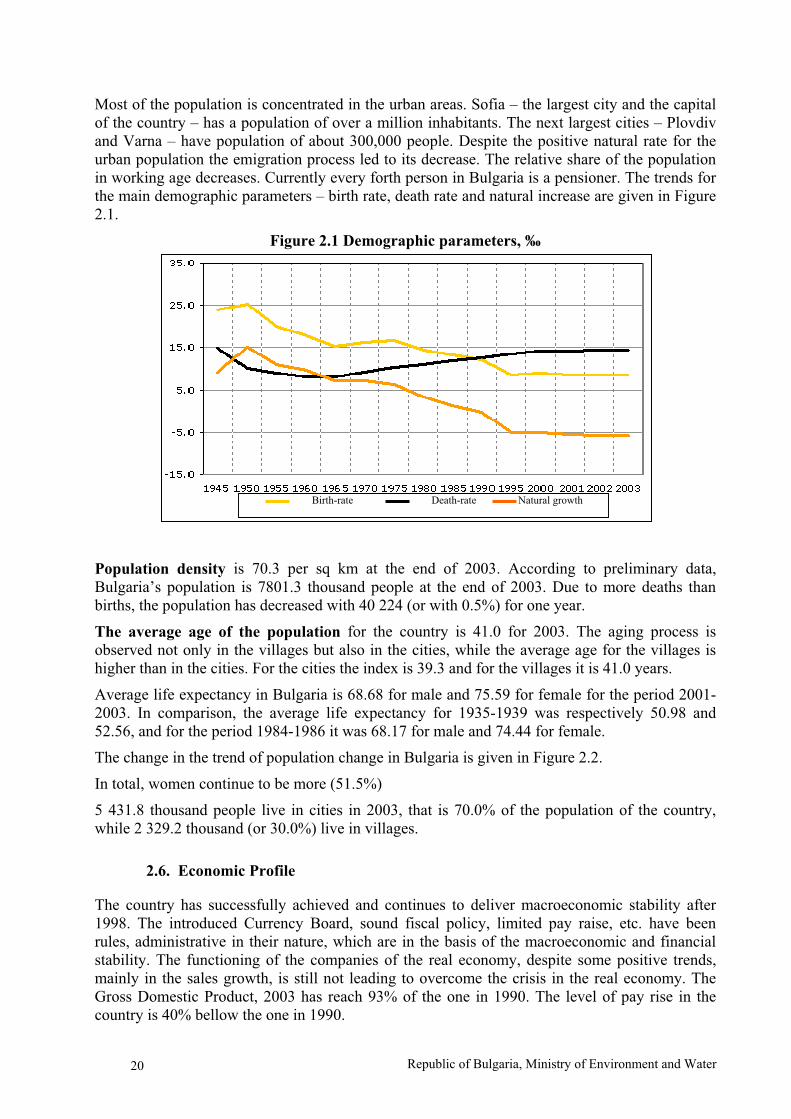
Most of the population is concentrated in the urban areas. Sofia – the largest city and the capital of the country – has a population of over a million inhabitants. The next largest cities – Plovdivand Varna – have population of about 300,000 people. Despite the positive natural rate for the urban population the emigration process led to its decrease. The relative share of the population in working age decreases. Currently every forth person in Bulgaria is a pensioner. The trends for the main demographic parameters – birth rate, death rate and natural increase are given in Figure 2.1.
Figure 2.1 Demographic parameters, ‰
Birth-rate Death-rate Natural growth
Population density is 70.3 per sq km at the end of 2003. According to preliminary data, Bulgaria’s population is 7801.3 thousand people at the end of 2003. Due to more deaths than births, the population has decreased with 40 224 (or with 0.5%) for one year.
The average age of the population for the country is 41.0 for 2003. The aging process is observed not only in the villages but also in the cities, while the average age for the villages is higher than in the cities. For the cities the index is 39.3 and for the villages it is 41.0 years.
Average life expectancy in Bulgaria is 68.68 for male and 75.59 for female for the period 2001-2003. In comparison, the average life expectancy for 1935-1939 was respectively 50.98 and 52.56, and for the period 1984-1986 it was 68.17 for male and 74.44 for female.
The change in the trend of population change in Bulgaria is given in Figure 2.2.
In total, women continue to be more (51.5%)
5 431.8 thousand people live in cities in 2003, that is 70.0% of the population of the country, while 2 329.2 thousand (or 30.0%) live in villages.
2.6. Economic Profile
The country has successfully achieved and continues to deliver macroeconomic stability after 1998. The introduced Currency Board, sound fiscal policy, limited pay raise, etc. have been rules, administrative in their nature, which are in the basis of the macroeconomic and financial stability. The functioning of the companies of the real economy, despite some positive trends,mainly in the sales growth, is still not leading to overcome the crisis in the real economy. The Gross Domestic Product, 2003 has reach 93% of the one in 1990. The level of pay rise in thecountry is 40% bellow the one in 1990.
Republic of Bulgaria, Ministry of Environment and Water20

As a result the average economic growth for the last five years was 4.1% and the inflation was decreasing.
After the introduction of the currency board and the denomination of the lev in 1999, a slow increase in GDP is witnessed in the country. The economic growth is stable and within a moderate range. Still, GDP levels are far bellow the desired levels. The trends of GDP change in mil. leva is given in Figure 2.3.
Figure 2.2. Bulgaria’s population
7 200 000
7 400 000
7 600 000
7 800 000
8 000 000
8 200 000
8 400 000
8 600 000
8 800 000
1990 1995 2000 2001 2002 2003
Bulgaria’s population
Years
Nu
mb
er
Table 2.2 GDP, current prices 1990 1995 1996 1997 1998 1999 2000 2001 2002 2003
Gross Domestic Product (mil. Lv) 45390 880332 1761 17433 22421 23790 26753 26356 28526 30227
GDP (annual real growth rate, %) -9.1 2.9 -10.1 -7.0 3.5 2.4 5.8 4.1 4.9 4.5
GDP per capita USD) 1163 1564 1190 1251 1548 1582 1546 1723 1984 2082
Source: NSI
Fourth National Communication on Climate Change21
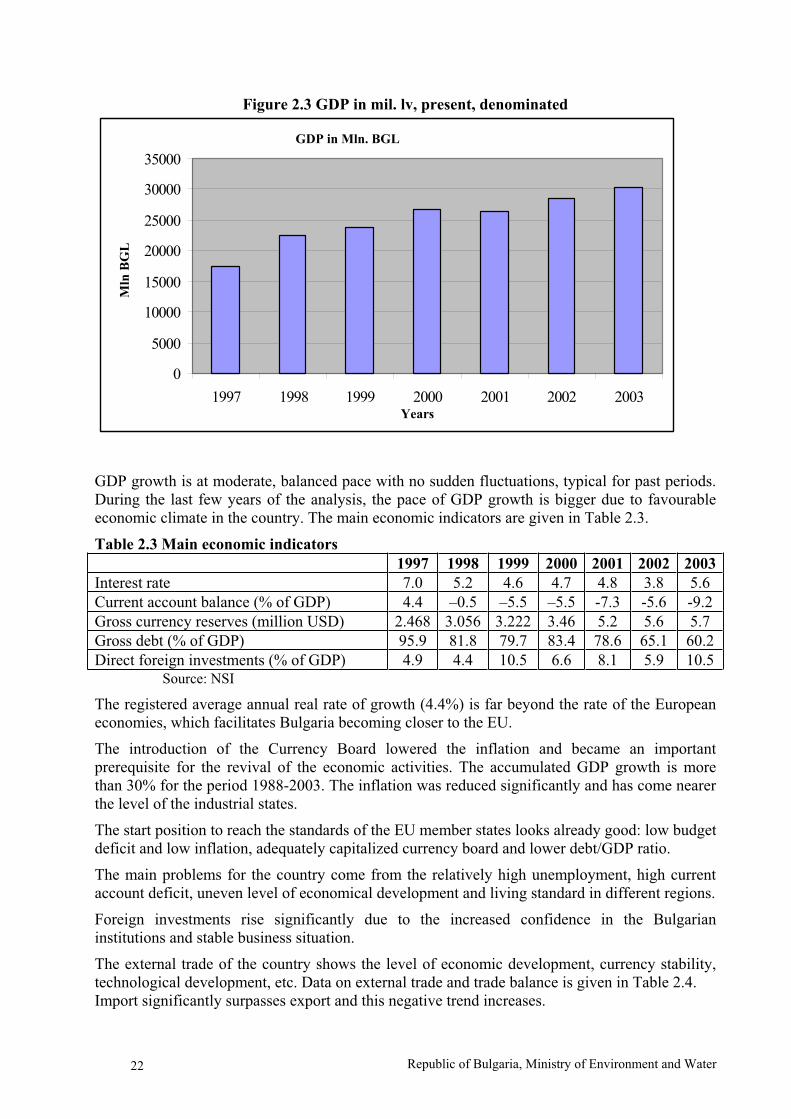
Figure 2.3 GDP in mil. lv, present, denominated
( . )
0
5000
10000
15000
20000
25000
30000
35000
1997 1998 1999 2000 2001 2002 2003
.GDP in Mln. BGL
Years
Mln
BG
L
GDP growth is at moderate, balanced pace with no sudden fluctuations, typical for past periods.During the last few years of the analysis, the pace of GDP growth is bigger due to favourable economic climate in the country. The main economic indicators are given in Table 2.3.
Table 2.3 Main economic indicators
1997 1998 1999 2000 2001 2002 2003
Interest rate 7.0 5.2 4.6 4.7 4.8 3.8 5.6
Current account balance (% of GDP) 4.4 –0.5 –5.5 –5.5 -7.3 -5.6 -9.2
Gross currency reserves (million USD) 2.468 3.056 3.222 3.46 5.2 5.6 5.7
Gross debt (% of GDP) 95.9 81.8 79.7 83.4 78.6 65.1 60.2
Direct foreign investments (% of GDP) 4.9 4.4 10.5 6.6 8.1 5.9 10.5Source: NSI
The registered average annual real rate of growth (4.4%) is far beyond the rate of the European economies, which facilitates Bulgaria becoming closer to the EU.
The introduction of the Currency Board lowered the inflation and became an importantprerequisite for the revival of the economic activities. The accumulated GDP growth is morethan 30% for the period 1988-2003. The inflation was reduced significantly and has come nearer the level of the industrial states.
The start position to reach the standards of the EU member states looks already good: low budget deficit and low inflation, adequately capitalized currency board and lower debt/GDP ratio.
The main problems for the country come from the relatively high unemployment, high currentaccount deficit, uneven level of economical development and living standard in different regions.
Foreign investments rise significantly due to the increased confidence in the Bulgarianinstitutions and stable business situation.
The external trade of the country shows the level of economic development, currency stability, technological development, etc. Data on external trade and trade balance is given in Table 2.4. Import significantly surpasses export and this negative trend increases.
Republic of Bulgaria, Ministry of Environment and Water22

Table 2.4 Trade balance
1998 1999 2000 2001 2002 2003
Export mil. lv 7575.8 7302.6 10274.1 11176.1 11857.9 13041.9
Import mil. lv 8 827.5 10052.8 13856.8 15896.6 16450.9 18796.6
Trade balance -474.7 -2 058.2 -2 503.3 -3478.1 -3 309.0 -4 302.0
Source: NSI
2.7. Privatization
The denationalization became a priority only at the beginning of 1993 and was put into practiceonly at the beginning of 1996 with the appropriate privatization forms and mechanisms, etc. It was not embedded in a clear enough vision on the structural reforms in the national economy and for the development of the real economy in the new market environment. Contradictory viewsand because of this – programs for denationalization of ruling governments lead to failure to achieve the necessary swift and favourable effects on the market situation.
The prevailing fragmented private property in industry, agriculture and tourism and at the sametime significant share of the state in areas like gas supply, railway transport, road infrastructure,partial power supply and power transportation lead to worsening business environment and reducing the possibilities for fast economic growth.
2.8. Sectors
The importance of the private sector in Bulgaria’s GDP increases in the last few years. In relativestructural terms, in regard to the private sector, the sector Services has the biggest importance. Just after it ranks the Industry sector.
Table 2.5 Relative share of the private sector in GDP (%)1996 1997 2000 2001 2002 2003
Private sector (total) 52.8 56.7 61.6 63.4 64.3 64.5Agriculture and forestry 15.1 26.2 13.9 13.7 12.1 11.4Industry 30.7 27.9 29.1 28.5 29.1 29.7Services 54.2 45.9 57.0 57.9 58.8 58.6
Source: NSI
The indicator “GVA, private sector” is the Gross Value Added from producers, classified according to the type of property in the private sector: private, non-finance finance enterprises,households, non-trade organizations, service households.
It is necessary to take into account the increased importance of the private sector in the Bulgarianeconomy for the analyzed period. The Services sector remains the biggest with largest relative share in the travelled way toward market economy.
One disturbing fact is the drop in the agricultural sector. This is an important sector for the Bulgarian economy together with Tourism, taking into consideration the geographic location of the country and its climate profile. This negative trend is since the year 2000. To overcome this trend, the country must adequately use the EC agricultural structural funds, to introduce preferential state policy in the sector and initiate entrepreneur training of the Bulgarian farmersregarding their entrepreneurial spirit.
2.8.1. Land Use and National Resources
Bulgaria territory is endowed with a variety of both metallic and non-metallic minerals. Geologic exploration has identified about 40 coal basins, which together contain an estimated 4.1 billion
Fourth National Communication on Climate Change23

tons of proven recoverable reserves. Of the reserves, virtually all is lignite. The main miningareas are in the Pernik basin south-west of Sofia, the Maritsa basin south of Stara Zagora, the Maritsa basin at Dimitrovgrad in the south, and Lom on the Danube. Lignite and brown coal fuel the country's thermal power stations and are used as fuel and as raw material for many of its industries. Although deposits of bituminous and anthracite coal have been almost exhausted in Bulgaria, other promising deposits of black coking coal have been found in the northeast, in the Dobruja region Deposits of iron ore are estimated at 317 million tons; one of the largest reservesis at Kremikovtsi near Sofia, the site of the country's largest metallurgical plant. Smallerquantities of iron ore are mined in the northwest (Montana [formerly Mikhaylovgrad]), in the central region (Troyan), and in the southeast (Yambol). There are significant deposits of nonferrous ores (copper, lead, and zinc) in the Rhodope Mountains, the Balkan Mountains, and the Sredna Gora Mountains. Bulgaria is also rich in less valuable minerals, including rock salt, gypsum, limestone, dolomite, kaolin (china clay), asbestos, perlite, feldspar, fluorite, and barite. Bulgaria has only small deposits of oil and natural gas; mineralogists have begun offshoreexploration of the Black Sea, which is believed to be rich in coal, oil, natural gas, and other minerals.
Table 2.6 Land use in Bulgaria – general information
Arable land 43%
Permanent crops 2%
Permanent pastures 14%
Forests and woodland 38%
Other 3%
Irrigated land 12,370 sq.km Source: MAF
2.8.2. Agriculture
Agriculture is one of the most important sectors of the Bulgarian economy. Much of theBulgarian population is occupied in it. The sector forms a relatively small share of the GDP.
Bulgaria has excellent natural conditions for the development of agriculture. Cultivatedagricultural land covers 48% of the total territory of the country. The favourable climate for various cultures, the fertile soil and long standing traditions in the sector, low labour cost, the presence of colleges and high schools on modern farming training can support a promisingdevelopment of this sector.
Agriculture is in a crisis at present. Most of the farms are small and do not have at their disposal significant financial means. Various European funds are not enough efficiently used. The state must intervene to get out quickly of the crisis in this important structural sector of the Bulgarian economy.
2.8.3. Forestry
Forestry is a traditional important economic sector for Bulgaria, where significant stateinvestments for the last 40 years have created a potential for significant and sustainable logging in the future, when young plantations will grow and become suitable for felling.
The forests cover some 34% of the total area of the country, support valuable ecosystems and control erosion. A big share of these forests (39.8%) has special function – protective and rehabilitation. A potential problem in the sector is the slow pace of reforms and restructuring.
In the following two tables – Table 2.7 and Table 2.8, data for the forest areas in Bulgaria is given and also – activities for afforestation.
Republic of Bulgaria, Ministry of Environment and Water24

Table 2.7 Total and wooded forest area
Type of forest 1993 1995 1999 2000 2001 2002 2003
Total 3877 3876 3894 3914 3980 4003 4015
Coniferous 1318 1304 1214 1282 1295 1291 1289
Non-coniferous
High-stemmed 1586 1579 1561 1535 1541 1525 1501
Low-stemmed 973 993 1059 1097 1144 1187 1225
of which: Wooded forest area 3329 3334 3347 3375 3443 3489 3526
Coniferous 1176 1154 1113 1115 1123 1122 1126
Non-coniferous
High-stemmed 1246 1251 1244 1237 1253 1256 1252
Low-stemmed 907 929 990 1023 1067 1111 1148
Source: Forest Research Institute, Bulgarian Academy of Sciences
Table 2.8 Activities for afforestation
Year 1993 1995 1999 2000 2001 2002 2003
Afforestation (ha)
Preparation of area 10620 10911 7598 6056 5475 8295 8105
Afforestation 16473 14367 7740 6313 5031 7134 8377
Establishing of intensive plantation 1476 959 1287 952 643 881 967
Reforestation of artificial forest 4623 4892 2697 2086 2344 2733 2352
Source: Forest Research Institute, Bulgarian Academy of Sciences
Data from Table 2.8 presents some disturbing facts for the last few years. The preparation ofareas for afforestation has decreased with 30% for the last decade.
The Bulgarian Government Program 2001 – 2005, has identified the following main
priorities in the areas of agriculture and forestry:
1. Efficient management of agriculture and forestry resources and development of marketstructures.2. Increasing the competitiveness of primary and secondary agricultural sector and creating conditions for development of export oriented agriculture. 3. Preparation for the implementation of the requirements of EU common market and cap mechanisms, as well as adherence to international agreements.4. Sustainable rural development.5. Eco-friendly and sustainable management of forestry resources, game and protected natural areas.
2.9. Biodiversity
The big variety of habitats and biogeographic conditions has lead to a diversity of the flora and fauna in the country, ranking Bulgaria amongst the first in Europe.
Fourth National Communication on Climate Change25

Table 2.9 Biodiversity
Groups of
organisms
Europe Bulgaria Endemic taxons/
Rare taxons/
Protected species
Protozoa n.a. 1 800 n.a. 422 0
Fungal/mushrooms n.a. 3 500 n.a. n.a. 0
Seaweeds and
pubescence
n.a. 3 666 n.a. 41 0
Mosses n.a. 709 14 25 0
Higher plants 12 500* 3 750 170 728 389
Invertebrates 200 000* 23 180* 1 131 2 125 All cave habitats and11 insect species
Fresh water fish 227 122 10 17 0
Amphibians 71 16 1** 0 14
Reptiles 199 36 4** 2 21
Birds 520 383 0 78 327
Mammals 250 94 6** 10 45
* - approximately ** - subspecies n.a. – not available
One of the main ways for the protection of this biodiversity and landscape diversity is the protection of territories. According to the Forest Act, the National Forestry Directorate (NFD) at MAF creates a special purpose system of forests, the objective of which is the protection and increase of the non-wood producing functions of the forest eco systems. These areas, reaching 34% of the total area of the state forest fund, have a management regime categories I to VIII as in the protected area territories classification of IUCN.
A system of recreational forests has been established around the national tourist and balneo centres, vacation villages and big cities. Its objective is to create optimal conditions for relaxation, tourism and treatment of the citizens. Their area is 237 903 ha.
The protection of the genetic fund of forest wood species is carried out with the creation of seed-funds, plantations, dendrary botanical gardens and botanical gardens with an total are of 44 622 at present.
The hunting grounds encompass 140 127 ha area and are located in territories, where the genetic fund of the game and its population is being preserved and increased.
Having 3 567 higher plants on its territory, Bulgaria ranks 5th
in Europe on number of species. Bulgaria also has 750 medical plants.
2.10. Taxes and Charges. Tax Policy
The objective of the tax policy is to reach macroeconomic stability, a sustainable economicgrowth, preparation of the country for EU membership and increase of social responsibility.
The objectives above cause reduction of the social security burden, increase of indirect taxes, raising the threshold of the personal income amount not subject to taxation, profit tax reduction and raising the property tax assessment values.
Changes in tax legislation that shift the tax burden from direct to indirect taxes are in the rightdirection, but without a reduction of the total burden itself they will be only of redistributivenature.
Republic of Bulgaria, Ministry of Environment and Water26

The Bulgarian government has declared its intention for lowering the corporate tax rates with several percentage points and also its intentions for new legislation on corporate tax and Value added tax.
2.11. Energy and Industrial Profile
2.11.1. Energy Profile
The big and swift industrialization of Bulgaria during the 60-ies of the last century determinedthe energy profile of the country. Industry is the biggest energy consumer with the energy intensity of the consumption of the sector decreasing during the last few years. The developmentof the Services sector and its bigger share in GDP are the logical reason for an increase of theenergy consumption in the transport sector. Data on the structure of energy consumption in Bulgaria are given in Table 2.10.
Table 2.10 Structure of final energy consumption (Per cent)
1995 1999 2000 2001 2002 2003
Industry 52.7 39.9 40.9 40.3 38.2 38.4
Transport 5.9 23.2 21.8 23.2 24.1 25.3
Households 30.5 25.7 26.0 24.2 25.7 25.1
Others 10.9 11.2 11.3 12.4 11.9 11.3
Total 100 100 100 100 100 100
Source: NSI
Industry is the biggest energy consumer in Bulgaria’s economy.
Table 2.11 Final energy consumption (PJ) 1995 1999 2000 2001 2002 2003
Industry 250.3 146.02 144.5 142.0 136.3 147.5
Transport 27.9 85.0 77.0 81.6 86.1 97.1
Households 145.0 94.2 91.7 85.1 91.8 96.5
Others 51.5 41.1 40.0 43.6 42.6 43.4
Total 474.7 366.2 353.2 352.3 356.8 384.5
Source: NSI
Public administration, in control and responsible for energy and industry includes: Ministry of Economy and Energy Energy Efficiency Agency (EEA) State Energy and Water Regulatory Commission Agency for Nuclear Regulation Ministry of Environment and Water
Bellow is given organizations, part of which non-governmental, engaged with the problems of the economy and the energy sector.
Local and Regional Energy Agencies and Energy Bodies Sofia Energy Agency SOFENA; Foundation Regional Energy Centre The Foundation Regional Energy Centre located in Lovech acquires and transfers information,
technology and know-how to the region and Bulgaria. Energy Agency of Plovdiv Union of Bulgarian Black Sea Local Authorities Black Sea Regional Energy Centre
Energy related funds and programmes:
Fourth National Communication on Climate Change27
Bulgarian Energy Efficiency Fund Bulgarian National Programme on Renewable Energy Sources, draft Bulgaria Municipal Energy Efficiency Program.
Bulgaria imports 100% of the needed nuclear fuel, 99% of the oil, 99% of the natural gas and 44% of the coal. The structure of the Final Energy Consumption (FEC) for the Bulgarian economy predetermines a big share of secondary energies and necessity of transformation of asignificant quantity of energy resources, i.e. about 40% of the energy resources included in the Primary Energy Consumption (PEC) are lost in the transformation processes.
Solid and liquid fuels, which are on market prices and also secondary energies (electricity and heat energy), whose prices are being regulated, decrease their share in FEC. The share of natural gas started to grow fast after 2002, following a long period of decrease. The biggest consumer of electricity and heat energy, as well as biomass (wood burning) is the household.
After a long period of decrease FEC started to increase extensively faster than GDP in 2003. TheIndustry sector is the decisive one for the high value of FEC.
The primary energy intensity of the GDP drops down continuously for the period 1997-2003 but the pace of reduction has decreased after 2003.
2.11.2. Industrial Profile
The Bulgarian industry has gone its difficult way from centralized planned economy to the open gates of EU. As an ex member country of Comecon, in a short period of time, Bulgaria was industrialized with low efficiency heavy industry, which was also great resource consumer.
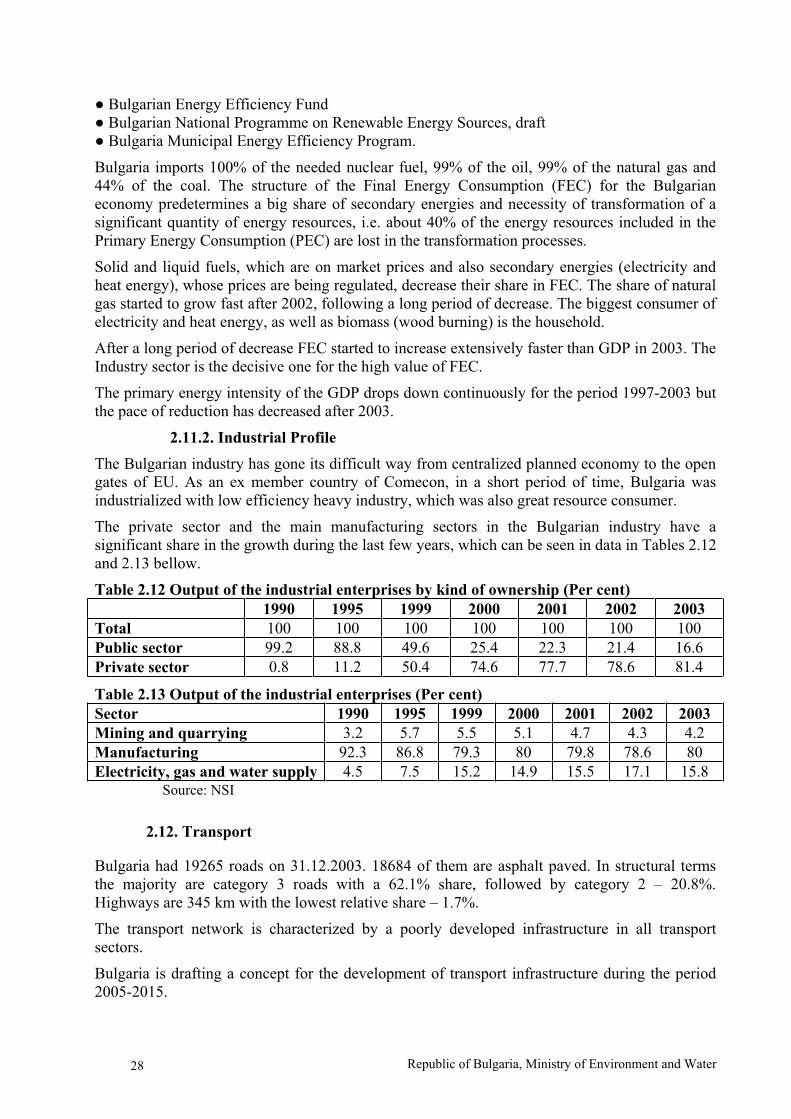
The private sector and the main manufacturing sectors in the Bulgarian industry have a significant share in the growth during the last few years, which can be seen in data in Tables 2.12 and 2.13 bellow.
Table 2.12 Output of the industrial enterprises by kind of ownership (Per cent)
1990 1995 1999 2000 2001 2002 2003
Total 100 100 100 100 100 100 100
Public sector 99.2 88.8 49.6 25.4 22.3 21.4 16.6
Private sector 0.8 11.2 50.4 74.6 77.7 78.6 81.4
Table 2.13 Output of the industrial enterprises (Per cent)
Sector 1990 1995 1999 2000 2001 2002 2003
Mining and quarrying 3.2 5.7 5.5 5.1 4.7 4.3 4.2
Manufacturing 92.3 86.8 79.3 80 79.8 78.6 80
Electricity, gas and water supply 4.5 7.5 15.2 14.9 15.5 17.1 15.8Source: NSI
2.12. Transport
Bulgaria had 19265 roads on 31.12.2003. 18684 of them are asphalt paved. In structural termsthe majority are category 3 roads with a 62.1% share, followed by category 2 – 20.8%. Highways are 345 km with the lowest relative share – 1.7%.
The transport network is characterized by a poorly developed infrastructure in all transport sectors.
Bulgaria is drafting a concept for the development of transport infrastructure during the period 2005-2015.
Republic of Bulgaria, Ministry of Environment and Water28

Data on carried passengers and transport of goods is given in Tables 2.14 and 2.15, respectively.
Table 2.14 Passengers carried – thousands
Year 1993 1995 1997 2000 2001 2002 2003
Total 1451820 1301152 1091126 1506645 1478151 1123950 1161266
Land transport 1096158 967343 709439 1158551 1130505 810872 830272
Waterway transport 81 28 31 76 67 60 79
Air transport 1848 1297 1209 1261 861 856 1471
Urban electrical transport 277648 273544 297791 346757 346718 312162 329444
Table 2.15 Transport of goods - thousand tons
Year 1993 1995 1997 2000 2001 2002 2003
Total 130427 109978 77053 96001 95000 110745 107011
Land transport 74101 48393 19717 75514 76959 93560 92826
Waterway transport 16575 19210 20542 20465 18037 17178 14174
Air transport 18 14 13 22 4 7 13
Source: NSI
The Bulgarian vehicle motor park is changing dynamically for the last few years. There is a steady increase for all kind of vehicles, which reflects in the increased traffic on the streets. Data on the number of motor vehicles is given in Table 2.16.Table 2.16 Number of motor vehicles
Year 1993 1995 1997 2000 2001 2002 2003
Passenger cars 1505451 1647571 1730506 1992748 2085730 2174081 2309343
Lorries 185824 203257 210960 237655 245962 255412 268098
Special vehicles 40282 40605 40051 41798 42464 43241 44408
Busses 39280 41019 40422 42306 42870 41172 43687
Motorcycles and mopeds 514598 519266 524950 522374 526046 530262 535669
Source: NSI
The most stable growth is for passenger cars and lorries, while there is almost no change formotorcycles and mopeds.
The vehicle park in Bulgaria is changing its structure not only in quantity but also in quality forthe last few years. The increased number of passenger cars comes from the big import of second hand cars mainly from Germany, Austria and the Netherlands. This determines their relative high average age.
The vehicles are 2 652 556 on 31.12.2003 and the unfavourable proportion in regard to their age related to the year of their initial registration is being kept as seen in Figure 2.4.
Figure 2.4. Vehicle distribution according to age, %
tional Communication on Climate Change
, %
6 - 10 .7,6%
11 - 15 .26,0%
16 - 20 .24,1%
20 .39,5%
0 - 5 .2,9%
Vehicle distribution according to age
>
29Fourth Na

Data from Figure 2.4 show the unsatisfactory age level of the vehicles in Bulgaria. More than 1/3rd of the total number of vehicles is older than 20 years, which causes increased emissions in the atmosphere on one hand and increased number of car incidents on the other.
Current transport project with necessity for accelerated implementation:
Danube bridge – in the “Vidin-Kalafat” area;
Rail road “Plovid-Svilengrad”;
Rail road “Karnobat-Sindel”;
Motorway “Lyulin”;
Dock complex “Lom”;
Construction of a terminal for combined transport in the area of the city of Sofia (Kazichane);
Construction of the south arc of the Sofia ring road motorway
Motorway "Trakia";
Motorway "Maritca"
Those entire projects are at a different stage of realization. The common feature is the delay as tothe planned schedule in the official investment programs of several governments. A trend of a constant increase of the planned resources is observed.
2.13. Waste
Landfilled solid waste is one of the key contributors for GHG emissions in Bulgaria. Sometypical parameters for the collected waste are given in Table 2.17.
Table 2.17 Waste, thousand tons
Year 1993 1995 1999 2000 2001 2002 2003
Industrial non-hazardous waste 267819 254625 174709 92335 86397 79632 84313
of which: Landfilled 264010 251247 174067 91306 85142 78812 83375
Collected municipal waste . . 3213 3318 3211 3199 3209
Final landfilled municipal waste . . 3197 3271 3198 3188 3194
Source: IE and NSI
A number of attempts for capturing of methane at landfills have been made and using it as an energy source. So far the practice in Bulgaria is to only burn small quantities hazardous waste from the pharmaceutical industry.
Industrial and household waste water treatment is also a methane emission source. A planned discharge at several tailing ponds has been carried out. This lead to a significant increase of methane emissions from waste water, which has not been typical for the transitional period 1988-2002.
Republic of Bulgaria, Ministry of Environment and Water30

3 INVENTORIES OF GREENHOUSE GAS EMISSIONS BY SOURCES AND
REMOVALS BY SINKS
3.1. Introduction
This chapter report represents information for the annual GHG Inventory in Bulgaria for 2003.This Inventory is prepared according to the UNFCCC Guideline approved by the SubsidiaryBody for Scientific and Technological Appliance on The 21st session on 06-14.12.2004 in Buenos Aires. The rules and the structure of the National GHG Inventory Report are formed by this Guideline. The report is elaborated in compliance with the Revised IPCC Guidelines, 1996 and Good Practice Guidance for National GHG Inventories, 2000
According to the UNFCCC Guidance, the Inventory should be prepared in a way that ensures Transparency, Consistency, Comparativeness, Completeness and Accuracy.
These qualities of the Inventory are elements of the “Good Practices” were pointed out in the IPCC Good Practice Guidance, 2000.
That is the reason why the current report also presents the GHG emissions trends for the period 1988-2003. There are described as well:
Methods and data for assessment of the uncertainty of the annual GHG emissions andtrends;
Key sources of the GHG emissions according to the methods from type Tier 1 andTier 2 described in the Good Practice Guidance;
Assessment of the system of Appliance and Control of the Quality.
Key sources
In defining the key sources of GHG emissions, the IPCC methodology, proposed in the Good Practice Guidance for GHG Inventories, is used.
The list of the key sources for 2003 is changed compared with the one in 2002. There are added two new key sources: CO2 emissions from non-energy usage of natural gas and CH4 emissionfrom waste water treatment. The source for fugitive CH4 emissions from the systems forextraction and transportation of oil and gas is dropped out.
The determination of the key sources according to the method type Tier 1 treats the national totalannual emissions as well as the total trend for annual emissions.
The results from applying Tier 1 method in its two varieties (quantitative assessment of the participation in the total emissions and assessment of the trend of each source toward the total emission trend) are presented in details in Annex 1 of this report. From the total 39 emissionsources, the key emission sources are 19 based on the quantitative assessment and 18 sources according to the trend assessment and the two types of assessment they give 95 % of the total quantity of the GHG emissions expressed in CO2-eqv.
3.2. Trends of Bulgaria’s Greenhouse Gas Emission
The GHG Inventory for the year 2003 revealed that the overall GHG emissions expressed inCO2–eqv. are 69 167 Gg not taking into account the sequestration in sector Land use Change and Forestry. The net emissions (including the sequestration from LUCF) are 62 111 Gg.
The main greenhouse gases to be reported pursuant to UNFCCC are as follows: Carbon dioxide - CO2
Fourth National Communication on Climate Change31

Methane - CH4
Nitrous oxide - N2O Hydrofluorocarbons – HFCs Perfluorocarbons - PFCs Sulphur hexafluoride - SF6.
Each of these gases has a warming effect which can be distinguished by its amount. As an example, the gases HFCs, PFCs and SF6 (so called F-gases) have much greater warming effect compared to methane, nitrous oxide and carbon dioxide.
Table 3.1 represents the emission trends of the basic GHG, the overall emissions (not taking into account the LUCF) and the relative share of the overall emissions to the emissions from the base year 1988 referred to as 100 %.
The analysis of the Table 3.1 reveals that in 2003 the CO2 emissions form the largest share of 75 % from the overall GHG emissions expressed in CO2-eqv.; the CH4 emissions are second with 15 % and the N2O emissions with a 10 % share stand in the third place.
There can be seen that in the year 2003 the overall of the GHG emissions expressed in CO2-eqv.registered an increase. The emissions for the year 2003 are 50 % in comparison to the base year 1988 and they registered an increase with 9.2 % in comparison to the previous year 2002.
The summary emissions from GHG-precursors and SOx are shown in Table 3.2.
3.3. Summary of Methodology and Data Sources
Carbon dioxide emissions
The CO2 emissions are derived by combustion of fuels in the energy sector, transport andhouseholds. Data from the energy balance of the country is used for emission calculation.
Parameters, specified in the Revised IPCC Guidelines, are used for estimation of the carbon stocks in the products, which is not CO2 emission source. The reason for that is the lack ofconcrete measured values of the non-oxidized carbon portion in the petrol products and in the natural gas, utilized in Bulgaria.
The present inventory reports for a first time on CO2 emissions from the non-energy fuel utilization, taking into account the quantities of the carbon stored in the products.
Due to the fact that combustion of solid household waste is not widely spread in the country (for power production or for the purpose of liquidation), the corresponding CO2 emissions are not reported.
Carbon dioxide sequestration
For the time being, Bulgaria reports on CO2 sequestration from forestry only (category 5.A fromsector “ Land-Use Change and Forestry”). Data for C sequestration from forestry is on the basis of:
Area of forestry used; Average annual forest growth by species (in m3/ha/year);Annual felling (in m3/year).
Estimation of the average annual forest biomass growth is made on the basis of data fromforestry inventory, which is made each five years according to a methodology, approved by theforestry authorities. For estimation of the biomass dry content, a common conversion factor of 0.6 for both forestry types, coniferous and deciduous, is used.
Republic of Bulgaria, Ministry of Environment and Water32

Fourth National Communication on Climate Change33
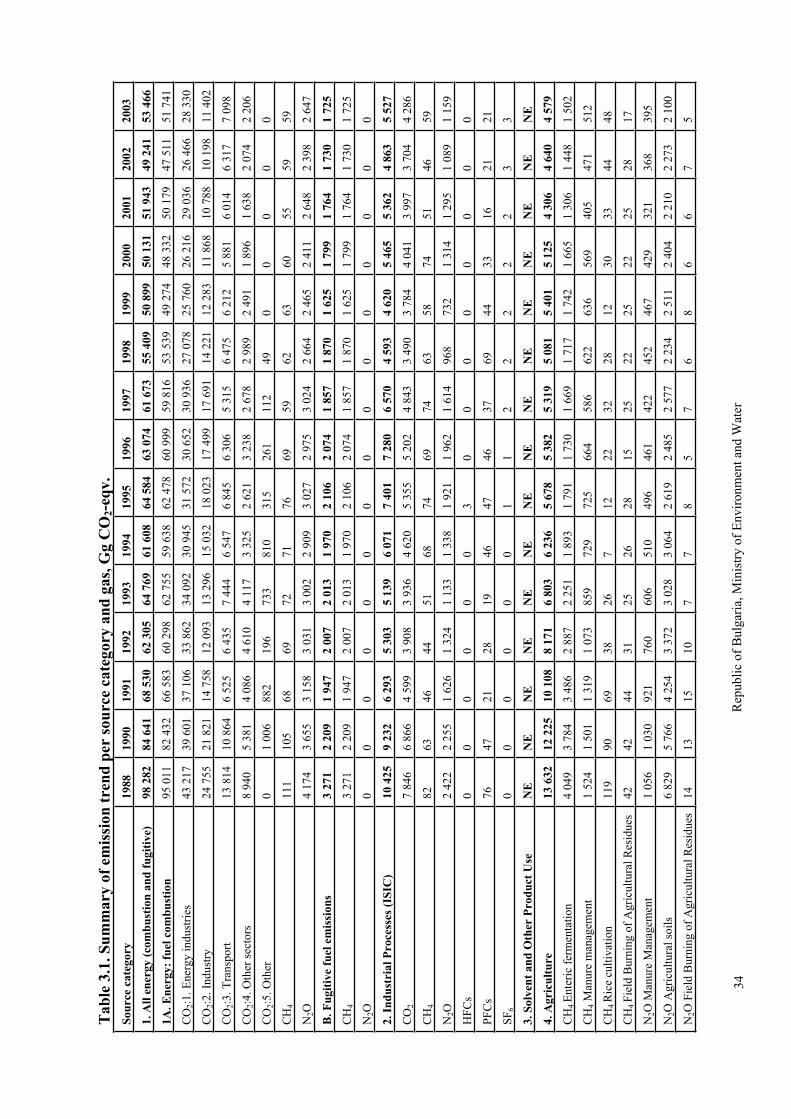
Tab
le 3
.1. S
um
mary
of
emis
sion
tre
nd
per
sou
rce
cate
gory
an
d g
as,
Gg C
O2-e
qv
.
Sou
rce
cate
gory
1988
1990
1991
1992
1993
1994
1995
1996
1997
1998
1999
2000
2001
2002
2003
1.
All
en
ergy
(co
mb
ust
ion
an
d f
ugit
ive)
98 2
82
84 6
41
68 5
30
62 3
05
64 7
69
61 6
08
64 5
84
63 0
74
61 6
73
55 4
09
50 8
99
50 1
31
51
943
49
241
53
466
1A
. E
ner
gy
: fu
el c
om
bu
stio
n95 0
11
82 4
32
66 5
83
60 2
98
62 7
55
59 6
38
62 4
78
60 9
99
59 8
16
53 5
39
49 2
74
48 3
32
50 1
79
47 5
11
51 7
41
CO
2:1
. E
ner
gy
indust
ries
43 2
17
39 6
01
37 1
06
33 8
62
34 0
92
30 9
45
31 5
72
30 6
52
30 9
36
27 0
78
25 7
60
26 2
16
29 0
36
26 4
66
28 3
30
CO
2:2
. In
dust
ry24 7
55
21 8
21
14 7
58
12 0
93
13 2
96
15 0
32
18 0
23
17 4
99
17 6
91
14 2
21
12 2
83
11 8
68
10 7
88
10 1
98
11 4
02
CO
2:3
. T
ransp
ort
13 8
14
10 8
64
6 5
25
6 4
35
7 4
44
6 5
47
6 8
45
6 3
06
5 3
15
6 4
75
6 2
12
5 8
81
6 0
14
6 3
17
7 0
98
CO
2:4
. O
ther
sec
tors
8 9
40
5 3
81
4 0
86
4 6
10
4 1
17
3 3
25
2 6
21
3 2
38
2 6
78
2 9
89
2 4
91
1 8
96
1 6
38
2 0
74
2 2
06
CO
2:5
.O
ther
01
00
68
82
19
67
33
81
03
15
26
11
12
49
00
00
0
CH
4111
105
68
69
72
71
76
69
59
62
63
60
55
59
59
N2O
4 1
74
3 6
55
3 1
58
3 0
31
3 0
02
2 9
09
3 0
27
2 9
75
3 0
24
2 6
64
2 4
65
2 4
11
2 6
48
2 3
98
2 6
47
B.
Fu
git
ive
fuel
em
issi
on
s3 2
71
2 2
09
1 9
47
2 0
07
2 0
13
1 9
70
2 1
06
2 0
74
1 8
57
1 8
70
1 6
25
1 7
99
1 7
64
1 7
30
1 7
25
CH
43 2
71
2 2
09
1 9
47
2 0
07
2 0
13
1 9
70
2 1
06
2 0
74
1 8
57
1 8
70
1 6
25
1 7
99
1 7
64
1 7
30
1 7
25
N2O
00
00
00
00
00
00
00
0
2.
Ind
ust
rial
Pro
cess
es (
ISIC
) 10 4
25
9 2
32
6 2
93
5 3
03
5 1
39
6 0
71
7 4
01
7 2
80
6 5
70
4 5
93
4 6
20
5 4
65
5 3
62
4 8
63
5 5
27
CO
27 8
46
6 8
66
4 5
99
3 9
08
3 9
36
4 6
20
5 3
55
5 2
02
4 8
43
3 4
90
3 7
84
4 0
41
3 9
97
3 7
04
4 2
86
CH
482
63
46
44
51
68
74
69
74
63
58
74
51
46
59
N2O
2 4
22
2 2
55
1 6
26
1 3
24
1 1
33
1 3
38
1 9
21
1 9
62
1 6
14
968
732
1 3
14
1 2
95
1 0
89
1 1
59
HF
Cs
00
00
00
30
00
00
00
0
PF
Cs
76
47
21
28
19
46
47
46
37
69
44
33
16
21
21
SF
60
00
00
01
12
22
22
33
3.
Solv
ent
an
dO
ther
Pro
du
ctU
seN
EN
EN
EN
EN
EN
EN
EN
EN
EN
EN
EN
EN
EN
EN
E
4.
Agri
cult
ure
13 6
32
12 2
25
10 1
08
8 1
71
6 8
03
6 2
36
5 6
78
5 3
82
5 3
19
5 0
81
5 4
01
5 1
25
4 3
06
4 6
40
4 5
79
CH
4E
nte
ric
ferm
enta
tio
n4 0
49
3
78
4
3 4
86
2
88
7
2 2
51
1
89
3
1 7
91
1
73
0
1 6
69
1
71
7
1 7
42
1
66
5
1 3
06
1
44
8
1 5
02
CH
4M
anu
rem
anag
emen
t1
52
41
50
11
31
91
07
38
59
72
97
25
66
45
86
62
26
36
56
94
05
47
15
12
CH
4R
ice
cult
ivat
ion
11
99
06
93
82
67
12
22
32
28
12
30
33
44
48
CH
4F
ield
Bu
rnin
go
fA
gri
cult
ura
lR
esid
ues
42
42
44
31
25
26
28
15
25
22
25
22
25
28
17
N2O
Man
ure
Man
agem
ent
1056
1030
921
760
606
510
496
461
422
452
467
429
321
368
395
N2O
Agri
cult
ura
l so
ils
6 8
29
5 7
66
4 2
54
3 3
72
3 0
28
3 0
64
2 6
19
2 4
85
2 5
77
2 2
34
2 5
11
2 4
04
2 2
10
2 2
73
2 1
00
N2O
Fie
ldB
urn
ing
of
Ag
ricu
ltu
ral
Res
idu
es1
41
31
51
07
78
57
68
66
75
Rep
ubli
c of
Bulg
aria
, M
inis
try o
f E
nv
iron
men
t an
dW
ater
34
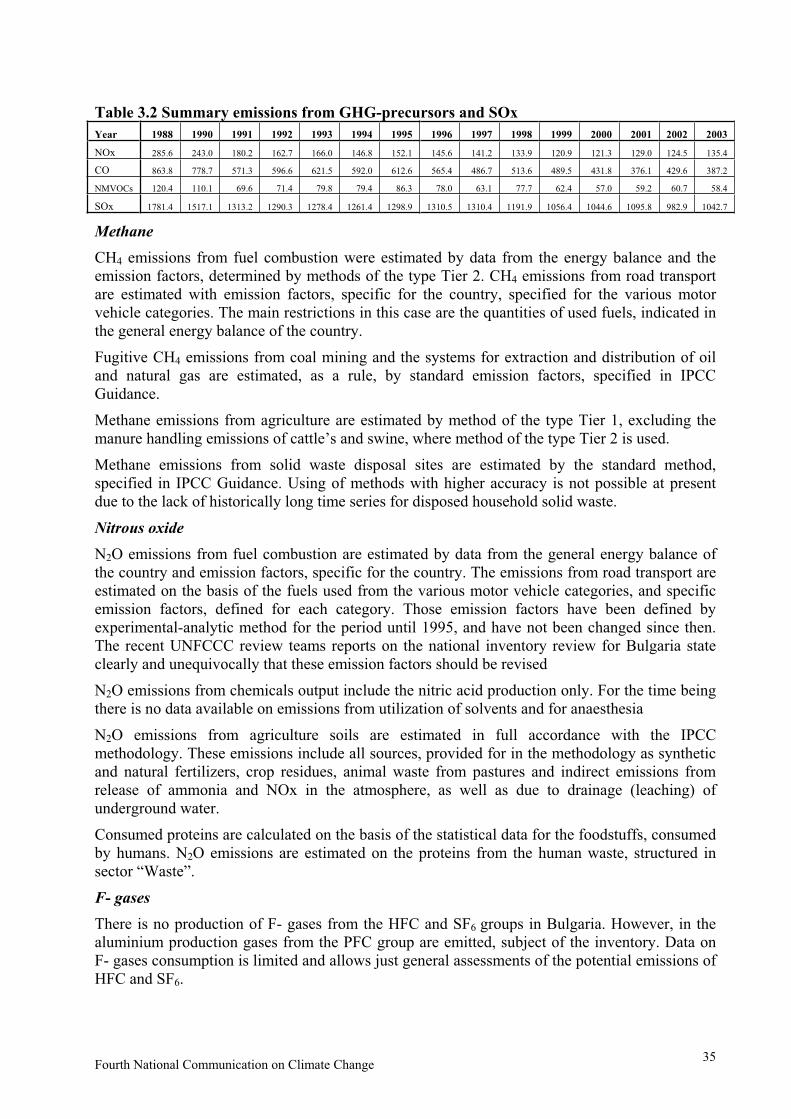
Table 3.2 Summary emissions from GHG-precursors and SOx
Year 1988 1990 1991 1992 1993 1994 1995 1996 1997 1998 1999 2000 2001 2002 2003
NOx 285.6 243.0 180.2 162.7 166.0 146.8 152.1 145.6 141.2 133.9 120.9 121.3 129.0 124.5 135.4
CO 863.8 778.7 571.3 596.6 621.5 592.0 612.6 565.4 486.7 513.6 489.5 431.8 376.1 429.6 387.2
NMVOCs 120.4 110.1 69.6 71.4 79.8 79.4 86.3 78.0 63.1 77.7 62.4 57.0 59.2 60.7 58.4
SOx 1781.4 1517.1 1313.2 1290.3 1278.4 1261.4 1298.9 1310.5 1310.4 1191.9 1056.4 1044.6 1095.8 982.9 1042.7
Methane
CH4 emissions from fuel combustion were estimated by data from the energy balance and theemission factors, determined by methods of the type Tier 2. CH4 emissions from road transportare estimated with emission factors, specific for the country, specified for the various motorvehicle categories. The main restrictions in this case are the quantities of used fuels, indicated in the general energy balance of the country.
Fugitive CH4 emissions from coal mining and the systems for extraction and distribution of oil and natural gas are estimated, as a rule, by standard emission factors, specified in IPCCGuidance.
Methane emissions from agriculture are estimated by method of the type Tier 1, excluding the manure handling emissions of cattle’s and swine, where method of the type Tier 2 is used.
Methane emissions from solid waste disposal sites are estimated by the standard method,specified in IPCC Guidance. Using of methods with higher accuracy is not possible at present due to the lack of historically long time series for disposed household solid waste.
Nitrous oxide
N2O emissions from fuel combustion are estimated by data from the general energy balance of the country and emission factors, specific for the country. The emissions from road transport are estimated on the basis of the fuels used from the various motor vehicle categories, and specificemission factors, defined for each category. Those emission factors have been defined byexperimental-analytic method for the period until 1995, and have not been changed since then. The recent UNFCCC review teams reports on the national inventory review for Bulgaria state clearly and unequivocally that these emission factors should be revised
N2O emissions from chemicals output include the nitric acid production only. For the time being there is no data available on emissions from utilization of solvents and for anaesthesia
N2O emissions from agriculture soils are estimated in full accordance with the IPCC methodology. These emissions include all sources, provided for in the methodology as synthetic and natural fertilizers, crop residues, animal waste from pastures and indirect emissions fromrelease of ammonia and NOx in the atmosphere, as well as due to drainage (leaching) of underground water.
Consumed proteins are calculated on the basis of the statistical data for the foodstuffs, consumedby humans. N2O emissions are estimated on the proteins from the human waste, structured in sector “Waste”.
F- gases
There is no production of F- gases from the HFC and SF6 groups in Bulgaria. However, in thealuminium production gases from the PFC group are emitted, subject of the inventory. Data on F- gases consumption is limited and allows just general assessments of the potential emissions of HFC and SF6.
Fourth National Communication on Climate Change35

During the last years, large-scale inquiries were initiated for data collection regarding the available SF6 quantities in the electrical equipment of the electric power system of the country. It resulted in reliable data for the fugitive SF6 emissions during equipment operation for the period 1995 -2003.
As a whole, the data on the current F-gases emissions is too limited and does not correspond to the actual consumption level at the moment.
3.4. Summary of the Key Sources of GHG Emissions
GHG emission inventory for 2003 showed that the overall GHG emissions in CO2–eqv.amounted to 69 167 Gg, without reporting of sequestration from sector Land-Use Change and Forestry (LUCF). The net emissions (without reporting of sequestration from LUCF) were 62 111 Gg.
In Table 3.3 are given emission trends of the main GHG, the summary emissions (withoutreporting of LUCF) and the overall emissions share of the emissions from the base year, 1988, assumed as 100 %.
Analysis of Table 3.3 shows, that in 2003, CO2 emissions headed the list with the biggest share– 75 % of the overall GHG emissions, expressed in CO2-eqv., CH4 emissions ranked the second place with 15 %, and N2O emissions ranked the third place with 10 %. This distribution hasundergone some changes compared to the base 1988, as it is shown in Figure 3.1. Thedistribution for 2003 is shown in Figure 3.2.
Figure 3.1
1988 (1995 for F - gases)
SF6
0%
HFCs
0%
PFCs
0%N2O
11%
CH4
18%
CO2 excluding
LUCF
71%
CO2 excluding LUCF CH4 N2O HFCs PFCs SF6
Republic of Bulgaria, Ministry of Environment and Water36
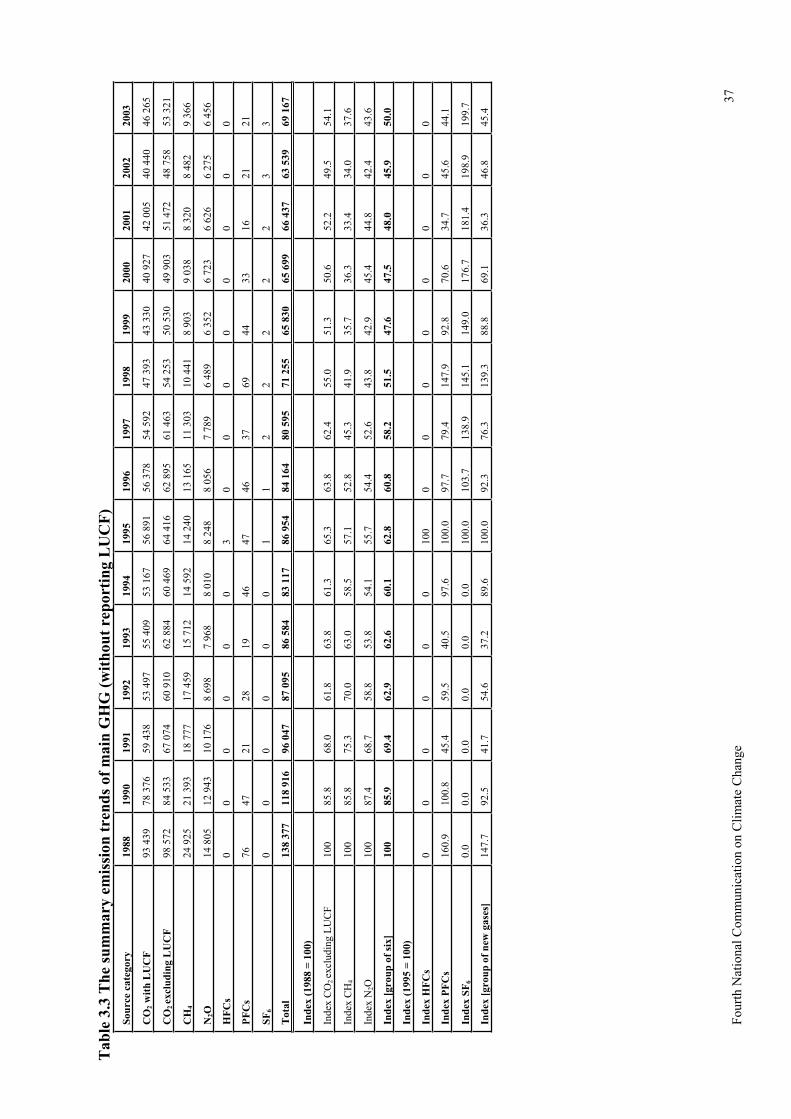
Tab
le 3
.3 T
he
sum
mary
em
issi
on
tre
nd
s of
main
GH
G (
wit
hou
t re
port
ing L
UC
F)
So
urce
ca
teg
ory
19
88
19
90
19
92
19
93
19
94
19
95
19
91
19
96
19
97
19
98
19
99
20
00
20
01
20
02
20
03
CO
2 w
ith
LU
CF
9
3 4
39
7
8 3
76
5
9 4
38
5
3 4
97
5
3 1
67
5
6 8
91
5
6 3
78
5
4 5
92
4
3 3
30
4
0 9
27
4
2 0
05
4
0 4
40
CO
excl
ud
ing L
UC
F2
98
57
2
67
07
4
60
91
0
62
88
4
60
46
9
62
89
5
61
46
3
54
25
3
50
53
0
55
40
9
47
39
3
46
26
5
84
53
3
64
41
6
49
90
3
51
47
2
48
75
8
53
32
1
CH
42
4 9
25
2
1 3
93
1
8 7
77
1
7 4
59
1
5 7
12
1
4 2
40
1
3 1
65
1
1 3
03
1
0 4
41
9
03
8
8 3
20
8
48
2
9 3
66
NO
21
4 8
05
1
2 9
43
8
69
8
7 9
68
8
01
0
8 2
48
7
78
9
6 4
89
6
35
2
6 7
23
6
27
5
6 4
56
HF
Cs
14
59
2
8 9
03
10
17
6
8 0
56
6
62
6
00
00
00
30
00
00
00
0
PF
Cs
76
47
21
19
46
47
46
69
44
33
16
21
SF
60
00
01
12
22
23
3
To
tal
13
8 3
77
28
37
21
00
2
11
8 9
16
96
04
7
87
09
5
86
58
4
83
11
7
86
95
4
84
16
4
80
59
5
71
25
5
65
83
0
65
69
9
66
43
7
63
53
9
69
16
7
Ind
ex (
19
88
= 1
00)
Ind
ex C
Oex
clu
din
gL
UC
F2
10
08
5.8
68
.06
1.8
63
.86
5.3
63
.86
2.4
55
.05
1.3
50
.64
9.5
54
.1
Ind
ex C
H4
10
07
5.3
70
.06
3.0
58
.55
7.1
52
.84
1.9
35
.73
6.3
33
.43
4.0
37
.6
Ind
ex N
O2
10
08
7.4
68
.75
8.8
61
.35
2.2
85
.84
5.3
53
.85
4.1
55
.75
4.4
52
.64
3.8
42
.94
5.4
44
.84
2.4
43
.6
Ind
ex
[gro
up
of
six
]1
00
85
.96
9.4
62
.96
2.6
60
.16
2.8
60
.85
8.2
51
.54
7.6
47
.54
8.0
45
.95
0.0
Ind
ex (
19
95
= 1
00)
Ind
ex H
FC
s 0
00
00
01
00
00
00
00
00
Ind
ex P
FC
s1
60
.91
00
.84
5.4
59
.54
0.5
97
.61
00
.09
7.7
79
.41
47
.99
2.8
70
.63
4.7
45
.64
4.1
Ind
ex S
F6
0.0
0.0
0.0
0.0
0.0
0.0
10
0.0
10
3.7
13
8.9
14
5.1
14
9.0
17
6.7
18
1.4
19
8.9
19
9.7
Ind
ex [
gro
up
of
new
ga
ses]
14
7.7
92
.54
1.7
54
.63
7.2
89
.61
00
.09
2.3
76
.31
39
.38
8.8
69
.13
6.3
46
.84
5.4
Fourt
h N
atio
nal
Com
munic
atio
n o
n C
lim
ate
Chan
ge
37

Figure 3.2
2003
CO2 excluding
LUCF
77%
PFCs
0%HFCs
0%
SF6
0%N2O
9%
CH4
14%
CO2 excluding LUCF CH4 N2O HFCs PFCs SF6
The change in the overall emissions for the period 1988–2003 is shown in Figure 3.3.
Figure 3.3 Total greenhouse gas emissions in CO2-eqv. kt
Total greenhouse gas emissions in CO2-eq kt
0
20000
40000
60000
80000
100000
120000
140000
1988 1990 1991 1992 1993 1994 1995 1996 1997 1998 1999 2000 2001 2002 2003
CO2 with LUCF CH4 N2O HFCs PFCs SF6
The aggregated GHG emissions by sectors in Bulgaria are shown in Table 3.4.
Data in Table 3.4 shows the leading position of the aggregated emission of the energy sector.The sectors Waste and Industrial processes have almost the same contribution.
In Table 3.5 is given the sector contribution in aggregated emissions.
Republic of Bulgaria, Ministry of Environment and Water38

Table 3.4 Aggregated GHG emissions by sector, Gg, CO2 eq
Sector/ year 1988 1990 1991 1992 1993 1994 1995
Energy 98 282 84 641 68 530 62 305 64 769 61 608 64 584
Industrial processes 10 425 9 232 6 293 5 303 5 139 6 071 7 401
Agriculture 13 632 12 225 10 108 8 171 6 803 6 236 5 678
Forestry -5 133 -6 157 -7 636 -7 412 -7 476 -7 302 -7 524
Waste 16 038 13 823 11 999 11 511 10 607 10 011 9 607
Total (without LUCF) 138 377 119 921 96 929 87 291 87 317 83 927 87 269
Sector/ year 1996 1997 1998 1999 2000 2001 2002 2003
Energy 63 074 61 673 55 409 50 899 50 131 51 943 49 241 53 466
Industrial
processes7 280 6 570 4 593 4 620 5 465 5 362 4 863 5 527
Agriculture 5 382 5 319 5 081 5 401 5 125 4 306 4 640 4 579
Forestry -6 517 -6 872 -6 860 -7 200 -8 976 -9 467 -8 318 -7 056
Waste 8 689 7 146 6 221 4 911 4 978 4 827 4 794 5 595
Total (without
LUCF)84 425 80 707 71 304 65 830 65 699 66 437 63 539 69 167
Table 3.5 Sector contribution in aggregated emissions, %
Sector/ year 1988 1990 1991 1992 1993 1994 1995
Energy 71.02 70.58 70.7 71.38 74.18 73.41 74.01
Industrial processes 7.53 7.7 6.49 6.08 5.89 7.23 8.48
Agriculture 9.85 10.19 10.43 9.36 7.79 7.43 6.51
Forestry -3.71 -5.13 -7.88 -8.49 -8.56 -8.7 -8.62
Waste 11.59 11.53 12.38 13.19 12.15 11.93 11.01
Sector/ year 1996 1997 1998 1999 2000 2001 2002 2003
Energy 74.71 76.42 77.71 77.32 76.3 78.18 77.5 77.3
Industrial processes 8.62 8.14 6.44 7.02 8.32 8.07 7.65 7.99
Agriculture 6.37 6.59 7.13 8.2 7.8 6.48 7.3 6.62
Forestry -7.72 -8.51 -9.62 -10.94 -13.66 -14.25 -13.09 -10.2
Waste 10.29 8.85 8.72 7.46 7.58 7.27 7.55 8.09
Analysis of Table 3.5 shows that sector “Energy”, where GHG emissions come from fuelcombustion, headed the list in 2003 with the biggest share – 77 %. Sector “Waste” ranked the second place, and sector “Industrial processes” ranked the third place.
3.5. Sub-sector “Transport”
Sub-sector “Transport” includes air, sea, road, inland waterway transport and other kinds of transport. The group “Other transport” included emission sources form off-road vehicles from agriculture and construction, such as: agriculture machinery for land cultivation, wood processing machinery, construction machinery, etc.
The aggregation level was by fuel type, vehicle type and dimensions (the engine volume forautomobiles and the loading capacity for trucks).
Fourth National Communication on Climate Change39
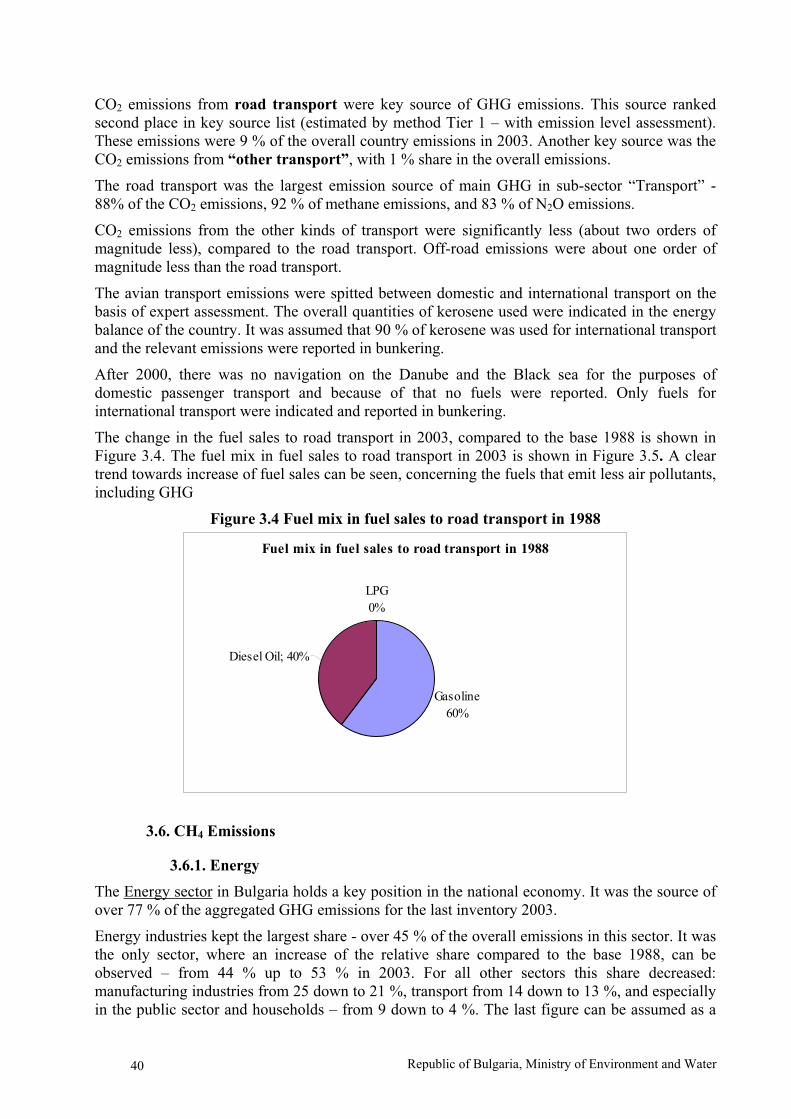
CO2 emissions from road transport were key source of GHG emissions. This source ranked second place in key source list (estimated by method Tier 1 – with emission level assessment).These emissions were 9 % of the overall country emissions in 2003. Another key source was the CO2 emissions from “other transport”, with 1 % share in the overall emissions.
The road transport was the largest emission source of main GHG in sub-sector “Transport” - 88% of the CO2 emissions, 92 % of methane emissions, and 83 % of N2O emissions.
CO2 emissions from the other kinds of transport were significantly less (about two orders of magnitude less), compared to the road transport. Off-road emissions were about one order of magnitude less than the road transport.
The avian transport emissions were spitted between domestic and international transport on thebasis of expert assessment. The overall quantities of kerosene used were indicated in the energy balance of the country. It was assumed that 90 % of kerosene was used for international transport and the relevant emissions were reported in bunkering.
After 2000, there was no navigation on the Danube and the Black sea for the purposes of domestic passenger transport and because of that no fuels were reported. Only fuels for international transport were indicated and reported in bunkering.
The change in the fuel sales to road transport in 2003, compared to the base 1988 is shown in Figure 3.4. The fuel mix in fuel sales to road transport in 2003 is shown in Figure 3.5. A clear trend towards increase of fuel sales can be seen, concerning the fuels that emit less air pollutants, including GHG
Figure 3.4 Fuel mix in fuel sales to road transport in 1988
Fuel mix in fuel sales to road transport in 1988
Gasoline
60%
LPG
0%
Diesel Oil; 40%
3.6. CH4 Emissions
3.6.1. Energy
The Energy sector in Bulgaria holds a key position in the national economy. It was the source ofover 77 % of the aggregated GHG emissions for the last inventory 2003.
Energy industries kept the largest share - over 45 % of the overall emissions in this sector. It was the only sector, where an increase of the relative share compared to the base 1988, can beobserved – from 44 % up to 53 % in 2003. For all other sectors this share decreased: manufacturing industries from 25 down to 21 %, transport from 14 down to 13 %, and especially in the public sector and households – from 9 down to 4 %. The last figure can be assumed as a
Republic of Bulgaria, Ministry of Environment and Water40

positive result from the reduced direct fuel combustion in the households, which led to an overall GHG emission and air pollutants’ reduction.
Figure 3.5 Fuel mix in fuel sales to road transport in 2003
Fuel mix in fuel sales to road transport in 2003
Gasoline
30%
Diesel Oil
51%
LPG
19%
The emissions growth in the energy industries, compared to the preceding year, was due to the decommissioning of units 1 and 2 (880 MW) in NPP Kozloduy, and the increased power consumption in the country, despite the decreased export of electrical power by 19%.
The trend of Transport sub-sector shows slight fluctuations, as in 2003 the emissions increased and were 14 % of the overall CO2 emissions in the sector. The fluctuations resulted from variations of liquid fuel prices, and from restructuring and renovation of the vehicles as well.
The overall trend in sub-sector “Other sectors” (Services, Households, Agriculture and Forestry)displayed fluctuations as well. The 1998 reduction was surmounted and emissions growth was observed in the last two years.
CO2 emissions from non-energy use of fuels were reported in this sector, and not in sector Process emissions due to the fact that they belong exactly to this sector
3.6.2. Agriculture
GHG emissions from sector “Agriculture“, result from production activities during processing of agricultural products, soil fertilization and animal manure management.
All emissions from combustion processes for energy production are reported in the “Agricultural and Forestry“ sub sector of the Energy sector while the emissions from agricultural machines arereported in the category “Other Transportation“ of the “Transport“ sub sector of the Energy sector.
GHG process emissions in sector “Agriculture” are grouped in the following sub sectors;
Enteric fermentation from domestic livestock;
Manure management;
Rice cultivation;
Agricultural soils;
Field burning of agricultural residues.
The biggest CH4 emission source in the sector is the enteric fermentation from domesticlivestock.
Fourth National Communication on Climate Change41
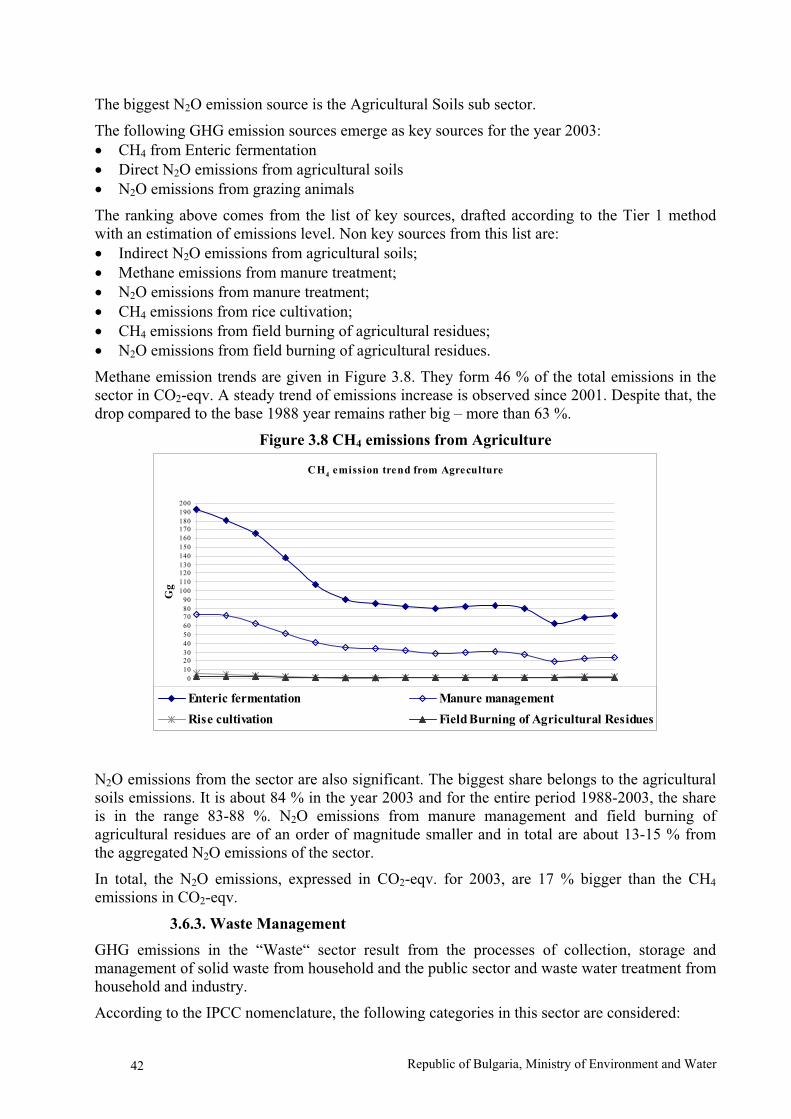
The biggest N2O emission source is the Agricultural Soils sub sector.
The following GHG emission sources emerge as key sources for the year 2003:
CH4 from Enteric fermentation
Direct N2O emissions from agricultural soils
N2O emissions from grazing animals
The ranking above comes from the list of key sources, drafted according to the Tier 1 methodwith an estimation of emissions level. Non key sources from this list are:
Indirect N2O emissions from agricultural soils;
Methane emissions from manure treatment;
N2O emissions from manure treatment;
CH4 emissions from rice cultivation;
CH4 emissions from field burning of agricultural residues;
N2O emissions from field burning of agricultural residues.
Methane emission trends are given in Figure 3.8. They form 46 % of the total emissions in the sector in CO2-eqv. A steady trend of emissions increase is observed since 2001. Despite that, the drop compared to the base 1988 year remains rather big – more than 63 %.
Figure 3.8 CH4 emissions from Agriculture
CH4 emission trend from Agreculture
0
10
2030
40
50
60
7080
90
100
110
120130
140
150
160
170180
190
200
1988 1990 1991 1992 1993 1994 1995 1996 1997 1998 1999 2000 2001 2002 2003
year
Gg
Enteric fermentation Manure management
Rise cultivation Field Burning of Agricultural Residues
N2O emissions from the sector are also significant. The biggest share belongs to the agricultural soils emissions. It is about 84 % in the year 2003 and for the entire period 1988-2003, the share is in the range 83-88 %. N2O emissions from manure management and field burning of agricultural residues are of an order of magnitude smaller and in total are about 13-15 % from the aggregated N2O emissions of the sector.
In total, the N2O emissions, expressed in CO2-eqv. for 2003, are 17 % bigger than the CH4
emissions in CO2-eqv.
3.6.3. Waste Management
GHG emissions in the “Waste“ sector result from the processes of collection, storage and management of solid waste from household and the public sector and waste water treatment from household and industry.
According to the IPCC nomenclature, the following categories in this sector are considered:
Republic of Bulgaria, Ministry of Environment and Water42
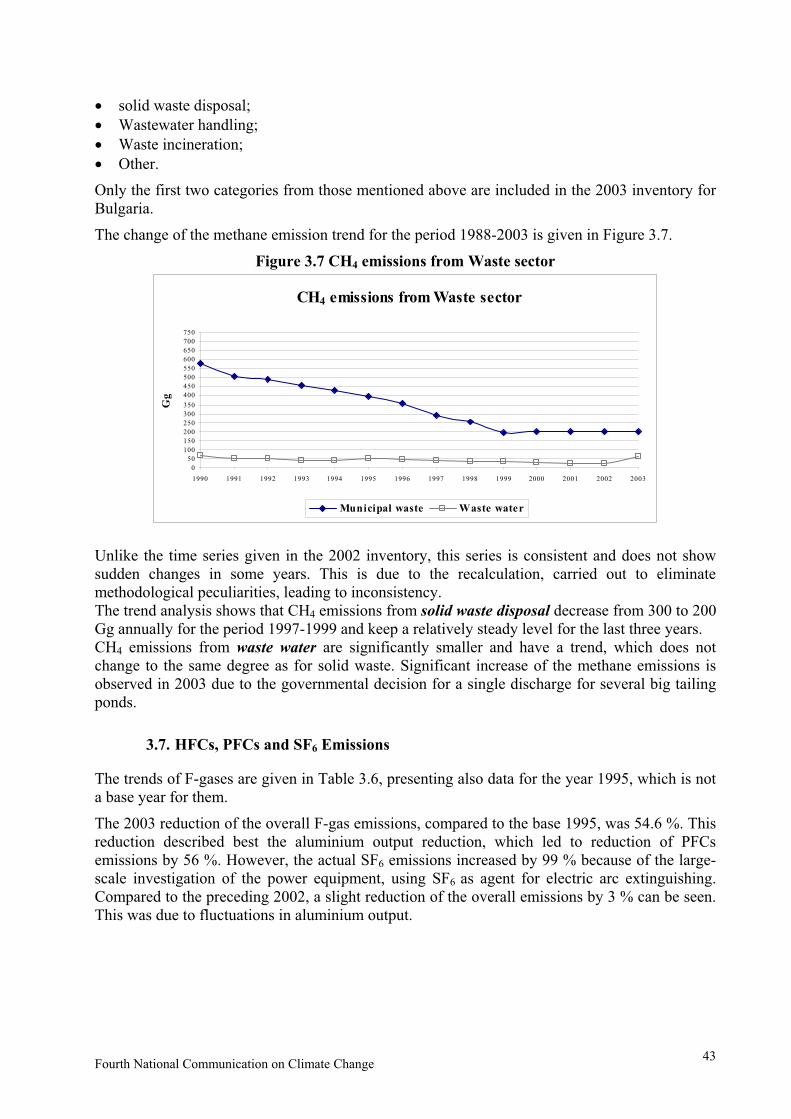
solid waste disposal;
Wastewater handling;
Waste incineration;
Other.
Only the first two categories from those mentioned above are included in the 2003 inventory for Bulgaria.
The change of the methane emission trend for the period 1988-2003 is given in Figure 3.7.
Figure 3.7 CH4 emissions from Waste sector
CH4 emissions from Waste sector
0
50
100
150
200
250
300
350
400
450
500
550
600
650
700
750
1990 1991 1992 1993 1994 1995 1996 1997 1998 1999 2000 2001 2002 2003
Gg
Municipal waste Waste water
Unlike the time series given in the 2002 inventory, this series is consistent and does not show sudden changes in some years. This is due to the recalculation, carried out to eliminatemethodological peculiarities, leading to inconsistency.The trend analysis shows that CH4 emissions from solid waste disposal decrease from 300 to 200 Gg annually for the period 1997-1999 and keep a relatively steady level for the last three years.CH4 emissions from waste water are significantly smaller and have a trend, which does not change to the same degree as for solid waste. Significant increase of the methane emissions is observed in 2003 due to the governmental decision for a single discharge for several big tailing ponds.
3.7. HFCs, PFCs and SF6 Emissions
The trends of F-gases are given in Table 3.6, presenting also data for the year 1995, which is not a base year for them.
The 2003 reduction of the overall F-gas emissions, compared to the base 1995, was 54.6 %. This reduction described best the aluminium output reduction, which led to reduction of PFCsemissions by 56 %. However, the actual SF6 emissions increased by 99 % because of the large-scale investigation of the power equipment, using SF6 as agent for electric arc extinguishing. Compared to the preceding 2002, a slight reduction of the overall emissions by 3 % can be seen.This was due to fluctuations in aluminium output.
Fourth National Communication on Climate Change43

Table 3.6 Actual emissions of HFCs, PFCs, SF6- Gg CO2-eq
F- gases, Gg 1 988 1 990 1 991 1 992 1 993 1 994 1 995
HFCs- total 2.95
PFCs-total 75.55 47.31 21.32 27.92 19.03 45.83 46.94
SF6-use 1.26
Total F- gases 75.55 47.31 21.32 27.92 19.03 45.83 51.16
F- gases, Gg 1997 1998 1999 2000 2001 2002 2003
HFCs- total
PFCs-total 37.26 69.44 43.55 33.14 16.29 21.42 20.69
SF6-use 1.75 1.83 1.88 2.23 2.29 2.51 2.52
Total F- gases 39.01 71.27 45.43 35.37 18.58 23.93 23.21
In Table 3.7 is shown the differences between National Inventory Report (NIR) 2004 (the inventory for 2002 was presented in 2004) and NIR 2005 (the inventory for 2003 was presented in 2005) for 1988-2002 due to recalculation.
Republic of Bulgaria, Ministry of Environment and Water44

Ta
ble
3.7
Dif
fere
nce
s b
etw
een
NIR
20
04
an
d N
IR 2
00
5 f
or
19
88
-20
02
du
e to
rec
alc
ula
tio
n,
%
Ga
s/se
cto
rS
ou
rce
1988
1990
1991
1992
1993
1994
1995
1996
1997
1998
1999
2000
2001
2002
En
erg
yN
IR-2
005
as
to
CO
2N
IR-
20
04
-4.1
73
.60
4.4
24
.30
4.3
95
.59
6.0
56
.26
6.9
15
.61
5.9
97
.53
5.6
94
.65
CH
4-3
0.3
4-4
9.8
1-4
9.1
2-4
5.0
8-4
3.1
8-4
3.6
9-4
6.7
2-4
7.5
6-4
3.9
9-4
0.5
3-3
9.1
0-3
7.9
0-3
6.6
1-3
3.3
1
N2O
-11
.82
0.0
00
.00
0.0
00
.00
0.0
00
.00
0.0
00
.00
-0.0
4-0
.04
0.0
00
.00
0.0
0
Ind
ust
ria
l p
roce
sses
CO
20
.00
0.0
00
.00
0.0
00
.00
0.0
00
.00
0.0
00
.00
0.0
00
.00
0.0
00
.00
0.0
0
CH
48
8.6
18
.95
7.0
27
.20
7.2
46
.05
5.9
16
.66
6.0
46
.39
2.6
70
.00
0.0
00
.00
N2O
0.0
00
.00
0.0
00
.00
0.0
00
.00
0.0
00
.00
0.0
00
.00
0.0
00
.00
0.0
00
.00
Solv
ent
use
NM
VO
Cs
-71
.73
-65
.05
-46
.43
-46
.07
-39
.05
-40
.16
-45
.48
-50
.69
-51
.40
-26
.08
46.0
80
.00
197
.80
186
.10
Ag
ricu
ltu
re
CH
40
.04
0.0
40
.04
0.0
50
.05
0.0
70
.09
0.0
70
.07
0.3
3-0
.32
0.3
40
.00
0.0
0
N2O
5.7
3-9
.79
-18
.16
-10
.76
-2.0
88
.07
-4.8
2-3
.95
1.6
1-4
.21
4.5
70
.04
0.0
7-0
.01
Fore
stry
Sin
ks
of
CO
21
0.2
16
.16
-3.1
1-2
.93
6.4
64
.68
0.0
7-9
.35
17.4
31
0.0
78
.96
0.0
00
.00
0.0
0
Wa
ste
CH
41
3.8
7-1
2.2
7-2
6.5
7-2
8.3
1-2
7.4
88
.56
0.0
00
.72
0.0
00
.01
-2.0
60
.00
0.0
00
.00
N2O
31.7
90
.00
0.0
00
.00
0.0
00
.00
0.0
00
.00
0.0
00
.00
0.0
00
.00
0.0
00
.00
To
tal
wit
ho
ut
fore
sts
CO
2-e
qv.-
wit
ho
ut
F-g
ases
-2.4
8-1
.80
-4.6
1-4
.70
-3.4
23
.03
1.5
41
.71
2.8
21
.82
2.4
63
.28
2.3
31
.77
CO
2-e
qv.-
tota
l-2
.43
-1.7
6-4
.58
-4.6
7-3
.40
3.0
81
.54
1.7
12
.82
1.8
32
.47
3.2
82
.33
1.7
8
CO
2-3
.85
3.3
04
.11
4.0
24
.11
5.1
55
.53
5.7
16
.33
5.2
35
.52
6.8
85
.23
4.2
8
CH
41
.98
-16
.38
-24
.85
-26
.10
-26
.02
-5.2
1-1
1.8
0-1
2.4
8-1
1.7
1-1
1.1
0-1
1.7
9-1
1.0
9-1
1.2
1-9
.53
N2O
-0.3
8-5
.40
-10
.16
-5.4
3-0
.96
3.4
6-1
.88
-1.4
90
.61
-1.8
12
.08
0.0
10
.03
0.0
0
Fourt
h N
atio
nal
Com
munic
atio
n o
n C
lim
ate
Chan
ge
45

Republic of Bulgaria, Ministry of Environment and Water46
4 POLICIES AND MEASURES
4.1. Introduction
This chapter provides an overview of general climate change policy in Bulgaria.
The main framework of the environmental policy in the country is the National EnvironmentalStrategy, which serves as a base for the activities in the environmental policy areas, including climate change. The Second National Action Plan on Climate Change 2005 -2008 fulfils the role of elaborating the goals set out in this strategy, by identifying concrete policies and measures,including actions to implement these policies and measures.
Due to the forthcoming accession of Bulgaria to the European Union the country is harmonizingall the aspects of the environmental legislation with the EU legislation. Based on the legal acts the Government has approved set of secondary laws, regulations and methodologies of the MOEW and its subsidiaries, which are already operational. The laws in the MOEW competenceare listed in p.1.2. Legislation.
The harmonization of the legislation is ongoing and all the already approved and the future EU legislative initiatives in the field of climate change will find place within the Bulgarianlegislation.
4.2. Institutional Organization
Responsibility of the Ministry of Environment and Water
The Ministry of Environment and Water (MOEW) is the governmental institution authorized to develop and carry out the state policy related to protection of the environment. MOEW isresponsible for the preparation and reporting of the annual inventories of GHG emissions, as well as for the formulation and implementation of the policies and measures to mitigate climatechange.
Role of the Inter-Ministerial Committee on Climate Change (IMCCC)
The IMCCC was set up under the Governmental decision to coordinate the implementation ofthe First Action Plan on Climate Change in July 2000. It was intended to facilitate thecommunications among institutions and to ensure the control and coordination of their activities in relation to the climate change process in the country. The Committee consists of representatives from a majority of the ministries, the Energy Efficiency Agency and an observerfrom Sofia Municipality, and is chaired by Deputy Minister of MOEW.
The Steering Committee (SC) for Joint Implementation Projects
Steering Committee is an evaluation body for and Joint Implementation projects under the Kyoto Protocol. It consists of representatives from MOEW, the Ministry of Economy, the Ministry ofFinance, the Ministry of Regional Development and Public Works, the Ministry of Agriculture and Forestry, the Executive Energy Efficiency Agency and the Bulgarian Investments Agency. The Committee is chaired by the Minister of MOEW. The SC evaluates proposed JI projectsaccording to the existing national criteria for JI projects on the basis of the Project DesignDocuments (a PDD). If necessary, additional expert opinions and statements from the relevantministries and organizations are requested. The SC advises the Minister of the Environment and Water in issuing / not issuing a Letter of Approval for each particular proposal.
Fourth National Communication on Climate Change47
The Intrministerial Working Group for Development of the National Allocation Plan
(IWGNAP)
The introduction of the EU Emissions Trading Scheme requires the country to possess National Plan for allocation of emission allowances. The Plan development is coordinated by an interministerial working group set by the ordinance of the Minister of MOEW No. RD-186/06.04.2005. Representatives of the MOEW, the MEE, the MRDPW, the MF, the NSI and representatives of NGOs: Bulgarian Chamber of Commerce and branch organizations of theindustrial branches that are covered by the Scheme – Bulgarian Association of the CementIndustry, Bulgarian Branch Chamber of the Energetic, Branch Chamber of the Pulp and Paper Industry, Branch Chamber of the Glass Industry, Branch Chamber of the Iron and Steel Industry, Branch Chamber of the Chemical Industry, Bulgarian Union of the Ceramics. The Plan development is supported by the Bulgarian and Dutch consultants under a project funded by thePSO program of the Government of The Netherlands.
Role of implementing agencies and other institutions
The Executive Environmental Agency within MOEW performs monitoring of the implementation of climate change-related measures. The agency deals with water and air qualitycontrol and receives data from the monitoring stations nationwide. It also carries out theprocedures on issuing the permits under the IPPC Directive. The Agency is responsible for the preparation of the GHG inventories, projections and registers. It carries out the procedures on issuing the GHG emission permits – considers the operators’ application forms and drafts the permits. The National Administrator of the National Registry for issuing, possession, transferand cancellation of the GHG emission allowances.
Energy Efficiency Agency within MEER – organizes the implementation of projects and measures in accordance with the national long- and short-term energy efficiency programs;approves projects for energy efficiency and controls their implementation; participates in thepreparation of legal regulations in the field of energy efficiency: proposes development and improvement of energy efficiency standards in order to achieve approximation to the EU norms and to encourage energy efficiency at the demand side; cooperates with central and regional governmental institutions, employers’ associations, branch organizations, consumer associations and NGOs on implementation of energy efficiency policies and measures; maintains the nationalinformation system on energy efficiency, develops guidelines for establishments and maintenance of EE information systems for central and regional governmental institutions;develops programs for implementation and control of EE measures and programs for EE awareness rising; develops programs for implementation of EE on local (municipal) level; cooperates in implementing EE training.
Municipalities
The major responsibility of municipal energy management is imposed upon local authorities. The rational use of energy as well as its production and supply at local level, becameresponsibility of municipal authorities. The basic instrument for energy management in municipalities is the local (municipal) energy planning.
Municipal energy efficiency planning is obligatory according to the new Energy Efficiency Law.Therefore, the municipal administration has to adopt the following programmes:
- Refurbishment of the housings, administrative and utility buildings throughout the municipal territory aiming to carry out measures for energy efficiency;
- Introduction of energy-saving appliances for street lighting in settlements and in public buildings;
- Other measures for improvement of energy efficiency.
Republic of Bulgaria, Ministry of Environment and Water48

4.3. Policy Instruments
This section presents set of political instruments which could be applied in the Climate Change Policy. In functional plan, these instruments have an intersectoral impact and influence the economy and household in general.
Legal instruments and regulation
In most countries laws and regulations are important instruments in climate change policy. The Bulgaria obligations in the climate change policy follow from multilateral and bilateralinternational agreements, from the EU legislation in the field of climate change as well as fromthe national legislation. The most important are:
Multilateral international agreements:
1.United Nations Framework Convention on Climate Change (UNFCCC), enforced in 1995.
2.Kyoto Protocol annexed to UNFCCC, enforced in 2005
European legislation:
1.Directive 2003/87/EC of the European Parliament and of the Council of 13 October 2003 establishing a scheme for greenhouse gas emission allowance trading within the Community and amending Council Directive 96/61/EC
2.Directive 2004/101/EC of the European Parliament and of the Council of 27 October2004 amending Directive 2003/87/EC establishing a scheme for greenhouse gas emissionallowance trading within the Community, in respect of the Kyoto Protocol's project.
3.2004/156/EC: Commission Decision of 29 January 2004 establishing guidelines for the monitoring and reporting of greenhouse gas emissions pursuant to Directive 2003/87/ECof the European Parliament and of the Council
4.Commission Regulation (EC) No 2216/2004 of 21 December 2004 for a standardised and secured system of registries pursuant to Directive 2003/87/EC of the European Parliament and of the Council and Decision No 280/2004/EC of the European Parliamentand of the Council
5.Decision No 280/2004/EC of the European Parliament and of the Council of 11 February 2004 concerning a mechanism for monitoring Community greenhouse gas emissions and for implementing the Kyoto Protocol
Bilateral international agreements
Seven Intergovernmental Memoranda of Understanding in the field of Joint ImplementationProjects under the Kyoto Protocol, respectively with Netherlands (2000), Austria (2002), Switzerland (2003), Denmark (2003), World Bank's Prototype Carbon Fund (2002), Sweden and Japan (2006).
National legislation:
1.Ratification act of the United Nations Framework Convention on Climate Change (UNFCCC), published in State Gazette, No 28/28.03.1995.
2.Ratification act of the Kyoto Protocol to the United Nations Framework Convention on Climate Change, published in State Gazette, No 72/25.07.2002
3.Act amending the Environmental Protection Act concerning the transposition of Directive 2003/87/EC of the European Parliament and of the Council establishing a
Fourth National Communication on Climate Change49

scheme for greenhouse gas emission allowance trading within the Community (published in State Gazette, No.77/27.09.2005)
4.Decision 1012/21.12.2004 of the Council of Ministers adopting the National Action Plan on Climate changes
5.Five Ratification acts of Bilateral Cooperation Agreements in the field of Joint Implementation Projects under the Kyoto Protocol, respectively with Netherlands, Austria, Switzerland, Denmark, World Bank's Prototype Carbon Fund, Sweden.
The other important laws that are directly or indirectly related to climate change are:
- The Environmental Protection Act (State Gazette, 25.09.2002) and Clean Air Act (StateGazette, 28.05.1996) and related secondary legislation, including a permit system for meetingminimum standards in accordance with EU regulation on Large Combustion Plants, theintroduction of the EU ETS and technical inspection (e.g. for cars) etc;
- The Energy Law (State Gazette 107/9.12.2003) in its part on renewable energy and combinedheat and power generation introduces the requirements of the two related EU directives and the use of instruments such as green certificates; defines indicative target for energy production from RES and mandates the state regulations to the licensed activities in the power sector and purchase obligations for district heating companies to buy utilized waste thermal energy (State Gazette 107, 18.12.2003);
- The Energy Efficiency Law and related secondary legislation (State Gazette, 5.03.2004), including obligation to adopt municipal energy efficiency programs, requirements for energy efficiency labelling, the use of minimum standards resulting from the EU directive on energy efficient appliances, regulations for energy efficiency labelling of various types of products(appliances, cars), obligatory audits and amendments of the Energy Performance Standards for existing buildings;
- The Law on Waste Management (State Gazette, 30.09.2004) and the related secondary legislation including the obligation for collecting, management and usage (or combustion) of the omitted gases from the new waste deposits;
- The Law on Statistics (State Gazette, 25.06.1999) including national and international monitoring and reporting obligations of GHG emissions.
Fiscal policy
In many EU countries fiscal policies are important instruments to stimulate measures that reduce emissions of greenhouse gases and/or save energy. The advantage of the fiscal incentives is that they are equally available to all investors and make better use of the market mechanisms. Whenintroducing such policies in Bulgaria it is necessary to remember that they have to be in harmonywith EU legislation (especially in relation to competitiveness) and to be implemented in such away that minimizes or eliminates the “free riders”.
A number of stimulating measures for the subjects of taxation were introduced in the Law on amendment and supplement of the Law on the Corporate Income Tax Act and also in the Law on amendment and supplement of the Personal Income Tax Law, regarding the activities of the newly established fund “Energy efficiency”.
Financing Emission Reduction Projects
The evaluation of the First Action Plan pointed out that the implementation of several mitigationmeasures was hindered by a lack of financial resources, mainly caused by the economic situationof the country during the 1990s. Both private and public sector lack adequate financial resources
Republic of Bulgaria, Ministry of Environment and Water50

to finance climate measures. It is expected that this situation will not significantly change in the period 2005-2008.
The implementation of measures can be funded by other financing schemes. Below some of theoptions are listed.
- Energy efficiency funds
The fund, which will become operational by January 2005, is supported by the World Bank and GEF. US$ 17 million will be available for energy efficiency projects.
At the same time the European Bank for Reconstruction and Development (EBRD) established an energy efficiency credit line of € 60 million, which will be used to improve energy efficiency at small and medium-sized enterprises (SMEs). Both funds will provide loans for energyefficiency activities.
- State Agricultural Fund (SAF)
The State Agricultural Fund has been established with support of the EU (SAPARD). Subsidies from this fund are granted only for agricultural activities. The fund gives priority to projects thatlead to reduction of emissions from agricultural activities, such as manure treatment and storage,soil fertilizing and agricultural residue burning.
- Kyoto Protocol Mechanisms - Joint Implementation, International Emissions Trading
(Green Investment Scheme)
The Kyoto Protocol defines the flexible instruments that can contribute to the reduction of GHG emissions and result is economical, social, technological and environmental benefits for thecountry.
- EU structural funds
ISPA and SAPARD are the main sources of EU financing the agricultural and infrastructuredevelopment of Bulgaria.
Education, Research and Development (R&D)
Education and R&D are important for the future development of climate change activities and environmentally-friendly behaviour of future generations. Due to a lack of finance only limitedactions have been undertaken:
- Introduction of climate change problems into the curriculum of schools and universities;
- Implementation of local R&D programs;
- Participation in EU Research programs (6th Framework program).
Awareness Raising and Public Information
Different stakeholders such as the national Government, the business community, environmentalNGOs and the media play an important role in the raising the public awareness about the climatechange, international and national actions to mitigate climate change. Activities, which areundertaken in Bulgaria, are:
- Designation of National Focal Point under Art. 6 o the UN FCCC;
- Regular actualization of the information about the current climate change policy at the MOEWweb site;
- Issuing and distribution of brochures and other materials;
- Inclusion of climate change days in the national environmental campaigns;
Fourth National Communication on Climate Change51

- Publications in the media presenting information on various aspects of the climate change;
- Information support and organization of workshops for business stakeholders on the opportunities to participate in Joint Implementation mechanism according to the requirements of the Kyoto Protocol and participation in the EU ETS;
- Dissemination of adapted scientific findings and information on climate change; popularized through integrating them in various specialized information flows.
National strategy for the Environment and Second National Action Plan 2005-2014
The Strategy was developed for the period 2005-2014 together with an Action Plan 2005-2009. It is a continuation of the National Strategy for the Environment 2000-2006 and in this aspect keeps the long-term environmental policy objective. The National Strategy for the Environmentis consistent with the principles of the prevention and reduction of the human health risk, integration of the environmental protection policy in the sectoral policies on the development of the economy and awareness of the citizens on the state of the environment.
The objectives and actions of this National strategy have been developed, taking into account theopinion of a wide variety of representatives – state institutions, business, municipalities, NGO, the general public.
For the first time, during the development of a strategic national document in the area of environmental protection, a national survey was carried out in order to take into considerationthe opinion of the population in determining the priorities and measures in the National Strategy for the Environment and also the public awareness on the environmental protection issues.
The project of the National Strategy for the Environment 2005-2014 was approved by the Council of Ministers on April 7th, 2005 and was passed to the National Assembly for discussion and adoption.
Second National Climate Change Action Plan (2005-2008)
During the analysis of the results of the actions undertaken to fulfil the First National Action Plan in 2002 a decision was undertaken to develop a Second National Action Plan for the period 2005 – 2008. The plan is approved by the Government and published in Bulgarian and English languages.
The First National Action Plan on Climate Change (NAPCC) for Bulgaria was developed in the period 1996 – 1997, and approved by the Government in 2000. It contained a coherent set of actions for the period in line with Bulgaria’s international obligations in the context of UNFCCCas well as the Climate Change Program of the European Union.
The economic growth of Bulgaria after the year 2000 along with changes in the international and domestic policy and regulatory framework required an update of the Plan. The updated action plan will be implemented in the period 2005 – 2008, although the effects of the measures in terms of greenhouse gas (GHG) emission reduction are assessed up to year 2012, when the First Commitment Period under the Kyoto Protocol ends.
The following four categories of actions are included in the updated Plan: Actions to implement mitigation policies and measures that result in GHG emissionreductions in the different economic sectors in Bulgaria;Actions to create the necessary conditions for implementation of the mitigation measures, forinstance institutional arrangements and awareness raising;Actions related to the monitoring and registration of GHG gases and the systematicevaluation of emission trends and projections, including the evaluation of policies and measures;
Republic of Bulgaria, Ministry of Environment and Water52
Actions for the implementation of the Joint Implementation and Emissions Trading schemes.
The NAPCC comprises mainly measures that do not require budget financing, since the economic situation in Bulgaria does not allow for the allocation of significant funding and other public resources for implementing climate change-related policies and measures. Nevertheless, the plan includes a set of “backup” measures which can be implemented in case when the GHGemissions grow faster than expected one or when the economic situation in Bulgaria allows theGovernment to participate more actively in this field.
4.4. Sectoral Policies and Measures for Reducing GHG Emissions in Bulgaria
Introduction
This chapter presents sector policies and measures, which contribute to a reduction of greenhouse gas emissions in Bulgaria. As discussed in Chapter 3, the need for Bulgaria to undertake mitigation measures is limited given the current GHG emission level and the expected emission trend. Implementing climate change measures are, however, also driven by other factors. Firstly, the commitments under the Climate Convention, the Kyoto Protocol and the EU accession require an active attitude of the country to mitigate greenhouse gas emissions.
Secondly, national and EU regulation require specific actions such as the implementation of standards, the development of a Green Certificates Scheme under the Renewable Energy Directive and Emissions Trading Scheme. And last but not least various climate change measures will lead to an energy efficiency improvement and contribute to long-term cost savings.
4.4.1. Energy Sector
The Energy strategy for Bulgaria is elaborated for the accelerated reformation of the Energy sector. The Bulgarian Energy Strategy was adopted by the Council of Ministers on May, 11th, 2002 and the National Assembly adopted it with Decision 39/2002. The strategy represents the national energy policy and the main reforms envisaged for this sector. The Bulgarian energy sector will continue to be based on two major pillars in the future: nuclear energy and localextraction of lignite coal as a leading priority for the development of a competitive energymarket. All other priorities are directly related to:
- Security of supply;
- Competition at the energy market;
- Environmental protection.
These priorities fully match the priorities of the EU energy policy.
The preparations for liberalization of the Bulgarian energy market have reached an advanced stage and the new Energy Law incorporated the EU requirements of the Electricity and NaturalGas Directives regarding the establishment of an electricity market and a natural gas market.Implementation programs for the Directives on Large Combustion Plants and Waste Disposal Sites respectively have been adopted. The electricity and thermal energy prices for thepopulation will be adjusted to the production costs. The state subsidies for the power sector will gradually be abolished and will be redirected to the low-income population groups.
Practically Bulgaria is the energy centre of South-East Europe due to its geographic location on one hand, and on the other – the country covers 45 % of the permanent deficit in the commonenergy balance of South-East Europe. From major electricity importer (up to 4.5 TWh per annum) now Bulgaria is a major electricity exporter (5-7 TWh per annum).
Fourth National Communication on Climate Change53

Improvement of the operation of nuclear power plant Kozloduy (NPP-K) – E1
Kozloduy units 1-4 will gradually be put out of operation (units 1 and 2 in 2002, and units 3 and 4 in 2006). To preserve the share of nuclear energy in the overall production of electricity in the country measures have been implemented to further improve the operation of units 5 and 6 and modernize them.
E2 Accelerated development of hydro energy – E2
The existing hydropower plants (HPPs) have been rehabilitated as a considerable part of themhad outdated equipment. New automation and control systems were introduced. 70 % of thehydro potential is already utilized. New capacities of 400 MW could be built for an annual operation of 2 000 to 3 000 hours.
Upgrading of cogeneration plants and district heating boilers – E4
The overall efficiency could be increased to 80-90 %, which is much higher than that of existing cogeneration units or heat boilers. The introduction of new natural-gas combined cycle forreplacing capacities at some of the existing thermal power plants and district heating plantsforms part of the Implementation Programme for the Directive on Large Combustion Plants for the period after 2007.
Electricity transmission and distribution losses – E5
A reduction of the electricity losses will lead to fewer GHG emissions as a result of lower electricity production in coal-fired plants.
Heat transmission and distribution losses – E6
Losses of heat can be reduced through rehabilitation, modernization and improving the exploitation of the transmission and distribution networks. A reduction of the heat losses willlead to fewer GHG emissions as a result of lower heat production in heat boilers.
E7 Biomass for electricity and heat production – E7
The assessment of the theoretical potential resulted in the following figures: firewood – 7.7 PJper year; waste paper - 0.3 PJ per year; agricultural solid waste - 77.1 PJ per year; waste from live-stock breeding -11.3 PJ per year; municipal solid waste - 12.5 PJ per year and industrial waste wood - 0.4 PJ per year.
The potential for reduction of carbon dioxide emissions in the list of measures in the energysector is very big. The Second National Plan on Climate change envisages an annual potential for CO2 emission reduction of 3.3 mil. tons per year from the overall modernization of the heating companies in the country, 2 mil. tons – from heating loss reduction, 6.8 mil. tons from natural gas supply to household.
The annual GHG emission reduction following concrete policies and measures in the Energy sector is given in Table 4.1.
Republic of Bulgaria, Ministry of Environment and Water54

Table 4.1 Policies and measures in the Energy sector for GHG emission reduction
Measure Subsector Activity Instrument
Annual
reduction
of GHG in
2010 (Mt)
Year of introduction
E1 Nuclear energyImprovement ofthe existing plants
Financial 0.9 2007
E2 Hydro energyConstruction ofnew blocks
LegislativeFinancial
0.4 (after 2012)
Subject to the introductionof Green certificates and additional financing
E3Small and micro
HPPConstruction ofnew blocks
LegislativeFinancial
0.2Subject to the introductionof Green certificates and additional financing
E4
Electricityproduction fromcogeneration anddistrict heating
UpgradeLegislativeFinancial
0.9
Subject to the introductionof Green certificates, the application of the IPPCDirective, the Directive on Large Combustion Plantsand additional financing
E5Transmission and
distributionnetworks
Reduction oflosses
Legislative 1.1 2005
E6Heating powertransmission
networks
Reduction oflosses
LegislativeFinancial
0.9Gradually (subject to theregulations of SEWRC andadditional financing
E7 Biomass BurningLegislativeFinancial
0.05
Subject to the introductionof Green certificates, the application of the IPPCDirective and additionalfinancing.
4.4.2. Industry
The industry policy aims towards transition to a market economy, abolishment of subsidies and liberalization of the energy market has led to sharp reduction of the share of industry in GDP – from 61 % in 1987 to 29 % in 2002. The policy towards fast privatization resulted in almostcomplete privatization of the industrial plants. As a consequence, the most inefficient industries were closed.
The growth of industrial production that tended lately is quite unsteady. At some enterprises theyears of production growth are followed by years of reduction. Under these conditions thebaseline development scenario for industry include maintenance of liberalization and marketprinciples without subsides and preferences. Energy efficiency measures with pay-back period less than 2 years are also included in the baseline scenario. The implementation of these measures is possible at own expenses and limited loans from bank institutions at the conditions of unstable production programme. These measures will result in an average annual growth of energy consumption in industry of 1.7 % at 3.9 % GDP growth. This corresponds to a comparatively good rate of increase of efficiency at the absence of designated state subsidies in this field.
Reduction of thermal losses in industry – I1
The use of heat in the form of steam and hot water is an important part of the industrial energy consumption. Reduction of heat losses can be realized through thermal insulation, redesign and replacement or updating of heat exchangers leading to reduction of fuel consumption for its production
Fourth National Communication on Climate Change55
Natural gas supply to the industry by development of gas infrastructure – I2
Industry is a large consumer of energy. Substituting liquid fuels with natural gas will lead to thereduction of the GHG emissions and higher efficiency.
Introduction of monitoring systems for energy consumption – I3
One way to achieve improvement of the efficiency of production processes is the establishmentof systems for monitoring and control of energy consumption at different technological stages. This enables companies to have more insight in their energy consumption in various parts of the process, showing where measures could be taken for increase of efficiency.
Upgrading of steam and heat generation and compressed-air plants – I4
In the light industry, food processing industry, machine building and metalworking, electrical and electronic industry can all reduce about 20 % of the energy consumption. This can be donethrough modernization of steam and compressed-air installations, regulation of the heat energy systems, energy management and control and introduction of small-scale co-generation at therelevant enterprises.
Reduction of fuel consumption in production of building materials – I6
Cement industry is a key GHG emissions source. Production of structural ceramics and quicklime consume large amounts of fuels (both liquid and solid) as well. The energy use in this sector can be reduced by replacing part of the fuel by combustible waste such as car tires
The annual GHG emission reduction following concrete policies and measures in the Industry sector is given in Table 4.2.
Republic of Bulgaria, Ministry of Environment and Water56

Table 4.2 Review of the policies and measures in the Industry sector
Measure Subsector Activity Instrument
Annual
reduction
of GHG
in 2010
(Mt)
Year of
implementation
I1 All subsectorsReduction of thermallosses in industry
LegislativeFinancial
VoluntaryAgreements
(VA)
0.12Subject to thesource of financing
I2 All subsectorsIncreased use of naturalgas in industry
Financial 0.05
Subject to financing of thenatural gas supplynetwork
I3
Non-ferrousmetallurgy
Light industryMachine building,
electrical and electronic industry
Control of energyconsuming system inindustry.
VA 0.11Gradualintroduction from2006.
I4
Light industry, Foodand beverage industry
Machine building,electrical and
electronic industry
Modernization of steamand compressed-airinstallations
LegislativeFinancial
VA
0.02Gradualintroduction from2007.
I5 Building
Introduction of highly effectivemachines in building,using diesel fuel.
Legislative 0.07Gradualintroduction from2006.
I6Production of
building materials
replacing part of thefuel by combustiblewaste and car tires
LegislativeVA
0.34Gradualintroduction from2005.
4.4.3. Policies and Measures for Residential and Commercial/Institutional
Buildings
Considerable progress in energy saving was achieved by national programmes on theimprovement of thermal insulation of the existing buildings, on the replacement of incandescentlamps with compact luminescent lamps, and on the introduction of automated control of street lighting.
The analysis of options for RES utilization in households and services revealed a practicablepotential for GHG emissions reduction through implementation of measures in the following directions (reported by the Energy Efficiency Agency and municipalities):
- Solar collectors at public buildings;
- Introduction of hybrid installations for hot water at nurseries, schools and hospitals.
Gas supply to households - H1
The Gas Supply Program for Residential and Servicing sector of MEE plans for 720000 additional households to be connected towards 2020, which should lead to a reduction of 6.9 Mton CO2 eqv. Assuming annual new connections varying between 20,000 households in 2004 till 60,000 in 2010, about 290 thousand additional households will be supplied towards 2010, leading to an emission reduction of 2.3 Mton.
Fourth National Communication on Climate Change57

Solar collectors – H2
The geographical situation of the country provides for a substantial solar energy potential. Thesolar collectors transform solar energy in useful thermal energy. Due to the relatively low single capacities these panels are suitable for installation at institutional buildings and private homes.
Hybrid and other hot water installations – H3
RES potential studies have shown a potential for hot water installations using renewable energy. This can be hybrid systems combining solar collectors and biomass boilers, as well as hot water installations using only biomass.
The annual GHG emission reduction following concrete policies and measures in the Residential and Servicing sector is given in Table 4.3.
Table 4.3 Policies and measures in the Residential and Services sector
Measure Subsector Activity Instrument
Annual
reduction of
GHG in
2010 (Mt)
Year of
implementation
H1 HouseholdHousehold gas
supplyFinancial
Public awareness2.3
Gradually butstrongly dependent
on the available financing
H2Municipaland public
Solar panels Financial 0.022006, Dependent on
the available financing
H3Municipaland public
Hybrid and other hot water
installationsFinancial 0.04
Dependent on the available financing
4.4.4. Transport
The governmental investment policy in transportation is based on development of the country’s transport infrastructure as an integrated part of the overall European transport network. Thetransport infrastructure will be reconstructed and updated in accordance with the international requirements and standards. The most important objectives of the National Government are theliberalization of the transport market, finalization of the legislative and institutional restructuringof the transportation sector and the provision of beneficial conditions for development of privatetransport companies and renewing of the mobile park.
Transports dispatching system – T1
A considerable part of the return trips of freight vehicles is done without cargo. Both from an economic and environmental point of view, this is not very efficient. The implementation ofcentral information dispatching system for the loads will lead to a decrease of empty or semi-loaded return trips of Lorries and trains.
Railway transport power dispatching system – T2
Supply of electricity to the electrified sections of the railway network and reduction of electricity losses require introduction of an automated system for collecting information and dispatching control. It will lead to an increase of the security of the electricity supply and, as a consequence, to a decrease of the emissions.
Modernization of Railways – T3
Republic of Bulgaria, Ministry of Environment and Water58
The consumption of residual oil and electricity for transportation of one cargo unit or passenger at a given distance is much lowers that in the road transportation. There are technical solutions that can lead, if applied, to additional reduction of the consumption of oil and electricity. The proposed measures have direct and indirect effects on the increase of the passengers and load flows in the railway transport as well as on GHG emissions reduction.
Improving the public transportation, reducing transportation flows in cities and
renewing the transport park – T4
The improvement of public transportation and the reduction of private transportation in cities might contribute to lower GHG emissions from transportation. An increasing share of public transport in total transportation activities can however only is reached when policies areaccompanied with instruments which make the use of cars less attractive (e.g. increased fuel or road taxes, introduction of parking taxes, introduction of car-free zones in city centres). The strengthening of the control and quality in the accomplishment of the periodical technical examinations will lead to the renewing of the transport park.
Introduction of biofuels – T5
The implementation of this measure will lead to reduction of GHG emissions. Bulgaria has thepossibility to produce a substantial amount of biomass. Production of biofuels has a positiveeffect on employment in the agricultural sector.
The annual GHG emission reduction following concrete policies and measures in the Transportsector is given in Table 4.4.
4.4.5. Agriculture
The Government will carry out a uniform national strategy focusing on sustainable developmentof the agricultural sector in compliance with the general agricultural EU policy, taking the specific natural circumstances in Bulgaria into account.
Manure management – A1
Manure is one of the most considerable methane sources in agriculture. The modern manuremanagement practices are not applied in Bulgaria.
In liquid manure management are used transportation tanks, underground disposal at cattle-breeding farms and poultry-farming sites, separation of manure into liquid and solid fraction at pig-breeding farms, etc.
Fertilization and irrigation – A2
During the last years fertilization was conducted in an uncontrolled manner. The amounts of nitrous fertilizers applied to soils often exceeded the recommended ones. The requirements for quality of production and lower prime costs grew strict due to expanded import of agricultural goods from the neighbouring countries.
The annual GHG emission reduction following concrete policies and measures in the Agriculture sector is given in Table 4.5.
Fourth National Communication on Climate Change59

Table 4.4 Policies and measures in the Transport sector
Measure Subsector Activity Instrument
Annual
reduction
of GHG in
2010 (Mt)
Year of
introduction
T1 road/railway Introduction oftransportdispatchingsystem for cargo
FiscalPublic awarenessand campaigns
0.03 Dependent on the private sectorinitiatives
T2 railway Introduction ofrailwaytransportpowerdispatchingsystem
LegislativeFinancial Public awareness andcampaigns
0.09 2005
T3 railway Modernization Legislative 0.04 Dependent on the ongoingimprovements in the railway sector
T4 Publictransport
Improvementof publictransport and reduction of transportationflows in cities
LegislativeFiscal FinancialPublic awarenessand campaignsstronger control
Not valued Dependent on the presence of subsidies and regulations
T5 Car transport Increased use of biofuels
Legislative Fiscal Financial Public awareness andcampaigns
Not valued Dependent on the biofuelproduction
4.4.6. Waste Management
The measures for reduction of GHG emissions to be implemented in this sector are related to management of municipal solid waste.
Landfill sites are widely used in the country. The typical amount of waste to be disposed at regional landfill sites varies between 50,000 and 100,000 ton per year. The governmental policy in this field is directed towards building up a system of 54 regional landfill sites and closingdown these landfills which do not meet the legal requirements. With the setting up of theseregional landfill sites the environmental friendly waste treatment of all waste generated in thecountry will be secured.
Utilization of the captured methane for production of electricity - W1
At this moment the energy generated during the flaring of the captured methane is not utilized.The captured methane can be utilized in piston gas motors where electricity is generated. Because of the presence of mixtures in methane, a comparatively low efficiency is accepted for this type of machines (30 %). The received electrical energy from the burning of one ton captured methane will be about 4.2 MWh under the assumption that the diesel-generators operate 6 000 hours per year. This utilization of equipment for electricity production means an installed capacity of 19,517 kW.
Republic of Bulgaria, Ministry of Environment and Water60

The annual GHG emission reduction following concrete policies and measures in the Wastesector is given in Table 4.6.
Table 4.5 Policies and measures in the Agriculture sector
Measure Subsector Activity Instrument
Annual
reduction
of GHG in
2010 (Mt)
Year of
introduction
A1Livestockbreeding
Manuremanagement
Financial Research,development and consultancy
0.07Gradually from2005
A2
Fertilization
and
irrigation
Improvingfertilizationpractices
Elaboration ofirrigationtechnologiesaiming at water use reduction
LegislativeFinancial Research,
development and consultancy
SAPARDprogramme and State fund “Agriculture”
0.17Gradually from2005
Table 4.6 Policies and measures in the Waste sector
Measure Subsector Activity Instrument
Annual
reduction of
GHG in 2010
(Mt)
Year of introduction
W1 Landfills
Utilization of captured methanefor production of electricity
LegislativeFinancial
0.09
Subject to theintroduction of Greencertificates andadditional financing
Fourth National Communication on Climate Change61

Republic of Bulgaria, Ministry of Environment and Water62

5 PROJECTIONS AND EFFECTS OF POLICIES AND MEASURES
5.1. Introduction
Decision making for GHG emission mitigation is closely related to the actual GHG emissions in the country as assessed by the inventories and the projections for their mid-term trends (i.e. until2020). GHG projections are elaborated taking in consideration the trends of key macro-economic, technological, demographic and other indicators that determine the economicdevelopment of the country.
When developing the First, Second and Third National Communications under UNFCCC, the link between the historical data and the projections was vague, thus the coverage of the inventories was limited to a few years. Currently, there is a significant change in this regardsince the inventories cover a fifteen year period (1988 – base-year, 1990-2003). Furthermore, theinventory data has been recalculated and updated according to the latest IPCC methodologicalguidelines.
5.2. Projections
Current projections are based on the following procedures and assumptions:
Analysis of the emissions projections reported in the Second National Communications.
Accounting for the actual GHG emissions / removals for the period 1988-2003 and the underlying reasons for the trends (national and external factors).
Taking into consideration the sectoral plans for agriculture, forestry, industry and waste as reported by the relevant state institutions and NGOs.
As a result, three scenarios for GHG emission projections until 2020 were developed, analysedand compared:
“without measures” scenario
“with measures” scenario
“with additional measures” scenario
The “without measures” scenario is based on the assumption for intensive economicdevelopment with emphasis on energy intensive technologies and limited application of energy efficiency improvement measures in industry and agriculture. This scenario was originally developed in 1994 (before Bulgaria ratified the UNFCCC) for the preparation of the First National Communication. It was considered “business-as-usual” scenario, nonetheless it is not a “frozen efficiency” such. It incorporates all of the governmental policies and measures that have been adopted before 1994, thus making it more “likely-to-be” scenario. GHG projections for the scenario have been based on a limited number of emission sources, reflecting the actual IPCC Inventory Guidelines for that period. To assure comparability between the three scenarios, based on the forecasted in 1994 macroeconomic indicators, production volumes, activity data and emission factors the emissions forecast in “without measures” scenario have been revised.
The “with measures” projection encompasses currently implemented and adopted policies and measures, and those measures that are given in the energy sector. It envisages a growth rate of electricity demand by 62.8% for the period 2000-2020. This scenario projects relevant measuresin the energy sector, while the rest of the sectors rely on already applied measures.
Fourth National Communication on Climate Change63

The key macroeconomic and energy characteristics of this scenario are provided in section 5.3 Methodology. Herein only the schedule for decommissioning of old and commissioning of new power units is given as follows:
Units 3 and 4 of NPP Kozloduy are to be decommissioned in 2006.
New lignite fired units 335 MW each are to be commissioned in TPP Maritsa East 1 as follows: 2009 – 1x335 MW; 2012 – 2x335 MW.
Furnishing of the heat facilities in Sofia with gas turbines as follows: 2010 – 1x130 MW.
Commissioning of renovated 100 MW unit fuelled by imported coal in 2009 in TPP Ruse.
Commissioning of new HPP Tzenkov kamuk 80 MW – 2009.
New NPP in Belene – 1000 MW in 2013 and 1000 MW in 2016.
New HPP cascade Gorna Arda – 160 MW in 2015.
New TPP on combined cycle – 1200 MW in period 2018-2020.
This scenario encompasses measures for entire rehabilitation of old units and improvedenvironmental performance. GHG emissions mitigation could be expected due to theintroduction of renewable energy sources (including Hydro Power), safe operation of NPP units after rehabilitation, and expansion of heat generation units in Sofia.
This projection integrates the assumption for increase in annual electricity export from 4,200 up to 7,000 GWh for the period after 2005.
The “with additional measures” scenario comprises planned policies and measures for GHG mitigation. While in the “with measures” scenario the measures are more generally referring to environmentally friendly development, this scenario is more concentrated on the specific GHG mitigation measures and policies in the power sector. It is based on the same key macroeconomiccharacteristics.
The main differences between the “with measures” and “with additional measures” scenariosare:
Electricity demand increases by 37.4% for the period 2000 - 2020
Electricity export is kept at annual level of 4,200 GWh.
New NPP Belene – 1050 MW in 2017 and 1000 MW in 2022.
New HPP cascade Gorna Arda – 160 MW in 2016.
The measures and influence of the EC Directives on biofuels, HPP and GHG Emission trading are considered for the other sectors as planned in the Second Action Plan (2005-2008). These directives will be applied after 2007.
Reported GHG inventory results reveal that the following sources are the major contributors for GHG emissions in Bulgaria:
Energy, including stationary and mobile combustion – for CO2, CH4 and N2O.
Industrial processes – for CO2, CH4 and N2O.
Agriculture – for CH4 and N2O.
Land use change and forestry – for CO2.
Landfills – for CH4 and N2O.
The categories represented below account for more than 99% of the total country emissions, thusthey are the ones considered in the projection.
The GHG emission projections, by sector and by GHG; and the overall emission projection are given in the figures provided at the end of this chapter. The analysis of the sectoral projections andthe overall GHG emission projections indicates the effect of the implementation of the measuresdescribed in Chapter 4.
Republic of Bulgaria, Ministry of Environment and Water64

The “without measures” scenario used the baseline scenario from the First NationalCommunication. This scenario is revised with the results obtained by the GHG inventories until 2000.
The emission analysis address the period 2005-2020, for the “with measures” and “with
additional measures” scenarios.
5.2.1. Energy
The sectoral emission projections for CO2, CH4 and N2O are provided in Tables 5.1, 5.2 and 5.3. The trends in emissions from the base year 1988 until 2020 are given in Figs. 5.1, 5.2 and 5.3. The combined effect of the measures in power sector, industry, transport, agriculture, residentialsector and services is given in the GHG emission projections. In terms of CO2 and N2O these measures account only for the emissions from fuel combustion in all those sectors. CH4 account for those emissions; as well as for the fugitive emissions from production, transportation and distribution of coal, natural gas, and crude oil.
Fourth National Communication on Climate Change65
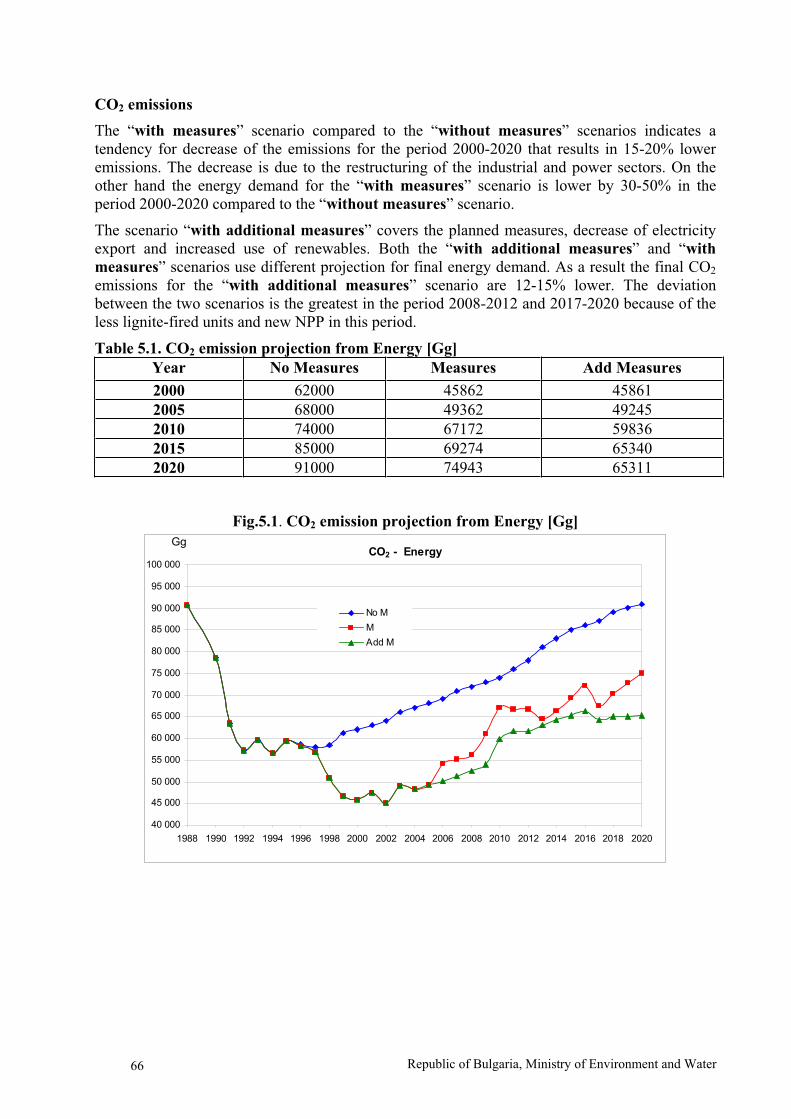
CO2 emissions
The “with measures” scenario compared to the “without measures” scenarios indicates a tendency for decrease of the emissions for the period 2000-2020 that results in 15-20% loweremissions. The decrease is due to the restructuring of the industrial and power sectors. On the other hand the energy demand for the “with measures” scenario is lower by 30-50% in theperiod 2000-2020 compared to the “without measures” scenario.
The scenario “with additional measures” covers the planned measures, decrease of electricity export and increased use of renewables. Both the “with additional measures” and “with
measures” scenarios use different projection for final energy demand. As a result the final CO2
emissions for the “with additional measures” scenario are 12-15% lower. The deviationbetween the two scenarios is the greatest in the period 2008-2012 and 2017-2020 because of the less lignite-fired units and new NPP in this period.
Table 5.1. CO2 emission projection from Energy [Gg]
Year No Measures Measures Add Measures
2000 62000 45862 45861
2005 68000 49362 49245
2010 74000 67172 59836
2015 85000 69274 65340
2020 91000 74943 65311
Fig.5.1. CO2 emission projection from Energy [Gg]
CO2 - Energy
40 000
45 000
50 000
55 000
60 000
65 000
70 000
75 000
80 000
85 000
90 000
95 000
100 000
1988 1990 1992 1994 1996 1998 2000 2002 2004 2006 2008 2010 2012 2014 2016 2018 2020
No M
M
Add M
Gg
Republic of Bulgaria, Ministry of Environment and Water66

CH4 emissions
The comparison of “with measures” and “without measures” scenarios takes into account the roleof the fugitive emissions. Most of these emissions are from mining of lignite and from transportation and distribution of natural gas. The decrease of the emissions in the period 2002-2013 is 23-26%. In the period 2009-2015 the decrease is variable and change from 26% in 2013 to 43% in 2020.
The comparison of the “with measures” and “with additional measures” scenarios indicatesvery low differences of 2-5% and mainly for the period after 2017.
Table 5.2. CH4 emission projection from Energy [Gg]
Year No Measures Measures Add Measures
2000 107 88 88
2005 115 90 89
2010 140 105 103
2015 165 110 108
2020 180 104 99
Fig.5.2. CH4 emission projection from Energy [Gg]
CH4 - Energy
70
80
90
100
110
120
130
140
150
160
170
180
190
1988 1990 1992 1994 1996 1998 2000 2002 2004 2006 2008 2010 2012 2014 2016 2018 2020
No M
M
Add M
Gg
Fourth National Communication on Climate Change67

N2O emissions
The emissions of N2O from energy sector are several times lower compared to the emissions of CH4 and occur in the energy transformation processes
Table 5.3. N2O emission projection from Energy [Gg]
Year No Measures Measures Add Measures
2000 1.45 1.10 1.10
2005 1.68 1.16 1.17
2010 2 1.31 1.21
2015 2.3 1.49 1.24
2020 2.7 1.67 1.21
Fig.5.3. N2O emission projection from Energy [Gg]
N2O - Energy
1,00
1,10
1,20
1,30
1,40
1,50
1,60
1,70
1,80
1,90
2,00
2,10
2,20
2,30
2,40
2,50
2,60
2,70
2,80
1988 1990 1992 1994 1996 1998 2000 2002 2004 2006 2008 2010 2012 2014 2016 2018 2020
No M
M
Add M
Gg
The “with measures” scenario compared to the “without measures” scenarios indicates a tendency for increase in the range of 33-59%. The difference till 2008-2009 is stabilized to 42% and then gradually increases to reach 58.8% in 2020.
The comparison of the “with additional measures” and “with measures” scenarios indicatesgradual increase of the differences from 8-9% in 2010 to 42% in 2020.
Table 5.4 presents the overall emissions from Energy expressed in Gg CO2 equivalent. The tendencies described above are slightly affected by the aggregation due to the fact that the importance of the CO2 emissions directs the overall trend.
Republic of Bulgaria, Ministry of Environment and Water68

Table 5.4. Total emissions from Energy [Gg CO2 eqv.]
Year No Measures Measures Add Measures
2000 64697 48051 48050
2005 70936 51617 51483
2010 77560 69778 62366
2015 89178 72044 67991
2020 95617 77640 67769
Fig.5.4. Total emissions from Energy [Gg CO2 eqv.]
CO2-eqv. - Energy
40000
50000
60000
70000
80000
90000
100000
110000
120000
130000
140000
1988 1990 1992 1994 1996 1998 2000 2002 2004 2006 2008 2010 2012 2014 2016 2018 2020
No M
M
Add M
Gg
The aggregated changes between the “with measures” and “without measures” scenarios are within the range of 11-19% with more explicit deviation after 2010. The comparison of the “with measures” and “with additional measures” scenarios also indicates a tendency for decrease in the second scenario which followed the commissioning of the new NPP.
If a comparison is made for the three scenarios over the 2000-2020 period, it indicates that the rates of emission increase (Table 5.5) are lower compared to the rates of increase of GDP from the relevant sectors.
Table 5.5. GHG emission increase for the energy sector in the 2000-2020 period, %
Scenario/ GHG CO2 CH4 N2O CO2 eqv.
With measures 63 18 52 62
With additional measures 42 13 10 41
For example the increase of the GDP of the country (including industry, energy industries, transport and services) is 2.76 times. Even the emissions in the “with measures” scenario have considerably lower increase (62%).
5.2.2. Industrial Processes
The emission projections for CO2, CH4, N2O and totals from industrial processes are provided in Tables 5.6, 5.7, 5.8 and 5.9. These do not include the emissions from fuel combustion.
The emissions from industrial processes include mainly ferrous industry, chemistry, buildingmaterials, food and beverage industry. Figs. 5.4, 5.5 and 5.6 provide emission trends for the period from the base year 1988 until 2020, including both inventory emissions and emission
Fourth National Communication on Climate Change69

projections.
CO2 emissions
The comparison of the scenarios “with measures” and “without measures” indicates a decrease of the emissions by 11-23% if measures are included.
The increase in the scenario “with measures” continues in period 2008-2012 and the difference with the “ with additional measures” scenario becomes 0.9-2%. After 2014 the emissions are expected to increase steeply for the both scenarios
CH4 and N2O emissions
Non-energy emissions of CH4 and N2O are much lower compared to CO2 emissions. The reduction of the CH4 emissions according to the scenario “with measures” compared to the “without measures” scenario is about 11-52% over the 2000-2008 period. In the period 2009-2020 the decrease is within the range of 45-52%.
Projected N2O emissions in the scenario “with measures” are considerably lower compared to the scenario “without measures”. This is due to the drop in the production of fertilizers in the period 1995-2000 that provides lower base for projections in the scenario “with measures”. As a result, for the entire projected period 2000-2020 the decrease to the scenario “without
measures” is comparatively stable in the range 88-129%.
Table 5.6. CO2 emission projection from Industrial Processes [Gg]
Year No Measures Measures Add Measures
2000 4900 4315 4315
2005 5800 5093 5093
2010 7200 6465 6278
2015 8100 7530 7530
2020 8800 7969 7969
Fig.5.5. CO2 emission projection from Industrial Processes [Gg]
CO2 - Ind. Proc.
3 000
3 500
4 000
4 500
5 000
5 500
6 000
6 500
7 000
7 500
8 000
8 500
9 000
1988 1990 1992 1994 1996 1998 2000 2002 2004 2006 2008 2010 2012 2014 2016 2018 2020
No M
M
Add M
Gg
Republic of Bulgaria, Ministry of Environment and Water70

Table 5.7. CH4 emission projection form Industrial Processes [Gg]
Year No Measures Measures Add Measures
2000 3.9 3.50 3.5
2005 4.0 2.40 2.4
2010 4.3 3.05 3.0
2015 4.7 3.55 3.5
2020 5.3 3.75 3.8
Fig.5.6. CH4 emission projection form Industrial Processes [Gg]
CH4 - Ind. Proc.
1,5
2
2,5
3
3,5
4
4,5
5
5,5
1988 1990 1992 1994 1996 1998 2000 2002 2004 2006 2008 2010 2012 2014 2016 2018 2020
No M
M
Add M
Gg
Fourth National Communication on Climate Change71

Table 5.8. N2O emission projection from Industrial Processes [Gg]
Year No Measures Measures Add Measures
2000 7.2 4.20 4.20
2005 8.3 2.93 2.93
2010 9.3 3.72 3.61
2015 10.5 4.33 4.33
2020 11.10 4.58 4.58
Fig.5.7. N2O emission projection from Industrial Processes [Gg]
N2O - Ind. Proc.
1,00
2,00
3,00
4,00
5,00
6,00
7,00
8,00
9,00
10,00
11,00
12,00
13,00
1988 1990 1992 1994 1996 1998 2000 2002 2004 2006 2008 2010 2012 2014 2016 2018 2020
No M
M
Add M
Gg
Republic of Bulgaria, Ministry of Environment and Water72

Table 5.9. Total emissions from Industrial Processes [Gg CO2 eqv.]
Year No Measures Measures Add Measures
2000 7214 5691 5691
2005 8457 6051 6051
2010 10173 7681 7459
2015 11453 8946 8946
2020 12353 9468 9468
Fig.5.8. Total emissions from Industrial Processes [Gg CO2 eqv.]
CO2-eqv. - Ind. Proc.
2000
4000
6000
8000
10000
12000
14000
1988 1990 1992 1994 1996 1998 2000 2002 2004 2006 2008 2010 2012 2014 2016 2018 2020
No M
M
Add M
Gg
5.2.3. Agriculture
Tables 5.10, 5.11, and 5.12 provide the non-energy emissions of CH4, N2O and the totals. Figs.5.9 and 5.10 and 5.11 show the forecasts for N2O and CH4 emissions for all years of the period. The main sources of CH4 are Enteric Fermentation and Manure Management that account formore than 95% of the CH4 emissions from Agriculture.
Fourth National Communication on Climate Change73

Table 5.10. CH4 emission projection from Agriculture [Gg]
Year No Measures Measures Add Measures
2000 124 109.0 109.0
2005 131 108.0 102.6
2010 210 196.3 186.5
2015 256 225.0 200.0
2020 299 242.0 220.0
Fig.5.9. CH4 emission projection from Agriculture [Gg]
CH4 - AGR
70
90
110
130
150
170
190
210
230
250
270
290
310
1988 1990 1992 1994 1996 1998 2000 2002 2004 2006 2008 2010 2012 2014 2016 2018 2020
No M
M
Add M
Gg
Table 5.11. N2O emission projection from Agriculture [Gg]
Year No Measures Measures Add Measures
2000 12.0 10.0 10.0
2005 13.0 9.4 8.9
2010 16.0 14.7 14.0
2015 22.0 20.6 18.5
2020 29.0 26.7 24.0
Fig.5.10. N2O emission projection from Agriculture [Gg]
N2O - AGR
5
7
9
11
13
15
17
19
21
23
25
27
29
31
1988 1990 1992 1994 1996 1998 2000 2002 2004 2006 2008 2010 2012 2014 2016 2018 2020
No M
M
Add M
Gg
Republic of Bulgaria, Ministry of Environment and Water74
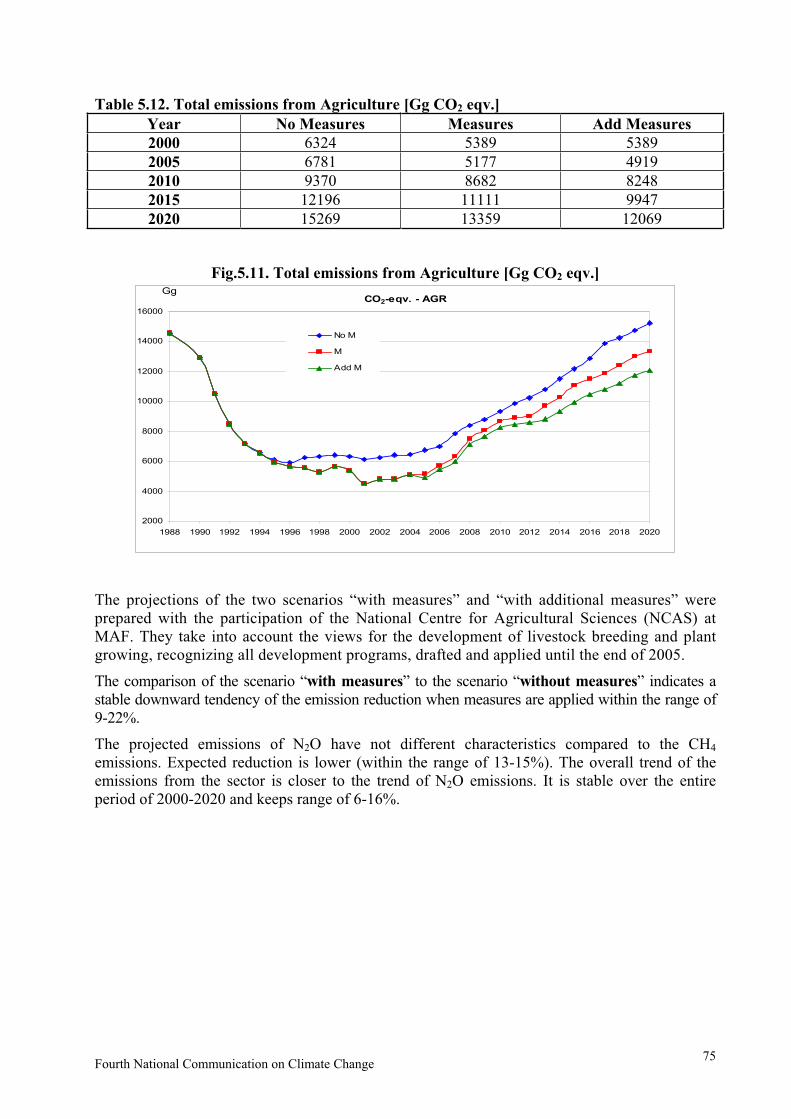
Table 5.12. Total emissions from Agriculture [Gg CO2 eqv.]
Year No Measures Measures Add Measures
2000 6324 5389 5389
2005 6781 5177 4919
2010 9370 8682 8248
2015 12196 11111 9947
2020 15269 13359 12069
Fig.5.11. Total emissions from Agriculture [Gg CO2 eqv.]
CO2-eqv. - AGR
2000
4000
6000
8000
10000
12000
14000
16000
1988 1990 1992 1994 1996 1998 2000 2002 2004 2006 2008 2010 2012 2014 2016 2018 2020
No M
M
Add M
Gg
The projections of the two scenarios “with measures” and “with additional measures” were prepared with the participation of the National Centre for Agricultural Sciences (NCAS) atMAF. They take into account the views for the development of livestock breeding and plant growing, recognizing all development programs, drafted and applied until the end of 2005.
The comparison of the scenario “with measures” to the scenario “without measures” indicates a stable downward tendency of the emission reduction when measures are applied within the range of 9-22%.
The projected emissions of N2O have not different characteristics compared to the CH4
emissions. Expected reduction is lower (within the range of 13-15%). The overall trend of the emissions from the sector is closer to the trend of N2O emissions. It is stable over the entire period of 2000-2020 and keeps range of 6-16%.
Fourth National Communication on Climate Change75
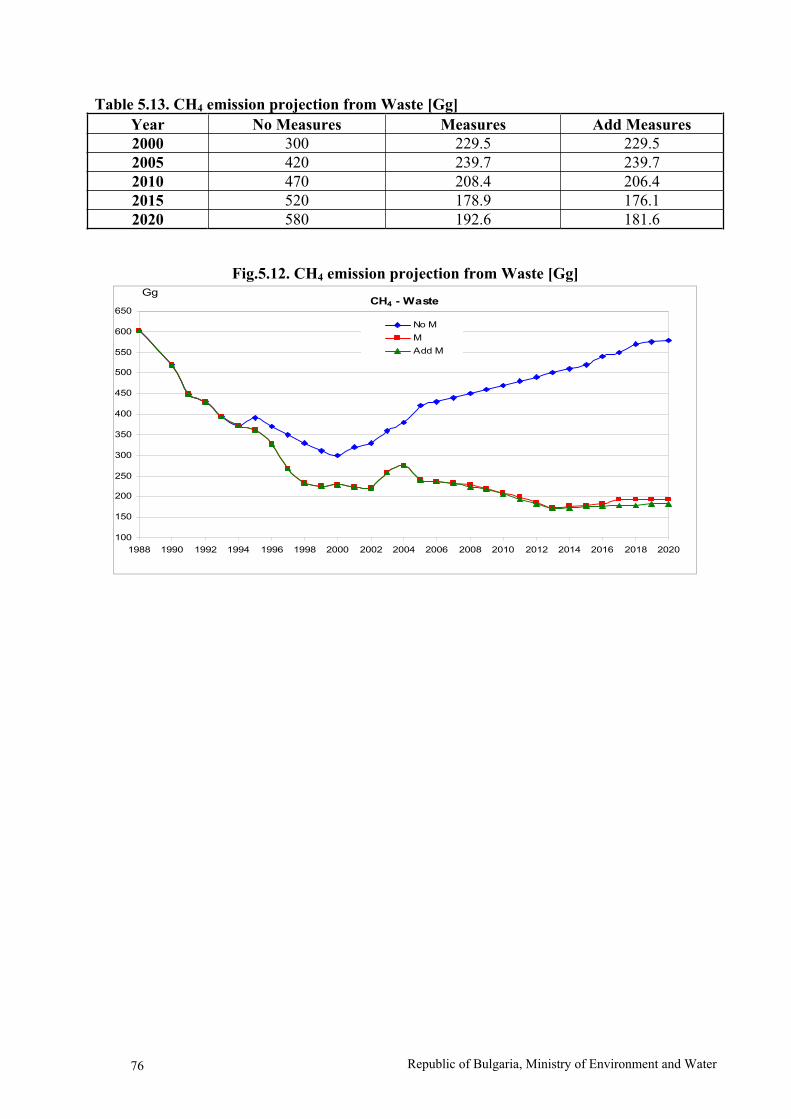
Table 5.13. CH4 emission projection from Waste [Gg]
Year No Measures Measures Add Measures
2000 300 229.5 229.5
2005 420 239.7 239.7
2010 470 208.4 206.4
2015 520 178.9 176.1
2020 580 192.6 181.6
Fig.5.12. CH4 emission projection from Waste [Gg]
CH4 - Waste
100
150
200
250
300
350
400
450
500
550
600
650
1988 1990 1992 1994 1996 1998 2000 2002 2004 2006 2008 2010 2012 2014 2016 2018 2020
No M
M
Add M
Gg
Republic of Bulgaria, Ministry of Environment and Water76
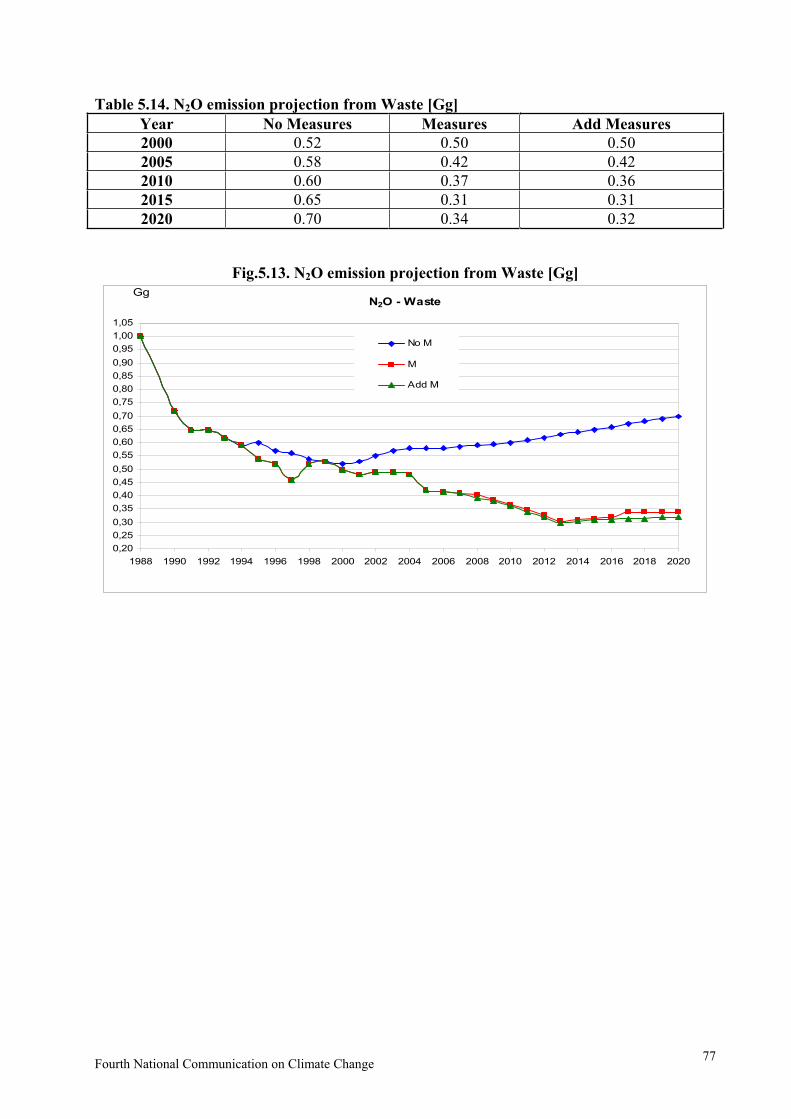
Table 5.14. N2O emission projection from Waste [Gg]
Year No Measures Measures Add Measures
2000 0.52 0.50 0.50
2005 0.58 0.42 0.42
2010 0.60 0.37 0.36
2015 0.65 0.31 0.31
2020 0.70 0.34 0.32
Fig.5.13. N2O emission projection from Waste [Gg]
N2O - Waste
0,20
0,25
0,30
0,35
0,40
0,45
0,50
0,55
0,60
0,65
0,70
0,75
0,80
0,85
0,90
0,95
1,00
1,05
1988 1990 1992 1994 1996 1998 2000 2002 2004 2006 2008 2010 2012 2014 2016 2018 2020
No M
M
Add M
Gg
Fourth National Communication on Climate Change77
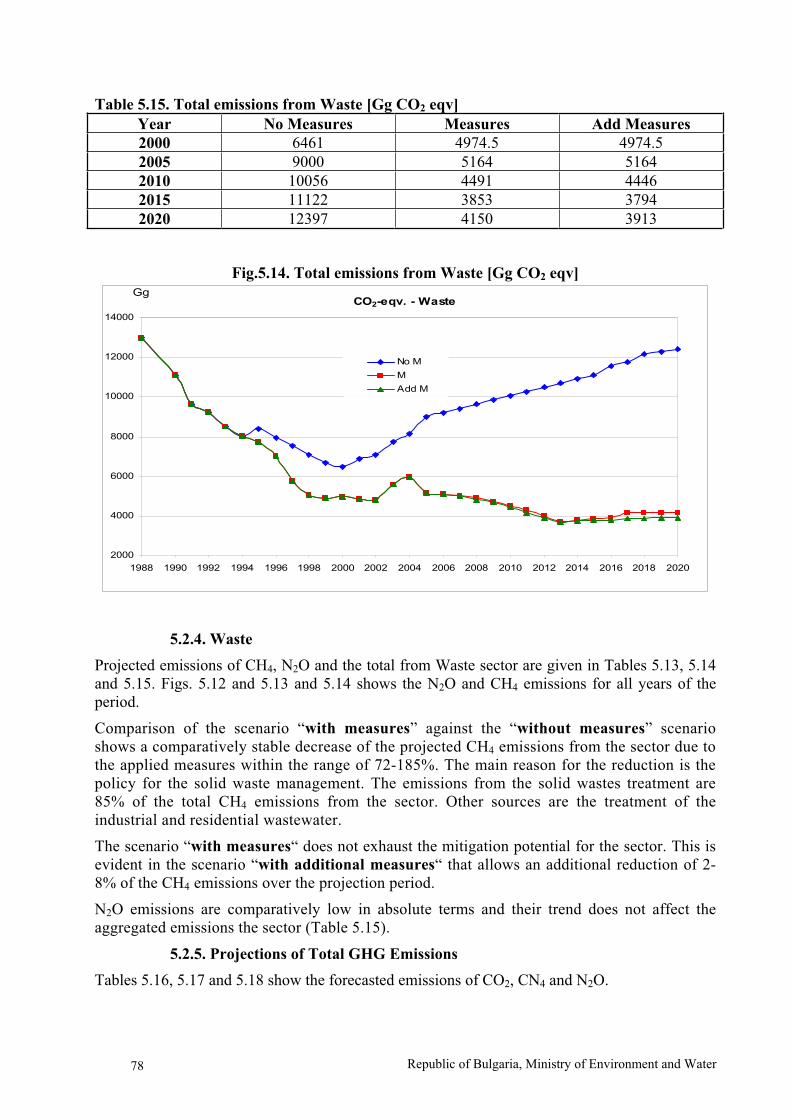
Table 5.15. Total emissions from Waste [Gg CO2 eqv]
Year No Measures Measures Add Measures
2000 6461 4974.5 4974.5
2005 9000 5164 5164
2010 10056 4491 4446
2015 11122 3853 3794
2020 12397 4150 3913
Fig.5.14. Total emissions from Waste [Gg CO2 eqv]
CO2-eqv. - Waste
2000
4000
6000
8000
10000
12000
14000
1988 1990 1992 1994 1996 1998 2000 2002 2004 2006 2008 2010 2012 2014 2016 2018 2020
No M
M
Add M
Gg
5.2.4. Waste
Projected emissions of CH4, N2O and the total from Waste sector are given in Tables 5.13, 5.14 and 5.15. Figs. 5.12 and 5.13 and 5.14 shows the N2O and CH4 emissions for all years of theperiod.
Comparison of the scenario “with measures” against the “without measures” scenario shows a comparatively stable decrease of the projected CH4 emissions from the sector due tothe applied measures within the range of 72-185%. The main reason for the reduction is thepolicy for the solid waste management. The emissions from the solid wastes treatment are85% of the total CH4 emissions from the sector. Other sources are the treatment of the industrial and residential wastewater.
The scenario “with measures“ does not exhaust the mitigation potential for the sector. This isevident in the scenario “with additional measures“ that allows an additional reduction of 2-8% of the CH4 emissions over the projection period.
N2O emissions are comparatively low in absolute terms and their trend does not affect theaggregated emissions the sector (Table 5.15).
5.2.5. Projections of Total GHG Emissions
Tables 5.16, 5.17 and 5.18 show the forecasted emissions of CO2, CN4 and N2O.
Republic of Bulgaria, Ministry of Environment and Water78

Comparison of the total CO2 emissions in the scenarios “with measures“ and “without
measures” indicates a steady decrease in the range of 9-26% in the forecast period after year 2005.
Comparison of the “with additional measures” scenario with the “with measures” one reflects the measures in the energy sector described above. As a result, CO2 emissionreduction is in the range 8-12%, with the peak expected in the period 2006-2010.
Analysis of the change of the forecast CH4 emissions shows high trend in the emissionreduction in the “with measures” scenario compared to “without measures” one. The expected reduction during the forecast period is 49-98%.
Comparison of “with additional measures” scenario with “with measures” one shows reduction of CH4 emissions in the range 5-10%. It has to be mentioned that in the total CH4
emissions are included the emissions resulting from leakage in the systems for transportation of oil and natural gas. The forecast for that type of emissions is the same in all three scenarios – it isaccepted that the amount 30-40 Gg will be valid for the period after year 2005. This amountleads to some differences between the percentage decrease in CH4 emissions from the various sectors and the total CH4 emissions.
Comparison of the forecasted emissions of N2O in “with measures” scenario compared to the “without measures” one reveals a decrease in emissions during the forecasted period in the range 40-42%. The decrease value is higher at the start of the period – after 2005. The reason for this is the stronger decrease in the agriculture sector, which has the major share inthese emissions.
In the total amount of N2O emissions is included the emissions forecast from leakage of oil and natural gas during transit transportation.
Comparison of forecast N2O emissions for “with additional measures” scenario to “with
measures” scenario shows a relatively small decrease in the range of 9-10%.
5.2.6. Aggregated GHG Emissions
The forecasted aggregated emissions for the three scenarios reflect the described sectoralmeasures for abatement of emissions and GHG reduction. They are shown in terms of CO2
equivalent given in Table 5.19 and Fig. 5.18. Comparison of “without measures” and “with
measures” scenarios shows an emission decrease in the range of 22-32%, which takes place in the period 2005-2020.
Comparison of “with addition measures” and “with measures” scenarios reveals too certain tendency for decrease of emissions in the period 2005-2020, but in smaller range: 5-13%.
Fourth National Communication on Climate Change79
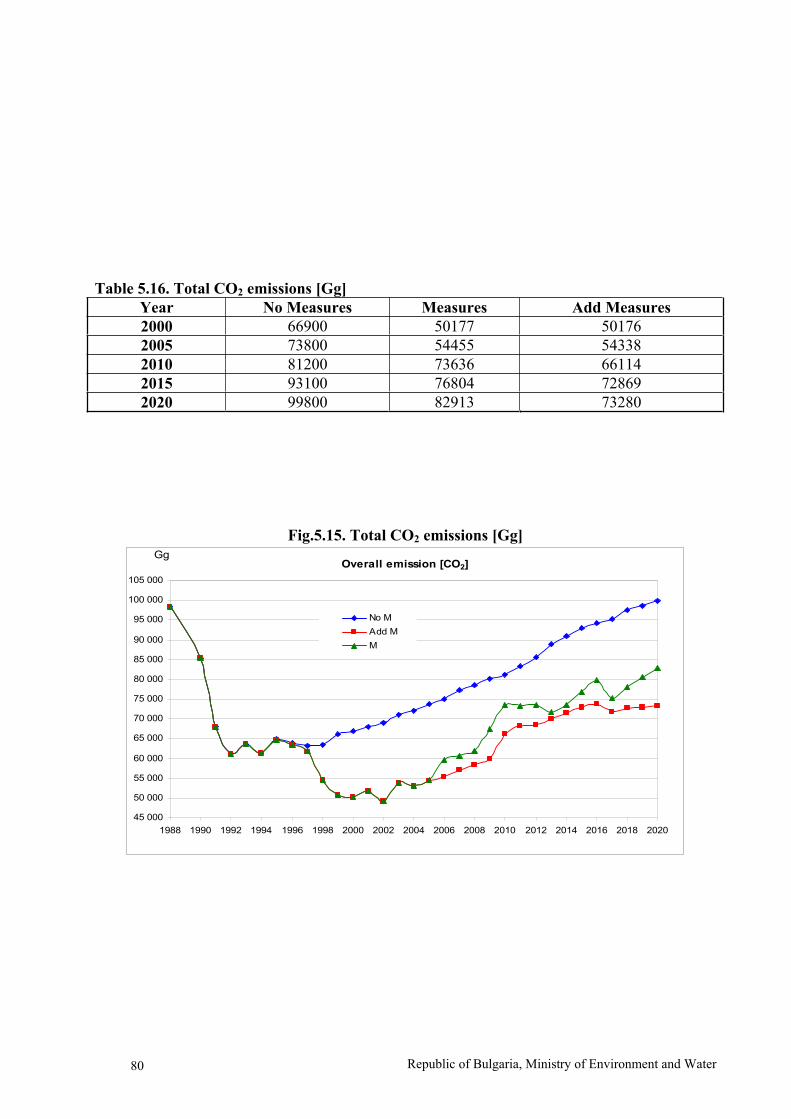
Table 5.16. Total CO2 emissions [Gg]
Year No Measures Measures Add Measures
2000 66900 50177 50176
2005 73800 54455 54338
2010 81200 73636 66114
2015 93100 76804 72869
2020 99800 82913 73280
Fig.5.15. Total CO2 emissions [Gg]
Overall emission [CO2]
45 000
50 000
55 000
60 000
65 000
70 000
75 000
80 000
85 000
90 000
95 000
100 000
105 000
1988 1990 1992 1994 1996 1998 2000 2002 2004 2006 2008 2010 2012 2014 2016 2018 2020
No M
Add M
M
Gg
Republic of Bulgaria, Ministry of Environment and Water80
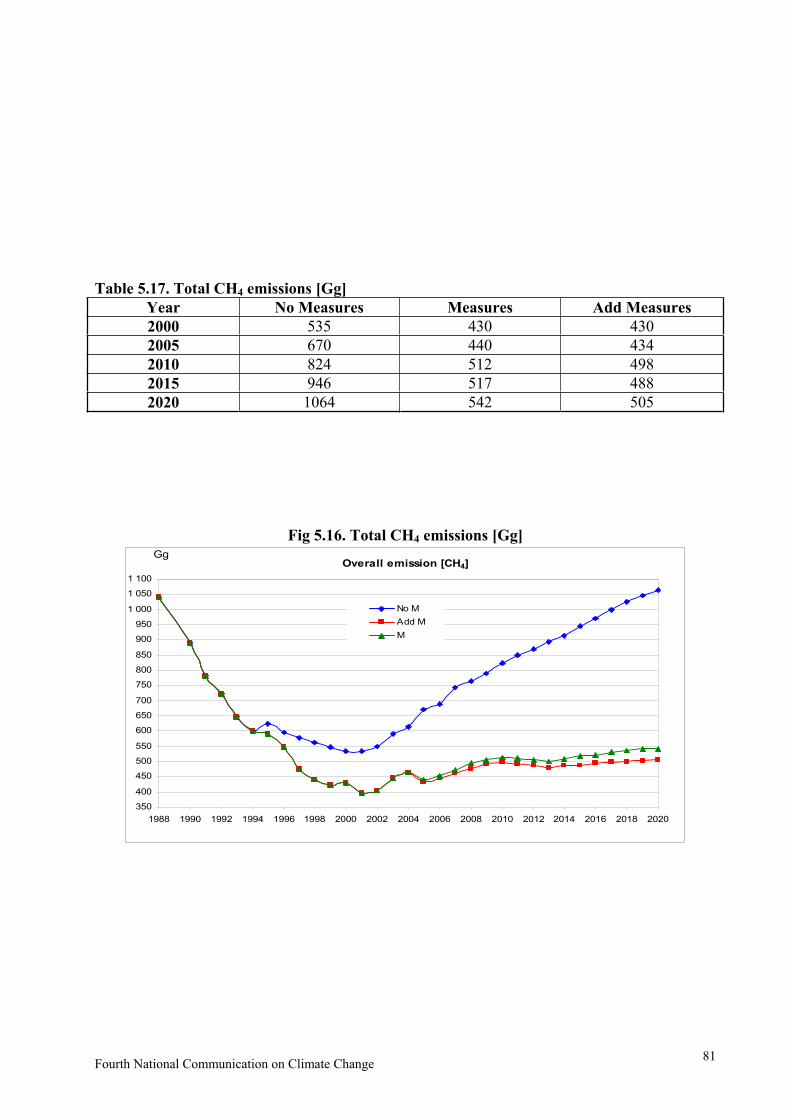
Table 5.17. Total CH4 emissions [Gg]
Year No Measures Measures Add Measures
2000 535 430 430
2005 670 440 434
2010 824 512 498
2015 946 517 488
2020 1064 542 505
Fig 5.16. Total CH4 emissions [Gg]
Overall emission [CH4]
350
400
450
500
550
600
650
700
750
800
850
900
950
1 000
1 050
1 100
1988 1990 1992 1994 1996 1998 2000 2002 2004 2006 2008 2010 2012 2014 2016 2018 2020
No M
Add M
M
Gg
Fourth National Communication on Climate Change81

Table 5.18. Total N2O emissions [Gg]
Year No Measures Measures Add Measures
2000 21 16 16
2005 24 14 13
2010 28 20 19
2015 35 27 24
2020 44 33 30
Fig.5.17. Total N2O emissions [Gg]
Overall emission [N2O]
1012
1416
1820
2224
2628
3032
3436
3840
4244
46
1988 1990 1992 1994 1996 1998 2000 2002 2004 2006 2008 2010 2012 2014 2016 2018 2020
No M
Add M
M
Gg
Table 5.19. Aggregated GHG Emissions, CO2-eqv]
Year No Measures Measures Add Measures
2000 84696 64236 64235
2005 95174 68268 67875
2010 107159 90981 82809
2015 123948 96344 91034
2020 135636 105048 93635
Av. 2008-12 107646 87089 80702
First Commitment Period
During the First Commitment Period 2008-2012, the expected yearly average amount of the total aggregated emissions is believed to be under the foreseen 8% reduction of the base year 1988 total amount of emissions (see Table 5.20).
Analysis of the projected emissions in Bulgaria during the 1st commitment period 2008-2012 shows that even if the without measures scenario would have happen (if there were no certain measures taken already for rapid increase of the efficiency of the economy in Bulgaria) thecountry would be able to fulfil its obligation as during the period, the emissions would have been by 12% below the Kyoto target. This is due to the already undertaken transition from centrally planed to the market economy and the restructuring that are guarantee that the country meets the commitment even without specific measures.. In addition, due to the implemented climate
Republic of Bulgaria, Ministry of Environment and Water82

change policies and measures a significant potential for emission trading appears. For the “withmeasures” scenario, this potential is estimated at over 34 million tons of CO2 equivalent on yearly basis. Should additional measures be implemented, the emission trading potential would reach about 41 million tons.
Fig.5.18. Aggregated GHG Emissions, CO2-eqv
Overall emission [CO2-eqv.]
55 00060 00065 00070 00075 00080 00085 00090 00095 000
100 000105 000110 000115 000120 000125 000130 000135 000140 000
1988 1990 1992 1994 1996 1998 2000 2002 2004 2006 2008 2010 2012 2014 2016 2018 2020
No M
Add M
M
Gg
There is even a bigger potential for emissions reduction in Bulgaria, however it cannot be realized due to lack of investments. Yet the carrying out of Joint Implementation projects in the field of energy efficiency in the industry and building sectors, or projects for developing thenatural gas household network would eventually lead to additional emission reduction in theamount of 10-15 million tons CO2-equivalent.
Table 5.20. Overall GHG emissions over the First Kyoto commitment period [Gg]
Years Scenarios
No measures With measures With additional measures
2008 102728 78372 71705
2009 105073 84072 76217
2010 107159 90981 82809
2011 110175 90878 85022
2012 113095 91140 85281
Average (2008-2012) 107646 87089 80207
Kyoto target (average) 121 716
5.2.7. Projections of the Forest Sink Capacity until 2035
Forest ecosystems absorb CO2 and thus influence the carbon budget. Inventory results forBulgarian forests indicate that the forest off-set potential amounted to 5-7% from the total CO2
emissions. Pursuant to the Forestry Act articles (1997), two scenarios for the forest sink capacity have been developed. The following assumptions are laid down in the two scenarios: optimisticand pessimistic.
Optimistic scenario: According to this scenario, a significant biomass accumulation is projected which means that carbon stored will increase up to 16 million t in 2035. Actually, the carbon stored could be expected to be more, if the planned/actual cut ratio remains the same.
Fourth National Communication on Climate Change83

Pessimistic scenario: According to this scenario the balance is negative, reaching the highestrate of decrease in 2015, but during the next 5 years the trend reaches almost zero values. The decrease of carbon accumulation could be projected to be small. In 2015, approximately 70 million m3 of wood biomass from the coppice and from low-stem forests above 41 years old are tobe harvested.
Pessimistic scenario realization (in the part for 70 million m3 coppice harvest) two positive results should be achieved: 1) improvement of the status (common) of the wood stands and 2) supplement of enormous quantities of renewable energy sources.
5.3. Methodology
As the inventory results indicate, the most significant contributors to GHG emissions in Bulgaria are the energy production sector and the energy-intensive sectors of the national economy.Therefore, the main efforts in the GHG emission forecasting are directed towards these sectors, while the studies that address non-energy sectors are more limited.
The GHG projections have two main targets:
To identify whether Bulgaria will be able to meet its obligations to the UN FCCC and the Kyoto Protocol.
To identify the most efficient policies and measures at macroeconomic, sectoral, utility,enterprise and household level that may lead to GHG emission reduction.
In order to meet these targets, a methodology that allows scrutinizing the interrelationshipsbetween macroeconomic development, sectoral development (including the energy sector),and GHG emissions is used. The main software used is the ENPEP package that has beenused in the 2nd and 3rd National Communications of Bulgaria for the purposes of projectingGHG emissions. The following program modules of ENPEP were used: MACRO, DEMAND,BALANCE, WASP and IMPACTS.
The macroeconomic forecasts, including GDP and population growth, were provided by theBulgarian Agency for Economic Analysis and Forecasts within the Ministry of Finance. The macroeconomic data are key inputs to the MACRO module. The DEMAND module estimatesthe useful and final energy demand by sector, including households, industry, services and transport.
The BALANCE module is a non-linear equilibrium model that matches the demand for energy with available resources and technologies. The purpose of the BALANCE module is todetermine the equilibrium of the supply/demand balance for the study period. Its basic part is the energy network.
The general assumptions used are that the energy network is presented as a combination of sectoral and level presentation of data. The network is simplified as to represent only some of the sectors and some of the levels in a detailed way. Other information is generalized in a way tokeep the total energy flows in the energy system and related emissions.
The WASP model (Vienna Automatic System Planning Package) is used to determine the least-cost generating system expansion, which adequately meets the demand for electrical power, subject to a number of user-defined constraints. The present value of total system costs,including the capital cost of new generating units, fixed and variable operation and maintenance(O&M) costs, fuel costs, and costs of undelivered energy, is used to measure the economicperformance of alternative expansion plans.
The IMPACTS module of ENPEP calculates the residuals (air pollutants, water pollutants, solid
Republic of Bulgaria, Ministry of Environment and Water84

waste, and land use) of the energy system. It takes the energy system design from BALANCE and WASP, and calculates the residuals based on fuel consumption and any environmental control technologies in use.
5.3.1. Specific Assumptions Related to the with Measures Scenario for GHG
Emissions
Generally macroeconomic indicators determine the share of energy demand, which serves as driving force of economy development. For the current study a moderate projections are applied. The major economic factors influencing the development of the energy sector are:
Restructuring of economy and increased share of private sector.
Access to the markets of EU and Balkan countries.
Closure of non-effective plants with high energy intensity, bad economic indicators or lack of markets.
Decreasing share of heavy industry in the national economy.
Increased share of production and services with low energy intensity.
Technological progress and high technological development.
Improved management and liberalization of energy prices.
Energy efficiency policy at supply and demand side.
Table 5.21. Final energy consumption – PJ
Sectors 2000 2005 2010 2015 2020
Industry 144.5 147.4 147.2 151.9 157.3
Transportation 77.0 98.9 139.5 159.6 169.5
Residential 91.7 94.1 95.0 102.3 127.5
Others 40.0 45.2 55.7 64.1 72.2
Total 353.2 385.6 437.4 477.8 526.5
Table 5.22. Forecast of structure energy demand by sectors, %
Sector 2000 2005 2010 2015 2020
Industry 40.9 38.2 33.7 31.8 29.9
Transport 21.8 25.6 31.9 33.4 32.2
Residential 26 24.4 21.7 21.4 24.2
Others 11.3 11.7 12.7 13.4
Total 100.0 100.0 100.0 100.0 100.0
13.7
The ENPEP modelling suite uses three sets of key inputs to produce the energy demandforecasts: the level and structure of GDP; total population; and the level and structure of final energy consumption.
a)For GDP in the base year, the information was provided by the Bulgarian National StatisticalInstitute (National Statistical Reference 2004) and the Bulgarian Agency for Economic Analyse and Forecasts.
Expected average annual GDP growth rates are as follows:
2001-2005 – 4.9%
2006-2010 – 5.6%
2011-2015 – 5.3%
2016-2020 – 5.0%
The sectoral structure of GDP assumes the restructuring tendencies to match the development of the sectors in the western countries, which means a slight decrease of the shares of industry, agriculture and forestry and increased share of services and transportation.
Fourth National Communication on Climate Change85
b)The second set of key inputs was the population in 2005 (7.67 million) and its growth rate. Inline with the official projections of the Bulgarian Academy of Sciences, the population growth rate was assumed to decline by 3.9% between 2005 and 2010 and 6.8% between 2010 and 2020. Consequently, total population drops to about 6.9 million by 2020. By implication, per capita
GDP more than doubles over the entire planning horizon.
c) The third set of key inputs describes the level and structure of energy demand.
The final energy demand forecast envisages two models of development: max and min, matchingoptimistic and pessimistic expectations for the energy intensity in the country. The expected energy demand according to the max scenario (that has become the basis for “with measures” scenario inthe present National Communication) is 353.2 PJ in 2000, 385.5 PJ in 2005, 437.4 PJ in 2010 and 526.5 PJ in 2020.
The forecast final energy demand and its structure are shown in Tables 5.21 and 5.22, respectively.
The energy intensity of the GDP in Bulgaria is higher compared to the developed countries. Increasing energy efficiency is one of the basic objectives for the future development of the energy sector; expected to be achieved mainly by implementing the following structural changes in the national economy:
Decrease in the share of the heavy industry in the GDP.
Faster development of the service sector (including transport).
Moderate development of the agricultural sector.
Decrease of the energy intensity of the GDP is also expected as follows:
Table 5.23 Energy intensity of GDP
Year Toe/1000Euro TJ/1000BGN
2000 180.0 3.8
2005 160.0 3.4
2010 132.0 2.8
2015 111.0 2.4
2020 93.0 2.0
5.4. Sectoral Analysis of the GHG Emission Projections
The GHG projections on sectoral level are based on the data that is used in emission calculations for each sector of the economy.
To project CO2 and other GHG emissions for all scenarios, the emission factors from the GHGinventory have been used and the following activities have been considered:
For GHG from energy combustion – projections on the quantities of fuels consumed in different sectors of economy and fuels for energy transformation.
For GHG from coal mining, oil and gas systems – projections on the quantities of coalmined in underground and open cast mines as well as quantities of oil and gas production, transportation, distribution and refining.
For GHG from industrial processes – projections on the quantities of produced cement, lime,ammonia, soda ash, glass, steel and others.
Due to the change in ownership in agricultural lands as well as to the expected change inagricultural practice and structure, it is very difficult to project emissions originating fromagriculture. Thus GHG emissions from agriculture are projected under 2 scenarios: without
Republic of Bulgaria, Ministry of Environment and Water86
measures for energy savings and in case of limited penetration of such measures, particularly in livestock breeding.
The projections on the CO2 sequestration potential of forests is based on the new Forestry Act(as given in the previous section) where there is rule set the increments to exceed the wood quantities used for construction and combustion.
There is a projection for the emissions from diesel and gasoline combusted by the transit road transport.
The fugitive emissions in gas transportation are projected in accordance with the plans fordevelopment of the gas transmission network and expected transit of natural gas. Theprojected figures for natural gas transits are: 6.3 billion Nm3 after 2000, and 18 billion Nm3 in each year of the 2005-2020 period.
The total GHG emissions are calculated as a sum of all emissions. LUCF is not included in thetotals.
Table 5.24. Primary energy consumption – “with measures” scenario [PJ]
Source 2000 2005 2010 2015 2020
Coal 282.2 364.74 354.27 333.33 352.18
Natural gas 176.72 99.25 98.41 134.00 165.83
Liquid oil 122.70 162.90 194.3 197.65 201.42
Nuclear 206.03 207.70 159.55 274.71 298.16
RES 33.04 48.99 45.23 55.28 68.68
Total 821.2 883.6 851.8 995.0 1086.3
Table 5.25. Primary energy consumption – “with additional measures” scenario [PJ]
Source 2000 2005 2010 2015 2020
Coal 282.75 364.74 332.08 342.13 299.41
Natural gas 176.72 99.25 84.17 120.60 134.00
Liquid oil 122.70 162.90 175.46 175.04 179.65
Nuclear 206.03 207.70 149.50 153.27 223.20
RES 33.04 71.19 79.56 54.86 67.00
Total 821.2 905.8 820.8 845.9 903.3
Fourth National Communication on Climate Change87

Republic of Bulgaria, Ministry of Environment and Water88

6 VULNERABILITY ASSESSMENT, CLIMATE CHANGE INFLUENCE
AND ADAPTATION MEASURES
6.1. Background
Bulgaria is located on the Balkan Peninsula in south-eastern Europe. The country includes 31% low-lands (0–200 m), 41% hills (200–600 m), 25% high-lands (600–1,600 m), and 3% mountains(>1,600 m). The annual mean air temperatures in Bulgaria vary from -3.0 to 14.0 C, depending on the location and elevation. Air temperature normally reaches minimum in January and maximumin July. The monthly mean temperature varies from -10.9 to 3.2 C in January and from 5.0 to 25.0 C in July. Total precipitation depends on the circulation patterns, site elevation, and the specificity of local orographic features. Annual mean total precipitation is approximately 500–650 mm, with variation ranging from 440 to 1,020 mm. The highest monthly values are measured in June, and atsome places in May, with the mean total varying between 55 and 85 mm. February, andsometimes March and September, are the driest months, with mean totals varying between 30 and 45 mm. Mean precipitation during the warm months, e.g. April through September, is 333 mm, with a standard deviation of 72 mm. Mean precipitation varies from a maximum of 573 mm in the Balkan Mountain to a minimum of 211 mm in south-eastern Bulgaria
Warming is observed from the middle of 1980s. The years 1994 and 2000 were among thewarmest years on record in Bulgaria. In general there was not a significant warming trend during the last century in Bulgaria despite of the slight increase of average air temperature during the last two decades (Fig.6.1b). The linear trend for the 20th century varies within the interval from0.2° to 0.5°C, which is lower than the diagnostic established by IPCC for the whole planet:
0.6 0.2°C. It confirms that the regional variations and trends can be different from the global ones. 1
1900 1920 1940 1960 1980 2000Year
-2.0
-1.0
0.0
1.0
2.0
Air
tem
per
ature
anom
alie
s (o
C)
observed
linear trend
5-year run. av.
a)
mean = 11.6 oCtrend = +1.0 oC/century
1900 1920 1940 1960 1980 2000Year
-2.0
-1.0
0.0
1.0
2.0
Air
te
mp
erat
ure
anom
alie
s(o
C)
b)
mean = 11.9 oCtrend = +0.4 oC/century
Figure. 6.1. Anomalies of annual average air temperature before (a) and after (b) homogenization in Pleven (north Bulgaria), relative to 1901-2000
1 Alexandrov, V., M. Schneider, E. Koleva and J-M. Moisselin, 2004. Climate Variability and Change in Bulgariaduring the 20th Century. Theoretical and Applied Climatology 79(3-4): 133-149.
Fourth National Communication on Climate Change89

Spring average air temperature did not show any significant changes during the 20th century. Thetemperature anomalies varied above and below the norms for the period 1901-2000 (Fig. 6.2). All weather stations have a slight positive trend during the both periods 1901-2000 and 1931-2000. Summer in Bulgaria is tending to be warmer from the beginning of the 1980s (Fig. 4.8b). Mainly positive anomalies were observed in the country during the last decade of the 20th
century. The spatial distribution of the summer trend estimated by the Spearman coefficientindicated that the Danube plain was affected for the period 1901-2000 by slight cooling in the stations located in the this area. For the period 1931-2000 this insignificant cooling in summerwas observed also in central and south Bulgaria. Regarding air temperature during the autumnseason – there has been a significant decreasing trend in average air temperature since the 1930s. Average air temperature in winter shows a positive trend – winters during the second half of the century are definitely milder than before (Fig. 6.2d). There is a significant trend of an airtemperature increase during the winter season in the northern Danubian weather stations during the two considered periods 1901-2000 and 1931-2000.
1900 1920 1940 1960 1980 2000Year
-3.0
-2.0
-1.0
0.0
1.0
2.0
3.0
Air
te
mp
erat
ure
ano
mal
ies
(oC
)
observed
linear trend
5-year run. av.
a)
mean = 10.5 oCtrend = +0.2 oC/century
1900 1920 1940 1960 1980 2000Year
-2.0
-1.0
0.0
1.0
2.0A
ir
tem
per
atu
re a
no
mal
ies
(oC
)b)
mean = 21.9 oCtrend = +0.4 oC/century
1900 1920 1940 1960 1980 2000Year
-3.0
-2.0
-1.0
0.0
1.0
2.0
3.0
Air
te
mp
erat
ure
ano
mal
ies
(oC
)
c)
mean = 11.2 oCtrend = -0.3 oC/century
1900 1920 1940 1960 1980 2000Year
-6.0
-4.0
-2.0
0.0
2.0
4.0
Air
te
mp
erat
ure
ano
mal
ies
(oC
)
d)
mean = 0.2 oCtrend = +1.5 oC/century
Republic of Bulgaria, Ministry of Environment and Water90

Figure. 6.2. Anomalies of spring (a), summer (b), autumn (c) and winter (d) average air temperature in Gabrovo (a: north Bulgaria), Burgas (b: east Bulgaria), Kazanlak (c: central Bulgaria) and Lom (d: northwest Bulgaria), relative to 1901-2000 2
Similarly to average air temperature, a significant cooling period appeared for annual minimumair temperature in the country from 1901 till the beginning of the second decade of the previouscentury. The next cold period occurred in the 1940s. An increase in minimum air temperaturewas observed in the 1950s, 1960 and the 1970s. There were insignificant anomalies above and below the average in the 1980s. The 1990s were characterised by significant positive anomalies,which in some years and stations range from 1.0° to 1.5°C. The last years of the 20th century were among the years with the highest minimum air temperature. The linear trend for the 20th
century varies within the interval from 0.6° to 0.8°C. There was a significant increase in annual minimum air temperature across Bulgaria during the last century (Fig. 6.3). Warming is lower insouth Bulgaria and higher in north Bulgaria3.
a) b)
Figure 6.3. Spatial distribution of the trend in annual minimum (a) and maximum (b) airtemperature (1901-2000) in Bulgaria by applying the coefficient of Spearman at probability level of 95%; - significant increasing trend; - increasing trend
Spring minimum air temperature also shows significant changes during the 20th century in the weather stations located in north Bulgaria, central Bulgaria and south Bulgaria. Positive but notsignificant trends are observed mainly in east Bulgaria. The highest warming in the terms of seasonal minimum air temperature is observed in summer. All weather stations covering temperature records the 20th century show a significant increasing trend during the summer season in Bulgaria. For example, the linear trend for the summer season in station Sadovo (south Bulgaria) is 1.4 oC/century. Most of the temperature anomalies in this station were positive during the second half of the 20th century. The minimum temperature anomalies during the autumn season varied above and below the average for the period 1901-2000 without showing any significant climate signal. Nevertheless, the insignificant positive trend is observed in mostof the weather stations. Winter in Bulgaria is tending to be warmer at the end of the last century,
2 See 1.
3 Alexandrov, V., 2003. Homogenization of Climate Long-term Series in Bulgaria. Report to Meteo-France, 41 pp
Fourth National Communication on Climate Change91

the spatial distribution of the winter trend in minimum air temperature indicated that only two weather stations are characterized by a significant increasing trend.
Homogenized annual maximum air temperature shows a lower increasing trend during the previous century in the country. In fact, there were not significant variations of annual maximumair temperature beyond the last decade, where mainly positive anomalies are observed. That is why, the linear trend of annual maximum air temperature for the 20th century varies within theinterval from 0.4° to 0.6°C. The increase of annual maximum air temperature is higher in northwest Bulgaria and southeast Bulgaria than in south Bulgaria and northeast Bulgaria. Sincethe cooling spell in the 1950s a steady increase in spring maximum air temperature has been observed. Almost all weather stations considered in the study present an insignificant increasingtrend in spring maximum air temperature in Bulgaria during the 20th century. There was a significant period of summer cooling in north Bulgaria during the 1960s, 1970s and the beginning of the 1980s in respect to maximum air temperature. However, since then a significant increasing trend in summer maximum air temperature has been observed. Regarding the autumn maximum air temperature – mainly insignificant increasing trends are spread across the country. Insignificant decreasing trends can be also identified in weather stations from east Bulgaria in respect of maximum air temperature during the autumn season. Finally, an increase to winter maximum air temperature is observed during the last century in the country.
The observed warming in Bulgaria continued at the beginning of the 21st century. So far 2002 is the third warmest year for the last 15 years while 2004 was the seventh in a row after 1997 with temperatures higher than the annual average air temperatures (Figure 6.4). Despite the fact that the annual average air temperatures in Bulgaria in 2005 were about ( 0.2°C) the climatic values,the observed slight warming since the beginning of the 1980-ies continued in some areas of the country in 2005. For example, in Dobrudja, annual average air temperatures were at average with 0.3°C higher than the climatic (1961-1990) norms (NIMH-BAS).
2001 2002 2003 2004Ãî äèí à
-1
-0.5
0
0.5
1
Àíî
ìà
ëè
èè (
î Ñ)
Ñåâåðí à Áúëãàðèÿ
Þ æí à Áúëãàðèÿ
Year
North Bulgaria
South Bulgaria
Anom
alie
s,(
C
Figure.6.4. Anomalies (2001-2004) of annual average air temperatures in north Bulgaria and southBulgaria relative to the climatic norms (1961-1990) (source: NIMH-BAS)
Republic of Bulgaria, Ministry of Environment and Water92

Annual precipitation in Bulgaria varied considerably from year to year during the 20th century. Insome years, very low annual precipitation caused droughts of different intensities. The countryhas experienced several drought episodes during the 20th century, most notably in the 1940s and 1980s (Fig. 6.5). The drought spells in the 1940s and 1980s were observed everywhere across the country. Drought in Bulgaria was most severe in 1945 and especially year 2000 with precipitation 30% less than the current climatic values. In some weather stations a significant wetspell occurred in the 1950s. It was followed also by relatively high precipitation values in the 1960s and 1970s. Generally, the variations of annual precipitation in Bulgaria showed an overall decrease (Fig. 6.5b).
1900 1920 1940 1960 1980 2000Year
-40
-20
0
20
40
60
80
Pre
cip
itat
ion
an
om
alie
s (%
)
a)
mean = 532 mmtrend = -1.6 %/century
observed
5-year run. av.
linear trend
1900 1920 1940 1960 1980 2000Year
-40
-20
0
20
40
60
80
Pre
cipit
atio
n a
nom
alie
s (%
)
b)
mean = 560 mmtrend = -10.1 %/century
Figure 6.5. Anomalies of annual precipitation before (a) and after (b) homogenization in station Yambol (south Bulgaria), relative to the period 1901-20004
Negative precipitation trends are observed mainly in the eastern and western parts of the country, while positive trend occurs in some central and northwest areas. However, it should be pointed out that the obtained trends in annual precipitation in Bulgaria for the period 1901-2000 are insignificant at the 95% probability level.
Sunshine duration - all weather stations covering the period 1931-2000 indicate a decreasing trend. Negative trends are also observed for spring and especially summer sunshine duration, where even some of the weather stations are characterized by a significant decreasing trend. Only positive trends are located for the winter season. No significant changes are seen in variability and trend of autumn sunshine duration.
6.2. Climate Change Scenarios
6.2.1. Climate Scenarios for 2015
HadCM3 A2 climate scenarios for four regions in Bulgaria (north Bulgaria, east Bulgaria,Thrace Low-down and south-west Bulgaria) for 2015 are presented in Table 6.1. The rise of the annual average air temperature for 2015, relative to the climatic norms of present climate (1961-1990) is expected to be from 0.7° (in east Bulgaria) and 1.1°C (in the other Bulgarian regions). The warming within a year is, however, different for different seasons and months. Warming ismost likely to be bigger during summer months (July, August and September), while for the cold
4 See 1.
Fourth National Communication on Climate Change93

half-year it will be less. Even the HadCM3 model simulates lower monthly temperatures(relative to the climatic norms) for November: -2°C in southwest Bulgaria and north Bulgaria and -0.6°C in east Bulgaria. Temperatures may not rise in February in east Bulgaria until 2015 and summer months are most likely not to be that hot as in the other regions in the country.
Despite the complexity of the simulation of future precipitation and the specifics of thishydrometeorological element, bellow follows the possible HadCM3 A2 scenario : Precipitation during some months (for example May, July and September) during the warm half-year are expected to be reduced by 30% relative to the present (1961-1990) climatic norms. This will increase the risk of drought – increased frequency, intensity and degree of impact. This mightsound frivolously for the period 2005/2006 when Bulgaria experienced several floods due to big and intensive rainfalls. However, it is considered that after such relatively wet period, a relativelydrought one follows. This statement is proved by the analysis of the available hydrometeorological information since the end of the 19th century until 2004. Drought was and will be part of the climatic cycle of the Balkan Peninsula, Bulgaria included. During the colderhalf-year, the decreased precipitation in the country is lower (Table 6.1) as calculated by HadCM3 A2. Even in south-west Bulgaria an insignificant increase in the monthly precipitationquantities for December, March and in particular – November (by 20%) is projected. Low but positive are the percentages of change for the precipitation for March and November for the Thrace Low-down.
Table 6.1. Change in the average monthly air temperature (°C) and monthly precipitation
(in %) for 2015 in certain regions of Bulgaria relative to the climatic norms for the period
of the present climate (1961-1990); HadCM3 A2 climatic scenarios.
North Bulgaria East Bulgaria Thrace Low-down Southwest Bulgaria
Month Rate(oC)
precipitation(%)
Rate(oC)
precipitation (%)
Rate(oC)
precipitation (%)
Rate(oC)
precipitation (%)
I 1.4 -9 1.2 -22 1.2 -8 0.8 -11
II 0.2 -6 -0.1 -17 0.3 -9 0.0 -8
III 1.0 2 0.3 -12 1.1 5 1.2 2
IV 0.7 -5 0.2 -11 1.1 -11 1.2 -4
V 1.0 -31 0.4 -32 0.8 -35 1.0 -39
VI 1.1 -13 0.9 -10 1.2 -14 0.9 -10
VII 1.9 -28 1.5 -31 1.9 -35 2.2 -30
VIII 1.9 -19 1.3 -39 1.8 -12 2.2 -6
IX 1.8 -30 1.3 -22 1.9 -29 1.9 -29
X 0.9 -9 0.5 2 0.8 -18 0.9 -16
XI -0.2 -5 -0.6 -4 0.0 4 -0.2 20
XII 1.3 -2 1.0 -2 1.1 -3 0.7 2
6.2.2. Climate Scenarios for the 2020s, 2050s and 2080s
The GCMs simulation results used, show an increase of the annual air temperatures in Bulgaria
between (HadCM2 model) and 1.8 C (GFDL-R15 model) in the 2020s. The HadCM2 modelsimulates even slight decrease of the temperatures in November. A warmer climate is expected
Republic of Bulgaria, Ministry of Environment and Water94

in the in the 2050s and 2080s with a rise in air temperatures between 1.6 (HadCM2) to 3.1 C
(GFDL-R15) in the 2050s, and between 2.9 (HadCM2 and CGCM) and 4.1 C (ECHAM4) inthe 2080s. The warming is expected to be bigger in the summer of 2080s (Figure 6.6).
The model CGCM1 projects an increase in the annual precipitation in the 2020s and 2050s. However, the GFDL-R15 model projects a decrease in the monthly precipitation in May, June and July. The models ECHAM4, HadCM2 and CSIRO-Mk2b simulate decrease of monthly,seasonal and annual precipitation in the 2080s. The change in solar radiation is expected to vary between -10 and 10% during the 21st century. The ECHAM4 model results show increase of the solar radiation for the cold half year.
0.0
0.5
1.0
1.5
2.0
2.5
3.0
3.5
4.0
4.5
5.0
5.5
Air
tem
per
atu
re (
oC
)
JAN FEB MAR APR MAY JUN JUL AUG SEP OCT NOV DEC
a)ECHAM4
HadCM2
CGCM1
CSIRO-Mk2b
GFDL-R15
-40
-30
-20
-10
0
10
20
30
40
50
60
Pre
cip
itat
ion
(%
)
JAN FEB MAR APR MAY JUN JUL AUG SEP OCT NOV DEC
b)
0.0
0.5
1.0
1.5
2.0
2.5
3.0
3.5
4.0
4.5
5.0
5.5
Air
tem
per
atu
re (
oC
)
JAN FEB MAR APR MAY JUN JUL AUG SEP OCT NOV DEC
c)
-40
-30
-20
-10
0
10
20
30
40
50
60
Pre
cip
itat
ion
(%
)
JAN FEB MAR APR MAY JUN JUL AUG SEP OCT NOV DEC
d)
0.0
0.5
1.0
1.5
2.0
2.5
3.0
3.5
4.0
4.5
5.0
5.5
Air
tem
per
atu
re (
oC
)
JAN FEB MAR APR MAY JUN JUL AUG SEP OCT NOV DEC
e)
-40
-30
-20
-10
0
10
20
30
40
50
60
Pre
cip
itat
ion
(%
)
JAN FEB MAR APR MAY JUN JUL AUG SEP OCT NOV DEC
f)
Fourth National Communication on Climate Change95

Figure 6.6. GCM climate scenarios for monthly temperature (a, c, e) and precipitation in Bulgaria in the 2020s (a, b), 2050s (c, d) and 2080s (e, f) 5
6.2.3. Climate Scenario for the end of the 21st Century
Some of the climate models simulate an increase of the air temperature in Bulgaria from 2 to 5 Chaving a two-fold increase of the carbon dioxide concentration in the atmosphere. For mostclimatic scenarios, winter precipitation are projected to increase until the end of the presentcentury but precipitations will drop significantly for the warm half-year and mostly during the summer (Figure 6.7).
-2 0 2 4 6 8 1
-2 0 2 4 6 8 10 ( )
-80
-60
-40
-20
0
20
40
(%
)
b)CGCM2
CSIRO-Mk2b
CSM-1.3
ECHAM4GFDL-R15b
MRI2
CCSR
DOE-PCM
HadCM3
Temperature ( C)
Pre
cip
itat
ion
(%
)
0 ( )
-80
-60
-40
-20
0
20
40
(%
)
a)
Pre
cip
itat
ion
(%
)
Temperature ( C)
5 Alexandrov, V., 2001. Climate Change Impact on Water use of Maize in Bulgaria. Proceedings of theinternational conference on 150 Years of Meteorological Service in Central Europe, Stara Lesna, Slovakia, (CD) 13pp.
Republic of Bulgaria, Ministry of Environment and Water96

Temperature ( C)
Pre
cip
itat
ion
(%
)
-2 0 2 4 6 8 10 ( )
-80
-60
-40
-20
0
20
40 (
%)
c)
-2 0 2 4 6 8 10( )
-80
-60
-40
-20
0
20
40
(%
)
d)
Figure 6.7. Climate model scenarios of average air temperatures and precipitation during winter (a, c) and summer (b, d) in Bulgaria at the end of the 21st century (for A2 (a, b) and B2 (c, d) SRES emission scenarios), relative to the present climate (1951-1990) (Alexandrow, 2002)
Temperature ( C)
Pre
cip
itat
ion
(%
)
6.3. Vulnerability Assessment
6.3.1. Agriculture
Climatic scenarios reveal that an increased risk and vulnerability to soil droughts are expected – an increase in the occurrence, intensity and level of impact of the soil droughts in Bulgaria for the 21st century. The soils with low capacity of moisture preservation and the regions in south-east Bulgaria are most vulnerable to those changes, in which areas precipitations during the warm half-year are low, even at present climatic conditions.
The generic grain cereal model CERES v.3.5, included in the computerized Decision Support System for Agrotechnology Transfer DSSAT v.3.5 was used to determine the vulnerability of current agricultural management scenarios in Bulgaria. The DSSAT crop models are designed to use a minimum set of soil, weather, genetic, and management information. The models integrate at daily time steps, and therefore, require daily weather data, consisting of maximum and minimum temperature, solar radiation and precipitation, as input. The models calculate crop phase and morphological development as a function of temperature, day length, and genetic characteristics. Leaf development, growth, and expansion determine the amount of light intercepted, which is assumed to be proportional to biomass production. The biomass ispartitioned to various growing organs in the plant, using a priority system. Water and nitrogensubmodels provide feedback that influences the development and growth processes. All crop models are sensitive to carbon dioxide concentrations. The DSSAT seasonal analysis programwas used to simulate possible adaptation measures, and to determine those managementscenarios that can decrease the potential agricultural crop vulnerability under expected climatechange conditions. The climate change impacts on agricultural crops are taken from the paper“Impact of climate variability and change on crop yield in Bulgaria”.
The ROIMPEL crop model was also used for the vulnerability assessment. It is a modularsimulation model of crop yields limited by soil -water and -nitrogen availability, using limitedeasy-to-map soil and weather data. Various practices for nitrogen and water management could be very easy considered specifying some easy to derive parameters through external files. ROIMPEL derives workability day statistics (optimum, soil too wet, or too dry) to be used for the optimization of machinery and labour at the farm level. The nitrate concentrations which are potential hazardous for groundwater contamination are optionally derived. The minimum
Fourth National Communication on Climate Change97

requirements for soil data are the soil texture and organic matter classes. The minimum weather data needed by the model are monthly values of the average daily air temperature and themonthly-cumulated rainfall. Hence, ROIMPEL is very helpful for climate change research projects where the perturbations of the climate parameters are scaled down from GCMs on amonthly base.
All transient GCM climate change scenarios used in the CERES and ROIMPEL (Fig. 6.8) simulation models projected a shorter vegetative and reproductive crop growing season during the 21st century. These changes were caused by the predicted temperature increase of the GCMscenarios. The duration of the regular crop-growing season for maize was between 5 (HadCM2) and 20 (GFDL-R15) days shorter in the 2020 s. Maturity dates for maize were expected to occur between 11 and 30 days earlier in the 2050s. The predicted changes in the crop-growing duration for maize in the 2050s were less for the HadCM2, CGCM1, and CSIRO-Mk2b climate changescenarios than the changes predicted by the ECHAM4 and GFDL-R15 models. These last twomodels simulated a higher increase of air temperature in Bulgaria, especially the GFDL-R15model, during the summer months July and August. The GCM climate change scenarios for the2080s projected a decrease in maize growing season by 17 (CSIRO-MK2b) to 39 (ECHAM4 and CGCM1) days. This will cause a shift in harvest maturity dates for maize from September toAugust at the end of the next century.
Winter wheat showed a decrease in growing season duration for the 2020s, varying between 3 (HadCM2) and 14 days (GFDL-R15). The projected decreases in growing season for the 2020s, 2050s, and 2080s were less for the HadCM2 model, which predicted a smaller air temperatureincrease during November and December. Even a slight decrease in monthly air temperature inNovember was projected for the 2020s under the HadCM2 climate change scenario. The transient GCM climate change scenarios predicted that harvest maturity for winter wheat wouldbe approximately 1–2 weeks earlier in the 2050s, and between 2–3 weeks earlier in the 2080s.
Republic of Bulgaria, Ministry of Environment and Water98
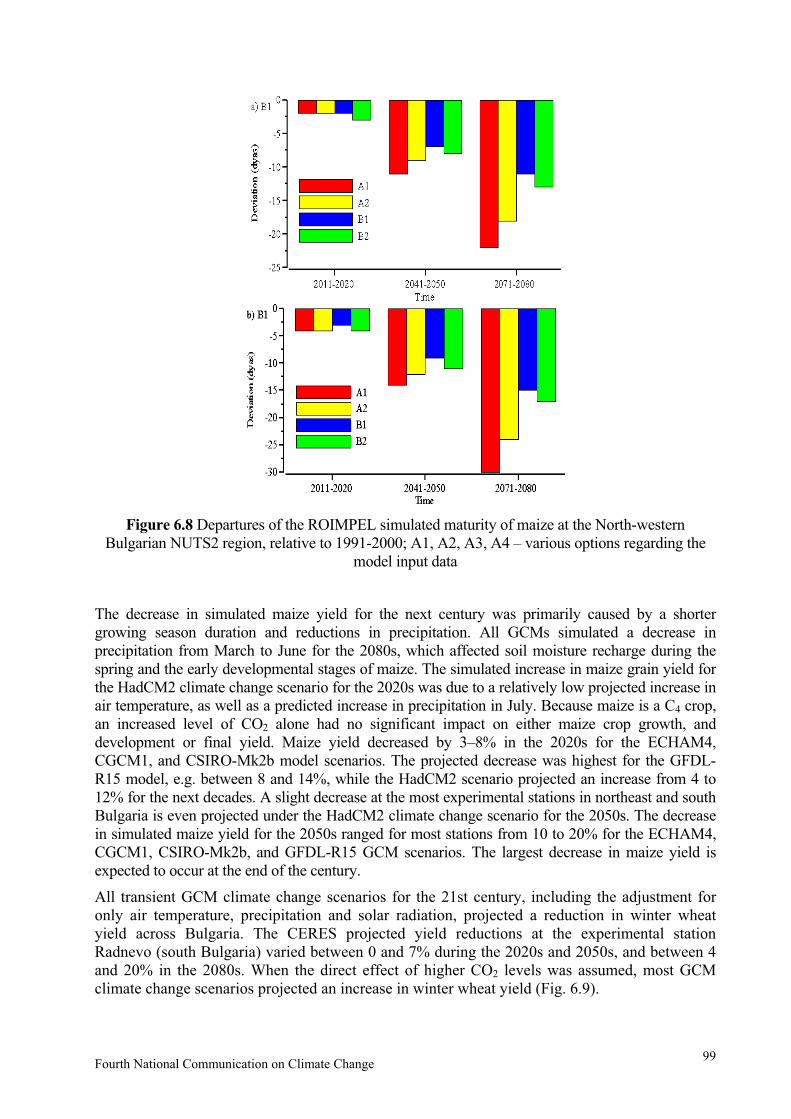
Figure 6.8 Departures of the ROIMPEL simulated maturity of maize at the North-westernBulgarian NUTS2 region, relative to 1991-2000; A1, A2, A3, A4 – various options regarding the
model input data
The decrease in simulated maize yield for the next century was primarily caused by a shortergrowing season duration and reductions in precipitation. All GCMs simulated a decrease inprecipitation from March to June for the 2080s, which affected soil moisture recharge during thespring and the early developmental stages of maize. The simulated increase in maize grain yield forthe HadCM2 climate change scenario for the 2020s was due to a relatively low projected increase inair temperature, as well as a predicted increase in precipitation in July. Because maize is a C4 crop, an increased level of CO2 alone had no significant impact on either maize crop growth, anddevelopment or final yield. Maize yield decreased by 3–8% in the 2020s for the ECHAM4,CGCM1, and CSIRO-Mk2b model scenarios. The projected decrease was highest for the GFDL-R15 model, e.g. between 8 and 14%, while the HadCM2 scenario projected an increase from 4 to12% for the next decades. A slight decrease at the most experimental stations in northeast and southBulgaria is even projected under the HadCM2 climate change scenario for the 2050s. The decreasein simulated maize yield for the 2050s ranged for most stations from 10 to 20% for the ECHAM4,CGCM1, CSIRO-Mk2b, and GFDL-R15 GCM scenarios. The largest decrease in maize yield is expected to occur at the end of the century.
All transient GCM climate change scenarios for the 21st century, including the adjustment for only air temperature, precipitation and solar radiation, projected a reduction in winter wheat yield across Bulgaria. The CERES projected yield reductions at the experimental station Radnevo (south Bulgaria) varied between 0 and 7% during the 2020s and 2050s, and between 4 and 20% in the 2080s. When the direct effect of higher CO2 levels was assumed, most GCM climate change scenarios projected an increase in winter wheat yield (Fig. 6.9).
Fourth National Communication on Climate Change99

Figure. 6.9. Change in potential rain fed wheat (%) on the Balkan Peninsula for the HadCM3 A2 scenario in 2011-2020 (left) and 2071-2080 (right), relative to 1961-1990. ROIMPEL model6
The major cause for this change in impact is that many crops, such as wheat and soybean, belong to the group of C3 crops, which are more sensitive to changes in CO2 concentration than thegroup of C4 crop, such as maize. The CO2 effect alone caused an increase in CERES wheat yield 10–20% above the baseline (1961–1990) for the 2020s. The simulated deviations of wheat yield increased in the 2050 by more than 20–25% for the ECHAM4, HadCM2, CGCM1, and CSIRO-Mk2b climate change scenarios. The increase in wheat yield varied from 14 to 37% for the GFDL-R15 scenario, depending on the location. Despite expected high air temperatures andprecipitation reductions during the spring in the 2080s, increases in wheat yield due to the fertilization impact of the increased CO2 level were also projected.
During the climate change in Bulgaria in the 21st century, most vulnerable will be: a) spring agricultural crops, due to the expected precipitation deficit during the warm half-year; b) crops cultivated on infertile soils; c) crops on non-irrigated areas; d) arable lands in south-east Bulgaria where even during the present climate, precipitation quantities are insufficient for normalgrowth, vegetation and productivity of agricultural crops.
6.3.2. Forestry
In order to define the forest ecosystem vulnerability under the possible climate changes, as well as to find measures for their adaptation to the new conditions, an information is necessary for theBulgarian forests calibrated to a basic period. 1990 has been chosen as a base year in the study. The meaning “status of Bulgarian forests” includes information about the areas, tree species,growth rates, volumes, etc. The status of the Bulgarian forest was thoroughly described in the First National Communication. In general, the total area of the forests in the country, the
6 Audsley, E., K.R. Pearn, C. Simota, G. Cojocaru, E. Koutsidou, M.D.A. Rounsevell, M. Trnka and V. Alexandrov,2006. What can scenario modelling tell us about future European scale land use, and what not? EnvironmentalScience and Policy 9(2): 148-162.
Republic of Bulgaria, Ministry of Environment and Water100

percentage of woodiness, the protected territories and the total area of the coniferous forests has increased within the last few decades.
The areas of annual afforestation have varied from 28,040 ha up to 89,660 ha, and this allowedover 1 million ha of new forests be established in the past 35 years, hence, over 1/3 of the country’s forests were re-established. The creative policy in the field of forestry resulted in a quick increase of the total volume of above-ground mass of wood in the forests of Bulgaria. The total volume of wood in the Bulgarian forests has increased from 244.68 mil. m3 (in 1955) up to 396.02 mil. m3 (in 1990), i.e. the amount of standing wood has increased by 61.8% in 35 years.
The consequences of this favourable effect on the forests in Bulgaria are obvious: the erosion in all the large water-catchment basins in the country was liquidated; the living conditions in manyterritories in the country improved, as well as the forests’ microclimatic, hydrological, ameliorative, etc., i.e. all the peerless favourable functions of the forests in Bulgaria have been improved.
Analysis on the condition of the forest vegetation from the last decade in Bulgaria shows thatthe coniferous forest vegetation which was widely introduced during the last decades under800 m a.s.l., i.e. out of its natural habitats, forms very unstable forest ecosystems. The mainreason is the discrepancy between the ecological conditions (mainly rainfalls) and therequirements of the coniferous tree species. Due to this reason these forests are physiologically in a chronic water deficit and in drought periods like this one in 1983-1994they begin to disintegrate. The above tendency subsequently encompasses the high fields of West Bulgaria, North Bulgaria, South Bulgaria, Black Sea Coast, and Southern parts of the country. In this sequence the vulnerability of the forest vegetation to the adverse dry climate increases.
The problem with the discrepancy of the ecological conditions of the forest vegetation is not anew one in Bulgaria forestry. Decay of the conifer plantations (Pinus sylvestris, P. nigra, morerarely Picea abies and Pseudotsuga menziesii) has been observed recently due to the improperintroduction of these species in the low part of the country. The main reason for this dangerous phenomenon was the discrepancy between the climatic conditions in this part of the countryand the ecological requirements of newly afforested coniferous species. If the projectionsabout the carbon dioxide doubling during the next century come true the ecological conditionsin Bulgaria will drastically deteriorate.
The climate change scenarios derived for Bulgaria were used to evaluate potential changes inforest vegetation. The altered temperature and precipitation databases corresponding to each of the climate change scenarios were used to run the Holdridge life zone (1967) classification model.
The changes are from “cool temperate moist forest” to “warm temperate dry forest” for North Bulgaria, and for South Bulgaria the “warm temperate dry forest” will remain typical. In the warmest country regions (station Sandansky) “subtropical dry forest” could be expected, which means drastic warming and droughts. Since 60.6% of forests are in the zone below 800 m, it is clear, that most of the Bulgarian forests would be vulnerable to the drastic climate change under the eventual doubling of carbon dioxide in the near future. The changes in the mountain regions of the country (station Smoljan, 1180 m a.s.l.) would pass from “cool temperate wet forest” to“warm temperate moist forest”. At an eventual climate warming a moving of the species composition from South to North could be expected, which means shifting of tree and shrub vegetation from the South-Bulgarian into the North-Bulgarian and from the South-Bulgarian border region into the South-Bulgarian forest vegetation area, respectively. That means that it could be expected that the South-Bulgarian border region area will be settled by typical Mediterranean vegetation, a part of which is to be seen there even at present.
Fourth National Communication on Climate Change101

In addition to the First National Communication, hereafter the forest vulnerability wasevaluated following the GAP models. The prediction of the forest ecosystem responses to long-term climate changes requires hierarchical constructed dynamic models, capable to cover and describe in a mechanistic manner the combination of the basic ecosystem processes andtheir interrelationships in space and time. The forest gap models are individually basedprograms which simulate the vegetation response functions to the environmental conditions. The model could evaluate the possible changes in the species composition, forest structureand productivity of specific forest sites. The model requires detailed information on specificforest species and environmental factors. The model could evaluate the dynamics of particularforest site in response to the climate change.
The GAP model results show that in case of climate warming over the next 90 years, the following consequences could be expected:
A. In the lowlands – Tree species diversity reduction. In spite of that, the biodiversity would be greater compared with the biodiversity in the mountain regions. The selected tree species guarantee increased bio-productivity. It could be considered that if proper selection is made,optimal bio-production could be released under changed climate conditions.
B. In mountains – Increased tree biodiversity could be expected. It could be realized by means ofthe natural shifting of tree vegetation from lower to higher sites in the mountains. This processwould be combined with biomass production increase.
C. Both in lowlands and mountains – Increased biomass productivity would be accompaniedby increased CO2 absorption.
Either using Holdridge Life Zones Classification Model or JABOWA-II GAP Model, two climate zones of climate change influence have been established: from 0 to 600-800 m a.s.l. and over 800 (1,000) m a.s.l. Working with Holdridge model, critical situation for the future of the forests in the lowlands and low-hill regions on the whole was outlined, while developing GAP models it could be seen that the status of the forests (in all altitudes) wouldn’t be critical at all. As Holdridge model provides a regional mapping system for interpreting spatial changes throughout the country or regions, while the forest GAP model evaluates the temporal dynamicsof a given site in response to climate change, it could be considered that the GAP model results are more objective.
6.3.3. Soils
Soil diversity in Bulgaria is enormous. Soils have different characteristics, fertility and vulnerability to climate change. The temperature rise will increase the water deficit in soils with low precipitation rates that are prone to droughts. The most serious impacts will beobserved for soils with light mechanical content and bad water characteristics and partly forheavy clay soils. About 30% of the soils in Bulgaria are prone to wind erosion.
Optimization of soil treatment includes:
Choice of optimal dates and terms for the collection of major crops Soil monitoring; Measures for improvement water content in soils; Measures to improve soil structure and characteristics; Actions against erosion and for better nutrition mode; Up-to-date technologies for soil treatment, preserving the moisture and soil texture; Melioration of poor soils; ; Effective use of mineral fertilizers, relevant to various soils.
Republic of Bulgaria, Ministry of Environment and Water102

6.4. Adaptation
6.4.1. Agriculture
The objectives of adaptation measures in agriculture are to support and sustain the agricultural production and to bring to minimum the impact of climate change by reducing the vulnerability of the agricultural crops. The adaptation to climate change will be carried out in various forms,including technological innovations, changes in arable land, changes in irrigation, etc.Technological innovations include the creation of new cultivars and hybrids, which have higherproductivity during changes in the climate. Farmers can start growing other cultures or cultures,prone to drought and diseases. The changes in arable lands, due not only to the needs of agricultural production following a population increase but also to climate change, are expected to be another form of adaptation. It is reasonable to expect that because of climate changes, there willbe significant changes in arable lands. As the global climate has a tendency towards warming, a significant change in the irrigation of agricultural crops is expected. Introducing irrigation systemsin areas and regions with high air temperatures and evapotranspiration values leading to areduction of the present soil moisture will be a supportive measure in the stabilization of the agricultural production in those areas. The changes in meliorative activities can alter some negative impacts of climate changes. The times for various activities (for example dates for sowing,fertilization, pesticides and insectize) can be critical during the battle for plant vulnerability to the new climate conditions. The changes in the sowing density and fertilization standards can also be of use. Other actions like ploughing, change of predecessors and crops themselves can influencesoil composition and structure and improve the flexibility of agricultural crops in relation to climate conditions. The adaptation options discussed above are only few examples of the manypossible adaptation measures in the agricultural sector, being investigated and applied around theworld.
The sowing dates of spring crops in Bulgaria could shift under the GCM climate change scenariosin order to reduce the yield loss caused by temperature increase. The selection of an earlier sowingdate for maize will probably be the appropriate response to offset the negative effect of a potentialincrease in temperature. This change in planting date will allow for the crop to develop during aperiod of the year with lower temperatures, thereby decreasing developmental rates and increasing the growth duration, especially the grain filling period. The results show that the sowing date of maize for the experimental station Carev Brod (northeast Bulgaria) should occur at least 2 weeks earlier in the 2080s under the ECHAM4 scenario, relative to the current climate conditions. It should be noted, however, that although changes in sowing date are a no-cost decision that can betaken at the farm-level, a large shift in sowing dates probably would interfere with the agro-technological management of other crops, grown during the remainder of the year.
Another option for adaptation is to use different hybrids and cultivars. There is an opportunity for cultivation of more productive, later or earlier-maturing, disease and pest tolerant hybrids and cultivars. Switching from maize hybrids with a long to a short or very short growing season projected an additional decrease of final yield under a potential warming in Bulgaria. However, using hybrids with a medium growing season would be beneficial for maize productivity. Technologicalinnovations, including the development of new crop hybrids and cultivars that may be bred to better match the changing climate, are considered as a promising adaptation strategy. However, the cost of these innovations is still unclear.
Results from the adaptation assessments suggest that possible changes in sowing date and hybrid selection can reduce the negative impact of potential warming on maize yield during the nextcentury. Changes in cropping mixtures, irrigation, and agricultural land use can be additional alternative options for adaptation in agriculture.
Fourth National Communication on Climate Change103
The adaptation measures presented bellow in relation to irrigation in the conditions of the present and future climate in Bulgaria are based on various expert assessment (for example, Vurlev, etc.
2004, Alexandrow and Slavov, 2003), documents, action plans (for example, Slavov and Ivanova
1998A, 1998b, 1999) and programs (for example, Republic of Bulgaria, 2001)
Measures for increasing irrigation and irrigated agriculture adaptation of the country
towards climate changes
The urgent necessity to undertake appropriate measures for increasing adaptation towards climate changes with warming and drought tendency is evident – not only in regard to agricultural production but also in to irrigation, which is the main factor in the fight with those tendencies, and also an element of the agricultural sector as a whole.
The objectives of the adaptation measures should be to decrease or avoid the damages from drought and from climatic changes in general, and be directed to support and maintainagricultural production at relatively high and sustainable productivity level, and also for effectiveand sparingly use of water resources, having full use of the built irrigation facilities. It isnecessary to include activities on information dissemination about the nature of droughts, as knowing the phenomenon will diminish the sensitiveness and vulnerability o the population fromtheir impact.
The main adaptation measures cover organizational and managerial, financial and economic, and legislative aspects of irrigation and irrigated agriculture and should aim at:
improvement of management, use and protection of water resources in irrigated agriculture;
improving the efficiency of the management and use of the existing irrigation facilities and elaboration of the technological and technical facilities for irrigation;
use of rational and economically sound irrigation regimes for the irrigated crops and elaboration of the technologies for cultivation of crops in the conditions of droughts and water deficit.
Adaptation measures to improve management, use and protection of water resources in
irrigated agriculture during climate change:
establishing the impact of climate changes and drought on the quantity and quality of waterresources used in irrigated agriculture;
assessing the needs of water for irrigation of agricultural crops under climate changes and preparing long term projections for the required water resources to be used in agriculture.
Work is going on in various institutions like the Institute of melioration and mechanization,Institute of Water Problems, University of Architecture, Civil Engineering and Geodesy (UACEG), Institute of Soil Science and Agroecology "N. Pushkarov", Higher Institute of Agriculture, National Institute of Meteorology and Hydrology (NIMH), etc. Numericalexperiments to determine the optimal dates and water quantity for irrigation of the maize for various climate scenarios are carried out in NIMH, using computer system for agrotechnological decision taking DSSAT (Alexandrov, 1998, 1999). The calculations are taken in regard to biophysical and economic analysis of the final yield and the received profit from the maize
During limited precipitation in summer, irrigation facilities must be used, oriented towards design and operation of irrigation facilities, which use water resources in an economical way and have very low water transportation losses during irrigation.
Gravitee feed irrigation and flooding of beds and rice fields should be used as a last resort, only when proven to be effective.
Main and distribution canals of old irrigation systems must be coated to bring to minimum losses from filtration. Permanent canals in irrigation systems must be afforested on sufferance strips to
Republic of Bulgaria, Ministry of Environment and Water104

utilize filtered water and to cover them aiming at the reduction of the physical evaporation from water surface in the canals.
Adaptation measures to improve management efficiency and use of existing irrigation systems
and elaboration of technological and technical means for irrigation under climate changes:
To prepare up-to-date strategy and new program for the rehabilitation and restructuring ofirrigation management and improving the efficiency of use of the existing irrigationinfrastructure;
To change legislation and regulation in the irrigation sector taking into consideration the altered agricultural conditions, the experience from the reforms carried out so far and to ask forfree use of the technologically established hydromeliorative infrastructure and service facilities on the territory of the associations;
To implement proper educational and training programs with emphasis on major issues on the involvement of users of water and the general public on drought problems;
Preparation of information materials for water users on the benefits and good practices of agricultural crop irrigation.
Adaptation measures for use of rational and economically viable irrigation regimes for
irrigated crops and elaboration of the technologies for cultivation under climate change:
Determining the vulnerability of agricultural crops under climate changes, long term droughts and water deficit in the major agroclimatic regions in the country, respectively their impact on the quantity and quality of the yield from them;
Reassessment of the water and irrigation norms and legislative provisions of irrigation, new zoning for the irrigated crops in the country;
Development and application of optimized irrigation regimes for the major agricultural cropsfor various agroclimatic regions in the country;
Research on the effect from irrigation and sustainability of yields under various water savingmethods and irrigation technologies;
Creation and application of mineral fertilization systems and integrated weed fight duringcultivation of agricultural crops under irrigation conditions;
Application of proper moisture preserving technologies and techniques for soil treatment in irrigated lands;
Adaptation and introduction in practice of information and advisory system for irrigation necessity forecast and defining the parameters of the irrigation regime for the irrigated crops;
Technology changes for irrigated crop cultivation in various agroclimatic regions under water shortage conditions;
Use of new cultivars and hybrids that adapt better to water deficit.
The presented above allows the following conclusions to be drawn:
Irrigation will be the main factor for the sustainable development of Bulgarian agriculture,giving guarantee for stable and quality plant production in years, varying in terms of the climate and accepting the challenges due to the expected periods of drought and water deficitin the years to come;
To use effectively the irrigation opportunities in the country, it is necessary to undertake timelymeasures from the present moment, encompassing all its organizational and management,financial and economic and legislation aspects, which will provide the necessary preconditions for the recovery and reorganization of irrigation facilities and increase the effectiveness of their use and further development, in line with the features of the constantly changing climate and the requirement for modern policy of integrated and sustainable water protection and use;
Fast restoration and development of the irrigation sector and irrigation agriculture should become a main priority of the state policy in the agricultural sector supported by real, active
Fourth National Communication on Climate Change105

and sound investment program, based on the use of national and international financial resources;
Completion of the institutional reforms in this direction, aimed at the improvement of irrigation organization and management and use of irrigation systems;
Completion of the economic efficiency assessment of the existing irrigation facilities and taking a decision for the restoration and reconstruction of economically effective, suitable and unsuitable facilities at the present moment;
Discarding obsolete areas and equipment, the use of which is economically non-viable in the near future;
Development and application of proper irrigation investment program for the next few years, with state subsidies aimed at the most efficient regions and such with active or to be established soon irrigation associations;
Implementing the measure on irrigation from the SAPHARD programme;
Reconstruction and reorganization of the existing irrigation systems, aimed at their use in thecondition of water deficit, implementing proper models in representative regions in the country;
Elaboration of the present irrigation technologies and equipment, aimed at compliance with the new needs of the irrigated cultivars and increasing their efficiency, development and use ofnew water saving and energy saving technologies and equipment;
Assessment of the energy demand of the irrigation systems and developing measures to increase their energy efficiency;
Development and application of technologies and systems for regulation and control of technological processes for distribution and use of water for irrigation;
Development and application of economic viability policy in regard to price formation in the irrigation sector;
Development and application of state support program for irrigation associations and other water users, aimed at encouraging and stimulation of their activities and transforming them in active participant of the joint management and development of the irrigation sector.
Some economic adaptation measures, such as substitution possibilities for other crops,availability, and costs of alternative production techniques, are recommended for evaluation in the future. As in the Second National Communication the other major adaptation measures under consideration in Bulgaria are:
New zoning of the agroclimatic resources and agricultural crops
Expanding areas of the most important agricultural crops over new regions characterized by improved thermal and moisture conditions.
Utilization of a variety of cultivars and hybrids, especially long-maturing, high-productivecultivars and hybrids with better industrial qualities.
Cultivation of new agricultural crops grown with Mediterranean origin.
New cultivars and hybrids to be adapted to climate change
The new cultivars of winter agricultural crops to pass through the winter season organogenesisunder higher temperatures without deviations from the normal crop growth and development.
The new cultivars and hybrids to be with higher dry-resistance, especially at the end of the vegetative period and at the beginning of the reproductive period.
Higher maximal air temperatures not to provoke thermal stress effects, especially during crop flowering and formation of the reproductive organs.
The new cultivars and hybrids to grow and photosynthesis under an increased concentration of carbon dioxide.
Republic of Bulgaria, Ministry of Environment and Water106

Optimization of soil treatment
Optimal dates and terms of sowing of main crops.
Soil monitoring.
Measures for improvement of the water content in soils.
Measures to improve the soil structure and performance.
Actions against erosion and for better nutrition mode.
Up-to-date technologies in soil treatment that keep soil water and structure.
Effective use of mineral fertilizers relevant to the soils diversity.
Overcoming of the misbalance of the main nutrients and normalization of the mineral /organicfertilizers ratio.
Adaptation phytosanitary measures
Development of special sub-models incorporated into models of agro-ecosystems which simulate plant-protection situations, related to climate change.
Assessment of already used pesticides and the way of their utilization and potentialeffectiveness of the chemical method against crop diseases and pests.
Improving technologies for plant protection and priority development of non-chemicalmethods against crop diseases and pests.
Improving the monitoring for the phytosanitary situation in the country.
6.4.2. Forestry
The Third National Communication thoroughly deals with the forestry sector and the availableadaptation and mitigation measures. Current Communication only adds the latest research in the field.
For the forests in the low parts of the country (under 800 m a.s.l.), where the most significant impact from climate change is expected, the strategic objective of the management must beadaptation towards drought and improving forest sustainability.
For the forests in the higher parts of the country, i.e. those above 800 m a.s.l., where expected changes are not likely to be drastic, the objectives are preservation of biodiversity, eco systemsustainability, multifunctional management, system of protected nature territories.
The natural and introduced forest wood and shrub species in Bulgaria have great potential for agood adaptation towards possible climate change in the present century.
Through planned felling of young plantations, the vital space of the remaining woods is improved and so is their light and water regime. This is also an approach to improve the possibilities for adaptation of wood plantations, resulting in increased biomass. Forest management projects forecast an annual growth of 120 000 ha with an average use of 2 801 800m3.
Fourth National Communication on Climate Change107

Republic of Bulgaria, Ministry of Environment and Water108

7 FINANCIAL RESOURCES AND TECHNOLOGIES TRANSFER
7.1. Introduction
Despite the fact that Bulgaria is an Annex I Party of the UN FCCC, as a country with economyin transition, it has no commitments to provide financial resources and technology transfer todeveloping countries. The country rather accepts financial and technological help, mainlywithin the framework of the Joint Implementation (JI) mechanism.
Through is flexible mechanisms, the Kyoto Protocol encourages the industrialized states to invest with clean, climate supporting technologies the countries with economies in transition as well as the developing countries. The Joint Implementation mechanism is an instrument, based on projects, aimed to encourage technology transfer for profitable GHG emission reduction for Annex I countries.
The JI mechanism is a convenient and profitable way for Bulgaria to receive economic, technicaland expert help with GHG mitigation efforts.
The basic principles of the national policy on climate change were developed on the basis of Bulgaria’s good will to join the efforts of the international community to solve the climatechange problems according to the potential of the national economy and looking at theopportunity to attract foreign investments, which will facilitate their implementation.
7.2. The Joint Implementation Mechanism in Bulgaria
The Joint Implementation (JI) mechanism, recommended by UNFCCC and endorsed by the Kyoto Protocol is regarded as a useful mean, which will allow the country to fulfil itscommitments. The position of the Republic of Bulgaria on JI, as expressed in National Communications is as follows:
JI is economically effective because it allows global GHG emission reduction under minimalexpenses;
JI mechanism could facilitate for the introduction of the latest technologies in the country; JI is a voluntary activity with two or more participants and the activity must be undertaken
and/or approved by the governments of the two participants.
Bulgaria is amongst the first countries in the world, which host JI projects, according to Article 6 of the Kyoto Protocol at UNFCCC. As a result, the country has already gained some experience in various aspects of the JI mechanism, amongst which: conclude a Memorandum of understanding/Cooperation Agreements with other Annex I countries, consultancy on the possibilities on the realization of JI projects, procedures for support and approval of particular projects.
The Sector Joint Implementation Projects at the department “Climate change policy” within the“Strategy, European integration and international cooperation” directorate in MOEW is responsible for the application of the flexible mechanisms of the Kyoto Protocol and for theexecution of the procedures for assessment and approval of JI projects in Bulgaria. The department is also responsible for the EC Directive, introducing the Emission Allowance Trading Scheme.
The use of the JI mechanism in Bulgaria started in 2000 with the establishment of a JI mechanism unit as an independent structure in the State Agency for Energy Efficiency under thedirect supervision of the Ministry of Environment and Waters.
Fourth National Communication on Climate Change109
The legislation on JI projects in Bulgaria includes the Laws on ratification of the UNFCCC and the Kyoto Protocol, signed bilateral Memorandums of Understanding with governments of other countries, that are Annex I parties and the Environmental protection act.
A procedure of approval of JI projects has been set and is in place, and it requires the assessmentof each project by a Steering Committee for JI projects (SC JI), which committee is formed by the order of the Minister of Environment and Waters and consists of 8 members, experts fromdifferent institutions concerned – the Ministry of Environment and Waters, Ministry of Finance, Ministry of Industry and Energy, Ministry of Regional Development and Public Works, National Forestry Directorate, Executive Energy Efficiency Agency. The chairman is the Minister of Environment and Waters. SC JI carries out an assessment of compliance with criteria, elaboratedin advance.
Seven Memorandums of Understanding/Cooperation Agreements have been signed aimed at JI cooperation – with The Netherlands, The Swiss Confederation, The Kingdom of Denmark,Republic of Austria, Prototype carbon Fund at World Bank, Japan and the Kingdom of Sweden. Memorandums with Finland, France, Spain and Italy are expected to be signed until the end of 2006.
The Joint Implementation project must be approved by both participating countries and should lead to emission reduction in addition to those, which would have been emitted in the absence of the project. The projects that satisfy the terms above and are accomplished before 2008 can be registered as Joint Implementation projects but the emission reduction units will be “issued” and transferred only after 2008. This will be done through a national register, which is to be established.
As an implementation of the signed bilateral agreements, 12 projects have been approved and some of them have already started. The execution of those projects will lead to greenhouse gases emission reduction more than 8 mln. tons carbon dioxide equivalent for the period 2008-2012.
7.3. List of the Approved Joint Implementation Projects
Bulgaria is ranked as the most attractive country for investment in Joint Implementation project, according to the Top 3 rating of the Agency for independent analysis – Point Carbon.
The country has already taken advantage numerous times from this very favourable situation in the following projects:
1. Cogeneration gas plant “Biovet JSC”, Pestera, investor – “Biovet” SC
2. Reduction of greenhouse gases through gasification of the cities Veliko Tarnovo, Gorna Oryahovica and Lyaskovec, investor – “Overgas Inc” SC;
3. Rehabilitation of the heating system in TPP Sofia, City of Sofia, investor “Toplofikacia” SofiaJSC;
4. Rehabilitation of the heating system in TPP Pernik, City of Pernik, investor “Toplofikacia”Pernik JSC;
5. Reduction of nitrous oxides in “Agropolichim SC, city of Devnia, investor “Agropolichim”SC;
6. Paper factory Stambolijski SC, city of Stambolijski, Investor – “Stambolijski” SC;
7. Vacha Cascade, investor “National electrical Company” JSC;
Republic of Bulgaria, Ministry of Environment and Water110

8. Greenhouse gas reduction through gasification of Sofia municipality, city of Sofia, Investor “Overgas Inc.” SC;
9. Greenhouse gas reduction through gasification of Varna municipality, city of Varna, Investor “Overgas Inc.” SC ;
10. Cogeneration in TPP Plovdiv JSC, city of Plovdiv, investor “Toplofikaciya Plovdiv” JSC;
11. Common project for installation of cogeneration gas plants, put together as several sub projects – Polimeri SC; Kostenec HHI SC; Toplofikaciya Kazanlak SC; ToplofikaciyaYambol SC;
12. Utilization of biomass in Sviloza SC, city of Svistov, investor “Sviloza” SC;
A significant number of projects are supported at Project Idea Note stage. Now follows the process of a further development and possible approval.
7.4. List of Supported Project ideas for the Joint Implementation Mechanism
1. Capture of biogas and production of electricity from Waste water treatment station Kubratovo, city of Kubrat, Investor “Sofia water” SC;
2. TPP Eco energy 2004 – plant for joint heat and electricity production in Sofia, Republic of Bulgaria, city of Sofia, district Ovcha Kupel, Investor – “Risc Engineering” SC;
3. Construction of own autonomous source for electrical and heat energy in BF “Panajot Volov” SC based on gas turbine, City of Shoumen, Investor – Financial industrial concern “AKB FORES”, JSC;
4. Factory for biodisel production, city of Slivovo pole, region of Russe, Investor “Astra Bio Plant” Ltd. ;
5. Construction and operation of HPP Potochnica, lower part of Arda river, Investor “Finauto”Ltd. ;
6. Wind energy park “Universum Energy” City of Kavarna, Dobrich region, Inverstor “Universum Energy” Ltd.;
7. Wind power station Kaliakra, Kavarna municipality, Investor “Mitsubishi Heavy Industries”,Japan
8. Portfolio: “Energy efficiency and renewable energy in Bulgaria”, incl. “Trakia gas”, region of Plovdiv, “Sugar plants”, city of Gorna Oryahovica, “Delektra Hydro”, city of Lesichevo, “Viva Agrotex”, city of Alfatar, “Astra V” Ltd., city of Devin, “Mount L”, “Trestena”, “Zebra” SC, city of Novi Iskar, “Pirinplast”, city of Goce Delchev, United Bulgarian Bank, Investor – United Bulgarian Bank;
9. Opportunities for construction of small hydropower plants (SHPP) along Sofia water supply system, city of Sofia, Investor Sofia municipality;
10. Utilization of methane gas at the solid household landfill Suhodol, city of Sofia, InvestorSofia municipality;
11. Expansion, modernization and reconstruction of thermal power plant “Yambolen” SC on its conversion in independent power producer, TPP “Yambolen” SC, city of Yambol, Investor “Yambolen” SC;
12.Energy efficiency investment program in the Cellulose factory Sviloza SC, city of Svistov, Investor “Sviloza” SC;
Fourth National Communication on Climate Change111

13. Rehabilitation project for hydroenergy cascade “Lower Arda”, including HPP “Kurdjali”, HPP “Studen kladenec” and HPP “Ivajlovgrad, Investor “National electrical company” SCS;
14. Portfolio: Cascade Sreden Iskar, including 8 HPP on Iskar river, Investor “HPP Svoge” Ltd.;
15. Wind power plant “Murgash”, the region of the mount Murgash, ridge of Stara planina, Investor “Ecosource Energy” Ltd. ;
16. A set of projects for small HPP in Bulgaria, including HPP “Lozyata” close to HPP “Krichim”, HPP “Byala Mesta” – mountain part of the basin of Mesta river, HPP “Cherna Mesta” – mountain part of Mesta river basin;
17. Construction of FAME /biodiesel/ production installation, city of Silistra, Investor “Green oil” Ltd.;
18. Pilot project – Forestry sector: change of fuels, city of Ardino, Ardino municipality;
19. A set of small hydro power plants and wind parks, including SHPP “Banite”, village Banite, SHPP “Hulubovo”, village Gulubovo; SHPP “Oryahovec”, village Oryahovo, SHPP “Prespa”, village Prespa, SHPP “Slivka”, village Slivka; SHPP “Churekovska”, river Churekovska, SHPP “Yugovo”, village Yugovo; SHPP “Zverino”, village Zverino; SHPP “Lyutinbrod”, village Lutinbrod; SHPP “Energy Govedarci”, village Govedarci; SHPP “Stankova reka”, Stankova river; SHPP “Pchelina”, village Lobosh, “Retije cascade”, villageKremen; Wind Energy Park (WEP) “Irichek”, village Irichek; WEP “Vidno”, village Vidno; WEP “Rakovski”, village Rakovski; WEP “Hadji Dimitar”, village Hadji Dimitar; WEP “Selce”, village Selce; WEP “Kavarna-LM”, city of Kavarna; Reconstruction of steam plantRuno-Kazanlak, investor “Runo Kazanlak” SC, city of Kazanlak.
20. New plant for joint production of heat and electrical energy in Toplofikaciya Burgas SC, city of Burgas, Investor “Toplofikaciya Burgas”;
21. Greenhouse gas reduction through gasification of Burgas municipality, Burgas municipality,Investor “Overgas Inc.” SC;
22. N2O emission reduction for Neochim SC, city of Dimitrovgrad, investor “Carbon Ventures”.
Republic of Bulgaria, Ministry of Environment and Water112

8 EDUCATION, TRAINING AND PUBLIC AWARENESS
8.1. Introduction
Public interest in climate changes has been significant. Various governmental, non-governmentaland social non-economic organizations have raised the issue on various occasions. However, the more serious problem is that a vast amount of people do not realize the increasing by the hour environmental threat for our planet. In this respect, each one of us, being direct or indirect component of the environment, can and must contribute to the protection of the environmentalbalance.
8.2. Education
Bulgaria carried out a project for self assessment of the capacity of the country in the field of sustainable development in 2004. The results from the project in the section Environmentaleducation and public awareness in climate change problems allow to define the priority topic, theexplanation of which will improve not only the level of the educational system but also public awareness.
Three complex and a number of specific reasons have been formulated as a reason for the unsatisfactory level of capacity. Specific objectives and tasks have been elaborated to improvethe situation and direct and indirect assets have been recognized that allow the tasks to be solved in a short period of time.
The main results from the work in the area of climate change are given in Table 8.1
Table 8.1 Reasons, specific objectives and assets
PRIORITY PROBLEM:
Insufficient participation of the interested parties and general public in the national andinternational climate change activities
STRATEGIC OBJECTIVE:
Active participation of the interested parties and general public in the formulation, development, execution and assessment of the climate change policies and measures
Complex reason:
Lack of sufficient information on the subject or the information is hard to obtain
Specific objective :
To create conditions the information on climate change, theinternational and national policy on this problem to be available and with easy accessed for everybody interested
Main reasons:
Lack of national program or plan for education, training and information on public awareness on climate change
Lack of journalists competentin this area
Media information are of sensational or campaign character, there are no fundamental and in-depth analysis
Tasks:
Development and adoption of national program or plan for education, training and information on public
Creation of informalgroup of journalists and experts to prepare and present information on climate change
Direct assets:
A huge amount of information exists in Internet on climate change
A company on environmental protection management activities exists
There are environmentalNGOs with experience in education and public
Fourth National Communication on Climate Change113

Lack of coordination amongst the administration in regard to presenting information to various customers
Lack of effective information system for the ongoing work, results and achievements in various climate change areas
Lack of purpose financing for the activities defined in the New Delhi Program on Article 6 of the UNFCCC
Media do not contact experts on the topic
Journalists trained on the subject
Create mechanism for Information Exchange (CHM) on climate changecauses, its effect and prevention activities in various areas and sectors
Improved inter administration coordination for detailed and in-timepresentation of information
Adapted scientificpublications and informationon climate change and popularizing through integration in various special information flows
awarenessMOEW has an
information centre and Internet site on climatechange
Ministries and Agencies have public awareness units Indirect assets:
There is a mechanismfor Information Exchange(CHM) on biodiversity
Specialized radio and TV broadcasts exist (for ex. “Brazdi”, “Ecocambana”,etc.)
Complex reason: :There is no general education on the subject
Specific objective:
Climate change subject integrated at all educational levels
Main reasons:
Lack of enough teachingmaterials and books in Bulgarian
Lack of specialized information materials for teachers on climate change
Training aids on natural science and humanitarian subjects do not include climate change and its impact in the respective area
Tasks:
Development of educational and informationmaterials in Bulgarian
Development of specialized educational programs on climate change for teachers and lecturers
Purpose financing is ensured on activities on the national program and for science and research in High schools
Training aids on natural science and humanitariansubjects that include climatechange and its impact on the respective area
Direct assets:
MOEW have an expert on Education and Environment
The Ministry of Education carries out reforms in the system for improvement of teachers’trainingIndirect assets:
There are someeducational materials in small circulation
State educationalrequirements are under way
Complex reason: :Lack of sufficient expert potential for business, local authorities,NGOs and academics
Specific objective: :
Established expert potential in regard to climate change forbusiness, local authorities, NGOs and academics
Main reasons:
Insufficient targeting ofscientific and research activitiestoward compliance and meetingthe requirement of UNFCCC
Tasks:
To ensure financing on this subject from the National Science Fund
Special educational
Direct assets:
There are highly qualified experts and scientists with interest onclimate change subject
Republic of Bulgaria, Ministry of Environment and Water114

Lack of sufficient financing for research on this subject
Ignoring the gravity of the problem by the parties concerned
Lack of good opportunities for employment and professional growth
practices (seminars, courses, information campaigns)
Improvedinterconnection of business and science for popularizing and financing the research on the subject
There are experiencedteams in climate change projects
There is a limitednumber of experts with good knowledge on climatechangeIndirect assets:
There are chamberorganizations that support information disseminationand protection of memberinterests
EPA requires the development and application of national and municipal environmentalprotection programs
There is experience in the development of municipal programs on EE
There are regional centres and local units on energy efficiency
There is already planning of the tasks from Table 8.1 and some positive results are in place.
8.2.1. Environmental Education in Schools
The effective use of human potential, especially in hard time as the present transitional period, is one of the greatest challenges, undertaken by people in the last decade. Environmental protection – soil, air, water, plants and animals, natural heritage must develop into personal conviction. One of the fundaments of the present education is to familiarize the pupils with the naturalenvironment and form a positive attitude towards everything, surrounding them.
The topics of environmental protection and climate change are included in school syllabuses in the educational and cultural field “Natural science and environment”. They are studied in mostdetails in the “Geography” subject but also, even in lesser scale in “Environmental chemistry”and “Biology”.
The children have contacts with nature even in primary school, they get used to watch it, get acquainted with various natural sites and objects, and follow different natural phenomenon. To enhance their knowledge on the environment it is of great benefit to have various games – didactic, of cognitive nature. When introducing Bulgarian mountains to them, a special attention should be drawn to the variety of mountains in the country.
For an efficient environmental education and training, trips and games at the open are very beneficial. The game “How old is the tree” will help the children understand how long does it take for a tree to grow.
Through a series of research, experiments are made on the state of the river, running through settlements. The water in the mountain is investigated and so is the water in the city. Even only primitive tools are used – magnifying glass, what is seen is enough for drawing some valuable
Fourth National Communication on Climate Change115

conclusions. Visits of the Black Sea, numerous water dams, parks and reserves can also positively contribute on children’s knowledge on environmental problems.
Pupils can see for themselves how much cleaner the water in the mountains is, where humanpresence is limited.
In this context, one should add the necessity of introduction of compulsory environmentallessons in primary schools and outdoor activities.
8.2.2. Development of Specific Syllabuses for Training of Teachers and
Lecturers
A “Specialized course on vocational training of chemistry teachers on environmental protection” was carried out in 2005. It was on 3 stages during the school year. All 50 participants – chemistry teachers have obtained a certificate. The participants in the course have been selectedfrom all over the country. The successful completion of the education can be used as a model forfuture training and elaboration of similar courses for training of teachers.
8.3. Ecotourism
The consolidation of the movement for environmental protection and development of ecotourismis typical for the period of transition to market economy. Both tendencies are expression of the concern for environmental protection and protection of the natural and cultural heritage. The protection of the environment, heritage and ecotourism are closely linked amongst them and need each other to achieve successfully their goals.
During the first national forum “Ecotourism, mountains and protected territories – partners for prosperity”, the Ministry of Economy, Ministry of Environment and Waters and Ministry of Agriculture and Forestry signed a Protocol for cooperation in the ecotourism.
The strong orientation of ecotourism to the principles, guiding directions and certification, based on the standards of sustainability, assigns it a special part in the sector Tourism. During the years, since the term was defined for the first time, Bulgaria reached consensus on the mainelements of ecotourism, which characterize it as follows:
contributes for the biodiversity protection; supports the prosperity of the local population; includes a responsible behaviour from tourists and the tourist sector; requires the lowest possible use of non-renewable resource; services for small tourist groups are provided mainly by small business the emphasis is on local participation, private property and business opportunities, specially for people from rural areas; includes imperative/cognitive element.
8.4. Contribution of MES in Sector “Household and services” in the Second
National Climate Change Action Plan
8.4.1. Improving Thermal Isolation (kindergartens, schools, universities and
orphanages)
The Ministry of Education and Science has successfully fulfilled energy efficiency sanitation program for schools. The building and construction work have been distributed on types of activities, according to the presented technical specification. The activities from 2005 are thebiggest so far and the financial means have used in the most effective way. The effect is in the
Republic of Bulgaria, Ministry of Environment and Water116

decrease of energy costs for schools and budget relief through investments with a short period of buy out.
8.4.2. Gasification – Abolishing Liquid Fuels for Heating (kindergartens,
schools, universities and orphanages)
The harmful emissions in the atmosphere and the air pollution are reduced by replacing liquid fuels with natural gas. The learning conditions are improved. Gasification is most oftenaccompanied by major rehabilitation of heating facilities, thus significantly improving theirefficiency.
8.4.3. Introducing Solar, Hybrid and Other Hot Water Installations
(kindergartens, schools, universities and orphanages)
Similar installations can be discussed and built after presenting detailed economic reasoning and proposal for managerial decision.
The completion of those projects is accompanied by education of pupils for the necessity of efficient use of energy, reduction of the emissions in the environment, improvement of the living space and in particular – the microclimate in school rooms.
Fourth National Communication on Climate Change117

Republic of Bulgaria, Ministry of Environment and Water118
9 RESEARCH PROJECTS AND SYSTEMATIC OBSERVATION
The Bulgarian Academy of Sciences (BAS) carries out research and other activities on climatechange. The information for this research is so big that can not be summarized and analyzed within this document. Work is going on not only on planned tasks with national financing butalso in cooperation with research organizations from EU member countries within the SixthFramework Programme.
Comprehending the significance of this problem, BAS established a National Coordination Centre for Global Change. The Centre for Global Change carries out work in the followingdirections:
Organizational activity for strengthening of the Centre;
Publication of books, papers, and other materials on global change problems;
Participation in scientific conferences and discussions dedicated to global changes; Supporting the contacts of our scientists with foreign scientists, who work on the topics of global change;
Public awareness on those changes.
On national level the centre puts efforts to strengthen the cooperation amongst Bulgarian institutions and organizations. In regard to this, it organizes discussions about the Second National Action Plan on Climate Change and the policy of MOEW on climate change; on climate change and global change project implementation, etc.
On international level, the centre supports participation in projects, publications and reports on climate change and global change.
A scientific monograph was published in the UK «Drought in Bulgaria. A Contemporary Analog for Climate Change» Ashgate, UK, pp. 336, edited by C. Gregory Knight, Ivan Raev, Marieta Staneva
Major planned projects:
Applying European experience on using the results from climate change research in Bulgaria,Introduction of decision taking mechanisms in agriculture under the conditions of global changes by establishing contacts between users and experts, climate change impact assessmenton the elements of the water balance.
- Forest-climatic research on the coniferous forests in Bulgaria.
Major publications:
- Alexandrov, V. and J. Eitzinger, 2005. The Potential Effect of Climate Change and ElevatedAir Carbon Dioxide on Agricultural Crop Production in Central and South-eastern Europe. In: Tuba, Z. (ed.), 205. Ecological responses and adaptations of crops to rising atmospheric carbon dioxide. The Haworth Press Inc., USA, pp.291-332 and Journal of Crop Improvement13(1-2): 291-331.
- Alexandrov, V., M.Genev and H.Aksoy, 2005. Climate variability and change effects on water resources in the western Black Sea coastal zone. Proceedings of the European Water Resources Association (EWRA’2005) Conference: “Sharing a common vision for our water resources”, 7-10 September 2005, Menton, France, (CD version) 12 pp.
- Alexandrov, V., 2005. Role and involvement of Bulgarian meteorologists in the implementation of the UN Convention to Combat Desertification at national level.Proceedings of the Technical Workshop on Drought Preparedness in the Balkans within thecontext of UNCCD. UNCCD Secretariat, Bon, Germany, 22 pp.
Fourth National Communication on Climate Change119

- Alexandrov, V., M.Genev and H.Aksoy, 2005. The impact of climate variability and change on water resources in the western coastal zone of Black Sea. Regional Hydrological Impactsof Climatic Change - Impact Assessment and Decision Making (Proceedings of symposiumS6 held during the Seventh IAHS Scientific Assembly at Foz do Iguaçu, Brazil, April 2005). IAHS Publ. 295, pp.62-71.
- Eitzinger, J. and V.Alexandrov, 2005. Results (and Problems) of Climate Change ImpactResearch in Agricultural Crop Production in Middle Europe. Proceedings of the CAgM OPAG 3.2 WMO Expert Team Meeting on Impact of Climate Change/Variability on Medium-to Long Range Predictions for Agriculture, 15-18 February 2005, Brisbane, Australia, WMO & Queensland Government, pp.17-20.
- Petkova N., R. Brown, E. Koleva and V. Alexandrov, 2005. Snow Cover Changes in Bulgarian Mountainous Regions, 1931-2000, Croatian Meteorological Journal 40: 662-665.
- Alexandrov, V., 2004. Climate variability and change and related drought on Balkan Peninsula. Proceedings of the Conference on Water Observation and Information System forDecision Support (BALWOIS) Ohrid, Macedonia, 25-29 May 2004, (CD) 14 pp.
- Alexandrov, V., 2004. Comparison of the CEECs scale crop modelling approaches. ACCELERATES Report, 81 pp.
- Alexandrov, V., 2003. Homogenization of Climate Long-term Series in Bulgaria. Report to Meteo-France, 41 pp.
- Alexandrov, V., 2001. Climate Change Impact on Water use of Maize in Bulgaria. Proceedings of the international conference on 150 Years of Meteorological Service inCentral Europe, Stara Lesna, Slovakia, (CD) 13 pp.
- Audsley, E., K.R. Pearn, C. Simota, G. Cojocaru, E. Koutsidou, M.D.A. Rounsevell, M. Trnka and V. Alexandrov, 2006. What can scenario modelling tell us about future Europeanscale land use, and what not? Environmental Science and Policy 9(2): 148-162.
- Alexandrov, V., M. Schneider, E. Koleva and J-M. Moisselin, 2004. Climate Variability and Change in Bulgaria during the 20th Century. Theoretical and Applied Climatology 79(3-4):133-149.
9.1. Strategic Projects
- National self assessment of Bulgaria for a global environmental protection management.
This project is joint initiative of the Ministry of Environment and Waters and the United NationsDevelopment Program and started at the end of 2002. The project was developed during the period February – June 2003. Its objective is to provide an in-depth assessment of Bulgaria’s capacity to carry out its commitments on the three UN conventions and to lead to the development of a strategic action plan on the improvement of the global management of theenvironment in the areas, related to the conventions on national level.
9.2. Current Projects with International Financing
National Information System for Air control in real time PHARE 9916
The objective of the project is to connect 17 automatic stations and 4 OPSIS stations in a way to allow data transfer to the Regional Environment and Water Inspectorates and the ExecutiveEnvironment Agency in real time. The main result from the project is the improvement of the available data in regard to the Bulgarian commitment for reporting.
Republic of Bulgaria, Ministry of Environment and Water120

Main objectives of the project - Further and full implementation of EU Air Quality Legislationby improving the administrative capacity of EEA and REIs with regard to QA/QC in the National Ambient Air Monitoring System (NAAMS).
Expected result
- Determination of present situation with regard to QA/QC within NAAMS i.e. to analyze the measurement methods, equipment and methodologies used; data handling, validation and verification procedures etc.;
- Established Calibration Lab operated on sustainable basis; ensured with adequate and well trained staff, as well as with the required methodologies
- Established National QA/QC System for AAQ measurements within NAAMS (in compliancewith EU QA/QC requirements [ISO 17025] according to art.3 of The Framework Directive96/62/EC on AAQ assessment and management); ensured with adequate and well trained staff (station operators and REI laboratory experts), as well as with the required guidebooks, instructions and methodologies
- Trained staff in 15 REIs and EEA (total 20 experts) on QA/QC in PAH and PCDD/PCDFemission measurements or other components
- Elaborated Action Plan for further development of QA/QC System (and The Calibration Lab) in order to gradually to increase it’s scope by covering the new AAQ parameters established by2000/69/EC, 2002/3/EC and the forthcoming daughter directives (PAH, benzene, arsenic, heavy metals).
Development and implementation of a soil monitoring and assessment framework for the
republic of Bulgaria
Main objectives of the project
The project is deemed to be a pro-active step towards complying with the upcoming soil monitoring legislation of the EU
Expected results
- Review of the existing system for soil monitoring;- Proposed structure and methodological approach for the new monitoring and assessment
framework;- Functional design of a GIS system.
Expected effect
Improved soil monitoring
Development of national system for monitoring of the biological diversity and protected areas
in Bulgaria in compliance with Council Directive 92/43/EEC on the conservation of natural habitats and of wild fauna and flora and Council Directive 79/409/EEC on the conservation of wild birds
Main objectives of the project - Strengthening the Bulgarian infrastructure for monitoring of the biodiversity and protected areas to ensure that the monitoring is in conformity with the EU-directives 92/43/EEC (habitat directive) and 79/409/EEC (bird directive).
Expected results
- A national programme for monitoring of the biodiversity and protected areas has been elaborated, including an action plan for its implementation;- Strengthened capacity at the Executive Environment Agency (EEA) regarding the monitoring of the bio-diversity;- Improved capacity of the Regional Inspectorates for Environment and Water staff for implementing the action plan activities in the field of the bio-diversity monitoring.
Fourth National Communication on Climate Change121

Expected effect
Improved monitoring of the biodiversity
Strengthening of the capacity and development of a Bulgarian national system for
information management and reporting according to the IPPC directive
Main objectives of the project - Strengthening the capacity of the Executive EnvironmentAgency with regard to issuing permits and reporting in accordance to the IPPC-directive (96/61/EC).
Expected results
- The Executive Environment Agency is able to issue permits in accordance with IPPC-requirements;
- Reporting by the Executive Environment Agency is in conformity with the IPPC-directive and other international agreements (EPER and PRTR);
- Increased awareness among Bulgarian industry regarding IPPC.
Expected effect
Effective reporting under IPPC-directive, EPER and PRTR
9.3. Financial Sources for Environmental Projects in Bulgaria
The main sources for financing of environmental projects in Bulgaria are: State budget; An enterprise for managing activities on environmental protection; National trust ecofund; European Union pre-accession funds for candidate member countries – ISPA, PHARE,
SAPHARD; “Joint Implementation” mechanism within the framework of the Kyoto Protocol to the United
Nations Framework Convention on Climate Change; Agreements for bilateral cooperation with:
- The Kingdom of the Netherlands;- The Federal Republic of Germany;- Denmark;- Austria;- The Kingdom of Belgium;- The United Kingdom;- The Principality of Monaco.
International organizations and financial institutions:- United Nations Development Program; ; - Nordic-funds; - CIM-projects; - Central European Initiative;- United States Agency for International Development;- European Bank for Reconstruction and Development;- The World Bank.
9.4. Systematic Observation
The section on systematic observations activities in the country follows the detailed guidance for required information as provided in the UNFCCC reporting guidelines on global climate
Republic of Bulgaria, Ministry of Environment and Water122
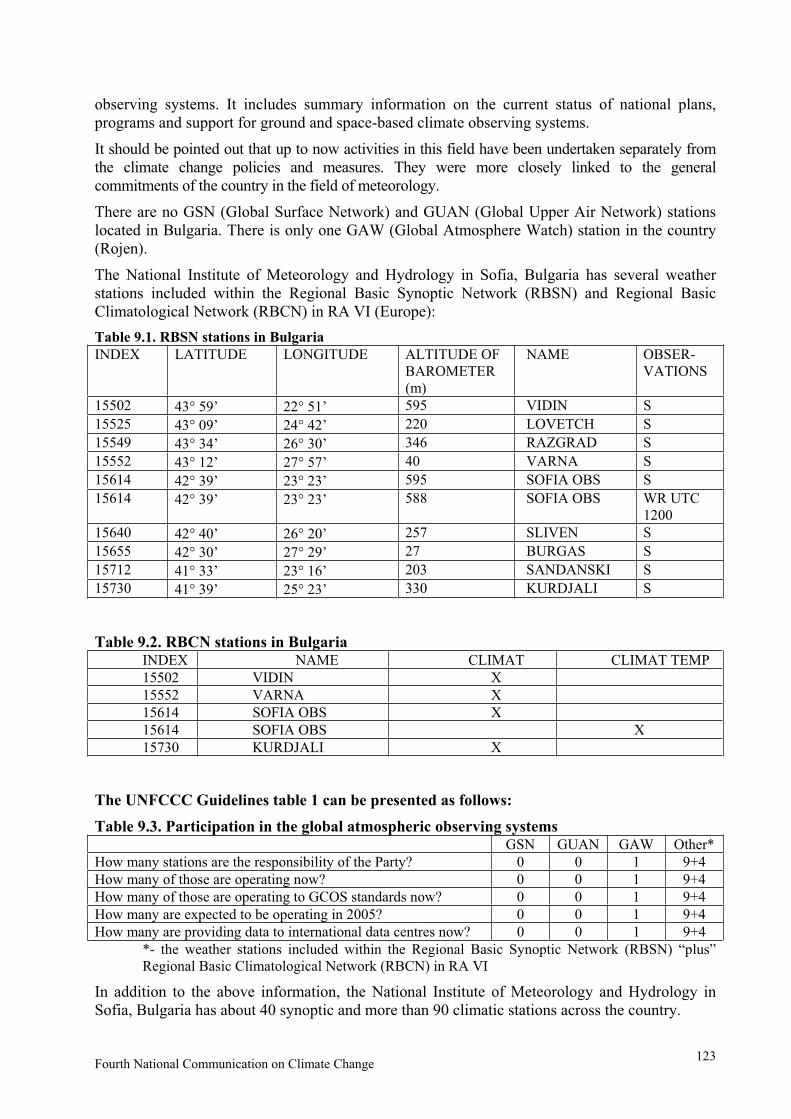
observing systems. It includes summary information on the current status of national plans, programs and support for ground and space-based climate observing systems.
It should be pointed out that up to now activities in this field have been undertaken separately fromthe climate change policies and measures. They were more closely linked to the generalcommitments of the country in the field of meteorology.
There are no GSN (Global Surface Network) and GUAN (Global Upper Air Network) stations located in Bulgaria. There is only one GAW (Global Atmosphere Watch) station in the country(Rojen).
The National Institute of Meteorology and Hydrology in Sofia, Bulgaria has several weather stations included within the Regional Basic Synoptic Network (RBSN) and Regional Basic Climatological Network (RBCN) in RA VI (Europe):
Table 9.1. RBSN stations in Bulgaria
INDEX LATITUDE LONGITUDE ALTITUDE OFBAROMETER(m)
NAME OBSER-VATIONS
15502 43 59’ 22 51’ 595 VIDIN S
15525 43 09’ 24 42’ 220 LOVETCH S
15549 43 34’ 26 30’ 346 RAZGRAD S
15552 43 12’ 27 57’ 40 VARNA S
15614 42 39’ 23 23’ 595 SOFIA OBS S
15614 42 39’ 23 23’ 588 SOFIA OBS WR UTC 1200
15640 42 40’ 26 20’ 257 SLIVEN S
15655 42 30’ 27 29’ 27 BURGAS S
15712 41 33’ 23 16’ 203 SANDANSKI S
15730 41 39’ 25 23’ 330 KURDJALI S
Table 9.2. RBCN stations in Bulgaria INDEX NAME CLIMAT CLIMAT TEMP
15502 VIDIN X
15552 VARNA X
15614 SOFIA OBS X
15614 SOFIA OBS X
15730 KURDJALI X
The UNFCCC Guidelines table 1 can be presented as follows:
Table 9.3. Participation in the global atmospheric observing systems GSN GUAN GAW Other*
How many stations are the responsibility of the Party? 0 0 1 9+4
How many of those are operating now? 0 0 1 9+4
How many of those are operating to GCOS standards now? 0 0 1 9+4
How many are expected to be operating in 2005? 0 0 1 9+4
How many are providing data to international data centres now? 0 0 1 9+4
*- the weather stations included within the Regional Basic Synoptic Network (RBSN) “plus”Regional Basic Climatological Network (RBCN) in RA VI
In addition to the above information, the National Institute of Meteorology and Hydrology in Sofia, Bulgaria has about 40 synoptic and more than 90 climatic stations across the country.
Fourth National Communication on Climate Change123

The main problems in the field are related to the lack of financial support for moderntelecommunication system. The same problem hinders the training of experts in the fields.
Oceanographic observations
National Institute of Meteorology and Hydrology, Sofia, Bulgaria: it has Black Sea coastal stations – 10 stations measure sea temperature; 10 stations measure sea level; 3 stations measuresea water salinity.
Institute of Oceanology, (PO Box 152, BG-9000 Varna, Bulgaria): Every year it carries out complex seasonal expeditions studying physical, chemical and biological parameters of seawater and bed at the western part of Black Sea. The research ship “Academic” executes up to 4 seasonal expeditions applying a constant scheme for monitoring (at about 50 points at the western part of Black Sea). The profiles of sea temperature and salinity, oxygen, phosphates, nitrates, nitrites, zooplanktons and fauna are measured. Weather observations are done at every location of interest: air temperature, sea level pressure, wind speed and direction. The institute iscurrently trying to recover and improve some oceanographic systems for observations such as VOS (Volunteer Observing Ship) and TIDE GAUGES as well as to include them within international programmers.
The Table 2 from the UNFCCC Guidelines can be presented as follows:
Table 9.4. UNFCCC table 2. Participation in the global oceanographic observing systems
Platforms VOS SOOPTIDEGAU-GES
SFCDRIF-TERS
SUB-SFCFLOATS
MOO-REDBUOYS
ASAP
For how many platforms is the Party responsible?
0 0 4 0 0 0 0
How many are providingdata to international datacentres?
0 0 0 0 0 0 0
How many are expected to be operating in 2005?
0 0 4 0 0 0 0
Legend to the table:VOS - Volunteer Observing ShipSOOP - Ship of Opportunity ProgrammeSFC DRIFTERS - Surface DriftersSUB-SFC FLOATS- Sub-surface floats ASAP - Automated Shipboard Aerological Programme
Institute of Oceanology, Varna, Bulgaria: the 4 stations measuring the Black Sea level are equipped with seagraphes and data are stored on paper. It does not allow operative data exchange.
Terrestrial observations
The National Institute of Meteorology and Hydrology in Sofia, Bulgaria has a network of 205 hydrological and 431 hydrogeological stations.
There are no carbon networks in the country.
The National Institute of Meteorology and Hydrology in Sofia, Bulgaria has a network of agrometeorogical stations observing the phenological development and stages of major crops aswell as orchards and forest trees.
Republic of Bulgaria, Ministry of Environment and Water124
The other networks monitoring land-use, land cover, land-use change and forestry are managedat the Ministry of Agriculture and Forestry.
Space-based observations
National Institute of Meteorology and Hydrology, Sofia, Bulgaria:
In 1995 Bulgaria was involved in the European space-based observing programmes on meteorology after signing an Agreement on Use of Images from the EUMETSAT Meteosat Satellites between the National Institute of Meteorology and Hydrology (NIMH) and EUMETSAT, the European Organisation for the Exploitation of Meteorological Satellites.
High Resolution Image (HRI) data from Meteosat-7 in three channels (0,5-0,9 µm, 5,7-7,1 µm10,5-12,5 µm) are processed and utilized for operational and research purposes. Daily imageryanalysis is made subjectively for the purposes of short-range weather forecasting.
The observations from the three channels of Meteosat-7 are received every 30 minutes at NIMH by operating a Primary Data User Station (PDUS).
A Cooperating State Agreement between the Government of the Republic of Bulgaria and EUMETSAT was signed in 2004. Bulgaria will benefit from faster and more comprehensive data made available by EUMETSAT’s Meteosat-8 satellite, the first of EUMETSAT’s secondgeneration satellite, providing 12 channels of data and images every 15 minutes. The receiving of Meteosat-8 data at NIMH and pre-operational use of the imagery for short-range forecasting purposes has been initiated in April 2005.
Institute for Space Research:
Bulgaria is participating in space-based observing programmes by development and execution of national and international space programmes as well as development of complex research tools for:
international crews of orbital space stations including those with the first and second Bulgarian astronauts
space satellites
geophysical rockets
sub-space experiments
An important way related to participation in space-based observing programmes is development,analyses and interpretation of space satellite images.
The basic research directions in the field of space meteorology were established in 1967 by the space programme “INTERCOSMOS”. The first satellite pictures of the Earth were delivered at the Geophysical Institute in Sofia applying Bulgarian installations. At that time the spacemeteorology was established in the country. In the framework of this activity meteorologistsdeveloped and improve the methods for interpretation of cloud images obtained by meteorological satellites. Bulgarian scientists created the first morphological systematics of cloud vortexes over the Mediterranean. The book “Mediterranean cyclones in the field of cloudiness” was written by Bulgarian, Hungarian, Romanian and Russian researchers.
By a model, developed by Bulgarian scientists, important results related to the impact of inhomogeneous Earth surface on the cloud distribution were obtained. The theory and resultswere published in a book written by Bulgarian, Hungarian, German, Romanian and Russian researchers.
Studies on the statistical structure of meteorological fields in the stratosphere and mesospherewere carried out by applying rocket data. The obtained results were involved within the methodsfor analyses of meteorological fields, hydrodynamic and statistical forecasts.
Fourth National Communication on Climate Change125

In Bulgaria a method was developed for measurement of the wind velocity vector in the upper layers of the atmosphere by applying dipole reflectors cluttered from a container located in meteorological rockets. The obtained data for the wind profile at a level of 75-100 km together with the data of temperature, pressure and density allow to investigate the global atmospherecirculation in the stratosphere and mesosphere.
Bulgaria utilizes observations from satellites: satellite images with very high (IKONOS,QuickBird, EROS) high (IRS, SPOT) and moderate (Landsat, ASTER) space resolution are used. The satellite images are used for research and scientific experiments as well as an basic source of information under development of geoinformation systems.
Bulgaria is an active participant at the investigation of the Earth surface by aero-space tools. The country has its own contribution (project teams from the Institute for Space Research and someother space laboratories in the country) to utilization of spectral-reflector characteristics of various natural forms. Bulgarian specialists created a catalogue of the major soil types in thecountry. Since 1989 Bulgarian scientists have participated during two stages of an international project “Earth cover” by using satellite data.
The satellite images are received by: participation of various national and international projectsand programmes (e.g. CD, DVD); Internet (e.g. FTP servers); purchase (e.g. CD, DVD).
The space studies are expensive activities and are possible only under the framework of a wide international collaboration. So far, Bulgaria participated in different space projects together withRussia, USA, EU countries, etc. At the institute project experience exists in the following fields: space physics, remote sensing methods for investigation of the Earth and planets; space biotechnology; etc.
Other ways for participation in space-based programmes are:
to organize and participate at national and international workshops, symposia and conferences;
to develop a project related to a micro-satellite BALKANSAT for ecological monitoring and education of students.
Republic of Bulgaria, Ministry of Environment and Water126

10 ANNEX
GHG INVENTORY
2003
Common Reporting Format
Summary Tables and Trends
Fourth National Communication on Climate Change127

Rep
ubli
c of
Bulg
aria
, M
inis
try o
f E
nv
iron
men
t an
dW
ater
128

Fourt
h N
atio
nal
Com
munic
atio
n o
n C
lim
ate
Chan
ge
129

Rep
ubli
c of
Bulg
aria
, M
inis
try o
f E
nv
iron
men
t an
dW
ater
130

Fourth National Communication on Climate Change131
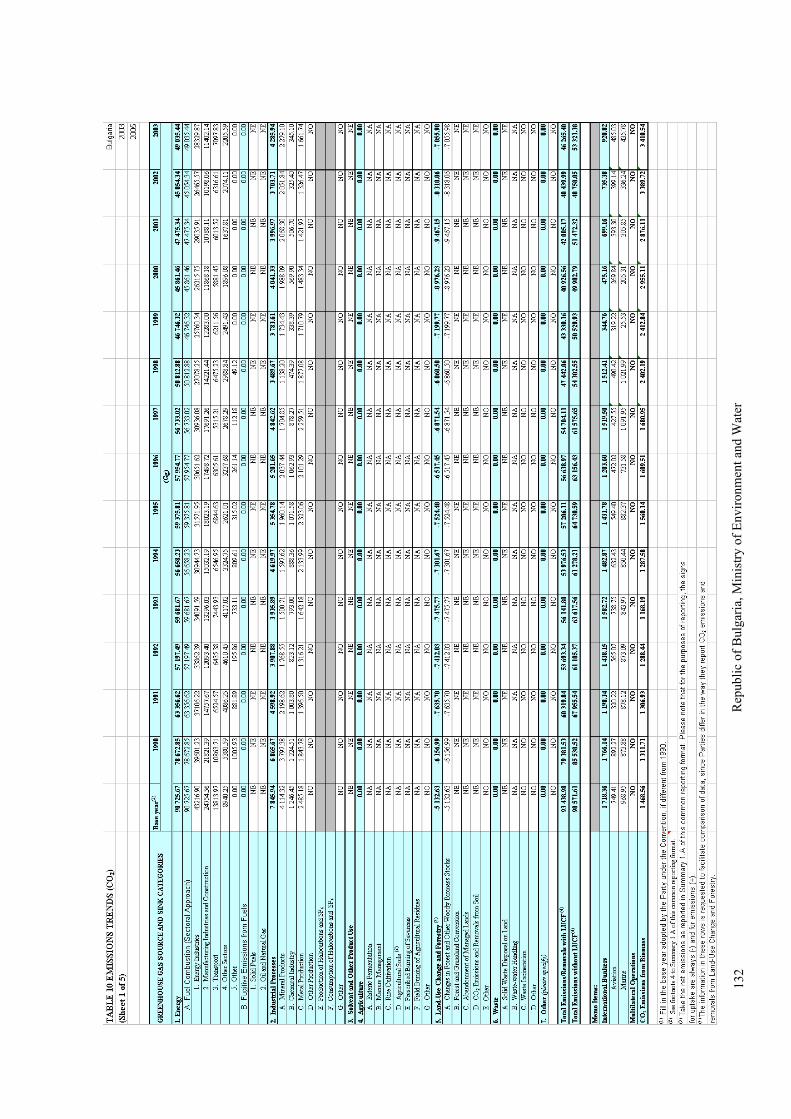
Rep
ubli
c of
Bulg
aria
, M
inis
try o
f E
nv
iron
men
t an
dW
ater
132

Fourt
h N
atio
nal
Com
munic
atio
n o
n C
lim
ate
Chan
ge
133

Rep
ubli
c of
Bulg
aria
, M
inis
try o
f E
nv
iron
men
t an
dW
ater
134

Fourt
h N
atio
nal
Com
munic
atio
n o
n C
lim
ate
Chan
ge
135

Rep
ubli
c of
Bulg
aria
, M
inis
try o
f E
nv
iron
men
t an
dW
ater
136

FOR FURTHER INFORMATION PLEASE CONTACT:
Ministry of Environment and Water
67, William Gladstone Str.
1000 Sofia
Bulgaria
Daniela Stoytcheva
Phone: +359 2 940 61 35
E-mail: [email protected]
REPUBLIC OF BULGARIA
FOURTH NATIONAL COMMUNICATION ON CLIMATE CHANGE
Elaborated by the Ministry of Environment and Water
By assignment to the Energy Institute JSC
Contributors:Christo Christov, Hristo Vassilev, Violeta Hristova, Boian Neshev, Vesselin Alexandrov, Paskal Jelev, Kiril Tagarov, Daniela Petkova, Luben Boyanov, Liuba Hristova
Fourth National Communication on Climate Change137