ESTONIA`S FOURTH NATIONAL COMMUNICATION
85
ESTONIA`S FOURTH NATIONAL COMMUNICATION 1
Transcript of ESTONIA`S FOURTH NATIONAL COMMUNICATION

ESTONIA`S FOURTH NATIONAL COMMUNICATION
1

ESTONIA`S FOURTH NATIONAL
COMMUNICATION
Under the UN Framework Convention on Climate Change
Estonia, November 2005
2

LIST OF IMPLEMENTERS
Jaan-Mati Punning Tallinn University, Institute of Ecology, team leader Jaanus Terasmaa Tallinn University, Institute of Ecology, project co-ordinatorTiiu Koff Tallinn University, Institute of EcologyAre Kont Tallinn University, Institute of Ecology Mart Landsberg Tallinn Technical University, Department of Electrical Power Engineering Olev Liik Tallinn Technical University, Department of Electrical Power EngineeringAnts Martins Tallinn Technical University, Faculty of SciencesMargus Pensa Tallinn University, Institute of EcologyInge Roos Tallinn Technical University, Department of Thermal EngineeringSulev Soosaar Tallinn Technical University, Department of Thermal Engineering Kristel Uetallo FKSM KE Ltd , PärnuTiit Vaasma Tallinn University, Institute of Ecology
Photos: Uudo Timm and Diana Kuusik, Estonian Environment Information Centre
FOR FUTHER INFORMATION PLEASE CONTACT:
Ministry of the Environment
Narva mnt 7a15172 Tallinn, EstoniaPhone: +372 62 62 802 Fax: +372 62 62 801e-mail: [email protected]
Institute of Ecology, Tallinn University
Suur-Sadama 510120 Tallinn, Estonia
3

TABLE OF CONTENTS
ABBREVIATIONS
1. EXECUTIVE SUMMARY OF THE FOURTH ESTONIA`S NATIONAL COMMUNICATION FOR THE UNFCCC
1.1. Introduction1.2. National circumstances1.3. Emission inventories
1.3.1. CO2 emission1.3.2. CO2 removals1.3.3. CH4 emissions1.3.4. N2O emissions1.3.5. Other gases1.3.6. Aggregated emissions of GHG
1.4. Greenhouse gas emission mitigation measures1.5. Emission projections1.6. Vulnerability analysis and adaptation strategy1.7. Research, education and public awareness
2. NATIONAL CIRCUMSTANCES2.1. Background and institutional arrangement2.2. Geographic, climatic and demographic profiles2.3. Natural resources and land use2.4. Economic profile 2.4.1. General 2.4.2. Economic indicators 2.4.3. Tax system2.5. Energy and industry profile 2.5.1. Energy profile 2.5.2. Transport
3. INVENTORIES OF ANTHROPOGENIC EMISSIONS AND REMOVALS OF GREENHOUSE GASES
3.1. Introduction3.2. Trends of Estonia’s greenhouse gas emissions3.3. Methodology and uncertainties
3.3.1 Uncertainties3.3.2. Fuel combustion - general method3.3.3. GHG Emissions from Mobile Sources3.3.4. Feedstock’s and Non-Energy Use of Fuels3.3.5. Burning Traditional Biomass Fuels3.3.6. International Bunkers and Multilateral Operations3.3.7. Industrial Processes3.3.8. Agriculture3.3.9. Waste3.3.10. Forestry
3.4. CO2 emissions and removals3.4.1. Energy3.4.2 Transport sector3.4.3. Industrial Processes3.4.4. GHG budget in land use sectors
3.5. CH4 emissions3.5.1. Energy3.5.2. Agriculture3.5.3. Waste management
4

3.6. N2O emissions3.7. HFCs, PFCs and SF6 emissions3.8. Indirect GHG and SO2 emissions3.9. Aggregated emissions of GHG ANNEXES OF PART 3
4. POLICIES AND MEASURES
4.1. Institutional and legislative framework4.2. International agreements and conventions, EU legislation4.3. Strategic documents and programmes
4.3.1. National Environmental Strategy4.3.2. Long-term National Development Plan for the Fuel and Energy Sector4.3.3. National Programme to reduce the emission of GHG4.3.4. Joint Implementation4.3.5. National allocation plan for GHG emission allowances4.3.6. Other strategy documents and programmes
4.4. New national legislation4.5. Fiscal measures4.6. Environmental monitoring and supervision4.7. Overview by sector
4.7.1. Energy sector4.7.2. Transport4.7.3. Industry4.7.4. Agriculture4.7.5. Forestry4.7.6. Waste management
5. PROJECTIONS AND EFFECTS OF POLICIES AND MEASURES
5.1. Methodology5.1.1. MARKAL model features
5.2. Basic considerations5.2.1. Forecast of main energy indicators5.2.2. Basic modelling assumptions
5.3. Energy related CO2 emission scenarios5.3.1. With measures (WM) scenario5.3.2. With additional measures (WAM) scenario5.3.3. Without measures (WOM) scenario5.3.4. Comments on results5.3.5. Conclusions
5.4. Forestry5.5. Agriculture
5.5.1. Projections of GHG from agriculture 5.6. References
6. EXPECTED IMPACTS OF CLIMATE CHANGE AND VULNERABILITY ASSESSEMENT
6.1. Climate Change6.2. Climate Scenarios6.3. Vulnerability analysis
6.3.1. Agriculture6.3.2. Forestry6.3.3. Water resources6.3.4. Coastal resources
7. EDUCATION, TRAINING AND PUBLIC AWARENESS
7.1. Introduction
5

7.2. Education7.2.1. Educational system7.2.2. Environmental education in pre-primary schools7.2.3. Environmental education in basic school and gymnasium7.2.4. Environmental education in higher schools7.2.5. Adult training
7.3. NGOs7.4. Green Energy and Estonian Fund for Nature7.5. Research7.6. Cooperation at international level
7.6.1. Joint projects with EU7.7. Cooperation at national levels
7.7.1. Cooperation between the ministries7.8. Outlook for implementation in the field of education, training and public awareness
8. REFERENCES
ANNEXES
6

Abbreviations
AAU – Assigned Amount Unit AIJ – Activities Implemented JointlyBEF – Baltic Environmental ForumBSP – Baltic Sea ProjectCAP – EU Common Agricultural PolicyCCCEQ – Canadian Climate Centre Equilibrium Model (Canada)CFBC – Circulating Fluidized Bed CombustionCRF – Common Reporting FormatCSIRO9M2 – Commonwealth Scientific and Industrial Research OrganisationDANCEE – Assistance to Eastern EuropeDH – District HeatingEAGGF – European Agricultural Guidance and Guarantee FundEC – European CommisionECHAM3TR – European Centre/Hamburg Model 3 Transient (Germany)EERC – Estonian Environmental Research CentreEIC – Environmental Investment Centre ELF – Estonian Fund for NatureEMAS – European Management and Audit SchemeEMS – Environment Management SystemERDF – European Regional Development FundERU – Emission Reduction UnitESF – European Social FundEU – European UnionFBC – Fluidized Bed CombustionGDP –Gross Domestic ProductGFDLLO – Geophysical Fluid Dynamics Laboratory Transient Model (USA)GHG – Greenhouse Gas(es)GWP – Global Warming PotentialHadCM2 – Hadley Centre Unified Model 2 Transient (UK)HFC-hydrofluorocarbonsHOB – Heat Only BoilerIPCC – Intergovernmental Panel on Climate ChangeISO – International Standardisation OrganisationJI – Joint ImplementationLFO – Light Fuel OilLPG – Liquefied Petroleum GasLULUCF – Land-Use, Land-Use Change and ForestryMAGICC – Model for the Assessment of Greenhouse-Gas Induced Climate ChangeMoA – Ministry of AgricultureMoEAC – Ministry of Economic Affairs and CommunicationsMoE – Ministry of EnvironmentNAO – North Atlantic OscillationNAP – National Allocation PlanNCSA – National Capacity Needs Self-Assessment NDP – National Development PlanNGO – Non-Governmental OrganisationNMVOC – Non-Methane Volatile Organic CompoundsNW – Naturewatch BalticODP – Ozone Depletion PotentialODS – Ozone Depleting SubstancesPFBC – Pressurized Fluidized Bed CombustionREC – Regional Environmental CentreRES – Reference Energy SystemRMK – State Forest Management CentreRT I – Riigi Teataja I (State Gazette I)RT L – Riigi Teataja L (State Gazette L)SCENGEN – (SCEN)ario (GEN)eratorSE21 – “Sustainable Estonia 21”
7

SOE – Statistical Office of EstoniaSPD – Single Programming DocumentTEEC – Tartu Environmental Education Centre TLU – Tallinn UniversityUNFCCC – United Nations Framework Convention on Climate ChangeUS – United StatesVAT – Value Added TaxWAM – With additional measuresWatBal – (Wat)er (Bal)ance WM – With measuresWOM – Without measuresWWF – World Wide Fund
8

1. EXECUTIVE SUMMARY OF THE FOURTH ESTONIA`S NATIONAL COMMUNICATION FOR THE UNFCCC
9

1.1. Introduction
Estonia signed the Framework Convention on Climate Change at the United Nations Conference on Environment and Development held in Rio de Janeiro in June 1992. In 1994 Estonia ratified the UN FCCC and in 2002, the Kyoto Protocol. Under the Protocol Estonia is obliged to reduce during the period 2008-1012 the emissions of air polluting greenhouse gases from its territory by 8% as compared with the 1990 level.
In response to UNFCCC requirements Estonia has prepared since 1994 every year National Inventory Reports and three National Communications. The current Fourth National Communication covers the GHG inventories of the years 1990 to 2003 including also the years for which inventories have been reported earlier but have now been recalculated. The purpose of all recalculations was to improve the accuracy and completeness. Now, the inventory of all years is estimated using the same methodology, adjusted statistical data and emission factors.
The general trends in the emissions and sinks are obvious. In 2003 the net emission in GWP units was only 22% of that in 1990 and the decreasing trend is continuing. The sink comprises from total emissions in CO2 equivalents about 30%. The favourable trends are mainly due to the restructuring of economy but also political measures. In 1994, when the first National Inventory Report was completed, Estonia belonged to the group of the world’s greatest emitters of GHG per inhabitant, but in 2003 we are already quite close to the average level. The reliability of our initial data has improved, legislation and surveillance have greatly developed and we can be sure that Estonia is capable of achieving the 8% reduction of GHG emissions as compared to the 1990 level by the year 2012 envisaged in the Kyoto Protocol.
1.2. National circumstances
Estonia is situated in the north-western part of the flat East-European Plain, remaining entirely within the drainage area of the Baltic Sea. It lies between latitudes 57o30`N and 59o49`N and 21o46`E and 28o13`E. To the west and north it has a long coastline on the Baltic Sea which is characterized by numerous bays, peninsulas, and straits between islands. The total area of Estonia is 45 227 km2, including 42 692 km2 of land area. More than a half of the land area is forestland, one-third is agricultural land, about 8% is under settlements and infrastructure, and remaining is covered by shrublands and peatlands (mires and bogs).
Estonia belongs to the Atlantic continental region of the temperate zone. The mean annual temperature at the westernmost point is 6.0 °C and at the most easterly point it is from 4.2 to 4.5 °C. These differences can be observed because Estonia’s territory lies in a transitional belt with the maritime type of climate in the West Estonian archipelago and the continental one in eastern Estonia. The climate of Estonia is humid because precipitation exceeds evapotranspiration. Nevertheless, there are often droughts during the summer period. The mean annual precipitation ranges from 550 to 750 mm. The mean annual total solar radiation in Estonia is 1300 – 1400 W/m2. Due to a very intense cyclonic activity in Northern Europe, the mean wind speed is comparatively high – 5–7 m/s – in the coastal zone.
Estonia is one of the smallest and least populated countries in Europe – its total population accordingly to the 2000 Population Census was 1.44 million inhabitants and 1.361 million as of 1 January 2002. The population density in Estonia is very low compared to the EU: the average
10

population density is 31.3 persons per km2, while the rural population density is 10.4 persons per km2.
Estonia is quite rich in renewable resources. Today 47.3% of the country (approximately 2.14 million ha) is covered by forest. During the past half-century the area of forest stands has nearly doubled and the growing stock on it has increased 2.7 times. In the early 1990s the area of forest increased rapidly mainly due to the abandonment of agricultural land.
The Estonian economy experienced a sharp and deep reduction in GDP in the early years of transition. The downward trend in economic activity stopped in 1995. In the recent years the GDP growth has been rapid. So in 2002 it was outstandingly fast (7.2%) and in 2003 a little lower (5.1%). Private consumption was favoured on the one hand by the historically low rise of consumer prices and hence the highest rise of real wages in recent years, on the other hand by persistently falling interest rates on loans and deposits.
1.3. Emission inventories
The energy sector is the main industrial sector in Estonia. In 2003, the share of domestic fuels – oil shale, wood and peat – accounted for 73% of the primary energy resources. Imported fuels (natural gas, fuel oils, coal, motor fuels) made up only 27% of the fuels utilised in 2003. The share of renewable energy sources reached 10.5%, wood fuels formed the major part of it, the proportion of other sources remained on the level of 0.1%. From the energy of primary fuels about 43% was used for electricity production, 24% for heat production, 15% for the production of secondary fuels (i.e. shale oil), 2% as raw material in industry and 16% for immediate final consumption. The heat production remained on the same level during 1999–2003. Mainly oil shale and natural gases were used in the production of heat. During the last years the share of oil shale in heat production has decreased, at the same time the share of natural gas has increased.
1.3.1. CO2 emission
Approximately 90% of Estonia’s energy is produced through the combustion of fossil fuels. The remaining 10 per cent comes from renewable, such as biomass, hydropower, and wind. In 2003, Estonia emitted 18830 Gg of carbon dioxide from fossil fuel combustion, what corresponds to 98% of the total CO2 emissions. Estonia satisfies most of its energy demand and approximately 62% of CO2 emissions from combustion of oil shale the remaining 38% come from natural gas (13%), motor fuels (gasoline and diesel oil, 11%), renewables (mainly wood, 10%), fuel oils (light fuel oil, heavy fuel oil and shale oil, 3%) and other fuels (coal, coke, 1%) (Figure 1.3.1).
11

Figure 1.3.1. CO2 emissions by energy sources, 2003.
Oil Shale72%
Fuel oils5%
Natural Gas 8%
Motor fuels12%
Peat2%
Others1%
The transport sector is the second largest source of carbon dioxide in Estonia and road transport is responsible for 90% of CO2 emissions in the transport sector. In the period 1990-2003 the number of passenger cars increased significantly. At the same time the consumption of motor fuels in the transport sector decreased from 37.1 PJ in 1990 to 30.2 PJ in 2003 due to the increasing share of new and more economical vehicles. Considerable decrease of CO2 emissions in the industrial sector since 1992 was caused by the reduction of cement and lime production in mid 90ies. From 1998 onwards the production amounts of minerals have been growing, particularly in cement industry, which is characterised also by increased CO2 emissions.
1.3.2. CO2 removals
Since 1990 considerable changes have occurred in Estonian forestry sector. The area of forestland has steadily increased from 1,856,800 ha in 1990 to 2,267,300 ha in 2003; total cutting from 3,200,000 m3 to 7,811,000 m3; and total biomass increment from 9,103,400 m3 to 12,254,000 m3. These changes have affected the removals and emissions of CO2 by forests. The increase in total cutting has caused higher CO2 emissions in 2003 as compared with 1990. The increase in CO2 emissions due to more extensive cuttings has partly been mitigated by greater growing stock increment in the second half of the period. Thus, net removals of CO2 have steadily increased (Figure 1.3.2).
12

Figure 1.3.2. Net CO2 removals by forests, Gg.-10000
-9000
-8000
-7000
-6000
-5000
-40001990 1991 1992 1993 1994 1995 1996 1997 1998 1999 2000 2001 2002 2003
CO
2, G
g
1.3.3. CH4 emissions
Methane comprises about 9 per cent of the total Estonia’s greenhouse gases (2003). In Estonia, the major sources of methane are energy, agriculture and waste management sectors (Figure 1.3.3).
Figure 1.3.3. Methane emissions by main sources, Gg.
0
30
60
90
120
150
180
210
1990
1991
1992
1993
1994
1995
1996
1997
1998
1999
2000
2001
2002
2003
WasteAgriculture Energy
13

The main sources of CH4 emissions in Estonia is energy sector, including fugitive emissions from oil shale mining, fuel handling and transport, enteric fermentation and waste manegement. Methane emission from enteric fermentation forms about 75% of total CH4 emission from agriculture. The waste management gave ca 50% from the total methane emission.
1.3.4. N2O emissions
In Estonia, nitrous oxide emissions contribute about 2.1 per cent to the Estonia’s total greenhouse gas emissions. The main activities producing Estonia's emissions of N2O are soil management and fertilizers used in agriculture, but also fossil fuel combustion (see Table 1.3.1).
Table 1.3.1. Estonia's sources of nitrous oxide emissions, Gg
1.3.5. Other gases
We do not have today a data collection system in Estonia needed for the emission calculations of fluorinated gases. The Ozone and Climate Unit at the Estonian Environmental Research Centre (EERC) has in the course of building up its ODS (ozone depleting substances) data bases also included HCFs whenever information was available but there are still major gaps in the collected data on fluorinated gases.
The emissions of the so called indirect GHG like NOx, CO and NMVOC during the reporting period have been constant, but on average the total amount of emissions has decreased twice since 1990.
1.3.6. Aggregated emissions of GHG
The Estonia’s total anthropogenic greenhouse gas emissions in 2003 were 21.387 Gg of carbon dioxide equivalents (without LULUCF) which is about 51% under the 1990 level (43.494 Gig respectively)
1990 1991 1992 1993 1994 1995 1996 1997 1998 1999 2000 2001 2002 2003Fuel Combustion 0.15 0.15 0.11 0.09 0.11 0.14 0.16 0.16 0.14 0.13 0.13 0.13 0.14 0.14
Agriculture 3.15 3.09 2.53 1.61 1.41 1.19 1.09 1.20 1.25 1.02 1.21 1.04 0.88 0.86
Total Emissions 3.30 3.23 2.63 1.70 1.53 1.32 1.25 1.37 1.39 1.16 1.34 1.17 1.01 1.01
14

Figure 1.3.4. Contribution of net GHG emission by sectors, Gg CO2 eq.
2 44
0
732
614
-6 3
17
1 60
8
38 8
29
-8 7
17
733
276
19 6
45
-10 000
0
10 000
20 000
30 000
40 000
Energy Agriculture Waste IndustrialProcesses
Land-UseChange and
Forestry
1990 2003
1.4. Greenhouse gas emission mitigation measures
During the short period elapsed since Estonia regained its independence, a great progress has been made in developing the legislation. Estonian legal acts were amended in the process of integration with the European Union, and today Estonian legislation, including legislation on environmental management, is almost fully harmonized with the acquis communautaire of the EU.
Estonia signed the Kyoto Protocol to the United Nations Framework Convention on Climate Change on 3 December 1998, the Protocol was ratified by the Estonian Parliament on 3 September 2002 (RT II 2002, 26, 111). According to the Protocol, during 2008 – 2012 Estonia has to reduce the GHG emissions by 8% in comparison with the 1990 level. A new division has been formed in the Information Centre of the MoE – Climate and Ozone Bureau, what will be responsible authority in the EU Emissions Trading Scheme implementation in Estonia.
In April 2004 the Government approved the National Program of Greenhouse Gas Emission Reduction for 2003-2012 (RT L 2004, 59, 990). The main goal of the Program is to ensure the meeting of targets set by the UN FCCC and the Kyoto Protocol. A special attention has been given to strategy, structure and costs of GHG emission trading and joint implementation projects. The long-term objective of the National Program is reduction of greenhouse gas emissions by 21% by 2010 as compared with the 1999 emission level. This would include reduction of carbon dioxide emissions by 20%, reduction of methane emissions by 28%, and increase of nitrogen dioxide emissions by 9%.
The Energy Conservation Programme (together with the Operational Programme for the Conservation Programme 2001–2005) approved by the Government in 2000, has the general goal to support the competitiveness of economy through increased energy efficiency; the
15

quantitative objective is to keep the growth rate of energy consumption at the level of 50% of the economic (GDP) growth rate.
The Transport Development Plan for 1999–2006 was adopted by the Government in 1999. As to environment, there was set the goal of slowing down the growth of absolute amounts of the total emission from transport sector. At present, the preparation process of the National Transport Development Plan for 2005–2010 is in progress.
In 1997 the Parliament (Riigikogu) approved the Estonian Forest Policy (RT I 1997, 47, 768) that regulates the forestry sector, which is the main GHG sink in Estonia. In November 2002 the Parliament approved the Estonian Forestry Development Plan up to 2010 (RT I 2002, 95, 552). The development plan attaches importance to forests in Estonian society, and plans the use and protection of forests in accordance with the principles of sustainable management. The Plan provides annual maximal felling allowance values, which to some extent can be modified on an as needed basis.
The National Waste Management Plan (RT I 2002, 104, 609) is an important strategic document organizing waste management and providing guidance at national level. The Plan constitutes a part of Estonia’s environmental policy and it is closely connected with the National Environmental Action Plan. The Plan provides for systematic waste management, uniform goals for the state as a whole, establishes objectives and tasks for counties, local governments, businesses and for population.
Estonian Strategy on Sustainable Development – Sustainable Estonia 21 as an alternative national development plan covering the issues of economy, culture and the environment, was elaborated in 2001-2003. The Strategy is based on the principles of Agenda 21 and the EU Strategy for Sustainable Development. It aims at creating an integral vision of Estonian long-term development to support integration of different policies and to co-ordinate implementation of development plans of different sectors. With regard to the international cooperation in integration of environment into other policies, Estonia has started to implement the action programme for sustainable development adopted by all Baltic Sea countries in the framework of Agenda 21 for the Baltic Sea region.
As a Member State, Estonia has to meet the EU requirements (Directive 2003/96/EC) for taxation of fuels and energy. Nevertheless, Estonia was granted some transitional periods for introduction of taxation. Regarding the major source of the CO2 in Estonia – the oil shale, the Directive 2004/74/EC stipulates that Estonia may apply a total exemption from taxation of oil shale until 1 January 2009.
Regarding pollution, the most important part of the energy sector is the combustion of oil shale, as approximately 70% of atmospheric pollution, 80% of effluents and 80% of solid waste are connected with the oil shale power industry. Introduction of new combustion technology allows reducing emissions from oil shale firing power plants. Heat supply, particularly district heating, is the next important sector where there is a large potential for increasing energy efficiency, which in turn results in lower emissions. Deployment of renewable energy sources, especially biomass and wind, will have an increasing role of mitigating impact of energy sector on environment in Estonia. By 2010 the share of renewable electricity is planned to reach the level of at least 5.1% of the gross consumption. The potential of Estonian renewable energy is primarily in the wind power and combined heat and power production based on biofuel; at the same time also small-scale hydropower industry can be developed.
16

Forest harvesting volumes have to be planned considering forest biomass increment. Based on the Act on Sustainable Development (RT I 1995, 31, 384) the Government has to set the limit to forest use so that natural balance and forest reproduction, following protective harvesting regimes and preservation of species and landscape diversity would be secured. To secure continuous carbon dioxide sink by forests, the annual harvesting volume should be at least 1–2 million cubic meters smaller than the current increment. In that case annual sink by forests would be approximately 2000 Gg CO2.
Although agriculture has traditionally been one of the most important sectors of economy in Estonia, its importance has been continuously decreasing after Estonia regained its independence. The emissions of CH4 and N2O from agriculture have fallen during the last ten years by about 60–70%. For preparing the agricultural sectors and rural areas of candidate countries for accession to the European Union, the programme SAPARD was used. It was approved according to the Rural Development Plan 2004-2006 drawn up under the EU Resolution 1268/1999/EC. This development plan is very important from the aspect of the abatement of greenhouse gas emissions because investments made in the framework of the SAPARD programme were envisaged basically for increasing production efficiency and solving problems of sustainable development in the agricultural sector. The objective of all political and other measures is to raise the production efficiency by means of introducing new technologies.
1.5. Emission projections
The analysis of emission projections has been carried out using the Estonian MARKAL model. The following basic assumptions were made in all scenarios:
1. Electricity and biomass imports and nuclear plants are restricted.2. Electricity net export is allowed until 2015.3. Price of natural gas will increase rapidly to the European level.4. GDP forecast is based on the actual value of 2000 GDP at market prices, actual growth
in 2001 and 2002, and the annual growth bases on the forecast of the Ministry of Finance of Estonia until 2030.
5. All scenarios use low energy consumption forecast. Heat consumption is assumed to be stable over the planning period, but electricity consumption is forecast to increase.
6. The planning period is 2000-2030 and the discount factor is 0.05.7. The number of population remains stable around 1.4 million over the planning period.
The forecasts of tax-free production and import prices (without inflation) of the main fuels for MARKAL modelling were the following:
• The oil shale price 14.2 EEK/GJ=0.91 EUR/GJ will remain constant until 2020 and then it will rise to the level of 18 EEK/GJ. The import price of coal will be stable on the level of 25 EEK/GJ=1.6 EUR/GJ.
• The production price of peat is assumed to grow from 20 EEK/GJ to 30 EEK/GJ and the price of wood fuel from 13 EEK/GJ to 30 EEK/GJ during 2000-2030.
• It is assumed that Estonia’s joining the EU brings rapidly about the same price levels and its growth predictions for natural gas and oil products. It means the growth of the heavy fuel oil price from 50 EEK/GJ=3.2 EUR/GJ in 2000 to 170 EEK/GJ = 10.9 EUR/GJ in 2030 and the growth of the natural gas price from 35 EEK/GJ = 2.24 EUR/GJ to 125 EEK/GJ = 8 EUR/GJ during the same period.
17

The following scenarios were compiled:With measures (WM) scenario. In this scenario approved or already decided policy measures are as described in “Policy and Measures”. The following basic assumptions were considered in the scenario: starting from 2008 our power plants have to comply with the EU directive on the limitation of emissions into the air from large combustion plants, Estonia will fulfil requirements on emission reductions and introduction of renewables and environmental taxes continue to increase 20% annually and they will reach the European forecast values at the end of the planning period.
With additional measures (WAM) scenario. In this scenario approved or already decided policy measures are as described in “National Programme for the Reduction of GHG Emissions”. The following basic assumptions were made is that the long-term objective of the National Programme is reduction of greenhouse gas emissions by 21% by 2010 as compared with the 1999 emission level. This includes reduction of carbon dioxide emissions by 20%, reduction of methane emissions by 28%, and increase of nitrogen dioxide emissions by 9%.
Two subscenarios were compiled: WAM-LEVEL1--reduction of CO2 emissions by 1% during 2010-2030 compared to the 2010 level and WAM-LEVEL2 – gradual reduction of CO2
emissions by 15% during 2010-2030 compared to the 2010 level in WM scenario.
Without measures (WOM) scenario where all measures described in were excluded.
The main findings are as follows:• Estonian CO2 emissions will never climb up to the Kyoto limit under any scenario.
There is no need to buy emission permits in the future.• Main driving factors for CO2 reduction are the improvement of conversion efficiency
of fossil technologies, and increase in the share of CHP and renewables.• Total capacity of CHP plants will increase quite rapidly giving the main future
solution for heat production as well. This tendency is common in all scenarios. The CHP potential will be used fully at the end of the planning period in all scenarios, only market shares of different fuels will differ by scenarios.
• Future solutions in the Estonian energy system are very sensitive to the price of natural gas. The security of Russian gas supply is an extremely important factor as well.
• In the scenarios WAM, the more rigid CO2 emission limits compared with the WM scenario will be met to a great extent by larger use of natural gas in high efficiency condensing power plants. Use of oil shale in electricity generation will decrease, but the PFBC technology is a considerable option starting from 2015. This shows that it is important to continue the research of pressurized fluidized bed combustion of oil shale.
The development plan of forestry states three basic principles that may affect the emissions of GHG in the forestry sector: forest land area cannot decline below the current level (i.e., approximately 50% of Estonian terrestrial area); the annual harvesting volume should not exceed the annual increment (it is suggested that optimal volume of annual harvesting should be 12.6 million m3); afforestation of abandoned agricultural lands and mining areas.
For estimating changes in GHG emissions in agriculture sector different scenarios were drawn up on the basis of long-term forecasts obtained from the Ministry of Agriculture (MoA) and the
18

Ministry of the Environment (MoE) and acccording to the National Programme of Greenhouse Gas Emission Reduction for 2003-2012 (RT L 2004, 59, 990), it can be assumed that Estonian agriculture will reach the level of other EU member states with regard of all indicators. The aggregate GHG emissions from the agricultural sector would increase by the year 2020 to up to 60% of the 1990 level.
1.6. Vulnerability analysis and adaptation strategy
Climate change scenarios for the 21st century were constructed following the methodology recommended for regional climate change impact studies. Air temperature and precipitation projections were compiled using a climate model – Model for the Assessment of Greenhouse-Gas Induced Climate Change (MAGICC) and a regional climate change database – (SCEN)ario (GEN)erator (SCENGEN). The baseline climate was defined as that prevailing between 1961 and 1990. Climate change scenarios were created for the years 2050 and 2100.
For the analysis of the effect of various climate change scenarios on the national grain yield, changes in barley productivity were estimated by aggregating the results on the tested soils and presenting as weighted mean values over the whole cultivated area of Estonia. It may be concluded that despite the small territory of Estonia, the soil and climate conditions are extremely variable, affecting strongly plant growth. As the modelling results show, temperature rise would decrease the crop yields everywhere in Estonia. Most vulnerable would be the cultivated areas on dry sandy soils. The fields on gleyic and gleyed soils would be less affected. However, the yields on these soils are so low (1.42-3.20 t/ha) and unstable that cultivation of barley is not profitable at all.
Earlier experiments using biophysical models for the productivity of various crops have shown that the effect of climate warming is more favourable on herbage cultivation than on cereals. Climate warming would make the potato yield very unstable. It may fall on unfertile and overmoist soils. Unlike herbage, the soil and climatic preconditions are relatively unfavourable for potato cultivation in western Estonia.
The climate change scenarios with respect to forest resources reflected obvious trends: a decrease in the snow pack duration and earlier snowmelt with increasing climate warming. The reduced influence of snowmelt on stream discharge would increase the synchronization between precipitation and stream discharge. Soils would become slightly drier during the growing season and, coupled with decreased spring and summer precipitation, increase drought stress. This could increase the forest fire potential, which could, in turn, accelerate species migration.
All climate scenarios predicted a significant increase in river runoff during autumn caused by increased precipitation. In the western part of Estonia, the runoff maximum in autumn (November) was expected to exceed the spring maximum. In eastern Estonia, typical snow cover conditions would remain but the duration of winter and its stability would decrease. As a consequence of the earlier spring runoff maximum, the minimum runoff in summer would also start earlier, in May rather than June. A certain pattern is influenced by local conditions, first of all by the character of the spring runoff peak of the rivers. The results of the water resources vulnerability assessment showed a strong dependence on regional changes in runoff and local topography and landscape features.
19

The results of analysis of water supply and demand indicated no effect of climate change on water use in Estonia. The groundwater resources can guarantee a sufficient supply of good quality domestic water in all regions of the country. Water consumption in towns and other settlements would be independent of the quantity and quality fluctuations of rivers. Climate warming would also have a positive influence on the ecological state of water-bodies in Estonia.
Risk analysis of potential sea-level rise was carried out in seven study areas. Detailed measurements and observations have been done in three study sites on Saaremaa Island with the aim of recording the changes resulted from increased storminess over recent decades. The study sites serve different human functions and represent a variety of coastal settlements. Thus, detailed analysis of the study areas provides the means of extrapolating the results for the whole country.
A 1.0 m sea rise would change substantially the coastline contour and the number of small islands. The most significant changes would occur on the western coast, including the Matsalu Bay test area. Coastal meadows and reed beds, characteristic ecosystems of the western coast of mainland Estonia, would migrate inland, but would not perish. Nevertheless, sea-level rise would reduce species richness, because the new sites for developing seashore grasslands are currently arable lands or young species-poor forests, and many of the rare species may not survive the migration into initially unfavourable conditions. Waves during the recent strong storms approached dwellings 300 m inland. Almost 2.5 km2 of the territory of Pärnu, the largest town in this region, is located in the zone of inundation.
The greatest destruction of the coastal zone in Estonia today is associated with stormy periods. Research carried out in Estonia over the last decade shows that the absence of sea ice cover in winter fosters coastal damage. The most exceptional changes in shoreline position and contour in many coastal areas of Estonia are attributable to a combination of strong storms, high sea level and mild (ice-free) weather. Depositional coasts, particularly beaches, are most vulnerable to this combination.
1.7. Research, education and public awareness
Climate change education and outreach is key to engage all stakeholders and major groups in the development and implementation of related policies. At COP 8 (New Delhi, October/November 2002), recognizing the need to establish a country-driven work programme on Article 6 of the Convention that enhances cooperation, coordination and exchange of information among governments, intergovernmental organizations, non-governmental organizations and community-based organizations, as well as the private and public sectors, Parties adopted the “New Delhi work programme” (Decision 11/CP.8).
Estonia has followed these recommendations and in recent years provisions promoting the involvement of the general public have started to appear in the national legislation (e.g. Environmental Impact Assessment and Environmental Auditing Act (RT I 2002, 99, 579). Through synergies between the UNFCCC and other conventions the cooperation is promoted both at the national and the international level. In the Final document of the National Capacity Needs Self-Assessment for Global Environmental Management in Estonia (NCSA-Estonia, 2004) among the major actions for further capacity building it is also stated that the role of the environmental conventions should be increased in study programmes of all school levels and in continuing education programmes aimed at companies.
20

Estonia has enhanced efforts to develop and use curricula and teacher training focused on climate change as methods to integrate climate change issues at all educational levels and across the disciplines. Having the environment and sustainable development as the underlying themes in the curricula is quite a new phenomenon in our educational system and therefore teachers and heads of schools need advice and training in these matters. To meet this demand, a successful environmental education projects for schools was organized. The project aims to make students aware of changes in the environment over time and take responsibility for the environment in which they live. There are a number of other environmental projects are ongoing for schoolchildren. Internationally, GLOBE is being implemented through bilateral agreements between the US government and governments of partner nations. Beside the running projects there is a system of various types of centres whose activities include environmental training. For example the State Forest Management Centre (RMK) has 7 nature centres.
All Estonian public law universities have curricula in environmental education, devoted to sound environmental management, sustainable development, environmentally efficient power engineering, protection of the atmosphere etc. There are similar courses in the private universities. This topic is part of the curricula of the future teacher training but not in all specialities.
The environmental education is incorporated also to the activities of the 58 NGOs. Besides Friends of Earth – Estonia also the European Youth Forest Action Estonia, Estonian Geographical Society, Forest Youth, Estonian Union of Scout Supporter's Societies, Viljandi Youth Society for Nature Conservation, Estonian Ecotourism Association, Centre for Applied Ecology, Estonian Biology and Geography Teachers' Union, Estonian Environmental Women's Union, Tartu Students’ Nature Protection Circle, Society for Nature Conservation of Tallinn; Sorex etc are dealing with environmental education and climate change issues.
The Ministry of Education and Research have financed more than 54 research projects that are connected with climate studies. The spectrum of these studies is very wide the studies being connected with the atmospheric circulation processes, ionization, analyses of satellite images and climate modelling. Investigations of this kind are the main goal of the research groups from the National Institute of Hydrology and Meteorology, Tartu Observatory, Institute of Geography of the University of Tartu, Institute of Ecology at Tallinn University etc.
As a member state of the European Union, Estonia will have the opportunity to take part in the regional policy of the Community and to receive financial assistance from the EU budget. There are several Structural Funds that support the EU structural policy and that can be connected with climate change education as well.
“Sustainable Estonia 21” (SE21) is a strategy for the development of the Estonian state and society until 2030. The strategy creates the general framework for interconnecting the social, economic and environmental spheres in terms of long-term development of the society and defines the general objective of the development for Estonia as movement towards the so-called knowledge-based society.
One of the most reliable ways to bring environmental information to people is media. We have different programmes devoted to environmental issues, periodically all main newspapers publish analyses and overviews about the problems of the climate change, scientific organisations organize public discussions. Therefore EIC supported environmental broadcasts produced by three different TV programmes. From the total budget of the environmental awareness
21

subordinate programmes the media got 35%, various publications 26%, youth projects 24% and national campaigns 15%. EIC financed also the publication of the Estonian nature magazines that unites naturalists of several generations and also of different levels.
22

2. NATIONAL CIRCUMSTANCES
23

2.1. Background and institutional arrangement
Estonia signed the Framework Convention on Climate Change at the United Nations Conference on Environment and Development held in Rio de Janeiro in June 1992. In 1994 Estonia ratified the UN FCCC and in 2002, the Kyoto Protocol. Under the Protocol Estonia is obliged to reduce during the period 2008-1012 the emissions of air polluting greenhouse gases from its territory by 8% as compared with the 1990 level.
A National Programme for the Reduction of Greenhouse Gas Emissions was compiled taking into consideration the Kyoto Protocol and the European Council Decision 93/389/EC from 24 June 1993 on the monitoring of greenhouse gas emissions in the EU (EÜT L 167, 09/07/1993 p 0031-0033). On 30 April 2004 the Estonian Government approved the National Programme for the Reduction of Greenhouse Gas Emissions for the years 2003-2012.
Table 2.1.1. National programme for the reduction of greenhouse gas emissions for the years 2003-2012
GHG, CO2 eqBase year 1990/19951
Emission 1999, Gg
Emission 2005, Gg
Emission 2010, Gg
Decrease, %
1990/1999
Decrease, %
1990/2005
Decrease, %
1990/2010
Decrease, %
1999/2010CO2 31787 8664 7940 6910 -73 -75 -78 -20CH4 4362 2530 2020 1830 -42 -54 -58 -28N2O 1023 357 390 390 -65 -62 -62 9Total emission 37172 11553 10350 9130 -69 -72 -75 -21
1 The base year for the so-called new gases is 1995. As Estonia has not yet the respective registry, the new gases were not taken into account in the current programme.
In 1994 an Interministerial Committee of Climate Change was created at the Estonian Government. The Chairman of this Committee is the Minister of the Environment and members are from key ministries, scientists as well as representatives of NGOs. This Committee deals with the problems connected with the implementation of UN FCCC, organises monitoring of emissions of GHG, National Communications etc.
The Ministry of the Environment organises the practical providing of GHG inventories and compiling of National Reports. Financial resources for this purpose are planned in the State Budget. Practical work has been done on the basis of contracts. The Institute of Ecology at Tallinn University is responsible for the inventories and National Communications. In conducting inventories as well as in compiling National Communications numerous leading specialists from Tallinn Technical University, University of Tartu, Estonian University of Agricultural Sciences, NGOs etc. are involved The Institute of Ecology informs regularly the Ministry of the Environment as well as the Interministerial Committee about advances and problems.
In response to UNFCCC requirements Estonia has prepared since 1994 every year National Inventory Reports and three National Communications. The Third National Communication covers the GHG inventories of the years 1990 to 1999 including also the years for which
24

inventories have been reported earlier but have now been recalculated. The purpose of all recalculations was to improve the accuracy and completeness. Now, the inventory of all years is estimated using the same methodology, adjusted statistical data and emission factors.
The general trends in the emissions and sinks are obvious. In 2003 the net emission in GWP units was only 22% of that in 1990 and the decreasing trend is continuing. The sink comprises from total emissions in CO2 equivalents about 30%. The favourable trends are mainly due to the restructuring of economy but also political measures. In 1994, when the first National Inventory Report was completed, Estonia still belonged to the group of the world’s greatest emitters of GHG per inhabitant, but in 2005 we are already quite close to the average level. The reliability of our initial data has improved, legislation and surveillance have greatly developed and we can be sure that Estonia is capable of achieving the 8% reduction of GHG emissions as compared to the 1990 level by the year 2012 envisaged in the Kyoto Protocol.
It is a pleasure to note that increasing GHG emissions into the atmosphere and possible global warming are becoming problems of nationwide concern. Questions connected with climate change are continuously discussed in the mass media and at conventions of different level; the necessary information is available on the home page of the Ministry of the Environment.
2.2. Geographic, climatic and demographic profiles
Estonia is situated in the north-western part of the flat East-European Plain, remaining entirely within the drainage area of the Baltic Sea. It lies between latitudes 57.30 N and 59.49 N and 21.46 E and 28.13 E. To the west and north, it has a long coastline on the Baltic Sea, which is characterized by numerous bays, peninsulas, and straits between islands. The total area of Estonia is 45 227 km2, including 42 692 km2 of land area. More than a half of the land area is forestland, one-third is agricultural land, about 8% is under settlements and infrastructure, and remaining is covered by shrublands and peatlands (mires and bogs).
Figure 2.2.1. Estonia.
25

Estonia is characterized by a flat topography. The average elevation is about 50 m, and the highest point is 318 m above sea level. The country can be divided into two regions: Lower Estonia in the north and west and Upper Estonia in the central and southern parts.
Estonia belongs to the Atlantic continental region of the temperate zone. The mean annual temperature at the westernmost point is 6.0 °C and at the most easterly point it is from 4.2 to 4.5 °C. These differences can be observed because Estonia’s territory lies in a transitional belt with the maritime type of climate in the West Estonian archipelago and the continental one in eastern Estonia. Summers are moderately warm (mean air temperature in July is 16–17 °C) and winters are moderately cold (mean air temperature in February is between –3.5C and –7.5 °C).
The climate of Estonia is humid because precipitation exceeds evapotranspiration. Nevertheless, there are often droughts during the summer period. The mean annual precipitation ranges from 550 to 750 mm.
The mean annual total solar radiation in Estonia is 1300–1400 W/m2. Due to a very intense cyclonic activity in Northern Europe, the mean wind speed is comparatively high – 5–7 m/s – in the coastal zone. The sum of effective temperatures (over 5 oC) is up to 1350° in Northern Estonia and up to 1500° in southern Estonia and the West Estonian islands.
Estonia is one of the smallest and least populated countries in Europe – its total population accordingly to the 2000 Population Census was 1.44 million inhabitants and 1.361 million as of 1 January 2002. The population density in Estonia is very low compared to the EU: the average population density is 31.3 persons per km2, while the rural population density is 10.4 persons per km2.
Figure 2.2.2. Distribution of population in 2003.
Other urban areas21%
Pärnu3%
Tallinn29%
Tartu8%
Rural areas31%
Narva5%
Kohtla-Järve3%
About 70% live in urban areas with 48% living in five largest towns: Tallinn (396 762); Tartu (101 244); Narva (67 554); Kohtla-Järve (46 555); and Pärnu (44 675).
26

2.3. Natural resources and land use
Estonia is quite rich in renewable resources. Today 47.3% of the country (approximately 2.14 million ha) is covered by forest stands. During the past half-century the area of forest stands has more than doubled and the growing stock on it has increased 2.7 times. In the early 1990s the area of forest increased rapidly mainly due to the abandonment of agricultural land. The area of forestland has steadily increased from 1 856 800 ha in 1990 to 2 267 300 ha in 2003; total cutting from 3 200 000 m3 to 7 811 000 m3; and total biomass increment from 9 103 400 m3 to 12 254 000 m3. Until 1995, most of the forest belonged to the state. After land reform was completed, 40–50% of forest belonged to the private sector. Today approximately 37% of forestland is in private ownership.
The Estonian forests belong to the zone of mixed and coniferous forests with relatively favourable growth conditions. Despite the small area of Estonia, the forests growing here are rather diverse. The variability brought about by natural conditions is in turn increased by the circumstance that the majority of the forests of Estonia have been affected by human activities in various degrees and ways (cutting, drainage, fires).
The main tree species in Estonian forests are Scots pine, Norway spruce and birch. Forests with conifers as the dominant tree species make up 50%.
Forest industry and forestry have been and still are important contributions to the economy and employment of Estonia. In 1995, forestry accounted for 1.9% of the GDP, which rose to 1.6% by 2003.
Figure 2.3.1. Contribution of forestry and agriculture to the GDP.
0123456789
1993 1994 1995 1996 1997 1998 1999 2000 2001 2002 2003
Shar
e of
GD
P
Forestry Agriculture and hunting
The share of agricultural gross output has decreased constantly while the share of forestry has remained the same, showing a slow rising tendency in the past ten years.In 2003, 1.175 million hectares of land was in the possession of 36 859 operating and non-operating holdings. Of that agricultural land made up 795 640 hectares, woodland 21.9%, other land 5.3%. The major part of other land was unutilised agricultural land.
Nearly two-thirds of the arable land was drained over the past 40 years but as collective farms were dismantled after 1991, the drainage system has not been well maintained. It is estimated that around 60% of Estonia’s most fertile lands are excessively moist.
27

The agricultural register and information department was formed in 2000 to administer national subsidies, EU agriculture and countryside development, agricultural registrars and other databases management. In June 2003 there were 433 767 cadastre units with an area of 3.2 million hectares registered in the land cadastre, which constitutes 71.5% of the total land stock. The following support measures have been implemented: investment aids for agricultural production, improvement of agricultural products handling and marketing, diversification of alternative economic activities in rural areas. The programme “Afforestation investment aid” will provide a better option for the afforestation of unused or uncultivated agricultural lands. All those measures are important to ensure settlement of less advantageous and environmentally limited areas, to foster the spread of environmentally friendly agricultural production, to support agricultural producers to comply with EU requirements (manure handling) and to assist small farms to restructure their production. In 2003, the agricultural sector and rural economy were supported in 332 million kroons (1 EUR=15.64664 EEK).
Table 2.3.1. Gross agricultural output, million kroons
YearCrop production Livestock
productionGross
agricultural output1995 2 847.30 3 120.40 5 967.701996 2 724.60 2 864.30 5 588.901997 2 669.30 2 836.20 5 505.501998 2 312.40 2 918.30 5 230.701999 2 103.90 2 697.20 4 801.102000 3 573.00 3 398.00 6 971.002001 3 078.25 4 194.59 7 272.852002 2 524.71 3 354.06 5 878.772003 2 646.56 3 288.10 5 934.66
Due to natural conditions, cattle breeding with its long traditions are the priority areas of the Estonian agriculture. Dairy cattle farming is the main branch of cattle farming. High-yield grasslands provide the bulk of the feed and also the cheapest feed for dairy herds. However, animal production has been decreasing for several years. The number of farm animals decreased between 1997 and 2003, except in pig and horse farming. The number of dairy cows decreased by 14% during 2002. The main reason for this was that many small producers gave up the dairy business because of their inability to make the investments crucial to the continuation of business.
The quantities of nitrogen taken to the agro-ecological systems have decreased 3–5 fold. While 72 000–112 000 tonnes of active substances of nitrogen fertilizers were used to fertilize field crops in 1980–1990, the quantity was reduced to 20 000–25 000 tones in 1997–2000. The phosphorous quantities applied to the soils with mineral fertilizers have decreased from 49 000–62 000 tonnes in 1980–1990 to 3000–4000 tonnes in 1997–2000.
28

2.4. Economic profile
2.4.1. General
Estonia’s transition from planned to market economy started in the early 1990s, with major reforms launched after the monetary reform in 1992. Estonia has been determined and decisive in implementing the necessary reforms. Successful reforms have resulted in achieving early macroeconomic stabilization and the creation of a favourable environment for economic development. Estonia has achieved a high level of commercial and financial integration with the European and global economy.
With independency in 1991, Estonia inherited an economy the structure and the trade relations of which were dominated by the Soviet Union. The economy had to go through a heavy restructuring as its structure was inappropriate and unbalanced in the new situation. Although the environmental legislation before the 1990s in general corresponded to internationally recognized principles and norms of environmental protection, and in many respects was even more stringent, there were limited mechanisms for their practical implementation. Therefore, there was an urgent need to redraft the existing legislation. By the end of the1990s, the updated legal framework of environmental protection, which largely corresponded to the European Union’s environmental acquis, was in place. All the main fields of environmental protection – air, water, waste, industrial pollution etc. –were in general covered by legal acts.
During the reporting period, first great success was achieved in negotiations of all legislation with the EU and then, since May 2004, in the harmonization of various development plans with the EU relevant directives.
2.4.2. Economic indicators
The Estonian economy experienced a sharp and deep reduction in GDP in the early years of transition. Estonian GDP fell by one-third in the four years between 1990 and 1994. As a result of appropriate policy choices and their implementation the general economic situation stabilized by the beginning of 1994, with the increase in efficiency and macroeconomic stabilization creating a favourable environment for economic growth in the coming years. The downward trend in economic activity stopped in 1995.
29

Table 2.4.1 Estonian macroeconomic indicators
Indicator 1995 2000 2001 2002 2003
GDP, current prices (mld EEK) 41 92 104 117 126GDP, real growth (%) 4.3 7.8 6.4 7.2 5.1Industrial sales, at constant prices of previous year (%) 2 3.9 5.6 3.6 1.4
Unemployment (%) 9.7 13.7 12.7 10.4 10.1Average wage (EEK) 2375 4907 5510 6144 6723Investments in fixed assets, at current prices (mln EEK) 8760.7 14427.4 20143.6 21023.1 22235.5Foreign direct investment flow (mln EEK) 2312.9 6644.5 9429.6 4800.2 12865.9Exports (mln EEK) 19008.9 55836.8 57856.5 56990.6 62627.2Imports (mln EEK) 27425 72217.1 75076.3 79471.7 89426.7Foreign trade balance (%) -44.3 -29.3 -29.8 -39.4 -42.8Current account balance (mln EEK) -1810.6 -5093.4 -5889.5 -11882.9 -15402
In the recent years the GDP growth has been rapid. So in 2002 it was outstandingly fast (7.2%) and in 2003 a little lower (5.1%). Private consumption was favoured on the one hand by the historically low rise of consumer prices and hence the highest rise of real wages in recent years, on the other hand by persistently falling interest rates on loans and deposits.
Figure 2.4.1. GDP and GDP per capita 2003=100%.
0%
20%
40%
60%
80%
100%
1993 1995 1997 1999 2001 2003
CDP per capita %GDP%
Throughout last year, low interest rates and an active inflow of foreign investments contributed to a high investment activity, making the share of investments in the GDP reach a record high, 34.1%. Investments growth was underpinned both by high construction activity and capital goods. The energy sector got the most of the investments, followed by hotels and restaurants.
Year by year the wages rose, reaching 6700 kroons in 2003. However, in 2003 the GDP per capita comprised ca 48% of the EU15 average, at the same time consumer prices made up ca 63%. Therefore people are very sensitive to the tax policy, especially in the transport and household sectors.
30

2.4.3. Tax system
In 1991 Estonia started to establish a simple and efficient tax system. The process was supported by a broad political consensus that tax reform and improved control of expenditures were necessary to achieve a successful transition to a market economy. Now Estonia’s tax structure broadly follows international norms. On average during the last three years, payroll and indirect taxes (primarily VAT and excises) both accounted over a third of the total tax revenue, and income taxes about a quarter. Compared to the EU15 countries, Estonia relies relatively more on indirect taxes and payroll tax. As the economy advances, direct taxes start to play a more significant role.
In connection with the harmonization of tax policy with the EU directives the excise rates of energy products have been continuously raised. Still, there is a large gap between the minimum excise rates valid in Estonia and mandatory in the EU. Transition periods have been established for the majority of energy products until 31 December 2009.
Economic activities that stimulate environmental protection are stable subsidies, mortgage system, natural resource usage and pollution fee. The major environmental fees include a pollution fee, special water use fee and mineral rights fee. Based on economic development and the increased solvency of the population, during the last 10 years the rates of environmental fees have been steadily increased due to tightened environmental requirements and the need to appreciate natural resources.
Figure 2.4.2. Share of GDP by sectors.
0%
20%
40%
60%
80%
100%
1993 1994 1995 1996 1997 1998 1999 2000 2001 2002 2003
Services Manufacturing Government Agriculture
2.5. Energy and industry profile
2.5.1. Energy profile
Estonia is relatively rich in natural resources, both mineral and biological. In 2003, the share of domestic fuels – oil shale, wood and peat – accounted for 73% of the primary energy resources. Imported fuels (natural gas, fuel oils, coal, motor fuels) made up only 27% of the fuels utilised in 2003. The share of renewable energy sources reached 10.5%, wood fuels formed the major part of it, the proportion of other sources remained on the level of 0.1%. From the energy of primary fuels about 43% was used for electricity production, 24% for heat production, 15% for the
31

production of secondary fuels (i.e. shale oil), 2% as raw material in industry and 16% for immediate final consumption.
Figure 2.5.1. Fuels in the supply of primary energy in 2003.Coal0,2%
Peat and wood10,5%
Oil products13,8%
Natural gas12,8%
Oil shale62,7%
In 2003, the production of oil shale amounted to 14.9 million tonnes, which exceeded the output of 1999 by 26%. Oil shale was used as a fuel in the production of electricity and heat, and also in the production of shale oil. More than half of the output of shale oil is exported.
The efficiency of primary energy utilisation (the ratio of final energy consumption to the primary energy used) is relatively low in Estonia, making up about 52% in 2003.
This index is lower than in neighbouring countries mainly because Estonia does not have large hydroelectric plants and over 90% of electric energy is produced by condensing steam power stations whose efficiency is approximately 30%. The efficiency index of the energy sector is reduced also by losses in electricity and district heating networks and by the export of converted energy (electricity, shale oil, peat briquettes and wood chips). The national goal in this field is continuous rise of the efficiency of the energy sector and as efficient as possible use of energy.
Figure 2.5.2. Production of electricity by energy sources in 2003.Natural gas
5,0%Other fuels
2,7%
RES0,2%
Oil-shale92,1%
32

In 2003, the production of electricity increased about 23% compared to 1999 mainly due to the exports and domestic consumption. Electricity was exported to Russia and Latvia. As much as 92.1% of electricity was generated on the base of oil shale, 5% from natural gas and the rest 2.9% from other energy sources including peat, shale oil and renewables (wind and hydro energy).
Figure 2.5.3. Electricity balance in 2003.
0
5 000
10 000
15 000
20 000
1990 1991 1992 1993 1994 1995 1996 1997 1998 1999 2000 2001 2002 2003
GW
h
ExportsLosses Ow n use by pow er plantsConsumptionImports
The heat production remained on the same level during 1999–2003. Mainly oil shale and natural gas were used in the production of heat. During the last years the share of oil shale in heat production has decreased, at the same time the share of natural gas has increased.
The energy sector is the largest user of water and mineral sources as well the greatest environment polluter in Estonia. Power and heat production based on the combustion of fossil fuels generates most of the emission of pollutants into the atmosphere (CO2, NOx, SO2, NMVOC, etc) and a number of other harmful environmental effects, in particular in mining. The state energy policy must ensure application of proper measures for the reduction of the sector’s environmental impact, for the implementation of environmental protection goals resulting from legal acts, various agreements and conventions.
The primary goal of reducing the pollution level arises from the Estonian Environmental Strategy, according to which the amount of SO2 pollution must be reduced by the year 2005 by 80% compared with the level of 1980 and the amount of particles by 25% compared with year 1995. The pollution amount of nitric compounds had to be stabilized on the level of 1987 by the year 2000; their further reduction is required.
Energy production is extremely wasteful, providing 73% of the total waste generation in Estonia in 2003. Out of 18.4 million tonnes of wastes generated in 2003, 6.3 million tonnes was oil shale combustion ashes and 6.2 million tonnes was mining residuals.
33

The energy sector is the main industrial sector in Estonia. Both the energy and the chemical industry are based on oil shale. Approximately 90% of Estonia’s energy is produced through the combustion of fossil fuels. The remaining 10% comes from renewables, such as biomass, hydropower and wind (Energy Balance, 2004).
According to EU legislation, the relevant Estonian legislation was prepared and put into force. Estonian Energy made loans for the renovation of two energy blocks (both 215 MW) for a repayment period of 15 years. The aim of renovation is to go over to a new combustion technology that will be more efficient and environment friendly than the presently used one. Major development directions planned involve expansion of the use of renewable energy sources. The area of forestland has steadily increased from 1 856 800 ha in 1990 to 2 267 300 ha in 2003; total cutting from 3 200 000 m3 to 7 811 000 m3; and total biomass increment from 9 103 400 m3 to 12 254 000 m3gy.
A specific fuel in the Estonian energy sector is oil shale, which made up 62% of the primary energy supply in 2003. Primary energy use and energy consumption by end users have continuously decreased since 1990. The largest decline in energy consumption occurred in industry and agriculture.
Figure 2.5.4. Total primary energy supply in 2003.
Motor fuels11%
Fuel oils3%
Natural gas13%
Wood10%
Others1%
Oil-shale62%
As in the entire Estonian economy, essential changes have taken place in the energy sector during the last years. Both the primary energy demand and the final consumption have decreased almost twice. From 1993 on the level of energy consumption has gradually stabilized. In 1996 about 72% of the primary energy demand was covered by indigenous energy sources. The changes in the energy sector reflect reduction in the country’s industrial output, but energy consumption has also become more economical during the last years.
34

Figure 2.5.5. Final energy consumption by sector categories in 2003.
Industry22%
Agriculture4%
Transport16%
Commercial and public services
12%
Households46%
The main fuel used in Estonia is oil shale: 92% of electricity was generated on its basis in 1999. The Estonian oil shale as a fuel is characterized by a high ash content (45–50%), a moderate moisture (11–13%) and sulphur content (1.4–1.8%), a low net calorific value (8.5–9 MJ). The production of oil shale in Estonia peaked in 1980. As a result of replacing oil shale gas with natural gas, the annual production of oil shale fell by 8 million tonnes from 1980 to 1990. The extraction of oil shale decreased further throughout the 1990s and fell to 12 million tonnes by 1999. Also exports and domestic consumption of electricity fell.
Figure 2.5.6. Production and consumption of oil shale.
8
10
12
14
16
18
1995 1997 1999 2001 2003
Mill
ion
tons
ProductionConsumed
The primary reason is the continuing decline in demand; besides part of oil shale demand was covered by imports and also stock reserves were reduced.
35

Figure 2.5.7. Fuel Consumption in Heat Only Boiler Houses in 2003.Heavy fuel oil
4%Shale oil15%
Peat and biofuels33%
Oil shale1%
Coal2%
Light fuel oil5%
Natural gas40%
According to the long-term development plan of the Estonian energy sector, oil shale will remain Estonia’s largest source of energy in the near future.
The share of natural gas will increase significantly, mostly due to the low environmental impact of this fuel. Its share in the primary energy balance is expected to increase twofold in the next 10–15 years. Estonia has developed a network for natural gas linking the largest towns and industrial centres and covering around 70% of the Estonian population.
The energy sector is largest user of water and mineral resources as well generator of waste in Estonia. Power and heat production based on the combustion of fossil fuels (oil shale, heavy fuel oil and natural gas) and imported motor fuels is responsible for the major share of national GHG emissions, particulates and VOCs. Oil shale mining and burning put severe strains on the environment, giving about 81% of the total harmful emissions in Estonia.
Figure 2.5.8. Harmful emissions in Estonia.
0
50
100
150
200
250
300
1990 1991 1992 1993 1994 1995 1996 1997 1998 1999 2000 2001 2002 2003
Thou
sand
tons
Nitrogen oxides
Solid particles
Sulphur dioxide
In 1999, a new economic instrument to limit CO2 emissions was introduced in Estonia. On 21 March 1999 the Act on Pollution Charges entered into force, introducing pollution charges for the release of CO2 into ambient air – 0.32 EUR/t in 2000 and 0.48 EUR/t from 2001 onward.
Energy production is also extremely wasteful, providing 73% of the total waste production in 2003. Out of more than 18 million tonnes of wastes generated in 2003, 6 million tonnes was oil shale combustion ashes and 6 million tonnes was mining residuals.
36

Figure 2.5.9. Industrial production by economic activity.
0%
20%
40%
60%
80%
100%
1995 2000 2001 2002 2003
Energy supply Mining Manufacturing
2.5.2. Transport
Estonian transportation policy is characterised by wide-scale privatization of operation services and infrastructure. The Estonian government approved the “Transport development framework 1999–2006” to specify the sector’s problems, development demands and measures. The majority of investments are planned to priority areas such as modernization of pan-European transportation corridors and renovation of domestic junctions. While implementing structural changes in the transportation sector, emphasis was on privatisation of railway companies. In order to increase the competitiveness of the relatively weak public transportation system, it is planned to develop a national public transportation framework and ensure its implementation. National and local governments subsidise public transportation, purchase of public transport vehicles, construction or renovation of public transportation infrastructure and public transportation research. In the period 1990–2003 the number of passenger cars increased significantly. At the same time the consumption of motor fuels in the transport sector decreased from 37.1 PJ in 1990 to 30.2 PJ in 2003 thanks to the increasing share of new and more economical vehicles. The share of public transport in the volume of passenger traffic in 2003 had decreased by 60% compared to 1990. Passenger kilometres by bus and rail have decreased 50–80%, mainly due to reorganisation of the previously state-owned transport enterprises and the boom in the use and numbers of privately owned cars.
Figure 2.5.10. Car ownership.
200
250
300
350
400
450
500
1990 1991 1992 1993 1994 1995 1996 1997 1998 1999 2000 2001 2002 2003
Num
ber (
thou
sand
)
The growing number of cars has an easily measurable effect on air quality, energy consumption, noise emissions and road use intensity and requires more road infrastructure in the future.
37

3. INVENTORIES OF ANTHROPOGENIC EMISSIONS AND REMOVALS OF GREENHOUSE GASES
38

3.1. Introduction
This chapter provides information on greenhouse gas emissions and removals by sink in Estonia for the years 1990 – 2003. Data for 1990 are assumed as a reference and used for comparison for the purposes of highlighting international commitments of Estonia to reduce GHG emissions. Data of GHG emissions are taken from annual CRF inventory reports of Estonia under the UNFCCC.
Six gases play a key role in contributing to the intensification of the greenhouse effect: carbon dioxide (CO2), methane (CH4), nitrous oxide (N2O), hydrofluorocarbons (HFC's), perfluorocarbons (PFC's) and sulphur hexafluoride (SF6). The most important of them are carbon dioxide, methane and nitrous oxide.
According to the IPCC reporting guidelines on national communications, information on all other gases whose 100-year global warming potential (GWP) values have been identified by the IPCC and adopted by the COP should be included to the national inventory.
In the Estonian's inventory is also included carbon monoxide (CO), nitrogen oxides (NOx) and non-methane volatile organic compounds (NMVOCs). These compounds have an indirect effect on the climate change - for example, by increasing the atmospheric life of methane. Their relative and absolute contribution to the climate change is uncertain. This chapter also reports Estonia's emissions of sulphur oxides (SO2). Sulphur gases - primarily SO2 - are believed to contribute negatively to the greenhouse effect.
The Fourth National Communication should include GHG inventories of the years 2000, 2001 and 2002 according to the base year 1990. In reality the current inventory covers the whole period from 1990 to 2003, including also the years for which inventories have been reported but are now recalculated. The purpose of all recalculations is the improvement of accuracy and completeness. Now, the inventory of all years is estimated using the same methodology, adjusted statistical data and emission factors.
3.2. Trends of Estonia’s greenhouse gas emissions
The total anthropogenic greenhouse gas emissions without land-use change and forestry in Estonia in 2003 were 21.387 million tons of CO2 eq (about 51% under the greenhouse gas emissions of the 1990 baseline level). The land-use change and forestry sector has constituted a net sink during the whole period of 1990-2003. In 2003 the size if Estonia’s net sink was estimated to be 8.72 million tons of CO2 equivalents. Following figures illustrate the overall trends in the Estonia’s greenhouse gas emissions by sector and gas (Figure 3.2.1, Figure 3.2.2), as well the GHG removals by sinks (Figure 3.2.3). Summary CRF tables of annual inventory submissions are attached in annexes of this report.
39
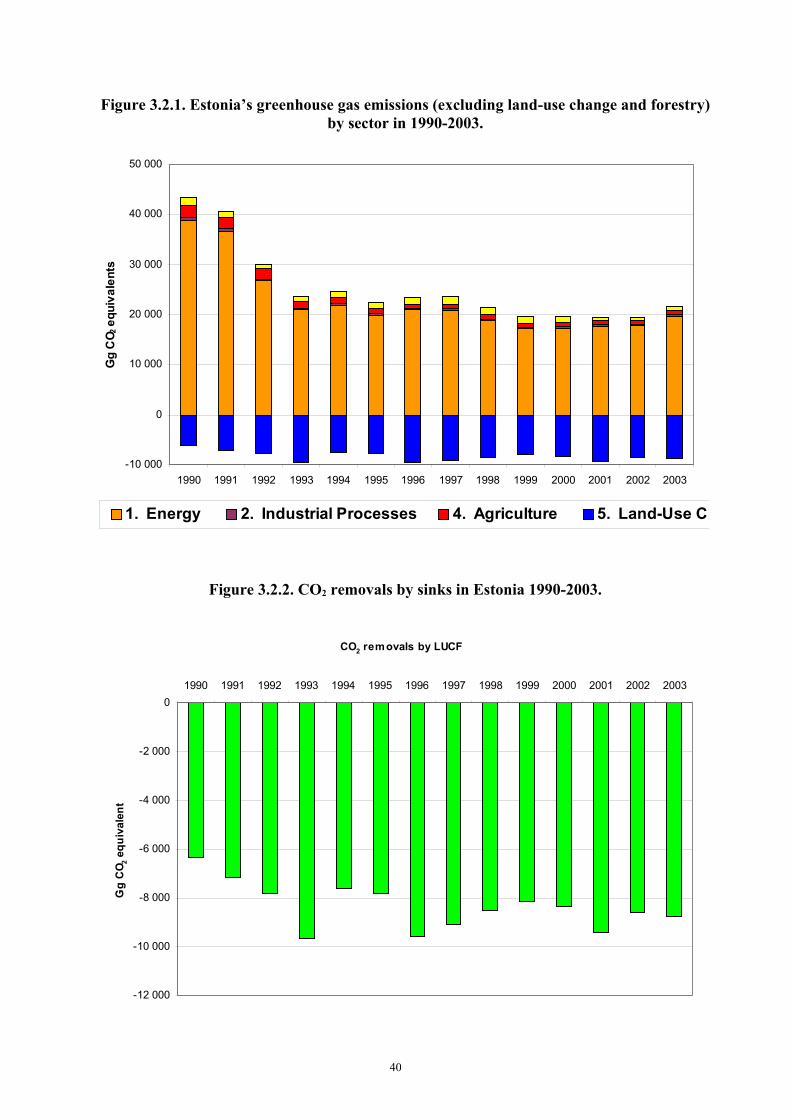
Figure 3.2.1. Estonia’s greenhouse gas emissions (excluding land-use change and forestry) by sector in 1990-2003.
-10 000
0
10 000
20 000
30 000
40 000
50 000
1990 1991 1992 1993 1994 1995 1996 1997 1998 1999 2000 2001 2002 2003
Gg
CO 2
equ
ival
ents
1. Energy 2. Industrial Processes 4. Agriculture 5. Land-Use Change and Forestry (7) 6. Waste
Figure 3.2.2. CO2 removals by sinks in Estonia 1990-2003.
CO2 removals by LUCF
-12 000
-10 000
-8 000
-6 000
-4 000
-2 000
01990 1991 1992 1993 1994 1995 1996 1997 1998 1999 2000 2001 2002 2003
Gg
CO 2 e
quiv
alen
t
40

Figure 3.2.3. Estonia’s greenhouse gas emissions (excluding land-use change and forestry) by gases 1990-2003.
0
5 000
10 000
15 000
20 000
25 000
30 000
35 000
40 000
45 000
50 000
1990 1991 1992 1993 1994 1995 1996 1997 1998 1999 2000 2001 2002 2003
Gg
CO 2 e
quiv
alen
t
CO2 emissions (w ithout LUCF) CH4 N2O
Figure 3.2.4. Per cent variation in Estonia’s greenhouse gas emissions since 1990 (excluding land-use change and forestry).
0,0
20,0
40,0
60,0
80,0
100,0
120,0
1990 1991 1992 1993 1994 1995 1996 1997 1998 1999 2000 2001 2002 2003
%
41

In Figure 3.2.4 the total emissions in proportion to emission of the year 1990 are presented. In 1993 the total GHG emission stated drastically decreases in Estonia, achieving in 1999 the lowest value, only 45% comparing with the 1990. In 2003 the total emissions of GHG were slightly grown, but are still lower than 50% of the total GHG emissions of the 1990.
Figure 3.2.5. Estonia’s greenhouse gas emissions (without LULUCF) per capita and per gross domestic product.
0
20
40
60
80
100
120
1990 1991 1992 1993 1994 1995 1996 1997 1998 1999 2000 2001 2002
Inde
x (1
990=
100)
Emissions per capitaEmissions per GDP
In Figure 3.2.5 the emissions of carbon dioxide per capita and per GDP are presented. Estonia is one of the biggest emitters of carbon dioxide per capita in Europe. In 2002, 14.3 tons of carbon dioxide per capita (without LULUCF) was emitted in Estonia, while the European Union (EU25) average was only about 9 t per capita. It is important to point out that while in EU CO2 emission per capita has been almost stable, then in Estonia it started to increase since 1990. The CO2 emission per capita was in 1990 about 27.7 tons per capita, it means, that the reduction has been almost 49%.
The amount of total GHG emissions follows the development trend of primary energy supply in Estonia. Intensity of CO2 emission reflects the contribution of the economy and whole society to the global warming. The CO2/GDP indicator is defined as the amount of CO2 emitted in the country to generate a unit of GDP. The intensity of CO2 emissions decreased during the 1990 to 2002 almost by 50% in Estonia (see Figure 3.2.5). Nevertheless, the Estonia’s carbon intensity indicator per GDP distinguishes from other countries exceeding the average EU25 value of this indicator about 3.5 times. It means, that despite to the mentioned before perceivable GDP growth (about 62%) during the last ten years, is the amount of TPES (and accompanied emission of CO2) used for generation of a unit of GDP still to high. This is mainly related to the high-energy intensity of economy in general and carbon intensive structure of total primary energy supply.
42

3.3. Methodology and uncertainties
3.3.1 Uncertainties
Estonias’s greenhouse gas inventory is compiled in accordance with UNFCCC Reporting Guidelines on annual inventories, to the extent possible. Emissions and removals by sinks of greenhouse gases from various sources have been estimated using methodologies that are consistent with the Revised 1996 IPCC Guidelines for National Greenhouse Gas Inventories.. The approach to estimate the uncertainties of the Estonia’s inventory is at present based entirely on expert judgement. The unsertanty of activity data could differ from 10% up to 25% depending on the sector and years. In the early 1990s, unsertanties were much higer than in resent years. The total uncertainty of the inventory for the year 2003 has in this preliminary assessment been estimated to be around ±10%. In the future more resources will be allocated to the development of better quantitative uncertainty estimates.
Each year Estonia attempts to improve the inventory estimates through the use of better methods and data, taking into account the development in the IPCC methodologies and UNFCCC reporting requirements as well the country experts sugsessions. The required changes and improvements mean that recalculations and revised estimates on historical inventory data are needed in order to maintain the consistency in the time series.
Estonia’s greenhouse gas inventory is compiled in accordance with UNFCCC Reporting Guidelines on annual inventories, to the extent possible. Emissions and removals by sinks of greenhouse gases from various sources have been estimated using methodologies that are consistent with Revised 1996 IPCC guidelines for National Greenhouse Gas Inventories.
3.3.2. Fuel combustion - general method
Emissions from all sources of combustion are estimated on the basis of the quantities of fuel consumed and average emission factors. The IPCC Reference Approach for CO2 is presented together with new methods for the estimation of CO2 and non-CO2 emissions from the main source categories.Bunker Fuels. The IPCC methodology subtracts the quantities delivered to and consumed by ships or aircraft for international transport from the fuel supply to the country. The CO2
emissions arising from use of international bunkers are not included in the national total and should be brought together in a separate table.Biomass Fuels. Biomass fuels are included in the national energy and emissions account for completeness. These emissions should not be included in national CO2 emissions from fuel consumption.
CO2 from fuel combustion activities - reference approach
The IPCC methodology breaks of CO2 emissions from fuel combustion into six steps:• estimate apparent fuel consumption in original units;• convert to common energy unit;• multiply by emission factors to compute the carbon content;• compute carbon stored;• correct for carbon unoxidised;• convert carbon oxidised to CO2 emissions.
43

The apparent consumption of primary fuels is calculated as follows:
Apparent Consumption = Production + Imports - International Bunkers - Stock Change
Apparent consumption of secondary fuels should be added to primary apparent consumption. Apparent consumption of secondary fuels is calculated as follows:
Apparent Consumption = Imports - Exports - International Bunkers - Stock Change
The basic formula for estimating total carbon content is:
Total Carbon Content (GgC) = Σ Apparent Energy Consumption (by fuel type in TJ) x Carbon Emission Factor (by fuel type in tC/TJ) x 10-3
CO2 emissions by source categories
A sectoral breakdown of national CO2 emissions using the defined IPCC source categories is needed for monitoring and abatement policy discussions. The more detailed calculations used for this approach are essentially similar in content to those used for the Reference Approach. The formula is:
Carbon Emissions = Σ Fuel Consumption Expressed in Energy Units (TJ) for Each Sector x Carbon Emission Factor - Carbon Stored x Fraction OxidisedThere are seven key considerations calculating CO2 emissions by sector some of which have already been discussed in the Reference Approach:• identification of the quantities of fuels consumed (combusted) in energy industries;• a clear understanding of how emissions from electricity generation and heat are treated;• identification of the fraction of carbon released during the use of fuels for non-energy
purposes;• adjustment for carbon unoxidised;• identification of the quantities of fuels used for international transport;• separation of the emissions from the combustion of biofuels;• separation of the quantities of fuels used in the Agriculture/Forestry/Fisheries between mobile
sources and stationary plant.
CO2 from fuel combustion by source categories are calculated by IPCC Guidelines (1996) for:• energy Industry;• manufacturing Industries and Construction;• transport Sector;• commercial/Institutional Sector;• residential Sector;agriculture/Forestry/Fisheries.
44

Non-CO2 from fuel combustion by source categories
Methane (CH4) emissions from fuel combustionThe general method for estimating CH4 can be described as:
Emissions = Σ (Efab x Activityab) (1.3.2.1)where: EF - Emission Factor (kg/TJ) (Table 1-7 (IPCC Guidelines, 1996));
Activity - Energy Input (TJ);a - fuel type;b - sector-activity.
Nitrous Oxide (N2O) emissions from fuel combustionNitrous oxide is produced directly from the combustion of fossil fuel. By combustion at the temperature below 800 K or over 1200 K the emissions of N2O are negligible. Compared to emissions from conventional stationary combustion units, emissions of nitrous oxides from fluidised bed combustion are relatively high.N2O emissions can be calculated with formula (1.3.2.1). N2O Emission Factors from Table 1-8 were used (IPCC Guidelines, 1996).
Nitrogen oxides (NOx) emissions from fuel combustionNitrogen oxides are indirect greenhouse gases. Fuel combustion activities are the most significant anthropogenic source of NOx. Within fuel combustion, the most important sources are the energy industries and mobile sources.NOx emissions can be calculated with formula (1.3.2.1). NOx. Emission Factors from Table 1-9 were used (IPCC Guidelines, 1996).
Carbon monoxide (CO) emissions from fuel combustionCarbon monoxide is an indirect greenhouse gas. The majority of CO emissions from fuel combustion come from motor vehicles. Another large contributor is the residential sector with small combustion equipment.CO emissions can be calculated with formula (1.3.2.1). CO Emission Factors from Table 1-10 were used (IPCC Guidelines, 1996).
Non-Methane Volatile Organic Compounds (NMVOC) emissions from fuel combustionNMVOC are indirect greenhouse gases. The most important sources NMVOCs from fuel combustion activities are mobile sources and residential combustion (especially biomass combustion).NMVOC emissions can be calculated with formula (1.3.2.1). NMVOC Emission Factors from Table 1-11 were used (IPCC Guidelines, 1996).
45

Sulphur dioxide (SO2) emissions from fuel combustionSulphur dioxide is not a greenhouse gas but its presence in the atmosphere may influence climate. SO2 emissions can be calculated with formula (1.3.2.1). The SO2 Emission Factors can be estimated (Greenhouse ... Workbook, Vol. 3, 1996) as:
EFSO2 (kg/TJ) = 2 x S x 10-2 x Q-1 x 106 x (100-r) x 10-2 x (100-n) x 10-2 where: EF - Emission Factor (kg/TJ);
SO2 - SO2/S (kg/kg);S - Sulphur content in fuel (%);r - Retention of sulphur in ash (%);Q - Net calorific value (TJ/kt);106 - (Unit) conversion factor;n - Efficiency of abatement technology and/or reduction efficiency (%).
In Estonia the oil shale power plants are the biggest source of SO2. The medium sulphur content of oil shale is 1.7% and the medium sulphur retention in ash is about 75% (Yu.Rundygin et.al., Oil Shale, 1997). In 2004 two reconstructed energy blocks (215 MWel each) were launched (block no. 8 of Estonian Power Plant and block no. 11 of Baltic Power Plant). The new cleaner circulating fluidised bed combustion technology was used. The first results of measurements show that the sulphur retention rate in ash is 99%.
3.3.3. GHG emissions from mobile sources
The basic calculation for estimating greenhouse gases emissions can be expressed as:
Emissions = Σ (EFabc x Activityabc)where: EF - emission factor;
Activity - amount of energy consumed or distance travelled for a given mobile source activity;
a - fuel type (diesel, gasoline, LPG, bunker, etc.);b - vehicle type (e.g. passenger, light-duty or heavy-duty for road
vehicles);c - emission control.
For estimation of mobile sources in Estonia are not any emission factors. For emission calculations were used emission factors from IPCC Guidelines (Greenhouse ... Workbook, Vol. 3, 1996).
3.3.4. Feedstock’s and non-energy use of fuels
All fossil fuels are used for non-energy purposes to some degree. For the IPCC Reference Approach, the suggested formula for estimating carbon stored in products for each country is:
Total Carbon Stored (GgC) = Non-Energy Use (103 t) x Conversion Factor (TJ/103t) x Emission Factor (tC/TJ) x Fraction Carbon Stored x 10-3
46

Currently the fraction stored applied to the Carbon from the use or destruction of the products in short term. The fraction is therefore lower than the fraction of carbon entering the products. The emissions resulting from the use or destruction of the products may occur in:industrial processes - both the production of non-fuel products from energy feedstock, and the emission from use of these products in industrial processes;other end uses of products (e.g., lubricants oxidised in transportation);waste disposal - particularly incineration of plastics and other fossil fuels based products.
In Estonia shale oil is produced from oil shale in internal combustion vertical retort and in solid heat carrier retorting units. In thermal processing of Estonian oil shale in internal combustion vertical retort semi coke is formed. The semi coke has the considerable calorific value. Up to now the oil shale semi coke has not used and is deposited in spent shale dumps. Analyses show that the energy of semi coke forms about 21% from consumption of oil shale energy for conversion to shale oil. In solid heat carrier retorting units practically all energy of oil shale semi coke is utilised. Crude shale oil is used as a fuel in medium and small boilers. The crude shale oil has low solidification point (-10°C), a moderate sulphur content S<0.8% (2002 - 0.62%) and ash residue content is below 0.3%. The calorific value of shale oil is 39.0÷40.0 MJ/kg (2002 - 39.08 MJ/kg).
Carbon Unoxidised During Fuel UseA small part of the fuel carbon entering combustion escapes oxidation. It is assumed that the carbon that remains unoxidised is stored indefinitely. The IPCC recommended that 1 per cent of the carbon in fossil fuels would remain unoxidised. From the available information a single global default assumption of 1 per cent unoxidised carbon is not always accurate. The Reference Approach requires data only on the amount of fuels consumed in a country, not data by technology type or sector of the economy Recommended values of Fraction of Carbon Oxidised are: coal (0.91÷) 0.98, oil and oil products - 0.99 , gas - 0.995 , peat for electricity generation - 0.99. Fugitive Emissions from Solid Fuels. Oil and Natural Gas.
Methane emissions from oil shale mining and handling activities
This section covers fugitive emissions of greenhouse gases from production, processing, handling and utilisation of coal. In Estonia only oil shale is mined and burned for energy generation and shale oil production. For approximate estimations of fugitive emissions from oil shale mining and handling were used methods suggested in IPCC Guidelines for coal.
The structure of the CH4 emissions from mining (underground and surface mining) and post mining activities (underground and surface mining) is (Greenhouse ... Workbook, Vol. 3, 1996):
CH4 emissions (Gg) = CH4 Emission Factor (m3 CH4/ton of oil shale mined) x Oil Shale Production (Mt) x Conversion Factor (Gg/106 m3)
Conversion Factor converts the volume of CH4 to a weight measure and is the density of methane at 20°C and 1 atmosphere, namely 0.67 Gg/106 m3. The emission factors (m3 CH4/t) for underground and surface mining and for post-mining activities of oil shale were received from local specialists - geologists of oil shale. The emission factors (m3CH4/t) for oil shale are:
a) underground mines: mining - 2.0 , post-mining - 0.2 and b) surface mines: mining - 0.3 , post-mining - 0.1.
47

Fugitive emissions from shale oil and natural gas activities
Sources of fugitive emissions within oil and gas systems include releases during normal operation, such as emissions associated with venting and flaring, chronic leaks or discharge from process vents, emissions during maintenance, and emissions during system upsets and accidents. In Estonia liquid fossil fuels and natural gas are mainly imported. Only shale oil is produced in Estonia.
The equation for calculating CH4 emissions from oil and gas activities is:
CH4 Emissions (Gg CH4) ={Activity (PJ) x Emission Factor (kg CH4/PJ)}/106
Emission factors of oil and gas activities are estimated on bases of dates in Table 1-8 IPCC Guidelines 1996 and on bases of expert meaning of specialists from Oil Shale Institute in Kohtla-Järve. CH4 emission factors for fugitive emissions from oil and gas activities are given in Table A.7.
3.3.5. Burning traditional biomass fuels
For all burning of biomass fuels, IPCC Guidelines requires that net CO2 emissions are treated as zero in the energy sector. Non-CO2 gases are emitted from burning of biomass fuels. Emissions of methane, carbon monoxide, nitrous oxide, and oxides of nitrogen are net emissions and are accounted for as energy emissions.Step 1: The general equation for estimating carbon emissions is:
Carbon Released from Biomass Fuel = Total Biomass Consumed (kt dm) x Fraction Oxidised x Carbon Fraction
Step 2: Non-CO2 trace gas emissions from burning calculation is summarised as follows:CH4 Emissions = Carbon Released x Emission Ratio x 16/12CO Emissions = Carbon Released x Emission Ratio x 28/12N2O Emissions = Carbon Released x N/C Ratio x Emission Ratio x 44/28NOx Emissions = Carbon Released x N/C Ratio x Emission Ratio x 46/14
In Estonia only wood is used as the biomass fuel. All calculations of emissions from burning Estonian biomass (wood) fuel are carried out using constant from IPCC Guidelines.
3.3.6. International bunkers and multilateral operations
In Energy Balance of Statistical Office of Estonia quantities of delivered fuel for marine bunkers are given. There are no statistical data of fuels used in international air transport. Therefore calculations of emissions from international bunkers are carried out only for international marine transport by methodology (Greenhouse ... Workbook, Vol. 2 and 3, 1996).
48

3.3.7. Industrial processes
Cement manufacturing
Carbon dioxide emitted during the cement production process represents the most important source of global carbon dioxide emissions from industry.The equation for calculation CO2 emissions from cement manufacturing is:
CO2 Emissions (Gg CO2) = {Cement Production (t) x Emission Factor(t CO2/t cement)}/1000
The IPCC Guidelines (1994, 1995, ...) recommended method assumes the average CaO content of cement to be 63.5%, which gives on emission factor of 0.4985 CO2/t cement.
Lime manufacturing
For calculation CO2 emissions from lime manufacturing could be used the formula of CO2
emissions from cement production. Emission factor of CO2 for lime manufacturing is taken equal to molecular weight ratio of CO2/CaO = 44/56 = 0.7857
3.3.8. Agriculture
The methodology (Tier 1) used in the “Revised 1996 IPCC Guidelines for National Greenhouse Gas Inventories”. Activity data is mainly based on official Estonian statistics, provided by the Statistical Office of Estonia. We used default emission factors for the calculations.
Agriculture contributes to emissions of greenhouse gases in a variety of ways. IPCC guidelines discuss the following emissions:
• CH4 emissions from stockbreeding (enteric fermentation and manure or liquid manure management)
• Emissions of N2O and CH4 from agricultural soils
The two most important gases emitted from agricultural activities in Estonia are methane and nitrous oxide.
Methane
Emissions from enteric fermentation and manure management are calculated according to IPCC methodology (Tier 1) (Revised 1996 IPCC Guidelines for National Greenhouse Gas Inventories), since 2003 mainly emission factors for the developed countries and Western Europe are used (Table 3.3.1; 3.3.2).
49

Table 3.3.1. Enteric fermentation methane emission factors
Enteric Fermentation Emission factor,kg CH4/animal/yr Reference of source
Dairy Cattle 100 IPCC Non-Dairy Cattle 48 IPCC Sheep 8 IPCC Goats 5 IPCC Horses 18 IPCC Swine 1.5 IPCC Poultry 0 IPCC
Annual quantities of decomposable organic matter have been estimated on the basis of data that were used in calculating emissions from enteric fermentation. IPCC methods (1997) have been applied.
Table 3.3.2. Manure management methane emission factors
Manure management Emission factor,kg/head/yr
Reference of source
Dairy Cattle 14.0 IPCC Non-dairy Cattle 6.0 IPCC Sheep 0.19 IPCC Goats 0.12 IPCC Horses 1.4 IPCC Swine 3.0 IPCC Poultry 0.08 IPCC
Nitrous oxide
The methodology of calculating emissions of nitrous oxide from agricultural soils as put forward in the chapter Greenhouse Gas Emissions from Agricultural Revised 1996 IPCC Guidelines for National Greenhouse Gas Inventories) determines two sources of emission of N2O into environment, namely direct and indirect emissions. In calculations IPCC methodologies and emission factors are used.
Major sources of nitrogen, causing direct and indirect emissions of nitrous oxide into the atmosphere, are the following: - mineral fertilizers- organic fertilizers (manure and liquid manure) from animal husbandry- animal faeces and urine excreted in pasture- biological fixation of nitrogen- crop residue- cultivation of high-organic content (peat) soil- volatilization of ammonia and nitrogen oxides (NOx) - nitrogen leaching and surface runoff/drainage into surface waters, groundwater, and water
watercourses.
50

Nitrous oxide emitted from urine and faeces of grazing animals in the pasture is attributed to emissions from agricultural soils. Emissions of nitrous oxide have been estimated on the basis of data on the number of domestic animals in Estonia (see Table 3.3.3). Calculations are made on the basis of IPCC Guidelines (1997).
Table 3.3.3. Nitrogen excretion for animal waste management system
Manure managementNitrogen excretion
kg/head/yr
Reference of source
Non-Dairy Cattle 50 IPCC Dairy Cattle 70 IPCC Poultry 0.6 IPCC Sheep 16 IPCC Swine 20 IPCC Others 25 IPCC
3.3.9. Waste
In the waste sector 2 sources are the key sources, where the emission amounts are calculated: − Solid waste disposal (landfills) (6 A);− Wastewater handling (6 B).
The most important gas emitted from waste management activities in Estonia is methane.
IPCC Tier 1 method (default method) is used for CH4 emissions calculation.
where:CH4emission – annual methane emission (Gg);MSWL - annual MSW landfilled (Gg);MCF – CH4 correction factor, depends on waste disposal site type;Managed sites – 1 Unmanaged >5m – 0.8Unmanaged <5m – 0.4DOC – degradable organic carbon (0.17);DOCF – fraction of DOC dissimilated (0.6);F – fraction of CH4 landfill gas (0.5);R – recovered CH4 (average is 2,35 Gg).
The data for annual amounts of mixed solid waste landfilled is taken from the Estonian Environment Information Centre. This data is available from year 1993, before that the amount was calculated. For emission calculations are taken into consideration the managed landfills.
The calculations are for two basic types of wastewater handling:Domestic and comercial wastewaterIndustrial wastewater
The calculations about industrial wastewater and sludge handling are for 2 types of industries:Food and beverage
CH4emission= MSWL*MCF*DOC*DOCF*F*16/12 – R
51

Paper and pulpEmissions of CH4 from domestic wastewater handling systems are estimated by using the IPCC method (special table for calculations) and the default emission factors:
DOC – degradable organic carbon (18,250 kg BOD/1000 person/yr);Fraction of wastewater treated by the handling system (0.8);MCF – methane conversion factor for the handling system (0.6).
3.3.10. Forestry
Forest stands, which cover about 47.3% of Estonian land area, contain a large part of the carbon stored on land in the form of biomass. Because approximately half the dry mass of wood is carbon, as trees add mass to their stems, branches, and roots, more carbon is accumulated and stored in the trees than is released to the atmosphere through respiration and decay. Soils and vegetative cover in forest also provide a potential sink for carbon. As forestry is an important branch of Estonian economy (the share of forestry related goods in total export was approximately 12% in 2004), the natural carbon balance of Estonian forests is strongly affected by forest management activities.
According to the Forest Act (RT I 1998, 113/114, 1872), the responsibility for inventorying the sate of Estonian forests lies with the MoE. Regulated by the Official Statistics Act (RT I, 1997, 51, 822), the inventory data are summarised and published by the Statistical Office of Estonia (SOE). These official data (Table 3.3.4), closely corresponding to the requirements of IPCC Guidelines (1996), are the core of the calculations of CO2 removals and emissions in the forestry sector. The volume data were converted to biomass (tons of dry mass, t dm) using default conversion factors (0.65 t dm m-3 for deciduous trees and 0.45 t dm m-3 for coniferous trees) suggested by IPCC Guidelines (1996). The proportion of coniferous forests was found from the species composition data. Part of tops, branches and stumps, taken as 35%, was added to volume data of growing stock increment. A default value of IPCC Guidelines (1996) for biomass carbon fraction (0.45) has been used throughout the calculations.
Table 3.3.4. List of the forest inventory data used as input in the calculations of CO2
removals and emissions in the forestry sector
Area of forest stands, thousands haSpecies composition of forests standsAnnual increment of growing stock, m3 ha-1
Total cuttings, m3
3.4. CO2 emissions and removals
Carbon dioxide is one of the most important greenhouse gases, accounting more than 50% of global warming. Like almost everywhere in the word, anthropogenic sources of CO2 in Estonia are fossil fuel combustion (in energy industries for heat and power generation, manufacturing, transport and other sectors, etc) and industrial activities.
Table 3.4.1. summarises the changes in Estonian emissions and uptakes of carbon dioxide in 2003 against the base year 1990.
52

Table 3.4.1. Sources of carbon dioxide emissions, GgSource/Sink CO2 emissions
1990 2003Energy SectorA. Total fuel consumption activities 37494 18830
Energy industries 29753 15855Manufacturing 2655 420Transport 2693 2146Residential 1556 202Agriculture 387 95Commercial 450 112
B. Industrial processes 614 276Cement production 468 252Lime production 146 24
Total CO2 emissions 38108 19106Land-use change and forestry -6320 -8717Total net emissions 31788 10389
3.4.1. Energy
Approximately 90% of Estonia’s energy is produced through the combustion of fossil fuels. The remaining 10 per cent comes from renewable, such as biomass, hydropower, and wind (Energy Balance, 2004).
As they burn, fossil fuels emit CO2 due to oxidation of the carbon in the fuel. The amount of carbon in fossil fuels varies significantly by fuel type. For example, oil shale contains the highest amount of carbon per unit of energy, while natural gas has about 47 per cent less carbon. Annex I contains data about carbon emission factors and oxidation factors of different fuels used in Estonia.
The Estonia’s GHG inventory includes carbon dioxide emissions from all fossil fuel consumption. Carbon dioxide emissions from biomass and biomass-based fuel consumption are reported, but are not included in the national total.
Fossil fuel consumption
In 2003, Estonia emitted 18,830 Gg of carbon dioxide from fossil fuel combustion, what corresponds to 98% of the total CO2 emissions. (Bunker fuels, used for international transport, accounted for an additional 355 Gg of CO2). The energy-related activities producing these emissions from following sub-sectors: energy industries, manufacturing industries and construction, transport, other sectors (incl. commercial, residential and agriculture), including production, transmission, storage and distribution of fossil fuels, diesel and gasoline consumption in automobiles and other vehicles, heating in residential and commercial buildings, steam production for industry, and generation of electricity (see Table 3.4.1).
Figure 3.4.2 shows the share of each sector to the total carbon dioxide emission. The biggest polluter is energy industry sector, accounting for 84% of Estonia’s total CO2 emissions.
53

Figure 3.4.1. Total primary energy supply in 2003.
Natural Gas13%
Wood10%
Others1%
Fuel Oils3%
Motor Fuels11%
Oil Shale62%
Figure 3.4.2. Carbon dioxide emissions by sectors, 2003.
Transport11%
Manufacturing2%
Energy Industries
84%
Agriculture1%
Commercial
1%Residental
1%
Estonia satisfies most of its energy demand (Figure 3.4.1), and approximately 62% of CO2
emissions from combustion of oil shale the remaining 38% come from natural gas (13%), motor fuels (gasoline and diesel oil, 11%), renewables (mainly wood, 10%), fuel oils (light fuel oil, heavy fuel oil and shale oil, 3%) and other fuels (coal, coke, 1%) (Figure 3.4.3).
54

Figure 3.4.3. CO2 emissions by energy sources, 2003.
Oil Shale72%
Motor fuels12%
Fuel oils5%
Peat2%
Natural Gas 8%
Others1%
3.4.2 Transport sector
The transport sector is the second largest source of carbon dioxide in Estonia. Table 3.4.1 shows that in 2003 emissions from the transport sector made up 2147 Gg, accounting for about 11% (Figure 3.4.2) of the Estonia’s CO2 emissions and being for 21% less than in 1990 (when the corresponding figure was 2693 Gg).
Transport sector includes the emissions from fuel combustion for the transport of passengers and freight in four distinct sub-sectors: road transport; aviation; railways and navigation.
As it follows from the Figure 3.4.4 road transport is responsible for 90% of CO2 emissions in the transport sector. It could be explained by the fact that according to the statistics in 2003 about 97% of inland passengers use road transport, 2% railway and only 0.6 marine and 0,01 air transport (Development, 2005). For goods transport 70% was made by railways and about 29% by road (Statistical Yearbook, 2004).
55

Figure 3.4.4. Carbon dioxide emissions by transport sector sub-sectors in 20031.
Navigation1%
Railways6%
Road Transportati
on90%
Civil Aviation3%
Table 3.4.2. Total number of cars, fuel consumption and CO2 emission of the transportation sector
1990 1991 1992 1993 1994 1995 1996 1997 1998 1999 2000 2001 2002 2003Total cars (thousand) 316 355 389 398 456 485 511 534 538 546 552 493 487 523incl. passenger cars 241 261 283 317 338 383 406 428 451 459 464 407 401 434Fuel2
consumption, PJ 37.1 42.1 20.7 23.6 21.1 15.3 14.5 17.8 18.8 16.8 14.3 27.1 30.6 30.2CO2 emissions, Gg 2693 3078 1497 1713 1522 1102 1047 1212 1251 1203 1030 1921 2175 2147
As it follows from the Table 3.4.2 and Figure 3.4.5, in the period 1990-2003 the number of passenger cars increased significantly. At the same time the consumption of motor fuels in the transport sector decreased from 37.1 PJ in 1990 to 30.2 PJ in 2003 due to the increasing share of new and more economical vehicles. While in 1995 the number of new registered cars was only 3091 then in 2005 already 15 824 (increase five times more).
1 Data source: Common Reporting Format for the provision of inventory information by Annex I Parties to the UNFCCC . Estonia 2003, submission 2004. Table 1. Sectoral Report for Energy.2 Including motor fuels used in agriculture and since 2001 also motor fuels used in households (by private cars)
56

Figure 3.4.5. Total numbers of motor vehicles in 1990-2003.
0
50
100
150
200
250
300
350
400
450
500Thousand vehicles
1990 1992 1994 1996 1998 2000 2002
PassengercarsBuses andtrucsMotorcycles
The decrease of the total number of passenger cars during the period 2001-2002 was actually caused by updating the motor vehicle register in the Estonian Motor Vehicle Registration Centre. That means that according to the new Traffic Act the data on vehicles which had not past regular technical inspection procedure and were actually not circulating in the traffic, were deleted from the register. Since 2003 the total number of passenger cars has been increasing (Figure 3.4.5) again due to purchase of new cars (Statistical…, 2004).
3.4.3. Industrial processes
This category comprises emissions from industrial processes where CO2 is a direct product of those processes. In Estonian industry emissions of carbon dioxide are realised mainly by cement and lime production.
By thermal processing of calcium carbonate (CaCO3) from limestone, chalk or other calcium-rich materials, calcium oxide (CaO) and carbon dioxide (CO2) are formed.
In 2003 CO2 emissions from industrial processes were approximately 276 Gg, which accounts for about 1.4 per sent of total CO2 emissions. In 1990 (base year) it was 614 Gg respectively, accounting for 6 per sent of Estonia's total emissions of CO2.
57

Figure 3.4.6. Main sources of CO2 emissions from industrial processes.
0
50
100
150
200
250
300
350
400
450
500
1990 1991 1992 1993 1994 1995 1996 1997 1998 1999 2000 2001 2002 2003
Gg
Cement productionLime production
Considerable decrease of CO2 emissions in the industrial sector since 1992 was caused by the reduction of cement and lime production in mid 90ies. From 1998 onwards the production amounts of minerals have been growing, particularly in cement industry, which is characterised also by increased CO2 emissions. From 2002 a small decease of cement production can be noticed again (see Figure 3.4.6). The amounts of CO2 emitted in 2003 are only 45% of the respective data of 1990.
3.4.4. GHG budget in land use sectors
Since 1990, the base year of GHG budget (Table 3.4.3), considerable changes have occurred in Estonian forestry sector. The area of forestland has steadily increased from 1,856,800 ha in 1990 to 2,267,300 ha in 2003; total cutting from 3,200,000 m3 to 7,811,000 m3; and stem volume increment from 9,103,400 m3 to 12,254,000 m3 (Figure 3.4.7). These changes have affected the removals and emissions of CO2 by forests. The increase in total cutting has caused higher CO2
emissions in 2003 as compared with 1990. The increase in CO2 emissions due to more extensive cuttings has partly been mitigated by greater growing stock increment in the second half of the period. Thus, net removals of CO2 have steadily increased (Figure 3.4.8). Faster growth of forests can be explained with the changes in age structure and species composition of forest stands. Due to extensive cutting of mature coniferous stands, the relative part of deciduous tree species has increased. Also, abandoned agricultural lands, which have been partly added to forestland, have naturally covered with young fast-growing birch and grey alder stands.
58

Table 3.4.3. Forest resources and CO2 removals/emissions in land use and forestry sector 1990 1995 2000 2001 2002 2003
Area of managed forests, thousand ha 1875 1850 2115 2091 2052 2113Total increment, thousand t dm 7391 6774 9780 10273 10080 10417Total cutting, thousand t dm 1664 1986 5414 6113 6402 6640Total removals by forests, Gg CO2 12193 12571 14380 18571 18200 18704Total emission by forests, Gg CO2 2821 3325 5553 10123 10600 10954
Total emissions from soils, Gg CO2 3053 1410 463 -967 -967 -967Net CO2 balance, Gg -6319 -7782 -8364 -9415 -8567 -8717
Figure 3.4.7. Dynamics of forest stand area, growing stock increment, and total cutting in
Estonia in 1990–2003.
0
2000
4000
6000
8000
10000
12000
14000
1990 1991 1992 1993 1994 1995 1996 1997 1998 1999 2000 2001 2002 2003
Fore
st in
crem
ent/c
uttin
g, x
1000
m
3
0
500
1000
1500
2000
2500
Are
a, k
ha
Area Increment Cutting
Figure 3.4.8. Net CO2 removals by forests, Gg.-10000
-9000
-8000
-7000
-6000
-5000
-40001990 1991 1992 1993 1994 1995 1996 1997 1998 1999 2000 2001 2002 2003
CO
2, G
g
59

The forest and grassland conversion has had only marginal effect on CO2 emissions in Estonia—the amount of CO2 released has fluctuated from 35 to 75 Gg during the period of 1990 to 2003. Since 2001, CO2 emissions from forest conversion have not been estimated anymore because cutting data already include information about biomass clearings on forestland. Thus, separate calculations of CO2 emissions from forest conversion would yield overestimated values of total CO2 emissions. Twenty-year total area abandoned and regrowing has been found as the difference between the area of forestland 20 years ago and the current area of forestland. Twenty-year total area abandoned ranges from 197,999 ha in 1995 to 325,100 ha in 1999 and CO2 uptake by regrowth fluctuates between 1,339.5 and 2,295.9 Gg.
3.5. CH4 emissions
Atmospheric methane (CH4) is second only to carbon dioxide as an anthropogenic source of the greenhouse effect. Methane's overall contribution to global warming is significant because it is 21 times (counting either direct or both direct and indirect effects) more effective at trapping heat in the atmosphere than carbon dioxide over a one hundred year time horizon.
Methane's concentration in the atmosphere has more than doubled over the last two centuries. These atmospheric increases are largely due to increasing emissions from anthropogenic sources, such as landfills, agricultural activities, fossil fuel combustion, coal mining, the production and processing of natural gas and oil, and wastewater treatment.
In Estonia, the major sources of methane are energy, agriculture and waste management sectors.
Figure 3.5.1. Methane emissions by main sources, Gg.
0
30
60
90
120
150
180
210
1990
1991
1992
1993
1994
1995
1996
1997
1998
1999
2000
2001
2002
2003
WasteAgriculture Energy
Total methane (CH4) emissions for the period 1990-2003 are presented in the Table 3.5.1. Figure 3.5.1 shows trends of CH4 emissions by sectors. In 2003 the total amount of CH4 emissions was about 43% of the level of 1990.
60

Table 3.5.1. Estonia's sources of methane emissions, Gg
1990 1991 1992 1993 1994 1995 1996 1997 1998 1999 2000 2001 2002 2003Waste Management 76.6 49.2 39.7 40.8 49.2 50.3 61.0 71.1 67.4 62.1 56.9 34.4 35.6 34.9
Agriculture 69.7 65.3 60.3 46.8 43.8 35.7 27.2 26.1 25.0 21.8 20.6 21.3 20.5 22.1
Energy 61.3 60.0 41.6 27.1 32.2 36.0 40.1 39.3 34.4 32.8 36.9 38.1 34.3 93.7
Total 207.8 174.7 141.7 114.7 125.3 122.0 128.3 136.5 126.8 116.7 114.4 93.8 90.4 93.7
3.5.1. Energy
Methane comprises about 9 per cent of the total Estonia’s greenhouse gases (2003). The main source of CH4 emissions in Estonia is energy sector, including fugitive emissions from oil shale mining, fuel handling and transport and also fuel combustion. In 2003 energy sector contribution was 62% to the total methane emissions, at that 85% were from fugitive emissions of fuel mining, transmission, storage and handling and only 5% from the direct fuel combustion. Table 3.5.2 shows that CH4 emissions in energy sector are going down every year to compare with 1990.
Table 3.5.2. Methane emissions from energy sector, Gg
1990 1991 1992 1993 1994 1995 1996 1997 1998 1999 2000 2001 2002 2003Fuel Combustion 4.1 4.8 3.4 2.9 3.5 5.9 6.9 6.9 5.5 5.3 5.2 5.2 5.3 5.5
Fugitive Emission 57.2 55.2 38.2 24.2 28.7 30.0 33.3 32.3 29.0 27.5 31.6 32.9 29.0 31.2
Total 61.3 60.0 41.6 27.1 32.2 56.9 40.1 39.3 34.4 32.8 36.9 38.1 34.3 36.7
3.5.2. Agriculture
Livestock is the main contributor to greenhouse gas emissions from agriculture. In Estonia methane emission is calculated for dairy cattle, non-dairy cattle, swine, sheep, horses and poultry (Figure 3.5.2). Dairy and non-dairy cattle account for the largest part of global methane emission from livestock manures. After cattle, swine wastes make the second largest contribution. As it can be seen in Figure 3.5.2 during the last decade the total number of livestock has decreased about 60%.
61

Figure 3.5.2. Number of livestock in Estonia.
0,0
0,5
1,0
1,5
2,0
2,519
90
1991
1992
1993
1994
1995
1996
1997
1998
1999
2000
2001
2002
2003
Poultry (10 millions)Swine (millions)Non-dairy Cattle (millions)Dairy Cattle (millions)Sheep (millions)Horses (100 thousands)
Since 1990 the total number of animals has decreased about 60% (see Figure 3.5.2), due to the rapid changes in the economy of Estonia. Since 1996 official statistics include number of goats separately from number sheep.
Animals produce methane through enteric fermentation. Methane emission from enteric fermentation forms about 75% of total CH4 emission from agriculture. The methane emissions from this source are released as a result of fermentation in the digestive systems of the ruminant animals. This process depends on the kind of animals and the feed intake. Manure management is also an important source of CH4; significant quantities of methane are emitted during the decomposition of animal excreta. Under anaerobic conditions, methane-producing bacteria convert organic matter into methane. The quantities of produced methane are largely dependent on the type of manure management system and environment temperature. Storing manure in lagoons or as liquid manure produces significantly greater quantities of methane compared to grazing on pasture or solid manure storage. Main producers of methane are cattle and swine. Sheep, goats, horses and poultry contribute only a comparatively small portion of total emission of methane in Estonia. As a result of decreased number of animals, CH4 emission from enteric fermentation has decreased also, but has more-or-less stabilized in the pervious few years (Table 3.5.3).
62

Table 3.5.3. CH4 emission from agriculture (Gg) 1990 1991 1992 1993 1994 1995 1996 1997 1998 1999 2000 2001 2002 2003Enteric Fermentation (Gg)
52.0 48.8 46.9 36.4 33.8 26.5 24.1 23.0 21.9 19.1 18.0 18.4 17.7 19.3
Manure Management (Gg)
17.7 16.5 13.4 10.4 10.0 9.1 3.1 3.1 3.1 2.7 2.7 2.9 2.8 2.8
TotalCH4 from agriculture (Gg)
69.7 65.3 60.3 46.8 43.8 35.7 27.2 26.1 25.0 21.8 20.6 21.3 20.5 22.1
3.5.3. Waste management
The methodology (Tier 1) used in the “Revised 1996 IPCC Guidelines for National Greenhouse Gas Inventories”. Activity data is mainly based on official Estonian statistics, provided by the Statistical Office of Estonia and Estonian Environment Information Centre. Was used the default emission factors for the calculations.
The data for annual amounts of mixed solid waste landfilled is taken from the Estonian Environment Information Centre. This data is available from year 1993, before that the amount was calculated. For emission calculations are taken into consideration the managed landfills.
The recovered methane is the methane that is exhausted from landfill and used for heating and electricity producing. In Estonia is only one landfill- Pääsküla- where this method is in use. The amount is calculated using the amount of exhausted methane and its therm.
Emissions of CH4 from domestic wastewater handling systems are estimated by using the IPCC method (special table for calculations) and the default emission factors.
In the Table 3.5.4 is presented the amounts of waste management and calculated methane emissions from year 1990-2003.
63

Table 3.5.4. Amounts of waste management and calculated methane emissions from year 1990-2003 1990 1991 1992 1993 1994 1995 1996 1997 1998 1999 2000 2001 2002 2003Total generation of municipal waste (t) 659 335 604 254 481 137 524 238 536 801
incl. mixed municipal waste
337 134 472 639 522 097 565 304 593 258 557 157 595 918 544 194 376 100 396 743 444 892
incl. collected by type
22 636 16 452 30 965 34 080 58 421
Mixed municipal waste generation (kg/y per habita)
223 320 361 397 422 400 432 397 275 292 328
Total generation of municipal waste (kg/y per habita)
478 440 352 385 396
Number of inhabitants (mil.) 1,511 1,477 1,448 1,425 1,406 1,393 1,379 1,372 1,367 1,361 1,356
Municipal waste landfilling (t) 750 620 306 330 306 330 317 041 468 869 518 520 563 688 591 991 556 000 568 622 543 874 402 960 419 248 371 306
Methane emission from waste (Gg)
67.4 27.5 27.5 28.5 39.4 44.2 48.3 50.8 47.6 48.8 46.5 24.0 23.6 22.1
Methane emission from wastewater (Gg)
9.1 21.7 12.2 12.3 9.8 6.1 12.7 20.3 19.8 13.3 10.4 10.4 12.0 12.8
Total emission (Gg) 76.6 49.2 39.7 40.8 49.2 50.3 61.0 71.1 67.4 62.1 56.9 34.4 35.6 34.9
3.6. N2O emissions
Nitrous oxide (N2O) is an active greenhouse gas while its actual emissions are much smaller those of CO2. At the same time, N2O is approximately 310 times more powerful than CO2 at trapping heat in the atmosphere over a 100-year horizon.
In Estonia, nitrous oxide emissions contribute about 2.1 per cent to the Estonia’s total greenhouse gas emissions. Figure 3.6.1 sows a rapid decrease of N2O emissions from 1990 to 2002 and some moderate increase in 2003 what could be explained with increase in the use on N-fertilizers.
Figure 3.6.1. Total nitrous oxide emissions in 1990-2003, Gg.
0,00
0,50
1,00
1,50
2,00
2,50
3,00
3,50
1990
1991
1992
1993
1994
1995
1996
1997
1998
1999
2000
2001
2002
2003
Agriculture
Fuel Combustion
64
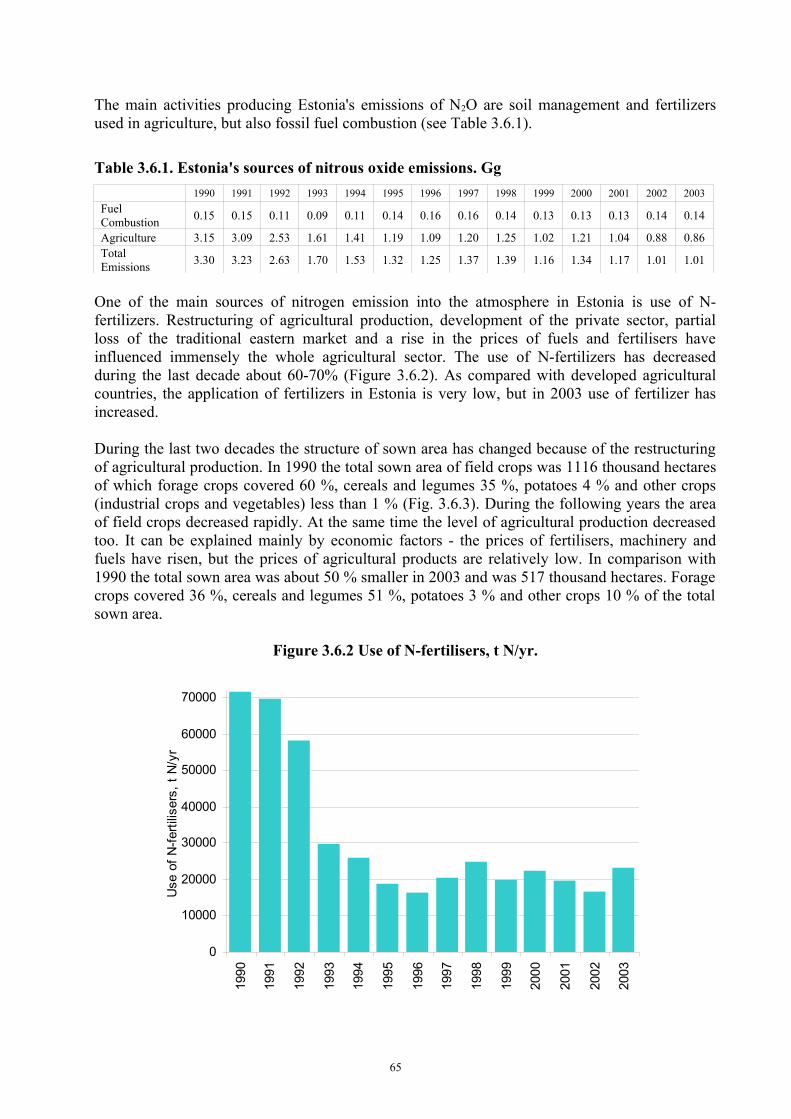
The main activities producing Estonia's emissions of N2O are soil management and fertilizers used in agriculture, but also fossil fuel combustion (see Table 3.6.1).
Table 3.6.1. Estonia's sources of nitrous oxide emissions. Gg1990 1991 1992 1993 1994 1995 1996 1997 1998 1999 2000 2001 2002 2003
Fuel Combustion 0.15 0.15 0.11 0.09 0.11 0.14 0.16 0.16 0.14 0.13 0.13 0.13 0.14 0.14
Agriculture 3.15 3.09 2.53 1.61 1.41 1.19 1.09 1.20 1.25 1.02 1.21 1.04 0.88 0.86Total Emissions 3.30 3.23 2.63 1.70 1.53 1.32 1.25 1.37 1.39 1.16 1.34 1.17 1.01 1.01
One of the main sources of nitrogen emission into the atmosphere in Estonia is use of N-fertilizers. Restructuring of agricultural production, development of the private sector, partial loss of the traditional eastern market and a rise in the prices of fuels and fertilisers have influenced immensely the whole agricultural sector. The use of N-fertilizers has decreased during the last decade about 60-70% (Figure 3.6.2). As compared with developed agricultural countries, the application of fertilizers in Estonia is very low, but in 2003 use of fertilizer has increased.
During the last two decades the structure of sown area has changed because of the restructuring of agricultural production. In 1990 the total sown area of field crops was 1116 thousand hectares of which forage crops covered 60 %, cereals and legumes 35 %, potatoes 4 % and other crops (industrial crops and vegetables) less than 1 % (Fig. 3.6.3). During the following years the area of field crops decreased rapidly. At the same time the level of agricultural production decreased too. It can be explained mainly by economic factors - the prices of fertilisers, machinery and fuels have risen, but the prices of agricultural products are relatively low. In comparison with 1990 the total sown area was about 50 % smaller in 2003 and was 517 thousand hectares. Forage crops covered 36 %, cereals and legumes 51 %, potatoes 3 % and other crops 10 % of the total sown area.
Figure 3.6.2 Use of N-fertilisers, t N/yr.
0
10000
20000
30000
40000
50000
60000
70000
1990
1991
1992
1993
1994
1995
1996
1997
1998
1999
2000
2001
2002
2003
Use
of N
-ferti
liser
s, t
N/y
r
65

Figure 3.6.3. Sown areas of field crops, thousand hectares.
0
200
400
600
800
1000
1200
Cereal andlegumes
Potatoes Forage crops Other Total
1980 1985 1990 1995 2000 2003
Domestic animals are a very small direct source of nitrous oxide and have not been considered in estimating emissions of greenhouse gases. A good deal of nitrous oxide is emitted during storage of animal waste. Nitrous oxide emitted from urine and faeces of grazing animals in the pasture is attributed to emissions from agricultural soils. Total nitrous oxide emission from agriculture has decreased rapidly since 1990 (Table 3.6.2).
Table 3.6.2. N2O emission from agriculture (Gg)1990 1991 1992 1993 1994 1995 1996 1997 1998 1999 2000 2001 2002 200
3
Manure Management 0.08 0.07 0.06 0.05 0.05 0.04 0.04 0.03 0.03 0.03 0.03 0.03 0.03 0.0
3
Agricultural Soils 3.07 3.01 2.47 1.56 1.37 1.15 1.06 1.17 1.22 1.00 1.18 1.00 0.84 0.8
3
Total Emissions 3.15 3.09 2.53 1.61 1.41 1.19 1.09 1.20 1.25 1.02 1.21 1.04 0.88 0.8
6
3.7. HFCs, PFCs and SF6 emissions
According to the Guidelines for the Preparation of National Communications by Parties Including in ANNEX I to the Convention a national GHG inventory should include three new greenhouse gases: hydroflurocarbons (HFCs), perflurocarbons (PFCs) and sulphur hexafluoride (SF6). These gases are not directly harmful to the stratospheric ozone layer; they are not controlled by the Montreal Protocol. However, these compounds are powerful greenhouse gases and are, therefore, considered under the Framework Convention on Climate Change.
For example, HFC-134a has an estimated direct global warming potential of 1300, which makes them 1300 times more heat absorbent than an equivalent amount by weight of CO2 in the
66

atmosphere. For this reason, emission estimates for these gases should have been included in a national inventory.
HFCs, PFCs and SF6 are not produced in Estonia. However, such gases are brought in Estonia in bulk or in some imported equipment (mainly household and industrial refrigerators, ice machines, drinking water coolers, etc) where the gases are accumulated.
Unfortunately, we do not have today such a data collection system in Estonia needed for the emission calculations of those gases, but the Ozone and Climate Unit at the Estonian Environmental Research Centre (EERC) has in the course of building up its ODS (ozone depleting substances) data bases also included HCFs whenever information was available but there are still major gaps in the collected data on fluorinated gases. Some awareness rising has also already taken place.
In 2005 a project proposal for the EU Transition Facility programme was prepared with title: “Enhancing the capacity to reduce the emissions of fluorinated greenhouse gases in Estonia”. The project will assess to what extent the current system for ozone depleting substances can be used in the context of fluorinated gases and what additional activities need to be taken. In addition all missing inventories, strategies, programmes, guidelines, standards, legislative provisions etc. will be prepared as well as public and industry awareness events and training sessions will be conducted with an aim to first stabilize the emissions of fluorinated gases and eventually reducing the emissions.
The project aims at preparing Estonia for better implementation of the Kyoto Protocol which was approved on behalf of the Community by decision 2002/358/EC (Council Decision of 25 April 2002 concerning the approval, on behalf of the European Community, of the Kyoto Protocol to the United Nations Framework Convention on Climate Change and the joint fulfilment of commitments there under) and by the Estonian Government on 30 September 2004 as well as the forthcoming Regulation 2003/0189 (COD) on fluorinated greenhouse gases and the Proposal for a Directive relating to emissions from air conditioning systems in motor vehicles and amending Council Directive 70/156/EEC that are planned to be passed before project start and which establish a detailed framework for the system to be set up in all member states for the reduction of emissions of fluorinated gases.
3.8. Indirect GHG and SO2 emissions
Naturally occurring GHGs include water vapour, carbon dioxide, methane, nitrous oxide and ozone. However, other photochemically important gases, such as carbon monoxide (CO), oxides of nitrogen (NOx), and non-methane volatile organic compounds, while not direct GHGs, do contribute indirectly to the greenhouse effect by creating tropospheric ozone and, as such, are included under the UNFCCC. Direct effect occur when the gas itself is a GHG, while indirect radiative forcing occurs when chemical transformation of original gas produces a GHG or GHGs or when a gas influences the atmospheric lifetime of other gases. Unlike other criteria pollutants, SO2 emitted into the atmosphere affects the Earth's radiative budget negatively.
CO is usually emitted when carbon-containing fuels are burned incompletely; oxides of nitrogen (NO and NO2) are created from lighting, natural fires, fossil fuel combustion, and in the stratosphere from nitrous oxide; NMVOCs, (including such compounds like propane, butane, ethane, etc) are emitted primarily from transportation and industrial processes, as well from
67

forest wildfires. SO2 is not a GHG however being a greater of sulphate aerosols in the atmosphere it has an impact on climate.
Figure 3.8.1. Indirect GHG emissions and SO2 in 1990-2003.
0
50
100
150
200
250
300
1990 1991 1992 1993 1994 1995 1996 1997 1998 1999 2000 2001 2002 2003
Gg
NOxCONMVOCSO2
Figure 3.8.1 presents data on indirect GHG and also SO2 emissions for the period 1990 until 2003 in Estonia. Emissions of indirect GHG and SO2 by sectors are presented in Annex 2.
3.9. Aggregated emissions of GHG
The concept of global warming potential (GWP) has been developed to allow scientists and policy makers to compare the ability of each GHG to trap heat in the atmosphere relative to another gas. By definition a GWP is the time integrated change in radiative forcing due to the instantaneous release of 1kg of a trace gas expressed relative to the radiative forcing from the release of 1 kg of carbon dioxide. In other words a GWP is a relative measure of the warming effect that the emission or a radiative gas might have on the surface troposphere. The GWP of a GHG takes into account both the incremental concentration increase and the lifetime of the gas. While any time period can be chosen for comparison, in this report the 100-year GWPs are used, as per UNFCCC guidelines (Decision 3/CP.5).
68

Table 3.9.1. 1995 IPCC Global Warming Potential (GWP) valuesGreenhouse Gas Chemical Formula 1995 IPCC GWPCarbon Dioxide CO2 1Methane CH4 21Nitrous oxide N2O 310HFC-134a C2H3F3(CF3CH3) 3800HFC-23 CHF3 11700HFC-152a C2H4F2(CH3CHF2) 140Sulphur hexafluoride SF6 23900
The Estonia’s total anthropogenic greenhouse gas emissions in 2003 were 21.387 Gg of carbon dioxide equivalents (without LULUCF) which is about 51% under the 1990 level (43.494 Gig respectively) (see also Annex 2. Emission Trends (Summary), Estonia). Figure 3.9.2 illustrates the contribution and changes of three main primary greenhouse gases (carbon dioxide methane and nitrous oxide) to total emissions during 1990 – 2003. This contribution was calculated based on the global warming potentials of these gases, as presented in the figure. The emissions of indirect greenhouse gases are not included in the total figure, because there is no aggregated – upon method to estimate their contribution to climate change.
Figure 3.9.1. Contribution of net greenhouse gas emission by sectors.
2 44
0
732
614
-6 3
17
1 60
8
38 8
29
-8 7
17
733
276
19 6
45
-10 000
0
10 000
20 000
30 000
40 000
Energy Agriculture Waste IndustrialProcesses
Land-UseChange and
Forestry
1990 2003
69

Figure 3.9.2. Dynamic of CO2, CH4, N2O and net Estonia’s emission, Gg CO2 eq.
Net carbon dioxide
0
5 000
10 000
15 000
20 000
25 000
30 000
35 000
1990
1991
1992
1993
1994
1995
1996
1997
1998
1999
2000
2001
2002
2003
Methane
0500
1 0001 5002 0002 5003 0003 5004 0004 500
1990
1991
1992
1993
1994
1995
1996
1997
1998
1999
2000
2001
2002
2003
Nitrous Oxide
0
200
400
600
800
1 000
1 200
1990
1991
1992
1993
1994
1995
1996
1997
1998
1999
2000
2001
2002
2003
Net Estonia's emission
05 000
10 00015 00020 00025 00030 00035 00040 000
1990
1991
1992
1993
1994
1995
1996
1997
1998
1999
2000
2001
2002
2003
70

APPENDIX
71

Calorific Values, Fractions of Carbon Oxidised and Carbon Emission Factors
Table A.1. Calorific values, fractions of carbon oxidised and carbon emission factors
EF (t C/TJ) Fraction of Carbon Oxidised
NCVaverage Unit
Natural Gas Liquids 17.2 0.99 45.8 GJ/tGasoline 18.9 0.99 43.01 GJ/tJet Kerosene 19.5 0.99 43.65 GJ/tOther Kerosene 19.6 0.99 40.94 GJ/tShale Oil 21.1 0.98 39.17 GJ/tDiesel Oil 20.2 0.99 42.33 GJ/tResidual Fuel Oil 21.1 0.98 40.52 GJ/tAnthracite 26.8 0.98 27.33 GJ/tOil Shale 29.1 0.98 8.82 GJ/tPeat 28.9 0.97 9.20 GJ/tPeat Briquette 28.9 0.97 16.04 GJ/tOil Shale Coke 29.5 0.97 25.89 GJ/tNatural Gas 15.3 0.995 32.48 GJ/1000 m3Solid Biomass 29.9 0.98 6.74 GJ/m3 s
Calorific values of used fuels were found from the annual proceeding of the Statistical Office of Estonia - Energy Balance 2004 (Energy…, 2004) CEF of used fuels were taken from IPCC Guidelines (Greenhouse ... Workbook, Vol. 2, 1996) and only the shale oil CEF was taken from Act No.58, Sept 08, 1998 of Ministry of the Environment. Calorific values of some fuels are changeable. Most of all are changeable caloric values of oil shale and that of solid biomass (wood waste).
IPCC Guidelines (1994, 1995) did not contain information about Estonian oil shale and its carbon emission factor. As oil shale is the main indigenous fuel of Estonia therefore its short description is given below. Estonian oil shale as fuel is characterised by high ash content (45-50%), a moderate content of moisture (11-13%) and sulphur (1.4-1.8%), a low net caloric value (8.5-9 MJ/kg), a high content of volatile matter in combustible part (up to 90%). The dry matter of Estonian oil shale considered to consist of three main parts: organic, sandy-clay and carbonate.
From the point of view of greenhouse gas emissions it is important that during combustion of powdered oil shale CO2 has been formed not only as a burning product of organic carbon, but also as a decomposition product of ash carbonate part. Therefore the total quantity of carbon dioxide increases up to 25% in flue gases of oil shale.
A formula compiled by A. Martins for calculation of Estonian oil shale carbon emission factor, taking in consideration the decomposition of its ash carbonate part, is as follow:
CEFoil shale = 10 x [Crt + k x (CO2)r
M x 12/44] / Qri (tC/TJ),
where:Qr
i - net calorific value oil shale as it burned, MJ/kg;Cr
t - carbon content of oil shale as it burned, %;(CO2)r
M - mineral carbon dioxide content of oil shale as it burned, %;k - decomposition rate of ash carbon part (k = 0.95÷1.0 for pulverised combustion of oil shale) (Kull, et al., 1974).
Oil shale emission factor 29.1 tC/TJ is included into IPCC Guidelines (Greenhouse ... Workbook, Vol. 2, 1996).
72

Emission Factors of non- CO2 Gases from Fuel Combustion
Table A.2. CH4 from fuel combustion (kg/TJ)
Coal Natural Gas Oil Wood Peat/
BriquetteEnergy Industries 1 1 3 30 30Manufacturing 10 5 2 30 30TransportDomestic Aviation 2Road 50 20/5*Railways 10 5National Navigation 10 5Commercial 10 5 10 300 300Residential 300 5 10 300 300AgricultureStationary 300 5 10 300 300Mobil 5 5
*Gasoline/DieselSource: IPCC96 default value
Table A.3. N2O from fuel combustion (kg/TJ)
Coal Natural Gas Oil Wood Peat/ Briquette
Energy Industries 1.0 0.1 0.6 4 4Manufacturing 1.4 0.1 0.6 4 4TransportDomestic Aviation 2Road 0.1 0.6/0.6*Railways 1.4 0.6National Navigation 1.4 0.6Commercial 1.4 0.1 0.6 4 4Residential 1.4 0.1 0.6 4 4AgricultureStationary 1.4 0.1 0.6 4 4Mobil 0.1 0.6
*Gasoline/DieselSource: IPCC96 default value
73

Table A.4. NOx from fuel combustion (kg/TJ)
Coal Natural Gas Oil Wood Oil Shale Peat/ Briquette
Energy Industries 300 150 200 100 125 100Manufacturing and Construction 300 150 200 100 123 100TransportDomestic Aviation 300Road 600 600/800*Railways 300 1200National Navigation 300 1500Commercial 100 50 100 100 123 100Residential 100 50 100 100 123 100Agriculture 100 50 100 100 123 100StationaryMobil 1000 1200
*Gasoline/DieselSource: IPCC96 default value
Table A.5. CO from fuel combustion (kg/TJ)
Coal Natural Gas Oil Wood Oil Shale Peat/
BriquetteEnergy Industries 20 20 15 1000 26 1000Manufacturing and Construction 150 30 10 2000 87 4000TransportDomestic Aviation 100
Road 400 800/1000*
Railways 150 1000National NavigationCommercial 2000 50 20 5000 87 5000Residential 2000 50 20 5000 87 5000AgricultureStationary 2000 50 20 5000 87 5000Mobil 400 1000
*Gasoline/DieselSource: IPCC96 default value
74

Table A.6. NMVOC from fuel combustion (kg/TJ)
Coal Natural Gas Oil Wood Peat/ Briquette
Energy Industries 5 5 5 50 50Manufacturing and Construction 20 5 5 50 50TransportDomestic Aviation 50Road 5 1500/200*Railways 20 200National Navigation 20 200Commercial 200 5 5 600 600Residential 200 5 5 600 600AgricultureStationary 200 5 5 600 600Mobil 5 200
*Gasoline/DieselSource: IPCC96 default value
Table A.7. CH4 emission factors for fugitive emissions from oil and gas activitiesOIL Emission
FactorUnit
Production (only Shale Oil) 4 000 kg CH4/PJTransport of oil products 745 kg CH4/PJStorage of oil products 200 kg CH4/PJGASProduction (only landfill gas) 458 000 kg CH4/PJTransmission and distribution (of natural gas)
458 000 kg CH4/PJ
Other LeakageNon-residential gas consumed 279 500 kg CH4/PJResidential gas consumed 139 500 kg CH4/PJVenting and flaring from oil/gas productionOil 4000 kg CH4/PJGas 18 000 kg CH4/PJ
75

4. POLICIES AND MEASURES
76

4.1. Institutional and legislative framework
The decisions on environment related policies and measures can be taken at national and at local level. In Estonia the Parliament – Riigikogu – is the highest legislative body. The Government of the Republic of Estonia is the supreme executive body and the Ministry of Environment – the highest executive body responsible for carrying out national environmental policy. As a rule, environmental legislation is initiated by the Government or by the Ministry of Environment (MoE). In some aspects, the initiative can come from the Ministry of Economic Affairs and Communications (MoEAC) or from the Ministry of Agriculture (MoA).
The Ministry of Environment comprises fifteen departments, including Environmental management and technology, Forestry, Waste, Strategy and Investment planning departments. Environment departments subordinated to the MoE work in every of 15 county governments. These departments implement national environmental, nature protection, forest and fisheries programmes and action plans at county level.
Some aspects of environment and climate items are in scope of responsibilities of other ministries. The MoEAC is responsible for energy related issues, including energy efficiency and conservation, also for the use of renewable sources in the energy sector. The MoA advises the Government in the field of agriculture and rural life. Some responsibilities of the Ministry of Finance include matters important for environmental management – taxation, use of state budget funds, etc. All ministries are in charge of national development plans and programmes.
The past decade has seen a steady increase in the number of NGOs, which deal with environmental problems and raise public awareness in environment and sustainable development matters. Several NGOs have taken active part in preparation of environment related development plans.
During the short period elapsed since Estonia regained its independence, a great progress has been made in developing the legislation. Estonian legal acts were amended in the process of integration with the European Union, and today Estonian legislation, including legislation on environmental management, is almost fully harmonized with the acquis communautaire of the EU.
According to § 5 of the Constitution of the Republic of Estonia (RT 1992, 26, 349) the natural wealth and resources of Estonia must be used economically and § 53 prescribes that everyone has a duty to preserve the human and natural environment and to compensate for damage caused to the environment.
It is important to emphasize that the § 123 of the Constitution stipulates: if laws or other legislation of Estonia are in conflict with international treaties ratified by the Parliament, the provisions of the international treaty shall apply.
4.2. International agreements and conventions, EU legislation
Since regaining the independence Estonia has concluded 49 bilateral or trilateral environmental agreements and has become a party to 24 environmental conventions and protocols. The conventions Estonia has acceded include: Arhus (1998), Espoo (1991), Helsinki (1992), Geneva
77

(1979), Vienna (1985), Washington (1973), Rio de Janeiro (1992), etc. Regarding ozone depletion: London and Copenhagen Amendments (April 12, 1999) and the Montreal Amendments (April 11, 2003) and also the latest Beijing Amendment (October 15, 2003).
Estonia signed the Kyoto Protocol to the United Nations Framework Convention on Climate Change on 3 December 1998, the Protocol was ratified by the Estonian Parliament on 3 September 2002 (RT II 2002, 26, 111). According to the Protocol, during 2008 – 2012 Estonia has to reduce the GHG emissions by 8% in comparison with the 1990 level. The obligation to reduce greenhouse gas emissions established in the Kyoto Protocol has already been achieved in Estonia as a result of significant re-organization of economic sectors, particularly of energy production but also of industry and agriculture, i.e. as a result of the qualitative and quantitative restructuring of the whole economy at the beginning of 1990s.
At present the Estonian environment related legislation is harmonized with the relevant acquis of the EU. There are only some exceptions. As a result of accession negotiations Estonia was granted five transitional periods under the chapter of environment. Three of these periods are related to ambient air quality as well as to climate change issues. In Estonia the EU requirements for the storage of petrol and its distribution from terminals to service stations (Directive 94/63/EC) will be gradually achieved by the end of 2006. As regards landfill of waste (Directive 1999/31/EC), due to the large amounts of hazardous waste (ash) generated by the oil shale industry, the transitional arrangements are required until 16 July 2009. Regarding large combustion plants (Directive 2001/80/EC), emissions from large oil shale firing power plants have to be fully compliant to EU requirements by 1 January 2016.
There are some more EU directives that have impact on the climate change. The directive on the promotion of electricity produced from renewable energy sources in the internal electricity market (Directive 2001/77/EC) provides for Estonia the indicative share (5.1%) of electricity produced from renewable energy sources in total electricity consumption by 2010. The Directive on the promotion of the use of biofuels or other renewable fuels for transport (Directive 2003/30/EC) stipulates that the Member States should ensure that a minimum proportion of biofuels and other renewable fuels is placed on their markets, and, to that effect, shall set national indicative targets. A reference value for these targets shall be 2%, calculated on the basis of energy content, of all petrol and diesel oil consumption for transport purposes placed on their markets by 31 December 2005; and 5.75 % by 31 December 2010. The Directive on the energy performance of buildings (Directive 2002/91/EC) has the objective to promote the improvement of the energy performance of buildings within the Community, taking into account outdoor climatic and local conditions, as well as indoor climate requirements and cost-effectiveness. The measures foreseen in this Directive would support the more efficient energy use both in private and public buildings. In Estonia the implementation of the Directive 2002/91/EC is in progress.
4.3. Strategic documents and programmes
4.3.1. National Environmental Strategy
Up today the National Environmental Strategy, approved by the Parliament in 1997 (RT I 1997, 26, 390) has served as the underlying document for planning of environmental policy. This environmental policy document provides general guidelines and objectives for environmental management and protection, establishes the most important goals to be achieved by the year 2010. Based on the objectives and tasks of the Strategy the National Environmental Action Plan
78

was developed in 1997–1998. The action plan is a subject to regular revisions. The latest phase of the document (for the years 2001–2003) was approved by the Government in June 2001 and the MoE was appointed as the agency responsible for the implementation of the action plan. The draft of the Action Plan for the next period (up to 2006) is in the process of preparation. At the same time, the new national environmental strategy is currently at the drafting stage as well.
4.3.2. Long-term National Development Plan for the Fuel and Energy Sector
In Estonia the first national long-term development plan for the energy sector was passed by the Parliament (Riigikogu) in 1998. The next plan – Long-term National Development Plan for the Fuel and Energy Sector until 2015 – was approved by the Riigikogu in December 2004. This development plan is based on the Sustainable Development Act (RT I 1995, 31, 384) and provides guidelines for the development of the fuel and energy sector until 2015. The Plan defines the current situation in the sector, presents issues set out in the EU accession treaty, prognoses developments of the energy consumption, sets the strategic development objectives for the energy sector, as well as the development principles and the extent of the necessary investments. The document is accompanied with the assessment of the strategic environmental impact of development scenarios proposed in the Plan. In the second half of 2005 the Plan will be supplemented by the Electricity Sector Development Plan, preparation of which is stipulated by the Electricity Market Act (RT I 2003, 25, 153). The strategic objectives of the Estonian fuel and energy sector presented in the Plan include the following environment related targets:
ensure that by 2010 renewable electricity forms 5.1 per cent of the gross consumption; ensure that by 2020 electricity produced in combined heat and power production stations
forms 20 per cent of the gross consumption; ensure that, in the open market conditions, the competitiveness of the domestic market of
oil shale production is preserved and its efficiency is increased, and apply modern technologies which reduce harmful environmental impact;
ensure compliance with the environmental requirements established by the state; increase the efficiency of the energy consumption in the heat, energy and fuel sector; until 2010, maintain the volume of primary energy consumption at the level of the year
2003; develop measures which enable the use of renewable liquid fuels, particularly biodiesel,
in the transport sector.
4.3.3. National programme to reduce the emission of GHG
In April 2004 the Government approved the National Programme of Greenhouse Gas Emission Reduction for 2003-2012 (RT L 2004, 59, 990). The main goal of the Programme is to ensure the meeting of targets set by the UN FCCC and the Kyoto Protocol. The Programme gives an overview of the Kyoto commitments and analyses the implementation strategy and action measures for Estonia. A special attention has been given to strategy, structure and costs of GHG emission trading and joint implementation projects. The long-term objective of the National Programme is reduction of greenhouse gas emissions by 21% by 2010 as compared with the 1999 emission level. This would include reduction of carbon dioxide emissions by 20%, reduction of methane emissions by 28%, and increase of nitrogen dioxide emissions by 9%.The sub-objectives of the programme are following:
determining the possibilities for reducing anthropogenic emissions of greenhouse gases;
79

offering possibilities for reducing anthropogenic emissions of greenhouse gases in order to reduce human impact on potential climate change;
developing the flexible mechanism of Joint Implementation along the lines of the Kyoto Protocol to reduce greenhouse gas emissions;
determining project themes for Estonia, suitable for Joint Implementation on the basis of the Kyoto Protocol and preparing a relevant database;
increasing the energy efficiency of the Estonian economy (reducing energy intensity).
4.3.4. Joint Implementation
Joint Implementation (JI) is one of three flexible mechanisms introduced by the Kyoto Protocol for reducing greenhouse gas emissions. Already in 1993 Estonia became involved in the early pilot stage of the JI – Activities Implemented Jointly (AIJ). In cooperation with the Swedish National Board for Industrial and Technical Development (NUTEK/STEM) a number of renewable energy projects were carried out. Investments were made by the Swedish side. The projects were mostly aimed at rebuilding boilers to start using local wood instead of imported liquid fuel, but included also energy conservation projects – renovation of district heating networks, insulation of residential buildings and installing DH substations in block houses. In total, Sweden and Estonia have registered 21 common AIJ projects in the Climate Secretariat in Bonn. The annual reduction of CO2 emission in Estonia was estimated to be more than 80 thousand tons.By today, Estonia has signed the memorandums of understanding on JI with Finland (2002), Netherlands (2003), Denmark (2003) and Sweden (2005). The negotiations with Austria are in progress and with Belgium in preparation phase. Up to now (as of September 2005), the assessed and approved impact of JI projects on CO2 emission is 260.3 thousand t of CO2 assigned amount units (AAU) and 368.5 thousand t of CO2 emission reduction units (ERU).
In February 2004 the Government adopted the accession of Estonia to the Agreement on a Testing Ground for Application of the Kyoto Mechanisms on Energy Projects in the Baltic Sea Region (RT II 2004, 22, 92). The Testing Ground for international cooperation in the use of Kyoto flexible mechanisms was started with the main objectives to build capacity and competence to use the JI mechanism, to promote the realisation of high quality projects in the energy sector generating emissions reductions. The other objectives include collaboration in addressing administrative and financial barriers, and minimization of transaction costs, especially regarding small-scale JI projects. The Agreement also facilitates ensurance of issuing and transferring of ERUs and AAUs related to or accruing from JI projects.
4.3.5. National Allocation Plan for GHG emission allowances
The EU Emissions Trading Scheme was officially started on 1 January 2005. Companies with regulated installations located in countries participating in the program must limit their GHG emissions to allocated levels in two periods: 2005 to 2007 and 2008 to 2012. The Estonia’s National Allocation Plan (NAP) was accepted on 20 October 2004 by the European Commission. Estonian Government adopted the NAP in January 2005 (RT I 2005, 6, 22). The Decree on the list of activity fields of operators and the order for greenhouse gases emissions allowances trading has been approved by the Government in of January 2005 as well (RT I 2005, 4, 14).
80

The NAP for GHG emission provides the right to emit 56 859 million tons of carbon dioxide during 2005-2007. The plan includes 43 installations: 36 in the energy production, five in the mineral industry sector and two in the group of “other activities” (pulp and paper industry). District heating installations with a capacity exceeding 20 MW form the largest group on the list – 20 installations. Also, six electricity producing installations qualified in the scheme.
In the first trading period the emission allowances have been allocated to the installations free of charge. The free allocation was based on the principle that new installations covered by the directive should be encouraged to participate in the trading scheme. This will stimulate the undertakings to use production and combustion technologies with lower emissions, to replace the more polluting fossil fuels with cleaner ones (e.g. with natural gas) or biofuels, as well as to invest in measures for sustainable energy production, transmission and consumption.
The allocated total amount of allowances also includes a reserve of emissions of 568 590 tonnes of CO2 for new entrants to be allocated on the “first comes, first served”-principle. The reserve is divided between the three years in proportion to the emission allowances for each year.
A new division has been formed in the Information Centre of the MoE – Climate and Ozone Bureau, what will be responsible authority in the EU Emissions Trading Scheme implementation in Estonia.
4.3.6. Other strategy documents and programmes
In July 2000, the Government approved the National Programme on Reduction of Pollutant Emissions from Large Combustion Plants (for 1999 – 2003), which approximated the EU Directive 88/609/EEC. As a result of the Programme, emissions of pollutants from large combustion plants were reduced substantially: particulates by 56%, SO2 by 23% and emission of NOx by 10%.
In May 1999 the Government approved the National Programme for Phasing out the Ozone Depleting Substances (RT L 1999, 79, 988). Main goal of the programme is implementation of responsibilities proceeding from international agreements in order to protect health of people and the environment from damage arising from the depleting of ozone layer. The Programme envisaged the establishment of a regional halons treatment centre for the Baltic countries, establishment of a recovery system for refrigerating agents and treatment centres for used freons, and creation of a system for monitoring in-country transport of ozone-depleting substances (ODS). As the result of the programme, Estonia reduced its consumption of ODS from 131 ODP tons of Annex A and B substances in 1995 to zero in 2002. Estonia does not produce ODS. The use of halons has been prohibited in Estonia since 1 January 2000.
As an EU member state, Estonia has the opportunity to receive EU regional structural assistance. The Estonian National Development Plan for the Implementation of the EU Structural Funds – Single Programming Document 2004-2006 (SPD) (RT L 2004, 19, 312) serves as the basis for common national and EU efforts to fasten the social and economic development of Estonia. The SPD is an important national document also for the purposes of the climate change mitigation. Measure 4.2 (Development of Environmental Infrastructure) deals directly with the environment. The general objective of this measure is improving the state of the environment and sub-objectives include improving the quality of ambient air, reduction of waste generation, enhancing the environmental supervision and monitoring system as well as promoting environmental awareness. Regarding climate change, the most important are the objectives,
81

which enable investments through the EU Cohesion Fund into the best available techniques in the oil shale burning power plants and promoting the use of renewable energy. The objective of promoting environmental awareness means involving the general public in environmental decision-making, active environmental protection and supervision and forming environmentally sound consumer attitudes among the younger generations. Measure 3.1 (Investment into Agricultural Holdings) should also be mentioned. This measure deals with investments into agricultural holdings. General objective of this measure is to increase the competitiveness of agricultural production through technical progress. Measures 3.4 (Integrated Land Improvement) and 3.7 (Forestry) can also include support to investments that mitigate the climate change.
The Energy Efficiency Target Programme (together with the Implementation Plan for Energy Efficiency Target Programme) approved by the Government in 2000, has the general goal to support the competitiveness of economy through increased energy efficiency; the quantitative objective is to keep the growth rate of energy consumption at the level of 50% of the economic (GDP) growth rate.
The Transport Development Plan for 1999–2006 was adopted by the Government in 1999. As to environment, there was set the goal of slowing down the growth of absolute amounts of the total emission from transport sector. As the next steps stopping the growth at a certain level with the later reduction of emissions were foreseen. At present, the preparation process of the National Transport Development Plan for 2005–2010 is in progress.
In 1997 the Parliament approved the Estonian Forest Policy (RT I 1997, 47, 768) that regulates the forestry sector, which is the main GHG sink in Estonia. In November 2002 the Parliament approved the Estonian Forestry Development Plan up to 2010 (RT I 2002, 95, 552). The development plan attaches importance to forests in Estonian society, and plans the use and protection of forests in accordance with the principles of sustainable management. The Plan is a development document to provide more detailed rules and implement the forest policy. The Plan provides annual maximal felling allowance values, which to some extent can be modified on an as needed basis.
The National Waste Management Plan (RT I 2002, 104, 609) is an important strategic document organising waste management and providing guidance at national level. The Plan constitutes a part of Estonia’s environmental policy and it is closely connected with the National Environmental Action Plan. The Plan provides for systematic waste management, uniform goals for the state as a whole, establishes objectives and tasks for counties, local governments, businesses and for population. It has to be noted that the Plan does not cover waste that is excluded from the scope of the Waste Act; therefore gaseous effluents emitted into the atmosphere are not dealt with.
Estonian Strategy on Sustainable Development – Sustainable Estonia 21 as an alternative national development plan covering the issues of economy, culture and the environment, was elaborated in 2001-2003 and approved by the Parliament on 14 September 2005. The Strategy is based on the principles of Agenda 21 and the EU Strategy for Sustainable Development. It aims at creating an integral vision of Estonian long-term development to support integration of different policies and to co-ordinate implementation of development plans of different sectors.
With regard to the international cooperation in integration of environment into other policies, Estonia has started to implement the action programme for sustainable development adopted by all Baltic Sea countries in the framework of Agenda 21 for the Baltic Sea region.
82

4.4. New national legislation
Major international environmental standards have been transformed into Estonian environmental legislation. The Sustainable Development Act (RT I 1995, 31, 384) prescribes the most general principles of sustainable development, thus serving as a basis for all environment related legislation and relevant national programmes. Therefore, the legal acts regulating the energy, industrial and transport sectors, i.e. the sectors that are the most important for the purposes of greenhouse gases, usually take into account major environmental issues. Several aspects of the environmental legislation are stipulated in the form of the Government and minister regulations.
As regards to the energy, from 1998 till 1 July 2003 the whole energy sector was regulated by the provisions of the Energy Act. Since 1 July 2003 the Energy Act was repealed and replaced with four sub-sector specific acts: Electricity Market Act, Natural Gas Act, Liquid Fuel Act and District Heating Act.
The Electricity Market Act (RT I 2003, 25, 153) regulates the generation, transmission, sale, export, import and transit of electricity and the economic and technical management of the power system. The Act prescribes the principles for the operation of the electricity market based on the need to ensure an effective supply of electricity at reasonable prices and meeting environmental requirements and the needs of customers, and on the balanced, environmentally clean and long-term use of energy sources. Regarding the planning for development of electricity sector it is stipulated in the Act that every three years, the MoEAC has to prepare a development plan for the electricity sector and submit it to the Government for approval. This plan has to include environmental protection aspects as well. Currently, the plan is in the drafting phase. Within the context of the climate change it is important to point out that a new renewable energy support scheme was introduced in the Electricity Market Act – the obligation for distribution companies to purchase electricity generated from renewable energy sources at a price of 0.81 EEK/kWh (51.77 EUR/MWh).
The Liquid Fuel Act (RT I 2003, 21, 127) prescribes liquid fuel quality requirements, which become gradually more stringent; and mechanisms for controlling fuel enterprises.
The District Heating Act (RT I 2003, 25, 154) regulates the activities related to heat production, distribution and sale in district heating networks and terms for the connection to the network. As to heat planning, the Act introduced the new for Estonia principle – "zoning of district heating" and relevant planning activities. The Act gives local governments the power to introduce zoning of heat supply based on analyses, carried out for alternative heat supply options during planning phase. The Act provides also that in order to increase energy efficiency, to preserve the quality of the environment and to use natural resources rationally, the Government has to approve an energy conservation programme and an operational programme for the conservation programme.
Regarding the other laws related to energy the Energy Efficiency of Equipment Act (RT I 2003, 78, 525) should be pointed out. A new Act, repealing the previous one, entered into force on 1 January 2004. The new act was needed to ensure the full compliance with the EU requirements. The Act regulates the requirements for the energy efficiency and energy labelling of certain types of household appliances (refrigerators, washing machines, electrict ovens, etc.), heating equipment and installations as well as provides the bases of and procedure for their conformity assessment and attestation in order to increase the energy efficiency.
83

A completely revised Ambient Air Protection Act (RT 2004, 43, 298) was enforced in September 2004. The new Act regulates activities, which involve the emission of pollutants into the ambient air, damage to the ozone layer, and appearance of factors causing climate change. The Act provides main principles for the control of ambient air quality, sets basis for emission standards, foresees measures for reduction of air pollution, etc. The Act harmonized Estonian legislation with the relevant EU acquis. The main objective of the Act is to maintain the quality of the ambient air in areas where the quality of the air is good and to improve the quality of the ambient air in areas where the quality of the air does not conform to the requirements. The Act stipulates that activities for the reduction of climate change have to be organised by the MoE on the basis of the requirements for restriction the limit values of emissions of greenhouse gases provided by the UN FCCC and the Kyoto Protocol. The Act also provides that the possessors of pollution sources must take additional measures to reduce the emission levels of carbon dioxide and other GHG. A number of secondary level legal acts have been issued on the basis of this Act.
The Environmental Monitoring Act (RT I 1999, 10, 154), entered into force in 1999. The Act provides for the organisation of environmental monitoring, the procedure for processing and storing data obtained, and the relations between persons carrying out environmental monitoring and owners or possessors of immovables. The environmental monitoring is defined as the continuous observation of the state of the environment and the factors affecting it, with the main purpose to predict the state of the environment and to obtain data for programmes and plans and for the preparation of development plans.
The Environmental Register Act (RT I 2002, 58, 361) entered into force in January 2003. The Act provides the bases for the entry of data regarding natural resources, natural heritage, the state of the environment and environmental factors in the environmental register, for the retention of data in the register and for the processing and release of the data. The environmental register is a general national register with the function to retain and process data regarding natural resources, natural heritage, the state of the environment and environmental factors and to provide information:
for the environmental permits for the right to use natural resources, for waste management or for release of pollutants or organisms into the environment;
for organisation of the international exchange of data; for the preparation of development plans and other plans; for forecasting natural environmental factors and their impact.
The Environmental Impact Assessment and Environmental Management System Act (RT I 2005, 15, 87) entered into force on 3 April 2005 (except for some provisions) replacing the Environmental Impact Assessment and Environmental Auditing Act (RT I 2000, 54, 348). The new Act provides legal bases and procedure for assessment of likely environmental impact, organisation of eco-management and audit scheme and legal bases for awarding eco-label in order to prevent environmental damage and establishes liability upon violation of the requirements of this Act. The aim of the new Act is to bring the Estonian laws and regulations concerning environmental impact assessment into full harmony with EU acquis eliminating the shortfalls in the previous act. The new act specifies the procedure and principles of environmental impact assessment; especially the strategic assessment is regulated in detail. The new act makes strategic environmental assessment mandatory in the case of national, county and local plans and programmes. The procedures of environmental impact assessment are prescribed in a more detailed way.
The Environmental Supervision Act (RT I 2001, 56, 337) entered into force in July 2001. The Act defines the nature of environmental supervision and establishes the rights and obligations of
84

persons and agencies who exercise environmental supervision, the rights and obligations of persons and agencies which are subject to environmental supervision, and the procedure for supervisory operations.
The Integrated Pollution Prevention and Control Act (RT I 2001, 85, 512), entered into force in May 2002. The Act determines the environmentally hazardous activities and lays down the bases for the integrated prevention and control of pollution arising from such activities, in order to prevent or reduce the harmful effect of human activity to the environment.
The Nature Conservation Act (RT I 2004, 38, 258) entered into force in May 2004. The main purpose of the Act is to protect the natural environment by promoting the preservation of biodiversity through ensuring the natural habitats and the populations of species of wild fauna, flora and fungi at a favourable conservation status. The Act also promotes the sustainable use of natural resources.
The Organic Farming Act (RT I 2001, 42, 235) is also important among the legislation regulating the agricultural sector. According to the Act organic farming is the sustainable production of agricultural products reducing on the one hand the emissions of N2O caused by the use of nitrate fertilizers and promoting on the other hand the development of effective and sustainable production. A number of secondary legislative acts have been issued on the basis of this act for regulating various aspects of organic farming.
The Forest Act (RT I 1998, 113/114, 1872) entered into force in 1999 and has been amended several times. The Act regulates the management of forest as a renewable natural resource to ensure human environment that satisfies the population and the resources necessary for economic activity without unduly damaging the natural environment. The Act provides also the legal bases for forest survey, forest management planning and forest management, and regulates the directing of forestry and organisation of forest management. The Act prescribes the obligation to prepare a forestry development plan at least in every ten years.
The new Waste Act (RT I, 2004, 9, 52), which entered into force in May 2004, provides the general requirements for preventing waste generation and the health and environmental hazards arising therefrom. It also prescribes the organisation of the waste management with the objective to reduce the harmfulness and quantity of waste. The Act places the obligation to organise the transport of waste in densely populated areas on the relevant local governments. As a new element, the local governments are allowed to impose a waste tax by a regulation within their administrative territory in order to develop waste management.
4.5. Fiscal measures
The fiscal measures, which have impact on GHG emissions in Estonia, include pollution charges, excise duties and VAT taxes applied on fuels and energy.
During last years Estonia has gradually introduced excise duties on fuels. The current tax rates provided in the Alcohol, Tobacco and Fuel Excise Duty Act (RT I 2003, 2, 17) are presented in Table 4.5.1.
85


![Pärnu, Estonia · Pärnu (Estonian pronunciation: [ˈpærˑnu]; German: Pernau) is the fourth-largest city in Estonia. Located in southwestern Estonia on the coast of Pärnu Bay,](https://static.fdocuments.net/doc/165x107/6041a25d4e1f9f19c51ca775/prnu-estonia-prnu-estonian-pronunciation-prnu-german-pernau-is.jpg)