FORTIFICATION OF VEGETABLE OIL AND SUGAR WITH VITAMIN …
73
i FORTIFICATION OF VEGETABLE OIL AND SUGAR WITH VITAMIN A IN UGANDA: PROGRESS, ISSUES, COSTS AND PROSPECTS Jack Fiedler, Ph.D. Ronald Afiidra Bsc Social Sectors Development Strategies A2Z: Fortification Advisor A2Z - Washington Uganda Omar Dary, Ph.D. A2Z: Food Fortification Specialist Washington D.C. A2Z: The USAID Micronutrient and Child-blindness Project AED Washington DC May, 2009
Transcript of FORTIFICATION OF VEGETABLE OIL AND SUGAR WITH VITAMIN …

i
FORTIFICATION OF VEGETABLE OIL AND SUGAR WITH VITAMIN A IN UGANDA:
PROGRESS, ISSUES, COSTS AND PROSPECTS
Jack Fiedler, Ph.D. Ronald Afiidra Bsc Social Sectors Development Strategies A2Z: Fortification Advisor A2Z - Washington Uganda
Omar Dary, Ph.D.
A2Z: Food Fortification Specialist Washington D.C.
A2Z: The USAID Micronutrient and Child-blindness Project AED
Washington DC
May, 2009

ii
This assessment was made possible by the generous support of the American people through the United States Agency for International Development (USAID) under the terms of Cooperative Agreement No. GHS-A-00-05-00012-00. The contents are the responsibility of the Academy for Educational Development, and
do not necessarily reflect the views of USAID or the United States Government.
i
TABLE OF CONTENTS
Executive Summary
I. Introduction
A. Vitamin A Deficiency in Uganda B. Food Fortification in Uganda C. Accelerating the Pace of Fortification: Toward a More Evidence-based Approach
II. Justification for Fortifying Oil and Sugar with Vit amin A in Uganda
A. Food Consumption Data: The Gold Standard to Identify Food Vehicles and Propose Fortification Levels
B. An Opportunity to Complement and to Keep Updated the Food consumption Pattern in the Country: The HIES Surveys.
III. The Public Sector Role in Fortification
A. Introduction and Overview B. The Public Regulatory System
1. The National Working Group on Food Fortification 2. The Ugandan National Bureau of Standards, UNBS 3. National Drug Authority, NDA 4. The Uganda Industrial Research Institute (UIRI) Analytical Laboratory 5. The Ministry of Health/Department of Inspection and Certification
IV. Uganda’s Vegetable Oil Supply and Vegetable Oil Fortification
A. Vegetable Oil Production B. The Vegetable Oil and Fat Industry C. Conclusion about the Ugandan Vegetable Oil Market and its Fortification
Prospects D. Vegetable and Fat Fortification E. The Cost of Fortifying Vegetable Oil F. Alternative Fortification Cost Measures: Considering the Consumer’s Perspective
V. The Public Health Attraction of Fortified Ugandan Sugar A. Sugar Fortification Prospects B. Key Characteristics of the Ugandan Sugar Industry and Market C. Differences in the Ugandan Sugar Companies D. The Changing Ugandan Sugar Market E. Conclusions about the Sugar Industry’s Current Situation and Attitude Toward
Fortification F. The Cost of Fortifying Sugar

ii
VI. Recommendations and Conclusions A. Nutritional Significance B. Cost Implications C. Governmental Investment
Annexes: 1: Terms of Reference 2: Household Income and Expenditure Surveys 3: Adult Consumption Equivalents and Updating Future HIES Data 4: UIRI Analytical Laboratory Costs 5: The GAIN/Uganda Grant 6: Comments on What is Not Included in the Cost Analysis and Why

iii
EXECUTIVE SUMMARY
Fortification has been a topic of public health discourse in Uganda since the early 1990s. The government mandated in 1994 that only iodized salt could be imported, and in 2002 the National Working Group on Food Fortification (NWGFF) was created and included diverse public and private sector agency representatives. The first fortification intervention in Uganda, apart from salt iodization, began in 2004 when Mukwano/AK Oil voluntarily pioneered fortifying vegetable oil with vitamin A. One year later, BIDCO built a new vegetable oil factory in Uganda, and chose to fortify with vitamin A and D. These two companies produce 85 percent of the vegetable oil consumed in Uganda. Today, most vegetable oil samples in the Ugandan market show the presence of the added micronutrient; the average content has been determined as 22 mg/kg of vitamin A.1 It is estimated that 57 percent of the Ugandan population (16.3 million persons) consume vegetable oil fortified with vitamin A. The additional intake of vitamin A, assuming a daily oil intake of 15 g/day and a vitamin a content of 20 mg/kg in the fortified oil at households, is approximately 300 µg/day—equivalent to 60 percent of the Estimated Average Requirement (EAR) of this vitamin. According to the 2003 Household Income and Expenditure Survey (HIES), sugar has a wider penetration (65%; 18.6 million) than vegetable oil in Uganda, and on average a consumer eats about 34 g/day. If sugar is fortified at 10 mg/kg, as specified in the ECSA food fortification guidelines, or at 15 mg/kg, as enacted in the current Ugandan standard, sugar would be an excellent complement to fortified vegetable oil. It is estimated that the average content of fortified sugar in households, following the cited formulations, would be 5 and 7.5 mg/kg, respectively. Under the specified conditions, sugar would provide 170 and 255 µg/day of vitamin A; i.e. 34% and 51% EAR, respectively. The combination of both programs would cover 76 percent of the Ugandan population (21.7 million persons), most of whom would receive the whole daily requirement of vitamin A through consuming these two fortified foods. Other food fortification programs (in addition to fortified vegetable oil and sugar) or micronutrient interventions will be required to extend coverage to other people or provide additional vitamin A intake. However, these two programs would constitute a remarkable public health achievement in the country.
This study was carried out to help develop a more evidence-based fortification program in Uganda. The industry and governmental costs of vegetable oil and sugar fortification programs were calculated; deductions and recommendations are offered to improve the efficiency of the oil program and to favor introducing the sugar fortification program.
1. The Food Regulatory System in Uganda This report includes a chapter that examines the public sector’s complex role in the fortification program. While regulatory system specifics have been planned, implementation actions are still being discussed. In some instances, specific activities 1 A most recently result in 2009 found that the vitamin A level at retail stores was 31 mg/kg.

iv
still need to be identified. In other instances, agencies charged with some fortification-related responsibilities have not been allocated budgetary resources to enable discharging those responsibilities adequately. In still other instances, agencies do not having adequate capacity to implement what they have been charged to do. A final reason for the incomplete articulation of the regulatory system is that quality control and monitoring activities require striking a balance between private sectors’ compliance with regulations and the government enforcing compliance at a reasonable cost. This balance must be mutually acceptable to the private and public sectors. Three observations—
(1) Some key public regulatory agencies’ fortification-related activities are inadequately defined,
(2) All agencies are performing multiple tasks, of which their “new” fortification-related activities are but one, and
(3) The intensity of fortification-related activities (i.e., the frequency, sample numbers, etc) will be largely determined by budget availability.
To date the public sector costs are subjective and only activities related to the following agencies have been estimated:
• Ugandan Bureau of Standards (UNBS) cost to inspect a single factory • UNBS’s costs to monitor fortified food imports • Costs for the National Drug Authority (NDA) to certify premix producers, and to
test quantitative assays of imported premix • Ministry of Health’s costs for its food inspector’s work to sample and test
fortified foods at retail sales outlets • Ugandan Industrial Research Institute (UIRI) analytical laboratory costs to
conduct quantitative tests of vitamin A (for UNBS and the MOH).
The total public sector cost estimates for regulating fortification were approximate, and may not reflect the reality of current actions. It was estimated that the country needs to allocate 67 to 100 million UGX (US$40,000 to US$60,000) yearly to cover the cost of the governmental food control for all the food fortification programs at factories, importation sites, and retail stores. The Food Control in Uganda chapter describes the fortification regulatory system’s development, general activities remaining key policy issues that need to be addressed. This chapter also discusses each agency’s role and objectives.

v
2. The Private Sector Cost of Fortifying Vegetable Oil with Vitamin A in Uganda
This report analyzed the vegetable oil industry of Uganda, focusing on characteristics that are pertinent to the feasibility, cost, and impact of fortifying oil with vitamin A. The production processes of the two largest plants are described and a prototype model from the two companies’ data is devised so as not to disclose sensitive proprietary data. The model is used to estimate the annual incremental, recurrent costs of fortifying vegetable oil with vitamin A. The key findings about the recurrent costs to fortify 85 percent (105,000 MT) of the demand of vegetable oil in Uganda are:
• using Retinol Palmitate 1 million IU/g—954.4 million UGX (US$573,320) • using Retinol Palmitate 1.7 million IU/g—907.9 million UGX (US$545,453) • the average cost of fortification per liter of oil is 8.070 UGX (US$0.0048) • the cost of fortification as a percent of the retail price of a liter of vegetable oil is
0.26 percent • the start-up or one-time capital costs per factory is 31,118,250 UGX (US$9,050) • The premix is roughly 400 million UGX (US$ 240,240), representing 89 percent
of the total annual recurrent costs of fortification.
3. The Private Sector Cost of Fortifying Sugar with Vitamin A
It is commonly thought that the three largest sugar companies in Uganda—which together produce roughly 85 percent of the domestically produced sugar in the country—have long been willing to fortify. This is no longer the case. The sugar industry’s market, structure, and business strategies are analyzed to assist public officials understand “where” the sugar industry is, what its concerns are, and where other Government of Uganda (GOU) actions, rules, or agreements affect or could affect the industry. This analysis gives the GOU some “tools” to negotiate more effectively with the sugar industry and to provide a better understanding that sugar fortification will likely need to be mandated to be realized in Uganda.
An estimate of the costs is presented. The GOU’s sugar fortification standards are still in draft form. If fortification occurs at 15 mg/kg, then it is estimated that:
• the annual, incremental cost to fortify all domestically produced sugar in Uganda is 3,600 million UGX or US$2,158,656
• The cost of fortifying a ton of sugar is: 17,971UGX (US$10.79) • the cost of sugar fortification is 1.06 percent of sugar’s retail price • the start-up or one-time capital costs— 200,000,000 UGX (US$120,000) per mill • the premix vitamin A cost is roughly 95 percent of the total annual recurrent
fortification costs.

vi
4. Comparing the Costs and Coverage of Sugar and Vegetable Oil Fortification The average per capita consumption of oil adjusted for those who do not purchase oil (43% of the population), is 15 grams per day. Thus, the annual investment is 50 UGX (US$0.030) for each oil consumer. The average per capita consumption of sugar, adjusted for the 35 percent who do not purchase it, is 34 grams per day. It was estimated that at fortification levels of 10 mg/kg (ECSA Guidelines) and 15 mg/kg (current Ugandan standard), the cost of fortification would be 12,487 UGX (US$7.50) and 17,971 UGX (US$10.79) per metric ton, respectively—a yearly consumer investment of 150 UGX (US$0.090) and 225 UGX (US$0.135), respectively. While the cited fortification levels of sugar and oil result in delivering very similar percentages of the daily EAR of vitamin A, the cost of fortifying sugar is 5 times higher than fortifying oil. The cost difference comes from the type of vitamin A compound used; sugar requires a microencapsulated powder that is dispersible in water. Because vegetable oil fortification has limited coverage in Uganda (57% of the population), and the supply of vitamin A is limited (60% EAR on average), sugar fortification is necessary to reach epidemiological goals. The combined use of oil and sugar fortification seems to be a proper strategy. The annual investment per person would be 200 UGX (US$0.120)2, and the total population coverage would be 76 percent (21.7 million persons). Whether the combined food fortification program (vegetable oil and sugar) delivers to the “right” Ugandans—i.e., those who are vitamin A deficient (VAD) and those who are most severely VAD is not known. This is a question that Uganda must answer much more definitively with data from the food consumption survey in progress. Modeling fortification impacts with food consumption data will show whether or not fortifying both sugar and oil will increase coverage to reduce VAD and if so, whether the current UNBS fortification standards should be modified to balance impact and safety.
2 Adopting the ECSA Guidelines of 10 mg/kg vitamin A for sugar fortification.

1
CHAPTER ONE
I. Introduction
A. Vitamin A Deficiency in Uganda
In 2001, 28 percent of Ugandan children 6 to 59 months old suffered from vitamin A deficiency (VAD), based on low serum retinol levels as determined by HPLC from blood samples spotted on paper filter. Although substantial variation in VAD prevalence across Uganda’s four regions exists (see Figure 1.1), throughout the country the VAD level exceeds the 15 percent prevalence threshold that the International Consultative Group of Vitamin A (IVACG) recommends to identify a national public health problem. The most recent valid and reliable nationally representative data about vitamin A status in Uganda is from 2001,3 however, VAD prevalence has likely fallen since then due to two factors: (1) the start in 2004 of a vegetable oil fortification program which now covers an estimated 85 percent of the domestic vegetable oil market, and (2) the introduction of Child Days Plus (CDP) the same year. CDP is a twice-annual campaign-style event designed to increase the coverage of vitamin A, de-worming, immunization, treatment of neglected tropical diseases and, depending on the districts’ decisions, one or more health services. Since its inception, the CDP posted generally increasing coverage rates, ranging from 52 to 74 percent. Then, in 2007, coverage fell dramatically to 29 percent (see Figure 1.2). It is uncertain whether the CDP program has recovered lately, but if not VAD prevalence rates may once again be increasing. However, given vitamin A oil fortification and the fact that the CDP covers nearly a third of children 6-59 months means that prevalence is still probably less than in 2001.
22%
28%
36%
29%28%
0%
5%
10%
15%
20%
25%
30%
35%
40%
Central Eastern Northern West Nationwide
Pre
vale
nce
of V
AD
Figure 1.1: The prevalence of low serum retinol levels in pre-schoolers (6-59 months old) of different regions of Uganda in 2001. Source: UDHS 2001.
3 The 2006 Ugandan DHS used a vitamin A test that is not reliable for providing acceptably information about vitamin A status.

2
74%
29%
65%66%66%
70%
52%
0%
10%
20%
30%
40%
50%
60%
70%
80%
May-04 Aug-04 Nov-04 Feb-05 May-05 Aug-05 Nov-05 Feb-06 May -06 Aug-06 Nov-06 Feb-07
Per
cent
of C
hild
ren
6-59
Mon
ths
Old
Rec
eivi
ng a
Vit
amin
A C
apsu
le
Figure 1.2: The Evolution of the coverage of the vitamin A supplementation through the Child Day Plus program in Uganda (May 2004 to April 2007). Source: A2Z/UG coverage files. B. Food Fortification in Uganda Food fortification has been viewed as a potential strategy for reducing micronutrient deficiencies in Uganda since at least the early 1990s. The promise of fortification as a tool for combating VAD and other micronutrient deficiencies has been widely discussed. The box below presents a timeline of major fortification-related activities in Uganda since 1991. Currently, in addition to imported iodized salt, four companies in Uganda are fortifying: the Mukwano Group of Industries’ AK Oil is fortifying vegetable oil and fat (VOF) with vitamin A; BIDCO Uganda Ltd. is fortifying VOF with vitamins A and D; and two maize flour companies, UNGA 2000 and Maganjo, are fortifying with a premix containing several vitamins and minerals. Oil fortification covers 85 percent of the Ugandan market, while maize fortification represents only a small food fortification effort. This study tries to answer information gaps, and to help the government and Ugandan industry to take well-informed decisions. This study focuses on oil and sugar, as suitable vehicles for vitamin A.

3
1991: Makerere University conducts a food consumption survey in Kamuli district
1993: Rapid assessment study in 37 or 39 districts found high levels of VAD, IDD and anemia
1994: Government mandates all imported salt to be iodized in compliance with Food and Drugs Acts
1995: UNICEF sponsors a fortification study tour to Zambia
Government negotiates with sugar factories to fortify with Vitamin A. Negotiations on-going through 1997, but not conclusive.
1998: Ministry of Health commissions UBOS to conduct a National Consumption Survey.
1999: MOST conducts a Situation Analysis assessing the feasibility of vitamin A fortification in Uganda
2001: Makerere University's Food Science and Technology Department conducts an IndustryMakerere University's Food Science and Technology Department produces an IndustryAssessment Report focused on maize flour and edible oil as suitable potential foodfortification vehicles based on the number of persons consuming them
Management of the Mukwano Group--owner of AK Oils--approves of the concept of fortification
2002: The National Working Group for Food Fortification (NWGFF) established by the MOH.
2003: A food consumption survey is conducted by Makere University.Makerere University conducts a food fortification survey.
MOST provides training in fortification issues and techniques, and sponsors NWGFF members on a study tour to Morocco
Food fortification standards are established by the Ugandan National Bureau of Standards.
2004: National Fortification Campaign was started. National Food Fortification Campaign starts.16 laboratory technicians from 11 public and private institutions trained in food fortificationanalytic methods to build national capacity for monitoring & evaluation and regulatory purposes.
2005: Fortification assessments and trials held in: Mukwano/Oil; Kakira/Sugar; and Maganjo/Maize
MOST purchases capital equipment and initial supplies of fortificant/premix for a few days of operation to facilitate fortification uptake by the participating oil and maize flour industries. The trial carried out at the sugar company only aimed to show feasibility.
Two new oil companies, BIDCO and Muddu, are established. BIDCO fortifies all oil with vitamin A and D. Muddu is receptive to the idea of fortifying, but never actually started fortifying. The company is reported to be bankrupt and in receivership (June 2008).
2006: Food fortification standards are revised with technical assistance of A2Z to adjust levels and procedures to those agreed in a 2005-ECSA meeting.
Food Control Workshop held in October to develop a monitoring plan for fortified oil, maize and salt at production, retail and importation sites. The first round of application QA/QC and inspection sampling and testing was carried out to establish a UNBS-led regulatory system.
2007: ECSA develops food fortification guidelines and produces a set of manuals of foor control for salt, oil and wheat flour, which have been applied in the QC/QA and inspection rounds for adjusting and validating the tools.
2008: GAIN fortification grant focusing on maize and wheat flour and vegetable oil is awarded A food/nutrient survey to assess quality of the diet, and penetration and use of food fortification vehicles starts with the technical and economical support of A2Z and GAIN. WFP extend the effort to other regions.
Timeline of Major Fortification Events in Uganda

4
C. Accelerating the Pace of Fortification: Toward a More Evidence-Based Approach A more formal, evidence-based fortification policy in Uganda is needed. Developing one will require the National Working Group on Food Fortification (NWGFF) to establish a new initiative that emphasizes developing and using data and documents, and making them readily and widely available to not only members of the NWGFF, but the general public. This evidence-based approach identifies the program’s progress and goals and increases the likelihood of its permanence and continuous success. The public sector needs to understand the context and plight of its private sector partners to create an environment of mutual trust and partnership. The economics of potential food industries and how fortification might affect them must be examined. This report discusses some economic aspects of sugar production in Uganda to sensitize the public to their situation, their interests, their concerns, and the uncertainties that they confront, so they better understand the sugar industry’s position and can identify leverage possibilities that will encourage these companies to fortify. A similar, but less in-depth analysis of Uganda’s vegetable oil industry is discussed. The study examines the government’s cost to enforce and supervise food fortification activities.

5
CHAPTER TWO II. Justification for Fortifying Oil and Sugar with Vitamin A in Uganda A. Food Consumption Data: The Gold Standard to Identify Food Vehicles and
Propose Fortification Levels To design a food fortification program one would ideally want to know the number of individuals who have micronutrient deficiencies, the specific type or types of micronutrients in which they are deficient, the severity of each deficiency, and the quantities of each potential food vehicle they consume. This information could then be used to model quantitatively the need for a fortification program, measure the potential coverage of a fortification program, and estimate the potential impact of the program, at various fortification levels. Unfortunately, as in most countries, a dearth of such data exists in Uganda. While some food consumption surveys exist (as noted in the Fortification Timeline Box in the preceding chapter), those data were not widely distributed and are not now widely available. The food consumption survey currently being conducted by Makerere University (in conjunction with the MOH, UBOS, A2Z, and GAIN) will provide micronutrient information for a sub-national sample of households. When available, the information should be used to examine Uganda’s general food fortification strategy and other micronutrient interventions. B. An Opportunity to Complement and to Keep Updated the Food Consumption Pattern in the Country: The HIES Surveys Uganda has empirical data with which to address the important issues about purchasing and consuming industrially-produced foods, to identify potential fortification vehicles. The Uganda Household and Income Expenditures Survey (HIES) has been conducted by UBOS once every three to five years since the mid-1990s. Although the HIES does not directly measure food consumption data, its probability sample is representative down to the regional level of Ugandan households’ food expenditures. The survey data could be a good proxy of food consumption patterns in the country, as illustrated in Figure 2.1. No information available—for any country in the world—rigorously addresses how well expenditure data serves as a proxy for food consumption data. Several characteristics about HIES constitute a compelling case for using these data (see Annex 2).

6
Figure 2.1: The Skewed-Right Cumulative Distribution of Oil and Sugar Apparent Consumption in Uganda, 2003 (in grams per adult equivalent per day); the data do not make adjustments for usual intake. Source: Elaborated by Marc-Francois Smitz using weighted UBOS Uganda HIES 2003 data.

7
HIES data offer opportunities to improve the selection and formulation of fortified foods. HIES data provide information that distinguishes between all food supplies and those that are purchased, thereby bringing greater precision to the analysis of the food quantity that is commercially accessible and thus characterized as being more “fortifiable.” These quantities can vary dramatically, which has important implications for a prospective economic feasibility study of fortification. The HIES distinguishes between those households that purchase some food and those that do not. This has important implications for prospective studies estimating the potential coverage of fortification. In the case of Uganda in 2003, for instance, 35 percent of households reportedly do not purchase sugar, 43 percent do not purchase vegetable oil, and 62 percent do not purchase maize. Thus, while it is common knowledge that “everyone” eats maize or maize products in Uganda, knowing that only 38 percent of Uganda households purchase it, means that maize flour is a much less attractive fortification vehicle in terms of coverage than sugar or oil. To exemplify the significance of this difference, we demonstrate the use of total population and total output for estimating individual consumption patterns: [(86,580 tons of edible oil & fats/year) / (27.6 million persons)] = 3.1 kg/person/year
3.1 kg/person/year = 8.5 grams per person per day From the HIES we know that only 57 percent of the population purchases vegetable oil. Substituting 57 percent of the population in the calculation: [(86,580 tons of edible oil & fats/year) / (15.7 million persons)] = 5.5 kg/person/year
5.5 kg/person/year = 15.1 grams per person per day This provides an estimated average apparent consumption per person per day that is 78 percent greater than the entire population-based estimate. The HIES data show that the consumption profile is skewed toward higher values inferring that a small portion of the population is eating more than the majority of the population (review Figure 2.1). However, like the food/nutrient surveys, extreme variation values should be corrected, to determine the usual consumption pattern rather than single estimates that may be highly affected by outliers. For example, Figure 2.1 shows the skewed distribution to the high values for oil and sugar consumption, estimated per adult equivalent. Nevertheless, the values between P-25 and P-75 may be useful to approximate the usual consumption distribution of those foods in the country in terms of adult equivalents. In any case, the difference between individuals with high consumption as compared with those with low consumption may be as high as 4 to 6 times in the mentioned range of distribution profile. Given the information void about individual consumption levels and using household purchases as its proxy, estimating the intra-household distribution of the household’s purchases of the vehicle in question is critical. The simplest approach uses HIES information about household size and implicitly assumes that all individuals in the household receive equal amounts of the food. This approach does not consider age or sex
8
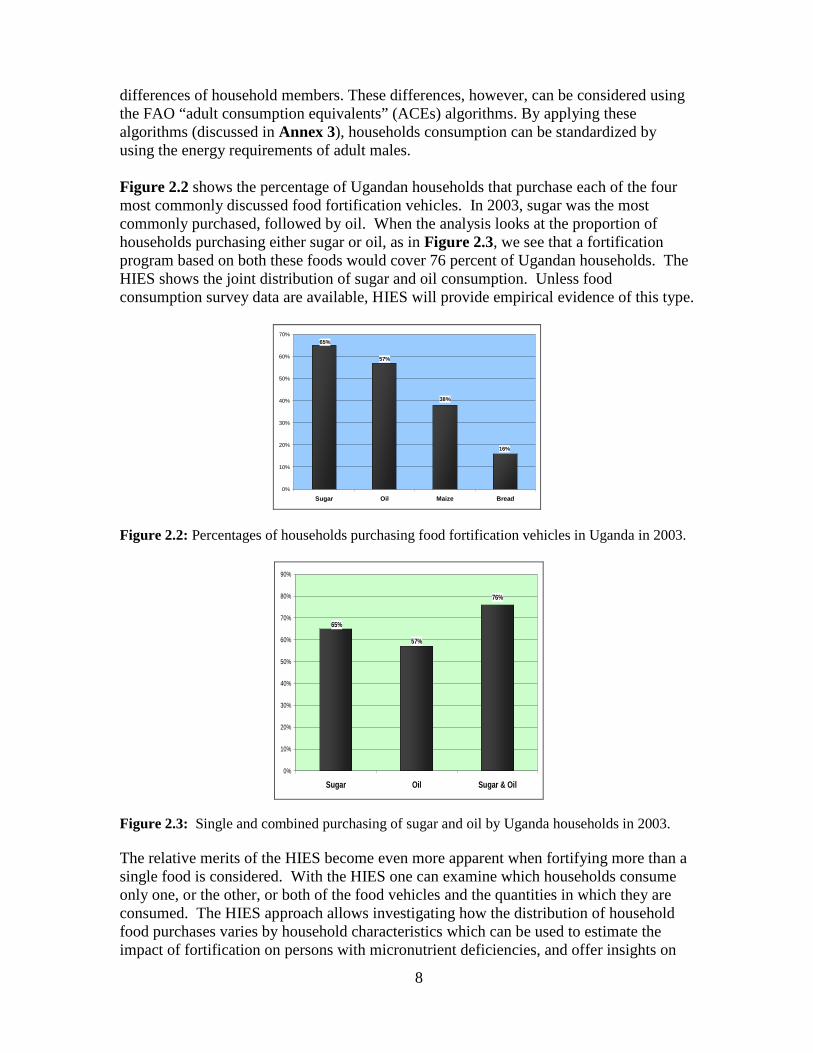
differences of household members. These differences, however, can be considered using the FAO “adult consumption equivalents” (ACEs) algorithms. By applying these algorithms (discussed in Annex 3), households consumption can be standardized by using the energy requirements of adult males. Figure 2.2 shows the percentage of Ugandan households that purchase each of the four most commonly discussed food fortification vehicles. In 2003, sugar was the most commonly purchased, followed by oil. When the analysis looks at the proportion of households purchasing either sugar or oil, as in Figure 2.3, we see that a fortification program based on both these foods would cover 76 percent of Ugandan households. The HIES shows the joint distribution of sugar and oil consumption. Unless food consumption survey data are available, HIES will provide empirical evidence of this type.
16%
38%
57%
65%
0%
10%
20%
30%
40%
50%
60%
70%
Sugar Oil Maize Bread Figure 2.2: Percentages of households purchasing food fortification vehicles in Uganda in 2003.
76%
57%
65%
0%
10%
20%
30%
40%
50%
60%
70%
80%
90%
Sugar Oil Sugar & Oil
Figure 2.3: Single and combined purchasing of sugar and oil by Uganda households in 2003. The relative merits of the HIES become even more apparent when fortifying more than a single food is considered. With the HIES one can examine which households consume only one, or the other, or both of the food vehicles and the quantities in which they are consumed. The HIES approach allows investigating how the distribution of household food purchases varies by household characteristics which can be used to estimate the impact of fortification on persons with micronutrient deficiencies, and offer insights on

9
how to target other micronutrient interventions to people not likely to be reached or adequately affected by fortification efforts. These important issues influence health and nutrition program design and policy-making. The HIES data also allow us to investigate household characteristics affected by fortification. Figure 2.4 provides expenditure data for only rural poor households. The data show that sugar and oil are purchased by 40 and 41 percent of all rural-poor households, respectively, making them the preferred fortification vehicles, relative to maize and bread, which only 24 and 3 percent of rural-poor households purchase. Figure 2.5 shows that if we consider fortifying sugar and oil, the number of households reached increases to 57 percent. This is important information for public health policy makers.
3%
24%
41%40%
0%
5%
10%
15%
20%
25%
30%
35%
40%
45%
Sugar Oil Maize Bread
Figure 2.4: Percentage of rural households purchasing the major potential food fortification vehicles in Uganda.
57%
41%40%
0%
10%
20%
30%
40%
50%
60%
70%
80%
90%
Sugar Oil Sugar & Oil
Figure 2.5: Percentage of rural households purchasing either sugar or oil or in combination in Uganda.

10
CHAPTER THREE III. The Public Sector Role in Fortification
A. Introduction and Overview This chapter discusses the public sector agencies involved in the food fortification program and the food regulatory system structure. It then considers how each different public entity is involved in the fortification program, and discusses activity costs. Three observations—
(1) Some key public regulatory agencies’ fortification-related activities are still inadequately defined;
(2) All agencies are performing multiple tasks, of which their “new” fortification-related activities are but one; and
(3) The intensity of fortification-related activities (i.e., the frequency with which
many of the public agencies’ fortification-related activities will be carried out) will be largely determined by budget availability.
—together, render the public sector’s costs a subjective and somewhat artificial undertaking. This is not the case for all public agency activities involved in regulating the fortification program. In instances where the type, content, and frequency of activities are clearly defined and universally accepted as established—costs were estimated. This chapter describes the fortification regulatory system’s development, general activities remaining key policy issues that need to be addressed. This chapter also discusses each agency’s role and objectives.
B. The Public Regulatory System
The Ministry of Health (MOH) enforces food safety standards set forth in the Food and Drug Act. Fortification-related activities are but one part of the Ministry’s responsibilities related to the Food and Drug Act. The MOH staff assigned to the micronutrient (fortification) program and more generally to nutrition is thin. The micronutrient section under the MOH Nutrition Department has two staff-persons. The Commissioner of Child Health coordinates NWGFF and heads an internal MOH working group composed of a secretariat and staff to lead the fortification program:
• a senior environmental health inspector, who oversees the Ministry’s front-line district-level food inspector and environmental health inspectors of the Department of Inspection and Certification,
• the Ministry’s Senior Health Educator, who works on the social communication-related fortification activities, and
• the MOH contact person for the NWGFF on safety, quality control and standards.

11
Each leads several activities of which fortification-related tasks are simply one among many activities. With this small staff and even smaller budget, the Ministry coordinates the NWGFF and oversees food fortification-related inspection, certification, quality control, social communication, and various monitoring and evaluation activities. Consequently, the MOH relies on international agencies for resources. The most support has come from the USAID-A2Z project and more recently from GAIN. Outside of these grants, the MOH has cobbled together whatever international agency multi-purpose resources it could mobilize to address issues and needs as they arise. 1. The National Working Group on Food Fortification
The National Working Group on Food Fortification (NWGFF) was established in 2002 under the Ministry of Health. The NWGFF provides a forum for a wide range of institutional stakeholders to collaborate on all fortification-related topics. The MOH Commissioner for Child Health Services chairs the NWGFF and while the MOH Nutrition Department head coordinates it. The NWGFF has four technical groups, each headed by a technical expert from a non-MOH organization who coordinates with a designated MOH point-person (see Figure 3.1)—the Production/Industries group, however, has no MOH counterpart.
Ministry of Health
National Working Group on Food Fortification (NWGFF)
Chair: Dr. Sam Okware, Commisioner, Child Health
Services, MOHCoordinator: Dr. Jacinta Sabiiti,
Nutrition Dept., MOH
Monitoring & Evaluation
Safety, Quality Control, Standards
Production/ Industries Social Mobilization/Communica tions
Makerere University UNBS NARO, Food Biosciences Center Uganda Consumer Protection Agency (UCPA)Dr. William Kyamuhangire Mr. David Eboku Dr. William Ssali Mr. Sam Watasa
MOH: Ruth Margola MOH: Dr. Agaba Friday MOH: Mr. Tabley Bakyaita
Figure 3.1: The Ugandan National Working Group on Food Fortification in 2008. The NWGFF generally meets monthly and more frequently if needed. The group includes private sector and the line ministries members, including: Agriculture, Trade, Industry, Health, Education and Finance. Major NWGFF partners listed below guide and implement the program:
• MOH • Uganda National Bureau of Standards (UNBS) • Uganda Bureau of Statistics (UBOS) • Uganda Virus Research Institute (UVRI)

12
• Uganda Industrial Research Institute (UIRI) • National Drug Authority (NDA) • Uganda Revenue Authority (URA) • Uganda Consumer Protection Association (UCPA) • Food Sciences and Technology Department/Makerere University • Food Bioscience Research Center – NARL • Private sector represented by Mukwano, Bidco, Maganjo, Unga
2000, Kendo Mills, and Ntake.
In addition, several development partners regularly attend meetings. The partners—foremost UNICEF, GAIN, and A2Z—provide various types of support to different fortification program activities, including:
• National advocacy and communications campaigns for promoting good health, good nutrition, and fortified food consumption,
• Technical assistance in developing the regulatory system for fortification, • Technical and financial assistance for the food consumption survey currently
being conducted by the Food Sciences and Technology Department of Makerere University, and
• Technical assistance in working with the private sector, conducting industrial assessments and trials, and training in quality assurance and quality control.
As Figure 3.2 shows, the food regulatory system of Uganda involves many agencies. From the fortification program’s perspective, the most important food regulatory system actors are:
• National Working Group on Food Fortification—which includes more than 20 partners, including nine different government agencies,
• Uganda National Bureau of Standards (UNBS), • National Drug Authority (NDA), • Uganda Industrial Research Institute (UIRI), and • Ministry of Health’s local (district level) food inspectors.

13
Micronutrient Producer (Foreign
Country)
Fortified Food Producer (Foreign
Country)Micronutrients &
PremixesFortified Foods
AGENCIES INVOLVED: NDA, UNBS, UIRI, URA,
MAAI&F*
AGENCIES INVOLVED: UNBS, UIRI, URA,
MAAI&F
Factory Inspections Fortified Food TestingAGENCIES INVOLVED:
NDA, UNBS, UIRIAGENCIES INVOLVED:
UNBS, UIRI, MOH
AGENCIES INVOLVED: UNBS, UIRI, MOH
Ugandan Import Port-of-Entry
Fortifying Ugandan Food Plants
Market (Retail Outlets) InspectionFortified Food Testing
Figure 3.2: An overview of the Ugandan regulatory system of the food supply chain.
* Ministry of Agriculture

14
2. The Ugandan National Bureau of Standards, UNBS a. Structure UNBS is a parastatal institution established by Chapter 327 of the Laws of Uganda under the Ministry of Tourism, Trade and Industry (MITTI). It is mandated to coordinate standards development—food standards and many non-food standards—and is a member of the International Organization for Standardization (ISO). UNBS became active in food fortification in 2002. UNBS is the country contact point for the WHO/FAO Codex Alimentarius Commission on Food Standards. The UNBS’s primary food safety responsibilities are to: develop standards, inspect imports, and provide quality assurance (QA) monitoring and testing at factories. As the lead government agency responsible for monitoring food safety, based on the Food and Drug Regulations of 2004, UNBS monitors fortified products. As shown in Figure 3.3 UNBS has four departments. Fortification standards are developed by the Standards Department. The Quality Assurance department inspects imported fortified foods and factories and conducts market surveillance. The Testing Department tests fortification levels in imported foods and fortified foods produced in Uganda.
Ministry of Trade, Tourism & Industry (MITTI)Minister of MITTI
National Standards Council (NSC)Executive Director of NSC
Uganda Nat'l Bureau of Standards
Food DirectorateAdministration, Finance & Budget
Technical Operations
Standards Department QualityAssurance Testing Metrology
Food & Agriculture Standards Product Specifications LaboratoriesEngineering Standards System Specifications
Environmental Standards Import Inspection at Entry P ointsMarket Surveillance
The Structure of the Uganda National Bureau of Stan dards, UNBS
Calibration of Dosifiers
Figure 3.3: The structure of the Uganda national Bureau of Standards (UNBS) b. Standards Development The UNBS has had food standards since 1993. UNBS’s Standards Department convenes ad hoc technical committees comprised of consumers, manufacturers, traders, government, academicians, and other stakeholders exclusively to develop the standards, which are then circulated to other stakeholders and the general public for comment. The National Standards Council reviews the committees’ recommendations and then officially adopts the standards. UNBS’s first fortification activities occurred in 2002, with a stakeholders’ workshop to sensitize and train industry on certification and using standards. The NWGFF established a Fortification Standards Committee and workshop in July 2003. In 2005, another

15
Technical Committee, with largely the same composition, revised the food fortification standards to align them with the ECSA food fortification guidelines. The current official UNBS regulations are noted in Table 3.1.
Table 3.1: The UNBS Revised Fortification Regulations Uganda Standards (US), Third Edition 2006-011-14
Document Number Document Title US 500:2003 Regulations for nutrition labeling of foods US 508:2003 Regulation for nutrition and health claims on foods US 510:2006 Specification for fortified sugar US 203:2006 Edible salts - Specifications US 509:2006 Fortified milled maize products - Specifications US 511:2006 Fortified fats and oils – Specification US 561:2006 Fortified wheat flour US 566:2006 Use of nutrition claims – Requirements
c. Inspection, Monitoring, and Quality Control: Activities and Costs The UNBS’s recurrent costs for fortification relate to factory and import inspections.
1) Factory Inspection The UNBS inspects factories by visiting and reviewing the plants technically—both and their internal physical structure and their internal systems of quality control and quality assurance. For certification, plants must comply with Good Manufacturing Practices (GMP)—a set of regulations, that requires food manufacturers, processors, and packagers to ensure that their products are safe, pure, and high quality. GMP regulations require a quality manufacturing approach to minimize or eliminate instances of contamination and other errors that might put consumers at risk of purchasing ineffective or dangerous products. GMP raise the generally accepted industry standards in Uganda and are guided by international practices. The UNBS’s fortification-related responsibilities are incremental additions to their food hygiene and safety responsibilities. Five UNBS inspectors visit and inspect all food factories in Uganda, not just those fortifying. While standards call for two or three visits per year, UNBS acknowledges that realistically, at this moment, it can reach each factory once a year. Table 3.2 shows the time and material inputs and estimated costs of a factory visit and the estimated cost of a single factory inspection. If each fortifying factory (assuming 3 of oil and 3 of sugar) is inspected just once a year, it will cost 3.3 million UGX (US$1,985) for the 6 visits and 9 days of UNBS inspector time (6% time). Adhering to UNBS standards would require 18 factory visits per year, cost 9.9 million UGS (US$5,955) and require 20 percent time of a full-time equivalent inspector.

16
1. Personnel Costs
2,600,000 Senior inspector pay per month1,700,000 Junior inspector pay per month2,150,000 Avg. inspector pay per month
97,727 Avg. inspector pay per day--assuming 22 working days / month35,000 Drivers' pay per day--assuming 22 working days / month
220 working days per year
146.6666667 max number of factory visits per inspector per year--if visiting every day and 1.5 days/factory
Calculating the Average Factor Visit Time Requireme nt2-3 hours per factory + travel~1 day per factory in Kampala~1-2 day per factory outside of Kampala (but if coordinate multiple visits per trip…)Average of 1.5 days per factory
2. Per Diem Costs70,000 Per diem per person
3. Transportation Costs180,000 Vehicle cost per day (US$108.11) includes a driver, but not diesel+oil OR
Transportation costs--using UNBS vehicle (depreciation)Fuel Costs: 1 liter=2,600 UGX 7km/liter. Toyota double cabin/landcruiser (Average distances--KPLA to: North=1,200; West=1,200; East=800; Central=100 km)Assume average distance= 200km. 200km / (7km / liter)= 74,286 In US$ = 44.62
4. Total Cost per UNBS Visita) 595,877 Inspection costs if 1.5 days per factory with rente d vehicle (UGX)
357.88 In US$b) 483,377 Inspection costs if 1.5 days per factory with UNBS vehicle (UGX)
290.32 In US$ STILL TO ENTER DEP/USE VALUE OF UNBS VEHICLEc) 550,877 Weighted average of two vehicle arrangements: 2 UNBS vehicles, 3 rented (UBX)
330.86 In US$
Table 3.2: UNBS Costs -1Factory Inspections - Auditing and Sampling
2) Quality Assurance UNBS standards set forth specific guidelines for conducting tests (qualitative and quantitative) on fortified foods produced in Ugandan factories. The guidelines identify the frequency with which to conduct each type of test, and stipulates whether the private company itself conducts the tests—i.e., as part of the company’s internal (or in-plant) monitoring—or whether an external entity conducts the tests as part of the Government regulatory system’s quality control (referred to as “external monitoring”). These testing requirements for fortified foods are presented in Table 3.3. The UNBS’s Quality Assurance Department visits factories and reviews procedures and products to ensure adherence to Uganda food safety standards, including the fortification standards. The UNBS’s Testing Department oversees external monitoring of food factories. To fulfill its quality assurance mandate, the UNBS Testing Department has authorized the Uganda Industrial Research Institute (UIRI) analytical laboratory unit to conduct quantitative tests, which are paid for by the private companies. UIRI charges 80,000 UGX (US$48) per vitamin A test (discussed below).

17
Food Regulations-Specified Sampling Methods & Testin g FrequencyType of
Monitoring Type of TestNumber of
Quantitative Tests
Vegetable Oil Fortificant Sample: At least once a month, take two 30 g samples-send to Internal Quantitative test of Vitamin A 24/Year an external lab
Packaging Department: Sample every hour ==> one composite sample/batch Develop one composite daily from the shift composite samples--per each factory Internal Semi-quantitative of Vitamin A
Shift testing (=300 days x 7 batch = 2100/batches/year; 2100 tests/year for all batches) InternalSemi-quantitative analysis of Vitamin A per batch
Composite Sample: At least once a month, send two daily-composite samples to Internal Quantitative test of Vitamin A 24/Yr/Factory an external lab (minimum: 24 tests/year)--for each factory
TOTAL TESTS PER YEAR: QUANTITATIVE 48; SEMI-QUANTITATIVE 4,200
On each of at least 3 annual visits to the factory, take two 30-gram samples.
-- One to be analyzed by UNBS ExternalSemi-quantitative analysis of Vitamin A
-- One to be analyzed by UNBS - UIRI / NDA External Quantitative test of Vitamin A 3/Yr/Factory
Sugar Fortificant Sample: At least once a month, take two 30 g samples-send to Internal Quantitative test of Vitamin A 24/Year(draft only) an external lab
200-g samples every 30 minutes 2 composite samples for each 8-hour shift Internal Quantitative test of Vitamin A 50/Yr/FactoryDaily composite sample of the shift-composite samples. At least once every two weeks select two daily composite samples and send to an external lab (minimum: 50 tests/year)
Two tests per shift (=100 days x 3 = 300 shift/year; 600 tests/year per factory; 1800 tests/country) Internal Semi-quantitative analysis of Vit. A, two per shift
Fortificant Sample: On each of at least 3 annual visits to the factor, take two 30 gram samples. One to be analyzed by UNBS External Semi-quantitative analysis of Vit. A One to be analyzed by UNBS - UIRI / NDA External Quantitative test of Vitamin A 3/Yr/Factory
Importation For each batch, truck, or consignment take and test 3 samples. Test for presence Qualitative tests of vitamin ASite Inspections of micronutrients--assume only Vitamin A and Iron Qualitative tests of ironof Fortificants & For each brand, develop monthly composite sample Quantitative test of Vitamin A 12/Yr/BrandFortified Foods For each brand, develop monthly composite sample Quantitative test of Iron 12/Yr/Brand
Table 3.3: Regulatory QA/QC Requirements: Sampling Procedures, Test Types and Testing Frequencies

18
3) Inspection of Imports UNBS does two distinct things when inspecting imports:
1. Checks that key micronutrients are present in imported foods being authorized by qualitative testing 3 samples from each consignment/truck.
2. For imports passing initial qualitative testing: document compliance monthly in terms of quantitative micronutrient content in a laboratory of reference. Brands that fail the composite tests must be notified and UNBS takes three samples of the brand’s subsequent import consignment and immediately sends them for testing before allowing the batch to enter the country.
When inspecting imports, enforcement officers assess the extent to which fortified foods importers comply with local regulations related to specific foods. This ensures that only properly fortified foods are imported and distributed to consumers. Inspecting imports involves collecting food samples and reviewing documentation and declarations on food labels. Officers review the Certificate of Analysis (COA), Certificate of Conformity (COC) and Certificate of Country of Origin (COCO) accompanying imported food batches, collect samples at ports of entry, and test them qualitatively. UNBS works with Uganda Revenue Authority (URA) and Ministry of Agriculture (MAAI&F) inspectors to inspect imports. All three agencies pool their resources, including staff, and perform multiple tasks. This spreads costs, but also dilutes focus. Import monitoring works similarly worldwide; only a small proportion of imports are inspected since the costs to inspect every consignment would be prohibitive and the logistics impossible to manage appropriately. UNBS’s primary import monitoring cost is personnel (approximately 130 million UGX (US$77,500) per year). The resources assigned to check imported products were not increased after UNBS began monitoring fortified food imports. 3. National Drug Authority (NDA) The 2004 Food and Drug Regulations established the NDA as the government agency responsible for certifying all drugs and drug manufacturing plants (whether located inside or outside Uganda). Its fortification role evolved because fortificants and premixes are considered “essential drugs” in Uganda. The Finance Act 2003/2004 exempts fortificants from tariffs.
a) Premix Producer Certification While the UNBS oversees fortified foods and food-related aspects of fortification, the National Drug Authority (NDA) oversees fortificant and fortificant premix inspection. In effect, fortificants and premixes are treated as drugs. Companies who wish to supply fortificant and/or premix to Ugandan food industries must be certified by the NDA. To

19
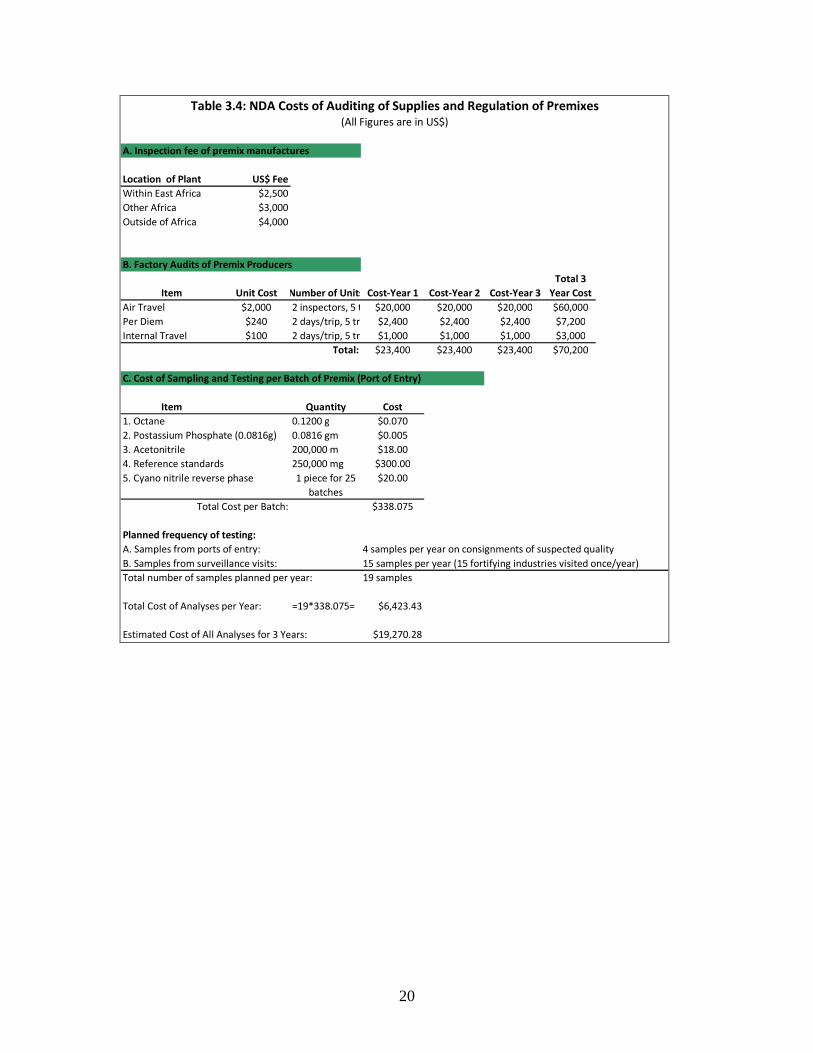
become certified, companies submit a Master File—a company profile with a description of the quality control systems. To be a certified supplier of premix or micronutrients, companies must submit an application and pay a 100,000 UGX (US$60) fee. NDA certifications are valid for three years and then must be renewed. At present all fortificants and premixes used in Uganda are imported. The certification process is just being established. NDA provided a grace period that expired at the end of 2008. Now fortificants and premixes produced by uncertified companies will not be permitted into the country. The NDA approves premix and vitamin A for oil and suppliers must submit to an on-site plant audit. As of June 2007, NDA had approved of vitamin A and premix supplies from DSM, Muhlenchemie, and BASF. When the tender for the premix is published, bidders must be certified by NDA. The NDA, however, had not yet notified food companies about this new procedure or the deadline established for fortificants. This could risk interrupting the fortification program or worse, compel the NDA to prohibit importing fortificants produced by uncertified companies. NDA has calculated the costs for covering fortification. The proposed budget developed in 2007 is still under discussion in the NWGFF. The draft proposed budget is the source of the data in Table 3.4.
b) Monitoring Fortificant Imports
NDA levies a 2 percent charge against the gross invoice of micronutrients and/or premixes. This fee applies to all products it monitors and is considered a user fee that covers some of the monitoring costs incurred. While UNBS regulations require quantitative tests of all fortificant imports, NDA plans to test only a sample, focusing on “suspect” shipments (see Table 3.4). NDA does not plan to sample premix at the ports of entry—unless the shipment is suspect (i.e., from companies whose last shipment was not compliant with UNBS standards). It estimates four such cases annually. At present, NDA reports that the significant space requirements for storing some premixes have made monitoring imports difficult, but has yet to determine how to address this problem. At ports of entry, NDA primarily checks certificates of analysis and certificates of conformity. Fortificant samples are also taken for quantitative testing by following shipments to the Uganda food factories and drawing the sample at the factory. (Samples are taken at the factory to avoid opening the concentrated, expensive fortificants and thereby increasing the risk of loss and degradation en route to the factory.)
20
A. Inspection fee of premix manufactures
Location of Plant US$ Fee
Within East Africa $2,500
Other Africa $3,000
Outside of Africa $4,000
B. Factory Audits of Premix Producers
Item Unit Cost Number of Units Cost-Year 1 Cost-Year 2 Cost-Year 3
Air Travel $2,000 2 inspectors, 5 trips$20,000 $20,000 $20,000 $60,000
Per Diem $240 2 days/trip, 5 trips $2,400 $2,400 $2,400 $7,200
Internal Travel $100 2 days/trip, 5 trips $1,000 $1,000 $1,000 $3,000
Total: $23,400 $23,400 $23,400 $70,200
C. Cost of Sampling and Testing per Batch of Premix (Port of Entry)
Item Quantity Cost
1. Octane 0.1200 g $0.070
2. Postassium Phosphate (0.0816g) 0.0816 gm $0.005
3. Acetonitrile 200,000 m $18.00
4. Reference standards 250,000 mg $300.00
5. Cyano nitrile reverse phase $20.00
$338.075
Planned frequency of testing:
A. Samples from ports of entry: 4 samples per year on consignments of suspected quality
B. Samples from surveillance visits: 15 samples per year (15 fortifying industries visited once/year)
Total number of samples planned per year: 19 samples
Total Cost of Analyses per Year: =19*338.075= $6,423.43
Estimated Cost of All Analyses for 3 Years: $19,270.28
Total Cost per Batch:
Table 3.4: NDA Costs of Auditing of Supplies and Regulation of Premixes(All Figures are in US$)
Total 3
Year Cost
1 piece for 25
batches

21
4. The Laboratory of the Uganda Industrial Research Institute
The Uganda Industrial Research Institute (UIRI) analytical laboratory conducts most quantitative testing of fortificants. While the UNBS has the equipment to do these tests, UIRI is now conducting nearly all the internal-reference and external quantitative tests for fortifying food factories. UIRI’s staff has markedly improved its skills in the past two years, benefitting greatly from the USAID ECSA regional project to strengthen laboratories and A2Z project technical assistance. UIRI charges 80,000 UGX (US$484) for each quantitative vitamin A test. Annex 4 presents a more comprehensive estimation of UIRI’s costs. They include annual maintenance costs of the laboratory’s equipment, pro-rated share of UIRI’s costs of administration and indirect costs—including a share of UIRI’s costs for common services—clerical, security and transportation—and electricity and water. Given that UIRI has excess capacity, it can conduct more tests and spread the indirect costs over this larger number of tests, thereby decreasing the average indirect costs per test. Currently, the estimated cost is very high, because personnel and indirect costs are high. The laboratory is performing very few tests accordingly to their capabilities. 5. The Ministry of Health’s Department of Inspection and Certification Food inspectors are district employees from the MOH’s Department of Inspection and Certification. A2Z trained food inspectors and supported the ECSA market/retail outlet manual. This manual describes a sampling and analytic testing methodology for fortified foods and guides the food inspectors’ work. This market/retail outlet manual will be used to train other health inspectors at the zonal level. A 2006 Food Control Workshop designed monitoring plans and regulatory protocols for food fortification. It instructs how UNBS inspectors visit factories and collect samples for analysis, and how MOH inspectors collect samples (initially salt, oil, and maize) from retail outlets in districts. In addition, two rounds of supervision training were given at factories, importation sites, and retail stores in 2006/7 with follow-up sessions in June and December 2007. Results documented that “most salt in the country complies with iodization regulations and more than 85 percent of the oil available at retail stores appears to be fortified with vitamin A, with an average vitamin A content of 22 ppm” (Makhumula, 2007).5
4 This value is for vitamin A determination using HPLC. If a spectrophotometric method is used, the total cost should not be higher than US$10. 5 A most recently result in 2009 found that the vitamin A level at retail stores is 31 mg/kg.
22
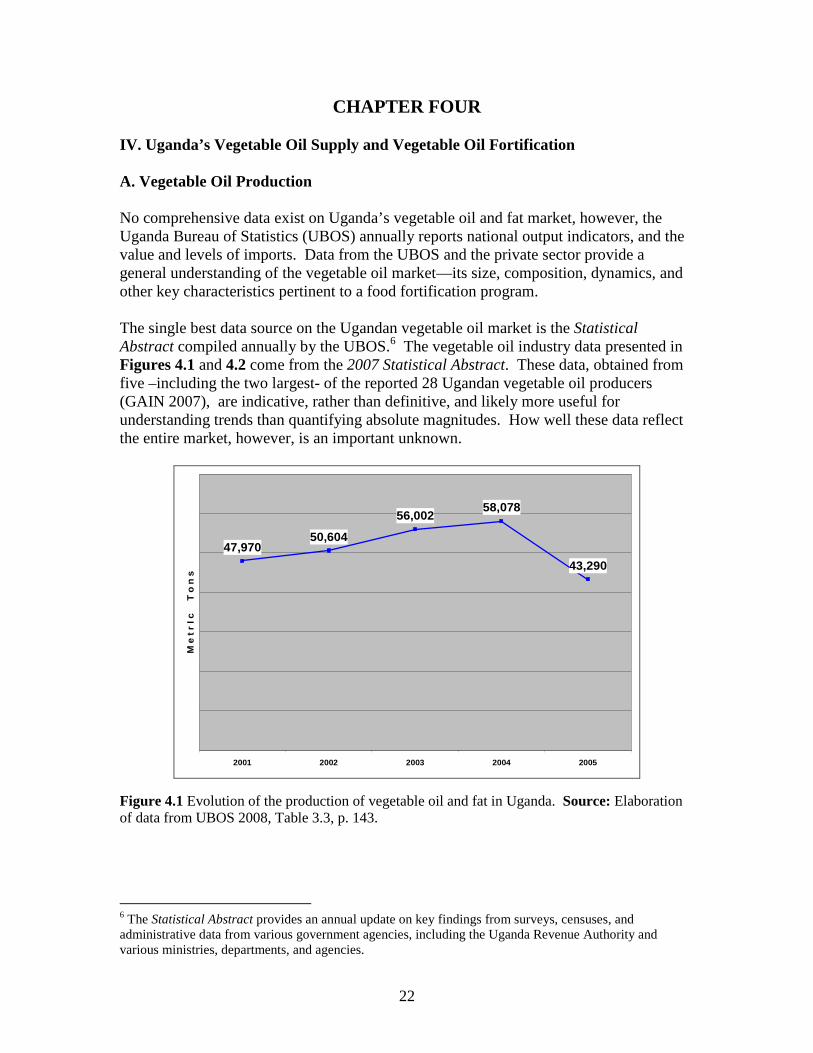
CHAPTER FOUR IV. Uganda’s Vegetable Oil Supply and Vegetable Oil Fortification A. Vegetable Oil Production No comprehensive data exist on Uganda’s vegetable oil and fat market, however, the Uganda Bureau of Statistics (UBOS) annually reports national output indicators, and the value and levels of imports. Data from the UBOS and the private sector provide a general understanding of the vegetable oil market—its size, composition, dynamics, and other key characteristics pertinent to a food fortification program. The single best data source on the Ugandan vegetable oil market is the Statistical Abstract compiled annually by the UBOS.6 The vegetable oil industry data presented in Figures 4.1 and 4.2 come from the 2007 Statistical Abstract. These data, obtained from five –including the two largest- of the reported 28 Ugandan vegetable oil producers (GAIN 2007), are indicative, rather than definitive, and likely more useful for understanding trends than quantifying absolute magnitudes. How well these data reflect the entire market, however, is an important unknown.
47,97050,604
56,00258,078
43,290
2001 2002 2003 2004 2005
M e
t r
I c
T o
n s
Figure 4.1 Evolution of the production of vegetable oil and fat in Uganda. Source: Elaboration of data from UBOS 2008, Table 3.3, p. 143.
6 The Statistical Abstract provides an annual update on key findings from surveys, censuses, and administrative data from various government agencies, including the Uganda Revenue Authority and various ministries, departments, and agencies.

23
The Ugandan vegetable oil and fat industry is dominated by two companies, AK Oil of the Mukwano Industries Group7 and BIDCO Oil. In 2007, these two companies produced 105,000 tons (personal communication from company sources). Over the years, the production of vegetable oil companies has been constant. Mukwanohas long produced more than half of all of the commercially produced vegetable oil in Uganda. BIDCO, on the other hand, is a recently established company and for that reason is probably not included in this UBOS data series. While the output of these plants fell by 26 percent in 2005 (Figure 4.1), this drop likely reflects BIDCO’s entry into the market in June 2005; in fact national output likely did not fall, but actually grew as a result of BIDCO’s production. Mukwano reports that its market share has fallen since BIDCO started production. It is likely that BIDCO’s gain was not Mukwano’s loss, but rather that Mukwano, together with other companies, all suffered some loss of market share. It is plausible that national vegetable oil production increased in 2005 and thereafter due to:
(1) increased demand enabled by increasing income levels; (2) increased advertising by established oil companies fighting to retain their markets and by BIDCO seeking establish its own market share; and (3) increased vegetable oil exports.
In 2005, the economy was robust: the labor force grew by 14 percent, manufacturing jobs grew by a whopping 42 percent and monthly consumption expenditures per household grew 15 percent (UBOS, 2008: page13-14). Vegetable oil and fats exports also grew vigorously in 2005. As Figure 4.2 shows, exports of Standard International Trade Classification (SITC) Code 2-42: Vegetable and Fats and and SITC Code 2-43: Processed Animal and Vegetable and Fats increased at a fast pace in recent years, with annual average growth rates in value of 55 and 66 percent, respectively. Data from BIDCO confirms the significance and rapid growth of vegetable oil exports. In 2007, BIDCO reported exporting 14,800 tons, 29 percent of its total vegetable oil production. This was an increase from its 2006 export total of 7,900 tons. No similar data were available from Mukwano or for the industry as a whole. Based on these imperfect and partial data, together with information obtained in interviews with industry representatives, it is estimated that Mukwano and BIDCO account for 85-90 percent of the total output of vegetable oil and fat in Uganda.
7 Following local custom, AK Oil will be referred to in this report as Mukwano.

24
1,561
2,457
4,080
7,285
11,797
-
2,000
4,000
6,000
8,000
10,000
12,000
14,000
2002 2003 2004 2005 2006
Tho
usan
ds o
f US
$
SITC2-43: Animal or vegetable oils and fats, proces sed
Average Annual Growth Rates: SITC2-43: 66%
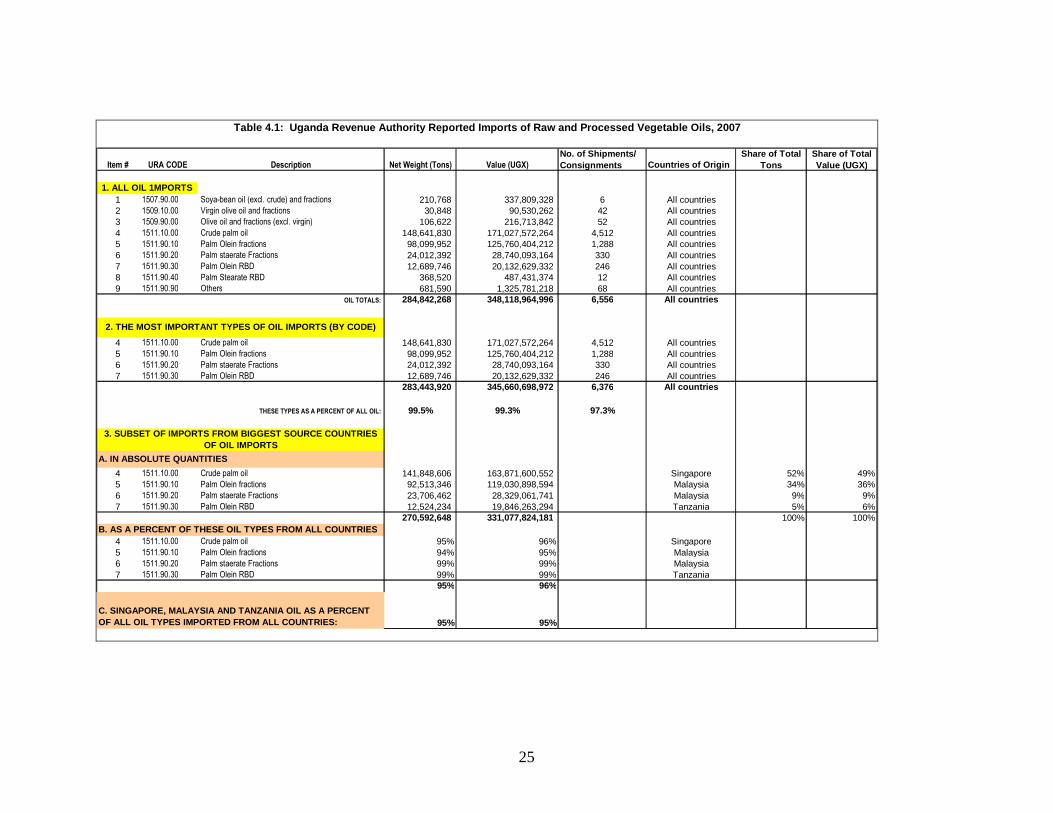
Figure 4.2 Evolution of the growing value of Ugandan export of oils and fats. Source: Elaboration of data from UBOS 2008, Table 4.2.1, page 195. Based on total national output. B. The Vegetable Oil and Fat Industry of Uganda In 2007, Uganda imported 285 million tons of vegetable oil; 99.6 percent of the imported oil consisted of crude or degummed palm oil, the base input into most of the refined vegetable oil and fat produced in Uganda. Data on the volume, value, and source of vegetable oil imports is presented in Table 4.1.8 As Table 4.1 shows, most of the palm oil imported by Uganda comes from Malaysia (or from Malaysia via Singapore) and is purchased by Mukwano and BIDCO. BIDCO’s entire production line—comprised of four vegetable oil brands (Ufuta, Golden Fry, Kornogold, and Fortune) and four vegetable fat brands (Kimbo, Chipsy, Chipo, and Cowboy)—is based exclusively on imported palm oil. Most of Mukwano’s raw material is also Malaysian palm oil, although it also uses some sunflower and cottonseed oils derived from crops grown in Uganda. Mukwano has four brands Three Star, Mukwano, Roki, and Nice Fry. This last brand is sold as a high end, pure sunflower oil product that is not fortified with vitamin A.9 Both Mukwano and BIDCO produce vegetable oil-based cooking fat in addition to cooking oil, although in both cases the fat is of much lesser commercial significance. Ninety-five percent of Mukwano’s output is vegetable oil, with the remainder comprised of fat. BIDCO’s proportionate shares are about 85 and 15 percent, respectively.
8 This information was obtained from the Uganda Revenue Authority (URA), and was assembled by URA at the request of A2Z. 9 The sunflower product has a container machine that produces only transparent plastic bottles and thus would not protect a vitamin A – fortified product from direct light. Nice Fry represents a small share of Mukwano’s oil products.
25
Item # URA CODE Description Net Weight (Tons) Value (UGX)
No. of Shipments/ Consignments Countries of Origin
Share of Total Tons
Share of Total Value (UGX)
1 1507.90.00 Soya-bean oil (excl. crude) and fractions 210,768 337,809,328 6 All countries2 1509.10.00 Virgin olive oil and fractions 30,848 90,530,262 42 All countries3 1509.90.00 Olive oil and fractions (excl. virgin) 106,622 216,713,842 52 All countries4 1511.10.00 Crude palm oil 148,641,830 171,027,572,264 4,512 All countries5 1511.90.10 Palm Olein fractions 98,099,952 125,760,404,212 1,288 All countries6 1511.90.20 Palm staerate Fractions 24,012,392 28,740,093,164 330 All countries7 1511.90.30 Palm Olein RBD 12,689,746 20,132,629,332 246 All countries8 1511.90.40 Palm Stearate RBD 368,520 487,431,374 12 All countries9 1511.90.90 Others 681,590 1,325,781,218 68 All countries
OIL TOTALS: 284,842,268 348,118,964,996 6,556 All countries
4 1511.10.00 Crude palm oil 148,641,830 171,027,572,264 4,512 All countries5 1511.90.10 Palm Olein fractions 98,099,952 125,760,404,212 1,288 All countries6 1511.90.20 Palm staerate Fractions 24,012,392 28,740,093,164 330 All countries7 1511.90.30 Palm Olein RBD 12,689,746 20,132,629,332 246 All countries
283,443,920 345,660,698,972 6,376 All countries
THESE TYPES AS A PERCENT OF ALL OIL: 99.5% 99.3% 97.3%
4 1511.10.00 Crude palm oil 141,848,606 163,871,600,552 Singapore 52% 49%5 1511.90.10 Palm Olein fractions 92,513,346 119,030,898,594 Malaysia 34% 36%6 1511.90.20 Palm staerate Fractions 23,706,462 28,329,061,741 Malaysia 9% 9%7 1511.90.30 Palm Olein RBD 12,524,234 19,846,263,294 Tanzania 5% 6%
270,592,648 331,077,824,181 100% 100%B. AS A PERCENT OF THESE OIL TYPES FROM ALL COUNTRI ES
4 1511.10.00 Crude palm oil 95% 96% Singapore5 1511.90.10 Palm Olein fractions 94% 95% Malaysia6 1511.90.20 Palm staerate Fractions 99% 99% Malaysia7 1511.90.30 Palm Olein RBD 99% 99% Tanzania
95% 96%
95% 95%
1. ALL OIL 1MPORTS
A. IN ABSOLUTE QUANTITIES
C. SINGAPORE, MALAYSIA AND TANZANIA OIL AS A PERCEN T OF ALL OIL TYPES IMPORTED FROM ALL COUNTRIES:
Table 4.1: Uganda Revenue Authority Reported Impor ts of Raw and Processed Vegetable Oils, 2007
3. SUBSET OF IMPORTS FROM BIGGEST SOURCE COUNTRIES OF OIL IMPORTS
2. THE MOST IMPORTANT TYPES OF OIL IMPORTS (BY CODE )
26
Uganda has a reported 28 vegetable oil producers (GAIN 2006). The other 26 oil producers include small- and medium-sized plants, but unlike Mukwano and BIDCO, none sells its product throughout the country, producing instead only for sub-national/regional markets within Uganda. The vegetable oil and fat industry has an association, the Ugandan Oil Seed Producers and Processors Association. C. Conclusion about the Ugandan Vegetable Oil Market and Its Fortification Prospects The vegetable oil industry of Uganda is thriving. The industry depends heavily on processing imported crude palm oil. Large, new firms, with modern technology and a commitment to establishing a high quality, fortified product have recently entered the market and heightened competition. The competition has increased advertising and product differentiation and branding, but not cut prices. It is vibrant market in which both total national production and exports are growing rapidly in quantity and value. The nature of the market and the companies’ business strategies portend well for a sustained commitment to continue to fortify products. Whether other producers are interested or capable of fortifying is unknown, however, given that Mukwano and BIDCO represent roughly 85 percent of the industry output, other producers are less important from a national coverage perspective. They might be strategically significant depending upon the overlap of their geographic markets and the geography of VAD in Uganda. D. Vegetable Oil and Fat Fortification In July 2004, Mukwano Industries began voluntarily adding vitamin A to its vegetable oil products, marking the advent of fortification in Uganda. At that time, Mukwano supplied an estimated 60 percent of the total national vegetable oil produced, and although the UNBS vitamin A fortification standard at the time was 15 mg per kg of oil, Mukwano was fortifying at level twice (30 mg/kg) that required for meeting the standard. The fortificant used was a retinyl palmitate, purchased in concentrations of 1.7 million IU/gram (or the equivalent of 510 g/kg). In June 2005, BIDCO, started fortifying its vegetable oil products with vitamins A and D. The fortificant BIDCO used had a different concentration, 1.0 million IU/g (or the equivalent of 300 g/kg), and 100,000 IU/g vitamin D (or the equivalent of 2.5 g/kg).10
a. The Mukwano Fortification Process
10 Adding vitamin D is unnecessary in Uganda, but this company is adding this nutrient—outside the standard—as a marketing tool.

27
Mukwano uses a dilution process to introduce vitamin A into a one-ton, stainless steel, pre-mixing tank and mixes the vitamin A for 30 minutes.11 After mixing, the oil is pumped12 into a 50-ton holding tank where it is mixed for another 30 minutes. In 2005, the MOST project sponsored oil fortification pilot trials in Mukwano. The company purchases the vitamin A fortificant quarterly and maintains good daily records of the vitamin A usage (Ranum, June 2007). Mukwano reported that it purchased new chemicals and equipment to comply with the UNBS in-plant quality control (QC) requirements. Additional training in the new laboratory methods is also required. The in-plant QC consists of preparing composite samples (mix of individual samples obtained every hour) per batch (large tanks) that they process. The company produces approximately seven batches per day. To meet UNBS QC requirements, Mukwano has assigned one person (per shift) to oversee the vitamin A blending process. Mukwano’s other fortification costs include: advertisements (Sunday section of several papers regularly carries a prominent advertisement) and a jingle used on radio. These costs are factored into the company’s general marketing and product differentiation strategy are not considered unique to fortification and thus are not included in cost estimates.
b. BIDCO Oil Fortification Process The BIDCO plant, located in the town of Jinja, began operations in June 2005. In 2007, it produced 4,500 MT/month of vegetable oil and 850 MT/month of fat. The plant currently operates at 150 tons per day or 60 percent of its capacity. Most fat is sold to bakeries, although two brands (Kimbo and Cowboy) are consumer goods. All vegetable oil is fortified with both vitamin A and D; the oil is added directly to a mixing tank and mixed for 30 to 60 minutes. The oil is then pumped into a holding tank for an additional 30 minutes of mixing and then packaged. No pre-dilution is prepared. The premix is weighed out for each batch in the lab and a log book is maintained to document the vitamin A addition. Samples are sent to UIRI monthly for quantitative vitamin A testing.
c. Plans for Introducing Fortification in Other Vegetable Oil Plants
The Muddu Oil Company, located just outside of Kampala in Mukona, is another recently constructed plant that will rely on imported palm oil. Although fortification discussions were held, its output level has been about one-third that of BIDCO and Mukwano. The company is currently reported to be bankrupt and in receivership. E. The Cost of Fortifying Vegetable Oil
11 The $15,000 tank was donated by the MOST Project in 2004. It has an estimated lifespan of 20 years. 12 The pump was also donated by the MOST Project.

28
The cost of vegetable oil fortification is based on data obtained from oil fortifying industries in Uganda. To protect proprietary information, the cost estimates presented and discussed here are based on a hybrid of the two companies rather than actual separate costs of each company. The two companies’ output levels and the technology they use in fortifying their products are similar. The only difference is whether the company uses a vitamin A premix/dilution or adds the vitamin A directly to the oil. The calculations assume the company:
• consists of one plant • produces six batches • annually produces 50,250 metric tons of vegetable oil • uses one of two retinol palmitate Vitamin A compounds:
o 1 million IU/g, for which it pays 67,849 UGX (US$40.75) per kilogram (Table 4.2) or
o 1.7 million IU/g, for which it pays 111,139 UGX (US$66.75) per kilogram (Table 4.3)
• uses semi-quantitative chromogenic method for quality control • the exchange rate is 1,665 UGX per US$1.00 (the rate on May 1, 2008).

29
To mix, introduce and improve dispersion of vitamin A: UGX US$stainless steel tank for making premix: 24,975,000 15,000 pump to pump premix solution into process tank: 832,500 500accessories 1,415,250 850piping 333,000 200
27,555,750 16,550
Training in in-plant QA-sensitization for QA heads of all food vehicles (25 staff, does not include value of staff time) 333,000 200 Training in in-plant QA of supervisors, lab etc. personnel (25 staff, does not include value of staff time) 333,000 200 Re-designing of label and printing plates ( 8 brands) 3,496,500 2,100
Total Capital Costs: 31,718,250 19,050
1. Premix Costs UGX US$Using Retinol Palmitate 1 million IU/g to add 83.3 g of vitamin A / ton of vegetable oil 1,466 kg/quarter 99,469,236 59,741
Freight 5,055,939 3,037 Clearance 250,000 150
Import license/NDA Certification of Premix Supplier (prorated to quarterly payment) 25,000 15 2% NDA charge 1,989,385 1,195
Total Premix Cost/Quarter 106,789,560 64,138 Total Premix Cost/Year 427,158,238 256,551
2. QA /QC Testing Costs-In PlantMethod #1: (As described in ECSA Vegetable Oil Fortification Manual, 2007)Semi-quantitative test using a chromogenic reagent (US$4/test x 6 test/day x 250 days) = 9,990,000 6,000
Total Additional In-Plant Lab Costs: 9,990,000 6,000
3. External Lab CostsUIRI Lab Quantitative Test Fee = 80,000 per test
1,920,000 monthly for two tests per month External Lab Costs: 23,040,000 13,838 4. Incremental production costsAdditional staff to handle production/premix-relate d activities: 1/shift
300,000 Monthly salary105,000 Benefits @ 35% of salary, includes:
a) NSSF (National Social Security Fund, 10%) b) Transport and food allowances c) Health Insurance
405,000 Total remuneration of one production worker/month1,215,000 Total cost 3 additional workers/month 14,580,000 8,757
Power for pump and two mixing tanks: 4 kw/hr*9 hrs/day*355 days/yr*190 UGX/hr 2,428,200 1,458Incremental Annual Production Costs: 17,008,200 10,21 5
Total Annual Incremental Costs of Fortification UGX US$1. Premix 427,158,238 256,551 2. Quality assurance / In-Plant lab testing: 9,990,000 6,000 3. Quality control / External lab testing: 23,040,000 13,8384. Additional production costs 17,008,200 10,215 TOTAL: 477,196,438 286,604
ANNUAL RECURRENT COSTS
ONE-TIME CAPITAL COSTS
Table 4.2: The Private Sector Plant Costs of Forti fying Vegetable Oil with Vitamin A in Uganda
(Based on a weighted average of the costs of the two largest vegetable oil producers in Uganda, and an annual output level of 50,250 tons per plant and 6 products/brands)
Fortificant: Retinol Palmitate 1 million IU / gram

30
To mix, introduce and improve dispersion of vitamin A: UGX US$stainless steel tank for making premix: 24,975,000 15,000 pump to pump premix solution into process tank: 832,500 500accessories 1,415,250 850piping 333,000 200
27,555,750 16,550
Training in in-plant QA-sensitization for QA heads of all food vehicles (25 staff, does not include value of staff time) 333,000 200 Training in in-plant QA of supervisors, lab etc. personnel (25 staff, does not include value of staff time) 333,000 200 Re-designing of label and printing plates ( 8 brands) 3,496,500 2,100
Total Capital Costs: 31,718,250 19,050
1. Premix Costs UGX US$Using Retinol Palmitate 1.7 million IU/g to add 35 mg of vitamin A / kg of vegetable oil 862 kg/quarter 95,777,986 57,524
Freight 3,013,983 1,810 Clearance 250,000 150
Import license/NDA Certification of Premix Supplier (prorated to quarterly payment) 25,000 15 2% NDA charge 1,915,560 1,150
Total Premix Cost/Quarter 100,982,528 60,650 Total Premix Cost/Year 403,930,113 242,601
2. QA /QC Testing Costs-In PlantMethod #1: (As described in ECSA Vegetable Oil Fortification Manual, 2007)Semi-quantitative test using a chromogenic reagent (US$4/test x 6 test/day x 250 days) = 9,990,000 6,000
Total Additional In-Plant Lab Costs: 9,990,000 6,0003. External Lab CostsUIRI Lab Quantitative Test Fee = 80,000 per test
1,920,000 monthly for two tests per month External Lab Costs: 23,040,000 13,838 4. Incremental production costsAdditional staff to handle production/premix-relate d activities: 1/shift
300,000 Monthly salary105,000 Benefits @ 35% of salary, includes:
a) NSSF (National Social Security Fund, 10%) b) Transport and food allowances c) Health Insurance
405,000 Total remuneration of one production worker/month1,215,000 Total cost 3 additional workers/month 14,580,000 8,757
Power for pump and two mixing tanks: 4 kw/hr*9 hrs/day*355 days/yr*190 UGX/hr 2,428,200 1,458Incremental Annual Production Costs: 17,008,200 10,21 5
Total Annual Incremental Costs of Fortification UGX US$1. Premix 403,930,113 242,601 2. Quality assurance / In-Plant lab testing: 9,990,000 60003. Quality control / External lab testing: 23,040,000 13,8384. Additional production costs 17,008,200 10,215 TOTAL: 453,968,313 272,654
ANNUAL RECURRENT COSTS
Table 4.3: The Private Sector Plant Costs of Forti fying Vegetable Oil with Vitamin A in UgandaFortificant: Retinol Palmitate 1.7 million IU / gr am
(Based on a weighted average of the costs of the two largest vegetable oil producers in Uganda, and an annual output level of 50,250 tons per plant and 6 products/brands)
ONE-TIME CAPITAL COSTS
Note: The proportion of the capital costs in the overall yearly cost of the program is very low; it is approximately 3,200,000 UGX (US$2,000), which represents 0.7% of the total cost of the annual fortification process.
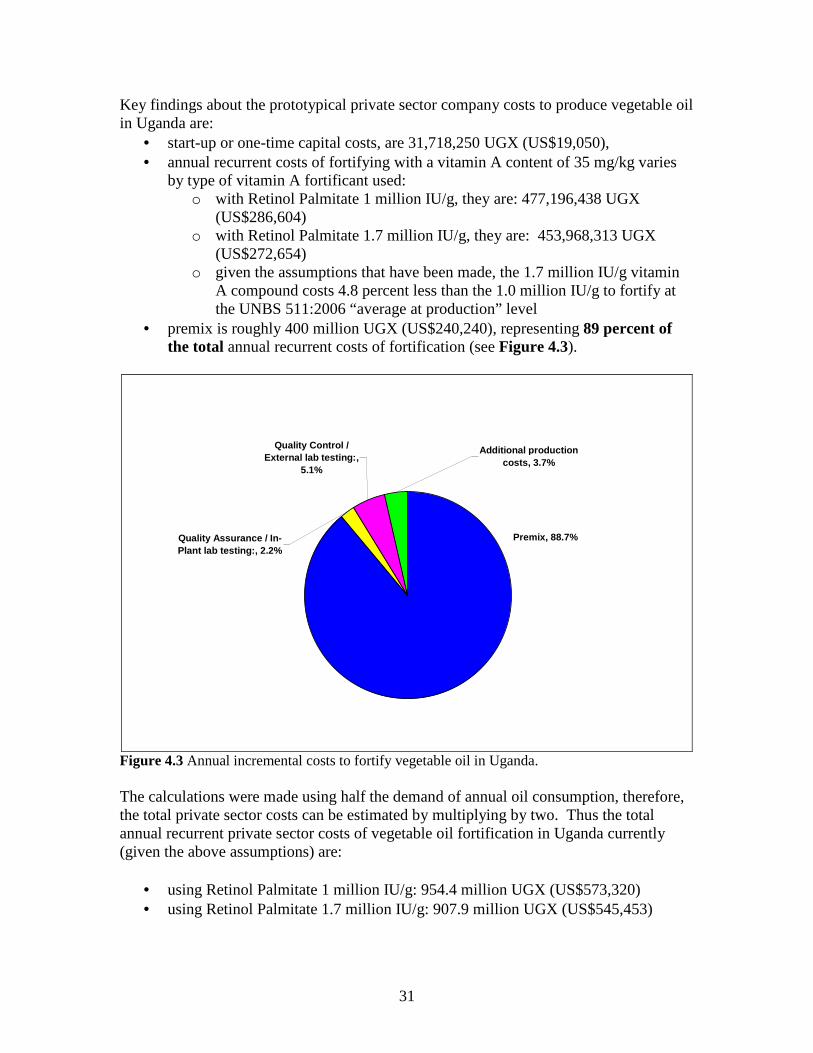
31
Key findings about the prototypical private sector company costs to produce vegetable oil in Uganda are:
• start-up or one-time capital costs, are 31,718,250 UGX (US$19,050), • annual recurrent costs of fortifying with a vitamin A content of 35 mg/kg varies
by type of vitamin A fortificant used: o with Retinol Palmitate 1 million IU/g, they are: 477,196,438 UGX
(US$286,604) o with Retinol Palmitate 1.7 million IU/g, they are: 453,968,313 UGX
(US$272,654) o given the assumptions that have been made, the 1.7 million IU/g vitamin
A compound costs 4.8 percent less than the 1.0 million IU/g to fortify at the UNBS 511:2006 “average at production” level
• premix is roughly 400 million UGX (US$240,240), representing 89 percent of the total annual recurrent costs of fortification (see Figure 4.3).
Premix, 88.7%Quality Assurance / In-Plant lab testing:, 2.2%
Quality Control / External lab testing:,
5.1%
Additional production costs, 3.7%
Figure 4.3 Annual incremental costs to fortify vegetable oil in Uganda. The calculations were made using half the demand of annual oil consumption, therefore, the total private sector costs can be estimated by multiplying by two. Thus the total annual recurrent private sector costs of vegetable oil fortification in Uganda currently (given the above assumptions) are:
• using Retinol Palmitate 1 million IU/g: 954.4 million UGX (US$573,320) • using Retinol Palmitate 1.7 million IU/g: 907.9 million UGX (US$545,453)

32
F. Alternative Fortification Cost Measures: Considering the Consumer’s Perspective This section presents two sets of results. Section a) presents the results assuming that all vegetable oil is fortified using Retinol Palmitate 1.0 million IU/g. Section b) assumes that the fortificant used is Retinol Palmitate 1.7 million IU/g.
a) Vegetable oil is fortified with Retinol Palmitate 1.0 million IU/g
Assuming the price per liter of fortified vegetable oil is 3,133 UGX (US$1.88), the retail value of all fortified vegetable oil in Uganda net of fortification costs using Retinol Palmitate 1.0 million IU/g is:
[(3,133 UGX) x (105,000 tons) x (1,098.9 liters/ton)] – [(477,196,438 UGX) x 2] =
361,490,090 UGX Assuming, all fortification costs were shifted onto the consumer through an increased price (i.e., assuming the maximum price increase scenario), it may be estimated that the maximum retail price increase attributable to fortification is:
[(477,196,438 x 2 UGX) / {(105,000 tons) x (1,099 liters/ton)}]
= 8.28 UGX/liter which is the equivalent of : (8.28 / 3,133) = 0.26 percent of the retail price of one liter of vegetable oil. Drawing on the HIES data, if 57 percent of Ugandans purchase vegetable oil, and, using the estimated 105,000 tons of oil produced annually by fortifying industries and assuming that 15,000 tons of that output is exported annually, the average Ugandan purchases (i.e., has an apparent consumption level of) an estimated 15.3 grams per day. The average person consumes an estimated 5.58 kilograms or 6.14 liters of vegetable oil per year and pays an additional 51 UGX (US$0.031) per year for fortified oil (as opposed to non-fortified oil, other things being equal). Given an average household size of 5.2 persons, the average Ugandan household that purchases vegetable oil pays an estimated additional 265 UGX (US$0.159) per year for fortified oil, or 51 UGX (US$0.031) per year per person.

33
b) Vegetable oil fortified with Retinol Palmitate 1.7 million IU/g Assuming the price per liter of fortified vegetable oil is 3,133 UGX (US$1.88), the retail value of all fortified vegetable oil in Uganda net of fortification costs using Retinol Palmitate 1.7 million IU/g is:
[(3,133 UGX) x (105,000 tons) x (1,098.9 liters/ton)] – [(453,968,313 UGX) x 2] =
398,155,390 UGX Assuming, all fortification costs were shifted onto the consumer through an increased price (i.e., assuming the maximum price increase scenario), it may be estimated that the maximum retail price increase attributable to fortification is:
[(453,680,704 x 2 UGX) / {(105,000 tons) x (1,099 liters/ton)}]
= 7.86 UGX/liter which is the equivalent of : (7.86 / 3,133) = 0.25 percent of the retail price of one liter of vegetable oil. Making the same assumptions as above regarding vegetable oil consumption, the average person who purchases vegetable oil consumes 6.14 liters of oil per year and pays an additional 48 UGX (US$0.029) per year for fortified oil (as opposed to non-fortified oil, other things being equal). Given an average household size of 5.2 persons, the average Ugandan household that purchases vegetable oil pays an estimated additional 250 UGX (US$0.150) per year for fortified oil, or 48 UGX (US$0.029) per year per person. The cost differences from using different vitamin A compounds are not large for individual plants, for the private vegetable oil industry as a whole, or for consumers.

34
CHAPTER FIVE V. The Public Health Attraction of Fortified Ugandan Sugar A. Sugar Fortification Prospects Sugar has been considered an attractive potential fortification vehicle since fortification discussions began in Uganda in the mid 1990s. Uganda has 3 major sugar mills which together produce about 83 percent of the national requirement. These three major sugar mills, Kakira, Kinyara, and Lugazi (the latter owned by SCOUL) 13 have participated sporadically in MOH-led meetings and discussions about fortification since 2001. Trials to determine technical feasibility were conducted in Kakira Sugar Works in 2005. The results showed that fortifying Uganda sugar with fortificants available on the market was possible. The three mills are all members of the Ugandan Sugar Cane Technologists Association (USCTA), and the trials were done under the association banner.
1. The Sugar Companies Conditional Acceptance of Fortification has been Noted, but Decisions Have not been Taken
Evidence dating from at least December 2004 highlights the sugar industry’s position on mandatory sugar fortification.
“The key concern for the sugar industry is the increase in cost due to change in technology and the fortificant. It was also pointed out that fortification should be made mandatory to all sugar industries so all of their costs of production go up and hence are able to compete. The sugar industries further pointed out that apart from the issue of acceptability of fortified sugar, once they start fortifying, government should put a ban on unfortified sugar….” (Kalyowa, MOST 2004:24).
It was noted that Kakira was “eager to fortify and is hoping for Government to make sugar fortification in Uganda mandatory. Two other sugar mills, Lugazi and Kinyara, would also participate in the fortification” (Makhmula, 2006). Just eight months later, the same consultant reported on a visit to Kakira: “Management in this factory is considering fortification of sugar they produce as long as regulations are in place and all mills are required by law to fortify.” Government officials wish fortification to remain voluntary to avoid “giving the sugar millers a monopoly.” As a result, sugar fortification in Uganda is at an impasse. And further, the sugar industry’s opposition to voluntary fortification has solidified over the years. Visits to each of the three largest mills for this study found two top managers in one mill expressing open hostility and opposition to fortification—primarily because of cost implications. 13 Lugazi Sugar is often referred to as SCOUL (Sugar Company of Uganda, Ltd.), which is the company that owns Lugazi Sugar.

35
Both managers are relatively new, having assumed their positions just one and two years ago. In one voice, they explained that the cost structure of Ugandan sugar is not internationally competitive. They were preoccupied with their company’s commercial survival and would not even entertain the thought of fortifying voluntarily. Another big sugar mill, reported “a paradigm shift,” and did not favor fortification. At the same time, however, two of the three mills were very sensitive to their highly visible position in Ugandan politics and the symbolic importance of what they do and do not do. Both did not want to oppose or be seen as opposing something that could improve the health of Ugandans or help the country, yet both producers stated that they would not fortify voluntarily. How much of this is political posturing and how much of this is an evidence-based, commercial strategy is uncertain. Either way the outcome appears the same: while sugar company officials continue to be pleasant and discuss fortification, they will not fortify voluntarily—at least not now. Fortifying Ugandan sugar will require a Government of Uganda mandate, yet Government officials are opposed to mandatory sugar fortification. Thus sugar fortification prospects dim and will entail considerable uphill political battle. This position seems to reflect where the companies are as businesses and as an industry. When the Government of Uganda can understand this position they will be able to negotiate effectively with the sugar industry in the future. The Government should consider using several potential policy levers to encourage the sugar industry to fortify. At the same time, the sugar industry faces uncertain times and the Government should acknowledge that the industry contributes significantly to the Uganda economy—in terms of jobs, taxes, and buying products and services of other businesses, including outgrowers. Overburdening companies or damaging them commercially will hurt the Government and Ugandan society. B. Key Characteristics of the Ugandan Sugar Industry and Market Sugar production in Uganda has increased nearly two-fold over the past decade, growing from 102,527 tons in 1998 to 197,292 tons in 2007. The USCTA 2007 Annual Report forecast a 50,000 ton (25%) increase in production for 2008. While annual production growth rates have been erratic—varying from -1 percent to +24 percent—the annual average has been a robust 8 percent. See Figure 5.1.

36
104,525
128,181138,950 135,981
167,965178,677
198,120 195,733 193,506 197,292
1998 1999 2000 2001 2002 2003 2004 2005 2006 2007
Met
ric T
ons
of C
entri
gual
Sug
ar
Figure 5.1: Evolution of sugar production in Uganda. As Figure 5.2 shows, total domestic sugar production in 2007 was 197,292 tons and accounted for 77 percent of the 256,644 tons of sugar consumed nationally; 59,352 tons (23% of national consumption) was imported. About half of total imports come from South Africa, although sources and quantities of sugar imports have varied substantially, as may be seen in Tables 5.1 and 5.2. Ugandan sugar imports are generally refined, which is primarily used by food industries to make soft-drinks.
Net Sugar Imports, 59,352 tons; 23%
Domestic Sugar Production,
197,292 tons; 77%
Source: Calculated from USCTA 2008 data.
Figure 5.2: Sugar supply in Uganda.

37
Country 2000 2001 2002 2003 2004 2005 2006 2007A. Sugar Direct to MarketBrazil 5,544 363India 4 557 364 248 14 10 172Kenya 1,386 26 21 492 58 41 2,807 5,134MozambiqueSouth Africa 12,848 14,927 12,044 9,280 14,543 19,729 10,377 23,192Swaziland 11 1,075 870 2,201 7,255 2,424Tanzania 270 480 12,596 7,537 13,734Thailand 3,106 2 151 258 903 1 2 45All others 19,078 11,379 1,883 728 1,523 3,411 9,702 2,201Total 42,247 28,809 14,969 13,323 24,530 38,216 30,435 44,478
B. Sugar Taken into BondBrazil 1,520 6,959 507 26 1,540 7,373 10,818India 499 836 5,354 732 1 13,732Kenya 532 39 215 0 100 1Mozambique 624 559 1,113 2,733 4,437South Africa 4,164 15,311 13,584 6,984 6,107 11,101 8,962 20,631Swaziland 2,280 5,515 5,700 10,249 21,118 24,080Tanzania 80 80Thailand 889 824 2,825 7,052 7,652 1,422 13,205All others 3,972 5,306 2,744 3,706 3,095 926 12,897 11,299Total 11,077 28,979 22,815 29,450 23,871 25,009 54,606 98,203
C. Sugar Taken Out of BondBrazil 434 6,955 293 26 440 6,125 1,590India 387 621 2,559 608 1 864Kenya 320 151 100 1Mozambique 494 129 3South Africa 4,464 11,920 12,228 5,081 3,782 7,725 3,980 4,659Swaziland 1,418 4,698 4,019 1,316 179 117Tanzania 80 80Thailand 1,362 999 1,624 2,881 4,937 86 4,574All others 4,395 4,930 2,000 1,317 2,212 303 6,926 3,070Total 10,975 25,271 18,335 17,030 15,713 9,870 17,394 14,875
D. Sugar Re-ExportedBrazilIndiaKenya 301 45MozambiqueSouth Africa 53 278 76Swaziland 129Tanzania 20Thailand 40 45Sudan 2 30 24 2,286 13,373 33,832DRC 649 282 26 272 1,826 10,680 24,683All others 461 2,115 840 52 878 2,673 9,594 12,384Total 1,433 2,520 1,189 324 2,728 15,768 23,043 70,944
E. Sugar Exported of Ugandan OriginBrazil 25IndiaKenya 14 105 1 248MozambiqueSouth AfricaSwazilandTanzania 100ThailandAll others 410 480 408 370 339 1,259 422 1,131Total 424 480 408 475 339 1,285 422 1,479
E. Net ImportsBrazil 5,978 7,318 293 0 26 440 6,125 1,590India 4 944 621 2,923 856 14 11 1,036Kenya 1,706 26 172 492 58 41 2,907 5,135Mozambique 0 0 0 494 129 0 3 0South Africa 17,312 26,847 24,272 14,361 18,325 27,454 14,357 27,851Swaziland 11 1,075 2,288 6,899 11,274 3,740 179 117Tanzania 270 560 0 0 0 12,596 7,617 13,734Thailand 4,468 1,001 1,775 3,139 5,840 87 2 4,619All others 23,473 16,309 3,883 2,045 3,735 3,714 16,628 5,271Total 53,222 54,080 33,304 30,353 40,243 48,086 47,829 59,353
Table 5.1: Ugandan Sugar Imports, 2000-2007In Metric Tons
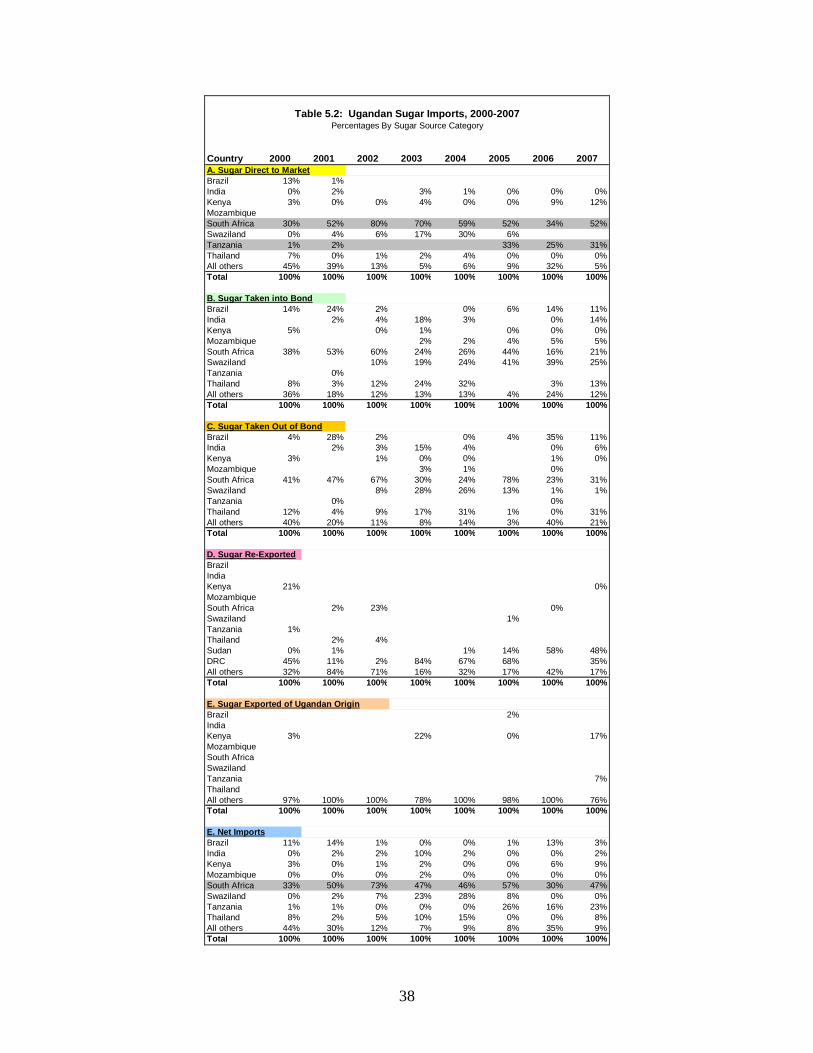
38
Country 2000 2001 2002 2003 2004 2005 2006 2007A. Sugar Direct to MarketBrazil 13% 1%India 0% 2% 3% 1% 0% 0% 0%Kenya 3% 0% 0% 4% 0% 0% 9% 12%MozambiqueSouth Africa 30% 52% 80% 70% 59% 52% 34% 52%Swaziland 0% 4% 6% 17% 30% 6% Tanzania 1% 2% 33% 25% 31%Thailand 7% 0% 1% 2% 4% 0% 0% 0%All others 45% 39% 13% 5% 6% 9% 32% 5%Total 100% 100% 100% 100% 100% 100% 100% 100%
B. Sugar Taken into BondBrazil 14% 24% 2% 0% 6% 14% 11%India 2% 4% 18% 3% 0% 14%Kenya 5% 0% 1% 0% 0% 0%Mozambique 2% 2% 4% 5% 5%South Africa 38% 53% 60% 24% 26% 44% 16% 21%Swaziland 10% 19% 24% 41% 39% 25%Tanzania 0%Thailand 8% 3% 12% 24% 32% 3% 13%All others 36% 18% 12% 13% 13% 4% 24% 12%Total 100% 100% 100% 100% 100% 100% 100% 100%
C. Sugar Taken Out of BondBrazil 4% 28% 2% 0% 4% 35% 11%India 2% 3% 15% 4% 0% 6%Kenya 3% 1% 0% 0% 1% 0%Mozambique 3% 1% 0% South Africa 41% 47% 67% 30% 24% 78% 23% 31%Swaziland 8% 28% 26% 13% 1% 1%Tanzania 0% 0% Thailand 12% 4% 9% 17% 31% 1% 0% 31%All others 40% 20% 11% 8% 14% 3% 40% 21%Total 100% 100% 100% 100% 100% 100% 100% 100%
D. Sugar Re-ExportedBrazilIndiaKenya 21% 0%MozambiqueSouth Africa 2% 23% 0%Swaziland 1%Tanzania 1%Thailand 2% 4%Sudan 0% 1% 1% 14% 58% 48%DRC 45% 11% 2% 84% 67% 68% 35%All others 32% 84% 71% 16% 32% 17% 42% 17%Total 100% 100% 100% 100% 100% 100% 100% 100%
E. Sugar Exported of Ugandan OriginBrazil 2%IndiaKenya 3% 22% 0% 17%MozambiqueSouth AfricaSwazilandTanzania 7%ThailandAll others 97% 100% 100% 78% 100% 98% 100% 76%Total 100% 100% 100% 100% 100% 100% 100% 100%
E. Net ImportsBrazil 11% 14% 1% 0% 0% 1% 13% 3%India 0% 2% 2% 10% 2% 0% 0% 2%Kenya 3% 0% 1% 2% 0% 0% 6% 9%Mozambique 0% 0% 0% 2% 0% 0% 0% 0%South Africa 33% 50% 73% 47% 46% 57% 30% 47%Swaziland 0% 2% 7% 23% 28% 8% 0% 0%Tanzania 1% 1% 0% 0% 0% 26% 16% 23%Thailand 8% 2% 5% 10% 15% 0% 0% 8%All others 44% 30% 12% 7% 9% 8% 35% 9%Total 100% 100% 100% 100% 100% 100% 100% 100%
Percentages By Sugar Source Category
Table 5.2: Ugandan Sugar Imports, 2000-2007

39
Most of the sugar production increase since 2000 has been sugarcane purchases from outgrowers as opposed to increased cultivation of estate lands. Figure 5.3 shows a long-term trend of generally increasing sugar cane purchases from outgrowers. The amount of sugarcane purchased from outgrowers in 2007 was three times the 2000 level. Figure 5.4 shows the relative growth rates of sugar production and sugarcane purchases from outgrowers. Using an index that compares both output levels relative to their 2000 levels and setting the 2000 level equal to 100, sugar production in 2007 was 144 (44% higher than in 2000), while sugarcane purchases from outgrowers increased to 291 (191% higher than in 2000). Thus, sugarcane from outgrowers is a growing source of all of sugar produced by the industry. It may be inferred that it is substantially cheaper to purchase sugarcane than to grow it.
388,513
612,272
804,273 780,765
550,769
822,012
653,294
1,131,645
2000 2001 2002 2003 2004 2005 2006 2007
Ton
s of
Sug
ar C
ane
Figure 5.3: Sugar cane purchases from outgrower farmers in Uganda.
100%
142%158%
212% 207% 201%
168%
291%
100% 98%121% 129%
143% 141% 140% 144%
2000 2001 2002 2003 2004 2005 2006 2007
Yea
r 20
00 =
100
% fo
r bo
th in
dica
tors
Outgrowers Cane Sugar Production
Figure 5.4: Relative growth rates in outgrowers’ cane purchased and sugar production since 2000.

40
C. Differences in the Ugandan Sugar Companies Figure 5.5 shows the relative output share of the four largest Ugandan sugar mills. As seen in Table 5.3, the rank size ordering of the big three companies was the same each year over the 1998-2007 period. Kakira is the dominant firm. Kinyara produces between 70 and 90 percent of the output level of Kakira, and Lugazi, the smallest, generally produces about 40 percent of Kakira’s output level. Table 5.3 shows the total production (in tons) and percent share of total output of each firm. The highlighted cells indicate the peak levels of output or share of total output of each of the three main companies over the 10-year period.
GM Sugar3%
Lugazi19%
Kinyara29%
Kakira49%
Figure 5.5: Ugandan sugar production: output shares of the four Ugandan sugar mills, 2007.
1998 1999 2000 2001 2002 2003 2004 2005 2006 2007Kakira 49,450 61,234 58,650 56,504 75,268 87,296 84,160 88,292 93,182 96,786Kinyara 35,478 41,700 50,209 52,948 57,900 53,799 65,137 61,299 60,201 58,062Lugazi 17,599 23,248 28,091 24,528 32,795 35,579 46,819 44,137 38,117 37,444GM Sugar (estimate) 5,000
TOTAL: 102,527 126,182 136,950 133,980 165,963 176,674 196,116 193,728 191,500 197,292
1998 1999 2000 2001 2002 2003 2004 2005 2006 2007Kakira 48% 49% 43% 42% 45% 49% 43% 46% 49% 49%Kinyara 35% 33% 37% 40% 35% 30% 33% 32% 31% 29%Lugazi 17% 18% 21% 18% 20% 20% 24% 23% 20% 19%GM Sugar (estimate) 3%
TOTAL: 100% 100% 100% 100% 100% 100% 100% 100% 100% 100%
Shaded cells indicate the year the sugar mill reached its highest level of the indicator in question.Source: USCTA 2008
Table 5.3: Ugandan Sugar Production by Mill, 1998-2 007
The big three companies vary in terms of size and structure, the extent to which they rely upon outgrowers, and their approaches to business risk and innovation. As seen in Figures 5.6 and Table 5.4, they differ markedly in the degree to which they rely on outgrowers, both in terms of the proportion of total sugar cane from their own lands and the proportion they purchase from outgrowers, and in terms of the total tons from each of these sources.

41
35%
53%
75%
65%
47%
25%
0%
10%
20%
30%
40%
50%
60%
70%
80%
90%
100%
Kakira Kinyara SCOUL
Per
cent
of E
ach
Mill
's A
crea
ge b
y T
ype
Nuclear Estate Outgrowers
Figure 5.6: Differences in the relative importance of nuclear estates vs outgrower area harvested in Uganda in 2007.
2000 2001 2002 2003 2004 2005 2006 2007Kakira 251,900 348,384 345,751 496,329 464,195 466,800 340,276 697,853Kinyara 88,334 149,962 147,233 193,155 213,068 247,932 271,990 310,612Lugazi 48,279 52,423 119,288 132,528 127,010 66,033 41,028 123,180GM Sugar (estimate) TOTAL 388,513 550,769 612,272 822,012 804,273 780,765 653,294 1,131,645
2000 2001 2002 2003 2004 2005 2006 2007Kakira 65% 63% 56% 60% 58% 60% 52% 62%Kinyara 23% 27% 24% 23% 26% 32% 42% 27%Lugazi 12% 10% 19% 16% 16% 8% 6% 11%GM Sugar (estimate) TOTAL 100% 100% 100% 100% 100% 100% 100% 100%
Table 5.4: Tons of Sugar Cane Purchased from Outgro wer Farmers, 2000-2007
Another difference between the companies is the extent to which they have introduced new sugar cane varieties. Thirty-eight percent of Kakira’s estate is now planted in new cane varieties, while both Kinyara and SCOUL have planted only four percent of their estates in new varieties. Kakira has also been at the forefront in expanding its sugar output, and largely by relying more on outgrowers. The companies also have different cost structures. SCOUL has a much larger fixed labor cost because over 5,000 persons live on the company’s estate; this limits management’s flexibility in using these costs proactively. These various differences—in size, structure, managerial style, and strategy—mean that changes required to fortify sugar would affect each company differently.

42
D. The Changing Ugandan Sugar Market The Ugandan sugar industry faces keen competition internationally. It produces an inferior product—its product is not white enough to meet international standards for “mill sugar” or “plantation sugar”—and it has a high cost structure. This limits potential markets for Ugandan sugar, as do transportation costs since Uganda is landlocked. The USCTA (2008) states that “probably the only realistic [export] markets” for the Ugandan sugar industry to target are DRC, Southern Sudan, Burundi, and Rwanda. Its major market is, and is likely to remain, Uganda. This has important implications for the Government’s sugar fortification strategy—particularly given the high level of protection the industry currently enjoys (further discussed below). The Ugandan sugar production market is changing in several important ways. First, sugar producers are increasing. GM Sugar Limited started production in 2007. It has no estate cane planted, and relies exclusively on outgrowers. Sango Bay, a mill closed for several years is planning to resume production in 2009. A new, relatively small mill is being constructed by Mayuge Sugar near Kayunga. Second, the Ugandan government has lowered the tariff for sugar imports, decreasing the tariff protection that the Ugandan sugar industry has enjoyed for many years (and further discussed below). Finally, the market is changing in ways discussed below.
1. The Ugandan Sugar Industry New Business Model The three major sugar companies are developing new business models to respond to these changes and are developing new product lines. While the traditional model—based on producing and refining sugarcane, and selling by-products—is still at the heart of the approach, international conditions (primarily the high price of oil) have created new opportunities that the sugar companies are seizing. According to the USCTA 2007 Annual Report, all three companies are conducting major modernization efforts costing together more than $100 million. Underlying the strategy are two key assumptions: (1) domestic consumption of sugar will increase faster than in direct proportion to the national population and (2) companies will be able to increase output more rapidly and achieve economies of scale such that the average cost to produce a ton of sugar will fall. Just as Kakira has been the innovator and industry leader in changing the traditional estate-based sugar model—by expanding its output, relying on increased purchase of outgrowers’ sugar to expand its sugar production and introducing new sugarcane varieties—it is at the forefront of this new business model. The other two major “new” products are electrical power from combining molasses and petroleum and ethanol production. Kakira began a commercial venture as a supplier of electrical power in December 2007. It uses internally-produced electricity to power its own operations—as most sugar mills do—and sells 6 MW of electricity to the national grid. Kinyara is currently installing a steam turbo-alternator with 7 MW capacity and SCOUL is installing one of 6 MW capacity. The molasses-based bio-fuel is still being developed, but the economics of oil suggest it is promising. They seek a government-articulated policy before investing in the required

43
distillation equipment. USCTA reports that in 2007, 80,000 tons of molasses were produced; “assuming that one ton of molasses can be turned into 200 to 250 liters of anhydrous ethanol, then 16 to 20 million litres of anhydrous ethanol could be mixed with 180,000 liters of petrol (at a 10 to 90 ratio) saving the foreign exchange cost of importing 20 million liters of petrol” (USCTA, 2007:8). A key underlying assumption of the new business model is that industries can increase production—relying principally on outgrowers providing the cane—and that they have adequate excess capacity to achieve these output levels with relatively minor incremental cost increases (effectively spreading the fixed costs of current operations over a larger production level.
2. Sugar Imports and Import Duties The Ugandan sugar industry is currently protected from international competition by several different international agreements to which Uganda is party. Uganda is a member of the East African Customs (EAC) Union which was established by Uganda, Kenya, and Tanzania on November 30, 1999. The EAC membership expanded in July 2007 to include Rwanda and Burundi. The EAC identifies sugar (among other products) as an exception to the Common External Tariff. The EAC applies a special, higher tariff rate to sugar imports. According to EAC regulations, imports of “direct consumption sugar” (EAC code: 1701.11.90) has a 100 percent duty and industrial sugar has duty of 10 percent of CIF price at East African port of entry. The USCTA 2007 Annual Report states that: The Customs Union provided for COMESA and SADC preferential tariff treatment to continue to apply on eligible goods. As a safeguard measure, initially only 200,000 tons of COMESA sugar per annum, designated as “Gap Sugar” was allowed into Kenya on a duty free basis for a 2-year period, which was later extended to February 28, 2008, when the safeguard measure was due to be lifted. However, the Kenya Sugar Board, concerned that the lifting of the “Gap Sugar” duty free limit would damage their sugar industry, has negotiated and won a further 4-year extension of a modified safeguard measure with COMESA. In 2008, the new safeguard quota is 220,000 tons and that will be increased by 40,000 tons per annum over the next 3 years. By March 2011, the safeguard will be eliminated. This will affect Uganda and indeed the whole of the East African sugar industry. It is doubtful whether the whole of the East African sugar industry will be able to survive full liberalization and some of the smaller producers will probably disappear. This is a very serious concern and should be assessed and addressed by the Uganda Government, not only for its sugar industry survival, but also to determine the viability of a sugar fortification program. E. Conclusions about the Sugar Industry’s Current Situation and Attitude toward Fortification The factors described above—the changing international sugar market, global economic conditions, protection from international competition, and the evolving business model of Ugandan sugar companies—provide little certainty for the industry’s future. Thus, it is hardly surprising that sugar companies are not rushing to fortify.
44
Regarding whether or not the industry will fortify voluntarily, a broader perspective of the relationship between the Government of Uganda and the sugar industry is needed. The Ministry of Health’s view, alone, is not adequate. While fortification is a public health issue for the MOH, it is more than that for the sugar industry. A more comprehensive Government of Uganda perspective on the sugar industry is necessary and must consider:
• the industry’s largely Uganda-only market and its desire to be internationally competitive,
• Maintaining protection and the characteristics of protection, together with UCSTA’s hope for continued Government support for protecting the industry,
• the international price of oil and whether a molasses-based ethanol policy should be developed,
• the regulatory system and the extent to which Government can mount a credible sugar import control policy, and
• the cost to generate power and the price the sugar industry gets for selling excess electricity.
The GOU should bring these points to the negotiating table when discussing fortification with the sugar industry. Pulling together the diverse public sector agencies and actors may be difficult, but is required to get sugar fortified in Uganda—particularly if the GOU continues to insist on a voluntary policy. F. The Costs of Fortifying Sugar The estimates presented here are based on the following assumptions:
1. Fortifiable sugar is defined as nearly 200,000 ton/year (i.e. calculated as 85% of domestic production: 232,108 x 0.85 = 197,292 tons of sugar as the UCSTA reported was produced by mainly three of the Ugandan sugar companies).
2. Fortifiable sugar consumption is assumed to be the equivalent of the distribution of UBOS HIES 2003 household sugar purchase data: nationally, 65 percent of all households purchase sugar.
3. The average consumption of fortifiable sugar is estimated as: (total sugar output of sugar for final consumption) divided by (the proportion of the national population purchasing some sugar: 28.58 million x 0.65 = 18.58 million) = 232,108 MT/18.58 million = 12.5 kg/year ≈ 34 g/day per person.
4. The fortificant is a water-dispersible encapsulate of Retinol Palmitate 250,000 IU/g. 5. The cost of the fortificant is 79,920 UGX (US$48) per kg. 6. The cost of freight, clearance, NDA import license fee and the 2 percent NDA fee
together equal 5.43 percent of the fortificant cost (based on Ugandan oil industry data). 7. The retail price of sugar is 1,700 UGX (US$1.02) per kg. 8. The sugar company’s cost to add vitamin A to the sugar and provide quality assurance
(internal and samples referred to UIRI) are US$20,000/year per mill (similar to an oil factory cost), i.e. U$60,000/year for the entire industry.

45
9. The equipment necessary for fortification will cost US$120,000 per mill; it means US$360,000 for the whole industry. The useful life of the equipment has been estimated in 10 years, which would mean an annual distributed investment for the country of US$36,000.
Then it may be estimated that:
a. The total cost to fortify all Ugandan-produced sugar with an average factory level of 15 mg/kg (200 g of vit. A 250,000 per metric ton) is: 0.2 kg vit A/ton x 200,000 ton x US$48/kg vit. A = US$1,920,000 x 7.43% freight and taxes = US$ 2,062,656 = 3,400 million UGX.
b. The additional cost due to industry quality control (US$60,000) plus the annual distributed expense in equipment (US$36,000) increases the annual cost of the sugar fortification program to US$2,158,656 = 3,600 million UGX.
c. Cost distribution is as follows: Vitamin A: 95% ; industry quality control: 3%; and equipment and processing: 2%.
d. The cost of fortifying a ton of sugar is: 17,971UGX (US$10.79) and e. The fortification cost equals 1.06% (18/1700) of the retail price of a kg of sugar. f. The annual investment per consumer is 225 UGX (US$0.135)/year (17,971
UGX/MT x 12.5 kg/year = 225 UGX/year per person).

46
CHAPTER SIX VI. Recommendations and Conclusions Uganda has made significant advances in fortification in recent years and is now poised to accelerate the pace of progress. Ugandan vegetable oil is already fortified with vitamin A; initial maize flour fortification efforts have begun; and the Government is now considering wheat flour fortification. Sugar, considered in the past, also seems to be an appropriate vehicle for fortification. This report focused on oil and sugar fortification as vitamin A sources. A. Nutritional Significance After reviewing the current consumption pattern of oil, a second food vehicle is necessary to complement vitamin A intakes being provided by fortified oil. The most suitable candidate is sugar, in terms of coverage and additional vitamin A intake. In Uganda, fortification formulas of both wheat and maize flour contain vitamin A, and the level should be adjusted to complement the amounts provided by oil and, expectantly, sugar. Table 6.1 summarizes the nutritional significance of oil and sugar fortified with vitamin A. Estimations were also made using the ECSA fortification guidelines—a level of 10 mg/kg instead of the current 15 mg/kg, as stipulated in the Ugandan sugar fortification standard.
Table 6.1 Nutritional Significance of Oil and Sugar Fortification in Uganda
Sugar
Parameter Oil Uganda Formula ECSA Formula
Average vitamin A level at fortification
35 mg/kg 15 mg/kg 10 mg/kg
Estimated vitamin A level at households
20 mg/kg 7.5 mg/kg 5 mg/kg
Daily food intake by consumers
15 g/day 34 g/day 34 g/day
Additional intake of vitamin A
300 µg/day 255 µg/day 170 µg/day
Additional proportion of the requirement14
60 % 51 % 34 %
Proportion of consumers in 2003
57 % 65 % 65%
Number of individuals reached15
16.3 million 18.6 million 18.6 million
14 Assuming that the “population” Estimated Average Requirement (EAR) is 500 µg/day. 15 Assuming a population of 29 million persons.

47
The data suggest that an important biological impact would be obtained by consuming fortified oil and fortified sugar, alone or in combination. Once fortified with this nutrient, these food vehicles are the main vitamin A sources for the majority of Ugandans. Sugar had a larger coverage than oil in 2003, (65% compared with 57%), but because oil is easier to fortify—and is an ongoing program—sugar should be the complementary program. The oil and sugar fortification programs combined would cover 76 percent of the population (i.e. 21.7 million persons). Reaching the remaining 24 percent will require other interventions, such as flour fortified with vitamin A or preventive supplementation. If sugar complements the oil fortification program, then the ECSA fortification formula may be more appropriate than the current Ugandan standard. The average oil consumer receives 66 percent EAR of vitamin A, while the average sugar consumer will receive 34 percent using the ECSA formula. The use of the ECSA-suggested formula appears to have little decrease in the nutritional significance of fortified sugar, but the price reduction may make this program more attractive and viable. B. Cost Implications The Table 6.2 shows the cost estimates of the oil and sugar fortification programs.
Table 6.2 Cost Implications of Oil and Sugar Fortification in Uganda
Sugar Parameter Oil
Uganda Formula ECSA Formula
Annual cost per person US$ 0.030 US$ 0.135 US$ 0.090
Cost per metric ton of food
US$4.84 US$ 10.79 US$ 7.50
Annual Production in the Country
100,000 MT 200,000 MT 200,000 MT
Total cost for the country
US$ 0.48 million US$ 2.2 million US$ 1.50 million
Food price per kilogram in 2008
US$ 1.88 US$ 1.02 US$ 1.02
Increase in price due to fortification
0.26 % 1.06 % 0.74 %
Initial Investment in Equipment per
factory16 US$ 19,050 US$ 120,000 US$ 120,000
Table 6.2 shows that both types of fortification are economically feasible, because the price increase of the unfortified product is relatively low (0.26% for oil and 0.74-1.06 % for sugar). The relative and absolute difference between the fortification cost of oil and sugar (6 times larger for sugar), and initial investment costs in equipment, explains why oil fortification is easier, and the reason why the industry has already adopted this program.
16 These amounts are for 10 years of operation.

48
The cost comparison of providing 100 percent EAR yearly for each individual through oil and sugar fortification is US$0.050/year for oil, and US$0.265 for sugar; i.e. a five time difference. The higher fortification cost of sugar is from a more expensive type encapsulated powder form of vitamin A. Thus, the fortificant compound of vitamin A for oil (1.7 million UI/g) is equivalent to 510 g/kg vitamin A (1 mg vitamin A = 3333 IU); the price of this compound is US$66.7/kg, so the cost is US$130 per kilogram of vitamin A (66.7/0.51). Likewise, the fortificant compound of vitamin A for sugar (250,000 IU/g) is equivalent to 75 g/kg vitamin A; the price of this compound is US$48 per kilogram, so the cost is US$640 per kilogram of vitamin A (48/0.075). Thus the cost of the vitamin A compounds explains why sugar fortification is more expensive. Sugar fortification will require a larger, yet necessary, investment, because fortified oil will not reach some vulnerable groups. In summary, a higher vitamin A level in oil combined with a lower sugar fortification level is an adequate policy to follow. Now, Uganda must adjust downwards the vitamin A content of sugar, following ECSA guidelines. Using both fortification programs, it would require a combined annual investment of US$ 0.120 per person (US$2 million yearly for the whole country), Uganda will provide almost the total needed amount of vitamin A to almost half the population (46% or 13.3 million persons), who consume both oil and sugar; 60 percent EAR to about 11 percent of the population (3.2 million persons), who consume oil but not sugar; and 34 percent EAR to a fifth of the population (19% or 5.5 million persons), who consume sugar but not oil. In any case, 76 percent of the population (21.7 million persons) will have improved vitamin A status. Although accurate additional amounts must be estimated by nutritional surveys, these figures are a good first approximation. The largest cost in oil and sugar fortification with vitamin A is the fortificant itself, 89 percent and 93-95 percent, respectively. This important ingredient is considered an essential drug in Uganda, and therefore is exempt from the 18 percent value-added tax. However, the National Drug Authority must still audit and certify the manufacturing industries wherever they are, and confirm compliance at importation sites. These processes cost approximately US$30,000/year, which means 1.5 percent of the fortificant cost. Therefore, strategies to reduce these costs, mainly for premix providers, may provide important savings for the whole program. The proportion of the cost for purchasing equipment is very low for oil fortification (around 6% of the total expenditures for the first year of operations, and 0.7% of the yearly cost when capital costs are distributed over a 10-year period). For sugar fortification, the initial investment per factory is about US$120,000, (24% of the annual expenditures of the first year if using the ECSA food fortification formula, or 16% if using the current Uganda formula). The proportions are reduced to 2.4 percent and 1.6 percent of the yearly costs, respectively, when considering the 10-year useful life of the equipment. The estimated cost associated to internal quality control and assurance, including sending periodic samples to external reference laboratories, is within expected figures. An estimated annual cost was US$45,000 for the oil and for the sugar fortification processes. This amount means 8 percent of the oil fortification recurrent cost, and 2-3 percent of the sugar fortification recurrent cost.
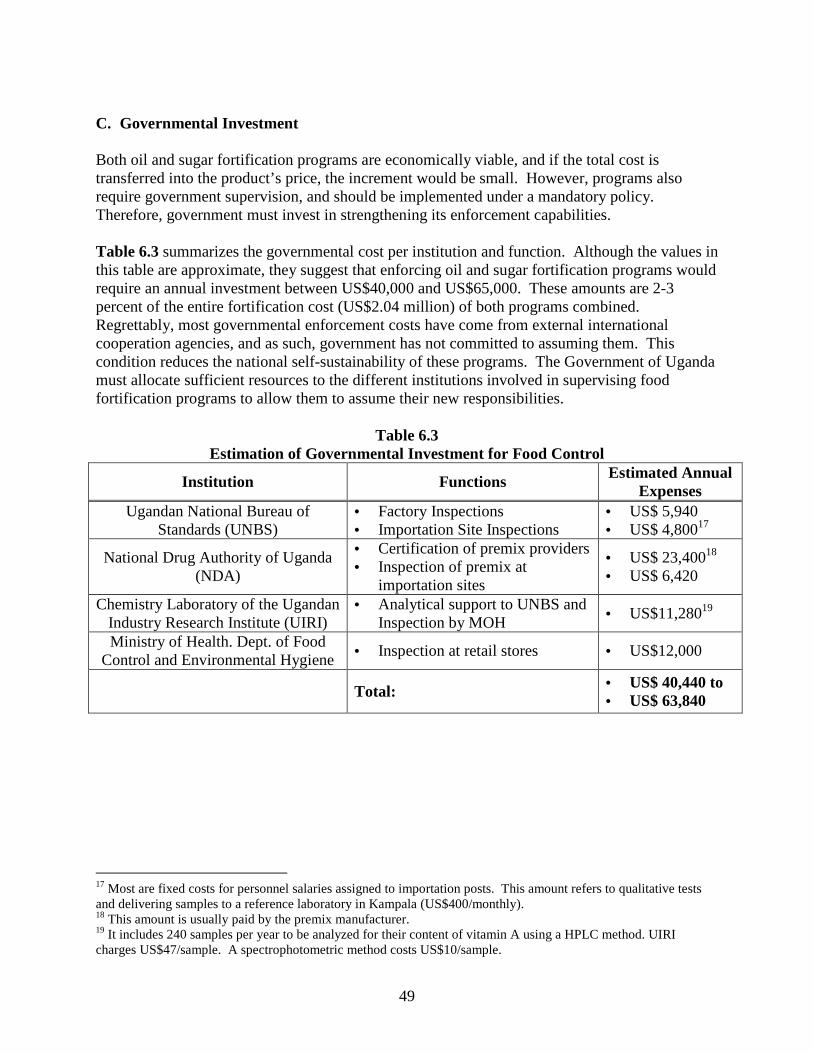
49
C. Governmental Investment Both oil and sugar fortification programs are economically viable, and if the total cost is transferred into the product’s price, the increment would be small. However, programs also require government supervision, and should be implemented under a mandatory policy. Therefore, government must invest in strengthening its enforcement capabilities. Table 6.3 summarizes the governmental cost per institution and function. Although the values in this table are approximate, they suggest that enforcing oil and sugar fortification programs would require an annual investment between US$40,000 and US$65,000. These amounts are 2-3 percent of the entire fortification cost (US$2.04 million) of both programs combined. Regrettably, most governmental enforcement costs have come from external international cooperation agencies, and as such, government has not committed to assuming them. This condition reduces the national self-sustainability of these programs. The Government of Uganda must allocate sufficient resources to the different institutions involved in supervising food fortification programs to allow them to assume their new responsibilities.
Table 6.3 Estimation of Governmental Investment for Food Control
Institution Functions Estimated Annual Expenses
Ugandan National Bureau of Standards (UNBS)
• Factory Inspections • Importation Site Inspections
• US$ 5,940 • US$ 4,80017
National Drug Authority of Uganda (NDA)
• Certification of premix providers • Inspection of premix at
importation sites
• US$ 23,40018 • US$ 6,420
Chemistry Laboratory of the Ugandan Industry Research Institute (UIRI)
• Analytical support to UNBS and Inspection by MOH
• US$11,28019
Ministry of Health. Dept. of Food Control and Environmental Hygiene
• Inspection at retail stores • US$12,000
Total: • US$ 40,440 to • US$ 63,840
17 Most are fixed costs for personnel salaries assigned to importation posts. This amount refers to qualitative tests and delivering samples to a reference laboratory in Kampala (US$400/monthly). 18 This amount is usually paid by the premix manufacturer. 19 It includes 240 samples per year to be analyzed for their content of vitamin A using a HPLC method. UIRI charges US$47/sample. A spectrophotometric method costs US$10/sample.

50
Annex 1: Terms of Reference
Support to the Government of Uganda to Conduct a Fortification Program Cost Analysis
Jack Fiedler, SSDS, A2Z/Washington
Uganda Visit: May 9-29, 2008 Overview Uganda has made significant advances in fortification in the past few years and the country is now poised to accelerate the pace of progress. Vegetable oil is already fortified with vitamin A in Uganda and initial efforts have been done with maize flour, and the Government is now actively considering the fortification of wheat flour, maize flour and sugar. The purpose of this consultancy is to develop estimates of the incremental costs to the public sector and the private sector of the fortification of vegetable oil and sugar as the most suitable vehicles to prevent vitamin A deficiency. Background USAID started providing technical assistance in fortification to the Government of Uganda in 2003 under the auspices of the MOST project. A2Z has continued that support. During the last year, the government of Uganda introduced a food control system, which covers factories, importation sites and retail stores. The system has also strengthening the analytical capabilities of the governmental food control laboratories. , Furthermore, Uganda is being considered as a model in the ECSA region, and the lessons learned are going to be extended to the other members of ECSA. Thus, A2Z’s ECSA fortification work, however, will be combined with two major activities that will be undertaken in Uganda; effectively using Uganda as an ECSA country example to demonstrate two additional key sets of activities that are essential in introducing a comprehensive fortification program. The two activities are: a food consumption and expenditure survey, and a cost study. A2Z and GAIN are jointly supporting the food consumption and expenditure survey in Uganda that is scheduled to begin fieldwork shortly. The purpose of the survey is to generate 24-hour recall food consumption data for women of reproductive age and for children 6-59 months old. This cost study will complete the information required for the use of food fortification as a public health intervention by estimating the financial requirements of a fortification program—both its public and its private sector components. Objective The purpose of this consultancy is to conduct a cost study of fortifying vegetable oil and sugar with vitamin A. The primary audience of the study is the government of Uganda—foremost the Ministry of Health, but also other government agencies involved in the implementation and regulation of the fortified foods including: the Uganda National Bureau of Standards (UNBS) and the Uganda Industry Research Institute (UIRI), both of the Ministry of Trade and Industry, as well as the National Working Group on Fortification.

51
A secondary audience of this study is other—especially neighboring—countries that might be considering fortification and would like a more detailed understanding of the structure, costs and operations of such a program. The study will provide a detailed descriptive analysis of the process through which the program was first discussed and the preparatory work that was undertaken so as to describe the issues and steps that other countries wanting to emulate the Ugandan experience can expect that they too will have to address. Later, cost analysis of wheat and maize flour fortification may be considered upon the identification of financial resources and the interest of the country to carry out these studies. The Costing Study Methodology The cost study will employ an activity-based costing methodology combined with the ingredients approach (WHO 2004). The studies will be designed and implemented in such a way as to provide a detailed descriptive account of the program and how it is implemented. The activities of all of the public sector actors—including the Ministry of Health’s Department of Nutrition, the Department of Food Control and Environmental Hygiene, the National Drug Authority, and the Ministry of Industry and Trade’s UIRI-Lab and UNBS. Having a detailed understanding of the program—how it is structured, how it functions, who does what, as well as the types and quantities of initial capital investments (equipment and training) required and the additional annual recurrent costs of labor, premix and other inputs—allows getting beyond simply providing a cost estimate: it facilitates identifying and better understanding why costs are what they are, what kind of variations exist in the program and its costs, and whether the program’s coverage can be increased, and/or the program can be made more effective in other terms, and/or its costs can be reduced. The study will entail site visits to the two largest vegetable oil producing plants (BIDCO and Mukwano) and one of two of the three largest sugar mills (Kakira, Kinyara and Lugazi) during this consultancy. The purpose of the visits will be to interview plant officials and obtain data and a first hand understanding of the fortification program’s requirements. In addition, there will be interviews with officials of each of the government agencies involved in the fortification program. Expected Outputs/Products The fortification costing study will produce several different products. First, it will produce an estimate of the total annual incremental costs of fortification, the total annual incremental costs to the public sector, the total annual incremental costs to the private sector, and the incremental costs per quantity of fortified food. Second, the study will produce a detailed set of algorithms that will identify the types and quantities of activities required to implement the fortification program and all of the inputs required to produce each major activity. There will be one set of these algorithms for the sugar industry, one for the vegetable oil industry and one for each of the government agencies monitoring the program or conducting related food quality assurance activities.
52
Tasks and Activities 1. From interviews and documents, develop a detailed description of the fortification program’s
structure and operations in each of the public sector agencies involved in its implementation and in the sugar and vegetable oil industries.
2. For each agency involved in implementing the public sector monitoring and regulatory program (and, if appropriate, each level of the agency) identify the key activities and the staff/positions responsible for each aspect of the program and the specific activities they perform or assist in undertaking in implementing the program.
3. Identify all of the inputs required to undertake the identified key activities at each level of the program for all of the organizations involved in implementing the program and the quantities and costs of those inputs.
4. Estimate costs of the planned social marketing program for the fortification program. 5. Analyze the data and write a draft report. 6. Send the draft report to those individuals or organizations that have participated in the study
and solicit their comments and suggestions. 7. Revise the draft report, taking into account comments and suggestions of those reviewing the
draft as deemed appropriate, and produce the final report. Level of Effort The total level of effort of this activity will be 29 days, including the 14 working days spent in-country. Reference World Health Organization (WHO). 2004. Making Choices in Health: WHO Guide to Cost-Effectiveness Analysis. Editors: T. Tan-Torres Edejer, R. Baltussen, T. Adam, R. Hutubessy, A. Acharya, D.B. Evans and C.J.L. Murray. WHO: Geneva. Updated version available at: http://www.who.int/choice/en/ (Accessed March 15, 2008.)

53
Terms of Reference For One or Two Ugandan Participants in the Fortification Cost Study
A2Z, the USAID Micronutrient Project, will be conducting a cost study of the fortification process at vegetable oil and sugar industries in May-June 2008. The A2Z health economist, Jack Fiedler, will be in Uganda May 9-29 to undertake the study. The study provides an opportunity to learn first-hand how to conduct such a study, and A2Z is encouraging one or two Ugandans to participate in the study. Given the discussions currently taking place regarding new fortification possibilities in Uganda, it is hoped this opportunity will provide the participants the experience and materials necessary to conduct similar such studies of other foods in Uganda or in other ECSA countries. Recognizing the common regional approach to fortification that has been championed by ECSA—including the development of common standards and a common regulatory structure and methods—there will be direct applicability of portions of the experience that will be gained from this Uganda-based work, to other member countries of ECSA. The attendance to this in-hand training will be without cost for the Ugandan colleagues who are accepted in the field team. Furthermore, A2Z is going to provide per diem and transportation costs of the participants while conducting the study in sites outside of Kampala.

54
Agencies, Organizations and Companies to be Visited for the Cost Study 1. Ministry of Health: a. Department of Nutrition b. Department of Food Control and Environmental Hygiene c. National Drug Authority 2. Ministry of Trade and Industry a. Uganda National Bureau of Standards (UNBS) b. Uganda Industry Research Institute (UIRI) 3. Vegetable oil producers:
a. BIDCO b. Mukwano
4. Sugar mills
a. Kakira b. Kinyara c. Lugazi
5. National Working Group on Fortification 6. GAIN Project

55
Annex 2: Household Income and Expenditure Surveys
Household surveys have been conducted in most countries for a decade or more and have become increasingly important routine sources of information for monitoring economic and social conditions. In most cases, periodic, routine household surveys were initiated to provide data for national income accounts, consumer and wholesale price indices, and poverty and inequality analysis. Over time, as countries’ needs for detailed information on a wide variety of household characteristics and activities have grown, the surveys conducted by most countries have evolved to become integrated, multi-purpose instruments. As the use of these tools has grown, starting in the mid-1980s, there has been a commensurate growth in interest in improving their design and implementation in order to make them more precise, while enabling cross country comparisons, avoiding duplication and reducing costs.20 These efforts have produced general guidelines for conducting household surveys, there remains a variety of different types of surveys and multi-purpose surveys include a variety of different combinations of modules, depending upon country’s perceived needs and priorities. This paper makes use of a variety of different household surveys, including income and expenditures surveys, as well as the income and expenditure sections of integrated, multi-purpose surveys covering different topical areas, but refers to all of them as simply “household income and expenditure surveys” (HIES). Due to their country-specific character, as well as differences in how the fieldwork of the surveys is conducted and differences in how the data coding, data entry and data cleaning are implemented, data may vary considerably across countries in terms of quality and content. Another important type of inter-country variation in HIES data that is of particular importance in investigating fortification possibilities is the number of reported food categories. Some countries collect and/or record data on only a few dozen food item categories, whereas others report several hundred. For most of the 31 countries analyzed, three of the four main candidate food vehicles analyzed here are staples. The exception is maize flour, which is a staple primarily only in Sub-Saharan African and Latin American countries. In countries, where maize flour is not a staple, there frequently is no maize flour food item category. Limitations and Potential Uses of HIES Data to Proxy Food Consumption Data The HIES provide data on food expenditures, not food consumption. This is a proxy measure for food consumption data. Household food expenditures, however, may vary for a variety of reasons. Food consumption might be less than food expenditures, for example, because they might simply add to stocks of food in the household, or the food might be lost, wasted or given away. Thus the results would be described as “apparent household consumption”.
20 Among the most important of these efforts have been the World Bank’s development and promotion of Living Standards Measurement Surveys (LSMS) and their more general household survey lessons (13, 14), the United Nations’ Household Survey Capability Program which is now the UN Demographic and Social Statistics Unit (15), and, of more recent vintage, the International Household Survey Network (16).

56
Another limitation of the HIES, is that they provide household-level data, not individual-level data. While they do provide information about key characteristics of the households—including the number of persons and the age, sex and education levels of each—as well as the household’s rural-urban location and its relative income (expenditure) level, they do not provide any insight into how the food that is purchased is distributed within the household or how much of it is actually consumed by each individual in the household.21 Nor do they provide information about the types or quantities of food that are consumed while household members are away from the home. For most countries a number of different food items include the food vehicle in some form. This is most importantly the case with wheat flour. In most countries, wheat flour often has its own food item category—reflecting the fact that households purchase the wheat flour itself as a final consumer product. Wheat flour is also contained in a number of other foods that have their own food item categories, as well. Uses of HIES data in Assessing the Feasibility and in Designing Fortification Programs 1. Assessing the Potential Coverage of a Candidate Food Vehicle The potential reach of three different approaches to wheat flour fortification was investigated by constructing two composite variables of different wheat products. First, wheat flour consumption (as a final consumer product) was analyzed. Then, wheat flour was combined with all other wheat flour-based products, to provide a measure of the maximum potential reach of a program that fortified all wheat flour. Third, in the interest of examining how excluding “luxury” foods from the wheat flour-based foods measure would affect fortification program costs and reach, all wheat flour-based staple foods were collapsed into a single composite which excluded cakes, pastries and biscuits.22 In constructing these different measures, it was necessary to estimate the flour content of the different food items in order to be able to add the flour content of the different products weighted by the quantity of the different products purchased, into a single measure. For a fortification program to be regarded primarily as a public health intervention, a rule of thumb used by food fortification experts is that it must be consumed by at least 30 percent of the population.23 2. Information for Mapping and Targeting Micronutr ient Interventions The HIES also contains information about the size and composition of the household—including the number of persons, their ages and gender—the place of residence (rural or urban), and geographic location. In some instances the samples are information statistically representative down to a region or a state/province level. Thus the HIES can be used to investigate how the coverage of a potential food fortification programs is likely to vary by these characteristics. 21 It is customary to use total expenditure data as a proxy for income. The relative income level is indicated by the household’s national expenditures/income quintile, which is empirically derived from the survey data. 22 “Luxury” foods are defined here (in the economic use of the term) as those that have a higher income elasticity of demand; i.e., they are foods the demand for which increases more than in proportion to increases in income, other things being equal. 23 In contrast to being primarily a public health intervention, fortification might alternatively be motivated primarily by other goals, such as the promotion of Good Manufacturing Practices, GMP.

57
This can be useful information for designing policies and programs so that complementary or substitute programs can be targeted to individuals or households of particular characteristics or targeted to geographic areas so as to better ensure higher coverage or more adequate impacts. Conversely, the HIES can also provide a better understanding of the characteristics of the households and individuals who are likely to benefit less, or not at all, from a fortification program. 3. Identifying “New” Potential Food Vehicles The discussion has focused up to this point on only the four most commonly considered “best” candidate food vehicles (exclusive of salt iodization). The HIES, of course, contains information on many more potential food vehicles that might also be of interest. For instance, in the four countries in which bouillon cubes were reported—Burkina Faso, Cameroon, Cote d’Ivoire and Guinea—it appears as though this might be a promising vehicle: with 72 to 89 percent of households reporting purchases of this low priced condiment and the proportion is relatively constant over all five income quintiles. 4. Investigating Combinations of Foods and Potential “Substitute” Vehicles Another potentially important use of the HIES is to investigate the combinations of specific types of foods that households purchase. A large proportion of Cambodians, for instance, consume fish sauce daily and some food industry analysts have suggested that it is a substitute for table salt, which has important implications for an iodine fortification strategy. Analysis of the Cambodian HIES found that:
• 46 percent of households purchase table salt, • 62 percent purchase fish sauce, • 75 percent purchase both fish sauce and salt, • 13 percent purchase only salt-not fish sauce and • 29 percent purchase only fish sauce-not salt.
This suggested that iodizing fish sauce, rather than table salt, would enable reaching a larger proportion of the population. The data were re-analyzed by household expenditure quintiles and it was found that salt purchasing patterns were independent of income quintile and although the poorest 20 and poorest 40 percent were not as likely to purchase fish sauce compared to all-households, fortifying fish sauce rather than salt would reach an additional 10 percent of the poorest 40 percent of the population, who are also more likely to be iodine deficient. 5. Informing the Decision of the Amount of One or More Fortificants to Add The HIES data on the quantity of the food purchased can also be used to help inform the setting of the level at which micronutrients should be added to a potential food vehicle. Here, the limitations of the HIES –namely containing household level purchases, not individual level consumption—become more apparent and thus some caution is necessary. The data limitations require certain assumptions about intra-household distribution since estimates for the amount of fortificant are determined on an individual basis.

58
One possible approach is to apply FAO algorithms to calculate adult consumption equivalents (ACE) to the household composition data available in HIES. The HIES data can also be used to model other assumptions and to test their sensitivity. Having chosen a method for estimating the intra-household distribution, the HIES can then be used to estimate the mean and median quantity purchased as well as the quantity purchased by the 5th and 95th percentiles. These values are important parameters that inform the setting of the safe upper limit for the amount of the fortificant(s) to be added to the food so as to ensure that individuals with high consumption levels are not at-risk of receiving excess amounts of any micronutrient that might be included in the fortification formulation. Even though operationalizing this approach requires making some critical assumptions, this approach is likely to be an improvement over less comprehensive, less systematic and less verifiable approaches. Still—because of the need to base the final decision on a key assumption—it is imperative to make any and all assumptions explicit and transparent, and to conduct sensitivity analysis. If there is data on the location or other characteristics of the population with micronutrient deficiencies, this information can be used to assess how well a potential fortification program is likely to cover this target population. Or it can identify (by location or other characteristics) the deficient population that will not be reached by the fortification lives. One potential use of this information would be to use it to target a supplementation program to the areas or persons who the fortification program will not reach (at least not immediately).

59
Annex 3: Adult Consumption Equivalents and Updating Future HIES Data with Data from the
Makerere University 2008 Food Consumption Survey As noted in the text discussion of the HIES, the HIES provides important empirical information about the skewed right nature of the distribution of consumption, which should be regarded as preferable to simply making some assumptions about these key parameters. Given the information void about individual consumption levels and the use of household purchases as its proxy, however, setting the amount of fortificant to be added to a vehicle still requires making one or more assumptions about the intra-household distribution of the household’s purchases of the vehicle in question. The simplest approach makes use of the HIES information about household size and implicitly assumes that all individuals in the household receive equal amounts of the food. This approach does not take into differences in the age or sex of household members, which (as reflected in the age- and sex-specific EARs) give rise to differences in “need”. An alternative approach would be to make use of the HIES information about the number of household members and their ages and sex and either (1) calculates the “adult consumption equivalents” (ACE) using the FAO algorithms (presented in the table below) which are based on energy requirements, or (2) in the case of analyzing a single micronutrient--vitamin A in this case—the vitamin A-specific EAR age and sex categories can be used to calculate vitamin A-specific-adult consumption equivalents.
FAO Adjustment Factors for Calculating the Number of Adult Equivalent Consumption Units
AGE MALE FEMALE < 1 year 0.27 0.27 1 – 3 years 0.45 0.45 4 – 6 years 0.61 0.61 7 – 9 years 0.73 0.73 10 – 12 years 0.86 0.78 13 – 15 years 0.96 0.83 16 – 19 years 1.02 0.77 20 years and above 1.00 0.73
While the ACE approach makes use of more detailed empirical data, it is important to note that its application implicitly assumes that the food purchased by the household is distributed within the household in direct proportion to “need” as reflected in whichever of the two specific algorithms is applied.24
24 This simplifying assumption “smoothes” the intra-household distribution of food consumption, resulting in an underestimation of extreme values and thereby increasing the potential risk of pushing individuals who are outliers (in terms of their level of consumption of the food vehicle) over the UL for a given level of fortification.

60
An alternative approach to making this assumption would be to use the HIES data to model some other intra-household assumptions and to test their sensitivity or to use the food consumption survey that Makerere University is currently conducting to provide an evidence-based approach to devising an algorithm for determining intra-household distribution of purchases, which can then be used in the future, in combination with “new” HIES surveys to update the food consumption survey data. Even though operationalizing this approach requires making some critical assumptions, this approach is likely to be an improvement over less comprehensive, less systematic and less verifiable approaches. Still—because of the need to base the final decision on a key assumption—it is imperative to make any and all assumptions explicit and transparent, and to conduct sensitivity analysis.25
25 If there is data on the location (e.g., region or rural-urban place of residence) or other characteristics of the population with micronutrient deficiencies, this information can be used to assess how well a potential fortification program is likely to cover this target population. Or it can identify (by location or other characteristics) the deficient population that will not be reached by the fortification lives. One potential use of this information would be to use it to target a supplementation program to the areas or persons who the fortification program will not reach (at least not immediately).

61
Annex 4 UIRI Analytical Laboratory Costs
In US$ Gross Monthly Monthly
Number of Persons Salary (US$) Comments Benefits Monthly Annually1 2000 Manager 200 2,200 26,4002 1000 Lab Analysts - Experienced 100 2,100 25,2004 500 Lab Analysts - New 50 2,050 24,6001 300 Assistant 30 330 3,9608 3800 380 6,680 80,160
In UGX Gross Monthly Monthly
Number of Persons Salary (UGX) Comments Benefits Monthly Annually1 3,330,000 Manager 333,000 3,663,000 43,956,0002 1,665,000 Lab Analysts - Experienced 166,500 3,496,500 41,958,0004 832,500 Lab Analysts - New 83,250 3,413,250 40,959,0001 499,500 Assistant 49,950 549,450 6,593,4008 6,327,000 632,700 11,122,200 133,466,400
Source: Author's derivation from data obtained from UIRI Laboratory
Notes:
1 OF 88 SAMPLES RELATED TO VITAMIN A FORTIFICATION
AVG. OF 10% OF ALL WORK IS FORTIFICATION RELATED
Total Remuneration
Total Remuneration
UIRI Analytical Laboratory Personnel Costs
UIRI has been growing. Increased from 5 to 8 staff in the past year, largely due to the ECSA initiated activities (Proficiency Tracking Scheme Project PTS) and UG-specific TA provided by A2Z
HALF OF THAT, 5% OF TOTAL IS RELATED TO REGULATORY COMPLIANCE (UNBS-COMMISSIONED WORK)THE OTHER HALF, 5% OF TOTAL, IS RELATED TO WORK THAT IS DONE DIRECTLY WITH COMPANIES TO IMPROVE THEIR IN-PLANT QA CAPABILITIES
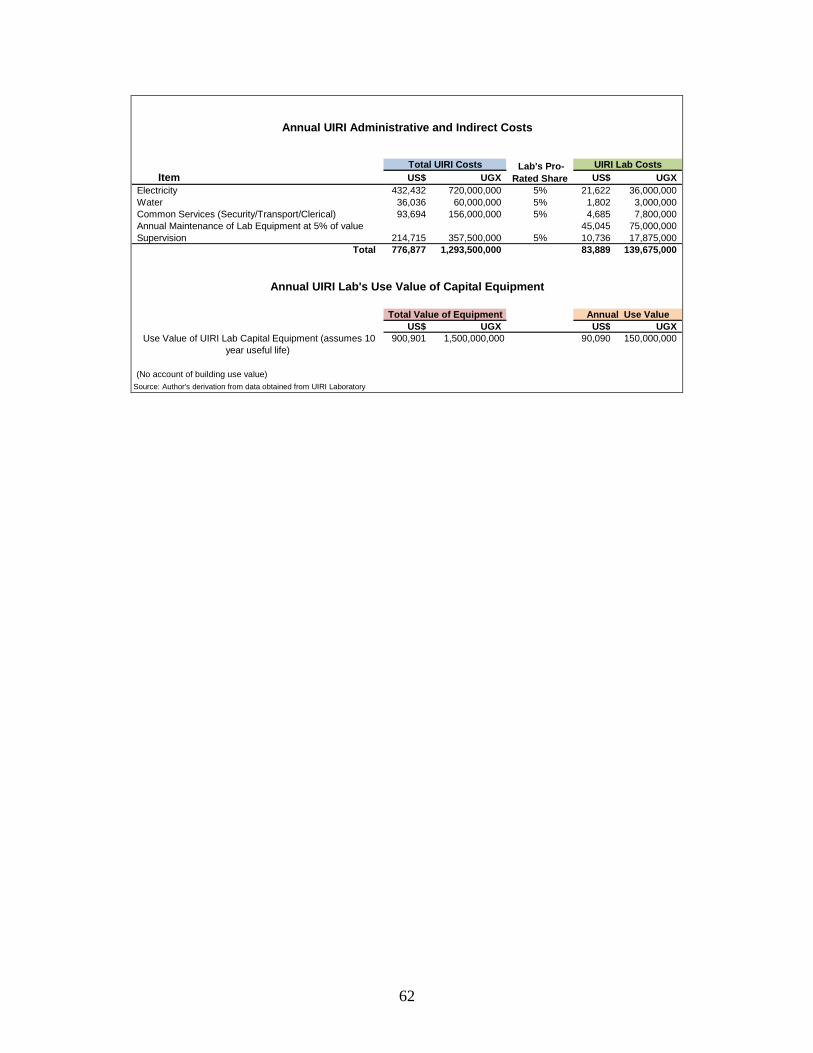
62
Item US$ UGX US$ UGXElectricity 432,432 720,000,000 5% 21,622 36,000,000 Water 36,036 60,000,000 5% 1,802 3,000,000 Common Services (Security/Transport/Clerical) 93,694 156,000,000 5% 4,685 7,800,000 Annual Maintenance of Lab Equipment at 5% of value 45,045 75,000,000 Supervision 214,715 357,500,000 5% 10,736 17,875,000
Total 776,877 1,293,500,000 83,889 139,675,000
US$ UGX US$ UGX900,901 1,500,000,000 90,090 150,000,000
(No account of building use value)Source: Author's derivation from data obtained from UIRI Laboratory
Use Value of UIRI Lab Capital Equipment (assumes 10 year useful life)
Annual UIRI Lab's Use Value of Capital Equipment
Annual UIRI Administrative and Indirect Costs
Total UIRI Costs UIRI Lab Costs
Total Value of Equipment Annual Use Value
Lab's Pro-Rated Share

63
Annex 5 The GAIN/Uganda Grant
One and a half-years ago, GAIN awarded Uganda a US$2.4 million grant, which has just become effective. The table below shows the budget for each of the project’s five major planned activities. Recognizing the limited budget relative to the substantial regulatory system responsibilities of UNBS, the GAIN grant provides for paying two additional UNBS staff and purchasing a vehicle. GAIN’s end-of-project indicators call for 16 companies to be fortifying (four of which already are):
Wheat: Nile Agro, Kengrow, UNGA, Ntake, Bakhresa (GAIN to start with 4, then add Bakhresa in last year) (5 total) Maize: Maganjo and UNGA 2000 (Western region) already fortifying; UNGA (Kampala) to be added (it has WFP contract); WFP (has own mill too) and Eastern Grain Millers and Sunrise. (5 total) Vegetable Oil: Mukwano, BIDCO and MUDDU (3 total) Sugar: Kakira, Kinyara, SCOUL (3 total)

64
Final Dis-Item Months 1-6 Months 7-12 Months 1-6 Months 7-12 Months 1-6 Months 7-12 bursement TOTALA. Absolute Amount in US$1. Production & Distribution 97,932 429,294 187,837 160,423 50,767 35,537 5,077 966,8652. Safety & Quality Control 72,050 62,403 71,846 73,854 81,887 57,321 8,189 427,5493. Social Marketing & Communication 97,020 86,303 108,113 103,438 84,738 59,316 8,474 547,4024. Monitoring & Evaluation 9,329 15,274 45,274 39,114 14,474 10,132 1,447 135,0425. Program Management & Administration 96,480 41,874 48,570 48,570 48,570 33,999 4,857 322,920
Total: 372,811 635,148 461,640 425,399 280,436 196,305 28,044 2,399,778
B. Percentage Distribution by Year1. Production & Distribution 26% 68% 41% 38% 18% 18% 18% 40%2. Safety & Quality Control 19% 10% 16% 17% 29% 29% 29% 18%3. Social Marketing & Communication 26% 14% 23% 24% 30% 30% 30% 23%4. Monitoring & Evaluation 3% 2% 10% 9% 5% 5% 5% 6%5. Program Management & Administration 26% 7% 11% 11% 17% 17% 17% 13%
Total: 100% 100% 100% 100% 100% 100% 100% 100%
C. Percentage Distribution of Project Total1. Production & Distribution 4% 18% 8% 7% 2% 1% 0% 40%2. Safety & Quality Control 3% 3% 3% 3% 3% 2% 0% 18%3. Social Marketing & Communication 4% 4% 5% 4% 4% 2% 0% 23%4. Monitoring & Evaluation 0% 1% 2% 2% 1% 0% 0% 6%5. Program Management & Administration 4% 2% 2% 2% 2% 1% 0% 13%
Total: 16% 26% 19% 18% 12% 8% 1% 100%
D. Cumulative Percentage Distribution of Project Total1. Production & Distribution 4% 22% 30% 36% 39% 40% 40% 40%2. Safety & Quality Control 3% 6% 9% 12% 15% 17% 18% 18%3. Social Marketing & Communication 4% 8% 12% 16% 20% 22% 23% 23%4. Monitoring & Evaluation 0% 1% 3% 5% 5% 6% 6% 6%5. Program Management & Administration 4% 6% 8% 10% 12% 13% 13% 13%
Total: 16% 42% 61% 79% 91% 99% 100% 100%
Year 1 Year 2 Year 3
GAIN/Uganda's Estimated Project Budget and Planned Disbursements

65
Annex 6: Comments of What is Not Included in the Cost Analysis and Why The training costs associated with the regulatory system—many of which have been paid for by MOST and A2Z—are not included in the cost estimates. These are capital costs, and are not included in the annual recurrent costs which are the focus of this analysis. Still, considerations should be given to whether or not there should be regular routine re-training and of which agencies’ staff, how many staff, and at what interval or frequency. If they are done less than annually they are capital costs. If they are done at least annually, they are recurrent costs and should be included here. In that instance, not including them here means the estimates presented here under-estimated the “full costs” of introducing a fortification program. There are also other start-up costs that are not included in this analysis. In addition, the opportunity cost of the persons who participate in the NWGFF and other meeting and study tour costs have not been included. These were not included because it is exceedingly difficult to identify which activities are “essential” and to estimate the costs of only those activities, as opposed to simply including all expenditures that have been made in Uganda by MOST / A2Z, GAIN, UNICEF and other international agencies that have helped to encourage fortification in Uganda. This does not, in any way, mean to suggest that these activities are not necessary. It is simply recognition of the fact that judgments about which of these activities to include and which to exclude, starting when, are largely subjective and arbitrary. Rather than to include them, the analysis here has focused on the recurrent annual costs about which there is much greater consensus and which by and large involve more objective decisions.