FORTIFICATION OVERAGES OF THE FOOD SUPPLY Vitamin … · FORTIFICATION OVERAGES OF THE FOOD SUPPLY...
33
FORTIFICATION OVERAGES OF THE FOOD SUPPLY Vitamin A, Vitamin D and Calcium Prepared as part of a New Zealand Food Safety Authority contract for scientific services by Dr Barbara Thomson June 2006
Transcript of FORTIFICATION OVERAGES OF THE FOOD SUPPLY Vitamin … · FORTIFICATION OVERAGES OF THE FOOD SUPPLY...
FORTIFICATION OVERAGES OF THE FOOD SUPPLY
Vitamin A, Vitamin D and Calcium
Prepared as part of a New Zealand Food Safety Authority contract for scientific services
by
Dr Barbara Thomson
June 2006

Client Report FW0637
FORTIFICATION OVERAGES OF THE FOOD SUPPLY
VITAMIN A, VITAMIN D AND CALCIUM
Dr Stephen On Food Safety Programme Leader
Dr Barbara Thomson Dr Jim Mitchell Project Leader Peer Reviewer
ESR Report on Fortification overagesof the food supply Prepared for the NZFSA, June 2006
DISCLAIMER This report or document (“the Report”) is given by the Institute of Environmental Science and Research Limited (“ESR”) solely for the benefit of the New Zealand Food Safety Authority (“NZFSA”), Public Health Services Providers and other Third Party Beneficiaries as defined in the Contract between ESR and the NZFSA, and is strictly subject to the conditions laid out in that Contract. Neither ESR nor any of its employees makes any warranty, express or implied, or assumes any legal liability or responsibility for use of the Report or its contents by any other person or organisation.
ACKNOWLEDGEMENTS The assistance of staff at the Christchurch Science Centre, ESR with the purchase and dispatch of samples is gratefully acknowledged. The vitamin analyses were ably carried out by AgriQuality, Auckland and the calcium analyses by the Food Chemistry Laboratory, Christchurch Science Centre, ESR. Appreciation to Peter Cressey for interrogation of the food consumption databases.
ESR Report on Fortification overagesof the food supply Prepared for the NZFSA, June 2006
CONTENTS
LIST OF TABLES ................................................................................................................ i
LIST OF FIGURES .............................................................................................................. i
ABBREVIATIONS..............................................................................................................ii
SUMMARY .........................................................................................................................iii
1 INTRODUCTION .................................................................................................... 1
2 MATERIALS AND METHODS............................................................................. 3 2.1 Selection of foods for inclusion in the study ......................................................... 3 2.2 Sampling and sample preparation.......................................................................... 3 2.3 Sample preparation and shelf life studies of vitamin A......................................... 4 2.4 Laboratory analytical methods............................................................................... 4
2.4.1 Vitamin A analysis......................................................................................... 4 2.4.2 Vitamin D analysis......................................................................................... 4 2.4.3 Calcium analysis ............................................................................................ 4 2.4.4 Quality control procedures............................................................................. 4
2.5 Derivation of ranges for overage or underage assessment..................................... 5
3 RESULTS.................................................................................................................. 7 3.1 Sample preparation and shelf life studies of vitamin A......................................... 7 3.2 Concentration of vitamin A in fortified foods ....................................................... 7 3.3 Dietary modelling of exposure to vitamin A ......................................................... 9 3.4 Concentration of vitamin D in fortified foods ..................................................... 10 3.5 Dietary modelling of exposure to vitamin D ....................................................... 11 3.6 Concentration of calcium in fortified foods......................................................... 12 3.7 Dietary modelling of exposure to calcium from fortified foods .......................... 13
4 DISCUSSION AND CONCLUSIONS.................................................................. 14
5 REFERENCES ....................................................................................................... 15
Appendix 1: New Zealand and Australia RDIs and ULs for vitamin A, vitamin D and calcium (AG/MoH, 2006) .................................................................. 16
Appendix 2: Foods fortified with vitamin A, vitamin D and calcium......................... 17
Appendix 3: Quality assurance data .............................................................................. 18
Appendix 4: Results for individual foods ...................................................................... 20
ESR Report on Fortification overagesof the food supply Prepared for the NZFSA, June 2006
LIST OF TABLES Table 1: Selection of foods fortified with vitamin A, vitamin D or calcium for analysis
and comparison with label claim ...........................................................................3 Table 2: Mean concentrations of vitamin A (µg/100g or 100ml) in fortified foods
compared with label claim.....................................................................................8 Table 3: Mean concentrations of vitamin D (µg/100g or µg/100ml) in fortified foods
compared with label claim...................................................................................10 Table 4: Mean concentrations of calcium (mg/100g or mg/100ml) in fortified foods
compared with label claim...................................................................................12
LIST OF FIGURES Figure 1: Measured concentrations of vitamin A compared with label claim ......................9 Figure 2: Measured concentrations of vitamin D compared with label claim ....................11 Figure 3: Measured concentrations of calcium compared with label claim........................13
ESR Report on Fortification overages i Prepared for the NZFSA, June 2006
ABBREVIATIONS CNS National children’s nutrition survey CV Coefficient of variation, equal to the standard deviation of results divided by
the mean of results, expressed as a percentage HPLC High perfomance liquid chromatography IANZ International accreditation New Zealand LOAEL Lowest observed adverse effect level MFD Manufactured Foods Database NOAEL No observable adverse effect level NNS National nutrition survey NZFSA New Zealand Food Safety Authority RDI Recommended dietary intake UL Upper level of intake
ESR Report on Fortification overages ii Prepared for the NZFSA, June 2006
SUMMARY The aim of the current project was to assess the levels of vitamin A, vitamin D and calcium in fortified foods and to compare levels to those claimed on product labels to underpin the development of food standards relating to nutrient fortification. Approximately 290 samples from seven different food groups were analysed for added vitamin A, vitamin D or calcium. Samples were purchased between November 2005 and May 2006 from Christchurch or Auckland retail outlets. Vitamin A content was determined using a solvent extraction and analysis by reverse phase high performance liquid chromatography (HPLC) with fluorescence detection. The inter-sample variability for 5 batches of 22 foods, as measured in terms of CV, was 0-42%. Pre-vitamin D and vitamin D was extracted after saponification, purification by semi-preparative HPLC and analysis by isocratic, reversed-phase HPLC. The inter-sample variability for 5 batches of 18 foods, as measured in terms of CV, was 1-46%. Calcium was measured by atomic emission spectroscopy following ashing and dissolution in nitric acid. The inter-sample variability for 5 batches of 18 foods, as measured in terms of CV, was 2-47%. In assessing the data, an overage or underage was defined as being where the label claim did not correspond to the measured value after making an allowance for the measurement uncertainty associated with this value. Vitamin A concentration was 11-100% below the label claim in 41% of the products tested (9/22) and exceeded the label claim in 32% (7/22) of products with overages of 18-44%. High consumption of the product with the maximum vitamin A overage would result in an intake of up to 27% of the upper level of intake (UL). Vitamin D concentration was 47-68% below the label claim in 28% of the products tested (5/18) and exceeded the label claim in 39% (7/18) of products with overages of 25-70%. High consumption of the product with the maximum vitamin D overage would result in an intake of up to 4% of the UL. Calcium concentration was 7-18% below the label claim in 11% of the products tested (2/18) and exceeded the label claim 39% (7/18) of products with overages of 26-79%. High consumption of the product with the maximum calcium overage would result in an intake of up to 77% of the RDI or 8% of the UL A total of 27% (16/58) of the foods sampled contained less fortificant than claimed, based on the criteria applied in this assessment. Consumers of these products are ingesting less of the added nutrients than they would believe, based on label claims. A total of 36% (21/58) of the foods sampled contained more fortificant than claimed. None of the selected foods fortified with either vitamin A, vitamin D or calcium appear to present a realistic hazard of a consumer exceeding the UL of any of these nutrients. All analytical measurements have associated uncertainty arising from sampling, the analytical method and the manufacturing technique. For standard setting, consideration may be given to defining a range around the label claim that takes measurement uncertainty into account.
ESR Report on Fortification overages iii Prepared for the NZFSA, June 2006
1 INTRODUCTION Work is currently being conducted on the development of food standards relating to nutrient fortification. The establishment of safe upper limits for nutrients added to foods relies on robust data on current intake, based on consumption data and concentration information for the foods of interest. While there is sufficient data on the composition of unfortified foods, there is limited independent data on the actual levels of fortificants in fortified foods in New Zealand. The Manufactured Foods Database (MFD) is a compilation of food ingredient and composition data voluntarily provided by New Zealand food manufacturers and compiled by Nutrition Services, Auckland Hospital, under contract to the New Zealand Food Safety Authority (NZFSA). The MFD includes data on fortificants which are derived from either measured amounts or calculated from recipes by manufacturers (Nutrition Services, 2004). International evidence suggests that actual levels of fortificants can vary significantly, by up to 320% of the claimed label value (Whittaker et al., 2001), consistent with overages of up to 166% for iron and 296% for folate reported for New Zealand foods (Thomson, 2005). There is also a potential public health and safety issue associated with over-consumption of some nutrients and interactions between nutrients if levels are too high. For this reason, Recommended Dietary Intakes (RDI)s and Upper Levels of Intake (UL)s have been estimated for New Zealand and Australia, for a range of nutrients including vitamin A, vitamin D and calcium (AG/MoH, 2006). Details for vitamin A, vitamin D and calcium RDIs and ULs are provided in Appendix 1. Vitamin A is a fat soluble vitamin important for embryonic development and to help maintain normal reproductive, vision and immune function. Excess intake of vitamin A has resulted in disturbed fetal growth and development for women of childbearing age and liver abnormalities for other adults, leading to the derivation of ULs for these population groups (Appendix 1). For infants, the UL is derived from reports of dietary excess of vitamin A. A lack of data means that the UL for children and adolescents is extrapolated from adult data with allowance made for relative body weights. Those individuals with a high alcohol intake, pre-existing liver disease, high blood lipid levels or severe protein malnutrition are at risk to excess intake of vitamin A and may not be protected by the UL for the general population (AG/MoH, 2006). Vitamin D naturally occurs in two forms. Vitamin D3 is produced by the action of sunlight on skin and vitamin D2 is found in a limited range of foods. The major function of vitamin D in humans is to maintain appropriate serum calcium concentrations by enhancing the ability of the small intestine to absorb calcium from the diet. The UL for vitamin D for adults is based on an absence of adverse effect at doses of 100 μg/day (Vieth et al.,2001) and an uncertainty factor of 1.2 because of inconsistencies between studies. For infants, the UL is derived from a no observable adverse effect (NOAEL) of 45 μg/day (Fomon et al., 1966, Jeans and Stearns, 1938) together with an uncertainty factor of 1.8. In the absence of available data, ULs for children and adolescents are the same as for adults. Calcium is essential for the normal development and maintenance of the skeleton and the proper functioning of neuromuscular and cardiac systems. Toxic effects of calcium have only been seen when high doses of calcium carbonate have been taken as an antacid, resulting in renal calcification and renal failure (Burnett et al.,1949). The UL for adults is
ESR Report on Fortification overages 1 Prepared for the NZFSA, June 2006
derived from a lowest observed adverse effect level (LOAEL) of 5 g/day and an uncertainty factor of 2. The uncertainty takes into account the relatively common occurrence of kidney stones in Australia and New Zealand, the fact that hypercalciuria has been shown to occur at intakes as low as 1.7 g/day and concern that calcium will interfere with absorption of other minerals such as zinc and iron in vulnerable populations (AG/MoH, 2006). There are an increasing number of fortified foods available on the New Zealand market. An analysis of actual levels of nutrients being added to these fortified foods is essential for undertaking a robust risk assessment of the consequences of nutrient additions to foods, both mandatory and voluntary, and will feed directly into the food standard setting process. The aim of the current project was to measure the actual levels of the fortificants vitamin A, vitamin D and calcium added to fortified foods and to compare actual levels with levels claimed on product labels.
ESR Report on Fortification overages 2 Prepared for the NZFSA, June 2006
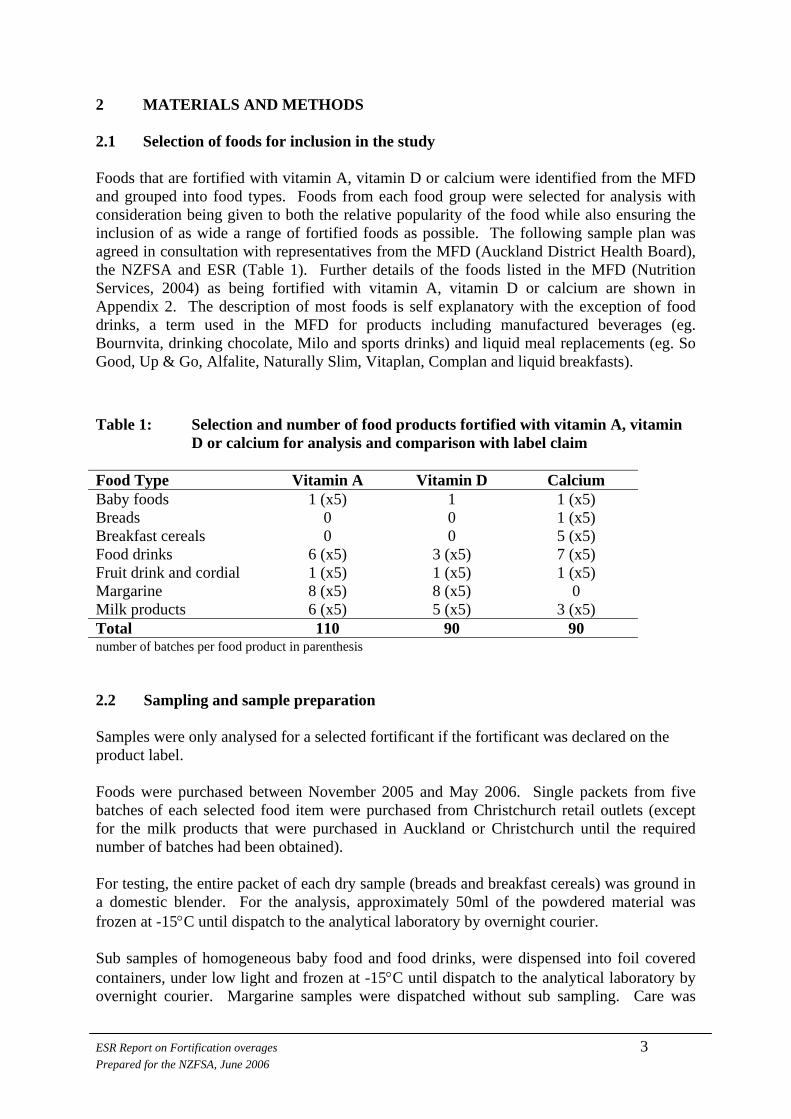
2 MATERIALS AND METHODS 2.1 Selection of foods for inclusion in the study Foods that are fortified with vitamin A, vitamin D or calcium were identified from the MFD and grouped into food types. Foods from each food group were selected for analysis with consideration being given to both the relative popularity of the food while also ensuring the inclusion of as wide a range of fortified foods as possible. The following sample plan was agreed in consultation with representatives from the MFD (Auckland District Health Board), the NZFSA and ESR (Table 1). Further details of the foods listed in the MFD (Nutrition Services, 2004) as being fortified with vitamin A, vitamin D or calcium are shown in Appendix 2. The description of most foods is self explanatory with the exception of food drinks, a term used in the MFD for products including manufactured beverages (eg. Bournvita, drinking chocolate, Milo and sports drinks) and liquid meal replacements (eg. So Good, Up & Go, Alfalite, Naturally Slim, Vitaplan, Complan and liquid breakfasts).
Table 1: Selection and number of food products fortified with vitamin A, vitamin D or calcium for analysis and comparison with label claim
Food Type Vitamin A Vitamin D Calcium Baby foods 1 (x5) 1 1 (x5) Breads 0 0 1 (x5) Breakfast cereals 0 0 5 (x5) Food drinks 6 (x5) 3 (x5) 7 (x5) Fruit drink and cordial 1 (x5) 1 (x5) 1 (x5) Margarine 8 (x5) 8 (x5) 0 Milk products 6 (x5) 5 (x5) 3 (x5) Total 110 90 90 number of batches per food product in parenthesis 2.2 Sampling and sample preparation Samples were only analysed for a selected fortificant if the fortificant was declared on the product label. Foods were purchased between November 2005 and May 2006. Single packets from five batches of each selected food item were purchased from Christchurch retail outlets (except for the milk products that were purchased in Auckland or Christchurch until the required number of batches had been obtained). For testing, the entire packet of each dry sample (breads and breakfast cereals) was ground in a domestic blender. For the analysis, approximately 50ml of the powdered material was frozen at -15°C until dispatch to the analytical laboratory by overnight courier. Sub samples of homogeneous baby food and food drinks, were dispensed into foil covered containers, under low light and frozen at -15°C until dispatch to the analytical laboratory by overnight courier. Margarine samples were dispatched without sub sampling. Care was
ESR Report on Fortification overages 3 Prepared for the NZFSA, June 2006
taken to ensure milk products remained sealed until analysis. Samples of baby food and fruit cordials were analysed without dilution. 2.3 Sample preparation and shelf life studies of vitamin A The following study of vitamin A in milk products was undertaken when preliminary results showed consistently low levels of vitamin A in frozen sub samples compared with product claims. Triplicate samples of three batches of a flavoured milk were purchased and stored in a refrigerator. One unopened sample from each batch was analysed in duplicate, at three different time periods across the shelf life of the product (13 days). One opened sample was reanalysed on the “use by” date after seven days of refrigeration. 2.4 Laboratory analytical methods 2.4.1 Vitamin A analysis The analysis of total pre-formed vitamin A, including cis- and –trans isomers, was based on the methodology of Brubacher et al., (1986) with in-house modifications. Homogenised samples were saponified under reflux, extracted into organic solvent and concentrated by evaporation. Quantitation was achieved with isocratic, reversed phase high performance liquid chromatography (HPLC) using fluorescence detection and external calibration. The analyses were undertaken by AgriQuality Laboratory Services, Auckland who are accredited by International Accreditation New Zealand (IANZ) for both vitamin A and vitamin D analyses. 2.4.2 Vitamin D analysis AgriQuality Laboratory Services, Auckland, measured the sum of vitamin D pre-cursors and vitamin D3, in the selected food samples, using published methodology (Indyk and Woollard, 1985, Brubacher et al., 1986). In summary, samples were saponified in ethanolic potassium hydroxide, extracted, and purified of interfering substances by semi-preparative HPLC on a silica column with ergocalciferol (vitamin D2) as an internal standard and measured by isocratic, reversed-phase HPLC. 2.4.3 Calcium analysis A minimum of 250 g of each product was homogenized in a domestic blender. Duplicate 50 ml portions were frozen until analysis. An aliquot of sample was ashed in a muffle furnace at 500ºC, the residue dissolved in concentrated nitric acid, with caesium chloride as an ionization suppressant. Calcium was determined by atomic emission spectroscopy by the ESR Christchurch Science Centre Food Chemistry Laboratory. The laboratory is accredited by IANZ to the standard NZS/ISO/IEC/17025, under section 2.71/5 for this analysis. 2.4.4 Quality control procedures The following quality assurance procedures were undertaken to ensure robust results:
• The analytical repeatability, in terms of coefficient of variation (CV) was determined for vitamin A, vitamin D and calcium by undertaking five analyses of each of three
ESR Report on Fortification overages 4 Prepared for the NZFSA, June 2006

samples representing different food matrices. A coefficient of variation (CV = standard deviation of results divided by mean x 100%) of less than 10% is considered good but higher values may be more realistic for some matrices, analyte and concentration combinations (Vannoort, personal communication, 2005). The repeatability for vitamin A ranged from 2 to 12%, 5 to 12% for vitamin D and 1 to 4% for calcium (Appendix 3.1 to 3.3).
• Recovery compares the amount of the analyte (eg. vitamin A, vitamin D or calcium), measured in a sample to which a known amount has been added and corrected for the amount of analyte in the unspiked sample, with the amount of analyte added in the spike. Acceptable recoveries for nutrient analyses would generally be 70-125% (Vannoort, personal communication, 2005). The recoveries of vitamin A, vitamin D and calcium from spiked samples were acceptable, ranging from 78-120%, 76-124% and 88-121% respectively, confirming the accuracy of the analytical method (Appendix 3.4).
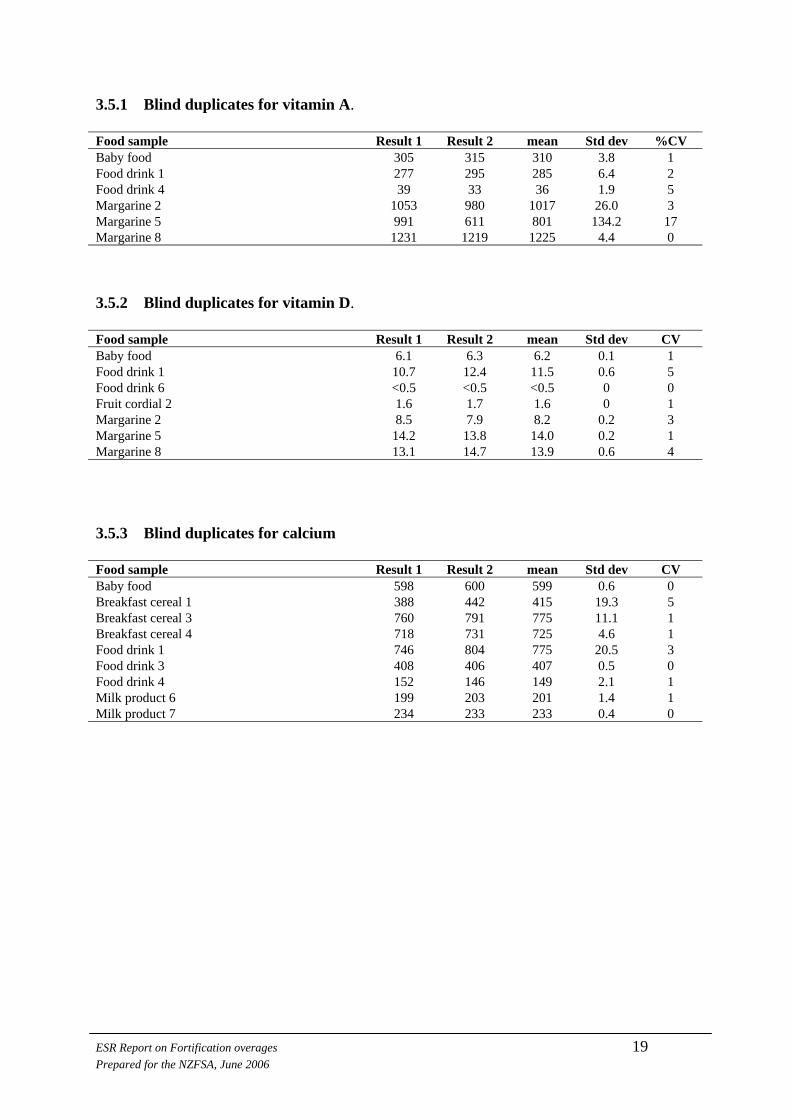
• Blind duplicates of different food types were submitted for analysis. The CVs for vitamin D and calcium were within 5% (Appendix 3.5.2 and 3.5.3). Greater variability (CV-17%) was repeatedly observed for vitamin A in one margarine sample reflecting the analytical challenge of this particular sample of this food type (Appendix 3.5.1).
2.5 Derivation of ranges for overage or underage assessment No analytical result is exact, but the result will always have an associated degree of uncertainty indicating the “±” range from the measured result within which the true result will lie. It is important to quantify the measurement uncertainty so that a range can be defined, for which there is a known probability that a measured result will occur, as a basis for comparing the measured concentration of a fortificant with a label claim. Uncertainty for the current samples is due to:
1 Intra-sample variability, or repeatability - a measure of the variation in results for multiple analyses of the same sample. This is a measure of variability resulting from the analytical method and sub-sampling procedures.
2 Inter-sample variability – a measure of the variability between different batches of the same product. This includes the variability of both the analytical method and the manufacturing technique. The homogeneity of a product depends on when and how the fortificant is added and may differ for different products. Lack of homogeneity is one source of both intra- and inter-sample variability.
A 95% uncertainty range of the mean was determined for each product sampled, using the standard deviation derived from the analysis of five different batches of each product and the formula (TELARC, 1987):
Range (confidence limits) = mean ± t x standard deviation √n
where: “t” = a statistical factor found in statistical tables n = number of sample replicates (5)
ESR Report on Fortification overages 5 Prepared for the NZFSA, June 2006
For a mean concentration falling within this range, there is a 95% probability that the true result lies within a range of the mean ± 1.2 (2.78/√5) x standard deviation of the measured concentration. It follows then that for a product where the label claim was outside this range, the level of confidence that the sample does not meet the label claim is approximately 95%. Samples were assessed as complying with the label claim if the label claim was within the 95% uncertainty range and defined as non-complying if the label claim was outside this range.
ESR Report on Fortification overages 6 Prepared for the NZFSA, June 2006
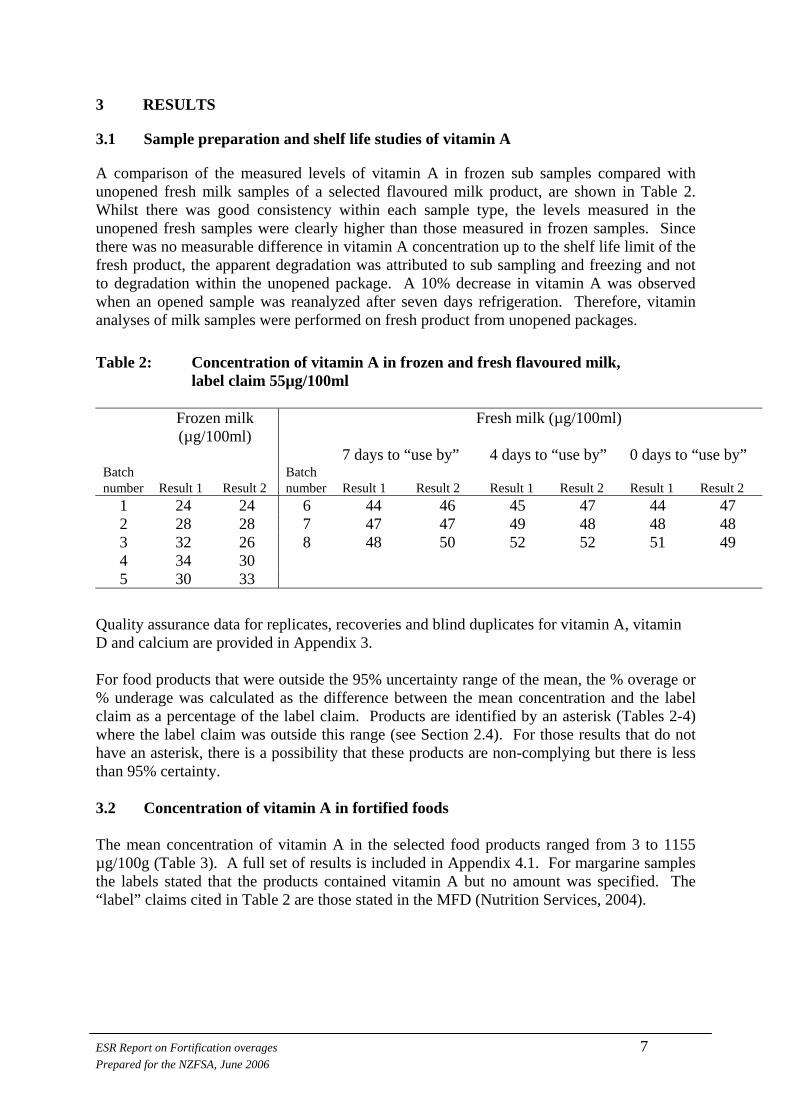
3 RESULTS 3.1 Sample preparation and shelf life studies of vitamin A A comparison of the measured levels of vitamin A in frozen sub samples compared with unopened fresh milk samples of a selected flavoured milk product, are shown in Table 2. Whilst there was good consistency within each sample type, the levels measured in the unopened fresh samples were clearly higher than those measured in frozen samples. Since there was no measurable difference in vitamin A concentration up to the shelf life limit of the fresh product, the apparent degradation was attributed to sub sampling and freezing and not to degradation within the unopened package. A 10% decrease in vitamin A was observed when an opened sample was reanalyzed after seven days refrigeration. Therefore, vitamin analyses of milk samples were performed on fresh product from unopened packages.
Table 2: Concentration of vitamin A in frozen and fresh flavoured milk, label claim 55µg/100ml Frozen milk
(µg/100ml) Fresh milk (µg/100ml)
7 days to “use by” 4 days to “use by” 0 days to “use by” Batch number
Result 1
Result 2
Batch number
Result 1
Result 2
Result 1
Result 2
Result 1
Result 2
1 24 24 6 44 46 45 47 44 47 2 28 28 7 47 47 49 48 48 48 3 32 26 8 48 50 52 52 51 49 4 34 30 5 30 33
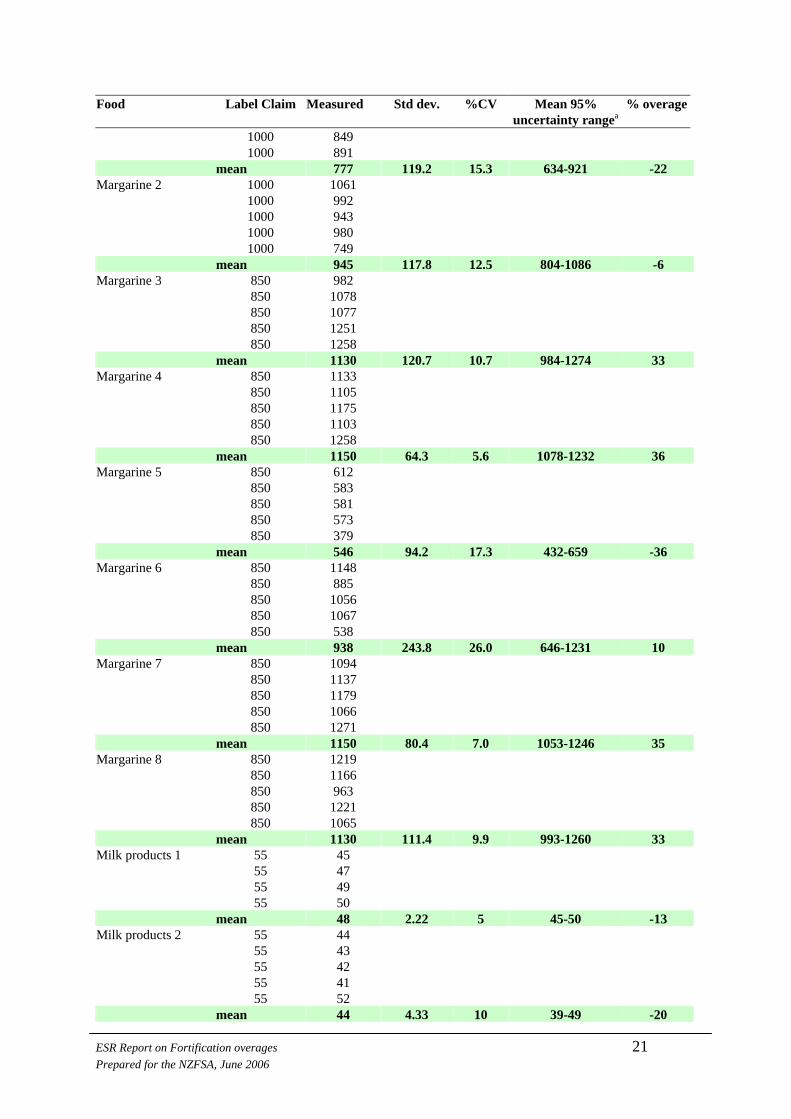
Quality assurance data for replicates, recoveries and blind duplicates for vitamin A, vitamin D and calcium are provided in Appendix 3. For food products that were outside the 95% uncertainty range of the mean, the % overage or % underage was calculated as the difference between the mean concentration and the label claim as a percentage of the label claim. Products are identified by an asterisk (Tables 2-4) where the label claim was outside this range (see Section 2.4). For those results that do not have an asterisk, there is a possibility that these products are non-complying but there is less than 95% certainty. 3.2 Concentration of vitamin A in fortified foods The mean concentration of vitamin A in the selected food products ranged from 3 to 1155 µg/100g (Table 3). A full set of results is included in Appendix 4.1. For margarine samples the labels stated that the products contained vitamin A but no amount was specified. The “label” claims cited in Table 2 are those stated in the MFD (Nutrition Services, 2004).
ESR Report on Fortification overages 7 Prepared for the NZFSA, June 2006
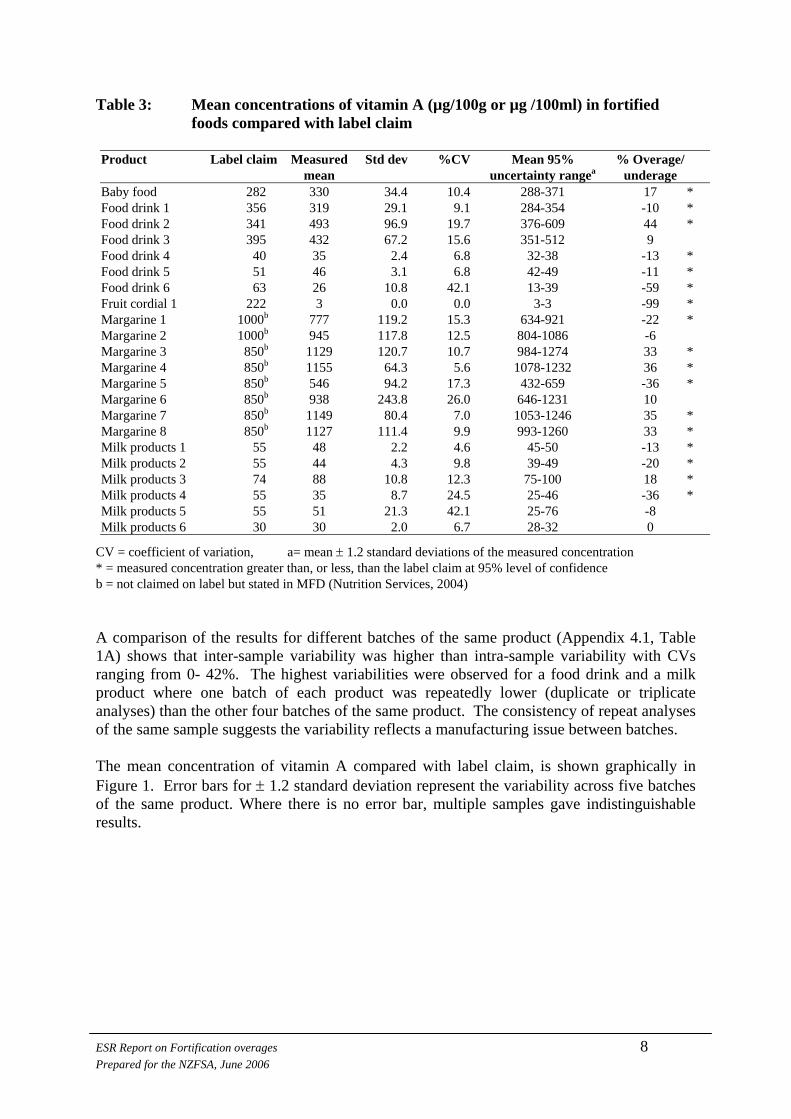
Table 3: Mean concentrations of vitamin A (µg/100g or µg /100ml) in fortified foods compared with label claim
Measured Std dev %CV Mean 95% % Overage/ Product Label claim
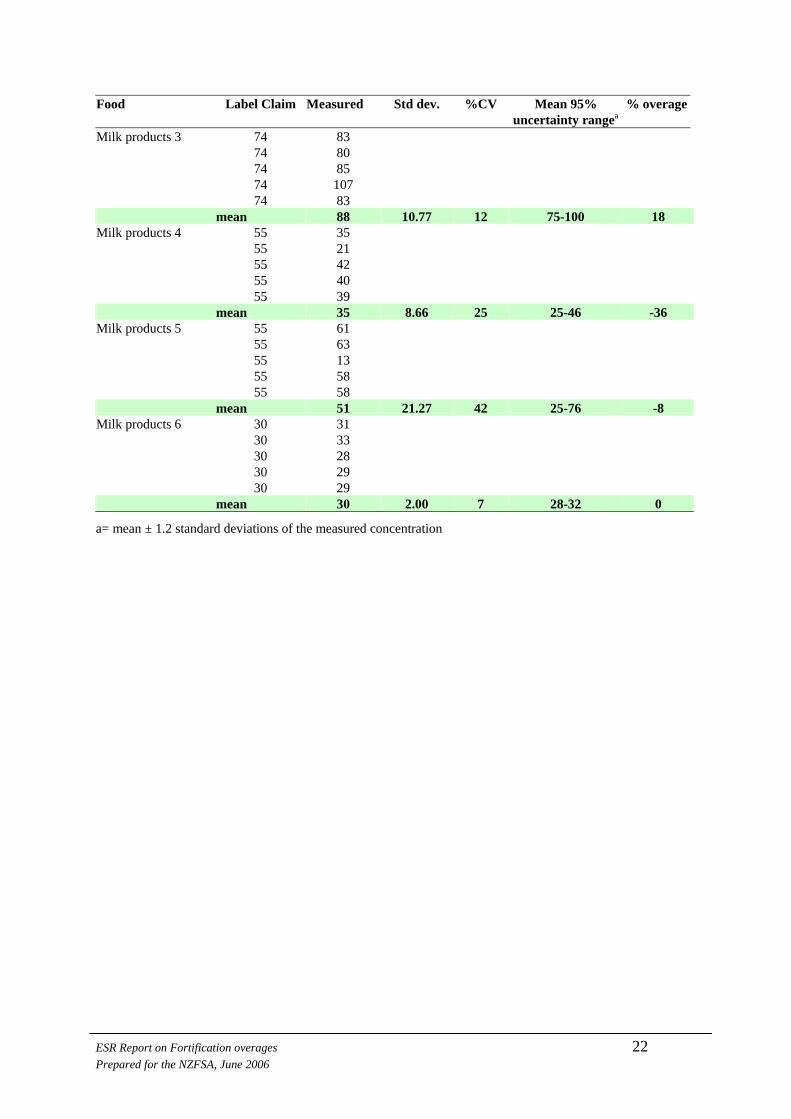
mean uncertainty rangea underage Baby food 282 330 34.4 10.4 288-371 17 * Food drink 1 356 319 29.1 9.1 284-354 -10 * Food drink 2 341 493 96.9 19.7 376-609 44 * Food drink 3 395 432 67.2 15.6 351-512 9 Food drink 4 40 35 2.4 6.8 32-38 -13 * Food drink 5 51 46 3.1 6.8 42-49 -11 * Food drink 6 63 26 10.8 42.1 13-39 -59 * Fruit cordial 1 222 3 0.0 0.0 3-3 -99 * Margarine 1 1000b 777 119.2 15.3 634-921 -22 * Margarine 2 1000b 945 117.8 12.5 804-1086 -6 Margarine 3 850b 1129 120.7 10.7 984-1274 33 * Margarine 4 850b 1155 64.3 5.6 1078-1232 36 * Margarine 5 850b 546 94.2 17.3 432-659 -36 * Margarine 6 850b 938 243.8 26.0 646-1231 10 Margarine 7 850b 1149 80.4 7.0 1053-1246 35 * Margarine 8 850b 1127 111.4 9.9 993-1260 33 * Milk products 1 55 48 2.2 4.6 45-50 -13 * Milk products 2 55 44 4.3 9.8 39-49 -20 * Milk products 3 74 88 10.8 12.3 75-100 18 * Milk products 4 55 35 8.7 24.5 25-46 -36 * Milk products 5 55 51 21.3 42.1 25-76 -8 Milk products 6 30 30 2.0 6.7 28-32 0
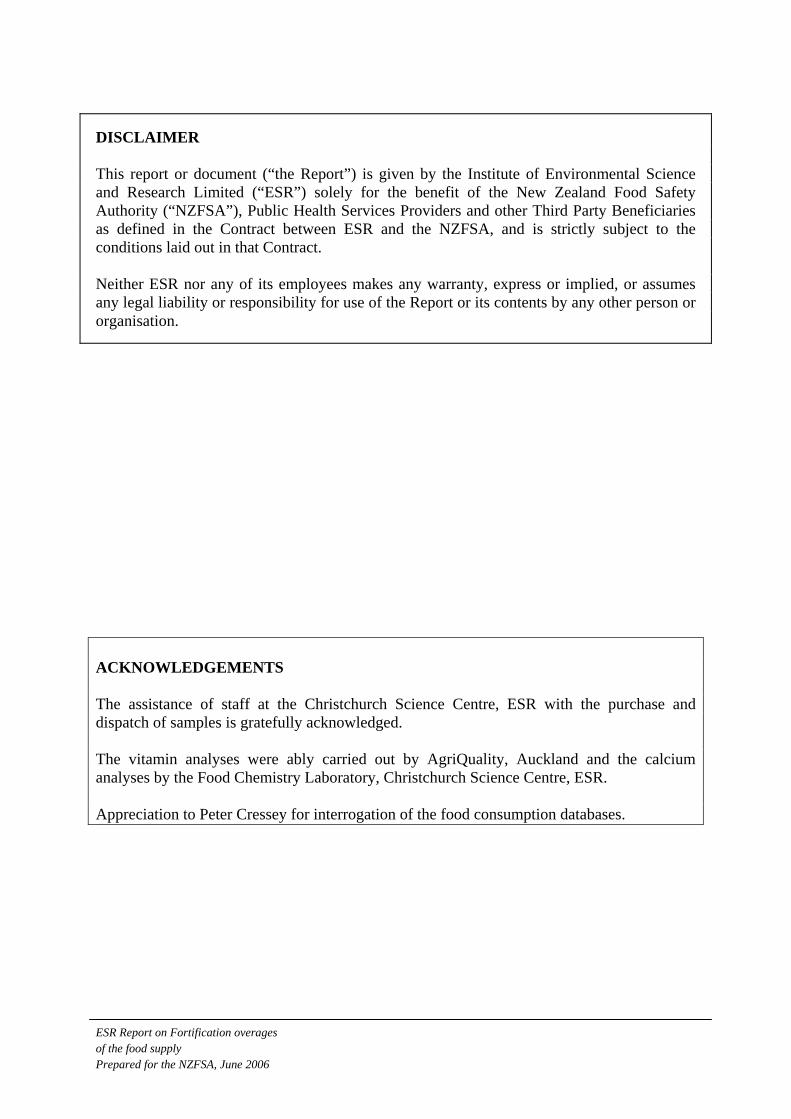
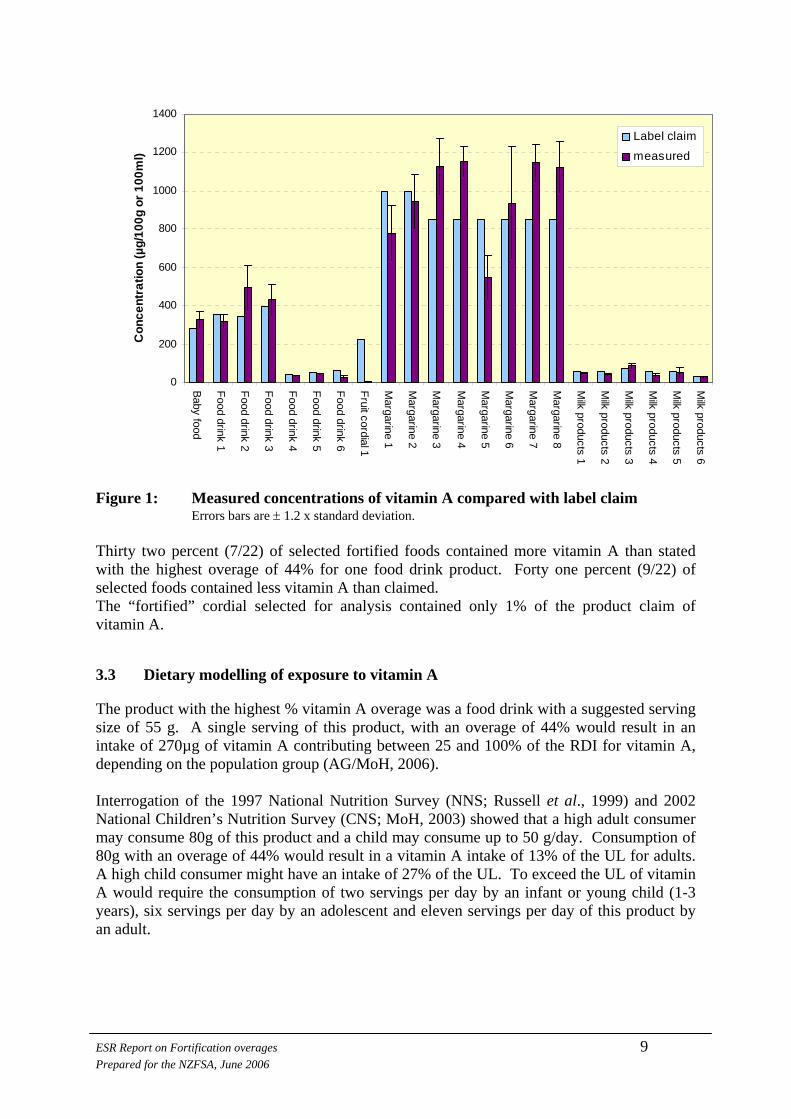
CV = coefficient of variation, a= mean ± 1.2 standard deviations of the measured concentration * = measured concentration greater than, or less, than the label claim at 95% level of confidence b = not claimed on label but stated in MFD (Nutrition Services, 2004) A comparison of the results for different batches of the same product (Appendix 4.1, Table 1A) shows that inter-sample variability was higher than intra-sample variability with CVs ranging from 0- 42%. The highest variabilities were observed for a food drink and a milk product where one batch of each product was repeatedly lower (duplicate or triplicate analyses) than the other four batches of the same product. The consistency of repeat analyses of the same sample suggests the variability reflects a manufacturing issue between batches. The mean concentration of vitamin A compared with label claim, is shown graphically in Figure 1. Error bars for ± 1.2 standard deviation represent the variability across five batches of the same product. Where there is no error bar, multiple samples gave indistinguishable results.
ESR Report on Fortification overages 8 Prepared for the NZFSA, June 2006
0
200
400
600
800
1000
1200
1400
Baby food
Food drink 1
Food drink 2
Food drink 3
Food drink 4
Food drink 5
Food drink 6
Fruit cordial 1
Margarine 1
Margarine 2
Margarine 3
Margarine 4
Margarine 5
Margarine 6
Margarine 7
Margarine 8
Milk products 1
Milk products 2
Milk products 3
Milk products 4
Milk products 5
Milk products 6
Con
cent
ratio
n (µ
g/10
0g o
r 100
ml)
Label claim
measured
Figure 1: Measured concentrations of vitamin A compared with label claim Errors bars are ± 1.2 x standard deviation.
Thirty two percent (7/22) of selected fortified foods contained more vitamin A than stated with the highest overage of 44% for one food drink product. Forty one percent (9/22) of selected foods contained less vitamin A than claimed. The “fortified” cordial selected for analysis contained only 1% of the product claim of vitamin A. 3.3 Dietary modelling of exposure to vitamin A The product with the highest % vitamin A overage was a food drink with a suggested serving size of 55 g. A single serving of this product, with an overage of 44% would result in an intake of 270µg of vitamin A contributing between 25 and 100% of the RDI for vitamin A, depending on the population group (AG/MoH, 2006). Interrogation of the 1997 National Nutrition Survey (NNS; Russell et al., 1999) and 2002 National Children’s Nutrition Survey (CNS; MoH, 2003) showed that a high adult consumer may consume 80g of this product and a child may consume up to 50 g/day. Consumption of 80g with an overage of 44% would result in a vitamin A intake of 13% of the UL for adults. A high child consumer might have an intake of 27% of the UL. To exceed the UL of vitamin A would require the consumption of two servings per day by an infant or young child (1-3 years), six servings per day by an adolescent and eleven servings per day of this product by an adult.
ESR Report on Fortification overages 9 Prepared for the NZFSA, June 2006
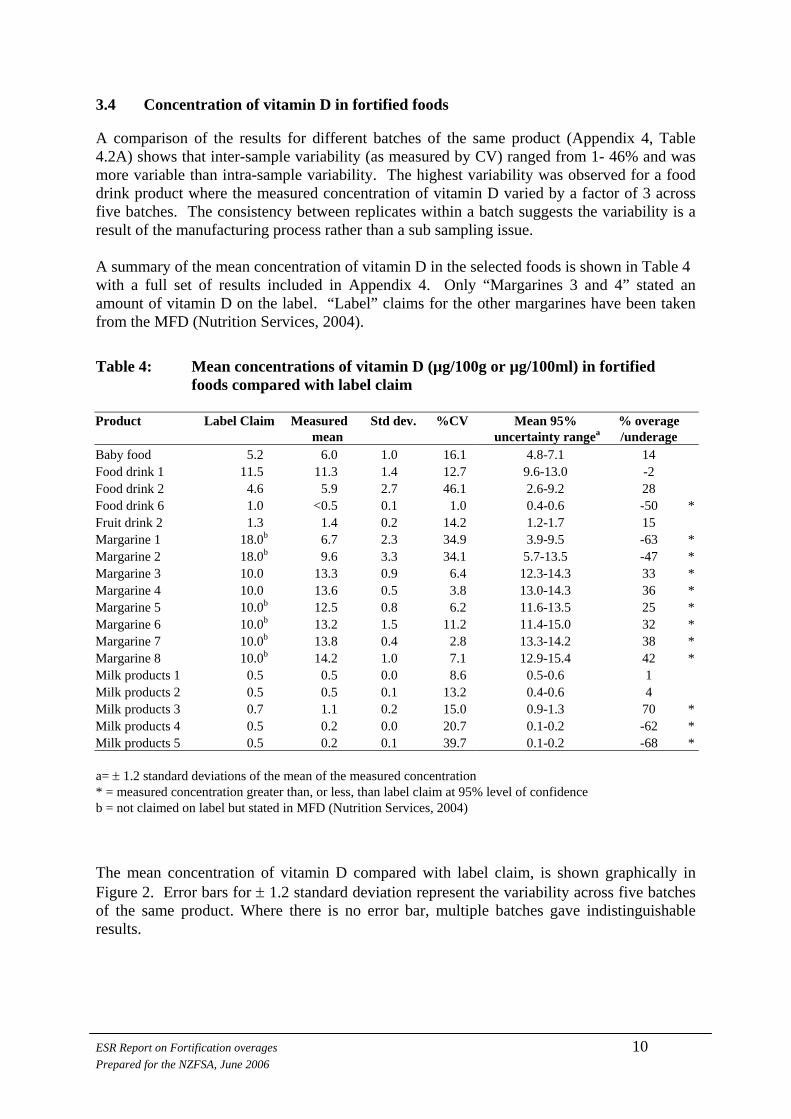
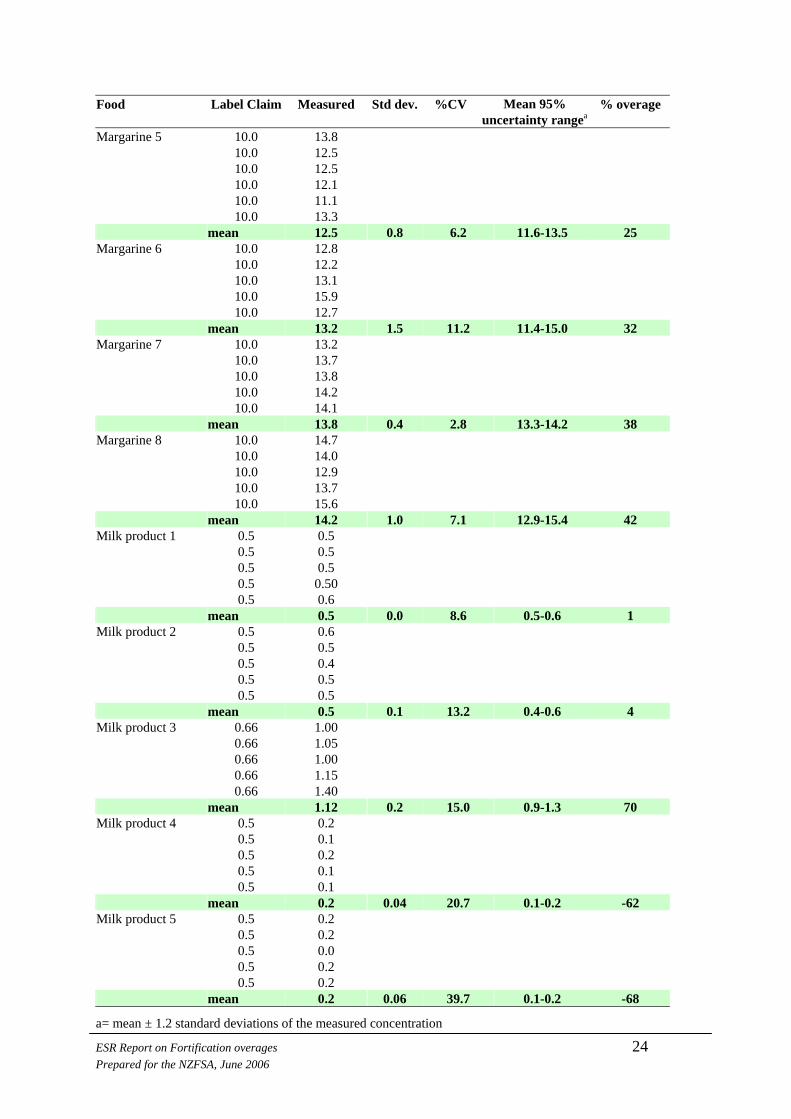
3.4 Concentration of vitamin D in fortified foods A comparison of the results for different batches of the same product (Appendix 4, Table 4.2A) shows that inter-sample variability (as measured by CV) ranged from 1- 46% and was more variable than intra-sample variability. The highest variability was observed for a food drink product where the measured concentration of vitamin D varied by a factor of 3 across five batches. The consistency between replicates within a batch suggests the variability is a result of the manufacturing process rather than a sub sampling issue. A summary of the mean concentration of vitamin D in the selected foods is shown in Table 4 with a full set of results included in Appendix 4. Only “Margarines 3 and 4” stated an amount of vitamin D on the label. “Label” claims for the other margarines have been taken from the MFD (Nutrition Services, 2004).
Table 4: Mean concentrations of vitamin D (µg/100g or µg/100ml) in fortified foods compared with label claim
Product
Label Claim
Measured mean
Std dev.
%CV
Mean 95% uncertainty rangea
% overage /underage
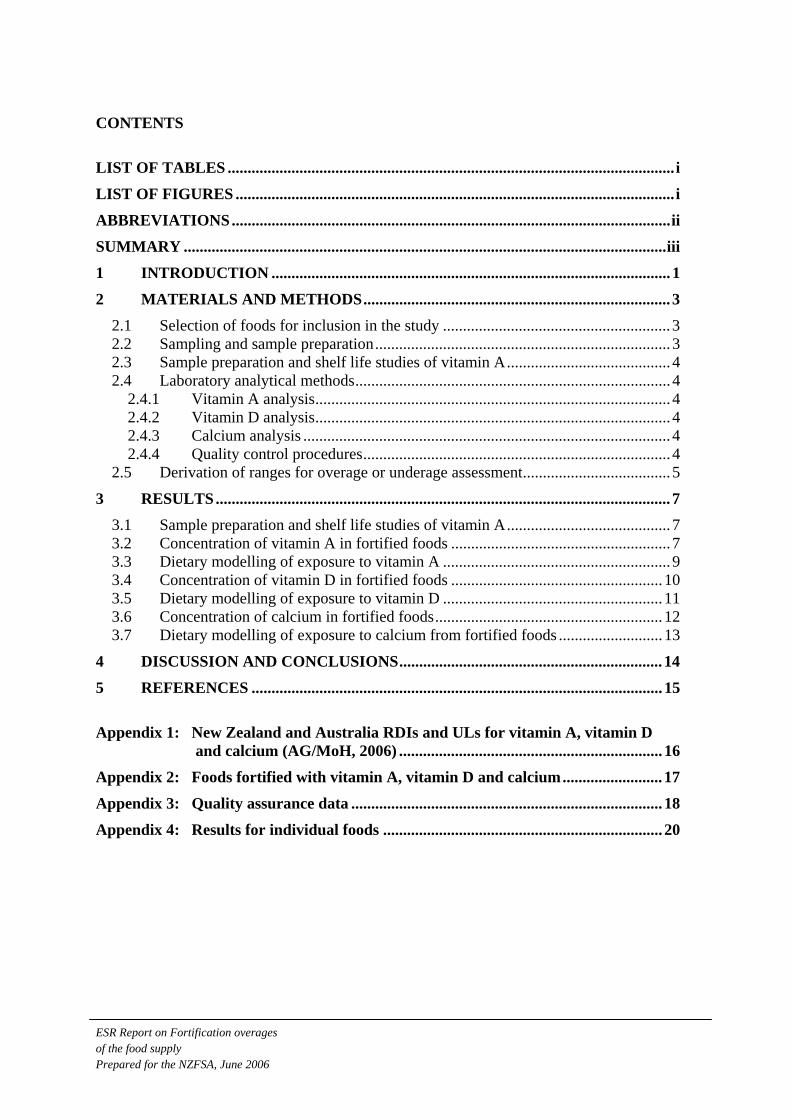
Baby food 5.2 6.0 1.0 16.1 4.8-7.1 14 Food drink 1 11.5 11.3 1.4 12.7 9.6-13.0 -2 Food drink 2 4.6 5.9 2.7 46.1 2.6-9.2 28 Food drink 6 1.0 <0.5 0.1 1.0 0.4-0.6 -50 *Fruit drink 2 1.3 1.4 0.2 14.2 1.2-1.7 15 Margarine 1 18.0b 6.7 2.3 34.9 3.9-9.5 -63 *Margarine 2 18.0b 9.6 3.3 34.1 5.7-13.5 -47 *Margarine 3 10.0 13.3 0.9 6.4 12.3-14.3 33 *Margarine 4 10.0 13.6 0.5 3.8 13.0-14.3 36 *Margarine 5 10.0b 12.5 0.8 6.2 11.6-13.5 25 *Margarine 6 10.0b 13.2 1.5 11.2 11.4-15.0 32 *Margarine 7 10.0b 13.8 0.4 2.8 13.3-14.2 38 *Margarine 8 10.0b 14.2 1.0 7.1 12.9-15.4 42 *Milk products 1 0.5 0.5 0.0 8.6 0.5-0.6 1 Milk products 2 0.5 0.5 0.1 13.2 0.4-0.6 4 Milk products 3 0.7 1.1 0.2 15.0 0.9-1.3 70 *Milk products 4 0.5 0.2 0.0 20.7 0.1-0.2 -62 *Milk products 5 0.5 0.2 0.1 39.7 0.1-0.2 -68 * a= ± 1.2 standard deviations of the mean of the measured concentration * = measured concentration greater than, or less, than label claim at 95% level of confidence b = not claimed on label but stated in MFD (Nutrition Services, 2004) The mean concentration of vitamin D compared with label claim, is shown graphically in Figure 2. Error bars for ± 1.2 standard deviation represent the variability across five batches of the same product. Where there is no error bar, multiple batches gave indistinguishable results.
ESR Report on Fortification overages 10 Prepared for the NZFSA, June 2006

0.0
2.0
4.0
6.0
8.0
10.0
12.0
14.0
16.0
18.0
20.0
Baby food
Food drink 1
Food drink 2
Food drink 6
Fruit drink 2
Margarine 1
Margarine 2
Margarine 3
Margarine 4
Margarine 5
Margarine 6
Margarine 7
Margarine 8
Milk products 1
Milk products 2
Milk products 3
Milk products 4
Milk products 5
Con
cent
ratio
n (µ
g/10
0g o
r 100
ml)
Label Claim
measured
Figure 2: Measured concentrations of vitamin D compared with label claim Errors bars are ± 1.2 x standard deviation.
Thirty nine percent (7/18) of selected fortified foods contained more vitamin D than stated with the highest overage of 70% for one milk product. Twenty eight percent (5/18) of the selected foods contained 47-68% less vitamin D than claimed. Of these, the two margarine samples, did not claim an amount on the label, although vitamin D was included in the list of ingredients
3.5 Dietary modelling of exposure to vitamin D The maximum vitamin D overage was found in a milk product with an overage of 70%. Consumption of a single 125g serving of this product would result in an intake of 1.4 µg of vitamin D, equal to the maximum permitted contribution of 1.6 µg per 150g (FSANZ, 2002). An intake of 1.4 µg equates to 9-28% of the RDI depending on the age of the consumer. Interrogation of the NNS and CNS (Russell et al., 1999, MoH, 2003) shows that a high consumer may consume 300 g of this product in which case intake of vitamin D would be 3.3 µg per day, well within the UL of 80µg/day (AG/MoH, 2006).
ESR Report on Fortification overages 11 Prepared for the NZFSA, June 2006

3.6 Concentration of calcium in fortified foods Inter-sample variability as measured by CV ranged from 2-47% for different batches of the same product (Appendix 4, Table 4.3A). The highest variability was observed for a food drink product. The consistency between replicates within a batch suggests the variability may be a result of the manufacturing process rather than a sub sampling issue. The mean concentration of calcium in the selected foods ranged from 114 to 842 mg/100g (Table 5). A full set of results is included in Appendix 4.
Table 5: Mean concentrations of calcium (mg/100g or mg/100ml) in fortified foods compared with label claim
Label Claim Measured Std dev. %CV Mean 95% % Overage/ Product uncertainty rangea underage
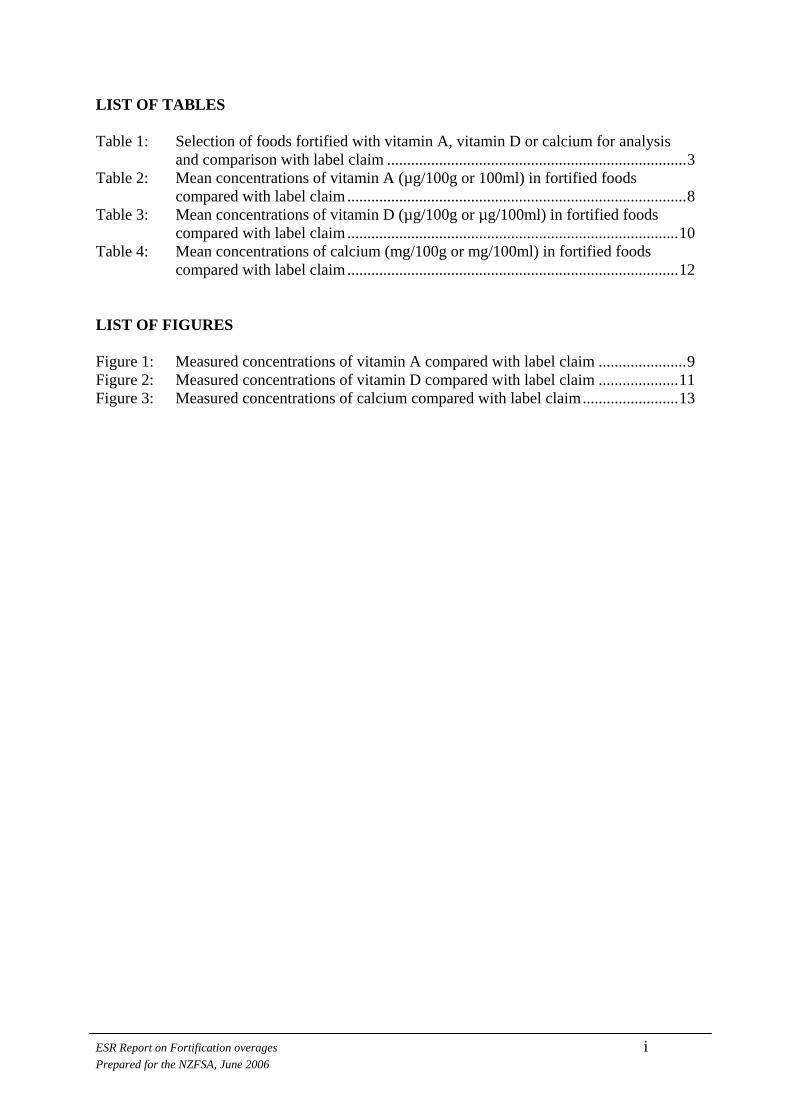
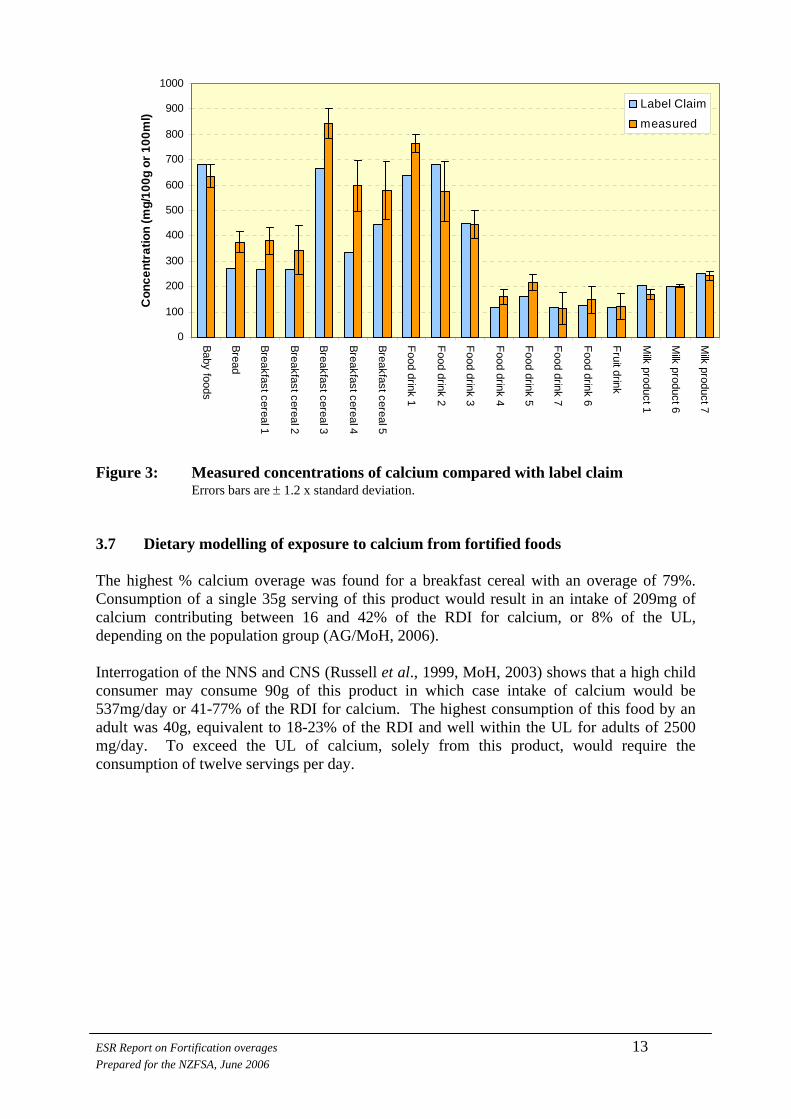
Baby foods 681 634 38.0 6.0 589-680 -7 * Bread 271 376 34.6 9.2 334-417 39 * Breakfast cereal 1 267 381 43.7 11.5 328-433 43 * Breakfast cereal 2 267 344 80.6 23.4 247-441 29 Breakfast cereal 3 667 842 49.0 5.8 783-901 26 * Breakfast cereal 4 333 597 84.0 14.1 496-698 79 * Breakfast cereal 5 444 579 94.1 16.3 466-691 30 * Food drink 1 639 763 29.4 3.9 727-798 19 * Food drink 2 683 576 97.9 17.0 459-694 -16 Food drink 3 450 443 46.0 10.4 388-498 -2 Food drink 4 120 160 24.1 15.0 131-189 34 * Food drink 5 160 217 27.4 12.6 184-250 35 Food drink 7 120 114 53.1 46.7 50-177 -5 Food drink 6 125 148 44.7 30.1 95-202 19 Fruit drink 120 121 42.9 35.5 69-172 1 Milk product 1 205 169 16.3 9.6 150-189 -18 * Milk product 6 200 202 4.6 2.3 196-207 1 Milk product 7 253 242 14.9 6.2 224-260 -4 a= ± 1.2 standard deviations of the mean of the measured concentration * = measured concentration greater than, or less, than label claim at 95% level of confidence Thirty nine percent (7/18) of selected fortified foods contained more calcium than stated with the highest overage of 79% for one breakfast cereal product. Eleven percent (2/18) of the selected foods contained 7-18% less calcium than claimed. The mean concentration of calcium compared with label claim, is shown graphically in Figure 3. Error bars for ± 1.2 standard deviation represent the variability between the five samples of each product tested.
ESR Report on Fortification overages 12 Prepared for the NZFSA, June 2006
0
100
200
300
400
500
600
700
800
900
Baby foods
Bread
Breakfast cereal 1
Breakfast cereal 2
Breakfast cereal 3
Breakfast cereal 4
Breakfast cereal 5
Food drink 1
Food drink 2
Food drink 3
Food drink 4
Food drink 5
Food drink 7
Food drink 6
Fruit drink
Milk product 1
Milk product 6
Milk product 7
Con
cent
ratio
n (m
g/10
0g o
r 100
ml)
1000
Label Claim
measured
Figure 3: Measured concentrations of calcium compared with label claim
Errors bars are ± 1.2 x standard deviation. 3.7 Dietary modelling of exposure to calcium from fortified foods The highest % calcium overage was found for a breakfast cereal with an overage of 79%. Consumption of a single 35g serving of this product would result in an intake of 209mg of calcium contributing between 16 and 42% of the RDI for calcium, or 8% of the UL, depending on the population group (AG/MoH, 2006). Interrogation of the NNS and CNS (Russell et al., 1999, MoH, 2003) shows that a high child consumer may consume 90g of this product in which case intake of calcium would be 537mg/day or 41-77% of the RDI for calcium. The highest consumption of this food by an adult was 40g, equivalent to 18-23% of the RDI and well within the UL for adults of 2500 mg/day. To exceed the UL of calcium, solely from this product, would require the consumption of twelve servings per day.
ESR Report on Fortification overages 13 Prepared for the NZFSA, June 2006

4 DISCUSSION AND CONCLUSIONS No analytical measurement is absolute. All analytical measurements have associated uncertainty arising from sampling, the analytical method and the manufacturing technique. From this study, it is seen that realistic uncertainties for different batches of foods fortified with vitamin A, vitamin D and calcium are ± 25% CV but up to 20% of foods will have variability greater than this. Since measured concentrations in fortified foods are close to label values, the uncertainty in measured concentrations is important when assessing compliance with label claims. Therefore, consideration may be given in standard setting to defining a tolerance around the label claim that incorporates these uncertainties. For example, compliance might be the label claim ± 1 standard deviation. Alternatively, a flat tolerance of ± 50% of the label claim might be considered as adopted by the Canadian Food Inspection Agency (CFIA, 2003). Estimating a concentration range that includes the uncertainty for each product provides a transparent, science-based systematic approach to assessing whether the concentration measured in a sample meets its label claim. The magnitude of the tolerance, and hence uncertainty range, will depend on the level of confidence that is required. The % level of confidence is a measure of how likely the stated outcome is true or correct. In other words, what is the likelihood that some samples that have been found to meet the label claim in fact do not and, what is the likelihood that some samples found to comply, in fact do not. For a mean of five analyses, as in this study, the level of confidence that the true result lies within a range of the mean ± 1.2 times the CV is 95%. This means that if the concentration of a product is found to be just outside this range, there is a 5% chance that a product does in fact meet its label claim and a 95% chance that it does not. If product compliance is based on the standard deviation, a highly variable product will have a wider tolerance range and therefore will more easily comply than a consistent product with a tighter tolerance range. Thus more variability favours the manufacturer and this may not be desirable nor equitable. A total of 29% (17/58) of the foods sampled contained less fortificant than claimed, based on the criteria applied in this assessment. Consumers of these products are ingesting less of the added nutrients than they would believe, based on label claims. A total of 36% (21/58) of the foods sampled contained more fortificant than claimed. None of the selected foods fortified with either vitamin A, vitamin D or calcium appear to present a realistic hazard of a consumer exceeding the UL of any of these nutrients.
ESR Report on Fortification overages 14 Prepared for the NZFSA, June 2006

5 REFERENCES AG/MoH (Australian Government, Department of Health and Ageing, National Health and Medical Research Council/ New Zealand Ministry of Health). (2006) Nutrient reference values for Australia and New Zealand. Canberra: Commonwealth of Australia. Brubacher G, Müller-Mulot W, Southgate DAT. (1986). Methods for the determination of vitamins in food – recommended by COST 91. London: Elsevier Science Publishers, p23-32. Burnett CH, Commons RM, Albright F, Howard JE. (1949) Hypercalcaemia without hypercalcuria or hypophosphatemia, calcinosis and renal insufficiency. A syndrome following prolonged intake of milk and alkali. New England Journal of Medicine; 240:787-94. CFIA (Canadian Food Inspection Agency). (2003). Nutrition labelling compliance test. Available at http://www.inspection.gc.ca/english/fssa/labeti/nutricon/nutricone.shtml Fomon SJ, Younoszai MK, Thomas LN. (1966). Influence of vitamin D on linear growth of normal full-term infants. Journal of Nutrition; 88:345-50. FSANZ (Food Standards Australia and New Zealand). (2002) Australia and New Zealand Food Standards Code 2002. Available at www.foodstandards.gov.au Indyk H and Woollard DC. (1985) The determination of vitamin D in fortified milk powders and infant formulas by HPLC. Journal of Micronutrient Analysis;1:121-141. Jeans PC, Stearns G. (1938) The effect of vitamin D on linear growth in infancy. II The effect of intakes above 1,800 USP units daily. Journal of Pediatrics; 13:730-40. MoH (Ministry of Health). (2003) NZ Food NZ Children. Key results of the 2002 National Children’s Nutrition Survey. Wellington: Ministry of Health. Nutrition Services. (2004). Fortified foods available in New Zealand. December 2004. Wellington: Ministry of Health. Russell DG, Parnell WR, Wilson NC. (1999). NZ Food:NZ people. Key results of the 1997 National Nutrition Survey. Wellington: Ministry of Health. TELARC (Testing Laboratory Registration Council of New Zealand) (1987). Precision and limits of detection for analytical methods. Auckland, New Zealand: Testing Laboratory Registration Council of New Zealand. Thomson BM. (2005) Fortification overages of the food supply. Folate and iron. ESR Client Report FW 0536. Christchurch: ESR. Vieth R, Chan PC, MacFarlane GD. (1938). Efficacy and safety of vitamin D3 intake exceeding the lowest observed adverse effect level. American Journal of Clinical Nutrition; 73: 288-94. Whittaker P, Tufaro PR, Rader JI. (2001). Iron and folate on fortified cereals. American College of Nutrition; 20 (3):247-254. ESR Report on Fortification overages 15 Prepared for the NZFSA, June 2006

Appendix 1: New Zealand and Australia RDIs and ULs for vitamin A, vitamin D and calcium (AG/MoH, 2006)
Age/gender group Vitamin A(µg/day)a Vitamin D (µg/day) Calcium (mg/day)
RDI UL AI UL RDI UL Infants 0-6 mo. AI = 250 600 5 25 AI = 210 BM 7-12 mo. AI = 430 600 5 25 AI=270 B/F Children 1-3 yrs 300 600 5 80 500 2500 4-8 yrs 400 900 5 80 700 2500 Boys 9-13 yrs 600 1700 5 80 1000-1300 2500 14-18 yrs 900 2800 5 80 1300 2500 Girls 9-13 yrs 600 1700 5 80 1000-1300 2500 14-18 yrs 700 2800 5 80 1300 2500 Men 19-30 yrs 900 3000 5 80 1000 2500 31-50 yrs 900 3000 5 80 1000 2500 51-70 yrs 900 3000 10 80 1000 2500 >70 yrs 900 3000 15 80 1300 2500 Women 19-30 yrs 700 3000 5 80 1000 2500 31-50 yrs 700 3000 5 80 1000 2500 51-70 yrs 700 3000 10 80 1300 2500 >70 yrs 700 3000 15 80 1300 2500 Pregnant 14-18 yrs 700 2800 5 80 1300 2500 19-30 yrs 800 3000 5 80 1000 2500 31-50 yrs 800 3000 5 80 1000 2500 Lactating 14-18 yrs 1100 2800 5 80 1300 2500 19-30 yrs 1100 3000 5 80 1000 2500 31-50 yrs 1100 3000 5 80 1000 2500 a = retinol equivalents, AI = Adequate intake, BM = amount normally received from breast milk of healthy women; B/F = amount in breast milk and food
ESR Report on Fortification overages 16 Prepared for the NZFSA, June 2006
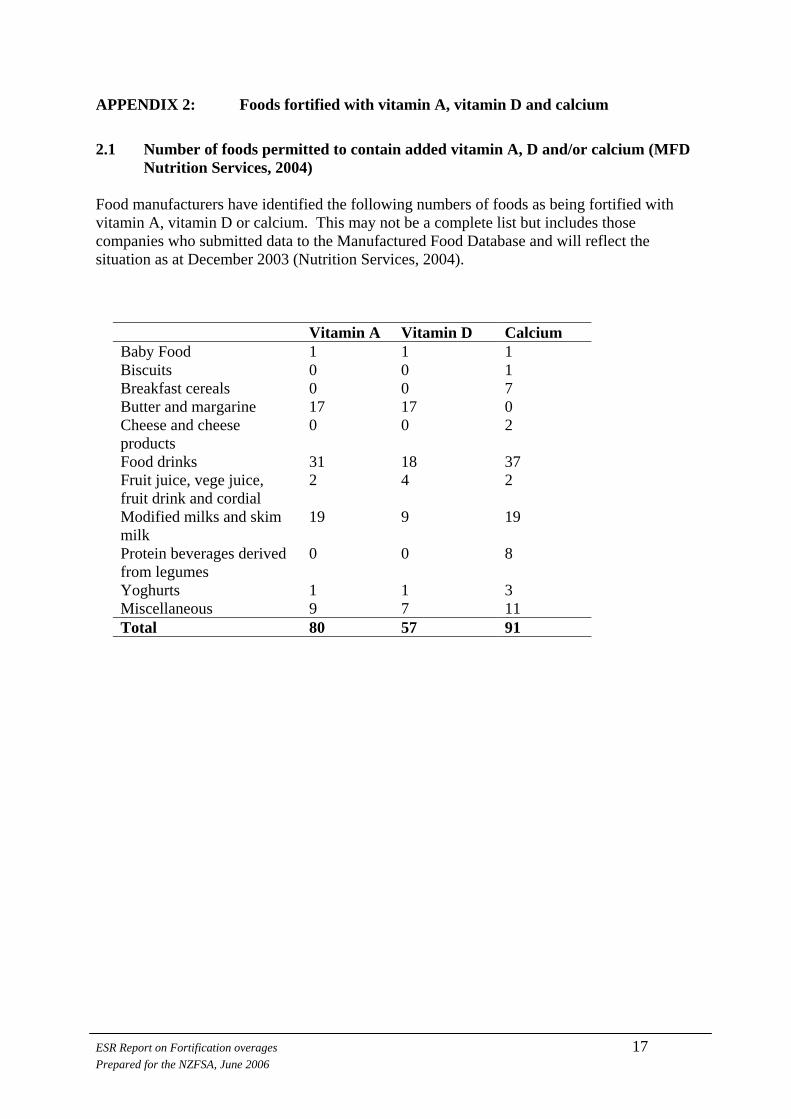
APPENDIX 2: Foods fortified with vitamin A, vitamin D and calcium
2.1 Number of foods permitted to contain added vitamin A, D and/or calcium (MFD
Nutrition Services, 2004) Food manufacturers have identified the following numbers of foods as being fortified with vitamin A, vitamin D or calcium. This may not be a complete list but includes those companies who submitted data to the Manufactured Food Database and will reflect the situation as at December 2003 (Nutrition Services, 2004).
Vitamin A Vitamin D Calcium Baby Food 1 1 1 Biscuits 0 0 1 Breakfast cereals 0 0 7 Butter and margarine 17 17 0 Cheese and cheese products
0 0 2
Food drinks 31 18 37 Fruit juice, vege juice, fruit drink and cordial
2 4 2
Modified milks and skim milk
19 9 19
Protein beverages derived from legumes
0 0 8
Yoghurts 1 1 3 Miscellaneous 9 7 11 Total 80 57 91
ESR Report on Fortification overages 17 Prepared for the NZFSA, June 2006
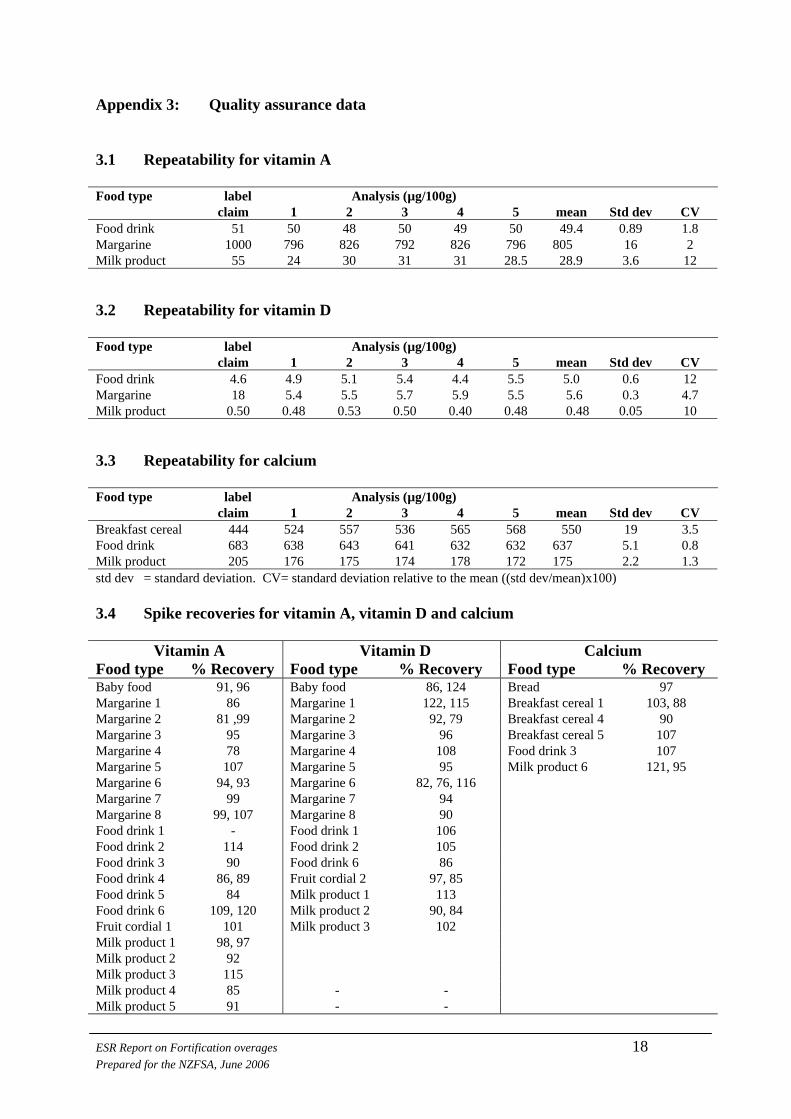
Appendix 3: Quality assurance data 3.1 Repeatability for vitamin A Food type label Analysis (µg/100g) claim 1 2 3 4 5 mean Std dev CV Food drink 51 50 48 50 49 50 49.4 0.89 1.8 Margarine 1000 796 826 792 826 796 805 16 2 Milk product 55 24 30 31 31 28.5 28.9 3.6 12 3.2 Repeatability for vitamin D Food type label Analysis (µg/100g) claim 1 2 3 4 5 mean Std dev CV Food drink 4.6 4.9 5.1 5.4 4.4 5.5 5.0 0.6 12 Margarine 18 5.4 5.5 5.7 5.9 5.5 5.6 0.3 4.7 Milk product 0.50 0.48 0.53 0.50 0.40 0.48 0.48 0.05 10 3.3 Repeatability for calcium Food type label Analysis (µg/100g) claim 1 2 3 4 5 mean Std dev CV Breakfast cereal 444 524 557 536 565 568 550 19 3.5 Food drink 683 638 643 641 632 632 637 5.1 0.8 Milk product 205 176 175 174 178 172 175 2.2 1.3 std dev = standard deviation. CV= standard deviation relative to the mean ((std dev/mean)x100) 3.4 Spike recoveries for vitamin A, vitamin D and calcium
Vitamin A Vitamin D Calcium Food type % Recovery Food type % Recovery Food type % Recovery Baby food 91, 96 Baby food 86, 124 Bread 97 Margarine 1 86 Margarine 1 122, 115 Breakfast cereal 1 103, 88 Margarine 2 81 ,99 Margarine 2 92, 79 Breakfast cereal 4 90 Margarine 3 95 Margarine 3 96 Breakfast cereal 5 107 Margarine 4 78 Margarine 4 108 Food drink 3 107 Margarine 5 107 Margarine 5 95 Milk product 6 121, 95 Margarine 6 94, 93 Margarine 6 82, 76, 116 Margarine 7 99 Margarine 7 94 Margarine 8 99, 107 Margarine 8 90 Food drink 1 - Food drink 1 106 Food drink 2 114 Food drink 2 105 Food drink 3 90 Food drink 6 86 Food drink 4 86, 89 Fruit cordial 2 97, 85 Food drink 5 84 Milk product 1 113 Food drink 6 109, 120 Milk product 2 90, 84 Fruit cordial 1 101 Milk product 3 102 Milk product 1 98, 97 Milk product 2 92 Milk product 3 115 Milk product 4 85 - - Milk product 5 91 - -
ESR Report on Fortification overages 18 Prepared for the NZFSA, June 2006
3.5.1 Blind duplicates for vitamin A. Food sample Result 1 Result 2 mean Std dev %CV Baby food 305 315 310 3.8 1 Food drink 1 277 295 285 6.4 2 Food drink 4 39 33 36 1.9 5 Margarine 2 1053 980 1017 26.0 3 Margarine 5 991 611 801 134.2 17 Margarine 8 1231 1219 1225 4.4 0 3.5.2 Blind duplicates for vitamin D. Food sample Result 1 Result 2 mean Std dev CV Baby food 6.1 6.3 6.2 0.1 1 Food drink 1 10.7 12.4 11.5 0.6 5 Food drink 6 <0.5 <0.5 <0.5 0 0 Fruit cordial 2 1.6 1.7 1.6 0 1 Margarine 2 8.5 7.9 8.2 0.2 3 Margarine 5 14.2 13.8 14.0 0.2 1 Margarine 8 13.1 14.7 13.9 0.6 4 3.5.3 Blind duplicates for calcium Food sample Result 1 Result 2 mean Std dev CV Baby food 598 600 599 0.6 0 Breakfast cereal 1 388 442 415 19.3 5 Breakfast cereal 3 760 791 775 11.1 1 Breakfast cereal 4 718 731 725 4.6 1 Food drink 1 746 804 775 20.5 3 Food drink 3 408 406 407 0.5 0 Food drink 4 152 146 149 2.1 1 Milk product 6 199 203 201 1.4 1 Milk product 7 234 233 233 0.4 0
ESR Report on Fortification overages 19 Prepared for the NZFSA, June 2006

Appendix 4: Results for individual foods Table 4.1A: Vitamin A concentration (µg/100g or 100ml)
Label Claim Measured Std dev. %CV Mean 95% % overageFood uncertainty rangea
Baby food 282 336 282 315 282 379 282 334 282 285 mean 330 34.4 10.4 288-371 17 Food drink 1 356 289 356 322 356 330 356 361 356 295 mean 319 29.1 9.1 284-354 -10 Food drink 2 341 660 341 439 341 483 341 467 341 415 mean 493 96.9 19.7 376-609 44 Food drink 3 395 516 395 414 395 484 395 351 395 393 mean 432 67.2 15.6 351-512 9 Food drink 4 40 35 40 33 40 34 40 34 40 39 mean 35 2.4 6.8 32-38 -13 Food drink 5 51 47 51 43 51 45 51 50 51 43 mean 46 3.1 6.8 42-49 -11 Food drink 6 63 25 63 32 63 35 63 29 63 8 mean 26 10.8 42.1 13 -59 Fruit cordial 1 222 3 222 3 222 3 222 3 222 3 mean 3 0.0 0.0 3-3 -99 Margarine 1 1000 581 1000 771 1000 796
ESR Report on Fortification overages 20 Prepared for the NZFSA, June 2006
Label Claim Measured Std dev. %CV Mean 95% % overageFood uncertainty rangea
1000 849 1000 891 mean 777 119.2 15.3 634-921 -22 Margarine 2 1000 1061 1000 992 1000 943 1000 980 1000 749 mean 945 117.8 12.5 804-1086 -6 Margarine 3 850 982 850 1078 850 1077 850 1251 850 1258 mean 1130 120.7 10.7 984-1274 33 Margarine 4 850 1133 850 1105 850 1175 850 1103 850 1258 mean 1150 64.3 5.6 1078-1232 36 Margarine 5 850 612 850 583 850 581 850 573 850 379 mean 546 94.2 17.3 432-659 -36 Margarine 6 850 1148 850 885 850 1056 850 1067 850 538 mean 938 243.8 26.0 646-1231 10 Margarine 7 850 1094 850 1137 850 1179 850 1066 850 1271 mean 1150 80.4 7.0 1053-1246 35 Margarine 8 850 1219 850 1166 850 963 850 1221 850 1065 mean 1130 111.4 9.9 993-1260 33 Milk products 1 55 45 55 47 55 49 55 50 mean 48 2.22 5 45-50 -13 Milk products 2 55 44 55 43 55 42 55 41 55 52 mean 44 4.33 10 39-49 -20
ESR Report on Fortification overages 21 Prepared for the NZFSA, June 2006
Label Claim Measured Std dev. %CV Mean 95% % overageFood uncertainty rangea
Milk products 3 74 83 74 80 74 85 74 107 74 83 mean 88 10.77 12 75-100 18 Milk products 4 55 35 55 21 55 42 55 40 55 39 mean 35 8.66 25 25-46 -36 Milk products 5 55 61 55 63 55 13 55 58 55 58 mean 51 21.27 42 25-76 -8 Milk products 6 30 31 30 33 30 28 30 29 30 29 mean 30 2.00 7 28-32 0
a= mean ± 1.2 standard deviations of the measured concentration
ESR Report on Fortification overages 22 Prepared for the NZFSA, June 2006
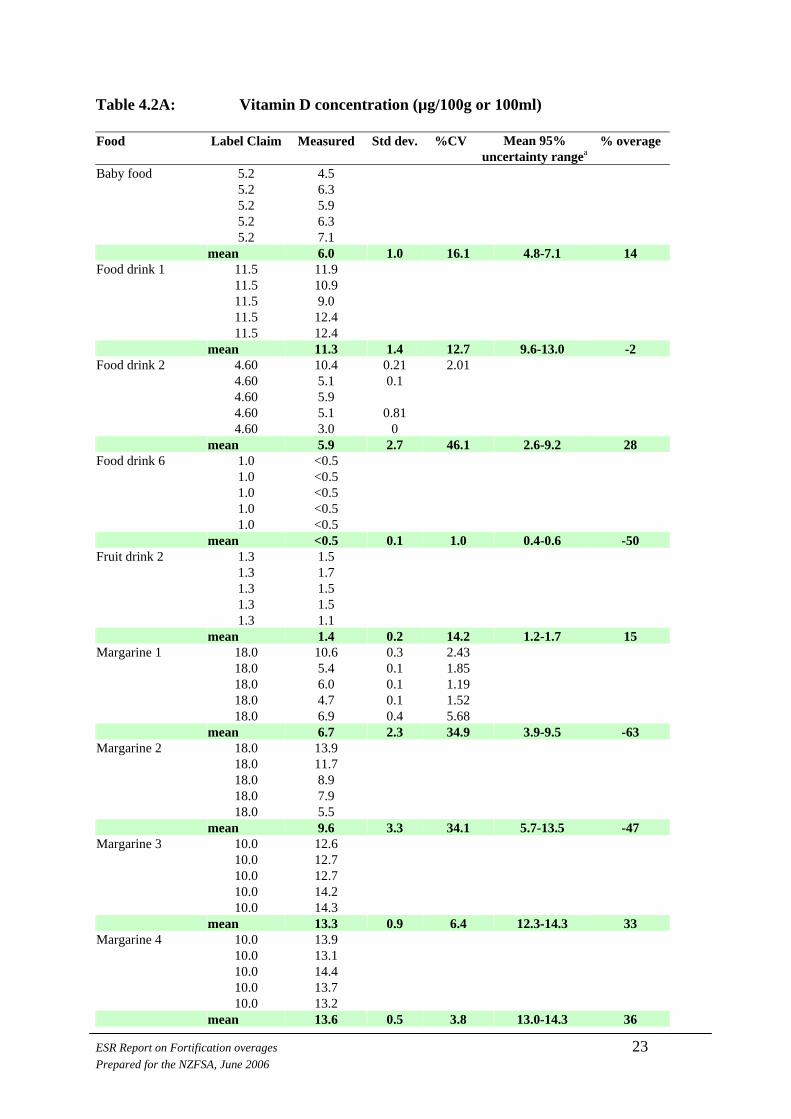
Table 4.2A: Vitamin D concentration (µg/100g or 100ml)
Label Claim Measured Std dev. %CV Mean 95% % overage Food uncertainty rangea
Baby food 5.2 4.5 5.2 6.3 5.2 5.9 5.2 6.3 5.2 7.1 mean 6.0 1.0 16.1 4.8-7.1 14 Food drink 1 11.5 11.9 11.5 10.9 11.5 9.0 11.5 12.4 11.5 12.4 mean 11.3 1.4 12.7 9.6-13.0 -2 Food drink 2 4.60 10.4 0.21 2.01 4.60 5.1 0.1 4.60 5.9 4.60 5.1 0.81 4.60 3.0 0 mean 5.9 2.7 46.1 2.6-9.2 28 Food drink 6 1.0 <0.5 1.0 <0.5 1.0 <0.5 1.0 <0.5 1.0 <0.5 mean <0.5 0.1 1.0 0.4-0.6 -50 Fruit drink 2 1.3 1.5 1.3 1.7 1.3 1.5 1.3 1.5 1.3 1.1 mean 1.4 0.2 14.2 1.2-1.7 15 Margarine 1 18.0 10.6 0.3 2.43 18.0 5.4 0.1 1.85 18.0 6.0 0.1 1.19 18.0 4.7 0.1 1.52 18.0 6.9 0.4 5.68 mean 6.7 2.3 34.9 3.9-9.5 -63 Margarine 2 18.0 13.9 18.0 11.7 18.0 8.9 18.0 7.9 18.0 5.5 mean 9.6 3.3 34.1 5.7-13.5 -47 Margarine 3 10.0 12.6 10.0 12.7 10.0 12.7 10.0 14.2 10.0 14.3 mean 13.3 0.9 6.4 12.3-14.3 33 Margarine 4 10.0 13.9 10.0 13.1 10.0 14.4 10.0 13.7 10.0 13.2 mean 13.6 0.5 3.8 13.0-14.3 36
ESR Report on Fortification overages 23 Prepared for the NZFSA, June 2006
Label Claim Measured Std dev. %CV Mean 95% % overage Food uncertainty rangea
Margarine 5 10.0 13.8 10.0 12.5 10.0 12.5 10.0 12.1 10.0 11.1 10.0 13.3 mean 12.5 0.8 6.2 11.6-13.5 25 Margarine 6 10.0 12.8 10.0 12.2 10.0 13.1 10.0 15.9 10.0 12.7 mean 13.2 1.5 11.2 11.4-15.0 32 Margarine 7 10.0 13.2 10.0 13.7 10.0 13.8 10.0 14.2 10.0 14.1 mean 13.8 0.4 2.8 13.3-14.2 38 Margarine 8 10.0 14.7 10.0 14.0 10.0 12.9 10.0 13.7 10.0 15.6 mean 14.2 1.0 7.1 12.9-15.4 42 Milk product 1 0.5 0.5 0.5 0.5 0.5 0.5 0.5 0.50 0.5 0.6 mean 0.5 0.0 8.6 0.5-0.6 1 Milk product 2 0.5 0.6 0.5 0.5 0.5 0.4 0.5 0.5 0.5 0.5 mean 0.5 0.1 13.2 0.4-0.6 4 Milk product 3 0.66 1.00 0.66 1.05 0.66 1.00 0.66 1.15 0.66 1.40 mean 1.12 0.2 15.0 0.9-1.3 70 Milk product 4 0.5 0.2 0.5 0.1 0.5 0.2 0.5 0.1 0.5 0.1 mean 0.2 0.04 20.7 0.1-0.2 -62 Milk product 5 0.5 0.2 0.5 0.2 0.5 0.0 0.5 0.2 0.5 0.2 mean 0.2 0.06 39.7 0.1-0.2 -68
a= mean ± 1.2 standard deviations of the measured concentration
ESR Report on Fortification overages 24 Prepared for the NZFSA, June 2006

Table 4.3A: Calcium concentration (mg/100g or 100ml)
Label Claim Measured Std dev. %CV Mean 95% % overageFood uncertainty rangea
Baby foods 682 592 682 600 682 681 682 659 682 642 mean 634 38.0 6.0 589-680 -7 Bread 271 384 271 345 271 424 271 386 271 339 mean 376 34.6 9.2 334-417 39 Breakfast cereal 1 267 407 267 442 267 372 267 335 267 349 mean 381 43.7 11.5 328-433 43 Breakfast cereal 2 267 320 267 301 267 295 267 487 267 317 mean 344 80.6 23.4 247-441 29 Breakfast cereal 3 667 842 667 801 667 791 667 912 667 863 mean 842 49.0 5.8 783-901 26 Breakfast cereal 4 333 519 333 569 333 623 333 731 333 545 mean 597 84.0 14.1 496-698 79 Breakfast cereal 5 444 594 444 551 444 670 444 646 444 432 mean 579 94.1 16.3 466-691 30 Food drink 1 639 728 639 777 639 761 639 744 639 804 mean 763 29.4 3.9 727-798 19 Food drink 2 683 415 683 558 683 606 683 649 683 653 mean 576 97.9 17.0 459-694 -16
ESR Report on Fortification overages 25 Prepared for the NZFSA, June 2006

Label Claim Measured Std dev. %CV Mean 95% % overageFood uncertainty rangea
Food drink 3 450 418 450 406 450 441 450 522 450 428 mean 443 46.0 10.4 388-498 -2 Food drink 4 120 150 120 146 120 203 120 154 120 148 mean 160 24.1 15.0 131-189 34 Food drink 5 160 255 160 186 160 233 160 211 160 199 mean 217 27.4 12.6 184-250 35 Food drink 7 120 135 120 196 120 99 120 67 120 72 mean 114 53.1 46.7 50-177 -5 Food drink 6 125 110 125 164 125 215 125 105 125 148 mean 148 44.7 30.1 95-202 19 Fruit cordial 120 164 120 168 120 109 120 86 120 77 mean 121 42.9 35.5 69-172 1 Milk product 1 205 184 205 186 205 171 205 152 205 153 mean 169 16.3 9.6 150-189 -18 Milk product 6 200 196 200 204 200 208 200 203 200 200 mean 202 4.6 2.3 196-207 1 Milk product 7 253 240 253 253 253 261 253 224 253 233 mean 242 14.9 6.2 224-2601 -4
a= mean ± 1.2 standard deviations of the measured concentration
ESR Report on Fortification overages 26 Prepared for the NZFSA, June 2006