Formula SAE Design, Test, Tune, and Setup: A Design of ...users.telenet.be/AudiR8/track...
16
400 Commonwealth Drive, Warrendale, PA 15096-0001 U.S.A. Tel: (724) 776-4841 Fax: (724) 776-5760 Web: www.sae.org SAE TECHNICAL PAPER SERIES Reprinted From: Vehicle Dynamics & Simulation, 2003 (SP-1778) 2003 SAE World Congress Detroit, Michigan March 3-6, 2003 Formula SAE Design, Test, Tune, and Setup: A Design of Experiment Approach Brooks Byam, George Coppens, Matt Dissette, Ken Janson, Jeremy McClain, Justin Ruediger and Brittany Zettel Saginaw Valley State University 2003-01-1320
Transcript of Formula SAE Design, Test, Tune, and Setup: A Design of ...users.telenet.be/AudiR8/track...
400 Commonwealth Drive, Warrendale, PA 15096-0001 U.S.A. Tel: (724) 776-4841 Fax: (724) 776-5760 Web: www.sae.org
SAE TECHNICALPAPER SERIES
Reprinted From: Vehicle Dynamics & Simulation, 2003(SP-1778)
2003 SAE World CongressDetroit, Michigan
March 3-6, 2003
Formula SAE Design, Test, Tune, and Setup:A Design of Experiment Approach
Brooks Byam, George Coppens, Matt Dissette, Ken Janson, Jeremy McClain,Justin Ruediger and Brittany Zettel
Saginaw Valley State University
2003-01-1320
All rights reserved. No part of this publication may be reproduced, stored in a retrieval system, ortransmitted, in any form or by any means, electronic, mechanical, photocopying, recording, or otherwise,without the prior written permission of SAE.
For permission and licensing requests contact:
SAE Permissions400 Commonwealth DriveWarrendale, PA 15096-0001-USAEmail: [email protected]: 724-772-4028Tel: 724-772-4891
For multiple print copies contact:
SAE Customer ServiceTel: 877-606-7323 (inside USA and Canada)Tel: 724-776-4970 (outside USA)Fax: 724-776-1615Email: [email protected]
ISSN 0148-7191Copyright © 2003 SAE International
Positions and opinions advanced in this paper are those of the author(s) and not necessarily those of SAE.The author is solely responsible for the content of the paper. A process is available by which discussionswill be printed with the paper if it is published in SAE Transactions.
Persons wishing to submit papers to be considered for presentation or publication by SAE should send themanuscript or a 300 word abstract of a proposed manuscript to: Secretary, Engineering Meetings Board, SAE.
Printed in USA
2003-01-1320
Formula SAE Design, Test, Tune, and Setup: A Design of Experiment Approach
Brooks Byam, George Coppens, Matt Dissette, Ken Janson,
Saginaw Valley State University
Copyright © 2003 SAE International
ABSTRACT
The Design of Experiment (DOE) method is becoming an industry standard for testing procedures. Saginaw Valley State University (SVSU) Formula SAE (FSAE) applied a DOE to a FSAE racecar in an attempt to efficiently and effectively focus their time, money, and personnel. The testing resulted in an optimum setup for each FSAE dynamic event, the sensitivity of nine vehicle parameters on vehicle performance, and the responsive interconnected relationships between parameters. As a result, future designs are easily focused towards the areas with the biggest potential performance gains saving time, money, and personnel.
INTRODUCTION
There is a need for Formula SAE (FSAE) teams to efficiently and effectively focus their time, money, and personnel due to the lack of such resources. FSAE teams designing race cars need to know what parameters will most affect the vehicle, what component settings will result in the highest performance, and what is the optimum setup for each dynamic event. Reliable answers to such questions could reduce research and design time, lower costs by eliminating the need to test multiple components, and help teams focus their personnel in areas where the most performance gains are possible.
The Saginaw Valley State University FSAE race team has applied the Design of Experiment (DOE) testing process to a FSAE racecar in an attempt to define reliable answers to these questions for FSAE racers. The DOE process allows many parameter settings to be optimized while only performing one set of experiments. DOE also reveals the sensitivity of each parameter setting on the performance of the vehicle and the interconnected relationships between parameters (1).
The DOE testing results provided SVSU FSAE with an optimum setup for each FSAE dynamic event, as well as the sensitivity of parameters such as camber, toe, tire pressure, damper settings, caster, Ackermann, anti-roll bar setting, spring rate, and final drive ratio. SVSU FSAE also found the interconnected relationships between the above parameters. The DOE approach has provided answers to the very important questions asked by Formula SAE teams and could help FSAE teams efficiently and effectively allocate resources.
DOE TESTING FOR FORMULA SAE RACING
The FSAE competition has four dynamic events; acceleration, skid pad, autocross, and endurance. Autocross and endurance have similar track layouts. Cones on a flat asphalt parking lot mark all events. SVSU FSAE ran DOE tests on these track configurations: two DOE tests on an acceleration track, one DOE test on a skid pad track, and three DOE tests on a combined autocross and endurance track.
Formula SAE racecars vary significantly in weight, length, and width. Therefore, results from this DOE testing may not be applicable to FSAE racecars of different weights and dimensions than those of the 2002 SVSU FSAE racecar. The data provided will best suit FSAE racecars with weights of approximately 460 lbs., 70” wheelbases, track widths of approximately 50”, and using 20.0x7.0 Hoosier R25A tires on 13 inch wheels. However, the results will provide an overview for all FSAE racecars of important interactions and significant findings from DOE testing.
GENERAL PROCEDURES
The general procedure started with selecting a number of vehicle parameter settings and number of trials applicable to the specific test. Next a test matrix of the selected parameters was established using DOE computer software. The test matrix determines the
Jeremy McClain, Justin Ruediger and Brittany Zettel
ordered set of trials containing specific settings for each parameter needed to perform a DOE. No trials are exactly the same since the combinations of settings in each trial differ from each other. Trials are run until all parameter combinations have been tested. 2n trials, where n is the number of vehicle parameters, are necessary in order to run a full factorial DOE (1). Less then a full factorial results in reduced accuracy. SVSU FSAE ran all tests at or above an eighth factorial. As compared to other testing methods, DOE requires fewer resources such as time, materials, and number of trial runs to test and tune a racecar (4).
One driver was used for each event. This was done to reduce errors due to different driving styles. In order to remain consistent and avoid biasing a particular set up the driver did not know what settings were being changed. Several runs for each set up were completed until lap times were consistent for five laps. The average of those five laps was the recorded lap time.
A photo-gate system was used for timing. The acceleration event system consisted of two gates. The racecar broke the gate at the starting line and the timer counted until the racecar broke the gate at the finish line.The skid pad and autocross/endurance tests had one photo-gate placed at the start/finish line of the course. The racecar breaking the gate started a timer and reset it each time it was broken, giving an elapsed time.
The lap times for each trial were entered in DOE computer software, which generated a vehicle model with parameter sensitivity and interaction plots.
Tire and track temperatures were monitored with a pyrometer after each individual run. It was important to have the track temperatures close to the same throughout the entire experiment to avoid error. Testing was done in a consistent climate.
ACCELERATION
The purpose of the acceleration event is to evaluate the acceleration performance of the racecar. Two DOE tests were conducted for this event, with seven vehicle parameters being changed.
TRACK LAYOUT
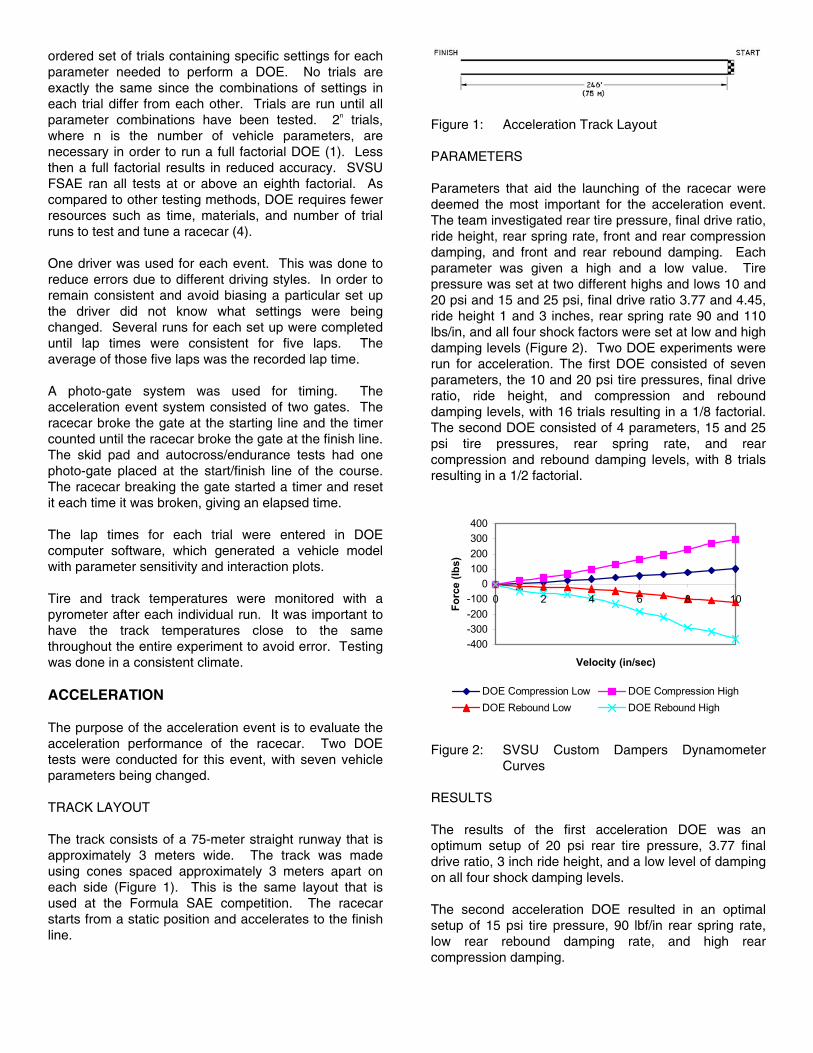
The track consists of a 75-meter straight runway that is approximately 3 meters wide. The track was made using cones spaced approximately 3 meters apart on each side (Figure 1). This is the same layout that is used at the Formula SAE competition. The racecar starts from a static position and accelerates to the finish line.
Figure 1: Acceleration Track Layout
PARAMETERS
Parameters that aid the launching of the racecar were deemed the most important for the acceleration event. The team investigated rear tire pressure, final drive ratio, ride height, rear spring rate, front and rear compression damping, and front and rear rebound damping. Each parameter was given a high and a low value. Tire pressure was set at two different highs and lows 10 and 20 psi and 15 and 25 psi, final drive ratio 3.77 and 4.45, ride height 1 and 3 inches, rear spring rate 90 and 110 lbs/in, and all four shock factors were set at low and high damping levels (Figure 2). Two DOE experiments were run for acceleration. The first DOE consisted of seven parameters, the 10 and 20 psi tire pressures, final drive ratio, ride height, and compression and rebound damping levels, with 16 trials resulting in a 1/8 factorial. The second DOE consisted of 4 parameters, 15 and 25 psi tire pressures, rear spring rate, and rear compression and rebound damping levels, with 8 trials resulting in a 1/2 factorial.
-400-300-200-100
0100200300400
0 2 4 6 8 10
Velocity (in/sec)
Forc
e (lb
s)
DOE Compression Low DOE Compression HighDOE Rebound Low DOE Rebound High
Figure 2: SVSU Custom Dampers Dynamometer Curves
RESULTS
The results of the first acceleration DOE was an optimum setup of 20 psi rear tire pressure, 3.77 final drive ratio, 3 inch ride height, and a low level of damping on all four shock damping levels.
The second acceleration DOE resulted in an optimal setup of 15 psi tire pressure, 90 lbf/in rear spring rate, low rear rebound damping rate, and high rear compression damping.

The DOE software predicted that the 2002 SVSU racecar was capable of a 4.178 second acceleration run and it was physically verified on the track. This was a 0.244 second improvement from the 4.422 second lap at the FSAE competition. This constitutes a potential twenty-place improvement from 23rd to 3rd place.
PARAMETER SENSITIVITIES
The sensitivity plots for the first acceleration DOE are shown in Figures 3 through 9. A sensitivity plot shows graphically how much an individual parameter affects the system at the optimal setup found by the DOE. The slope indicates the sensitivity, the steeper the slope the more sensitive the parameter. All sensitivities plots are lap time versus parameter setting.
Figure 3: Rear Tire Pressure Sensitivity
Figure 4: Final Drive Sensitivity
Figure 5: Ride Height Sensitivity
Figure 6: Front Compression Damping Level Sensitivity
Figure 7: Front Rebound Damping Level Sensitivity
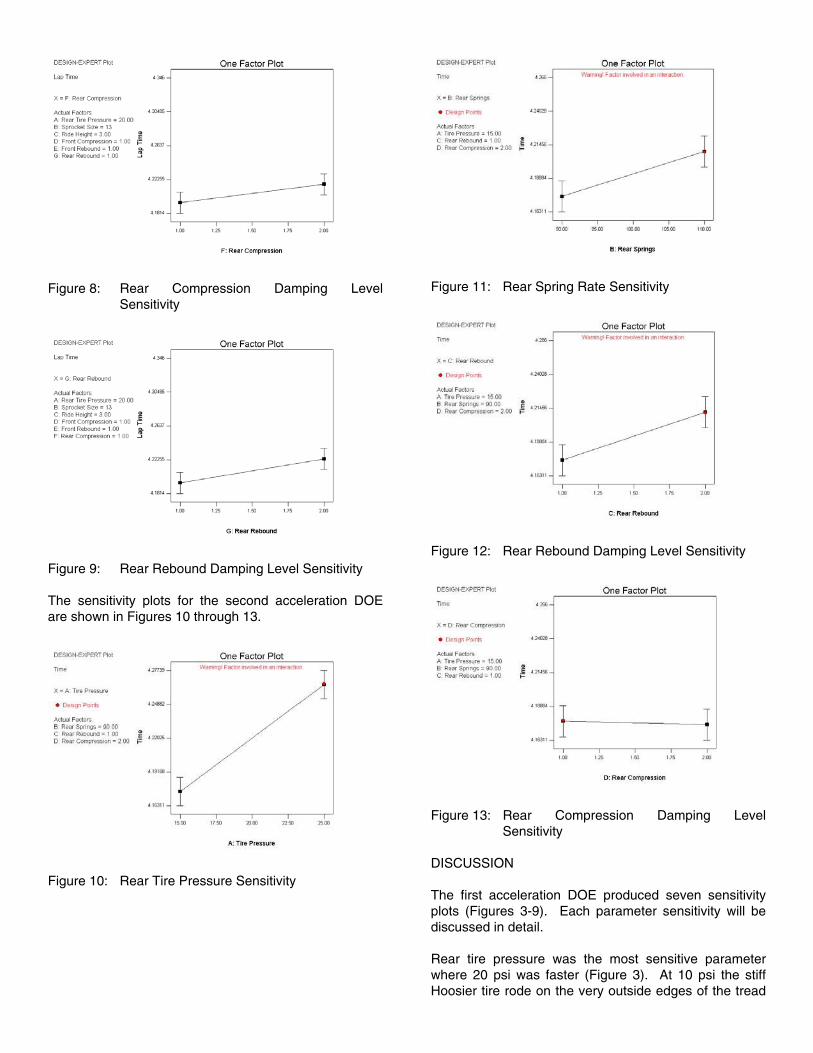
Figure 8: Rear Compression Damping Level Sensitivity
Figure 9: Rear Rebound Damping Level Sensitivity
The sensitivity plots for the second acceleration DOE are shown in Figures 10 through 13.
Figure 10: Rear Tire Pressure Sensitivity
Figure 11: Rear Spring Rate Sensitivity
Figure 12: Rear Rebound Damping Level Sensitivity
Figure 13: Rear Compression Damping Level Sensitivity
DISCUSSION
The first acceleration DOE produced seven sensitivity plots (Figures 3-9). Each parameter sensitivity will be discussed in detail.
Rear tire pressure was the most sensitive parameter where 20 psi was faster (Figure 3). At 10 psi the stiff Hoosier tire rode on the very outside edges of the tread

reducing the contact patch. This was validated by tire temperature measurements.
The final drive ratio plot showed the lower ratio was faster (Figure 4). This was inconclusive due to the fact that takeoff RPM was not tuned properly to each ratio. The higher ratio with the 11 tooth front sprocket produced more tire spin.
The ride height plot showed that higher was faster (Figure 5). The higher ride height increases the longitudinal load transfer to the rear wheels giving the racecar more traction at launch. Most time is lost at launch in the acceleration event. Ride height improves launch.
The front compression damping plot showed a very flat or very low sensitivity where the low level was faster (Figure 6). This parameter does not need to be included in future acceleration DOE’s because the sensitivity plot shows very little impact on the system. The parameter may be investigated after all other parameters have been optimized.
The front rebound damping plot showed a low level was faster (Figure 7). The low front rebound damping level allows the weight to come off front axle quickly and transfer to the rear.
The rear compression damping plot showed a low level was faster (Figure 8). The low rear compression damping level allows the car to squat quickly.
The rear rebound damping plot showed a low level was faster (Figure 9). A high level was expected to be faster. A second DOE was run to further investigate the rear damping levels.
Analysis of the first acceleration DOE resulted in further investigation of tire pressure, rear spring rate, and rear compression and rebound damping levels. Tire pressure because of its high sensitivity, rear spring rate to attempt to reveal more of the dampers impact on the system, and damping levels that were not as expected. As a result, a second acceleration DOE was set up using those four factors.
The second acceleration DOE produced four sensitivity plots (Figures 10-13). Each parameter will be discussed in detail.
Rear tire pressure was the most sensitive factor again where 15 psi was faster (Figure 10). 15 psi was close to the optimal tire pressure setting supported by an even tire temperature gradient across the face of the tire. The even tire temperatures show that the largest contact patch possible between the tires and pavement is being achieved.
The rear spring rate plot showed the softer 90 lb/in rate was faster (Figure 11). The softer springs put more of the load on the dampers. However, the interaction plots were inconclusive. Further tests need to be run.
The rear rebound damping level plot showed a low level was faster (Figure 12). Both DOE’s confirmed the low level of rear rebound damping. Again this was unexpected. Further tests need to be run.
The rear compression damping level plot showed a high level was faster (Figure 13). This is the opposite setting shown in the first acceleration DOE. Both DOE’s showed rear compression damping did not have large impact on lap time. Further investigation is necessary once all other parameters are optimized.
Both DOE’s show the need for further investigation of rear damping and rear spring rate interaction. However, the results give parameter settings that make the racecar faster.
Two other points became clear during the process of the acceleration DOE’s. First, weight is an extremely important factor in acceleration times. This was verified by adding 20 pounds to the car in addition to the driver. The driver’s best time was a full 0.1 seconds slower under the optimal settings with the additional 20 pounds. This does not necessarily mean more horsepower it means less weight. Second, tire and track temperatures greatly affect lap times. There was no clear indication of what exact track and tire temperature was optimal, but it is clear that warm tires are necessary to get good grip.
SKID PAD
The purpose of the skid pad event is to evaluate the cornering ability of the racecar on a flat surface while making a constant radius turn. One DOE test was conducted for this event, with eight parameters being changed.
TRACK LAYOUT
The skid pad event consists of a figure eight track marked by cones (Figure 14). This is the same track used at FSAE competition. The racecar enters the track in the middle of the two 50 ft. diameter circles, makes two runs around the right circle, and then switches to the left circle. Two more runs are made around the left circle and the racecar exits. The second lap in each direction is timed and the two times are averaged.

Figure 14: Skid Pad Track Layout
PARAMETERS
Parameters that aided the control of understeer and oversteer were deemed most important parameters for the skid pad event. The team investigated tire pressure, driver/vehicle weight, front and rear toe, front and rear camber, and front and rear roll gradient. Each factor was given a high and a low value, tire pressure 10 and 20 psi, driver/vehicle weight low with 180 lbs driver and high with the driver plus 40 lbs, front and rear toe 1/2 inch in and 1/2 inch out, front camber 2.5O and 3.5O, rear camber 0O and 1O, front roll gradient of 2.22 O/g and 1.5 O/g, and rear roll gradient of 2.95 O/g and 1.5 O/g. The DOE consisted of all eight of the above parameters with 32 trials resulting in a 1/8 factorial.
RESULTS
The results of the skid pad DOE was an optimal setup of 20 psi tire pressure, low driver/vehicle weight, 1/2 inch toe out front and rear toe, 3.5O front camber, 1O degree rear camber, 2.22 O/g front roll gradient, and 1.5 O/g rear roll gradient.
The DOE software predicted that the 2002 SVSU racecar was capable of 5.339 seconds and it was physically verified on the track. This was a 0.143 second improvement from the 5.482 second lap at the 2002 FSAE competition. This constitutes a seven-place improvement from 12th to 5th place.
PARAMETER SENSITIVITIES
The sensitivity plots for the skid pad DOE are shown in Figures 15 through 22. A sensitivity plot shows graphically how much an individual parameter affects the system at the optimal setup found by the DOE. The slope indicates the sensitivity, the steeper the slope the more sensitive the parameter. All sensitivities plots are lap time versus parameter setting.
Figure 15: Tire Pressure Sensitivity
Figure 16: Driver Weight Sensitivity
Figure 17: Front Toe Sensitivity

Figure 18: Rear Toe Sensitivity
Figure 19: Front Camber Sensitivity
Figure 20: Rear Camber Sensitivity
Figure 21: Front Roll Gradient Sensitivity
Figure 22: Rear Roll Gradient Sensitivity
PARAMETER INTERACTIONS
Interaction plots are similar to sensitivity plots, except that they show how two parameters can have a large influence over one another. Figure 23 shows an interaction plot for time versus front roll gradient. The interacting parameter shown at the top of the plot is rear roll gradient.
Figure 23: Front and Rear Roll Gradient Interaction

DISCUSSION
The skid pad DOE produced seven sensitivity plots (Figures 15-22). Each parameter sensitivity will be discussed in detail.
Tire pressure was the most sensitive parameter with 20 psi being faster (Figure 15). Acceleration data showed the best tire contact patch between 15 and 20 psi. 15 psi was faster in acceleration. 20 psi was faster in skid pad.
The driver weight sensitivity plot shows that lighter is faster (Figure 16). This was a common theme throughout all testing. At the optimal set up less weight always makes the racecar faster.
The front toe sensitivity plot showed that ½ inch toe out was faster (Figure 17). The sensitivity plot shows this parameter had little impact on the system. This was not expected. It is believed compliance in the steering system was the reason for the low sensitivity.
The rear toe sensitivity plot showed that ½ inch toe out was faster (Figure 18). Rear toe showed a greater influence on the system than front toe. Toe out in the rear is an oversteer condition. It seemed throughout skid pad testing oversteer conditions were faster.
The front camber sensitivity plot showed that 3.5O was faster (Figure 19). The sensitivity plot showed that front camber did not have large impact on the system. More sensitivity was expected. In autocross/endurance testing caster increased front camber sensitivity. Caster was not tested in this skid pad DOE but needs to be included in future tests. 3.5O was the upper limit of this car. It is possible that higher settings may be faster.
The rear camber sensitivity plot showed that 1O was faster (Figure 20). The sensitivity plot showed that rear camber did not have large impact on the system. 1O was the upper limit of this car. It is possible that higher settings may be faster.
The front roll gradient sensitivity plot showed that 2.22 O/g was faster (Figure 21). The sensitivity plot showed that front roll gradient did not have large impact on the system. However, front roll gradient did have a strong interaction with rear roll gradient.
The rear roll gradient sensitivity plot showed that 1.5 O/gwas faster (Figure 22). The front and rear roll gradient settings greatly influence the understeer and oversteer characteristics of the racecar. The optimum settings for the roll gradients produce an oversteer effect, which seems to be faster throughout skid-pad testing.
The front and rear roll gradient interaction plot shows that with a 1.50 O/g rear roll gradient, the front roll gradient has little influence on the system (Figure 23).
However, once the rear roll gradient is increased to 2.95 O/g, the sensitivity of the front roll gradient is greatly increased. This plot shows a very important relationship between the front and rear roll gradients. Front and rear roll gradients greatly influence oversteer and understeer. With both front and rear roll gradients equal, the racecar is closer to neutral. Increasing the front roll gradient with respect to the rear causes the car to develop an oversteer condition, which has proven to be faster in skid pad. The data also shows that understeer is very undesirable.
Again, tire and track temperatures greatly affect lap times. There was no clear indication of what exact track and tire temperature was optimal, but it was clear that warm tires were necessary to get good traction.
AUTOCROSS/ENDURANCE
The purpose of the autocross event is to evaluate the racecar’s maneuverability and handling qualities on a tight course without the hindrance of competing cars. The endurance event is designed to evaluate the performance of the racecar and test the racecar’s reliability. Three DOE’s were conducted for the autocross/endurance events with 13 parameters being changed.
TRACK LAYOUT
A single track containing most features of both the FSAE autocross and endurance events was used. The track, marked by cones, consisted of a 50 ft diameter left hand sweeper, a 30 ft spaced slalom, two acute angled 14 ft radius turns, and a 100 ft long 11 ft wide straight (Figure 24).
Figure 24: Autocross/Endurance Track Layout
PARAMETERS
Parameters that aid corner entry, corner center speed, and corner exit were deemed the most important parameters for the autocross/endurance event. The team investigated tire pressure, front and rear toe, front and rear camber, front and rear roll gradient, caster,

Ackermann, and front and rear compression and rebound damping. Each factor was given a high and a low value. Tire pressure was set at two different highs and lows 15 and 20 psi and 17.5 and 22.5 psi, front and rear toe 0” and ½” toe out, front camber 2.5O and 3.5O,rear camber 0O and 1O, front roll gradient 2.22 and 1.5 O/g, rear roll gradients 2.95 and 1.5 O/g, caster 0O and 3O,Ackermann 0O and 1.5O at full lock, and front and rear compression and rebound set at low and high damping levels (Figure 2). Since there was a total of 13 different parameters, three separate DOE tests were run to reduce the uncertainty inherent in large fractional factorial DOE models. The first autocross/endurance DOE consisted of four parameters, front and rear toe and front and rear roll gradient, with 16 trials resulting in a full factorial. The second autocross/endurance DOE consisted of five parameters, 15 and 20 psi tire pressure, caster, front and rear camber, and Ackermann, with 16 trials resulting in a 1/2 factorial. The third autocross/endurance DOE consisted of five parameters, 17.5 and 22.5 psi tire pressure and front and rear compression and rebound damping, with 16 trials resulting in a 1/2 factorial.
RESULTS
The results of the first autocross/endurance DOE was an optimum setup of front and rear toe ½” out and both front and rear roll gradients at 1.5 O/g.
The results of the second autocross/endurance DOE was an optimum setup of 20 psi tire pressure, 3O caster, 0O Ackermann, 3.5O front camber, and 1O rear camber.
The results of the third autocross/endurance DOE was an optimum setup of 17.5 psi tire pressure, low front compression and rebound damping, low rear rebound damping, and high rear compression damping.
The DOE software predicted that the 2002 optimal set up was 3.38% faster then the 2002 SVSU Formula SAE competition set up in autocross and endurance and it was physically verified on the track. This constitutes an eleven-place improvement from 15th to 4th in autocross and a four-place improvement from 10th to 6th in endurance at the 2002 FSAE competition.
PARAMETER SENSITIVITIES
The sensitivity plots for the first autocross/endurance DOE are shown in Figures 25 through 28. A sensitivity plot shows graphically how much an individual parameter affects the system at the optimal setup found by the DOE. The slope indicates the sensitivity, the steeper the slope the more sensitive the parameter. All sensitivities plots are lap time versus parameter setting.
Figure 25: Front Toe Sensitivity
Figure 26: Rear Toe Sensitivity
Figure 27: Front Roll Gradient Sensitivity

Figure 28: Rear Roll Gradient Sensitivity
Sensitivity plots from the second autocross/endurance DOE are shown in figures 29-33.
Figure 29: Tire Pressure Sensitivity
Figure 30: Caster Sensitivity
Figure 31: Front Camber Sensitivity
Figure 32: Rear Camber Sensitivity
Figure 33: Ackermann Sensitivity
Sensitivity plots from the third autocross/endurance DOE are shown in figures 34-38.

Figure 34: Tire Pressure Sensitivity
Figure 35: Front Compression Damping Sensitivity
Figure 36: Front Rebound Damping Sensitivity
Figure 37: Rear Compression Damping Sensitivity
Figure 38: Rear Rebound Damping Sensitivity
PARAMETER INTERACTIONS
Interaction plots are similar to sensitivity plots, except that they show how two parameters can have a large influence over one another. Figure 39 shows an interaction plot for time versus front camber. The interacting parameter shown at the top of the plot is caster. Figure 40 shows an interaction plot for time versus front roll gradient. The interacting parameter is rear roll gradient.
Figure 39: Front Camber and Caster Interaction

Figure 40: Front and Rear Anti-Roll Bar Interaction
DISCUSSION
The first autocross/endurance DOE produced four sensitivity plots (Figures 25-28). Each parameter sensitivity will be discussed in detail.
The front toe sensitivity plot showed that ½ inch toe out was faster (Figure 25). The front toe has greater sensitivity in autocross/endurance than in skid pad, possibly due to toe effects in corner entry and exit not present in skid pad.
The rear toe sensitivity plot showed that ½ inch toe out was faster (Figure 26). Toe out in the rear is an oversteer condition.
The front roll gradient sensitivity plot showed that 1.5 O/gwas faster (Figure 27). The sensitivity plot showed that front roll gradient did not have large impact on the system. However, front roll gradient did have a strong interaction with rear roll gradient.
The rear roll gradient sensitivity plot showed that 1.5 O/gwas faster (Figure 28). The front and rear roll gradient settings greatly influence the understeer and oversteer characteristics of the racecar. Both front and rear roll gradient being set at 1.5 O/g bring the car close to neutral.
The second autocross/endurance DOE produced five sensitivity plots (Figures 29-33). Each parameter sensitivity will be discussed in detail.
The tire pressure sensitivity plot showed that 20 psi was faster (Figure 29). This seems to be in agreement with the skid pad data.
The caster sensitivity plot showed that 3O was faster (Figure 30). This was an unexpected result. The 2002 SVSU Formula SAE racecar was designed to run without caster because caster induces weight jacking into the suspension of a racecar, which is an undesirable trait. However, caster also produces camber gain and
driver feel, both of which are desirable traits in a racecar.This DOE shows that the positive effects outweigh the negative on the 2002 SVSU FSAE racecar.
Front camber was the most sensitive parameter from the second autocross/endurance DOE and it showed 3.5O to be faster (Figure 31). 3.5O was the upper limit of this car. It is possible that higher settings may be faster. Front camber did have a strong interaction with caster.
The rear camber sensitivity plot showed that 1O was faster (Figure 32). 1O was the upper limit of this car. It is possible that higher settings may be faster.
The Ackermann sensitivity plot showed that 0O was faster (Figure 33). This was an unexpected result. Ackermann was expected to help in the tight turns of an FSAE course. The data showed that Ackermann did not have large influence on lap time. Further investigation is necessary once all other parameters have been optimized. A DOE with front toe and Ackermann would be ideal.
The third autocross/endurance DOE produced five sensitivity plots (Figures 34-38). Each parameter sensitivity will be discussed in detail.
The tire pressure plot showed that 17.5 psi was faster (Figure 34). The optimum tire pressure from the second autocross/endurance DOE showed 20 psi faster. This means that the optimum pressure is narrowed to the 17.5 to 20 psi range. Additional testing would further narrow this range.
The front compression damping plot showed the low level was faster (Figure 35). A low setting represents near critical damping. This allows the racecar’s front end to settle quicker then a high setting in a transient course.
The front rebound damping plot showed a low level was faster (Figure 36). This was the most sensitive parameter of the third autocross/endurance DOE. The low front rebound damping level allows the weight to come off front axle quickly and transfer to the rear.
The rear compression damping plot showed a high level was faster (Figure 37). This was an unexpected result. Further investigation is necessary once all other parameters have been optimized.
The rear rebound damping plot showed a low level was faster (Figure 38). This parameter did not have a large influence on lap times. Further investigation is necessary once all other parameters have been optimized.
The caster and front camber interaction plot shows that front camber is much more sensitive with caster than with no caster (Figure 39). The camber gain from caster

has a large influence on lap time. This is another validation of the benefits of caster.
The front and rear roll gradient interaction plot shows that with a 1.50 O/g rear roll gradient, the front roll gradient has little influence on the system (Figure 40). However, once the rear roll gradient is increased to 2.95 O/g, the sensitivity of the front roll gradient is greatly increased. This plot shows a very important relationship between the front and rear roll gradients. Front and rear roll gradients greatly influence oversteer and understeer. With both front and rear roll gradients equal, the racecar is closer to neutral. The data showed that closer to neutral was faster in autocross/endurance. The data also shows that understeer is very undesirable. This data is very similar to that found in the skid pad DOE.
Another observation was that tire and track temperatures greatly affect run times. There was no clear indication of what exact track and tire temperature was optimal, but it is clear that warm tires are necessary to get good grip.
ADDITIONAL OBSERVATIONS
Meticulous observation while completing DOE’s have lead to many significant findings and trends not revealed by the DOE software. Track and tire temperatures should be recorded periodically, as these two factors may vary lap time and will not be revealed by the DOE results. Lap times that are dramatically higher or lower than previous lap times should also be investigated. Every racecar component should be checked to confirm proper operation and to find any signs of binding, excessive deflection, fracture or fatigue no matter how simple or obvious the component. For example, an accelerator pedal that binds can impair the driver’s ability to accelerate, corner, or decelerate. Positive stops on the steering rack that are not set to the correct position may inhibit cornering around a sharp turn. Driver observation is also very important. The driver should report how the car handles, whether it has a loose, tight, or neutral feel to it. The driver’s preferred driving style should also be noted in the results. Observation during the testing procedures should not be neglected since it is an integral part of the testing process and can lead to recommendations for future design.
Fatigue was found to be very important factor when testing a FSAE racecar. During the DOE testing seven component fatigue failures occurred. This shows the need to build at least two of every part. It also shows the necessity to replace every part before the Formula SAE competition if testing is conducted before the event. It is essential to constantly check all parts for cracking and any other signs that fatigue failure could occur. As a result, fatigue analysis should be done on all parts.
CONCLUSIONS
Tire pressure was a very sensitive parameter in every DOE. In all cases, tire pressures from 15 to 20 psi were faster. Tire pressure changes are very cheap and simple and large gains can be made.
Toe out front and rear was faster in both skid pad and autocross/endurance. Toe is a cheap and simple way to decrease lap times.
Caster can play an important role in reducing lap times. The 2002 SVSU Formula SAE racecar was designed to run without caster because caster induces weight jacking into the suspension of a racecar, which is an undesirable trait. However, caster also produces camber gain and driver feel, both of which are desirable traits in a racecar. The autocross/endurance DOE data shows the caster positives outweigh the negatives on the 2002 SVSU Formula SAE racecar. This was validated by the caster and front camber interaction seen in the second autocross/endurance DOE.
Ride height had a significant impact on acceleration time. The DOE showed that the higher ride height was faster. It is possible that a further increase in ride height would continue to decrease acceleration times. This is a very simple and cheap way to decrease acceleration lap times.
Front and rear roll gradients have an important interaction. The balance of these parameters can control the amount of understeer and oversteer of the racecar. In skid pad an oversteer condition was faster and in autocross/endurance a more neutral condition was faster. Understeer was always undesirable.
Damping levels seem to produce the fastest lap times at or around critical damping. This is the low setting on the SVSU dampers. However, much more testing needs to be accomplished to refine optimal damping level. Time should be invested in optimizing all other parameters first then the damping levels.
Lower driver/vehicle weight always resulted in faster lap times. Data from the skid pad and acceleration DOE showed that lighter is faster. These findings show that future FSAE racecars should be designed with weight reduction being a major goal. Weight reduction can be expensive and time consuming but with the entire team initially focused on weight reduction it can be achieved.
A full or ½ factorial should be used in all DOE testing. Lower order factorials have reduced accuracy. SVSU FSAE ran two eighth, three half, and one full factorial DOE’s. If there are a large number of parameters to be tested, break up the parameters into several smaller higher order DOE’s instead of one large low order DOE. Test parameters with the most understandable effect

first then set these parameters at their optimum level for the following DOE’s. Test the less understandable parameters last with all other parameters at an optimum setting. For example, tire pressure is an understandable parameter. Damping levels are a less understandable parameter. Attempt to combine parameters in the smaller DOE’s that have the highest probability of having interactions. Two strong interactions that were found in the DOE process were front and rear roll gradient, and front camber and caster. If at all possible, parameters such as these should be tested in the same DOE.
REFERENCES
1. Anderson, Mark. “Design of Experiments.” The Industrial Physicist. Sept. 1997. American Institute of Physics. 6 Nov. 2001
2. Dixon, John C. Shock Absorber Handbook.Warrendale: Society of Automotive Engineers, Inc., 1999
3. Gillespie, Thomas D. Fundamentals of Vehicle Dynamics. Warrendale: Society of Automotive Engineers, Inc., 1992
4. Hill, John. “Design of Experiment.” Racecar Engineering Oct. 2001: 57-62.
5. Milliken, William F. and Douglas L. Milliken. RaceCar Vehicle Dynamics. Warrendale: Society of Automotive Engineers, Inc., 1995