
Foreword - Hypo Vorarlberg · Claudio Zanini, HPB Bludenz Branch Office Christian Vonach, BOH...
69
Passionate. Sound. Advice.
-
Upload
hoangnguyet -
Category
Documents
-
view
215 -
download
0
Transcript of Foreword - Hypo Vorarlberg · Claudio Zanini, HPB Bludenz Branch Office Christian Vonach, BOH...
Foreword
Passionate. Sound. Advice.
ViennaWels
GrazBolzano
St. Gallen
Vaduz
Bregenz
Como
Bergamo
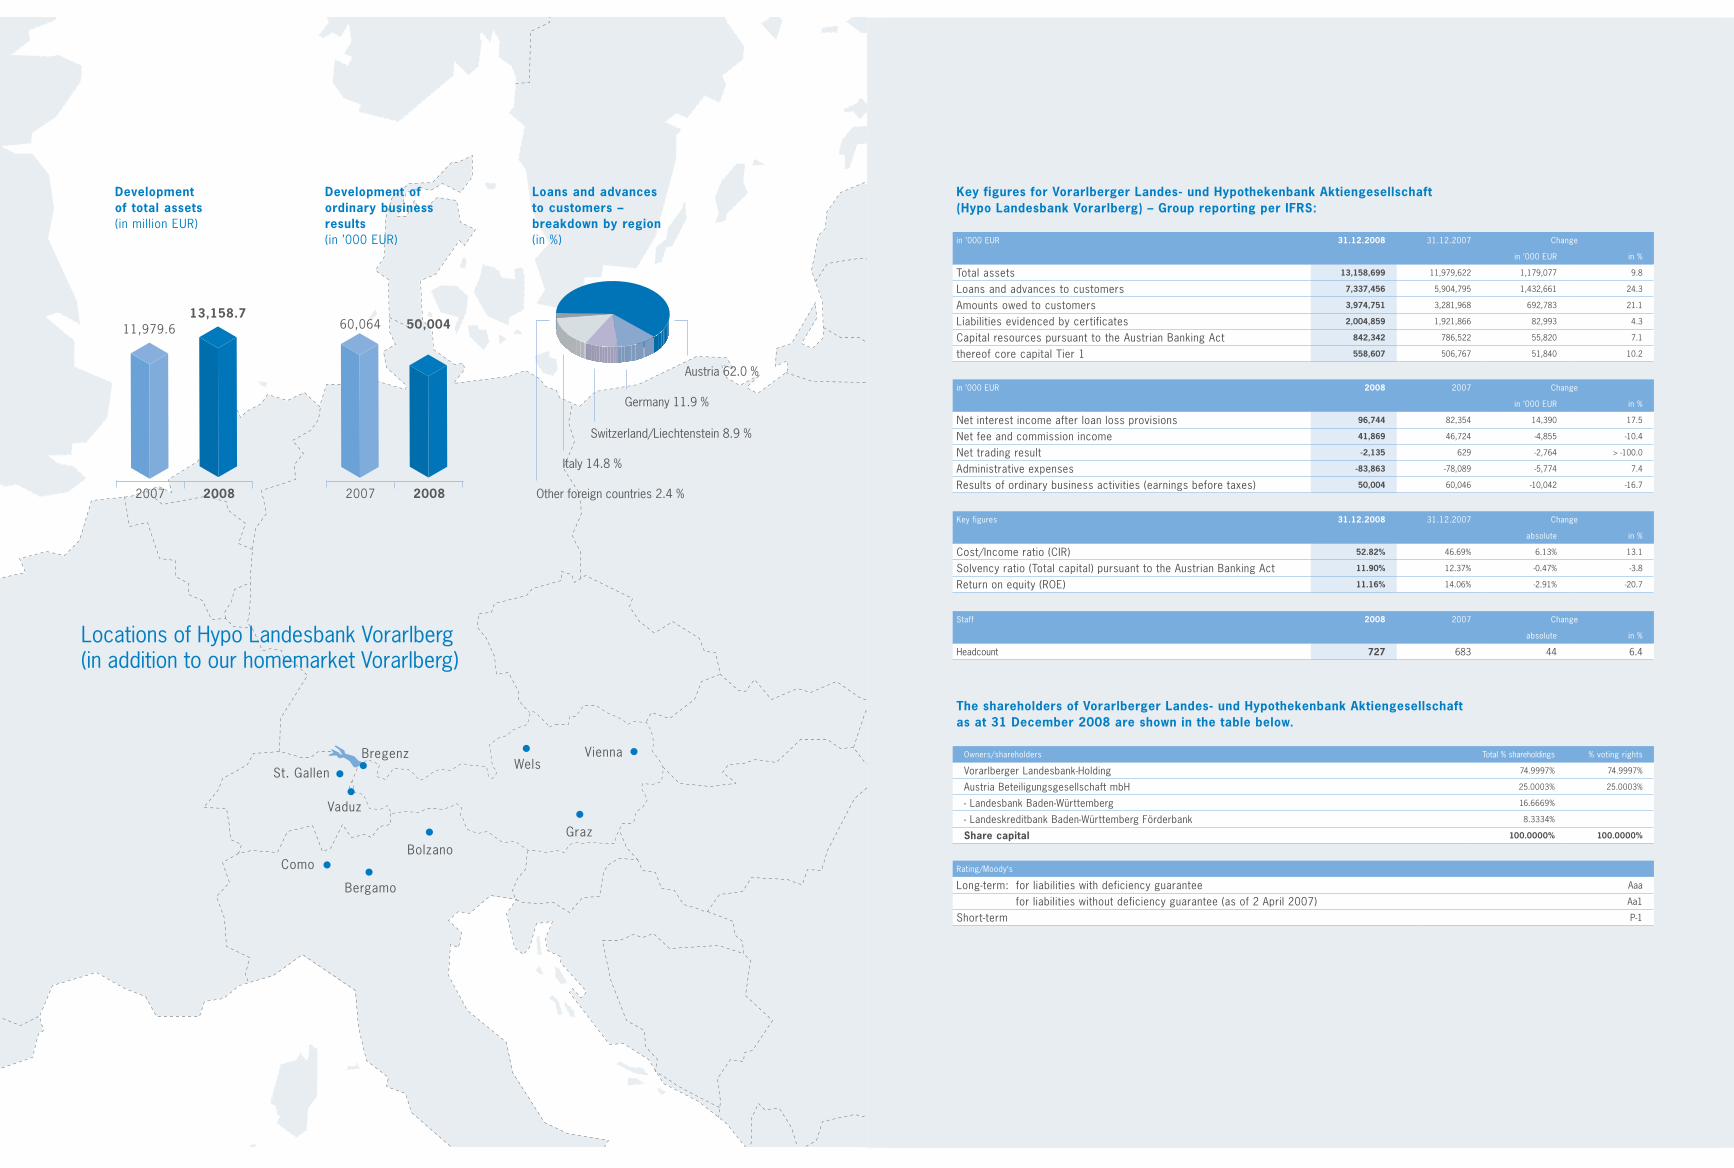
Locations of Hypo Landesbank Vorarlberg(in addition to our homemarket Vorarlberg)
Key figures for Vorarlberger Landes- und Hypothekenbank Aktiengesellschaft (Hypo Landesbank Vorarlberg) – Group reporting per IFRS:
in ’000 EUR 31.12.2008 31.12.2007 Change
in ’000 EUR in %
Total assets 13,158,699 11,979,622 1,179,077 9.8
Loans and advances to customers 7,337,456 5,904,795 1,432,661 24.3
Amounts owed to customers 3,974,751 3,281,968 692,783 21.1
Liabilities evidenced by certificates 2,004,859 1,921,866 82,993 4.3
Capital resources pursuant to the Austrian Banking Act 842,342 786,522 55,820 7.1
thereof core capital Tier 1 558,607 506,767 51,840 10.2
in ’000 EUR 2008 2007 Change
in ’000 EUR in %
Net interest income after loan loss provisions 96,744 82,354 14,390 17.5
Net fee and commission income 41,869 46,724 -4,855 -10.4
Net trading result -2,135 629 -2,764 > -100.0
Administrative expenses -83,863 -78,089 -5,774 7.4
Results of ordinary business activities (earnings before taxes) 50,004 60,046 -10,042 -16.7
Key figures 31.12.2008 31.12.2007 Change
absolute in %
Cost/Income ratio (CIR) 52.82% 46.69% 6.13% 13.1
Solvency ratio (Total capital) pursuant to the Austrian Banking Act 11.90% 12.37% -0.47% -3.8
Return on equity (ROE) 11.16% 14.06% -2.91% -20.7
Staff 2008 2007 Change
absolute in %
Headcount 727 683 44 6.4
The shareholders of Vorarlberger Landes- und Hypothekenbank Aktiengesellschaft as at 31 December 2008 are shown in the table below.
Owners/shareholders Total % shareholdings % voting rights
Vorarlberger Landesbank-Holding 74.9997% 74.9997%
Austria Beteiligungsgesellschaft mbH 25.0003% 25.0003%
- Landesbank Baden-Württemberg 16.6669%
- Landeskreditbank Baden-Württemberg Förderbank 8.3334%
Share capital 100.0000% 100.0000%
Rating/Moody‘s
Long-term: for liabilities with deficiency guarantee Aaa
for liabilities without deficiency guarantee (as of 2 April 2007) Aa1
Short-term P-1
2007 2008
11,979.613,158.7
Development of total assets(in million EUR)
2007 2008
60,064 50,004
Development of ordinary business results(in ’000 EUR)
Austria 62.0 %
Switzerland/Liechtenstein 8.9 %
Germany 11.9 %
Italy 14.8 %
Other foreign countries 2.4 %
Loans and advances to customers – breakdown by region(in %)
Passionate. Sound. Advice.
Foreword
Managing Board/Supervisory Board
Economic environment
Management report
Financial Statements (IFRS)
Branch offices/Subsidiaries
Foreword by the Managing Board
Organisational chart
Managing Board/Supervisory BoardManaging BoardAdvisory Board
Economic environment
Questions to Jodok Simma, CEO and Chairman Managing Board
Questions to Johannes Hefel, Managing Board Private Customer, Private Banking, Portfolio and Asset Management
Questions to Michael Grahammer, Managing Board Risk Management, Leasing and Real Estate
Management reportDevelopment by segmentMajor subsidiariesOutlook
Business policyHuman resourcesMarketing and Advertising
Consolidated Financial Statements in accordance with International Financial Reporting Standards (IFRS)I. Income statementII. Balance sheetIII. Statement of changes in shareholder’s equityIV. Cash flow statementV. NotesVI. Supervisory BoardVII. Subsidiaries/Holdings
Managing Board declaration
Report of the Supervisory Board
Audit opinion
Branch offices/Subsidiaries
This translation of the original German version of the annualreport has been prepared for the convenience of English-speakingreaders. The German version is authoritative.
Table of Contents
4
6
101012
16
20
22
23
26303639
424244
48
5052535455
126127
128
128
129
130

7
FOR
EW
OR
DM
AN
AG
ING
BO
AR
D/S
UP
ER
VIS
OR
y B
OA
RD
EC
ON
OM
IC E
NV
IRO
NM
EN
TM
AN
AG
EM
EN
T R
EP
OR
TFI
NA
NC
IAL
STA
TE
ME
NT
S (
IFR
S)
BR
AN
CH
OFF
ICE
S/S
UB
SID
IAR
IES
6
Strong roots create a feeling of safety. For 111 years we have remained true to our busi-
ness model. We feel connected to Austria and to our Vorarlberg roots. This consistency
has led to successful development. The stable ownership structure in a globally shifting
market makes us a favorite partner for Vorarlberg businesses as well as a financial anchor
for the populace. Security has never been so modern.

8 9
FOR
EW
OR
DM
AN
AG
ING
BO
AR
D/S
UP
ER
VIS
OR
y B
OA
RD
EC
ON
OM
IC E
NV
IRO
NM
EN
TM
AN
AG
EM
EN
T R
EP
OR
TFI
NA
NC
IAL
STA
TE
ME
NT
S (
IFR
S)
BR
AN
CH
OFF
ICE
S/S
UB
SID
IAR
IES
ForewordForeword
Dear customers, business partners, shareholder representatives and employees,
Behind us lies an exceptional business year, in every respect. We have all witnessed developments that were previously unimaginable in their magnitude and pace. The end of the crisis is not in sight. The following lessons for companies, and this includes banks, are pivotal:
There is no substitute for healthy common senseComputer models with multiple decimal places, based on unsure or past assumptions, create make-believe security. Even supposedly ingenious methods and instruments can fail, even skew the entire system. Technocratic thinking and feasibility studies are no substitute for a professional sense of proportion and common sense. It is also important to keep a cool head, keep an eye on overall interests and not to succumb to impulsive action.
Trees do not grow right up to the skyBusinesses and investors were reminded of this truth again in 2008 in harsh fashion. No economic expansion lasts forever, nor do financial markets always go up. High returns involve high risks. The question of security must always be a theme with monetary investments.
Hypo Landesbank Vorarlberg’s down to earth business model has proven its worth for 111 yearsWe are pleased to present the positive results of Hypo Landesbank Vorarlberg with this annual report. Our figures and our more than 111 year business history confirm that our measured, risk-aware, organic business strategy is the right course, and is why we have grown to be Vorarlberg’s largest bank.
We reached our planned goal of 50 million euros annual profit in spite of the very difficult conditions. Our business model is solid and has proven itself again in turbulent times. Hypo Landesbank Vorarlberg is a safe haven in the banking sector. This is shown by the sharp increase in customer deposits. Our liquidity and equity capital is sufficient and provides us additional security. The trust of our customers – the number one commodity a bank can have – is intact.
We remain consistent with our proven, long-term corporate and investment policies.
Credit volume increased 24.3%The reasons for the above-average growth were the stable economy in the first half of 2008 and, at the same time, the sharp decrease in loan loss provisions. From a total loan volume of over 7.3 billion euros, 70% went to corporate customers. These figures show two things. One, that Hypo Landesbank Vorarlberg is the absolute leading corporate bank in Vorarlberg; three-fourths of the top 100 companies in Vorarlberg have a business relationship with Hypo Landesbank Vorarlberg. And two, these figures show clearly that Hypo Landesbank Vorarlberg is not experiencing the oft-mentioned credit crunch.
Passionate. Sound. Advice.The stable and enduring success of Hypo Landesbank Vorarlberg certainly has to do with our basic principles – to always be committed to our customers and to long-term success. The new focus of our marketing with the slogan “Passionate. Sound. Advice.” brings us closer to our customers and underlines – with heart and head – our commitment to them.
We are giving the highest priority to granting the requests of our customers, even during the financial crisis. In the past year we gained many new customers for the bank. We want to prove, through quality advisory and support services, that they have chosen the right bank. It is essential to continually change the defined standards of customer service so that customers, like banks, ask critical questions concerning which product is right for which customer, and which risk (including emotional risk) a customer is prepared to take on.
Our heartfelt thanks2008 showed us all that trust is the most important commodity a bank can have. We thank our customers, shareholders and business partners for the loyalty that we could count on during these difficult market conditions. Above all we thank our employees for their great dedication and for the excellent results.
The Members of the Managing BoardJodok SimmaJohannes HefelMichael Grahammer
Foreword – Managing Board
Johannes HefelMember Managing Board
Jodok SimmaCEO, Chairman Managing Board
Michael GrahammerMember Managing Board
Foreword
10 11
Foreword
11
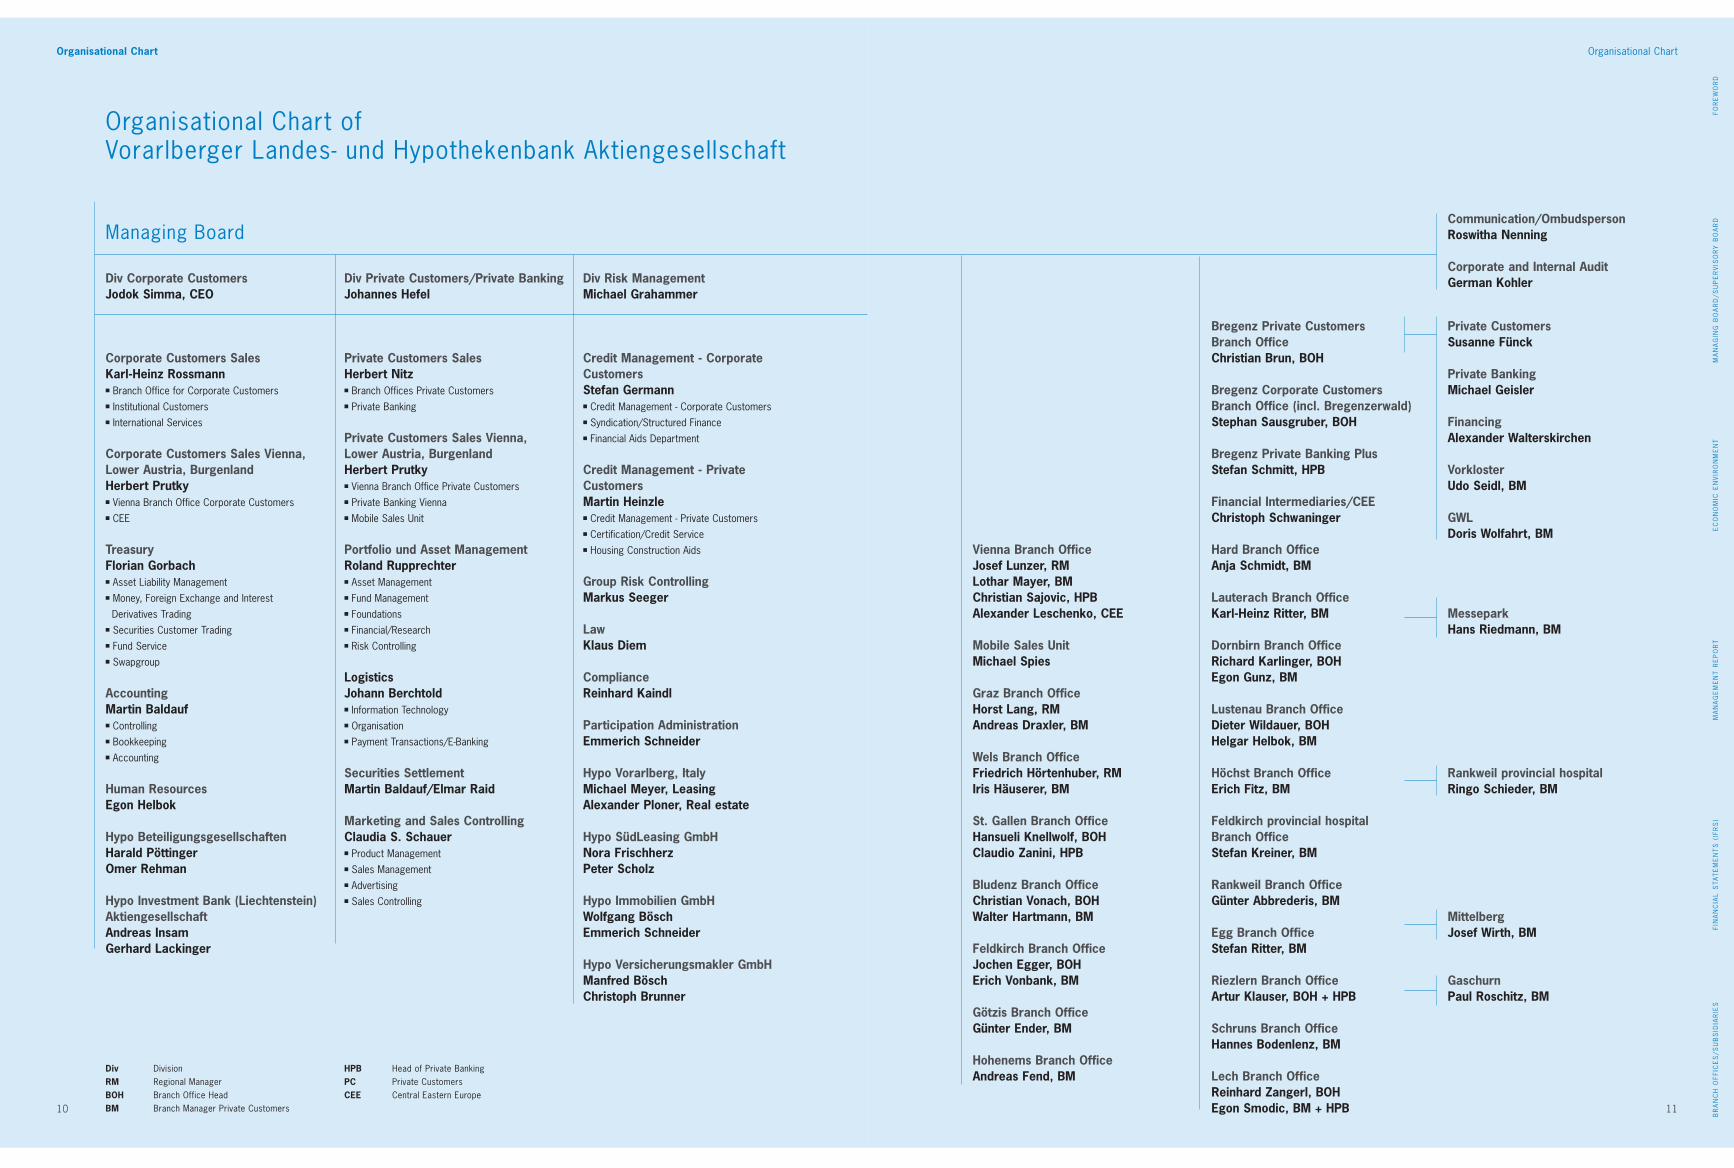
Organisational ChartOrganisational Chart
Managing Board
Div Corporate CustomersJodok Simma, CEO
Corporate Customers SalesKarl-Heinz Rossmann■ Branch Office for Corporate Customers■ Institutional Customers■ International Services
Corporate Customers Sales Vienna,Lower Austria, BurgenlandHerbert Prutky■ Vienna Branch Office Corporate Customers■ CEE
TreasuryFlorian Gorbach■ Asset Liability Management■ Money, Foreign Exchange and Interest
Derivatives Trading■ Securities Customer Trading■ Fund Service■ Swapgroup
AccountingMartin Baldauf■ Controlling■ Bookkeeping■ Accounting
Human ResourcesEgon Helbok
Hypo BeteiligungsgesellschaftenHarald PöttingerOmer Rehman
Hypo Investment Bank (Liechtenstein)AktiengesellschaftAndreas InsamGerhard Lackinger
Div Private Customers/Private Banking Johannes Hefel
Private Customers SalesHerbert Nitz■ Branch Offices Private Customers■ Private Banking
Private Customers Sales Vienna, Lower Austria, BurgenlandHerbert Prutky■ Vienna Branch Office Private Customers■ Private Banking Vienna■ Mobile Sales Unit
Portfolio und Asset ManagementRoland Rupprechter■ Asset Management■ Fund Management■ Foundations■ Financial/Research■ Risk Controlling
LogisticsJohann Berchtold■ Information Technology■ Organisation■ Payment Transactions/E-Banking
Securities SettlementMartin Baldauf/Elmar Raid
Marketing and Sales ControllingClaudia S. Schauer■ Product Management■ Sales Management■ Advertising■ Sales Controlling
Div Risk ManagementMichael Grahammer
Credit Management - Corporate CustomersStefan Germann■ Credit Management - Corporate Customers■ Syndication/Structured Finance■ Financial Aids Department
Credit Management - Private CustomersMartin Heinzle■ Credit Management - Private Customers■ Certification/Credit Service■ Housing Construction Aids
Group Risk ControllingMarkus Seeger
LawKlaus Diem
ComplianceReinhard Kaindl
Participation AdministrationEmmerich Schneider
Hypo Vorarlberg, ItalyMichael Meyer, LeasingAlexander Ploner, Real estate
Hypo SüdLeasing GmbHNora FrischherzPeter Scholz
Hypo Immobilien GmbHWolfgang BöschEmmerich Schneider
Hypo Versicherungsmakler GmbHManfred BöschChristoph Brunner
Div DivisionRM Regional ManagerBOH Branch Office HeadBM Branch Manager Private Customers
HPB Head of Private BankingPC Private CustomersCEE Central Eastern Europe
Communication/OmbudspersonRoswitha Nenning
Corporate and Internal AuditGerman Kohler
Vienna Branch OfficeJosef Lunzer, RMLothar Mayer, BMChristian Sajovic, HPBAlexander Leschenko, CEE
Mobile Sales UnitMichael Spies
Graz Branch OfficeHorst Lang, RMAndreas Draxler, BM
Wels Branch OfficeFriedrich Hörtenhuber, RMIris Häuserer, BM
St. Gallen Branch OfficeHansueli Knellwolf, BOHClaudio Zanini, HPB
Bludenz Branch OfficeChristian Vonach, BOHWalter Hartmann, BM
Feldkirch Branch OfficeJochen Egger, BOHErich Vonbank, BM
Götzis Branch OfficeGünter Ender, BM
Hohenems Branch OfficeAndreas Fend, BM
Organisational Chart ofVorarlberger Landes- und Hypothekenbank Aktiengesellschaft
Bregenz Private CustomersBranch OfficeChristian Brun, BOH
Bregenz Corporate CustomersBranch Office (incl. Bregenzerwald)Stephan Sausgruber, BOH
Bregenz Private Banking PlusStefan Schmitt, HPB
Financial Intermediaries/CEEChristoph Schwaninger
Hard Branch OfficeAnja Schmidt, BM
Lauterach Branch OfficeKarl-Heinz Ritter, BM
Dornbirn Branch OfficeRichard Karlinger, BOHEgon Gunz, BM
Lustenau Branch OfficeDieter Wildauer, BOHHelgar Helbok, BM
Höchst Branch OfficeErich Fitz, BM
Feldkirch provincial hospitalBranch OfficeStefan Kreiner, BM
Rankweil Branch OfficeGünter Abbrederis, BM
Egg Branch OfficeStefan Ritter, BM
Riezlern Branch OfficeArtur Klauser, BOH + HPB
Schruns Branch OfficeHannes Bodenlenz, BM
Lech Branch OfficeReinhard Zangerl, BOHEgon Smodic, BM + HPB
Private CustomersSusanne Fünck
Private BankingMichael Geisler
FinancingAlexander Walterskirchen
VorklosterUdo Seidl, BM
GWLDoris Wolfahrt, BM
MesseparkHans Riedmann, BM
Rankweil provincial hospitalRingo Schieder, BM
MittelbergJosef Wirth, BM
GaschurnPaul Roschitz, BM
FOR
EW
OR
DM
AN
AG
ING
BO
AR
D/S
UP
ER
VIS
OR
y B
OA
RD
EC
ON
OM
IC E
NV
IRO
NM
EN
TM
AN
AG
EM
EN
T R
EP
OR
TFI
NA
NC
IAL
STA
TE
ME
NT
S (
IFR
S)
BR
AN
CH
OFF
ICE
S/S
UB
SID
IAR
IES

13
MA
NA
GIN
G B
OA
RD
/SU
PE
RV
ISO
Ry
BO
AR
DE
CO
NO
MIC
EN
VIR
ON
ME
NT
MA
NA
GE
ME
NT
RE
PO
RT
FIN
AN
CIA
L S
TAT
EM
EN
TS
(IF
RS
)B
RA
NC
H O
FFIC
ES
/SU
BS
IDIA
RIE
S
12
The values we adhere to affect the way others perceive us. This is reflected in our per-
sonal commitment to important topics concerning the future such as energy efficiency,
renewable energy and environmental protection. An extremely low cost-income-ratio,
cost awareness, Austrian efficiency, productivity and a conscientious use of resources
are part of our mindset, and have noticeable effect. We are responsible on all levels – in
our advising with passion and professionalism as well as in our social involvement with
spirit and vision.
14 15
MA
NA
GIN
G B
OA
RD
/SU
PE
RV
ISO
Ry
BO
AR
DE
CO
NO
MIC
EN
VIR
ON
ME
NT
MA
NA
GE
ME
NT
RE
PO
RT
FIN
AN
CIA
L S
TAT
EM
EN
TS
(IF
RS
)B
RA
NC
H O
FFIC
ES
/SU
BS
IDIA
RIE
S
Managing Board/Supervisory Board
Managing Board
Jodok SimmaCEO, Chairman Managing Board Bregenz
Johannes HefelMember Schwarzach
Michael GrahammerMember Dornbirn
Supervisory Board
Kurt RuppChairmanChairman Managing Board (retired), Bregenz
Norbert MetzlerDeputy Chairman Management Consultant, Alberschwende
Christian BrandCEO of Landeskreditbank, Baden-Württemberg Förderbank, Karlsruhe
Albert BücheleAgriculturist, Hard
Elmar GeigerManaging Director of EHG-Stahlzentrum-West, Dornbirn
Herbert HagerManaging Director of Vorarlberger Medienhaus, Schwarzach
Michael HornDeputy CEO of Landesbank Baden-Württemberg, Stuttgart
Rainer KeckeisDirector of Chamber of Labour Vorarlberg, Feldkirch (until 18 June 2008)
Christian KonzettLawyer, Bludenz
Elke KroisenbrunnerLawyer, Dornbirn (until 18 June 2008)
Klaus MartinProvincial Official (retired), Feldkirch (since 19 June 2008)
Nicolas StiegerLawyer, Bregenz (since 19 June 2008)
Bernhard EggerWorks Council Delegate
Bernhard KöbWorks Council Delegate
Elmar KöckWorks Council Delegate
Veronika MoosbruggerWorks Council Delegate
Rudolf WüstnerWorks Council Delegate
State Commissioner
Gabriele Petschinger
Josef Nickerl Deputy
Escrow Agents
Martin BertelHead of Court, Bregenz
Heinz BildsteinDeputyPresident of the Provincial Court, Feldkirch
Managing Board/Supervisory Board

16 17
EC
ON
OM
IC E
NV
IRO
NM
EN
TM
AN
AG
EM
EN
T R
EP
OR
TFI
NA
NC
IAL
STA
TE
ME
NT
S (
IFR
S)
BR
AN
CH
OFF
ICE
S/S
UB
SID
IAR
IES
Managing Board/Supervisory Board
Advisory Board
Herbert SausgruberChairmanProvincial Governor, Höchst
Hans Dietmar SauerDeputy ChairmanRetired Chairman Managing Board, Karlsruhe
Werner AbbrederisManaging Director of GIKO Verpackungen AG, Weiler
Fritz AmannChairman of the Parliamentary Group of the Austrian Freedom Party, Fraxern
Gerhart BachmannPresident Vorarlberg Dental Chamber, Feldkirch
Wilfried BerchtoldMayor, President of the Association of Municipalities of Vorarlberg, Feldkirch
Hubert BertschPresident, Vorarlberg Industrial AssociationConsul of The NetherlandsManaging Director of Bertsch Holding GmbH, Bludenz
Ernst BitscheManaging Director of Erne Fittings GmbH, Schlins
Herbert BlumManaging Director of Julius Blum GmbH, Höchst
Martin DechantChairman, Junior Chamber VorarlbergManaging Director of ikp Vorarlberg PR & Lobbying GmbH, Dornbirn
Guntram DrexelManaging Director of ASPIAG Management AG, St. Margrethen Switzerland
Rudi FeursteinDean, University of Applied Sciences Vorarlberg, Dornbirn
Gerald FleischManaging Director of Vorarlberger Krankenhaus-Betriebsges.m.b.H., Dornbirn
Georg FrühCFO of Alpla Werke Alwin Lehner GmbH & Co KG, Hard
Rainer GögeleChairman of the Parliamentary Group of the Austrian Conservative Party, Mäder
Hans-Dieter GrabherMayor, Lustenau
Heinz HämmerleEntrepreneur, Lustenau
Hubert HämmerlePresident of the Chamber of Labour, Lustenau
Gebhard HalderPresident of the Provincial Parliament, Bregenz-Fluh
Anton HallerHotelier, Mittelberg
Dietmar HefelCEO of Hefel Textil AG, Schwarzach
Josef HuberManaging Director of Huber Invest GmbH, Götzis
Nivard HuberAdministrator of the Monastery of Mehrerau, Bregenz
Robert JanschekManaging Director of Walter Bösch KG, Lustenau
Siegfried JaschinskiChairman of the Managing Board of Landesbank Baden-Württemberg, Stuttgart
Walter KlausEntrepreneur, Klaus
Urs-Peter KollerEntrepreneur, Gossau
Oswin LängleManaging Director of Anton Längle KG, Götzis
Wilfried LenzTax Advisor and Auditor, Dornbirn
Markus LinhartMayor, Bregenz
Hans-Peter LorenzManaging Director of Vorarlberger gemeinnützige Wohnungsbau- und Siedlungsgesellschaft mbH, Dornbirn
Sepp ManhartPresident of the Bar Association of Vorarlberg,Lawyer, Bregenz
Erhard MeierManaging Director of Meier Verpackungen GmbH, Hohenems
Siegfried MetzlerPresident of the Chamber of Public Accountants in Vorarlberg, Dornbirn
Egon MohrProvincial Official, Wolfurt
Josef MoosbruggerPresident of the Chamber of Agriculture, Dornbirn
Lothar NatauPresident of the Administrative Council of Glessmann AG, Wittenbach
Johannes RauchChairman of the Parliamentary Group of the Austrian Green Party, Rankweil
Hubert RhombergChairman, young Industry VorarlbergManaging Director of Rhomberg Gruppe, Bregenz
Michael RitschChairman of the Parliamentary Group of the Austrian Social-democratic Party, Bregenz
Karl-Heinz RüdisserMember of the Provincial Government, Lauterach
Günter SchertlerManaging Director of Schertler-Alge GmbH, Lauterach
Karl SchiemerDirector of the Health Insurance Fund of Vorarlberg, Dornbirn
Hannelore SchneiderHotelier, Lech
Thomas SohmManaging Director of Carini Etiketten GmbH, Lustenau
Werner StrohmaierMayor, Mittelberg
Ludwig SummerCEO of the Illwerke/VKW Group, Bregenz
Eduard TschofenPublic Accountant, Feldkirch
Ingrid WieseneggerManaging Director of Scheyer Verpackungstechnik GmbH, Klaus
Peter WößPresident of the Chamber of Physicians, Rankweil
Managing Board/Supervisory Board
MA
NA
GIN
G B
OA
RD
/SU
PE
RV
ISO
Ry
BO
AR
D

19
MA
NA
GE
ME
NT
RE
PO
RT
FIN
AN
CIA
L S
TAT
EM
EN
TS
(IF
RS
)B
RA
NC
H O
FFIC
ES
/SU
BS
IDIA
RIE
S
18
EC
ON
OM
IC E
NV
IRO
NM
EN
T
Conservative trendsetter – one way to describe Hypo Landesbank Vorarlberg. As a
result of the financial crisis regional banks are enjoying a renaissance. Our unwavering
corporate policies have shown themselves to be valuable and are suddenly “in”. We
finance the local business economy, residential real estate and operate as a partner for
finding mutual solutions for investment. Our new slogan „Passionate. Sound. Advice.“
delivers the message of our professional and ethical commitment to our clients with
renewed clarity.
20 21
EC
ON
OM
IC E
NV
IRO
NM
EN
TM
AN
AG
EM
EN
T R
EP
OR
TFI
NA
NC
IAL
STA
TE
ME
NT
S (
IFR
S)
BR
AN
CH
OFF
ICE
S/S
UB
SID
IAR
IES
Economic environment
World Economy and Euro zoneInflation and recession worries dominated the first half of the year, while the second half was predominately concerned with coping with the escalation of the finan-cial crisis. Developments in the “post-Lehman-age”, after the bankruptcy of the US investment firm Lehman Brothers in September, wrote new history in capital markets. Several times central banks secured the abi-lity of money markets to function by injecting billions in liquidity to ward off threatened liquidity shortages. This led to abnormal massive fluctuations in the money markets. The first institution to fall victim was the US investment firm Bear Stearns. Other institutions were rescued by government intervention or survived through hostile takeovers or mergers.
In the aftermath of the real estate crisis and its con-sequences, the USA lost its position as flagship of the world economy. The emerging markets – especially China – filled the demand and prevented an even greater decline. The International Monetary Fund (IMF) lowered its prognosis for world economic growth in 2008 to 3.70%. The revised outlook for 2009 is 1.50%. Accor-ding to IMF definitions, economic growth under 3.0% is considered recession.
The economic engines of the Euro zone (Germany, France) began to sputter, especially in the second half of the year. Previously Italy and Spain had exhibited recession tendencies. One after another the large eco-nomic blocks posted negative GNP growth. Not only the macro-economic data (e.g. industrial production) fell to its knees, but also mood indicators which showed a dive in consumer confidence. Almost without exception, surveys of large firms and industries reported new lows. At the end of the year concern that the automobile industry, which has been especially affected by the crisis, would be able to survive made the situation even more precarious.
AustriaEconomic performance contracted in the fourth quarter 2008 in Austria also, although not as severely as in the USA and the largest national economies of the EU. Due to reduction in international demand, the export industries in Austria were especially affected. Real economic growth in Austria in 2008 was 1.8%, slightly higher than neighbouring countries Switzerland (1.6%) and Germany (1.3%) and considerably stronger than the prognosis for the Euro zone (0.8%). Consumer price developments in Austria (3.2%) were clearly above the comparison values for bordering countries Switzerland (2.4%) and Germany (2.6%). The savings ratio of pri-vate households (as percentage of disposable income) in Austria (10.8%) was higher than the savings ratio for Germany (10.5%) but below the Swiss (12.0%). Double-digit savings ratios are not only notably higher in comparison to the rest of the world, but also to fellow members of the EU. (Source: WIFO - Austrian Institute for Economic Development). The most recent WIFO test of the economy indicated a further weakening in industry in the first quarter 2009. The labour market responded in February 2009 with an increase in unem-ployment and a reduction in job positions.
VorarlbergThe economic barometer in Vorarlberg has not been this low for years. The important parameters such as business outlook, volume of orders and expectations for the coming six months are predominantly negative. The results of an economic survey in the last quarter 2008 clearly showed that the international financial and eco-nomic crisis has also effected industry in Vorarlberg.47 firms, with a total of 21,004 employees, took part in the survey which is carried out quarterly by the In-dustriellenvereinigung (an industrial association) and the Vorarlberg Chamber of Commerce. 16% of the respondents reported poor business conditions in the fourth quarter 2008, 70% reported no change and only 14% reported positive business conditions. This corresponds to a reduction in the balance figure of 17%, from 16% in the third quarter to -1% currently. Even more pessimistic is the business prognosis for the next six months: 53% of respondents are convinced that the business situation will remain the same, 47% expect the situation to get worse by the middle of 2009.
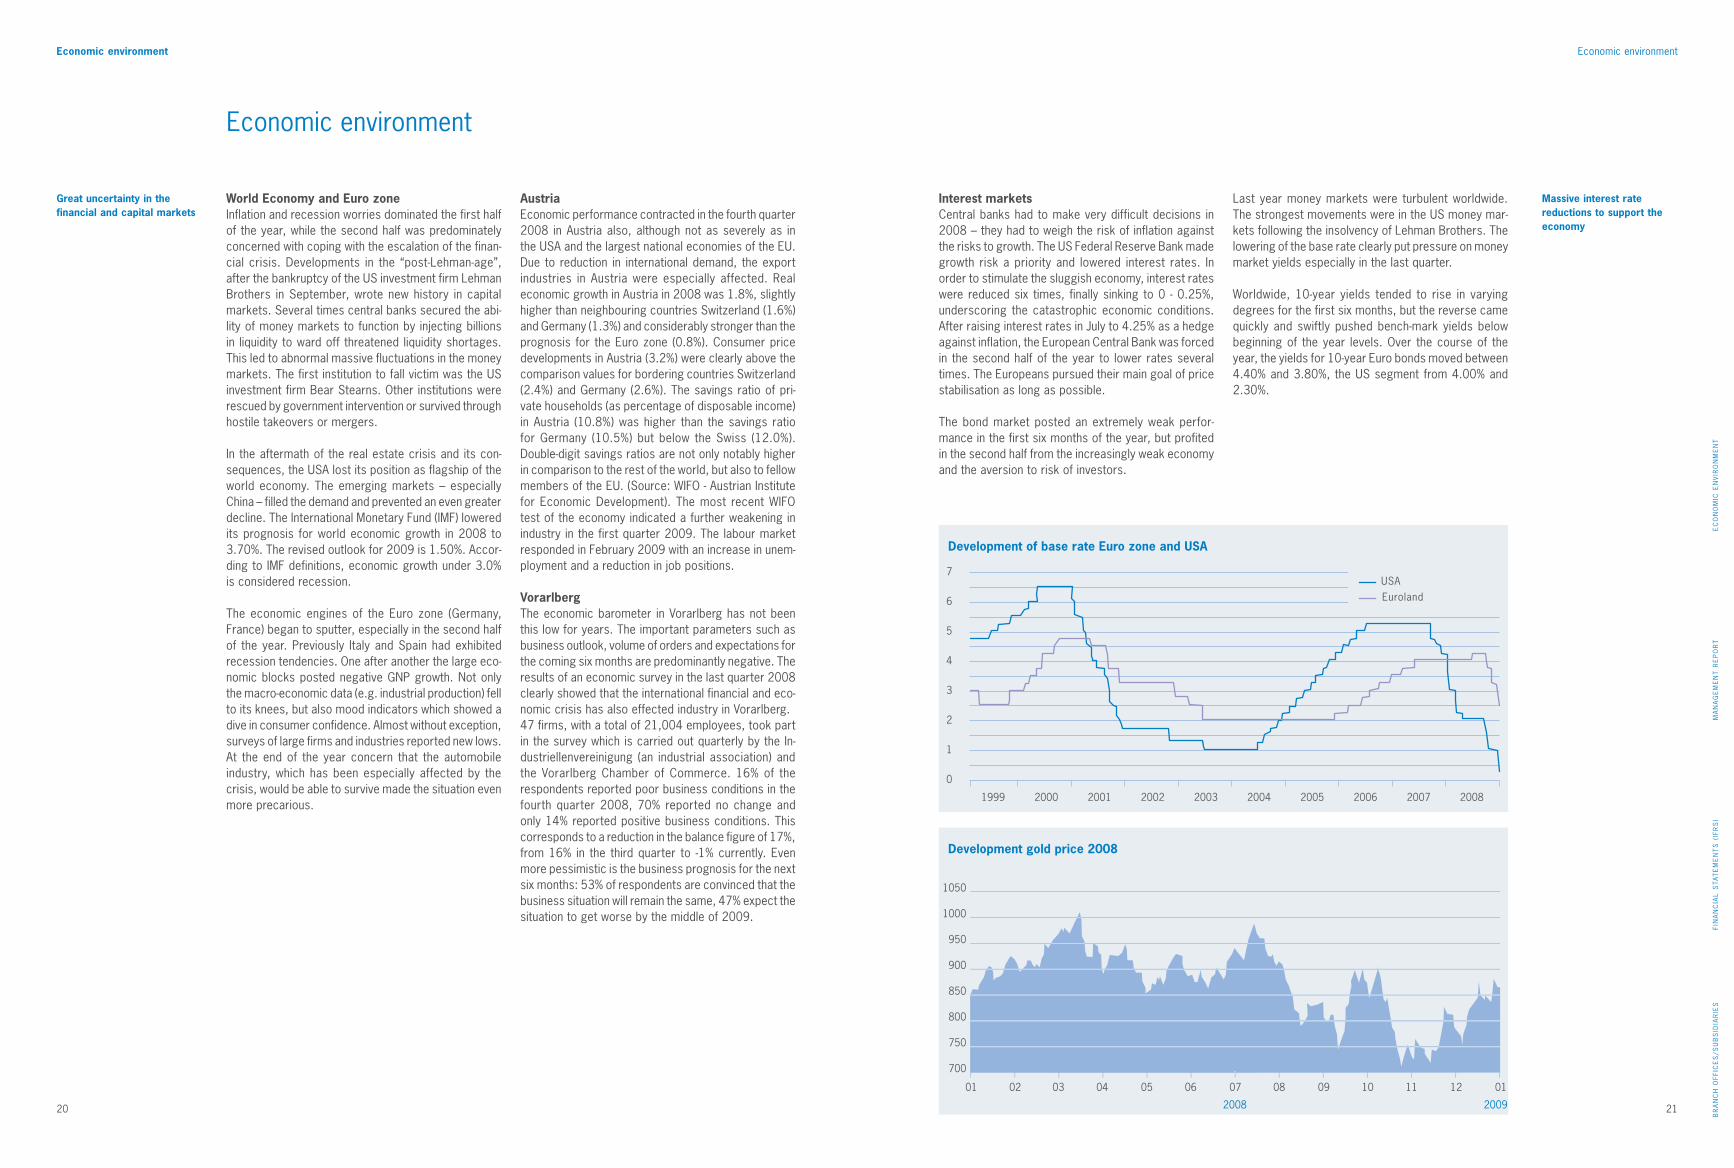
Last year money markets were turbulent worldwide. The strongest movements were in the US money mar-kets following the insolvency of Lehman Brothers. The lowering of the base rate clearly put pressure on money market yields especially in the last quarter.
Worldwide, 10-year yields tended to rise in varying degrees for the first six months, but the reverse came quickly and swiftly pushed bench-mark yields below beginning of the year levels. Over the course of the year, the yields for 10-year Euro bonds moved between 4.40% and 3.80%, the US segment from 4.00% and 2.30%.
Economic environment
Economic environment
7
6
5
4
3
2
1
0
1999 2000 2001 2002 2003 2004 2005 2006 2007 2008
EurolandUSA
Development of base rate Euro zone and USA
01 02 03 04 05 06 07 08 09 10 11 12 01
1050
1000
950
900
850
800
750
700
2008 2009
Development gold price 2008
Interest marketsCentral banks had to make very difficult decisions in 2008 – they had to weigh the risk of inflation against the risks to growth. The US Federal Reserve Bank made growth risk a priority and lowered interest rates. In order to stimulate the sluggish economy, interest rates were reduced six times, finally sinking to 0 - 0.25%, underscoring the catastrophic economic conditions. After raising interest rates in July to 4.25% as a hedge against inflation, the European Central Bank was forced in the second half of the year to lower rates several times. The Europeans pursued their main goal of price stabilisation as long as possible.
The bond market posted an extremely weak perfor-mance in the first six months of the year, but profited in the second half from the increasingly weak economy and the aversion to risk of investors.
Great uncertainty in the financial and capital markets
Massive interest rate reductions to support the economy
22 23
EC
ON
OM
IC E
NV
IRO
NM
EN
TM
AN
AG
EM
EN
T R
EP
OR
TFI
NA
NC
IAL
STA
TE
ME
NT
S (
IFR
S)
BR
AN
CH
OFF
ICE
S/S
UB
SID
IAR
IES
Economic environment
Currencies
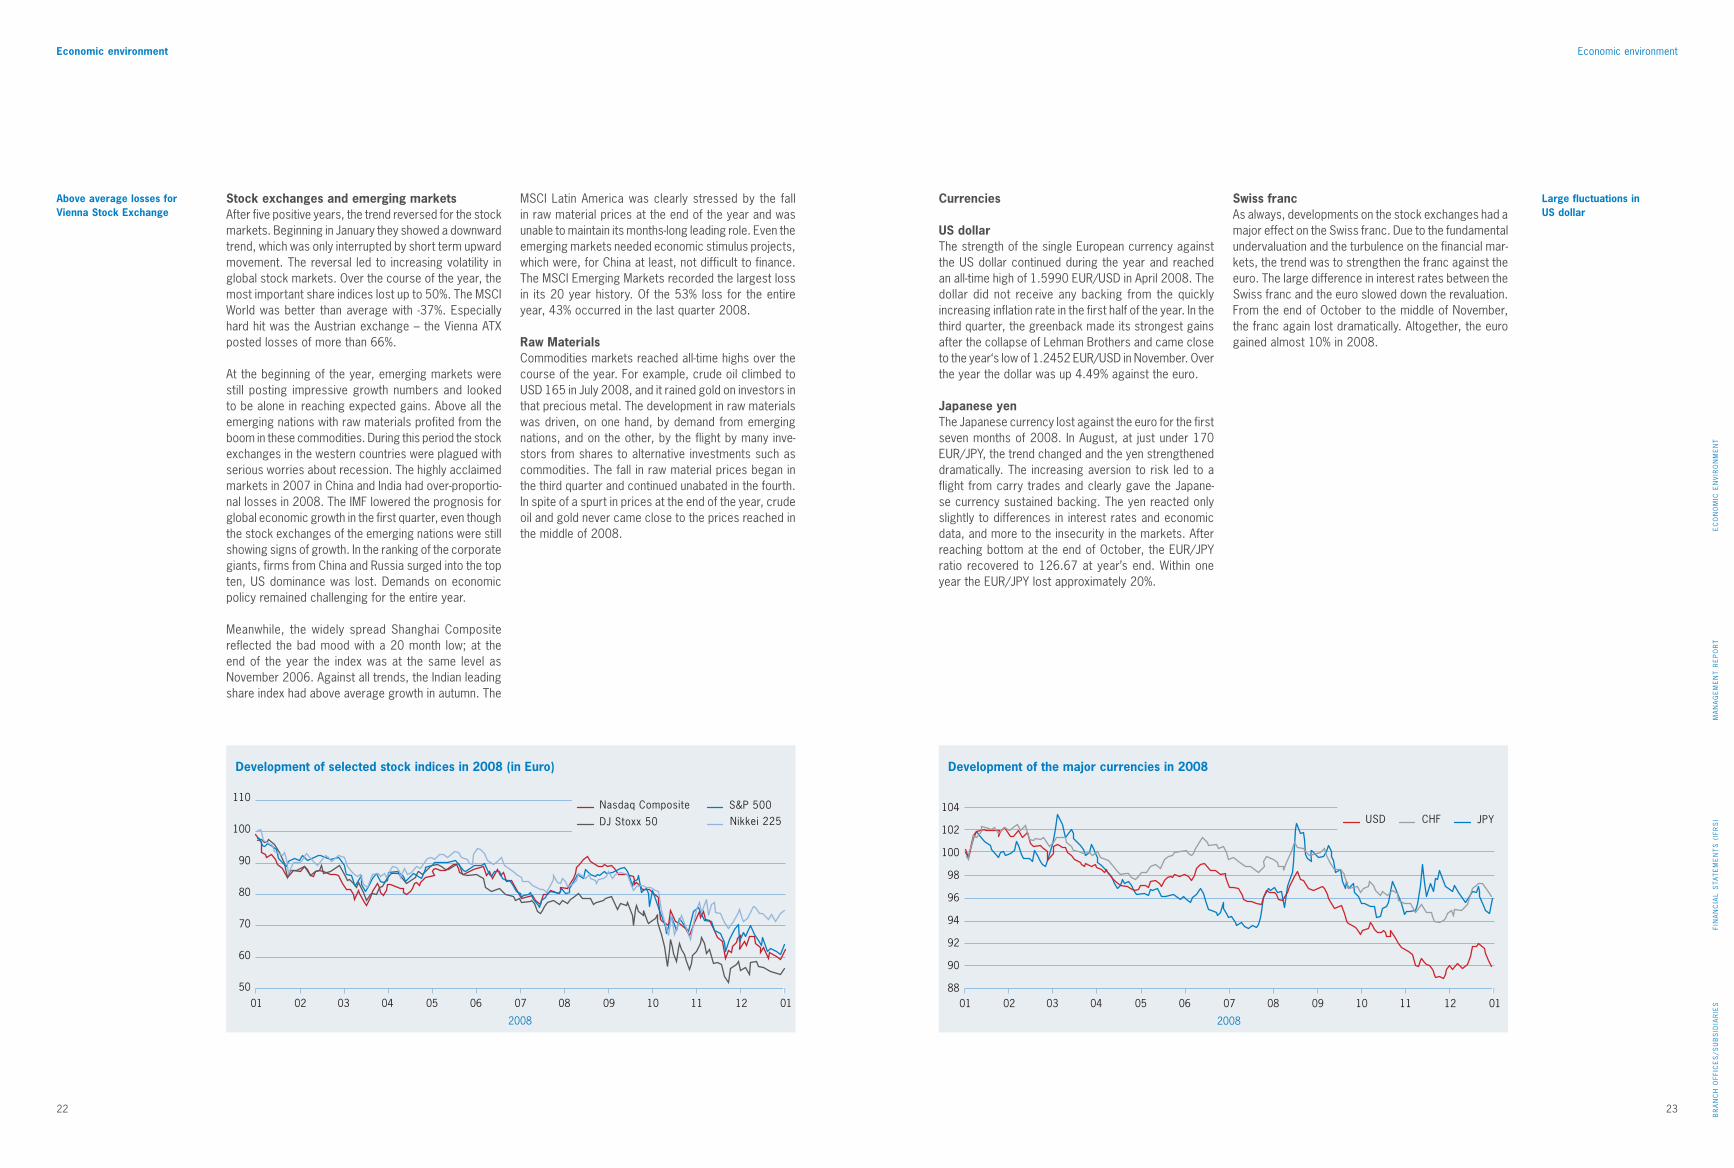
US dollarThe strength of the single European currency against the US dollar continued during the year and reached an all-time high of 1.5990 EUR/USD in April 2008. The dollar did not receive any backing from the quickly increasing inflation rate in the first half of the year. In the third quarter, the greenback made its strongest gains after the collapse of Lehman Brothers and came close to the year‘s low of 1.2452 EUR/USD in November. Over the year the dollar was up 4.49% against the euro.
Japanese yenThe Japanese currency lost against the euro for the first seven months of 2008. In August, at just under 170 EUR/JPy, the trend changed and the yen strengthened dramatically. The increasing aversion to risk led to a flight from carry trades and clearly gave the Japane-se currency sustained backing. The yen reacted only slightly to differences in interest rates and economic data, and more to the insecurity in the markets. After reaching bottom at the end of October, the EUR/JPy ratio recovered to 126.67 at year’s end. Within one year the EUR/JPy lost approximately 20%.
Swiss francAs always, developments on the stock exchanges had a major effect on the Swiss franc. Due to the fundamental undervaluation and the turbulence on the financial mar-kets, the trend was to strengthen the franc against the euro. The large difference in interest rates between the Swiss franc and the euro slowed down the revaluation. From the end of October to the middle of November, the franc again lost dramatically. Altogether, the euro gained almost 10% in 2008.
Stock exchanges and emerging marketsAfter five positive years, the trend reversed for the stock markets. Beginning in January they showed a downward trend, which was only interrupted by short term upward movement. The reversal led to increasing volatility in global stock markets. Over the course of the year, the most important share indices lost up to 50%. The MSCI World was better than average with -37%. Especially hard hit was the Austrian exchange – the Vienna ATX posted losses of more than 66%.
At the beginning of the year, emerging markets were still posting impressive growth numbers and looked to be alone in reaching expected gains. Above all the emerging nations with raw materials profited from the boom in these commodities. During this period the stock exchanges in the western countries were plagued with serious worries about recession. The highly acclaimed markets in 2007 in China and India had over-proportio-nal losses in 2008. The IMF lowered the prognosis for global economic growth in the first quarter, even though the stock exchanges of the emerging nations were still showing signs of growth. In the ranking of the corporate giants, firms from China and Russia surged into the top ten, US dominance was lost. Demands on economic policy remained challenging for the entire year.
Meanwhile, the widely spread Shanghai Composite reflected the bad mood with a 20 month low; at the end of the year the index was at the same level as November 2006. Against all trends, the Indian leading share index had above average growth in autumn. The
MSCI Latin America was clearly stressed by the fall in raw material prices at the end of the year and was unable to maintain its months-long leading role. Even the emerging markets needed economic stimulus projects, which were, for China at least, not difficult to finance. The MSCI Emerging Markets recorded the largest loss in its 20 year history. Of the 53% loss for the entire year, 43% occurred in the last quarter 2008. Raw MaterialsCommodities markets reached all-time highs over the course of the year. For example, crude oil climbed to USD 165 in July 2008, and it rained gold on investors in that precious metal. The development in raw materials was driven, on one hand, by demand from emerging nations, and on the other, by the flight by many inve-stors from shares to alternative investments such as commodities. The fall in raw material prices began in the third quarter and continued unabated in the fourth. In spite of a spurt in prices at the end of the year, crude oil and gold never came close to the prices reached in the middle of 2008.
Large fluctuations in US dollar
Economic environment
01 02 03 04 05 06 07 08 09 10 11 12 01
110
100
90
80
70
60
50
2008
Nikkei 225DJ Stoxx 50
Nasdaq Composite S&P 500
Development of selected stock indices in 2008 (in Euro)
01 02 03 04 05 06 07 08 09 10 11 12 01
104
102
100
98
96
94
92
90
88
2008
CHFUSD JPY
Development of the major currencies in 2008
Above average losses for Vienna Stock Exchange

24 25
EC
ON
OM
IC E
NV
IRO
NM
EN
TM
AN
AG
EM
EN
T R
EP
OR
TFI
NA
NC
IAL
STA
TE
ME
NT
S (
IFR
S)
BR
AN
CH
OFF
ICE
S/S
UB
SID
IAR
IES
Questions to Jodok Simma
Assessment of the business year 2008?Hypo Landesbank Vorarlberg ended the 2008 business year with group results of EUR 50 million. This corre-sponds exactly to plan and is an impressive indication that our mix of profit pillars puts us in an excellent strategic and crisis resistant position.
Both the interest business and low credit risk costs clearly contributed to the positive year end results. Due to growth in volume in lendings and the strong reduction in credit risk costs, net interest income after loan loss provisions increased by 17.5% to EUR 96.7 million. Although net fee and commission income fell by 10.4% due to the market turbulence, it remained at a high level with EUR 41.9 million.
Corporate philosophy and strategy?Over the years, Hypo Landesbank Vorarlberg has posi-tioned itself as a corporate, investment and residential real estate bank and is one of the top regional banks in Austria. We follow a down to earth business policy, speculation was never our business.
The stable and enduring success of Hypo Landesbank Vorarlberg certainly has to do with our basic principles – to always be committed to the customer and to long-term success. We believe in continuity and will stay with our proven, long-term business and credit policies.
We view our entire market area as an “expanded home market”. We are active in Vorarlberg, the Lake Constance region and in Austria as well as selectively in the border areas of Eastern Switzerland, Liechtenstein, Southern Germany, and Northern Italy. We will continue to be on the offensive in our market. Quick decision tak-ing, absolute discretion, fair conditions and the safety and stability of our owners are strong arguments for choosing a banking relationship, especially in difficult financial times.
Hypo Landesbank Vorarlberg self-image as corporate bank?We not only support businesses in financial matters, we also offer a comprehensive pallet: from interest ma-nagement, international services, and support services to solutions for company-specific investment queries. These banking services are complemented by our subsidiaries Hypo-Versicherungsmakler (insurance), Hypo-Immobilien GmbH (real estate), Hypo SüdLeasing GmbH (property leasing), as well as HyPO EQUITy Management AG, specialised in equity capital invest-ments. In addition, the Hypo Academy and the popular semi-annual Hypo breakfast for entrepreneurs have developed into excellent communication platforms. We want to offer our customers added value – particularly in difficult times.
Credit crunch?Loans are being awarded everyday and we have noted healthy competition. There cannot be a credit crunch when customers are able to get loans from several banks. All viable loans are granted and loans that would have been denied before are still denied. Although we are observing a noticeable reduction in requests for loans, there are still many companies that are cautiously but optimistically implementing investment plans.
From a total lending volume of EUR 7.3 billion, 70% went to corporate customers. These figures prove two things. The first is that Hypo Landesbank Vorarlberg is the leading corporate bank in Vorarlberg; three-fourths of the top 100 businesses in Vorarlberg have a relation-ship with us. And secondly, these figures show clearly that Hypo Landesbank Vorarlberg is not experiencing the oft-mentioned credit crunch.
Economic crisis?Every crisis contains opportunities. A crisis forces the choice between the essential and the non-essential. Nice to do becomes need to do. Nice to have becomes need to have.
A crisis means questioning habits and this can be a great opportunity. A crisis means decision making and implementation. The results count more. A crisis – whether business or private – pulls people out of the comfort zone. But this is also very important: in a crisis real leaders show themselves and this is now required of us on the Managing Board as well as our executive team. It has fallen to us to make strategic decisions and goals to meet the new conditions.
Committed to long-term success
Questions to Jodok Simma CEO, Chairman Managing Board
Questions to Jodok Simma
Outlook for the business year 2009?An exact prognosis for the current year is difficult. We consider the outlook in our region to be positive com-pared to other countries and regions. In accordance with plans we will be decelerating growth in total assets and systematically reallocating resources into loans and advances to customers in our core markets.
Our bank will continue to be confronted with uncertain-ties from the financial crisis and the threat of recession. Against that background, 2009 has begun on a some-what muted note. We anticipate results for 2009 to be lower than the 2008 results if loan loss provisions rise substantially and adjustments become necessary.
Curriculum Vitae Jodok Simma
Jodok Simma (62), CEO and Chair-man of the Board, has been a member of the Managing Board of Hypo Landesbank since 1975. After his commercial science studies at the Vienna University of Business Administration, Mr. Simma began his career in the accounting depart-ment of Girozentrale in Vienna. In 1980, he was appointed Deputy Chairman of the bank’s Board, becoming Chairman of the Board in 1997. Jodok Simma has been Section Representative and thus Spokesman for all banks and insu-rance companies in Vorarlberg since 2000. Until 2006, he served as President of the Association of the Austrian Landes-Hypotheken-banken for two terms. Besides ser-ving as Spokesman for the Board, Jodok Simma is also the head of the departments Corporate Custo-mers Sales, Treasury, Accounting, Human Resources, the Hypo Invest-ment Bank (Liechtenstein) AG, and the associated companies HUBAG and HEMAG.

26 27
EC
ON
OM
IC E
NV
IRO
NM
EN
TM
AN
AG
EM
EN
T R
EP
OR
TFI
NA
NC
IAL
STA
TE
ME
NT
S (
IFR
S)
BR
AN
CH
OFF
ICE
S/S
UB
SID
IAR
IES
Questions to Johannes Hefel Questions to Michael Grahammer
Questions to Johannes Hefel, Managing Board Private Customer, Private Banking, Portfolio and Asset Management
Questions to Michael Grahammer, Managing Board Risk Management, Leasing and Real Estate
Curriculum VitaeJohannes Hefel
Johannes Hefel (51) has been a member of the Board of the Bre-genz-based Vorarlberger Landes- und Hypothekenbank AG since 1997. His responsibilities include the departments Private Custo-mer Sales, Private Banking, and Portfolio and Asset Management. He previously worked as financial analyst and asset manager, and as a business consultant and manage-ment trainer in Liechtenstein and Frankfurt am Main. In 1982, he con-cluded his business management studies with a Master’s degree, and went on to obtain a doctoral degree in economic and social sciences in 1985.
Curriculum VitaeMichael Grahammer
Michael Grahammer (43) was appointed member of the Board of Hypo Landesbank Vorarlberg as of 1 July 2004, and is respons-ible for Risk Management, Leasing, Real Estate, Legal Matters, and Equity Companies. After having obtained his doctoral degree in commercial sciences (Vienna Uni-versity of Business Administration), Mr. Grahammer began his career in 1993 as country adviser and team leader for Africa and Asia at Raiffeisen Zentralbank AG. In 1997, he became the head of the Risk Man-agement department of Raiffeisen-bank in the Czech Republic, and was appointed member of its Managing Board in 1999. In 2000, Vorarl-berg-born Grahammer returned to his home province, where he was appointed Regional Director of the commercial business of Erste Bank der Österreichischen Sparkassen AG. In late 2001, Mr. Grahammer changed to Hypo Landesbank Vorarl-berg, where he was put in charge of the leasing department.
Developments in Private Customer Sector in 2008?Lendings to Private Customers grew to EUR 1,491.4 million, more than double the amount in 2000. We plan to build on our position as a construction financing bank this year. With the Hypo-Klima-Kredit, the Hypo-Lebenswert-Kredit and the Hypo-Generationen-Kredit, we have an especially interesting range of products.
Developments in customer funds?Throughout 2008, and especially after the financial crisis intensified, Hypo Landesbank Vorarlberg noted a large inflow of customer funds. Savings deposits grew by 28.4% to EUR 1,407.7 million. In total, customer deposits increased by 21.1% to just under EUR 4 bil-lion. This inflow underlines the trust customers have in Hypo Landesbank Vorarlberg. Special-interest savings books were especially popular in 2008.
Hypo Landesbank Vorarlberg among top 5 Austrian private banksHypo Landesbank Vorarlberg was able to further strengthen its excellent position as an investment bank in Vorarlberg and Austria. Our standings in both the “Fuchsbriefe Report” and the “Elite Report” underscore the excellent quality of Hypo Landesbank Vorarlberg. We are the only bank to be ranked among the top five investment banks in Austria in both reports.
In 2008, the Hypo-Weltdepot Dynamik Aktien fund of funds, an asset management strategy with value protection first introduced in 2004, proved its value during a difficult year for the markets. The shares were systematically reduced to zero.
New asset management strategy Hypo-Weltdepot Dynamik AnleihenWith Hypo-Weltdepot Dynamik Anleihen, a bond fund, the bank has successfully found a fitting and quick answer to changing market conditions. In the five months from its start on 1 August 2008 to the end of the year, the asset management strategy reached a performance of 4.92% (11.8% annualised). This entails an asset management strategy with active duration controls – a bond strategy that can profit from both rising and falling interest rates equally.
Outlook for 2009?The investment area will continue to be uncertain in 2009. High on our list of priorities for our customers is the need for close supervision and counselling and we are making customer support a main focus in 2009. We understand that due to the current market conditions it will take time to rebuild customer trust in financial markets. Our advisory service will concentrate on com-municating our long-term investment philosophy as well as consistent attention to safeguarding assets.
It is certain that we will have – based on a record level – a worldwide decline in economic growth as well as decidedly lower profits from corporations. At the same time there is the danger of deflation as well as the threat from massive national debt in many countries due to economic stimulation measures.
What do you recommend to investors? We are current experiencing a situation that has not occurred for several generations, something like “driv-ing in fog”. Investors must proceed carefully, be well informed and use common sense. What is on offer? A relatively large part should be in a savings account. I recommend investing another part in short to middle-term bonds from bond issuers with excellent credit ratings. And up to 10% of the investment should be in gold, a recommendation the bank has been making for years, in preparation for the current market situ-ation. With gold investments it makes sense to take advantage of temporary price fluctuations in the gold position. A portion of the investment can also be put in shares, when the investor has the patience and the nerves. The handling of money was and remains con-servative at Hypo Landesbank Vorarlberg. Great value is placed on security – very positive for customers in these turbulent times.
Appraisal of 2008 from the risk side?From a risk management perspective, 2008 was a challenging year. In particular were the questions con-cerning which risks exist and how can the bank maintain an optimal chance-risk-ratio in terms of sustainable growth even under changing conditions. Among other measures, we do a risk bearing ability calculation every month.
Loan loss provisions were notably reduced and are in relation to lending volume at an historic low. Traditional-ly we have practised a conservative loan loss provisions policy. In parallel we were able to further improve the quality of our credit portfolios.
It has become evident that the organisational changes implemented over the last few years (centralised corporation-level bank risk management, enhanced credit management) were timely and proper steps in response to the new requirements for professional, comprehensive bank risk management.
Priority for 2008 – EnergyA priority for 2008 was environmental protection and support for renewable energy. With over EUR 260 million in energy saving and energy optimising invest-ments, we recognise a strong demand for this type of financing. Energy efficiency is essential in our own construction projects also. Through renovations in our new headquarters we have been able to halve energy costs. The Hypo Office in Dornbirn was conceived as an ultra-low energy project and is the first office building in Vorarlberg to be enlarged and renovated to Passive House standards.
Highlight: Headquarters reopening 17 October 20082008 was a special year for anniversaries and in-vestments in the 111 history of Hypo Landesbank Vorarlberg. With an investment of EUR 16.5 million, our headquarters has been expanded and modernised to offer our customers and our advisors the best possible support facilities.
Hypo subsidiaries under one roofHypo Immobilien GmbH, a subsidiary of Hypo Lan-desbank Vorarlberg, as developer of the Hypo Office Dornbirn project, proposed bringing several Hypo sub-sidiaries with know-how in real estate, insurance and leasing under one roof to provide one stop shopping for clients. The central location with excellent transport connections was a factor in the concept. Currently the Hypo Office Dornbirn has 141 workstations, 61 of these for employees of Hypo subsidiaries. This gives us the ideal conditions to create synergy in the real estate, leasing, insurance and banking areas and to offer tailor made, comprehensive support to our customers, thus giving them the assurance that they have found the optimal solution.
Leasing sector?Our leasing business is divided into two subsidiaries: Hypo SüdLeasing GmbH in Austria and in Italy the Hypo Vorarlberg Leasing AG. Together, the subsi-diaries reached a new volume level of over EUR 500 million in 2008. Significantly lower growth is expected in 2009.
Outlook 2009The flattened demand for credit in the first quarter 2009 was the first sign of an economic slowdown. We must therefore be especially careful in recognising and managing credit risk this year. In 2009, many of our corporate customers will need to adapt capacity in time. It is essential in a downturn to safeguard company success. This includes us – in addition to credit risk costs, we need to keep a watchful eye on our own administrative costs (staff and operating expenses).

29
FIN
AN
CIA
L S
TAT
EM
EN
TS
(IF
RS
)B
RA
NC
H O
FFIC
ES
/SU
BS
IDIA
RIE
S
28
MA
NA
GE
ME
NT
RE
PO
RT
Quality goes hand in hand with transparency. Transparency fosters trust. And trust in turn
enhances quality. This is the cycle of healthy growth and the enduring corporate strategy
that Hypo Landesbank Vorarlberg is committed to. Our expansion course is being carried
out selectively and is characterised by sustainable success. We know our customers,
opportunities and limits. And therefore remain transparent and predictable.
30 31
MA
NA
GE
ME
NT
RE
PO
RT
FIN
AN
CIA
L S
TAT
EM
EN
TS
(IF
RS
)B
RA
NC
H O
FFIC
ES
/SU
BS
IDIA
RIE
S
Consolidated management report
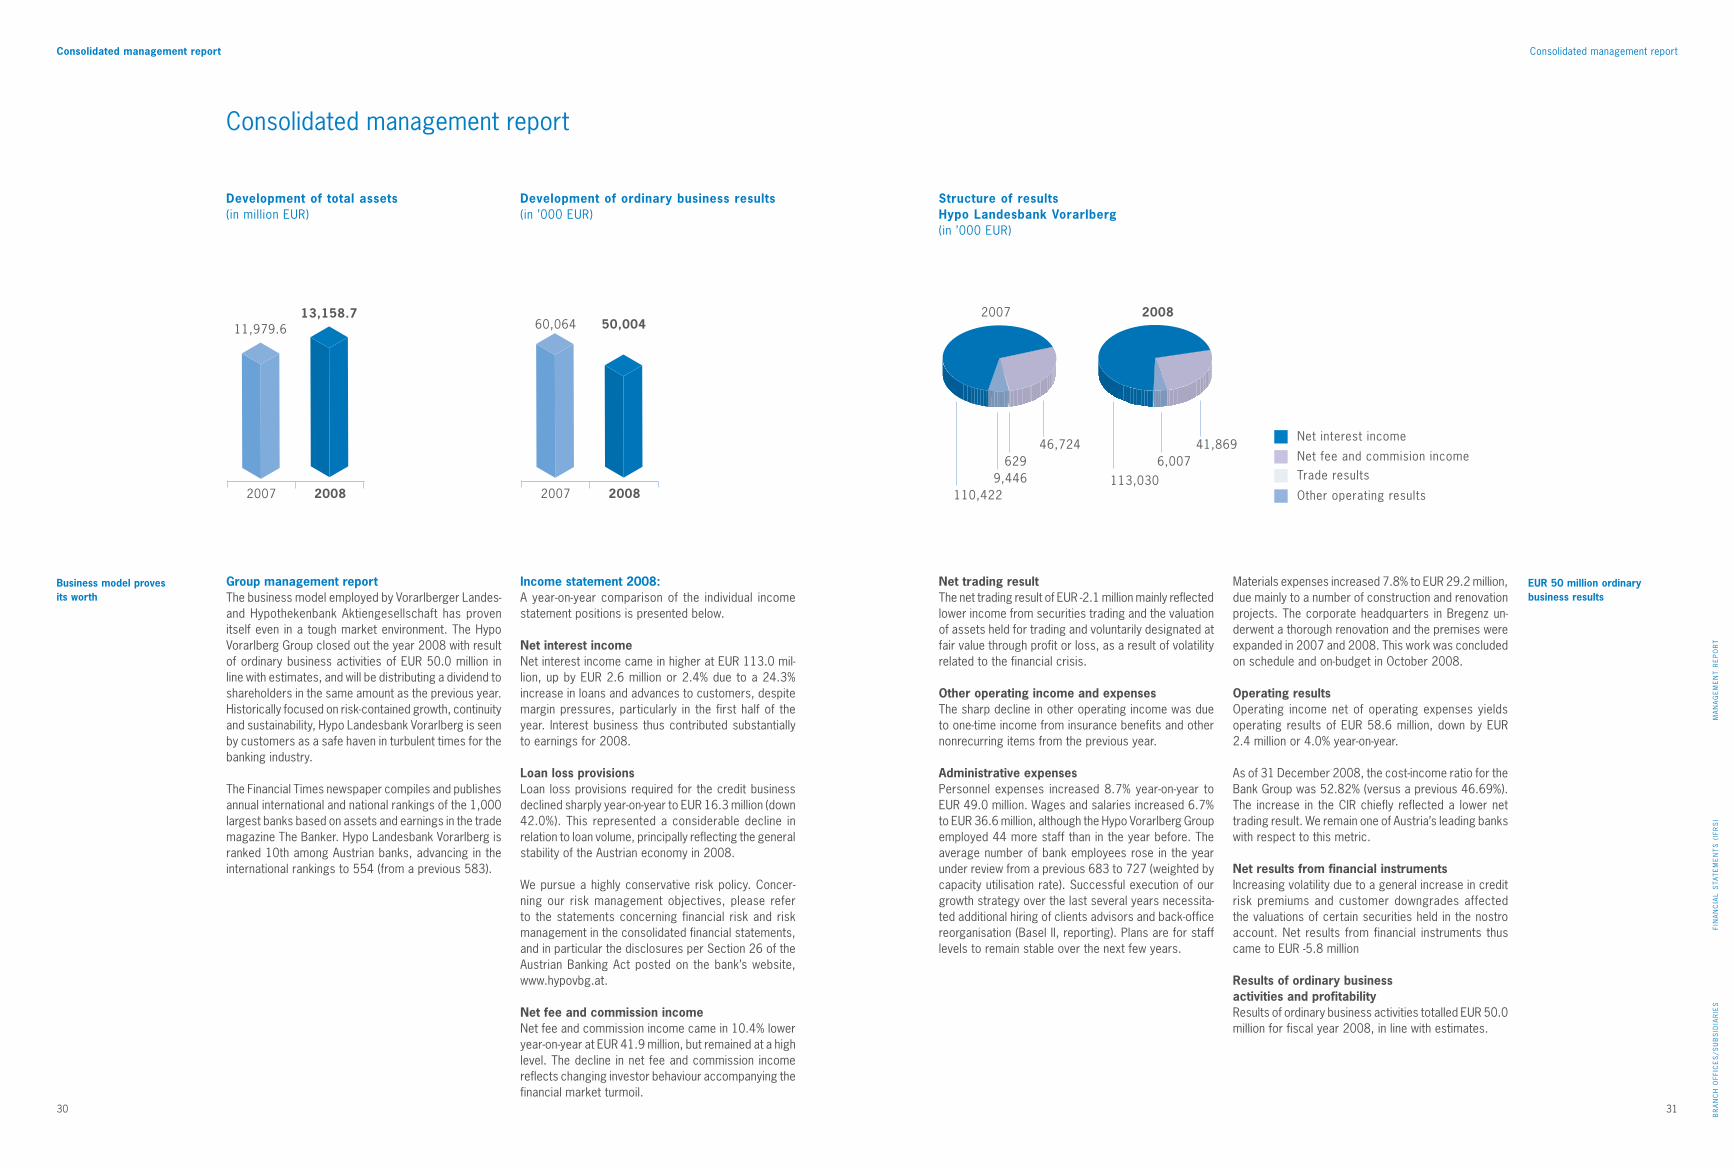
Group management report The business model employed by Vorarlberger Landes- and Hypothekenbank Aktiengesellschaft has proven itself even in a tough market environment. The Hypo Vorarlberg Group closed out the year 2008 with result of ordinary business activities of EUR 50.0 million in line with estimates, and will be distributing a dividend to shareholders in the same amount as the previous year. Historically focused on risk-contained growth, continuity and sustainability, Hypo Landesbank Vorarlberg is seen by customers as a safe haven in turbulent times for the banking industry.
The Financial Times newspaper compiles and publishes annual international and national rankings of the 1,000 largest banks based on assets and earnings in the trade magazine The Banker. Hypo Landesbank Vorarlberg is ranked 10th among Austrian banks, advancing in the international rankings to 554 (from a previous 583).
Income statement 2008:A year-on-year comparison of the individual income statement positions is presented below.
Net interest incomeNet interest income came in higher at EUR 113.0 mil-lion, up by EUR 2.6 million or 2.4% due to a 24.3% increase in loans and advances to customers, despite margin pressures, particularly in the first half of the year. Interest business thus contributed substantially to earnings for 2008.
Loan loss provisionsLoan loss provisions required for the credit business declined sharply year-on-year to EUR 16.3 million (down 42.0%). This represented a considerable decline in relation to loan volume, principally reflecting the general stability of the Austrian economy in 2008.
We pursue a highly conservative risk policy. Concer-ning our risk management objectives, please refer to the statements concerning financial risk and risk management in the consolidated financial statements, and in particular the disclosures per Section 26 of the Austrian Banking Act posted on the bank’s website, www.hypovbg.at.
Net fee and commission incomeNet fee and commission income came in 10.4% lower year-on-year at EUR 41.9 million, but remained at a high level. The decline in net fee and commission income reflects changing investor behaviour accompanying the financial market turmoil.
Net trading resultThe net trading result of EUR -2.1 million mainly reflected lower income from securities trading and the valuation of assets held for trading and voluntarily designated at fair value through profit or loss, as a result of volatility related to the financial crisis.
Other operating income and expensesThe sharp decline in other operating income was due to one-time income from insurance benefits and other nonrecurring items from the previous year.
Administrative expensesPersonnel expenses increased 8.7% year-on-year to EUR 49.0 million. Wages and salaries increased 6.7% to EUR 36.6 million, although the Hypo Vorarlberg Group employed 44 more staff than in the year before. The average number of bank employees rose in the year under review from a previous 683 to 727 (weighted by capacity utilisation rate). Successful execution of our growth strategy over the last several years necessita-ted additional hiring of clients advisors and back-office reorganisation (Basel II, reporting). Plans are for staff levels to remain stable over the next few years.
Materials expenses increased 7.8% to EUR 29.2 million, due mainly to a number of construction and renovation projects. The corporate headquarters in Bregenz un-derwent a thorough renovation and the premises were expanded in 2007 and 2008. This work was concluded on schedule and on-budget in October 2008.
Operating resultsOperating income net of operating expenses yields operating results of EUR 58.6 million, down by EUR 2.4 million or 4.0% year-on-year.
As of 31 December 2008, the cost-income ratio for the Bank Group was 52.82% (versus a previous 46.69%). The increase in the CIR chiefly reflected a lower net trading result. We remain one of Austria’s leading banks with respect to this metric.
Net results from financial instrumentsIncreasing volatility due to a general increase in credit risk premiums and customer downgrades affected the valuations of certain securities held in the nostro account. Net results from financial instruments thus came to EUR -5.8 million
Results of ordinary business activities and profitability Results of ordinary business activities totalled EUR 50.0 million for fiscal year 2008, in line with estimates.
Business model proves its worth
EUR 50 million ordinary business results
Consolidated management report
Consolidated management report
46,724629
9,446110,422
41,869Net interest income
Net fee and commision incomeTrade results
Other operating results
6,007
113,030
2007 2008
2007 2008
11,979.613,158.7
Development of total assets(in million EUR)
2007 2008
60,064 50,004
Development of ordinary business results(in ’000 EUR)
Structure of resultsHypo Landesbank Vorarlberg(in ’000 EUR)

32 33
MA
NA
GE
ME
NT
RE
PO
RT
FIN
AN
CIA
L S
TAT
EM
EN
TS
(IF
RS
)B
RA
NC
H O
FFIC
ES
/SU
BS
IDIA
RIE
S
Consolidated management report
The Bank’s return on equity (ROE) before taxes was 11.16% (previous year: 14.06%). Consolidated net incomeA 55.7% decline in taxes on income to EUR 9.2 million resulted from a Bank audit last year. After deducting minority interests from earnings after taxes, the Hypo Vorarlberg Group reported consolidated net income of EUR 40.4 million (previous year: EUR 38.7 million), a 4.3% rise.
Proposal for profit distribution: Unchanged dividend
The Managing Board cancelled plans to issue new Hypo Landesbank Vorarlberg participation certificates in autumn 2008 in view of the tremendous uncertainty unleashed by the Lehman Brothers bankruptcy.
All outstanding participation certificates were redeemed on 21 November 2008 pursuant to an 18 June 2008 shareholder resolution at a price of EUR 99.00 set 25 November 2008. Upon publication of the redemption resolution, the participation certificates were delisted from the Vienna Stock Exchange and new participation capital with a nominal value of EUR 9 million was placed with the shareholders (Vorarlberger Landesbank-Holding, Landeskreditbank Baden-Württemberg Förderbank).
At the annual meeting of shareholders on 17 June 2009, the Managing Board will propose distributing to Vorarlberger Landesbank-Holding Austria Beteiligungs-gesellschaft mbH (Landesbank Baden-Württemberg and Landeskreditbank Baden-Württemberg Förderbank) and other shareholders dividends totalling EUR 8.79 million on share capital of EUR 150 million. Balance sheet
Group total assets rose 9.8% to EUR 13,158.7 million in fiscal year 2008. Customer business played a signifi-cant part in the growth of total assets, in terms of both assets and liabilities.
On the assets side, loans and advances to customers were up 24.3% to EUR 7,337.5 million, taking into account that compliance with IFRS 7 is mandatory as of 1 January 2007. This standard also requires finan-cial instruments to be shown separately by valuation category as per IAS 39. For this reason, the Group re-classified loans and advances to banks and customers voluntarily designated at fair value through profit or loss in the amount of EUR 684.2 million (2007: EUR 622.9 million) as ‘Financial assets – at fair value’ for fiscal year 2008 and the previous year. This item qualifies and is reportable as loans and advances to customers.
The increase in loans and advances to customers broke down regionally as follows: Austria + EUR 637.1 million, Germany + EUR 296.0 million, Italy + EUR 266.6 million, Switzerland and Liechtenstein + EUR 231.0 million. The expanding Vienna, Graz and Wels markets had the high-est growth rates in Austria. The most product growth was seen with other loans (+ 32.7%) and overdraft lines (+39.4%). This accounted for the 73.5% increase in loans and advances to customers repayable on demand to EUR 1,756.0 million
Under financial assets, primarily consisting of nostro accounts, securities designated available-for-sale de-creased by 51.9% in the year under review as a result of a reclassification to loans and advances to banks and customers. The Bank’s complete portfolio of financial assets totalled EUR 3,221.1 million (previous year: EUR 3,544.9 million).
On the liabilities side, amounts owed to customers increased most, up 21.1% by EUR 692.8 million to EUR 3,974.8 million as of December 31, 2008. This major increase in deposit volume reflected strong customer demand for special-interest savings books (+ 62%), un-derscoring customers’ confidence in Hypo Landesbank Vorarlberg. Financial liabilities at fair value increased 7.3% by EUR 396.6 million to EUR 5,814.4 million.
Capital resourcesShare capital was increased by EUR 128 million from reserves to EUR 150 million, participation capital in-creased from a nominal EUR 2.18 million to EUR 9 million.
The assessment basis of consolidated capital resources according to the Austrian Banking Act increased 11.4% to EUR 7,078.2 million in 2008. After the distribution of dividends totalling EUR 8.790 million, an amount of EUR 29.6 million was allocated to core capital (tier 1) as reserves. Core capital now totals EUR 558.6 million, a 10.2% year-on-year increase. As of 31 December 2008, the Hypo Vorarlberg Group recorded supple-mentary capital resources (tier 2) of EUR 287.0 million, resulting in attributable capital resources of EUR 842.3 million (+ 7.1%) after deductions. Based on required capital resources of EUR 591.8 million, surplus cover thus amounts to EUR 250.5 million. At 31 December 2008, the core capital ratio (banking book) was 7.89%, representing a 0.08% decrease year-on-year. At 11.90% the bank book debt-equity ratio (total capital ratio or solvency margin) was 0.47% lower year-on-year, though well above the 8.0% required by regulations. Barring changes in regulatory requirements, the Bank’s capital resources continue to be comfortable, also in view of the risk profile.
Above average growth in lendings by 24%
Increase of share capital to EUR 150 million
Consolidated management report
Austria 62.0 %
Switzerland/Liechtenstein 8.9 %
Germany 11.9 %
Italy 14.8 %
Other foreign countries 2.4 %
Loans and advances to cutomers 55.8 %
Financial assets 24.5 %
Loans and advances to, and placements with, banks 14.4 %
Other assets 5.3 %
Industry, Trade and Commerce 28.2 %
Leasing 18.6 %
Real estate 12.3 %
Public 8.4 %
Other 10.2 %
Employed and Independent Professionals 22.3 %
Amounts owed to customers 30.2 %
Shareholders' equity 3.7 %
Financial liabilities (AFV) 44.2 %
Other liabilities 6.7 %
Own issues 15.2 %
Loans and advances to customers – breakdown by region(in %)
Structure of assets(in %)
Loans and advances to customers –breakdown by sector(in %)
Structure of liabilities(in %)

34 35
MA
NA
GE
ME
NT
RE
PO
RT
FIN
AN
CIA
L S
TAT
EM
EN
TS
(IF
RS
)B
RA
NC
H O
FFIC
ES
/SU
BS
IDIA
RIE
S
Consolidated management report
Development of Hypo Landesbank Vorarlberg by segment
The Bank’s core business segments are Corporate Services/Public Sector and Private Customers, which are run as separate sales organisations. The Private Banking and Asset Management segment is attributed to both the Corporate Services and Private Customers segments on a split basis.
Corporate Customers and Public Sector – Hypo Landesbank Vorarlberg, the corporate bank
For years, Hypo Landesbank Vorarlberg has been a partner to corporate enterprises and a specialist in the creation of sophisticated financing solutions for private and public-sector organisations.
Dependable corporate partnerIn the Group, the Corporate Customers segment ac-counts for loans totalling EUR 4,773.1 million. This lending volume underscores the leading position of Hypo Landesbank Vorarlberg as a commercial lender and business bank. In 2008, the sector generating the most net growth for the Bank was industry, which contributed EUR 365.2 million, followed by leasing with EUR 301.5 million, trade with EUR 116.8 million and real estate with EUR 77.0 million.
Renewable energies and climate protection were a strategic focus in 2008. Hypo Landesbank Vorarlberg financed nearly 100 projects valued at a total EUR 262.8 million in 2008, half of which were in Austria. The primary alternative energy sources are wind, solar, biomass and water.
Due to the increase in lending volume, net interest income rose 16.3% to EUR 49.6 million. Net fee and commission income increased 3.6% to EUR 11.3 million, boosted by securities and documentary business in the Corporate Customer segment. Proprietary investment products have been well received by corporate custo-mers. The new team of Private Banking Plus specialists ensures our ability to provide professional support to businesses and owners. In our growth markets out-side Vorarlberg (Vienna, Graz, Wels, Switzerland and Southern Germany), we saw satisfactory growth in both sales and earnings. The Corporate Customer segment recorded earnings before taxes (results of ordinary business activities) of EUR 35.9 million (EUR 39.8 mil-lion including the Public Sector unit). This substantial earnings increase was due to the 50% reduction in loan loss provisions to EUR 7.5 million.
The significant rise in commercial lending volume illus-trates Hypo Landesbank’s importance as a dependable partner to corporate enterprises. Being a universal bank, Hypo Landesbank Vorarlberg offers customers both traditional banking products and a range of banking-related services including leasing, real estate services and insurance via subsidiaries. The portfolio of financing products is rounded out by equity financing, expert consulting and support/liaison in connection with funding programmes and public-sector institutions.
Vorarlberg Health Awareness AwardIn the year under review, for the third time Hypo Lan-desbank Vorarlberg presented the Vorarlberg Health Awareness Award to innovative companies based in Vorarlberg that show their commitment to addressing employee health issues through the implementation of creative and innovative health projects for staff members. Hypo Academy for EntrepreneursHypo Landesbank Vorarlberg looks back on a long and very successful history of commercial customer business. The Hypo Academy for Entrepreneurs was created especially for entrepreneurs, in conjunction with publishing a Hypo guideline for entrepreneurs. The Hypo Entrepreneurs Breakfast, held twice a year by Hypo Landesbank Vorarlberg, has become an ex-tremely popular communication forum for business decision-makers.
Private Customers
The Hypo Landesbank Vorarlberg Private Customers business has a dual focus on residential construction financing and banking services for affluent private cus-tomers. Because Hypo Landesbank understands that each customer is individual, we offer a spectrum of tailored financing and investment solutions.
Loans and advances to customers in the Private Cus-tomers segment increased 7.1% year-on-year to EUR 1,491.4 million. The big 21.4% increase in amounts owed to customers to EUR 2,113.7 million was due in particular to the special-interest savings books with a 12-months minimum holding period.
Net interest income from the Private Customers seg-ment rose 9.1% to EUR 38.7 million. The Private Custo-mers segment generated results of ordinary business activities of EUR 13.5 million, down 22.4% year-on-year. This decline primarily reflected lower net fee and com-mission income due to the market situation.
Residential real estate bank As a Landesbank state banking institution, residential construction financing is a traditional core element of our business model. In 2008, we further consolidated on our position as the residential real estate bank for the province of Vorarlberg. Residential construction loans increased 42% overall to EUR 1,459.2 million.
During the year under review the Bank added on the Hypo-Lebenszeit-Kredit to complement the Hypo-Le-benswert-Kredit financing product designed for older individuals. This generational loan is also available to EU citizens with official residence in Austria for properties located in Austria.
As trustee for the province of Vorarlberg, the bank ma-nages a portfolio of subsidised residential construction loans not recorded on the balance sheet. As of 31 De-cember 2008, a total of 54,013 loans were outstanding with a total volume of EUR 1,780.8 million. In 2008, approximately EUR 88.3 million in new loan subsidies were disbursed, offset by redemption repayments of EUR 74.1 million.
Energy-saving Hypo-Klima-Kredit loansThe Bank provides Hypo-Klima-Kredit loans to finance any form of energy-saving investment. The goal is to promote energy-conserving measures by offering at-tractive lending terms, in cooperation with the Energy Institute Vorarlberg.
Private Banking Hypo Landesbank Vorarlberg is the leading asset man-agement bank in the Vorarlberg province. We operate Private Banking Centres in all large branch offices in Vorarlberg, as well as in Lech, Vienna, Graz and Wels. These centres provide exceptionally high-quality advice, staffed exclusively by certified investment advisors. Raising the qualification level of Private Banking ad-visors even further was a particular training focus in fiscal year 2008. Seventeen staff members completed financial advisor training to receive the official Austrian certification of Diplom. Finanzberater (BAK).
The superior quality of our investment consulting and as-set management services has been confirmed through outside recognition in the Fuchsbriefe Report and the Elite Report. The Elite Report gave Hypo Landesbank Vorarlberg the elite “cum laude” distinction in its pro-minent peer rankings. The 2009 Fuchs Report ranked Hypo Vorarlberg a solid fourth place in Austria, making us the only bank to qualify in Austria’s top 5 with both ranking organisations.
Spotlight on securityRegional banks like Hypo Vorarlberg have been ex-periencing a renaissance since the outbreak of the financial crisis. Savings deposits of EUR 372.2 million in the Private Customers segment highlight the confidence customers have in Hypo Landesbank Vorarlberg. For Hypo Landesbank, handling money has always been something conservative. Security is a top priority, from which customers are benefiting in today’s troubled financ-ial markets through conservative asset management and diversification into gold, a long-recommended investment.
Asset management in volatile marketsThe financial and banking world saw unprecedented upheaval across many different markets in the year under review. The business and market environment was thus extremely troubled, particularly for Portfolio and Asset Management. At 31 December 2008, assets under management totalled EUR 644.6 million. This 27.0% year-on-year decline is due primarily to the effect of falling stock markets.
Leading corporate bank in Vorarlberg
Large growth in customer deposits
Consolidated management report

36 37
MA
NA
GE
ME
NT
RE
PO
RT
FIN
AN
CIA
L S
TAT
EM
EN
TS
(IF
RS
)B
RA
NC
H O
FFIC
ES
/SU
BS
IDIA
RIE
S
Consolidated management report
The impact on Portfolio and Asset Management was partially offset by continued inflows (EUR 25.3 Mio) into quantitative investment strategies. The chart below illustrates the capital-preservation effectiveness of the innovative Hypo Dynamik equity strategy during the year under review.
While the benchmark MSCI World equity index fell by over 40% in 2008, in the same period the Hypo-Welt-depot Dynamik Aktien 90 conservative equity strategy declined only by roughly 10%. This flexible investment concept thus retained most of the gains accumulated
between 2004 and 2007, unlike the MSCI World equity benchmark.
The new Hypo Dynamik Anleihen bond fund also perfor-med outstandingly last year. Returning 4.92% between 1 August 2008 and the year-end (11.8% annualised), this active maturity management strategy, which can generate returns in both rising and falling interest rate environments, substantially exceeded expectations. Despite these considerable asset management achieve-ments however, it remains difficult to generate positive returns across all asset classes. The short-term outlook
remains extremely uncertain. The financial markets and the real economy continued to face major problems. Distressed real estate markets in the US and several European countries, falling energy and commodity prices, and manufacturing overcapacity in particular are serving to accelerate deflationary tendencies. The credit and liquidity situation is still tight on international financial markets. Both private and institutional inve-stors are showing continued restraint.
Portfolio and Asset Management employs effective and dynamic investment strategies. Strict discipline in market and security selection and containing risk and costs remains a high priority. Hypo Vermögens-verwaltung is well-positioned in Vorarlberg, particularly given investors’ renewed interest in a safe haven (ca-pital preservation concepts and international investing standards).
Sole Austrian bank conforming to international asset management performance standardsSince 2005, Hypo Landesbank Vorarlberg has been the only Austrian bank offering asset management certified to comply with international standards. Pricewater-houseCoopers audits our asset management annually for compliance with Global Investment Performance Standards (GIPS®), most recently in March 2009.
The standards are designed to afford customers an objective comparison of investment results. The Bank itself benefits however from GIPS® quality control in investing and risk management processes, which again ultimately benefits the customer.
Treasury/Financial Markets
Treasury activities conducted by Hypo Landesbank Vorarlberg in fiscal year 2008 were substantially af-fected by the turmoil on international financial markets. Like virtually every other bank active in the capital markets, Hypo Landesbank Vorarlberg was confronted with an extremely difficult market environment. Falling bond prices on widening credit spreads weighed on Treasury earnings. However, in contrast to many banks the financial impact on Hypo Landesbank Vorarlberg was only limited, being effectively contained due to the solid, long-term orientation of our business. Our excellent liquidity and long-term funding position are particularly positive factors. The crisis has provided an opportunity to generate considerable investment management returns while maintaining a conservative risk profile. The liquidity buffer built up in 2007 made it possible to take positions in bonds and loans on a selective basis. In the current difficult financial crisis it has become particularly clear that our conservative strategic position and risk policies have had a positive impact; thus even in this difficult economic environment, Hypo Landesbank Vorarlberg is able to produce stable results.
Asset and Liability ManagementIn 2008, assets totalling EUR 1,022 million were purchased for fixed income nostro accounts. At 31 December 2008, bond holdings were valued at a total EUR 3,238 million. Margins increased substantially in fiscal year 2008.
The investment focus in 2008 was on covered bonds and assets of public institutions. Bond issuers from Austria and other European countries comprised the core of a broadly diversified portfolio.
In fixed income markets, the focus was on interest rate hedging and active asset and liability management. Bond yields fell in the second half of the year, followed by money market yields in the fourth quarter. Strategic fixed interest receiver positions were taken over the course of the entire year. In the second half of the year, interest rate risk management was stepped up in the areas of equity and credit, which made a major contribution to stabilising the overall portfolio.
Asset management proves itself with value protection
Accordance with Global Investment Performance Standards (GIPS)® again confirmed
Consolidated management report
01 02 03 04 05 06 07 08 09 10 11 12 01
110
100
90
80
70
60
2008
MSCI World Hypo Dynamik 90
Performance comparison
38 39
MA
NA
GE
ME
NT
RE
PO
RT
FIN
AN
CIA
L S
TAT
EM
EN
TS
(IF
RS
)B
RA
NC
H O
FFIC
ES
/SU
BS
IDIA
RIE
S
Consolidated management report
Asset and Liability Management – FundingThe bank enjoys an excellent liquidity situation thanks to prudent funding policies pursued in 2006 and 2007. As a result, the Bank did not have to secure funding from international capital markets on increasingly expensive terms.
Nine issues were implemented in the course of 2008 (private placements and retail bonds) with a total volume of EUR 195 million. To maintain at adequate capitalisation Hypo Landesbank Vorarlberg also issued upper tier 2 bonds in the amount of EUR 26.5 million.
The international rating agency Moody’s recently reite-rated its very good Aa1 rating. Our rating thus remains excellent even after the discontinuation of the state deficiency guarantee. In future, the covered pool will be increasingly drawn upon for the issuance of mortgage and municipal covered bonds in order to obtain more favourable funding for the Bank.
Nominal derivative volume managed by the Swaps unit increased in 2008 from EUR 9.3 billion to EUR 10.0 billion. This increase was mainly attributable to propri-etary trading in interest rate options and forward rate agreements for interest rate management and hedging of Bank issues. Nominal currency options volume in customer accounts doubled to EUR 211.6 million. A total 437 swap contracts with an approximate nominal volume of EUR 7.9 billion were on the books as of 31 December 2008. The number of new framework and collateral agreements negotiated was lower than in the previous year. However, in the last quarter of the year, a number of novation agreements in connection with bank acquisitions were signed.
Money market, currency and interest rate derivatives tradingThe solid liquidity situation greatly facilitated Hypo Landesbank’s ability to act in the crisis-stricken money markets. The level of cash and equivalents held stabilised at around EUR 1 billion after peaking at the end of the first quarter.
Overall, Hypo Landesbank benefited as the crisis es-calated in a third wave starting in September. Spreads of invested and borrowed funds widened considerably, helping us obtain excellent interest rates for invested funds, mainly in CHF.
To expand money market funding and access a further source of liquidity, the ECB Tender System was participa-ted in at times, and roughly EUR 1.2 billion in securities placed in the Austrian National Bank collateral account. To secure liquidity in CHF steps were taken to participate in the SNB Repo System. This process is scheduled to be completed in February 2009, upon which we will begin participating in live trading via the electronic platform.
Fund ServiceThe Fund Service unit administored 72 mandates at the end of 2008. Fund assets under administration have declined sharply as a result of the financial crisis by 36% or EUR 2.3 billion. By comparison, the overall Austrian fund market shrank 23% (source: volume figures from VÖIG).
Slumping markets in the first half of the year and the tremendous financial crisis erupting in the autumn of 2008 precipitated a major decline in fund assets under administration. However, the low percentage of holdings in straight equity funds and equities in balan-ced mandates limited erosion relative to international financial markets. Nine new funds were launched and two funds liquidated in fiscal year 2008, a historically bad year for the market.
As tax representative and paying agent for foreign investment funds, 82 new fund tranches were taken on and 14 tranches withdrawn from distribution due to Europe-wide consolidation. The Fund Service unit now oversees 304 foreign fund mandates (including classes) and calculates the relevant tax data for residents.
A third business area administores customer accounts of external intermediaries. Most new account openings are processed by specialised banks, yet many custo-mers closed accounts due to market uncertainty. To the end of the year, 9,500 customer accounts were administored.
Securities Trading (Customer Trading)Securities trading volume was heavy in 2008. Customer trading volume rose 10% from EUR 1.6 billion in 2007 to EUR 1.7 billion in 2008. This increase was due to a wide range of factors including market turmoil towards the end of 2008. Additionally, the handling of transactions for several funds had a positive effect on securities trading.
Capital management
Pillar 2 of Basel II requires banks additionally to establish their capital adequacy on the basis of internal models. This is to ensure in particular that risks are considered for which no capital adequacy requirements are provided under Pillar 1. Such risks include interest rate risk in the non-trading portfolio. The Bank employs the so-called Internal Capital Adequacy Assessment Process (ICAAP) to identify, quantify, aggregate, and monitor all major risks. The Bank calculates the required economic capital for each of these major risks, allocating capital buffers whenever calculation is not possible. The available risk coverage potential is distributed across organisational units and risk types in annual planning.
By using the Capital Adequacy Process, the Bank en-sures that risk limits are complied with and that the risks taken are covered by existing coverage potential. The Bank applies a confidence level of 99.95% and a holding period of one year in the Capital Adequacy Process. Correlations between individual risk types are not taken into consideration. The Capital Adequacy Process calculation is performed monthly.
The Bank’s credit risk calculation of economic capital is based on the Basel II IRB approach. With this approach, the consumption of economic capital depends on the volume, collateral and rating of the debtor. Value at risk is employed in the ICAAP for the management of market risk. The VaR limit defines the maximum loss the Bank is prepared to absorb under normal market conditions. The Managing Board defines the global VaR limit on an annual basis. In addition, limits are defined for various interest-rate curves, currency pairs and equity position risks.
The Bank calculates its economic capital resources for operational risk using the basis indicator approach under Pillar 1. This value is further increased for ICAAP to reflect the stricter capitalisation requirements than imposed by regulations. To quantify structural liquidity risk, Hypo Vorarlberg calculates liquidity VaR, based on the ICAAP guidelines of the Austria Financial Market Authority/Austrian National Bank. A PD-LGD method is used for shareholder risk; a capital buffer is calculated for other risks.
Compliance and Money Laundering
The Compliance department reports directly to the Managing Board and is chiefly responsible for ensuring compliance with securities, exchange and banking re-gulations for preventing money laundering.
ComplianceAll employees undertake to follow the terms of the compliance regulations when they join Hypo Landes-bank Vorarlberg. The body of regulations is based on the Standard Compliance Code for the lending industry and on securities and exchange regulations. In 2008, adherence with the Securities Issuer Compliance Ord-nance was mandatory as Hypo Landesbank Vorarlberg participation certificates were still listed on the ex-change. Compliance with these regulations is regularly checked and documented. New hires receive thorough instruction on compliance basics. Other employees also receive regular compliance training and information on relevant changes.
The Compliance department regularly audits for compli-ance with securities regulations including the Markets in Financial Instruments Directive (MiFID), implementing any necessary changes jointly with other departments concerned. These regulations are designed for inves-tor protection and to ensure market efficiency and integrity.
Money launderingThe amendments to the 3rd EU Money Laundering Directive in the past fiscal year were implemented by Hypo Landesbank Vorarlberg. In addition to regular mo-nitoring, special software has been installed to facilitate checking records.
Relevant staff members go through extensive money-laundering training in which they receive instruction on applicable laws and suspicious facts, as well as how to prevent money laundering and the financing of ter-rorism. Furthermore, all newly hired employees receive basic training. Annual tests are conducted to ensure that employees’ knowledge is up-to-date. Continuing education seminars are conducted to instruct staff members on special anti-money-laundering regulations and detection procedures.
Sufficient liquidity due to foresighted refinancingpolicies
High security standard for Money Laundering and Compliance
Consolidated management report
40 41
MA
NA
GE
ME
NT
RE
PO
RT
FIN
AN
CIA
L S
TAT
EM
EN
TS
(IF
RS
)B
RA
NC
H O
FFIC
ES
/SU
BS
IDIA
RIE
S
Consolidated management report
Major subsidiaries of Hypo Landesbank Vorarlberg
Hypo Investment Bank (Liechtenstein) AG, Gamprin-Bendern
Hypo Investment Bank (Liechtenstein) AG (HIB) has been successfully operating as a private bank in Liechtenstein for ten years. An average 42 employees (weighted by capacity utilisation rate) serviced nearly EUR 1 billion in customer assets as of 31 December 2008. Earnings fell well short of the record level reached in 2007 (EUR 8.0 million), coming in at EUR 6.3 million. As the Liechten-stein subsidiary is only involved in the credit business to a very limited extent (EUR 71.8 million), it holds a large volume of (EUR 494.0 million) money market assets with the Group parent company.
Investment and business strategySince its founding ten years ago, Hypo Investment Bank (Liechtenstein) AG has pursued an index-oriented inves-ting policy for customer assets. This proven strategy will be kept in place going forward. Bank Management believes the long-term strength of the business rests upon maintaining broad international diversification in customer portfolios. Key success factors include foreign language skills, networking competency and family ties in various local regions. On January 2009 Mandarin and Arabic were added to the existing lan-guage desks (German, Italian, English, Russian and Turkish). Over the next 24 months, the Institutional Clients department will be doubling from a current staff of four to eight employees.
A review of the regular residences of beneficiary owners of customer portfolios shows that more than half of customers have their place of residence in the Euro-pean Union. In the past fiscal year, the Bank focused sharply on the Turkish-speaking market. All printed sales materials, such as account opening documents, monthly asset services, and informational brochures, are now available in six languages: German, English, Italian, Russian, Turkish and Arabic. Being organised by language region affords efficient market access. Language skills are also a requirement for compliance with mandatory due diligence obligations.
Qualitative objectives HIB’s objective is to remain a cutting-edge private bank for affluent entrepreneurs and private individuals. As the sixth largest bank in Liechtenstein, HIB will continue to play a leading role in the country’s banking indus-try. This includes further activity on the board of the Liechtenstein Banking Association and the universities of Vaduz and Innsbruck.
Employees Of the average 42 employees on staff (weighted by capacity utilisation rate), 23 hold a university degree. Long-term employee retention is a key priority. Long-term-oriented employee incentive schemes and per-formance-linked compensation elements are important structures in this regard.
Sufficient office space secured for decades In the first week of December 2008 we moved into the office facilities located at Schaaner Strasse 27, FL 9487 Gamprin-Bendern, right next to the LGT Service Centre. The property offers space for approximately 100 personnel, thus potentially accommodating over twice as many staff.
Hypo Fund Management (Liechtenstein) AGThis Liechtenstein company is a wholly-owned subsidiary of HIB. For strategic reasons HIB decided to launch non-retail funds for large investors. Private customers and corporate investors meeting all the criteria to qualify as accredited investors per Article 23 IUG (Investment Company Act) in conjunction with Article 29 IUV (Or-dinance on the Investment Company Act) are eligible to invest. Hypo Fund Management (Liechtenstein) AG commenced operations on 1 September 2008.
In the autumn of 2008, the Hypo Landesbank Vorarlberg Managing Board requested Supervisory Board approval of the sale of Hypo Investment Bank (Liechtenstein) AG, subject to certain buyer and price requirements. The sale process is to be completed by 30 June 2009.
Hypo Vorarlberg Leasing AG, BolzanoHypo Vorarlberg GmbH, Bolzano
In 2008, Hypo Vorarlberg Leasing AG concluded 506 contracts to post net new business volume of EUR 291 million. This robust growth is mainly attributable to the successful distribution system built up over the last several years, closing large transactions and the elimination of certain competitors through the crisis. Plans are for moderate expansion of our territorial reach (Veneto/Treviso) and product range (alternative energies).
The Italian leasing market shrank by 21% in 2008, with the real estate segment declining as much as 34%. These unfavourable developments mainly reflected restrained capital expenditure due to the financial and economic crisis and to liquidity problems encountered by many leasing firms in the second half of the year.
Hypo Vorarlberg Leasing AG recorded results of ordi-nary business activities of EUR 1.14 million for 2008, below the 2007 result due to a negative interest effect of approximately EUR 1 million.
The rapid growth of the company was supported by the parent company with two capital increases totalling EUR 12.5 million. Hypo Vorarlberg Leasing AG is now sufficiently capitalised to meet requirements imposed by Italy’s central bank.
In May 2008, the company moved into a new office location in Bolzano at Galileo-Galilei-Strasse 10/B of-fering better process organisation, extra office space, and enhanced prestige and visibility.
Following the departure of the long-time sales director in July 2008, it was decided to implement an internal reorganisation involving an expanded managerial body in which all unit managers are represented. Clearly defined tasks and responsibilities characteristic of modern risk management were outlined, separating the front and back office.
For 2009, the new contract volume target is signifi-cantly lower, reflecting considerable selectivity and stricter risk parameters for acquisition. The focus next year will be on efficient risk management, so as to contain any negative impact from the current economic crisis and substantially enhance profitabili-ty. Initial profitability-boosting measures were already implemented in 2008. Hypo Vorarlberg GmbH expanded the range of technical services provided to Hypo Vorarlberg Leasing AG in 2008. Hypo Vorarlberg GmbH independently conducts the annual reappraisals for leased properties on the books in line with Basel II.
Earnings improved significantly versus fiscal year 2007 due to an expanded product and service array and to lower borrowing costs. Hypo Vorarlberg GmbH offered services to third parties for the first time in 2008; this activity will be increasing in the years ahead.
HYPO EQUITYUnternehmensbeteiligungen AG (HUBAG)HyPO EQUITy Unternehmensbeteiligungen AG is a basket fund for venture capital and private equity companies. Its core business is the financing of small and middle sized enterprises by providing equity and mezzanine capital.
Data is not yet available on the Austrian private equity and venture capital markets for 2008. Tight credit how-ever will likely have put the leading buyout segment into decline in the last months of 2008. The economic crisis has also driven down company valuations as a result of the linkage to financial markets. Relevant private equity indices like the LPX Major Market and LPX 50 fell by over 60% in 2008.
The HUBAG portfolio performed well in 2008. In September 2008, HyPO EQUITy Unternehmensbetei-ligungen AG acquired ECOS Venture Capital Beteili-gungs AG (ECOS) with registered office in Vienna via its subsidiary AURORA - Beteiligungs und Verwaltungs GmbH. ECOS specialises in early-stage and expansion financing of technology companies. The ECOS portfolio companies LMT Lammers Medical Technology GmbH (life-saving medical systems) and Biomax Informatics AG (bioinformatics solutions) hold particularly great growth potential.
HUBAG is well-positioned for the future with its existing portfolio and potential new acquisitions.
Satisfactory growth of Hypo subsidiaries
Modern location for Hypo Vorarlberg Leasing AG, Bolzano, Italy
Consolidated management report
42 43
MA
NA
GE
ME
NT
RE
PO
RT
FIN
AN
CIA
L S
TAT
EM
EN
TS
(IF
RS
)B
RA
NC
H O
FFIC
ES
/SU
BS
IDIA
RIE
S
Consolidated management report
HYPO EQUITY Management AG (HEMAG)
HyPO EQUITy Management AG is specialised in the ma-nagement of funds and fund portfolio companies, and the acquisition of new portfolio companies. Deal flow in 2008 was roughly 70% higher than in the previous year with 433 new contacts. In 2008, the average number of HEMAG employees was eight.
Hypo Immobilien GmbH
Hypo Immobilien GmbH, based in Dornbirn, is the real estate competence centre within the Hypo Vorarlberg Group, managing the entire real estate portfolio of buildings used for internal purposes and properties destined for realisation. The company is organised into the business areas of real estate brokerage, faci-lity management, portfolio management, construction management and real estate appraisal.
The company also utilises its expertise to offer real estate brokerage in the Vorarlberg market. Services include expert consulting, objective valuation, locating property buyers and tenants, and professional support with real estate transactions. In 2008, cooperation with the Hypo branch offices and the consulting team were further expanded. Hypo Immobilien GmbH is now one of the top 3 real estate firms in Vorarlberg.
The large construction projects Hypo Office Dornbirn and Hypo Headquarters Bregenz begun in 2006 were completed in fiscal year 2008. Both were completed on time and on budget. The Hypo Office Dornbirn property will mainly be used by subsidiaries, and the remaining space leased. An expanded range of services including real estate brokerage, consulting and appraisal plus insurance brokerage and leasing is to be provided out of the Hypo Office Dornbirn location.
In fiscal year 2008, Hypo Immobilien GmbH employed an average of 19 personnel weighted by capacity uti-lisation rate. At the end of the year, Hypo Immobilien GmbH had 22 subsidiaries and property companies. Three companies were sold in share deals in fiscal 2008 together with the associated properties. As of 31 December 2008, total assets of consolidated com-panies within the real estate division amounted to EUR 83.1 million. The real estate division recorded results of ordinary business activities of EUR 2.0 million.
Hypo Versicherungsmakler GmbH
In August 2008, Hypo Versicherungsmakler GmbH transferred its headquarters to the new Hypo Office property at Poststrasse 11, Dornbirn. There is a branch office in Bludenz. Customers from the Steiermark area are served jointly with a partner in Graz.
Hypo Versicherungsmakler GmbH employs its expertise in advising corporate customers on how to dramatically reduce insurance costs while optimising coverage and benefits. Businesses highly value this service, especially in tough times like now when budgets are tight. The company’s earnings were impacted in the fourth quarter of 2008 by declining premium income for property and life insurance due to financial market developments.
Sales of EUR 893,761 were generated; the average number of staff members in 2008 was 13. More field representatives are being hired to boost cross sel-ling within the Hypo Vorarlberg Group further, though in-house personnel still comprise the primary sales force. Due to the market, an earnings effect from the projected additional sales is anticipated to materialise in the years ahead.
Further deterioration has been seen in international markets over the last few weeks. As yet the situation does not appear to have stabilised. Austria is likely to experience a longer and deeper recession than previ-ously presumed. Coming after 1.8% GDP growth last year, a 1.5% contraction is forecast for the economy in 2009. At the earliest, the economy may have bottomed out by the end of 2009. Current forecasts are for tepid + 0.7% economic growth in 2010.
Reliable earnings estimates are difficult to make at this time, though we believe the outlook in our markets is better than in many countries and regions. In accordance with plans we will be decelerating growth in total assets and systematically reallocating resources into loans and advances to customers in our core markets.
Our business model does not require any major adap-tation in view of business strategy already in place. We view our entire market territory as an expanded home market, operating essentially in Vorarlberg, the Lake Constance region, and Austria, as well as on a highly selective basis in bordering eastern Switzerland, Liechtenstein, southern Germany and northern Italy.
Energy efficiency and optimisation will remain a key focus in 2009. In addition to promoting energy-saving investment through the Hypo-Klima-Kredit product, Hypo Landesbank Vorarlberg supports the Vorarlberg Climate Protection Awards and the passive-house campaign run by Vorarlberg Province.
The Bank will be unavoidably impacted in 2009 by the financial crisis and recession. Accordingly, we have started out 2009 with somewhat muted expectations. For this year earnings are expected to fall short of the 2008 level in view of a substantial projected increase in credit risk costs.
No material business events occurred in the period between the end of the fiscal year and the preparation of the financial statements and their confirmation by the auditor.
Hypo Office Dornbirn – Hypo subsidiaries under one roof
Remaining with proven, long-term business and credit policies
Consolidated management report
Outlook and recent developments

45
FIN
AN
CIA
L S
TAT
EM
EN
TS
(IF
RS
)B
RA
NC
H O
FFIC
ES
/SU
BS
IDIA
RIE
S
44
MA
NA
GE
ME
NT
RE
PO
RT
Remaining strong involves more than just investing in our brand. Health initiatives for our
employees are also a part. The announcement of the Vorarlberger Health Awareness
Award, sponsoring the largest Vorarlberger track and field event in Götzis, and the large
participation in training programmes for employees and partners confirm the validity
of our activities. Even the new headquarters in Bregenz is “physically and mentally”
in top form. It meets the expectations of our customers for a modern universal bank
and unites history with innovation.
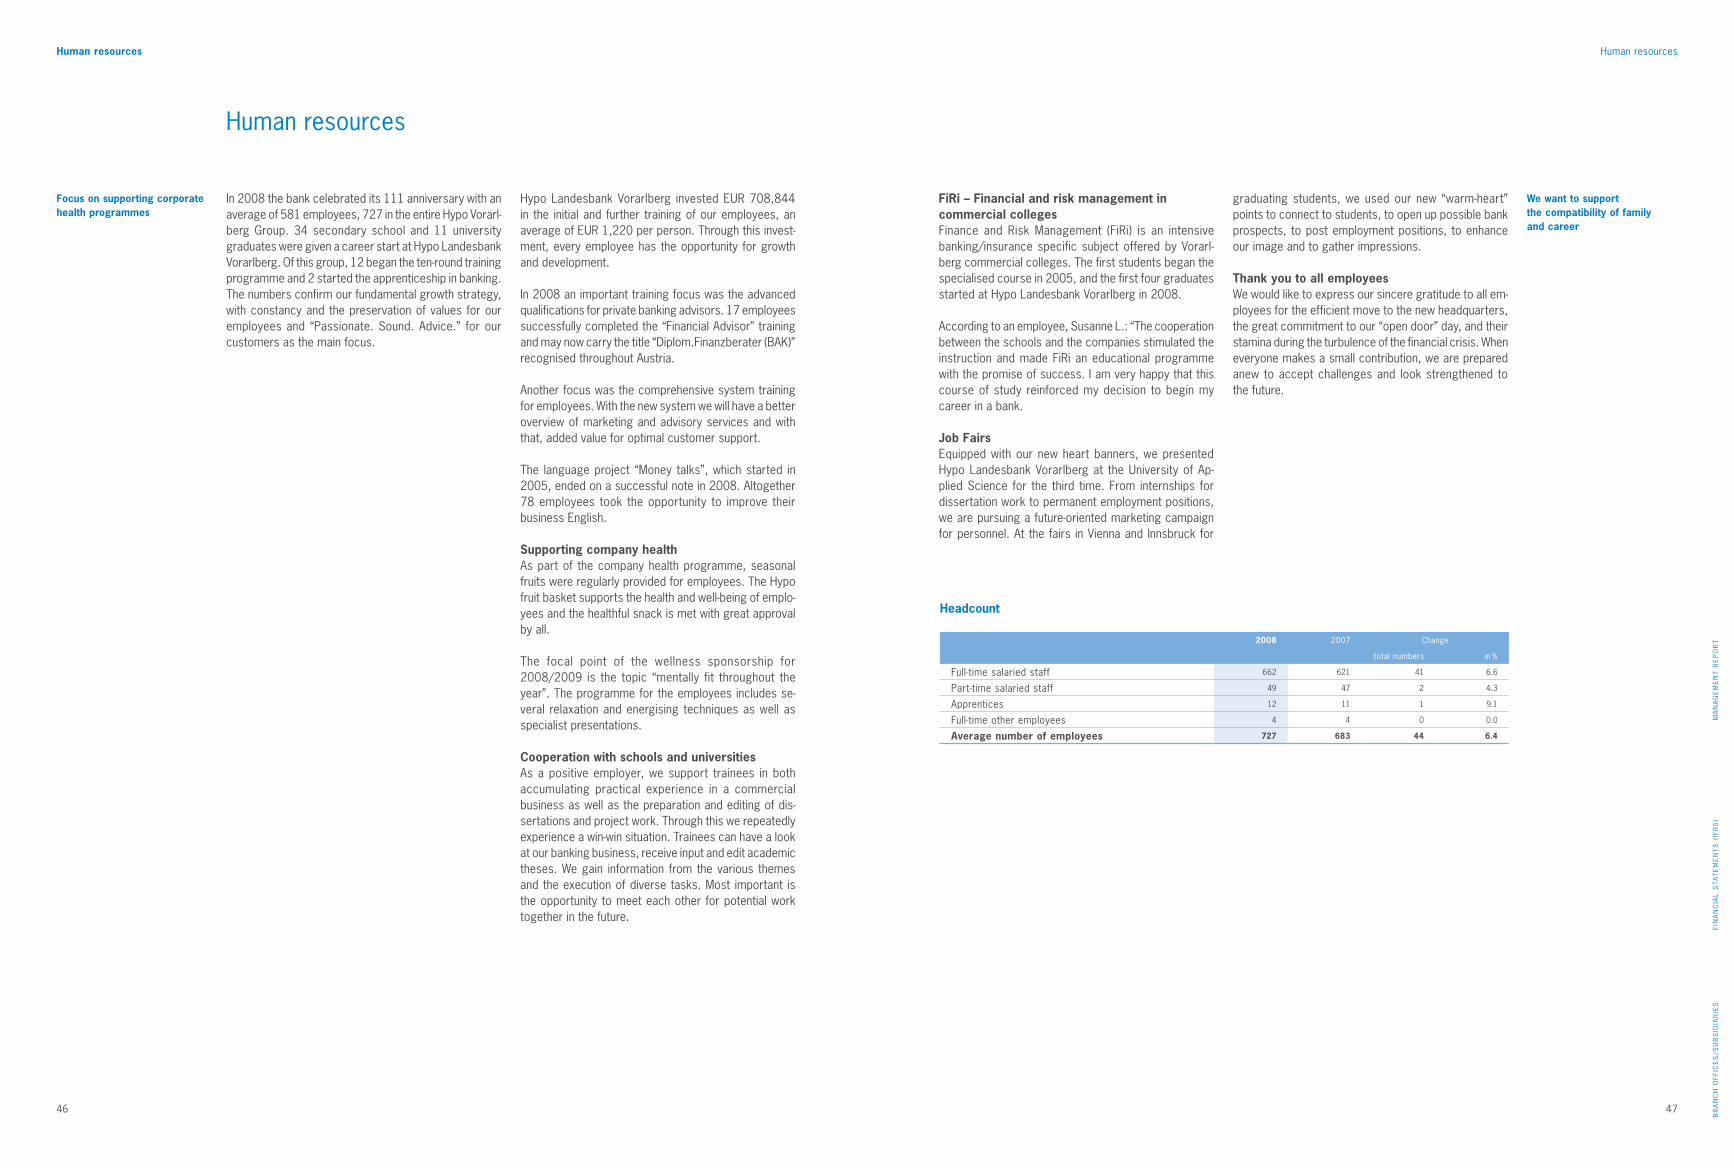
46 47
MA
NA
GE
ME
NT
RE
PO
RT
FIN
AN
CIA
L S
TAT
EM
EN
TS
(IF
RS
)B
RA
NC
H O
FFIC
ES
/SU
BS
IDIA
RIE
S
Human resources
In 2008 the bank celebrated its 111 anniversary with an average of 581 employees, 727 in the entire Hypo Vorarl-berg Group. 34 secondary school and 11 university graduates were given a career start at Hypo Landesbank Vorarlberg. Of this group, 12 began the ten-round training programme and 2 started the apprenticeship in banking. The numbers confirm our fundamental growth strategy, with constancy and the preservation of values for our employees and “Passionate. Sound. Advice.” for our customers as the main focus.
Hypo Landesbank Vorarlberg invested EUR 708,844 in the initial and further training of our employees, an average of EUR 1,220 per person. Through this invest-ment, every employee has the opportunity for growth and development.
In 2008 an important training focus was the advanced qualifications for private banking advisors. 17 employees successfully completed the “Financial Advisor” training and may now carry the title “Diplom.Finanzberater (BAK)” recognised throughout Austria.
Another focus was the comprehensive system training for employees. With the new system we will have a better overview of marketing and advisory services and with that, added value for optimal customer support.
The language project “Money talks”, which started in 2005, ended on a successful note in 2008. Altogether 78 employees took the opportunity to improve their business English.
Supporting company healthAs part of the company health programme, seasonal fruits were regularly provided for employees. The Hypo fruit basket supports the health and well-being of emplo-yees and the healthful snack is met with great approval by all.
The focal point of the wellness sponsorship for 2008/2009 is the topic “mentally fit throughout the year”. The programme for the employees includes se-veral relaxation and energising techniques as well as specialist presentations.
Cooperation with schools and universitiesAs a positive employer, we support trainees in both accumulating practical experience in a commercial business as well as the preparation and editing of dis-sertations and project work. Through this we repeatedly experience a win-win situation. Trainees can have a look at our banking business, receive input and edit academic theses. We gain information from the various themes and the execution of diverse tasks. Most important is the opportunity to meet each other for potential work together in the future.
FiRi – Financial and risk management in commercial collegesFinance and Risk Management (FiRi) is an intensive banking/insurance specific subject offered by Vorarl-berg commercial colleges. The first students began the specialised course in 2005, and the first four graduates started at Hypo Landesbank Vorarlberg in 2008.
According to an employee, Susanne L.: “The cooperation between the schools and the companies stimulated the instruction and made FiRi an educational programme with the promise of success. I am very happy that this course of study reinforced my decision to begin my career in a bank.
Job FairsEquipped with our new heart banners, we presented Hypo Landesbank Vorarlberg at the University of Ap-plied Science for the third time. From internships for dissertation work to permanent employment positions, we are pursuing a future-oriented marketing campaign for personnel. At the fairs in Vienna and Innsbruck for
graduating students, we used our new “warm-heart” points to connect to students, to open up possible bank prospects, to post employment positions, to enhance our image and to gather impressions.
Thank you to all employeesWe would like to express our sincere gratitude to all em-ployees for the efficient move to the new headquarters, the great commitment to our “open door” day, and their stamina during the turbulence of the financial crisis. When everyone makes a small contribution, we are prepared anew to accept challenges and look strengthened to the future.
Focus on supporting corporate health programmes
We want to support the compatibility of family and career
Human resources
Human resources
Headcount
2008 2007 Change
total numbers in %
Full-time salaried staff 662 621 41 6.6
Part-time salaried staff 49 47 2 4.3
Apprentices 12 11 1 9.1
Full-time other employees 4 4 0 0.0
Average number of employees 727 683 44 6.4
48 49
MA
NA
GE
ME
NT
RE
PO
RT
FIN
AN
CIA
L S
TAT
EM
EN
TS
(IF
RS
)B
RA
NC
H O
FFIC
ES
/SU
BS
IDIA
RIE
S
Marketing and advertising
Marketing and advertising
In 2008, the Hypo Landesbank Vorarlberg successfully enhanced its corporate image recognition. With the new slogan “Passionate. Sound. Advice.” Hypo Landesbank Vorarlberg clearly puts the focus on personal, high quality advisory services and distances itself from self-service branches and on-line banking.
The Sofa, for more than ten years the trademark of Hypo Landesbank Vorarlberg, will have a communicative addition in the future: the Heart.
The heart represents the Hypo Landesbank Vorarlberg promise to be fully committed to our customers, with de-dication and understanding. Hypo Landesbank Vorarlberg first presented the new look as part of the re-opening of the headquarters on 18 October 2008, an event that all Vorarlbergers were invited to take part in.
Fairs
Dornbirn spring and autumn fairsAt the spring and autumn fairs in Dornbirn, Hypo Landes-bank Vorarlberg presented the new Hypo-Klima-Kredit, a loan with special conditions for energy saving invest-ments. The Hypo team greeted visitors with an ice-cream stand.
The Hypo fashion show again attracted large numbers of visitors.
wohn+bau 2008The largest construction fair in Vorarlberg celebrated its tenth anniversary in 2008. 26 developers presented a range of projects from all over Vorarlberg. Those in-terested in property and real estate used the opportunity for a one-stop comprehensive overview of the current offers from individual builders.
Invest-Messe in StuttgartHypo Landesbank Vorarlberg was again represented at the 2008 Invest-Messe in Stuttgart with a consulting team. The fair, with 250 exhibitors for institutional and private investors, attracted more than 17,000 visitors.
IAM DüsseldorfThe International Investment Fair took place from 5-7 September 2008 in Düsseldorf, Germany. As one of 170 exhibitors, Hypo Landesbank Vorarlberg answered diverse questions concerning investing in troubled mar-kets.
Events
On Saturday, 18 October 2008, Hypo Landesbank Vorar-lberg celebrated the re-opening of the headquarters in Bregenz. Vorarlbergers, numerous customers and other interested groups took the opportunity to take a look behind the scenes at Hypo Landesbank Vorarlberg and spend an eventful day in the party tent near the lake. A scavenger hunt, with prizes, led visitors through the different floors and departments.
111 year anniversaryTo celebrate the 111 year anniversary of Hypo Landes-bank Vorarlberg, the book “111 Hypo Vorarlberg – ein historischer Kassasturz”, which documents the history of the bank, was presented at a special event in the Alten Landtagssaal, the historic auditorium that was incorporated into the renovated headquarters.
Customer concert 2008For the traditional Hypo Customer Concert, the Vorarl-berg Symphonic Orchestra played their new programme “Trilogy”, a classical work with humorous elements. The 1,600 concert-goers completely filled the Bregenzer Festspielhaus.
Hypo-Akademie and Hypo Breakfast for EntrepreneursThe Hypo-Akademie inspired participants this year with talks on resource management and innovation manage-ment.
The Hypo Breakfast for Entrepreneurs took place in spring in cooperation with the firm Grass GmbH. A very interesting presentation by Prof. Würth drew a record number of participants to the breakfast. Vorarlberg Lines and Hypo Landesbank Vorarlberg together held the breakfast in autumn.
Check your rightsIn 2008, Hypo Landesbank Vorarlberg took part in a series of events called “Check-Dein-Recht” (check your rights) an initiative of Vorarlberg Attorneys in cooperation with the Vorarlberger Nachrichten, the local newspaper. On 28 May 2008, 250 interested participants attended the presentation on residential construction. The theme “Inheritance and Bequest” drew 300 visitors to the Otten Gravour, a local event centre, on 6 November 2008.
Vorarlberg Health Awareness AwardFor the second time, Hypo Landesbank Vorarlberg pre-sented the Vorarlberg Health Awareness Award. At the award ceremony, all agreed that promoting health at the work place increases productivity and makes firms more competitive. “The Vorarlberg Health Awareness Award is always an incentive for our own projects” said Jodok Simma, Chairman of the Managing Board, Hypo Landesbank Vorarlberg.
Sponsorship
Hypo meetingHypo Landesbank Vorarlberg was again the main sponsor of this international multi-discipline competition. In the Hypo tent visitors could enjoy cool beverages and watch live coverage of the events.
Dmitriy Karpov from Kazakhstan emerged as winner of the decathlon and the Russian Tatyana Chernova suc-cessfully defeated her opponents in the heptathlon.
Climate Protection Prize The topic renewable energy was a priority for Hypo Lan-desbank Vorarlberg in 2008. As part of this involvement, the bank sponsored the VN-Klimaschutzpreis 2008 (Cli-mate Protection Prize). The goal was to provide Vorarlber-gers information concerning global climate change, CO2 emissions and energy guzzling household appliances and to encourage active involvement in climate protection.
OutdoortrophyThe Outdoortrophy was once again held in Lingenau in Bregenzerwald in 2008. This is an annual, interna-tional super team competition consisting of four sports: mountain running, paragliding, white water kayaking and mountain biking. The race is one of the most difficult team competitions in the world and is an incredible challenge for all athletes. As part of its sponsorship, Hypo Landesbank Vorarlberg was involved with the award ceremony and, among others, gave the award for most passionate fan.
RIKKI Schlauberger“RIKKI – Schlauberger vermeiden Abfall” is a local project to inform school children about trash recycling. Hypo Landesbank Vorarlberg supported the action by offering savings books for the winners.
Hypo beach barDuring EURO 2008, Hypo Landesbank Vorarlberg, Stadt-Marketing-Bregenz and several Vorarlberg restaurants organised a beach bar for football fans. 200 tonnes of sand, lots of beach chairs and a wonderful Caribbean flair welcomed all to the music pavilion in Bregenz to linger and enjoy a cocktail. In response to the positive feedback, the Hypo Beach Bar remained open for the entire summer.
Hyperworld
As part of Hyperworld, Hypo Landesbank Vorarlberg offered our younger customers a broad range of activi-ties and events.
The “Finanzführerschein” project informed students about the correct way to handle money, music fans could win or purchase discounted festival tickets, cinema fans were thrilled by exciting movie premieres and winter sport fans enjoyed a special offer for safety equipment.
Hypo Landesbank Vorarlberg supported students with in-dividual account products and other interesting offers.
Passionate. Sound. Advice.
Marketing and advertising
Marketing and advertising
Awarding of the Vorarlberg VN Climate Protection Prize

51
FIN
AN
CIA
L S
TAT
EM
EN
TS
(IF
RS
)B
RA
NC
H O
FFIC
ES
/SU
BS
IDIA
RIE
S
50
A bank is also a living thing. It takes real chances and grows. These challenges definitely
stand on a strong foundation. It is the Province of Vorarlberg, as majority owner, whose
economy and people we feel committed to. Important strategic reforms follow agreement
with the owners and require the approval of the Supervisory Board. The selective growth
markets outside of Vorarlberg remain Vienna, Graz, Wels and the Lake Constance region.
As a universal financial service provider, our subsidiaries meet with customers under our
brand family and profit from the synergy. Time passes, security remains – the premise
of Hypo Landesbank Vorarlberg.
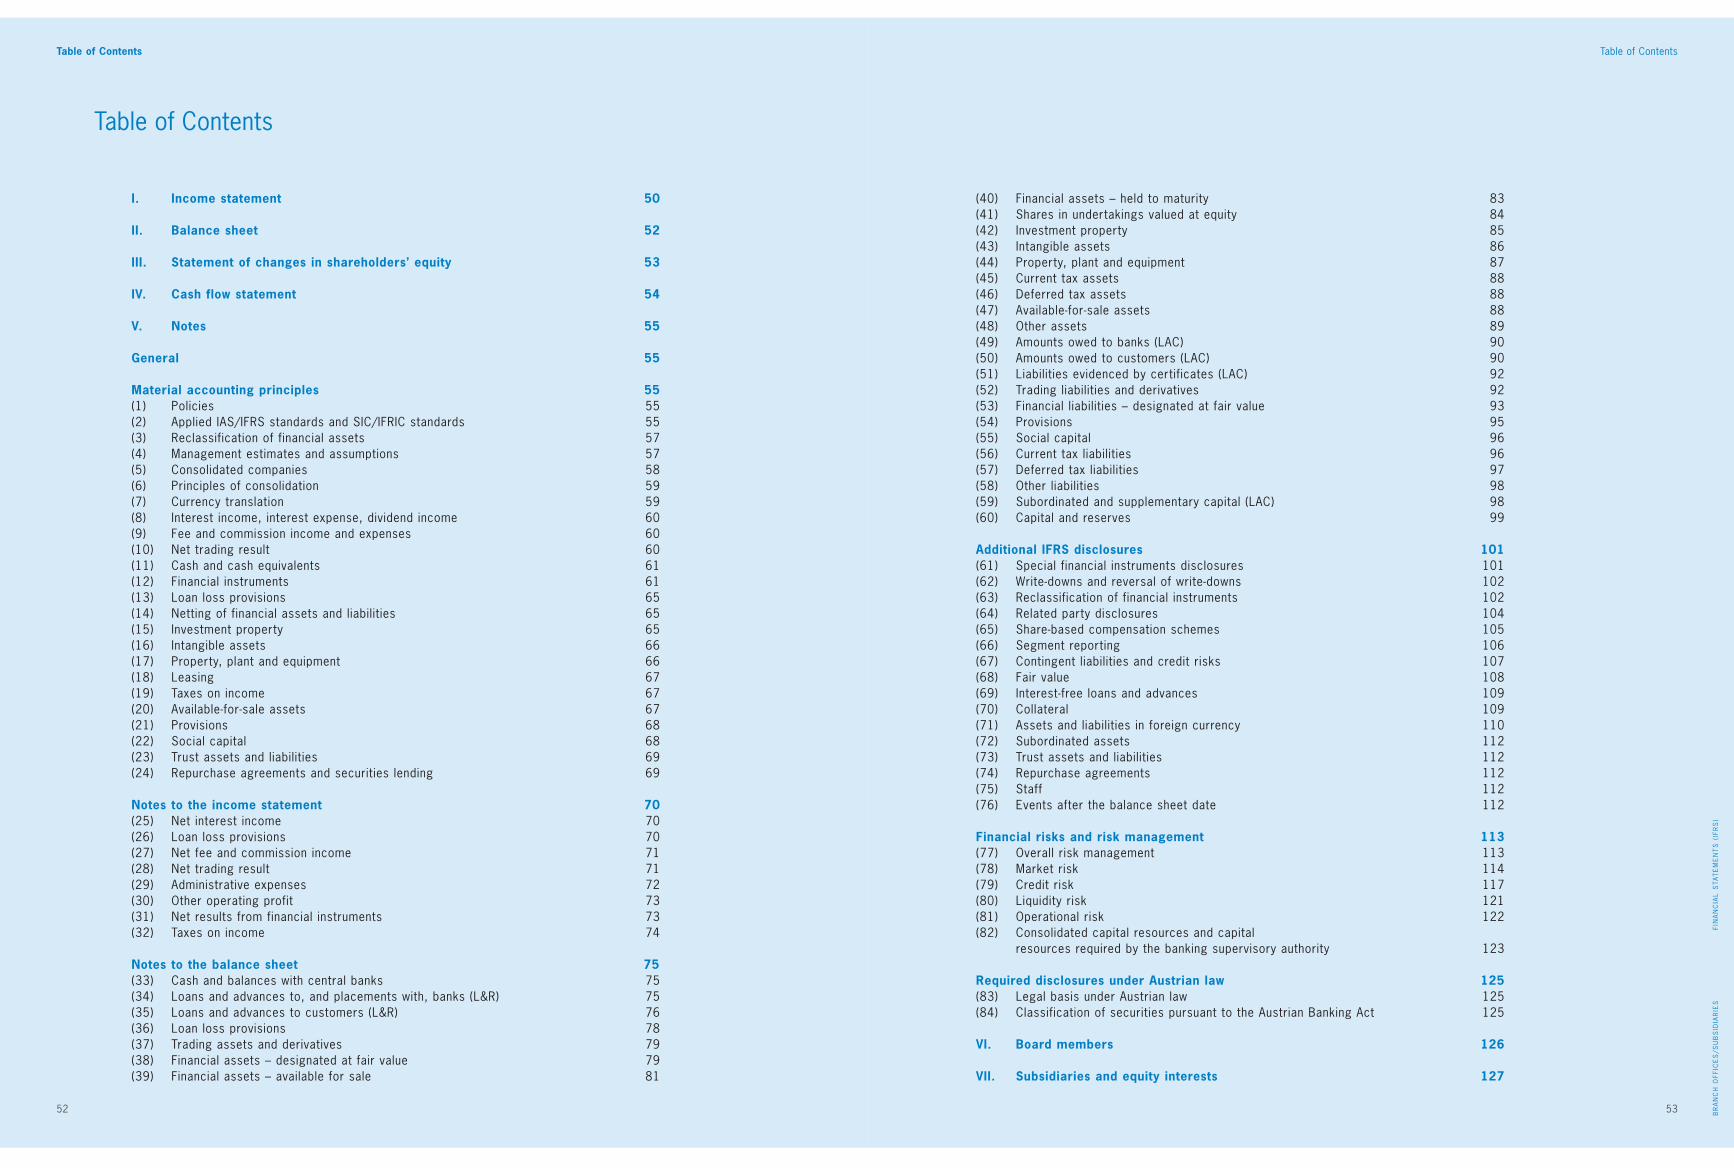
Foreword
52 53
Foreword
53
Table of ContentsTable of Contents
I. Income statement 50
II. Balance sheet 52
III. Statement of changes in shareholders’ equity 53
IV. Cash flow statement 54
V. Notes 55
General 55
Material accounting principles 55 (1) Policies 55 (2) Applied IAS/IFRS standards and SIC/IFRIC standards 55 (3) Reclassification of financial assets 57 (4) Management estimates and assumptions 57 (5) Consolidated companies 58 (6) Principles of consolidation 59 (7) Currency translation 59 (8) Interest income, interest expense, dividend income 60 (9) Fee and commission income and expenses 60 (10) Net trading result 60 (11) Cash and cash equivalents 61 (12) Financial instruments 61 (13) Loan loss provisions 65 (14) Netting of financial assets and liabilities 65 (15) Investment property 65 (16) Intangible assets 66 (17) Property, plant and equipment 66 (18) Leasing 67 (19) Taxes on income 67 (20) Available-for-sale assets 67 (21) Provisions 68 (22) Social capital 68 (23) Trust assets and liabilities 69 (24) Repurchase agreements and securities lending 69
Notes to the income statement 70 (25) Net interest income 70 (26) Loan loss provisions 70 (27) Net fee and commission income 71 (28) Net trading result 71 (29) Administrative expenses 72 (30) Other operating profit 73 (31) Net results from financial instruments 73 (32) Taxes on income 74
Notes to the balance sheet 75 (33) Cash and balances with central banks 75 (34) Loans and advances to, and placements with, banks (L&R) 75 (35) Loans and advances to customers (L&R) 76 (36) Loan loss provisions 78 (37) Trading assets and derivatives 79 (38) Financial assets – designated at fair value 79 (39) Financial assets – available for sale 81
(40) Financial assets – held to maturity 83 (41) Shares in undertakings valued at equity 84 (42) Investment property 85 (43) Intangible assets 86 (44) Property, plant and equipment 87 (45) Current tax assets 88 (46) Deferred tax assets 88 (47) Available-for-sale assets 88 (48) Other assets 89 (49) Amounts owed to banks (LAC) 90 (50) Amounts owed to customers (LAC) 90 (51) Liabilities evidenced by certificates (LAC) 92 (52) Trading liabilities and derivatives 92 (53) Financial liabilities – designated at fair value 93 (54) Provisions 95 (55) Social capital 96 (56) Current tax liabilities 96 (57) Deferred tax liabilities 97 (58) Other liabilities 98 (59) Subordinated and supplementary capital (LAC) 98 (60) Capital and reserves 99
Additional IFRS disclosures 101 (61) Special financial instruments disclosures 101 (62) Write-downs and reversal of write-downs 102 (63) Reclassification of financial instruments 102 (64) Related party disclosures 104 (65) Share-based compensation schemes 105 (66) Segment reporting 106 (67) Contingent liabilities and credit risks 107 (68) Fair value 108 (69) Interest-free loans and advances 109 (70) Collateral 109 (71) Assets and liabilities in foreign currency 110 (72) Subordinated assets 112 (73) Trust assets and liabilities 112 (74) Repurchase agreements 112 (75) Staff 112 (76) Events after the balance sheet date 112 Financial risks and risk management 113 (77) Overall risk management 113 (78) Market risk 114 (79) Credit risk 117 (80) Liquidity risk 121 (81) Operational risk 122 (82) Consolidated capital resources and capital resources required by the banking supervisory authority 123 Required disclosures under Austrian law 125 (83) Legal basis under Austrian law 125 (84) Classification of securities pursuant to the Austrian Banking Act 125 VI. Board members 126 VII. Subsidiaries and equity interests 127
Table of Contents
BR
AN
CH
OFF
ICE
S/S
UB
SID
IAR
IES
FIN
AN
CIA
L S
TAT
EM
EN
TS
(IF
RS
)

Foreword
54 55
Foreword
FIN
AN
CIA
L S
TAT
EM
EN
TS
(IF
RS
)B
RA
NC
H O
FFIC
ES
/SU
BS
IDIA
RIE
S
55
Income statementIncome statement
I. Income statement
in ’000 EUR (Notes) 2008 2007 Change
in ’000 EUR in %
Interest and similar income 568,661 482,299 86,362 17.9
Interest and similar expenses -455,631 -371,877 -83,754 22.5
Net interest income (25) 113,030 110,422 2,608 2.4
Loan loss provisions (26) -16,286 -28,068 11,782 -42.0
Net interest income after loan loss provisions 96,744 82,354 14,390 17.5
Fee and commission income 47,105 53,077 -5,972 -11.3
Fee and commission expenses -5,236 -6,353 1,117 -17.6
Net fee and commission income (27) 41,869 46,724 -4,855 -10.4
Net trading result (28) -2,135 629 -2,764 > -100.0
Administrative expenses (29) -83,863 -78,089 -5,774 7.4
Other operating profit (30) 6,007 9,446 -3,439 -36.4
Operating results 58,622 61,064 -2,442 -4.0
Net results from financial instruments (31) -5,784 -1,409 -4,375 > 100.0
Result from equity consolidation -2,834 391 -3,225 > -100.0
Results of ordinary business activities 50,004 60,046 -10,042 -16.7
Taxes on income (32) -9,239 -20,841 11,602 -55.7
Net income after taxes 40,765 39,205 1,560 4.0
Net income after taxes attributable to minority interests -384 -489 105 -21.5
Consolidated net income 40,381 38,716 1,665 4.3
Reconciliation to consolidated net profit
in ’000 EUR 2008 2007 Change
in ’000 EUR in %
Consolidated net income 40,381 38,716 1,665 4.3
Allocation to reserves -29,581 -29,386 -195 0.7
Consolidated net profit 10,800 9,330 1,470 15.8
Earnings per share and participation certificate
in ’000 EUR 2008 2007 Change
in ’000 EUR in %
Net profit after minority interests in '000 EUR 40,381 38,716 1,665 4.3
.thereof stock shareholders 38,095 36,740 1,355 3.7
.thereof participation certificate holders 2,286 1,976 310 15.7
Number of shares at 31 December 293,000 293,000 0 0.0
Number of participation certificates at 31 December 1,000,000 300,000 700,000 233.3
Earnings per share in EUR 130.02 125.39 4.62 3.7
Earnings per participation certificate in EUR 2.29 6.59 -4.30 -65.3
Income statement (quarter by quarter)
in ’000 EUR Q1 Q2 Q3 Q4 Total
2007 2007 2007 2007 2007
Net interest income 26,995 27,329 27,090 29,008 110,422
Loan loss provisions -8,213 -7,295 -5,217 -7,343 -28,068
Net fee and commission income 10,867 10,864 12,313 12,680 46,724
Net trading result 1,698 2,750 189 -4,008 629
Administrative expenses -19,646 -19,060 -19,828 -19,555 -78,089
Other operating profit 1,708 2,245 3,182 2,311 9,446
Net results from financial instruments 233 -1,144 -535 37 -1,409
Result from equity consolidation 600 -254 -764 809 391
Results of ordinary business activities 14,242 15,435 16,430 13,939 60,046
Taxes on income -3,450 -4,430 -7,265 -5,696 -20,841
Net income after taxes 10,792 11,005 9,165 8,243 39,205
Net income after taxes attributable to minority interests -76 -157 -121 -135 -489
Consolidated net income 10,716 10,848 9,044 8,108 38,716
in ’000 EUR Q1 Q2 Q3 Q4 Total
2008 2008 2008 2008 2008
Net interest income 27,883 29,176 32,007 23,964 113,030
Loan loss provisions -3,057 -7,787 -3,786 -1,656 -16,286
Net fee and commission income 10,357 10,771 10,622 10,119 41,869
Net trading result -1,939 -1,876 -1,580 3,260 -2,135
Administrative expenses -21,475 -21,225 -20,738 -20,425 -83,863
Other operating profit 1,173 2,267 1,502 1,065 6,007
Net results from financial instruments 1,440 2,881 -8,846 -1,259 -5,784
Result from equity consolidation -1,843 -974 463 -480 -2,834
Results of ordinary business activities 12,539 13,233 9,644 14,588 50,004
Taxes on income -3,154 -3,206 -3,606 727 -9,239
Net income after taxes 9,385 10,027 6,038 15,315 40,765
Net income after taxes attributable to minority interests -77 -161 -129 -17 -384
Consolidated net income 9,308 9,866 5,909 15,298 40,381
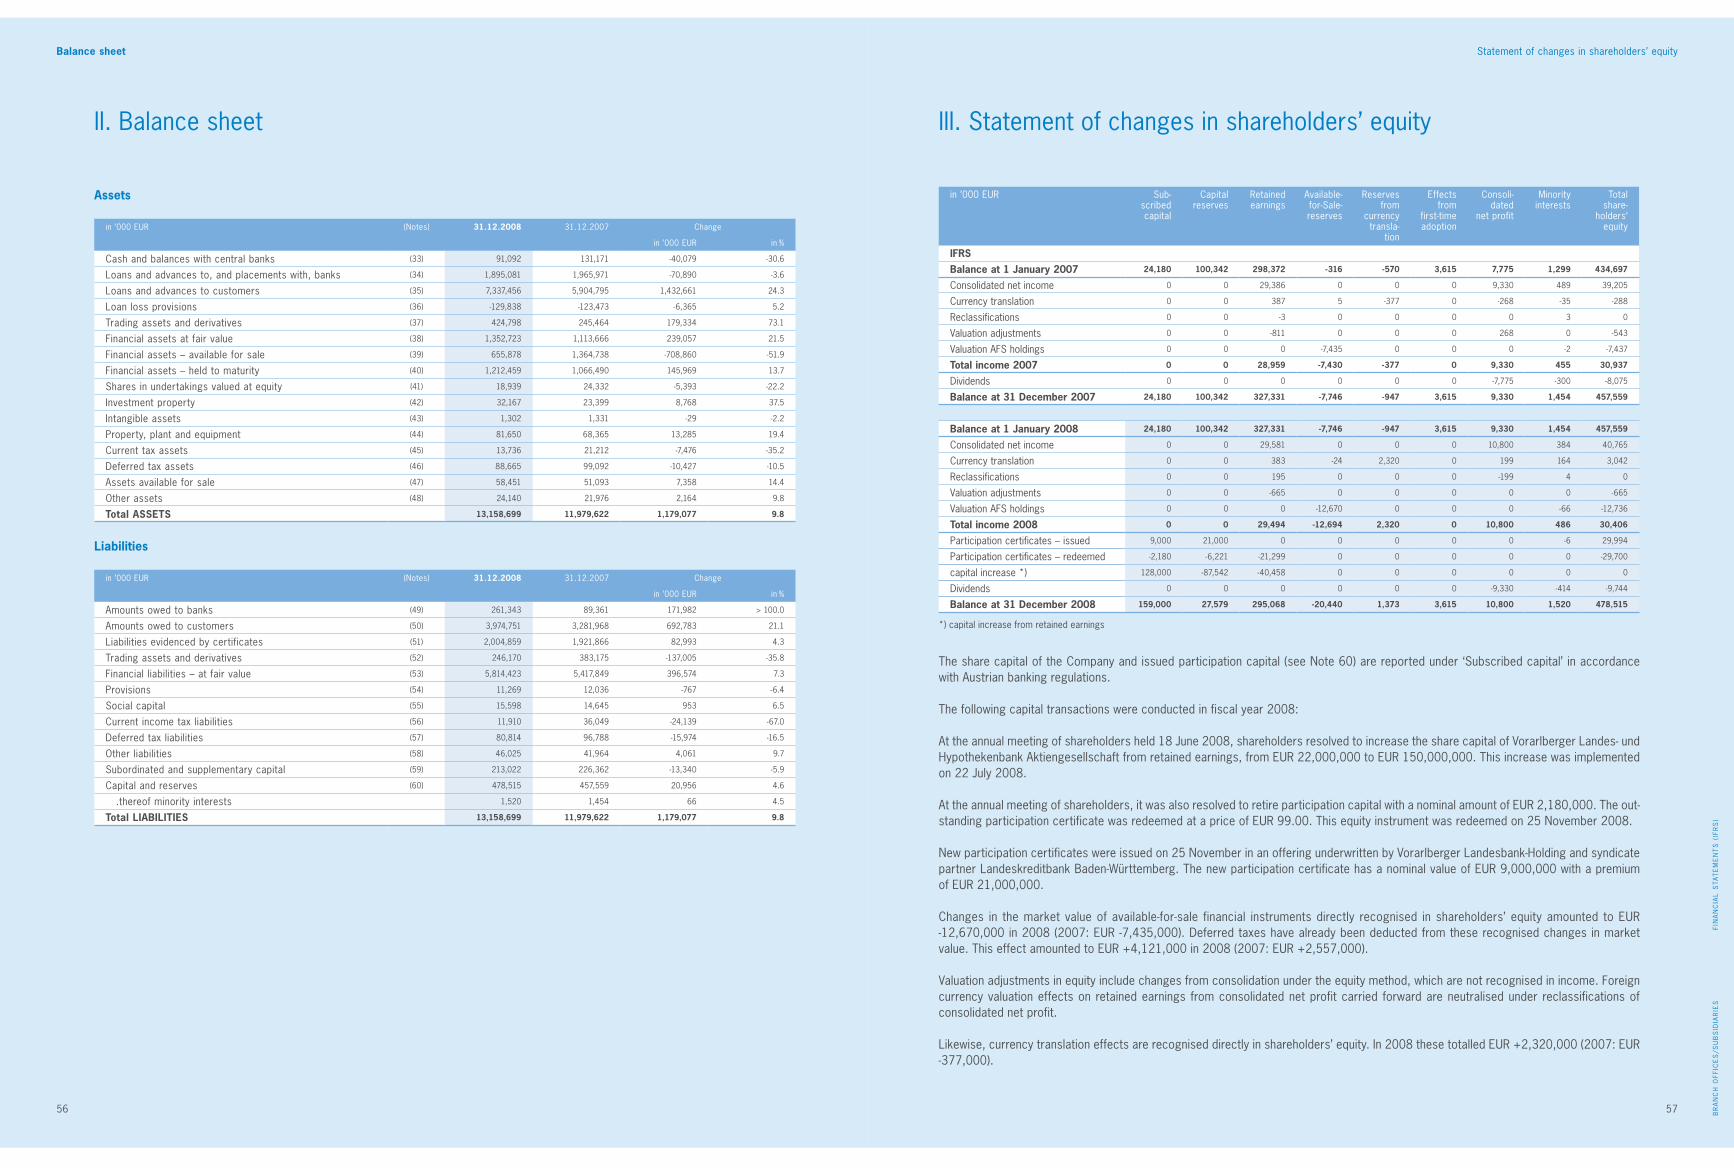
Foreword
56 57
Foreword
FIN
AN
CIA
L S
TAT
EM
EN
TS
(IF
RS
)B
RA
NC
H O
FFIC
ES
/SU
BS
IDIA
RIE
S
57
Balance sheet Statement of changes in shareholders’ equity
III. Statement of changes in shareholders’ equityII. Balance sheet
Assets
in ’000 EUR (Notes) 31.12.2008 31.12.2007 Change
in ’000 EUR in %
Cash and balances with central banks (33) 91,092 131,171 -40,079 -30.6
Loans and advances to, and placements with, banks (34) 1,895,081 1,965,971 -70,890 -3.6
Loans and advances to customers (35) 7,337,456 5,904,795 1,432,661 24.3
Loan loss provisions (36) -129,838 -123,473 -6,365 5.2
Trading assets and derivatives (37) 424,798 245,464 179,334 73.1
Financial assets at fair value (38) 1,352,723 1,113,666 239,057 21.5
Financial assets – available for sale (39) 655,878 1,364,738 -708,860 -51.9
Financial assets – held to maturity (40) 1,212,459 1,066,490 145,969 13.7
Shares in undertakings valued at equity (41) 18,939 24,332 -5,393 -22.2
Investment property (42) 32,167 23,399 8,768 37.5
Intangible assets (43) 1,302 1,331 -29 -2.2
Property, plant and equipment (44) 81,650 68,365 13,285 19.4
Current tax assets (45) 13,736 21,212 -7,476 -35.2
Deferred tax assets (46) 88,665 99,092 -10,427 -10.5
Assets available for sale (47) 58,451 51,093 7,358 14.4
Other assets (48) 24,140 21,976 2,164 9.8
Total ASSETS 13,158,699 11,979,622 1,179,077 9.8
Liabilities
in ’000 EUR (Notes) 31.12.2008 31.12.2007 Change
in ’000 EUR in %
Amounts owed to banks (49) 261,343 89,361 171,982 > 100.0
Amounts owed to customers (50) 3,974,751 3,281,968 692,783 21.1
Liabilities evidenced by certificates (51) 2,004,859 1,921,866 82,993 4.3
Trading assets and derivatives (52) 246,170 383,175 -137,005 -35.8
Financial liabilities – at fair value (53) 5,814,423 5,417,849 396,574 7.3
Provisions (54) 11,269 12,036 -767 -6.4
Social capital (55) 15,598 14,645 953 6.5
Current income tax liabilities (56) 11,910 36,049 -24,139 -67.0
Deferred tax liabilities (57) 80,814 96,788 -15,974 -16.5
Other liabilities (58) 46,025 41,964 4,061 9.7
Subordinated and supplementary capital (59) 213,022 226,362 -13,340 -5.9
Capital and reserves (60) 478,515 457,559 20,956 4.6
.thereof minority interests 1,520 1,454 66 4.5
Total LIABILITIES 13,158,699 11,979,622 1,179,077 9.8
The share capital of the Company and issued participation capital (see Note 60) are reported under ‘Subscribed capital’ in accordance with Austrian banking regulations.
The following capital transactions were conducted in fiscal year 2008:
At the annual meeting of shareholders held 18 June 2008, shareholders resolved to increase the share capital of Vorarlberger Landes- und Hypothekenbank Aktiengesellschaft from retained earnings, from EUR 22,000,000 to EUR 150,000,000. This increase was implemented on 22 July 2008.
At the annual meeting of shareholders, it was also resolved to retire participation capital with a nominal amount of EUR 2,180,000. The out-standing participation certificate was redeemed at a price of EUR 99.00. This equity instrument was redeemed on 25 November 2008.
New participation certificates were issued on 25 November in an offering underwritten by Vorarlberger Landesbank-Holding and syndicate partner Landeskreditbank Baden-Württemberg. The new participation certificate has a nominal value of EUR 9,000,000 with a premium of EUR 21,000,000.
Changes in the market value of available-for-sale financial instruments directly recognised in shareholders’ equity amounted to EUR -12,670,000 in 2008 (2007: EUR -7,435,000). Deferred taxes have already been deducted from these recognised changes in market value. This effect amounted to EUR +4,121,000 in 2008 (2007: EUR +2,557,000).
Valuation adjustments in equity include changes from consolidation under the equity method, which are not recognised in income. Foreign currency valuation effects on retained earnings from consolidated net profit carried forward are neutralised under reclassifications of consolidated net profit.
Likewise, currency translation effects are recognised directly in shareholders’ equity. In 2008 these totalled EUR +2,320,000 (2007: EUR -377,000).
in ’000 EUR Sub-scribedcapital
Capitalreserves
Retainedearnings
Available-for-Sale-reserves
Reserves from
currencytransla-
tion
Effectsfrom
first-timeadoption
Consoli-dated
net profit
Minorityinterests
Totalshare-
holders‘equity
IFRSBalance at 1 January 2007 24,180 100,342 298,372 -316 -570 3,615 7,775 1,299 434,697
Consolidated net income 0 0 29,386 0 0 0 9,330 489 39,205
Currency translation 0 0 387 5 -377 0 -268 -35 -288
Reclassifications 0 0 -3 0 0 0 0 3 0
Valuation adjustments 0 0 -811 0 0 0 268 0 -543
Valuation AFS holdings 0 0 0 -7,435 0 0 0 -2 -7,437
Total income 2007 0 0 28,959 -7,430 -377 0 9,330 455 30,937
Dividends 0 0 0 0 0 0 -7,775 -300 -8,075
Balance at 31 December 2007 24,180 100,342 327,331 -7,746 -947 3,615 9,330 1,454 457,559
Balance at 1 January 2008 24,180 100,342 327,331 -7,746 -947 3,615 9,330 1,454 457,559
Consolidated net income 0 0 29,581 0 0 0 10,800 384 40,765
Currency translation 0 0 383 -24 2,320 0 199 164 3,042
Reclassifications 0 0 195 0 0 0 -199 4 0
Valuation adjustments 0 0 -665 0 0 0 0 0 -665
Valuation AFS holdings 0 0 0 -12,670 0 0 0 -66 -12,736
Total income 2008 0 0 29,494 -12,694 2,320 0 10,800 486 30,406
Participation certificates – issued 9,000 21,000 0 0 0 0 0 -6 29,994
Participation certificates – redeemed -2,180 -6,221 -21,299 0 0 0 0 0 -29,700
capital increase *) 128,000 -87,542 -40,458 0 0 0 0 0 0
Dividends 0 0 0 0 0 0 -9,330 -414 -9,744
Balance at 31 December 2008 159,000 27,579 295,068 -20,440 1,373 3,615 10,800 1,520 478,515
*) capital increase from retained earnings

Foreword
58 59
Foreword
FIN
AN
CIA
L S
TAT
EM
EN
TS
(IF
RS
)B
RA
NC
H O
FFIC
ES
/SU
BS
IDIA
RIE
S
59
Material accounting principlesCash flow statement
General
Vorarlberger Landes- und Hypothekenbank Aktiengesellschaft and its subsidiaries offer customers a comprehensive portfolio of financial services. The core businesses include corporate services, private customers and private banking. These are complemented by a range of leasing, insurance, and real estate services. The Group’s core market is the province of Vorarlberg, plus the regions Eastern Switzerland, Southern Germany, and Southern Tyrol. The Bank operates locations in Vienna, Graz, and Wels in eastern Austria.
The Bank is a joint stock corporation with registered offices in Bregenz/Austria, and is registered in the companies register of Feldkirch, Austria (FN 145586y). The Bank is the parent of companies included in the consolidated financial statements. The Bank’s shareholders are disclosed under Note 64. The Bank’s business address is Hypo-Passage 1, 6900 Bregenz. All amounts are stated in euro thousands (EUR 000s) unless specified otherwise.
The publication of these financial statements was approved by the Managing Board of Vorarlberger Landes- und Hypothekenbank Aktien-gesellschaft on March 20, 2009. The financial statements of Vorarlberger Landes- und Hypothekenbank Aktiengesellschaft, included in the consolidated accounts after reconciliation with the applicable accounting principles, have not yet been presented to the Supervisory Board and the shareholders’ meeting for approval. Both the Supervisory Board and shareholders may adopt changes that could affect these consolidated financial statements.
The consolidated financial statements of Vorarlberger Landesbank Holding are published in the official journal of the Wiener Zeitung newspaper. Vorarlberger Landesbank-Holding is 100%-owned by the state of Vorarlberg.
Material accounting principles
The material accounting and valuation principles applied for the preparation of these consolidated financial statements are discussed below. These methods were applied by the consolidated companies on a uniform and constant basis for the relevant reporting periods, unless otherwise stated.
(1) PoliciesThese consolidated financial statements have been prepared in accordance with IFRS standards effective at 31 December 2008, as applicable in the European Union. The consolidated financial statements are based on the going-concern principle. Revenues and costs are recognised on a pro rata temporis basis and recorded in the period commercially accrued.
Financial instruments are accounted for on the basis of classification and measurement principles outlined in IAS 39. Hedge accounting does not apply to derivative hedging instruments. An asset is recognised on the balance sheet when it is likely that future economic benefit will be derived and its cost or other applicable valuation can be reliably measured. A liability is recognised on the balance sheet when it is probable that a direct outflow of resources conveying economic benefit will result from a present commitment, and the fulfilment amount can be reliably measured.
(2) Applied IAS/IFRS standards and SIC/IFRIC standardsThe consolidated financial statements take into account IFRS standards, the application of which was mandatory on the balance sheet date.The International Accounting Standards Board (IASB) has adopted a number of changes in connection with existing standards and issued new standards and interpretations that are mandatory for 2008. These regulations are applicable in the EU and concern the following areas:
•RevisionofIAS39–FinancialInstruments:RecognitionandMeasurement•RevisionofIFRS7onReclassificationsofFinancialAssets• IFRIC11TreasuryShareTransactionsunderIFRS2(applicableforreportingperiodsbeginningonorafter1March2007)
V. Notes
in ’000 EUR (Notes) 2008 2007
Net profit (before minority interests) 40,765 39,205
Non-cash items included in net profit andreconciliation to cash flow from operating activities Write-downs and write-ups of property, plant and equipment, fixed and current assets -23,489 25,877
Allocation/reversal of provisions/loan loss provisions 5,599 -2,419
Profit from the disposal of financial assets and property, plant and equipment 4,898 -1,895
Changes in other non-cash items 17,720 -24,731
Change in asset/liabilities in operatingactivities after adjustment for non-cash items Loans and advances to, and placements with, banks 103,757 -918,077
Loans and advances to customers -806,550 -677,639
Trading assets and derivatives -5,787 19,104
Other assets 24,282 -30,242
Amounts owed to banks 168,157 -3,617
Amounts owed to customers 643,872 668,400
Liabilities evidenced by certificates 83,479 424,599
Financial liabilities at fair value -227,991 792,294
Trading assets and derivatives -586 98,051
Other liabilities -36,263 38,000
Cash flows from operating activities -8,137 446,910
Proceeds from disposal/redemption of Financial assets 656,445 303,095
Property, plant and equipment and intangible assets 2,768 10,001
Outflows for investment in Financial assets -626,579 -678,490
Property, plant and equipment and intangible assets -45,215 -22,227
Cash flows from investing activities -12,581 -387,621
Inflows from capital increases 300 0
Non-cash changes in subordinated and supplementary capital -13,179 18,765
Dividend payments -9,744 -8,011
Cash flows from financing activities -22,623 10,754
Cash and balances with central banks at end of previous period 131,171 61,406
Cash flows from operating activities -8,137 446,910
Cash flows from investing activities -12,581 -387,621
Cash flows from financing activities -22,623 10,754
Effects of changes in exchange rate, valuation, consolidation 3,262 -278
Cash and balances with central banks at end of period (33) 91,092 131,171
Payments for interest, dividends/profit distributions and income taxes Interest received 555,753 440,104
Dividends and profit distributions received 3,908 13,777
Interest paid -451,155 -336,075
Taxes on income paid -35,074 -2,581
IV. Cash flow statement

Foreword
60 61
Foreword
FIN
AN
CIA
L S
TAT
EM
EN
TS
(IF
RS
)B
RA
NC
H O
FFIC
ES
/SU
BS
IDIA
RIE
S
61
Material accounting principlesMaterial accounting principles
Initial application of new accounting principles
The above revisions of existing standards and new standards and interpretations were initially applied in fiscal year 2008.
The IASB revisions of IAS 39 und IFRS 7 ‘Reclassification of Financial Assets’ adopted 13 October 2008 expand the options for reclas-sifying financial assets under certain circumstances. The revision was adopted by the Commission of the European Communities in directive (EU) no. 1004/2008 dated 15 October 2008, becoming effective European law on 17 October 2008. This revision serves to harmonise IAS 39 with US GAAP and more closely aligns accounting of financial instruments with business policy objectives.
Effective retroactively to 1 July 2008, the Group reclassified financial assets for which no active market exists as loans & receivables rather than available-for-sale assets. The assets were reclassified at fair value as of 1 July 2008, which constitutes the new cost basis. The difference between the new cost basis and estimated redemption amounts of each asset item at maturity is recorded in the valuation result of financial assets using the effective interest method. The revaluation reserve recorded upon reclassification of these assets is still shown under revaluation reserve, and likewise reversed using the effective interest method over the remaining maturity of the individual financial assets.
The effects of the revisions to IAS 39 and IFRS 7 are discussed in further detail in the Notes (3, 63). IFRIC interpretation 11 has no effect on the consolidated financial statements
New accounting principles not yet applied
The IASB has adopted additional standards or revised existing standards and interpretations that are not yet mandatory for the fiscal year 2008. The following standards had been adopted by the EU and published in the official journal prior to preparation of these con-solidated financial statements. The updates and revisions are applicable for reporting periods beginning on or after 1 January 2009.
• IFRS8OperatingSegments;applicationofthenewstandardwillleadtoareductioninthenumberofsegmentsandthedisconti-nuation of presenting a regional breakdown.
•RevisiontoIAS1PresentationofFinancialStatements;TheGroupwillapplyIAS1(revised)forreportingperiodsbeginningonorafter 1 January 2009. The application of this revised IAS will in particular affect the presentation of financial statement contents.
•RevisiontoIAS16Property,plantandequipment;theGroupintendstoapplytherevisionsstarting1January2009.Therevisionis not expected have a material impact on the Group.
•RevisiontoIAS19EmployeeBenefits;theGroupintendstoapplytherevisionsstarting1January2009.Therevisionisnotexpected have a material impact on the Group.
•RevisiontoIAS20AccountingforGovernmentGrantsandDisclosureofGovernmentAssistance;thisrevisionhasnoimpactonthe consolidated financial statements.
•RevisiontoIAS23BorrowingCosts;theoptionutilisedbytheBankofimmediatelyexpensingborrowingcostsinconnectionwithqualified assets in the income statement is disallowed starting 1 January 2009. From that date going forward, these must be capitalised as part of cost. This new rule is not anticipated to have a material impact.
•RevisiontoIAS27ConsolidatedFinancialStatementsandAccountingforInvestmentsinSubsidiaries–measurementofsubsidia-ries held for sale on the parent company’s separate financial statements; this revision has no impact on the consolidated financial statements.
•RevisiontoIAS28InvestmentsinAssociates;thisrevisionhasnoimpactontheconsolidatedfinancialstatements.•RevisiontoIAS29FinancialReportinginHyperinflationaryEconomies;thisrevisionhasnoimpactontheconsolidatedfinancial
statements.•RevisiontoIAS32FinancialInstruments:Presentation;theGroupintendstoapplytherevisionsstarting1January2009.
Application is not expected to have a material impact on the Group based on the information currently available.•RevisiontoIAS36ImpairmentofAssets;theGroupintendstoapplytherevisionsstarting1January2009.Therevisionisnot
expected to have a material impact on the consolidated financial statements based on the information currently available.•RevisiontoIAS38IntangibleAssets;thisrevisionhasnoimpactontheconsolidatedfinancialstatements.•RevisiontoIAS39FinancialInstruments:RecognitionandMeasurement;theGroupintendstoapplytherevisionsstarting1
January 2009. The application of this revised IAS will in particular affect the presentation of the consolidated financial statements.•RevisiontoIAS40InvestmentProperty;thisrevisionhasnoeffectontheconsolidatedfinancialstatements.•RevisiontoIAS41Agriculture;thisrevisionhasnoeffectontheconsolidatedfinancialstatements.
Although adopted by the IASB or IFRIC, the European Union had not yet implemented the following standards, revisions or interpreta-tions by the preparation date of these consolidated financial statements.
• IFRS3BusinessCombinations(revisedJanuary2008–applicableforreportingperiodsbeginningonorafter1July2009).TheGroup intends to apply the revised standards to future business combinations falling within the scope of this standard in reporting periods beginning on or after 1 July 2009.
• IAS27ConsolidatedFinancialStatementsandAccountingforInvestmentsinSubsidiariesunderIFRS(revisedJanuary2008–applicable for reporting periods beginning on or after 1 July 2009). The Group intends to apply the revised standards to future business combinations falling within the scope of this standard in reporting periods starting on or after 1 July 2009.
• IFRS1First-timeAdoption(revisedJanuary2008–applicableforreportingperiodsbeginningonorafter1January2009).Thisrevision will have no effect on the consolidated financial statements.
•RevisiontoIAS39FinancialInstruments:RecognitionandMeasurement–exposuresqualifyingforhedgeaccounting(revisedJuly2008 – applicable for reporting periods beginning on or after 1 July 2009). This revision will have no effect on the consolidated financial statements.
• IFRIC12ServiceConcessionArrangements(applicableforreportingperiodsbeginningonorafter1January2008)Thisrevisionwill have no effect on the consolidated financial statements.
• IFRIC15AgreementsfortheConstructionofRealEstate(applicableforreportingperiodsbeginningonorafter1January2008)This revision will have no effect on the consolidated financial statements.
• IFRIC16HedgesofaNetInvestmentinaForeignOperation(applicableforreportingperiodsbeginningonorafter1October2008). This revision will have no effect on the consolidated financial statements.
• IFRIC17DistributionsofNon-cashAssetstoOwners(applicableforreportingperiodsbeginningonorafter1July2009)Thisrevi-sion will have no effect on the consolidated financial statements.
• IFRIC18TransfersofAssetsfromCustomers(applicableforreportingperiodsbeginningonorafter1July2009).Thisrevisionwill have no effect on the consolidated financial statements.
(3) Reclassification of financial assetsOn 30 October 2008, management determined that the IAS 39 revisions issued by the IASB on 13 October and adopted by the EU on 16 October concerning the reclassification of financial instruments will be observed for certain fixed-interest securities for which no active market exists.
This reclassification applied to 65 securities with carrying value totalling EUR 368,632,000. In accordance with the IAS 39 revisions, reclassified instruments were carried at fair value measured as of the 1 July 2008 effective date. The effects of reclassification are presented under Note 63.
(4) Management estimates and assumptionsThe preparation of the consolidated financial statements requires management to make estimates and assumptions that affect balance sheet disclosures and the recognition of earnings and expenses in the reporting period. These estimates and assumptions primarily concern the recoverability of assets, the useful lives of property, plant and equipment used Group-wide, and the accounting for and valuation of accruals and provisions.
These estimates and assumptions are based on premises which in turn are based on current knowledge and information. Estimates regar-ding future business developments were made based on circumstances prevailing at the time of preparation of the consolidated financial statements, and on projections in relation to the global business and industry environment presumed to be reasonable. Actual values may vary from original estimates due to developments outside management’s control. The assumptions underlying estimates more substantial in scope are discussed in the following. In certain cases actual values may vary from projected values that are based on assumptions and estimates.
a) Impairment of ‘loans and advances to, and placements with, banks’ and ‘loans and advances to customers’The Group tests the credit portfolio at least quarterly for impairments. This involves identifying events reducing future expected cash flows in the credit portfolio. Indications of impairment include non-compliance with maturities and agreements, observed deterioration in customers’ commercial position, and rating changes. Management planning takes into account future cash flow assumptions based on historical default data for comparable credit portfolios.
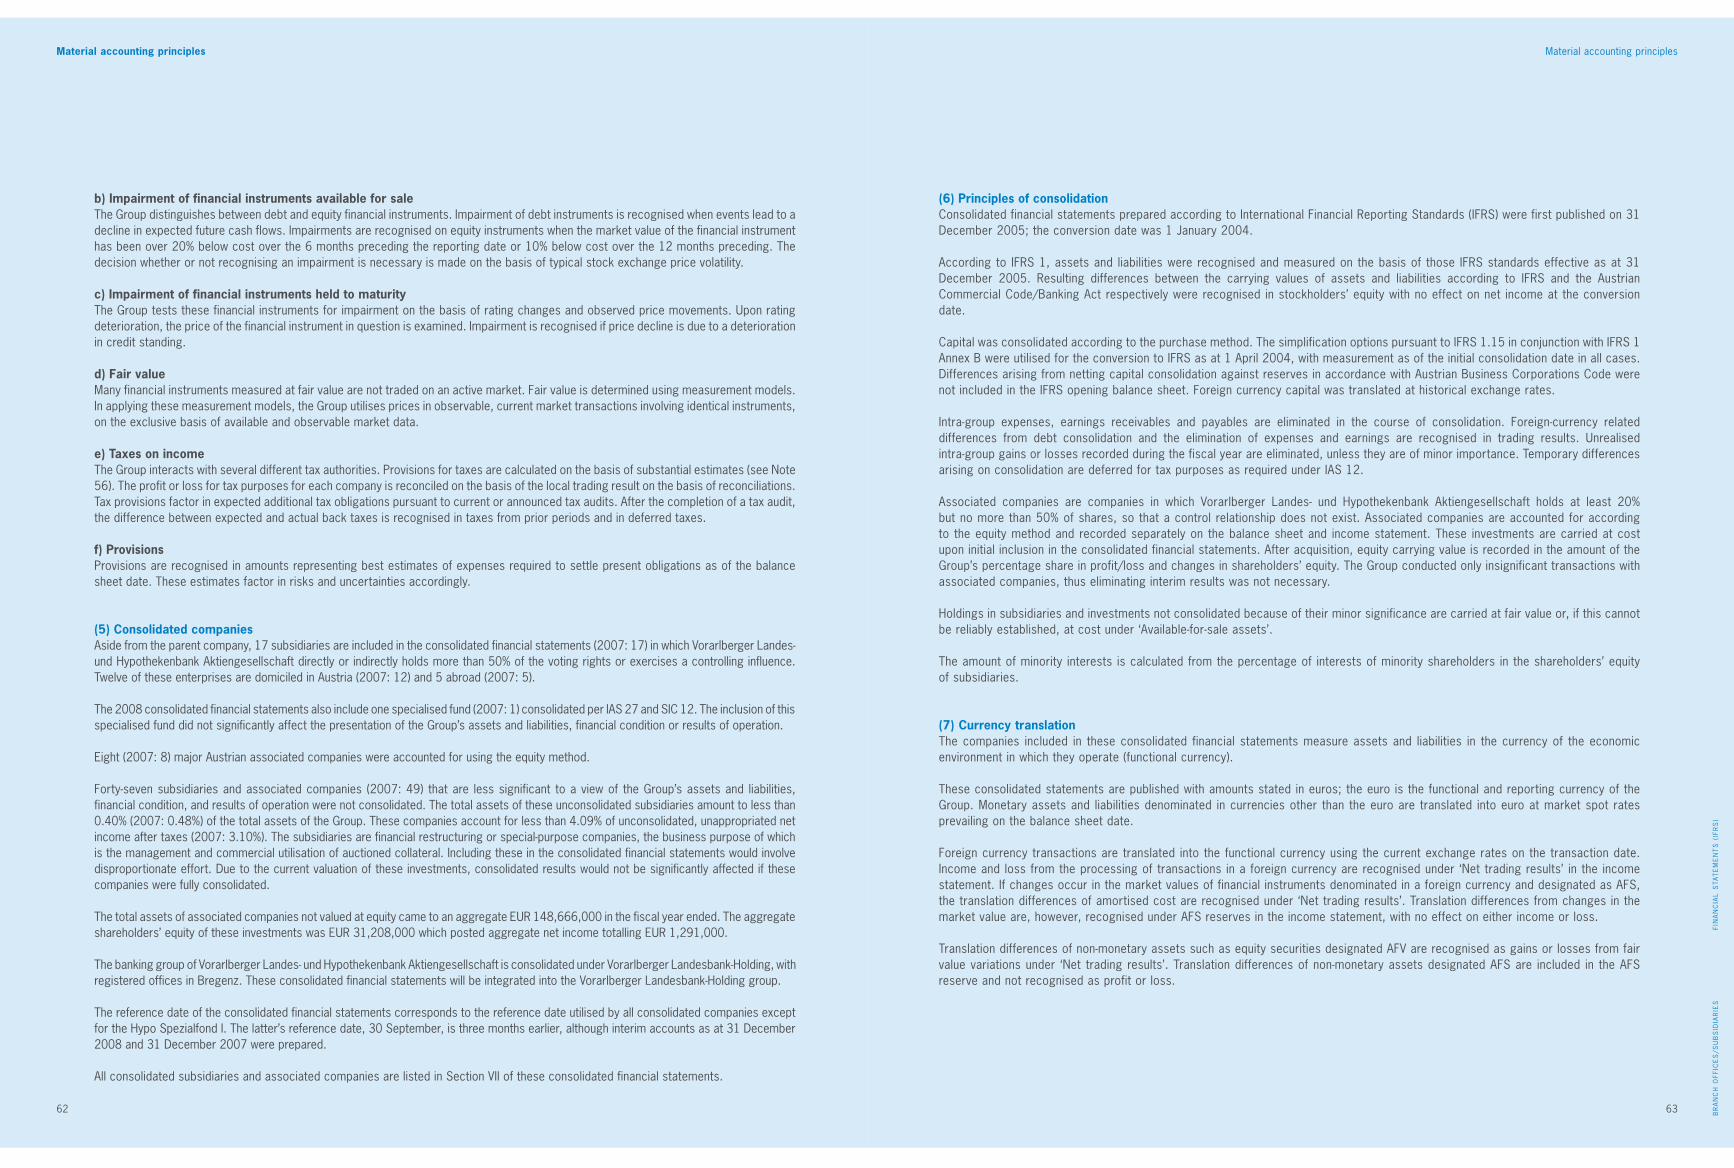
Foreword
62 63
Foreword
FIN
AN
CIA
L S
TAT
EM
EN
TS
(IF
RS
)B
RA
NC
H O
FFIC
ES
/SU
BS
IDIA
RIE
S
63
Material accounting principlesMaterial accounting principles
b) Impairment of financial instruments available for saleThe Group distinguishes between debt and equity financial instruments. Impairment of debt instruments is recognised when events lead to a decline in expected future cash flows. Impairments are recognised on equity instruments when the market value of the financial instrument has been over 20% below cost over the 6 months preceding the reporting date or 10% below cost over the 12 months preceding. The decision whether or not recognising an impairment is necessary is made on the basis of typical stock exchange price volatility.
c) Impairment of financial instruments held to maturityThe Group tests these financial instruments for impairment on the basis of rating changes and observed price movements. Upon rating deterioration, the price of the financial instrument in question is examined. Impairment is recognised if price decline is due to a deterioration in credit standing.
d) Fair valueMany financial instruments measured at fair value are not traded on an active market. Fair value is determined using measurement models. In applying these measurement models, the Group utilises prices in observable, current market transactions involving identical instruments, on the exclusive basis of available and observable market data.
e) Taxes on incomeThe Group interacts with several different tax authorities. Provisions for taxes are calculated on the basis of substantial estimates (see Note 56). The profit or loss for tax purposes for each company is reconciled on the basis of the local trading result on the basis of reconciliations. Tax provisions factor in expected additional tax obligations pursuant to current or announced tax audits. After the completion of a tax audit, the difference between expected and actual back taxes is recognised in taxes from prior periods and in deferred taxes.
f) ProvisionsProvisions are recognised in amounts representing best estimates of expenses required to settle present obligations as of the balance sheet date. These estimates factor in risks and uncertainties accordingly.
(5) Consolidated companiesAside from the parent company, 17 subsidiaries are included in the consolidated financial statements (2007: 17) in which Vorarlberger Landes- und Hypothekenbank Aktiengesellschaft directly or indirectly holds more than 50% of the voting rights or exercises a controlling influence. Twelve of these enterprises are domiciled in Austria (2007: 12) and 5 abroad (2007: 5).
The 2008 consolidated financial statements also include one specialised fund (2007: 1) consolidated per IAS 27 and SIC 12. The inclusion of this specialised fund did not significantly affect the presentation of the Group’s assets and liabilities, financial condition or results of operation.
Eight (2007: 8) major Austrian associated companies were accounted for using the equity method.
Forty-seven subsidiaries and associated companies (2007: 49) that are less significant to a view of the Group’s assets and liabilities, financial condition, and results of operation were not consolidated. The total assets of these unconsolidated subsidiaries amount to less than 0.40% (2007: 0.48%) of the total assets of the Group. These companies account for less than 4.09% of unconsolidated, unappropriated net income after taxes (2007: 3.10%). The subsidiaries are financial restructuring or special-purpose companies, the business purpose of which is the management and commercial utilisation of auctioned collateral. Including these in the consolidated financial statements would involve disproportionate effort. Due to the current valuation of these investments, consolidated results would not be significantly affected if these companies were fully consolidated.
The total assets of associated companies not valued at equity came to an aggregate EUR 148,666,000 in the fiscal year ended. The aggregate shareholders’ equity of these investments was EUR 31,208,000 which posted aggregate net income totalling EUR 1,291,000. The banking group of Vorarlberger Landes- und Hypothekenbank Aktiengesellschaft is consolidated under Vorarlberger Landesbank-Holding, with registered offices in Bregenz. These consolidated financial statements will be integrated into the Vorarlberger Landesbank-Holding group.
The reference date of the consolidated financial statements corresponds to the reference date utilised by all consolidated companies except for the Hypo Spezialfond I. The latter’s reference date, 30 September, is three months earlier, although interim accounts as at 31 December 2008 and 31 December 2007 were prepared.
All consolidated subsidiaries and associated companies are listed in Section VII of these consolidated financial statements.
(6) Principles of consolidationConsolidated financial statements prepared according to International Financial Reporting Standards (IFRS) were first published on 31 December 2005; the conversion date was 1 January 2004.
According to IFRS 1, assets and liabilities were recognised and measured on the basis of those IFRS standards effective as at 31 December 2005. Resulting differences between the carrying values of assets and liabilities according to IFRS and the Austrian Commercial Code/Banking Act respectively were recognised in stockholders’ equity with no effect on net income at the conversion date.
Capital was consolidated according to the purchase method. The simplification options pursuant to IFRS 1.15 in conjunction with IFRS 1 Annex B were utilised for the conversion to IFRS as at 1 April 2004, with measurement as of the initial consolidation date in all cases. Differences arising from netting capital consolidation against reserves in accordance with Austrian Business Corporations Code were not included in the IFRS opening balance sheet. Foreign currency capital was translated at historical exchange rates.
Intra-group expenses, earnings receivables and payables are eliminated in the course of consolidation. Foreign-currency related differences from debt consolidation and the elimination of expenses and earnings are recognised in trading results. Unrealised intra-group gains or losses recorded during the fiscal year are eliminated, unless they are of minor importance. Temporary differences arising on consolidation are deferred for tax purposes as required under IAS 12.
Associated companies are companies in which Vorarlberger Landes- und Hypothekenbank Aktiengesellschaft holds at least 20% but no more than 50% of shares, so that a control relationship does not exist. Associated companies are accounted for according to the equity method and recorded separately on the balance sheet and income statement. These investments are carried at cost upon initial inclusion in the consolidated financial statements. After acquisition, equity carrying value is recorded in the amount of the Group’s percentage share in profit/loss and changes in shareholders’ equity. The Group conducted only insignificant transactions with associated companies, thus eliminating interim results was not necessary.
Holdings in subsidiaries and investments not consolidated because of their minor significance are carried at fair value or, if this cannot be reliably established, at cost under ‘Available-for-sale assets’.
The amount of minority interests is calculated from the percentage of interests of minority shareholders in the shareholders’ equity of subsidiaries.
(7) Currency translationThe companies included in these consolidated financial statements measure assets and liabilities in the currency of the economic environment in which they operate (functional currency).
These consolidated statements are published with amounts stated in euros; the euro is the functional and reporting currency of the Group. Monetary assets and liabilities denominated in currencies other than the euro are translated into euro at market spot rates prevailing on the balance sheet date.
Foreign currency transactions are translated into the functional currency using the current exchange rates on the transaction date. Income and loss from the processing of transactions in a foreign currency are recognised under ‘Net trading results’ in the income statement. If changes occur in the market values of financial instruments denominated in a foreign currency and designated as AFS, the translation differences of amortised cost are recognised under ‘Net trading results’. Translation differences from changes in the market value are, however, recognised under AFS reserves in the income statement, with no effect on either income or loss.
Translation differences of non-monetary assets such as equity securities designated AFV are recognised as gains or losses from fair value variations under ‘Net trading results’. Translation differences of non-monetary assets designated AFS are included in the AFS reserve and not recognised as profit or loss.
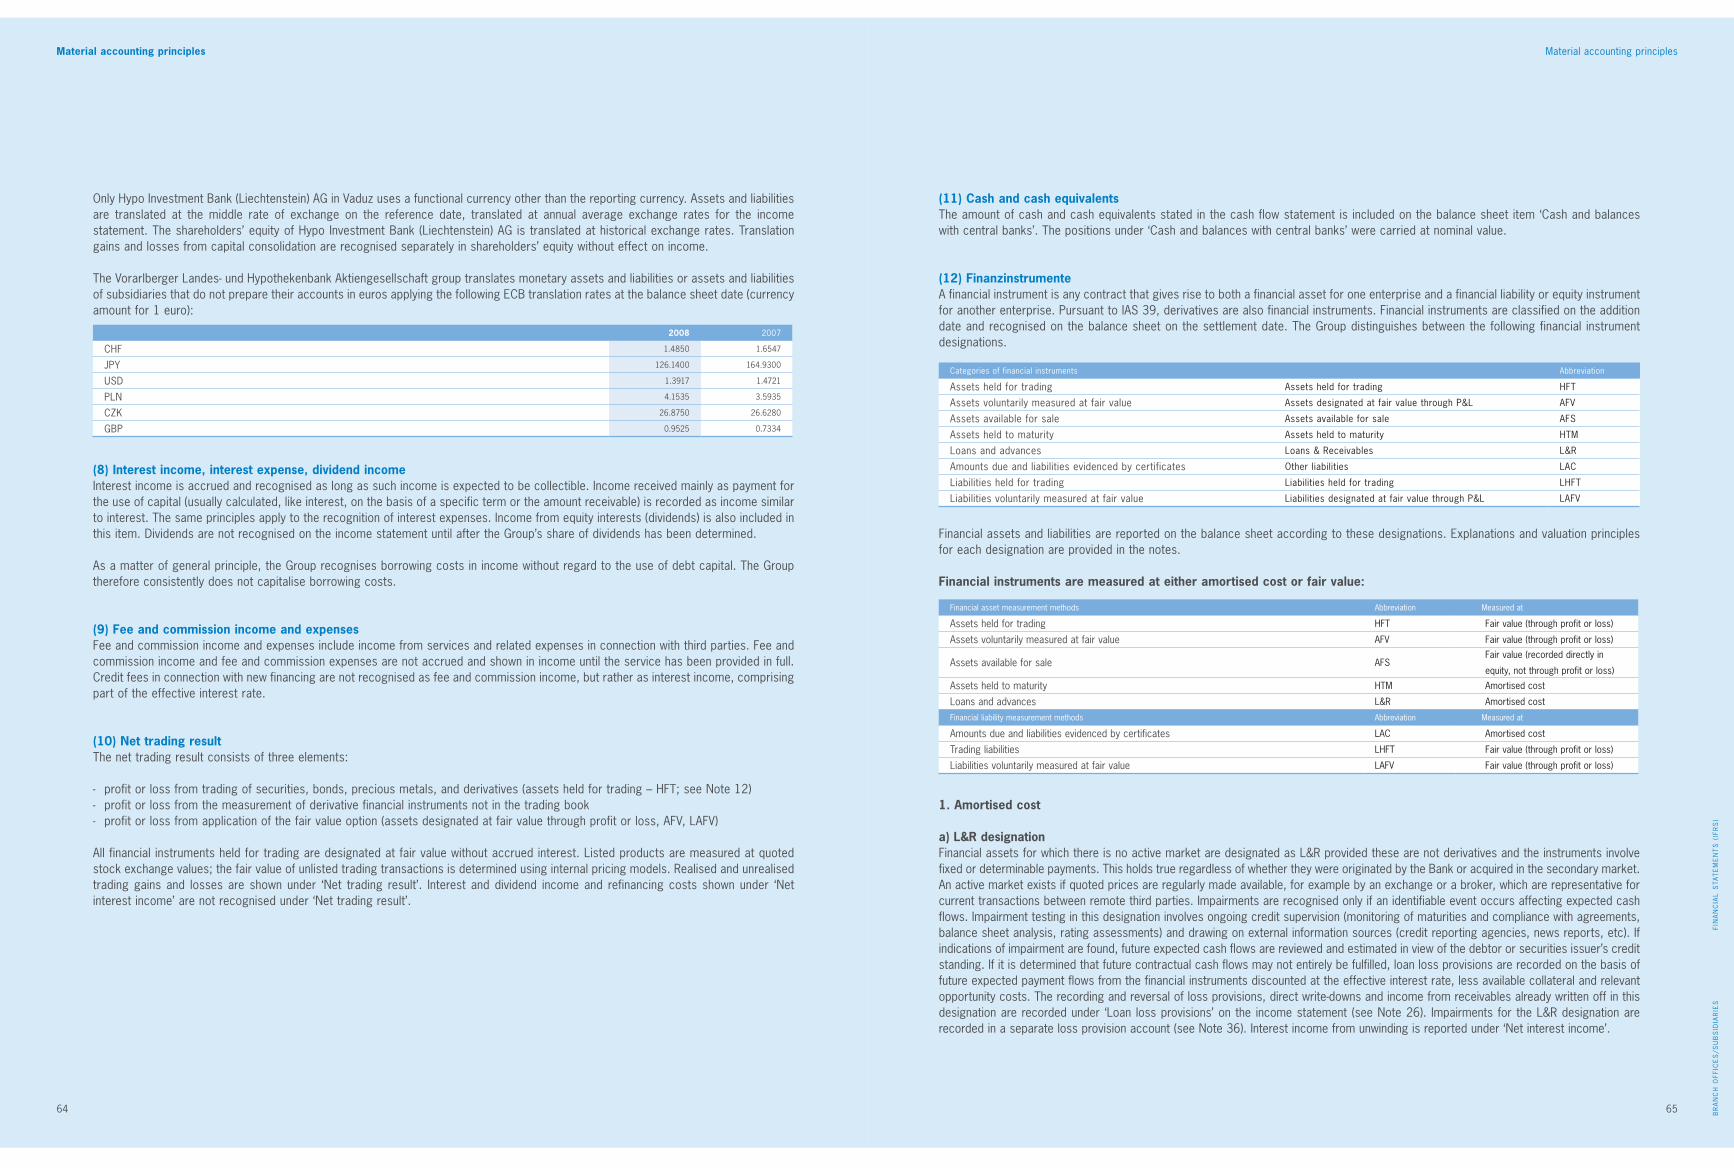
Foreword
64 65
Foreword
FIN
AN
CIA
L S
TAT
EM
EN
TS
(IF
RS
)B
RA
NC
H O
FFIC
ES
/SU
BS
IDIA
RIE
S
65
Material accounting principlesMaterial accounting principles
Only Hypo Investment Bank (Liechtenstein) AG in Vaduz uses a functional currency other than the reporting currency. Assets and liabilities are translated at the middle rate of exchange on the reference date, translated at annual average exchange rates for the income statement. The shareholders’ equity of Hypo Investment Bank (Liechtenstein) AG is translated at historical exchange rates. Translation gains and losses from capital consolidation are recognised separately in shareholders’ equity without effect on income.
The Vorarlberger Landes- und Hypothekenbank Aktiengesellschaft group translates monetary assets and liabilities or assets and liabilities of subsidiaries that do not prepare their accounts in euros applying the following ECB translation rates at the balance sheet date (currency amount for 1 euro):
(8) Interest income, interest expense, dividend incomeInterest income is accrued and recognised as long as such income is expected to be collectible. Income received mainly as payment for the use of capital (usually calculated, like interest, on the basis of a specific term or the amount receivable) is recorded as income similar to interest. The same principles apply to the recognition of interest expenses. Income from equity interests (dividends) is also included in this item. Dividends are not recognised on the income statement until after the Group’s share of dividends has been determined.
As a matter of general principle, the Group recognises borrowing costs in income without regard to the use of debt capital. The Group therefore consistently does not capitalise borrowing costs.
(9) Fee and commission income and expensesFee and commission income and expenses include income from services and related expenses in connection with third parties. Fee and commission income and fee and commission expenses are not accrued and shown in income until the service has been provided in full. Credit fees in connection with new financing are not recognised as fee and commission income, but rather as interest income, comprising part of the effective interest rate.
(10) Net trading resultThe net trading result consists of three elements:
- profit or loss from trading of securities, bonds, precious metals, and derivatives (assets held for trading – HFT; see Note 12)- profit or loss from the measurement of derivative financial instruments not in the trading book- profit or loss from application of the fair value option (assets designated at fair value through profit or loss, AFV, LAFV)
All financial instruments held for trading are designated at fair value without accrued interest. Listed products are measured at quoted stock exchange values; the fair value of unlisted trading transactions is determined using internal pricing models. Realised and unrealised trading gains and losses are shown under ‘Net trading result’. Interest and dividend income and refinancing costs shown under ‘Net interest income’ are not recognised under ‘Net trading result’.
(11) Cash and cash equivalentsThe amount of cash and cash equivalents stated in the cash flow statement is included on the balance sheet item ‘Cash and balances with central banks’. The positions under ‘Cash and balances with central banks’ were carried at nominal value.
(12) FinanzinstrumenteA financial instrument is any contract that gives rise to both a financial asset for one enterprise and a financial liability or equity instrument for another enterprise. Pursuant to IAS 39, derivatives are also financial instruments. Financial instruments are classified on the addition date and recognised on the balance sheet on the settlement date. The Group distinguishes between the following financial instrument designations.
Financial assets and liabilities are reported on the balance sheet according to these designations. Explanations and valuation principles for each designation are provided in the notes.
Financial instruments are measured at either amortised cost or fair value:
1. Amortised cost
a) L&R designationFinancial assets for which there is no active market are designated as L&R provided these are not derivatives and the instruments involve fixed or determinable payments. This holds true regardless of whether they were originated by the Bank or acquired in the secondary market. An active market exists if quoted prices are regularly made available, for example by an exchange or a broker, which are representative for current transactions between remote third parties. Impairments are recognised only if an identifiable event occurs affecting expected cash flows. Impairment testing in this designation involves ongoing credit supervision (monitoring of maturities and compliance with agreements, balance sheet analysis, rating assessments) and drawing on external information sources (credit reporting agencies, news reports, etc). If indications of impairment are found, future expected cash flows are reviewed and estimated in view of the debtor or securities issuer’s credit standing. If it is determined that future contractual cash flows may not entirely be fulfilled, loan loss provisions are recorded on the basis of future expected payment flows from the financial instruments discounted at the effective interest rate, less available collateral and relevant opportunity costs. The recording and reversal of loss provisions, direct write-downs and income from receivables already written off in this designation are recorded under ‘Loan loss provisions’ on the income statement (see Note 26). Impairments for the L&R designation are recorded in a separate loss provision account (see Note 36). Interest income from unwinding is reported under ‘Net interest income’.
Categories of financial instruments Abbreviation
Assets held for trading Assets held for trading HFT
Assets voluntarily measured at fair value Assets designated at fair value through P&L AFV
Assets available for sale Assets available for sale AFS
Assets held to maturity Assets held to maturity HTM
Loans and advances Loans & Receivables L&R
Amounts due and liabilities evidenced by certificates Other liabilities LAC
Liabilities held for trading Liabilities held for trading LHFT
Liabilities voluntarily measured at fair value Liabilities designated at fair value through P&L LAFV
Financial asset measurement methods Abbreviation Measured at
Assets held for trading HFT Fair value (through profit or loss)
Assets voluntarily measured at fair value AFV Fair value (through profit or loss)
Assets available for sale AFSFair value (recorded directly in
equity, not through profit or loss)
Assets held to maturity HTM Amortised cost
Loans and advances L&R Amortised cost
Financial liability measurement methods Abbreviation Measured at
Amounts due and liabilities evidenced by certificates LAC Amortised cost
Trading liabilities LHFT Fair value (through profit or loss)
Liabilities voluntarily measured at fair value LAFV Fair value (through profit or loss)
2008 2007
CHF 1.4850 1.6547
JPy 126.1400 164.9300
USD 1.3917 1.4721
PLN 4.1535 3.5935
CZK 26.8750 26.6280
GBP 0.9525 0.7334
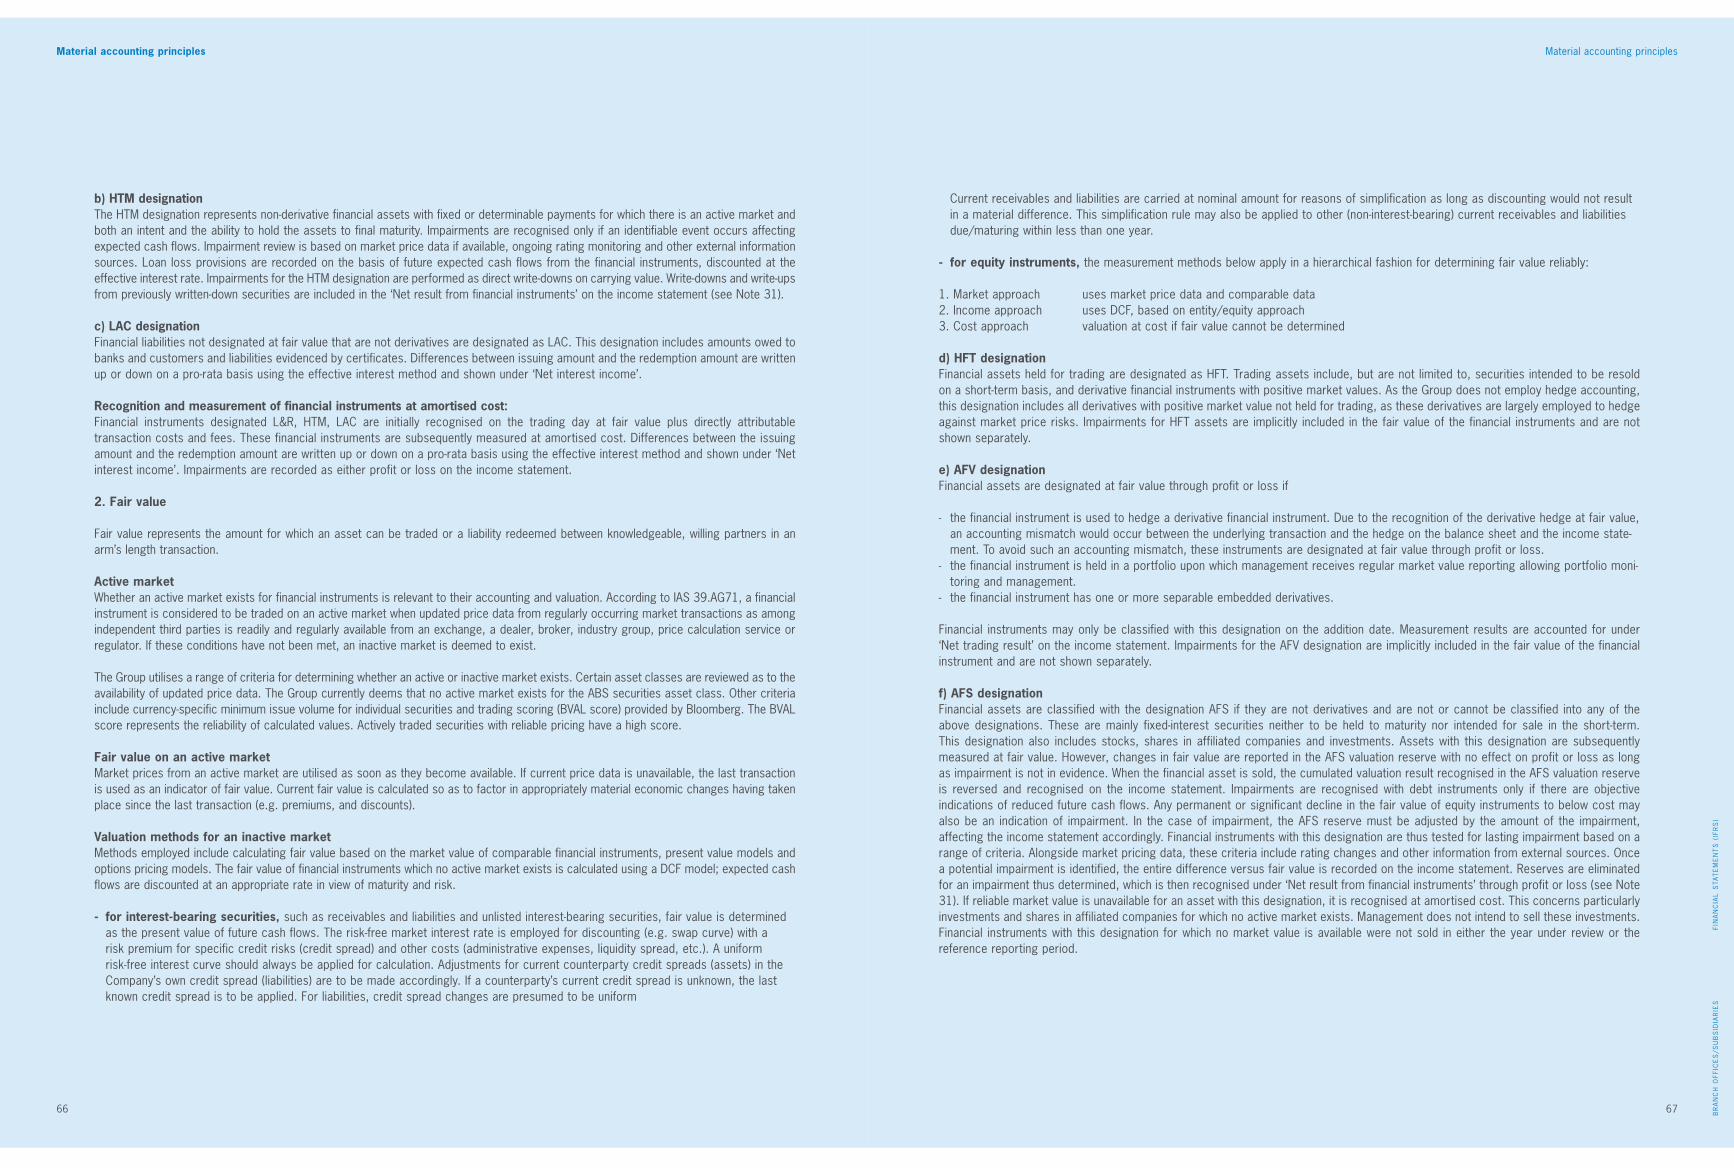
Foreword
66 67
Foreword
FIN
AN
CIA
L S
TAT
EM
EN
TS
(IF
RS
)B
RA
NC
H O
FFIC
ES
/SU
BS
IDIA
RIE
S
67
Material accounting principlesMaterial accounting principles
b) HTM designationThe HTM designation represents non-derivative financial assets with fixed or determinable payments for which there is an active market and both an intent and the ability to hold the assets to final maturity. Impairments are recognised only if an identifiable event occurs affecting expected cash flows. Impairment review is based on market price data if available, ongoing rating monitoring and other external information sources. Loan loss provisions are recorded on the basis of future expected cash flows from the financial instruments, discounted at the effective interest rate. Impairments for the HTM designation are performed as direct write-downs on carrying value. Write-downs and write-ups from previously written-down securities are included in the ‘Net result from financial instruments’ on the income statement (see Note 31).
c) LAC designationFinancial liabilities not designated at fair value that are not derivatives are designated as LAC. This designation includes amounts owed to banks and customers and liabilities evidenced by certificates. Differences between issuing amount and the redemption amount are written up or down on a pro-rata basis using the effective interest method and shown under ‘Net interest income’.
Recognition and measurement of financial instruments at amortised cost:Financial instruments designated L&R, HTM, LAC are initially recognised on the trading day at fair value plus directly attributable transaction costs and fees. These financial instruments are subsequently measured at amortised cost. Differences between the issuing amount and the redemption amount are written up or down on a pro-rata basis using the effective interest method and shown under ‘Net interest income’. Impairments are recorded as either profit or loss on the income statement.
2. Fair value
Fair value represents the amount for which an asset can be traded or a liability redeemed between knowledgeable, willing partners in an arm’s length transaction. Active marketWhether an active market exists for financial instruments is relevant to their accounting and valuation. According to IAS 39.AG71, a financial instrument is considered to be traded on an active market when updated price data from regularly occurring market transactions as among independent third parties is readily and regularly available from an exchange, a dealer, broker, industry group, price calculation service or regulator. If these conditions have not been met, an inactive market is deemed to exist.
The Group utilises a range of criteria for determining whether an active or inactive market exists. Certain asset classes are reviewed as to the availability of updated price data. The Group currently deems that no active market exists for the ABS securities asset class. Other criteria include currency-specific minimum issue volume for individual securities and trading scoring (BVAL score) provided by Bloomberg. The BVAL score represents the reliability of calculated values. Actively traded securities with reliable pricing have a high score.
Fair value on an active marketMarket prices from an active market are utilised as soon as they become available. If current price data is unavailable, the last transaction is used as an indicator of fair value. Current fair value is calculated so as to factor in appropriately material economic changes having taken place since the last transaction (e.g. premiums, and discounts).
Valuation methods for an inactive marketMethods employed include calculating fair value based on the market value of comparable financial instruments, present value models and options pricing models. The fair value of financial instruments which no active market exists is calculated using a DCF model; expected cash flows are discounted at an appropriate rate in view of maturity and risk.
- for interest-bearing securities, such as receivables and liabilities and unlisted interest-bearing securities, fair value is determined as the present value of future cash flows. The risk-free market interest rate is employed for discounting (e.g. swap curve) with a risk premium for specific credit risks (credit spread) and other costs (administrative expenses, liquidity spread, etc.). A uniform risk-free interest curve should always be applied for calculation. Adjustments for current counterparty credit spreads (assets) in the Company’s own credit spread (liabilities) are to be made accordingly. If a counterparty’s current credit spread is unknown, the last known credit spread is to be applied. For liabilities, credit spread changes are presumed to be uniform
Current receivables and liabilities are carried at nominal amount for reasons of simplification as long as discounting would not result in a material difference. This simplification rule may also be applied to other (non-interest-bearing) current receivables and liabilities due/maturing within less than one year.
- for equity instruments, the measurement methods below apply in a hierarchical fashion for determining fair value reliably:
1. Market approach uses market price data and comparable data2. Income approach uses DCF, based on entity/equity approach3. Cost approach valuation at cost if fair value cannot be determined
d) HFT designationFinancial assets held for trading are designated as HFT. Trading assets include, but are not limited to, securities intended to be resold on a short-term basis, and derivative financial instruments with positive market values. As the Group does not employ hedge accounting, this designation includes all derivatives with positive market value not held for trading, as these derivatives are largely employed to hedge against market price risks. Impairments for HFT assets are implicitly included in the fair value of the financial instruments and are not shown separately.
e) AFV designationFinancial assets are designated at fair value through profit or loss if
- the financial instrument is used to hedge a derivative financial instrument. Due to the recognition of the derivative hedge at fair value, an accounting mismatch would occur between the underlying transaction and the hedge on the balance sheet and the income state-ment. To avoid such an accounting mismatch, these instruments are designated at fair value through profit or loss.
- the financial instrument is held in a portfolio upon which management receives regular market value reporting allowing portfolio moni-toring and management.
- the financial instrument has one or more separable embedded derivatives.
Financial instruments may only be classified with this designation on the addition date. Measurement results are accounted for under ‘Net trading result’ on the income statement. Impairments for the AFV designation are implicitly included in the fair value of the financial instrument and are not shown separately.
f) AFS designationFinancial assets are classified with the designation AFS if they are not derivatives and are not or cannot be classified into any of the above designations. These are mainly fixed-interest securities neither to be held to maturity nor intended for sale in the short-term. This designation also includes stocks, shares in affiliated companies and investments. Assets with this designation are subsequently measured at fair value. However, changes in fair value are reported in the AFS valuation reserve with no effect on profit or loss as long as impairment is not in evidence. When the financial asset is sold, the cumulated valuation result recognised in the AFS valuation reserve is reversed and recognised on the income statement. Impairments are recognised with debt instruments only if there are objective indications of reduced future cash flows. Any permanent or significant decline in the fair value of equity instruments to below cost may also be an indication of impairment. In the case of impairment, the AFS reserve must be adjusted by the amount of the impairment, affecting the income statement accordingly. Financial instruments with this designation are thus tested for lasting impairment based on a range of criteria. Alongside market pricing data, these criteria include rating changes and other information from external sources. Once a potential impairment is identified, the entire difference versus fair value is recorded on the income statement. Reserves are eliminated for an impairment thus determined, which is then recognised under ‘Net result from financial instruments’ through profit or loss (see Note 31). If reliable market value is unavailable for an asset with this designation, it is recognised at amortised cost. This concerns particularly investments and shares in affiliated companies for which no active market exists. Management does not intend to sell these investments. Financial instruments with this designation for which no market value is available were not sold in either the year under review or the reference reporting period.

Foreword
68 69
Foreword
FIN
AN
CIA
L S
TAT
EM
EN
TS
(IF
RS
)B
RA
NC
H O
FFIC
ES
/SU
BS
IDIA
RIE
S
69
Embedded derivativesEmbedded derivatives are derivative components embedded within a host financial instrument. These are accounted for and measured separately at fair value as a stand-alone derivative as long as the characteristics and risks associated with the embedded derivative are not closely related to those of the original host contract, and the host contract is not designated HTF or AFV. Remeasurement changes are shown in profit and loss. The host contract is accounted for and measured applying the rules for the designation with which the financial instrument is classified.
The Group holds financial instruments with embedded derivatives through Vorarlberger Landes- und Hypothekenbank Aktiengesellschaft. The Bank provides customers a 6% interest rate cap on home construction loans. This embedded derivative may not be separately sold or traded, and is inseparable from the host contract. For this reason the embedded derivative is not measured separately. The Bank holds further embedded derivatives in the form of convertible bonds. The fair value option was applied for these securities, in which the embedded derivative need not be treated separately from the host contract and measured as a stand-alone derivative.
(13) Loan loss provisionsSpecific and portfolio loss provisions are established to address loan default risk.
Specific provisions were established for credit risks in connection with loans and advances to customers and banks in accordance with uniform Group policies. Loans are subject to review for loss provisioning if certain monitored criteria indicate that contractual interest rate and repayment obligations cannot be fully met. Provisions correspond to the difference between carrying value of the credit and the present value of expected payments.
Portfolio loss provisions are additionally established to address credit risks. The level of portfolio loss provisions to be established are measured using the Basel II parameters.
The total amount of risk provisions for loans and advances on the balance sheet is shown separately under assets. Risk provisions for off-balance sheet transactions (guarantees, endorsement liabilities, loan commitments) are shown as loan loss provisions.
Non-collectible receivables for which specific loss provisions have been recorded are written down directly. Amounts collected from written-down receivables are recognised in income. Receivables are written down, utilising any existing specific loan loss provisions as applicable, when it has been determined that they are partially or fully uncollectible. Receivable amounts in excess of loan loss provisions are similarly written down directly upon being deemed uncollectible.
(14) Netting of financial assets and liabilitiesNetting is performed only as upheld by law, applying the expected future cash flows from transactions.
(15) Investment propertyLand and buildings held on a long-term basis as investments to generate rental income or for appreciation are carried at amortised cost. These investment properties shown under financial assets are generally depreciated over a period of 25 to 50 years. Properties are depreciated on a straight line basis over their expected useful life.
An Hypo Immobilien GmbH staff member who is a sworn and court-certified appraiser produces regular appraisals for investment properties. Income, tangible asset and comparative methods are used for valuing these assets in the appraisals. The appraised value is then compared with the real estate market and adjusted as necessary. For larger properties, independent third-party appraisals are also commissioned.
Rental income is recognised under ‘Other operating profit’. Similarly, depreciation as well as maintenance expenses for these properties are reported under ‘Other operating profit’ (see Note 30).
Material accounting principlesMaterial accounting principles
g) LHFT designation Financial liabilities are classified with the designation HFT if they were issued for trading. Trading liabilities include short sales and derivative financial instruments with negative market value. As the Group does not employ hedge accounting, this designation includes all derivatives with negative market value not actually held for trading, which are largely employed to hedge against market price risks.
h) LAFV designationFinancial liabilities are designated at fair value through profit or loss when:
- the financial instrument is used to hedge a derivative financial instrument. Due to the carrying of derivative hedges at fair value, an accoun-ting mismatch would occur between the underlying transaction and the hedge on the balance sheet and the income statement. To avoid such an accounting mismatch, these instruments are designated at fair value through profit or loss.
- the financial instrument has one or several separable embedded derivatives.
Financial instruments may only be designated LAFV upon addition. Financial instruments for which the fair value option is applied are reported at fair value under a separate designation.
The valuation results are reported under ‘Net trading result’ on the income statement. Interest income and expenses are recorded under ‘Net interest income’.
Recognition and measurement of financial instruments at fair value:Financial instruments of the designations HFT, AFV, AFS, LAFV, LHFT and derivatives are recognised and measured at fair value. Fair values were determined on the basis of market prices and quotations, to the extent available. When these were unavailable, market values were estimated with reference to financial instruments with comparable credit risk, income and maturity. If no comparable investment can be identified, fair value was calculated using an internal valuation model. The fair value of investment grade bonds was thus no longer determined on the basis of indicative prices, but rather a valuation model employing market data so as to minimise reliance on internal company data. This valuation model employs a discounted cash flow method. Losses are first estimated based on cumulative default probabilities observed for each current external rating level and maturity and then deducted from contractual bond cash flows. Cash flows determined on the basis of defaults are discounted applying a risk-adjusted yield curve as of the balance sheet date reflecting a risk-free interest rate and a risk premium for bond illiquidity.
These financial instruments are recognised at fair value plus transaction costs on the trade date. Changes in fair value are reported under ‘Net trading result’ as either profit or loss. In the case of AFS, market value changes are shown in the AFS valuation reserve with no effect on profit or loss. Impairments are always recorded as profit or loss on the income statement.
Financial guarantee contractsPursuant to IAS 39, a financial guarantee contract is a contract that provides for payments to be made by the guarantor to compensate the guarantee for a loss incurred from a specific debtor’s failing to make payment as due according to the original or amended contract terms for a debt instrument. Obligations under financial guarantee contracts are recognised as soon as the guarantor becomes a party to the contract, i.e. upon acceptance of the guarantee offer. Initial measurement is at fair value on the recognition date. The fair value of a financial guarantee contract is generally zero upon contract conclusion, as the value of the contractual premium will correspond to the value of the guarantee obligation if concluded at market conditions. If the entire premium is collected upfront at the commencement of the contract, the premium is initially recorded as a liability and then distributed on a pro-rated basis over the contract term. Any ongoing premiums paid from the guarantee are accrued under ‘Fee and commission income’. Given any indication of deterioration of the credit standing of the contract holder, provisions are recorded in the expected amount of utilisation. Guarantees provided by the Group are outlined in Note 67.

Foreword
70 71
Foreword
FIN
AN
CIA
L S
TAT
EM
EN
TS
(IF
RS
)B
RA
NC
H O
FFIC
ES
/SU
BS
IDIA
RIE
S
71
Material accounting principlesMaterial accounting principles
(16) Intangible assetsIntangible assets include purchased software and licenses, and have a limited useful life. These assets are valued at cost, less regular amortisation. Amortisation is recorded on a straight-line basis over the estimated useful life.
The useful lives applied are as follows:
If the recoverable amount is lower than carrying value, impairment is recognised. No impairments were recorded in the year under review. Regular amortisation is accounted for in administrative expenses.
(17) Property, plant and equipmentProperty, plant and equipment are carried at cost less regular depreciation. Depreciation is recorded on a straight-line basis over the expected useful life of the assets in question. Cost includes all expenses arising in connection with acquisition and start-up. Acquisition financing interest is not factored into cost. No liabilities from the purchase of property, plant and equipment existed on the reference date or in the reference reporting period.
The useful lives applied are as follows:
Impairments are recorded if the recoverable amount is lower than the asset’s carrying value.
(18) LeasingLeases are classified according to the extent to which risks and rewards attendant with ownership of a leased asset lie with the lessor or the lessee.
Lease accounting as lessor: Assets attributable to the lessee (finance leases) are shown as loans and advances at net investment value (present value). The recognition of interest income reflects a constant periodic rate of return on the net investment outstanding. Income from finance leases is reported under Group net interest income. The group predominantly leases properties.
Reporting of leased assets attributable to the lessor (operating leases) depends on the type of leased asset. Leased property is shown under investment property and valued according to the relevant rules. Movable assets are shown under property, plant and equipment and valued according to the relevant rules. Lease income is recognised on a straight-line basis over the term of the agreement. Vorarlberger Landes- und Hypothekenbank Aktiengesellschaft is mainly active as a lessor under finance leases.
Lease accounting as lessee. With finance leases, the leased asset is recorded under property, plant and equipment, and the obligation recorded as a liability. The leased asset and the obligation are stated at the lower of fair value of the leased asset at lease inception or the present value of the minimum lease payments. The implicit lease interest rate is used to calculate the present value of minimum lease payments. The Group did not conduct any sale-and-lease-back transactions in 2008.
Lease payments consist of interest and principal portions, the latter of which redeems the outstanding debt. The principal portion reduces the outstanding debt level; the interest portion is treated as interest expense. Operating lease payments are treated as rental expenses. These are generally oriented to the market price for comparable properties and subject to indexing (rent indexing). Leases concluded by Vorarlberger Landes- und Hypothekenbank Aktiengesellschaft as lessee include leases for business premises, which are of relative insignificance to these consolidated financial statements.
(19) Taxes on incomeCurrent tax assets and liabilities are calculated using the applicable rates under the tax regimes of the respective countries of operation. Tax asserts and liabilities are only recorded in amounts expected to be due from/to the tax authority.
Deferred taxes are recognised and calculated in accordance using the liability method. Calculation for each taxable entity is based on the tax rates effective for the applicable tax period under relevant tax code.
Deferred tax assets represent potential income tax reductions through temporary differences between the carrying values of assets and liabilities on the consolidated balance sheet under IFRS and tax accounting respectively, the latter being applicable to consolidated companies pursuant to local tax code.
Deferred tax assets are recognised only if sufficient deferred tax liabilities exist for the same taxable entity, or if it is sufficiently probable that future taxable profits will be generated by the same taxable entity. The same is true for the recognition of deferred tax assets on tax loss carryforwards. Deferred taxes are not discounted.
Current tax expense on net income is shown under ‘Taxes on income’ on the consolidated income statement. Effects from the recognition or reversal of deferred taxes are also shown in this account, unless relating to items recorded directly in equity. In such case, their recognition or reversal is recorded directly in equity in the available-for-sale reserve.
(20) Available-for-sale assetsAvailable-for-sale long-term assets include real estate foreclosed in collection and held for short-term sale. These also include leased assets to be sold upon lease expiration. These properties are sold by Hypo Immobilien GmbH and the leasing companies. The aim is to realise sale within one year. Should sale be impossible within the long term, these properties are typically leased or land leased. In such case they are generally reclassified as investment properties. These assets are not depreciated on an ongoing basis, instead being written down if fair value less sales costs is lower than carrying value.
Any income or expense in connection with available-for-sale assets is recorded on the income statement under ‘Other operating profit’. Available-for-sale assets are shown under ‘Leasing and real properties’. No liabilities are held in connection with available-for-sale assets.
Customary useful life in years:
Buildings 25 - 50
Furniture and fixtures 5 - 10
Construction on leased business premises 10
IT hardware 3
Customary useful life in years:
Standard software 3
Other software 4
Securities administration software 10

Foreword
72 73
Foreword
FIN
AN
CIA
L S
TAT
EM
EN
TS
(IF
RS
)B
RA
NC
H O
FFIC
ES
/SU
BS
IDIA
RIE
S
73
Material accounting principlesMaterial accounting principles
(21) ProvisionsProvisions are recorded for present legal or constructive obligations as of the balance sheet data as a result of a past event where the outflow of resources for their fulfilment is probable and the amount of which can be reliably determined. Accordingly, we record provisions for uncertain liabilities to third parties and onerous contracts in the amounts anticipated. The amount in which provisions are recorded represents a best estimate of expenses required to fulfil the present obligation as of the balance sheet date. Risks and uncertainties are factored into these estimates. Provisions are carried at present value if there is a material interest effect.
(22) Social capitalAccrued social capital includes provisions for pensions, severance, service anniversary bonuses and disability risk.
PensionsFourteen (2007: 14) pensioners and survivors are entitled to a pension under the Vorarlberger Landes- und Hypothekenbank Aktiengesellschaft defined benefit plan. These individuals are already retired and thus no longer make any contributions. There is no intention to terminate the plan. A defined contribution plan is in place for eligible active employees.
SeverancePursuant to Austrian labour law, employees were entitled to compensation after termination of their employment under certain conditions. This included in particular termination due to retirement. This compensation is payable to all employees who joined the Bank prior to 31 December 2002. Depending on the length of service, this compensation amounts to a maximum one year’s salary. The Bank has recorded severance provisions to cover these claims. This rule no longer applies to any employees who joined the Bank after 31 December 2002. For those employees, monthly contributions are made to a severance fund. There are no other employee entitlements.
Service anniversary compensationUpon completing 25 and 40 years of service, employees are entitled to service anniversary bonuses in the amount of one or two monthly salaries respectively.
Accruals for pensions and existing severance claims are defined benefits. The present value of social capital was calculated on the basis of actuarial assumptions:
- Provisions for defined benefit plans are made according to the accrued benefit valuation method.- The domestic discounting rate applied is 5.5% (2007: 5.0%)- for annual increases, increases under collective bargaining agreements, career progression increases 4.5% (2007: 3.9%) in calculating
provisions for accrued severance, service anniversary bonuses and disability risk- Turnover rate of 8.8% (2007: 8.7%)- Annual increase of 3.5% (2007: 3.2%) for accrued pensions- The earliest possible retirement age was applied for all active employees.- Employee actuarial tables: the AVЦ 2008 P values were used to calculate pension funding – Pagler&Pagler
Actuarial profits and losses resulting from the adjustment of actuarial assumptions were immediately recorded in income. Pension benefits of EUR 440,000 are expected to be paid in 2009.
Contributions to defined contribution plans are expensed on an ongoing basis. Mandatory contributions to the new severance scheme are also expensed on an ongoing basis. There are no further obligations.
(23) Trust assets and liabilitiesTrust assets and liabilities in connection with the management or trusteeship of assets for another’s benefit are not shown on the balance sheet. Commissions paid on these transactions are shown under ‘Net fee and commission income’ on the income statement.
(24) Repurchase agreements and securities lendingRepurchase agreements combine the spot purchase or sale of securities with their forward sale or repurchase from one and the same counterparty. The lender’s consolidated balance sheet still recognises and measures securities sold under repurchase agreements (spot sale) as portfolio securities. Depending on the counterparty, the cash inflow from repurchase transactions is shown on the balance sheet as amounts owed to either banks or customers. Contractual interest payments are booked as interest expense, reflecting the respective maturities.
The cash outflow from reverse repos is accounted for as ‘Loans and advances to, and placements with, banks’ or ‘Loans and advances to customers’ and measured accordingly. Securities purchased under repurchase agreements (spot purchase) are not reported on the balance sheet or measured. Contractual interest from reverse repurchase agreements is reported as interest income, reflecting the respective maturities, unless such interest derives from trading. Receivables from reverse repurchase agreements and payables from repurchase agreements with the same counterparty are not set off against each other.
The accounting treatment of securities lending transactions is similar to the treatment of securities from repurchase agreements. Securities on loan remain in the securities portfolio and are measured in accordance with IAS 39. Lent securities are not recognised within the balance sheet. Cash collateral provided by us for securities lending transactions is shown as receivables, whereas collateral received is reported under liabilities.

Foreword
74 75
Foreword
FIN
AN
CIA
L S
TAT
EM
EN
TS
(IF
RS
)B
RA
NC
H O
FFIC
ES
/SU
BS
IDIA
RIE
S
75
Notes to the income statementNotes to the income statement
(25) Net interest income
in ’000 EUR (Notes) 2008 2007 Change
in ’000 EUR in %
Interest and similar income 568,661 482,299 86,362 17.9
Interest income from cash and balances with central banks (33) 2,598 1,904 694 36.4
Interest income from loans and advances to, and placements with, banks (34) 62,048 62,743 -695 -1.1
Interest income from loans and advances to customers (35) 295,058 221,902 73,156 33.0
Interest income from bonds – held for trading (37) 13 12 1 8.3
Interest income from bonds – at fair value (38) 54,102 37,025 17,077 46.1
Interest income from bonds – available for sale (39) 50,965 56,079 -5,114 -9.1
Interest income from bonds – held to maturity (40) 47,176 45,318 1,858 4.1
Interest income from leasing loans and advances (35) 51,840 43,537 8,303 19.1
Interest income from derivatives, other (37) 954 0 954 100.0
Income from shares 2,486 11,766 -9,280 -78.9
Investment income from affiliated companies (39) 152 178 -26 -14.6
Investment income from associated companies (39) 916 1,360 -444 -32.6
Other investment income (39) 353 475 -122 -25.7
Interest and similar expenses -455,631 -371,877 -83,754 22.5
Interest expenses on amounts owed to banks (49) -19,288 -3,094 -16,194 > 100.0
Interest expenses on amounts owed to customers (50) -144,357 -81,328 -63,029 77.5
Interest expenses for liabilities evidenced by certificates (51) -93,416 -80,052 -13,364 16.7
Interest expenses for derivatives (52) -6,710 -2,507 -4,203 > 100.0
Interest expenses on liabilities – at fair value (53) -182,047 -195,947 13,900 -7.1
Interest expenses on subordinated and supplementary capital (59) -9,809 -8,822 -987 11.2
Other expenses from the leasing business (35) -4 -127 123 -96.9
Net interest income 113,030 110,422 2,608 2.4
Thereof income from shares
in ’000 EUR (Notes) 2008 2007 Change
in ’000 EUR in %
Income from shares – held for trading (37) 70 16 54 > 100.0
Income from shares – at fair value (38) 427 9,766 -9,339 -95.6
Income from shares – available for sale (39) 1,989 1,984 5 0.3
Income from shares 2,486 11,766 -9,280 -78.9
(26) Loan loss provisions
in ’000 EUR (Notes) 2008 2007 Change
in ’000 EUR in %
Allocations to loan loss provisions (35, 36) -31,965 -35,675 3,710 -10.4
Reversal of loan loss provisions (35, 36) 16,571 12,078 4,493 37.2
Direct write-downs of loans (35) -1,017 -3,670 2,653 -72.3
Income received from written-down receivables (35) 892 1,874 -982 -52.4
Allocations of provisions (35, 54) -3,951 -7,194 3,243 -45.1
Reversal of provisions (35, 54) 3,184 4,519 -1,335 -29.5
Loan loss provisions -16,286 -28,068 11,782 -42.0
(27) Net fee and commission income
in ’000 EUR 2008 2007 Change
in ’000 EUR in %
Credit and leasing business 3,710 3,128 582 18.6
Securities business 24,842 33,750 -8,908 -26.4
Giro and payment transactions 10,887 9,992 895 9.0
Other service business 7,666 6,207 1,459 23.5
Fee and commission income 47,105 53,077 -5,972 -11.3
(28) Net trading result
in ’000 EUR (Notes) 2008 2007 Change
in ’000 EUR in %
Trading result (37) 12,532 7,621 4,911 64.4
Profit/loss from the valuation of derivative financial instruments (37, 52) 168,544 -89,378 257,922 > -100.0
Valuation results from assets – held for trading (37) -4,305 -1,159 -3,146 > 100.0
Valuation results from financial liabilities – at fair value (38, 53) -178,906 83,545 -262,451 > -100.0
Net trading result -2,135 629 -2,764 > -100.0
Thereof trading result
in ’000 EUR (Notes) 2008 2007 Change
in ’000 EUR in %
Equity-related transactions 1,830 1,671 159 9.5
Currency-related transactions 8,702 7,240 1,462 20.2
Interest rate-related transactions 1,463 -85 1,548 > -100.0
Credit risk-related transactions -2,272 0 -2,272 100.0
Result of debt consolidation 2,809 -1,205 4,014 > -100.0
Trading result (37) 12,532 7,621 4,911 64.4
Thereof profit/loss from the valuation of derivative financial instruments
in ’000 EUR (Notes) 2008 2007 Change
in ’000 EUR in %
Valuation results, interest rate swaps 159,065 -99,840 258,905 > -100.0
Valuation results, cross-currency swaps 15,885 10,763 5,122 47.6
Valuation results, interest rate options -967 573 -1,540 > -100.0
Valuation results, forward rate agreements -90 0 -90 100.0
Valuation results, credit default swaps -6,629 -695 -5,934 > 100.0
Valuation results, currency futures 37 148 -111 -75.0
Valuation results, currency swaps 1,243 -327 1,570 > -100.0
Profit/loss from the valuation of derivatives (37, 52) 168,544 -89,378 257,922 > -100.0
in ’000 EUR 2008 2007 Change
in ’000 EUR in %
Credit and leasing business -1,698 -1,481 -217 14.7
Securities business -2,828 -4,142 1,314 -31.7
Giro and payment transactions -621 -629 8 -1.3
Other service business -89 -101 12 -11.9
Fee and commission expenses -5,236 -6,353 1,117 -17.6
Net fee and commission income 41,869 46,724 -4,855 -10.4
The loss on credit business results from direct write-downs of loans and advances and the utilisation of loss provisions. This loss totalled EUR 11,213,000 in 2008 (2007: EUR 32,112,000). The decline in risk provisions in the credit business was chiefly due to the strength of the economy in the first three quarters of 2008. There were no indications of further impairment as of the time of publication.
Currency-related transactions include translation differences from foreign currency assets and liabilities. This difference amounted to EUR 4,958,000 in 2008 (2007: EUR 1,053,000).
Notes to the income statement
Interest income from loans and advances to customers includes an amount of EUR 793,000 (2007: EUR 827,000) from unwinding.

Foreword
76 77
Foreword
FIN
AN
CIA
L S
TAT
EM
EN
TS
(IF
RS
)B
RA
NC
H O
FFIC
ES
/SU
BS
IDIA
RIE
S
77
Notes to the income statementNotes to the income statement
(29) Administrative expenses
in ’000 EUR 2008 2007 Change
in ’000 EUR in %
Personnel expenses -49,042 -45,114 -3,928 8.7
Materials expenses -29,158 -27,058 -2,100 7.8
Depreciation/amortisation of property, plant and equipment and intangible assets -5,663 -5,917 254 -4.3
Administrative expenses -83,863 -78,089 -5,774 7.4
Thereof staff costs
in ’000 EUR 2008 2007 Change
in ’000 EUR in %
Wages and salaries -36,618 -34,321 -2,297 6.7
Compulsory employee benefit expenses -8,965 -8,269 -696 8.4
Voluntary employee benefit expenses -943 -762 -181 23.8
Expenses for retirement benefits and other benefits -963 -1,092 129 -11.8
Social capital -1,553 -670 -883 > 100.0
Personnel expenses -49,042 -45,114 -3,928 8.7
Thereof material expenses
in ’000 EUR 2008 2007 Change
in ’000 EUR in %
Building occupancy expenses -3,975 -3,291 -684 20.8
IT expenses -7,366 -7,047 -319 4.5
Advertising and promotional expenses -4,855 -3,896 -959 24.6
Legal and consulting fees -1,764 -1,957 193 -9.9
Communication expenses -1,257 -1,259 2 -0.2
Expenses caused by the bank's legal form -1,874 -1,834 -40 2.2
Expenses for staff development -1,320 -1,103 -217 19.7
Other taxes and fees -542 -239 -303 > 100.0
Other materials expenses -6,205 -6,432 227 -3.5
Materials expenses -29,158 -27,058 -2,100 7.8
Thereof depreciation/amortisation of property, plant and equipment and intangible assets
in ’000 EUR 2008 2007 Change
in ’000 EUR in %
Depreciation of property, plant and equipment -3,438 -3,359 -79 2.4
Extraordinary depreciation of property, plant and equipment 0 -1,789 1,789 -100.0
Amortisation of intangible assets -671 -769 98 -12.7
Depreciation/amortisation of other assets -16 0 -16 100.0
Extraordinary depreciation/amortisation of other assets -1,538 0 -1,538 100.0
Depreciation/amortisation of property, plant and equipment and intangible assets -5,663 -5,917 254 -4.3
(30) Other operating profit
in ’000 EUR 2008 2007 Change
in ’000 EUR in %
Operating lease income 2,120 2,071 49 2.4
Depreciation of operating lease assets -814 -974 160 -16.4
Extraordinary depreciation of operating lease assets -50 0 -50 100.0
Residual book value disposals -15 0 -15 100.0
Gains from the sale of fixed assets 6,003 7,958 -1,955 -24.6
Losses from the sale of fixed assets -5,112 -1,841 -3,271 > 100.0
Income from disposals of fixed assets 367 -1 368 > -100.0
Profits from the sale of goods 440 121 319 > 100.0
Cost of sales -355 -364 9 -2.5
Other sales 665 33 632 > 100.0
Operating costs 38 32 6 18.8
Service income -369 -337 -32 9.5
Write-ups of property, plant and equipment 0 135 -135 -100.0
Other operating income 10,151 9,806 345 3.5
Other operating expenses -7,062 -7,193 131 -1.8
Other operating profit 6,007 9,446 -3,439 -36.4
Thereof profit/loss from the valuation of financial instruments – at fair value
in ’000 EUR (Notes) 2008 2007 Change
in ’000 EUR in %
Valuation results from loans and advances to, and placements with, banks 878 687 191 27.8
Valuation results from loans and advances to customers 41,397 -26,241 67,638 > -100.0
Valuation results, securities 5,346 -17,140 22,486 > -100.0
Valuation results, amounts owed to banks -1,534 2,744 -4,278 > -100.0
Valuation results, amounts owed to customers -26,173 10,987 -37,160 > -100.0
Valuation results, liabilities evidenced by certificates -191,387 129,456 -320,843 > -100.0
Valuation results, subordinated and supplementary capital -7,433 -16,948 9,515 -56.1
Valuation results from financial liabilities – at fair value (38, 53) -178,906 83,545 -262,451 > -100.0
The net result from the ‘Valuation of derivative financial instruments’ of EUR 168,544,000 (2007: EUR -89,378,000) should be seen in connection with the measurement result of EUR -178,906,000 from applying the fair value option 2007: EUR 83,545,000), as hedge accounting per IAS 39 is not applied. The result from the measurement of derivatives represents almost exclusively hedging of market risk with banking transactions under the fair value option.
Building occupancy expenses includes payments for rented/leased assets. Minimum rental expense of EUR 4,601,000 is projected for 2009 (2008: EUR 5,578,000), and EUR 22,731,000 over the next 5 years (2008: EUR 29,351,000).
Impairment of other equipment represents a partial write-down to net present value of a held-for-sale property.
Profits from the sale of goods and cost of sales concern subsidiary Hypo Informatik GmbH, which purchases and resells computer hardware inside and outside the Group. ‘Other operating income’ contains income in the amount of EUR 1,717,000 from consulting and services (2007: EUR 2,814,000). ‘Other operating expenses’ includes an amount of EUR -5,467,000 (2007: EUR -2,769,000) representing impairments of non-financial assets, and EUR -149,000 (2007: EUR -1,106,000) representing operational damage.
(31) Net results from financial instruments
in ’000 EUR 2008 2007 Change
in ’000 EUR in %
Realised income from sales of financial assets 7,920 687 7,233 > 100.0
Realised expenses from sales of financial assets -316 -6,982 6,666 -95.5
Write-ups of financial instruments 2,405 8,933 -6,528 -73.1
Write-downs of financial instruments -15,793 -4,047 -11,746 > 100.0
Net results from financial instruments -5,784 -1,409 -4,375 > 100.0
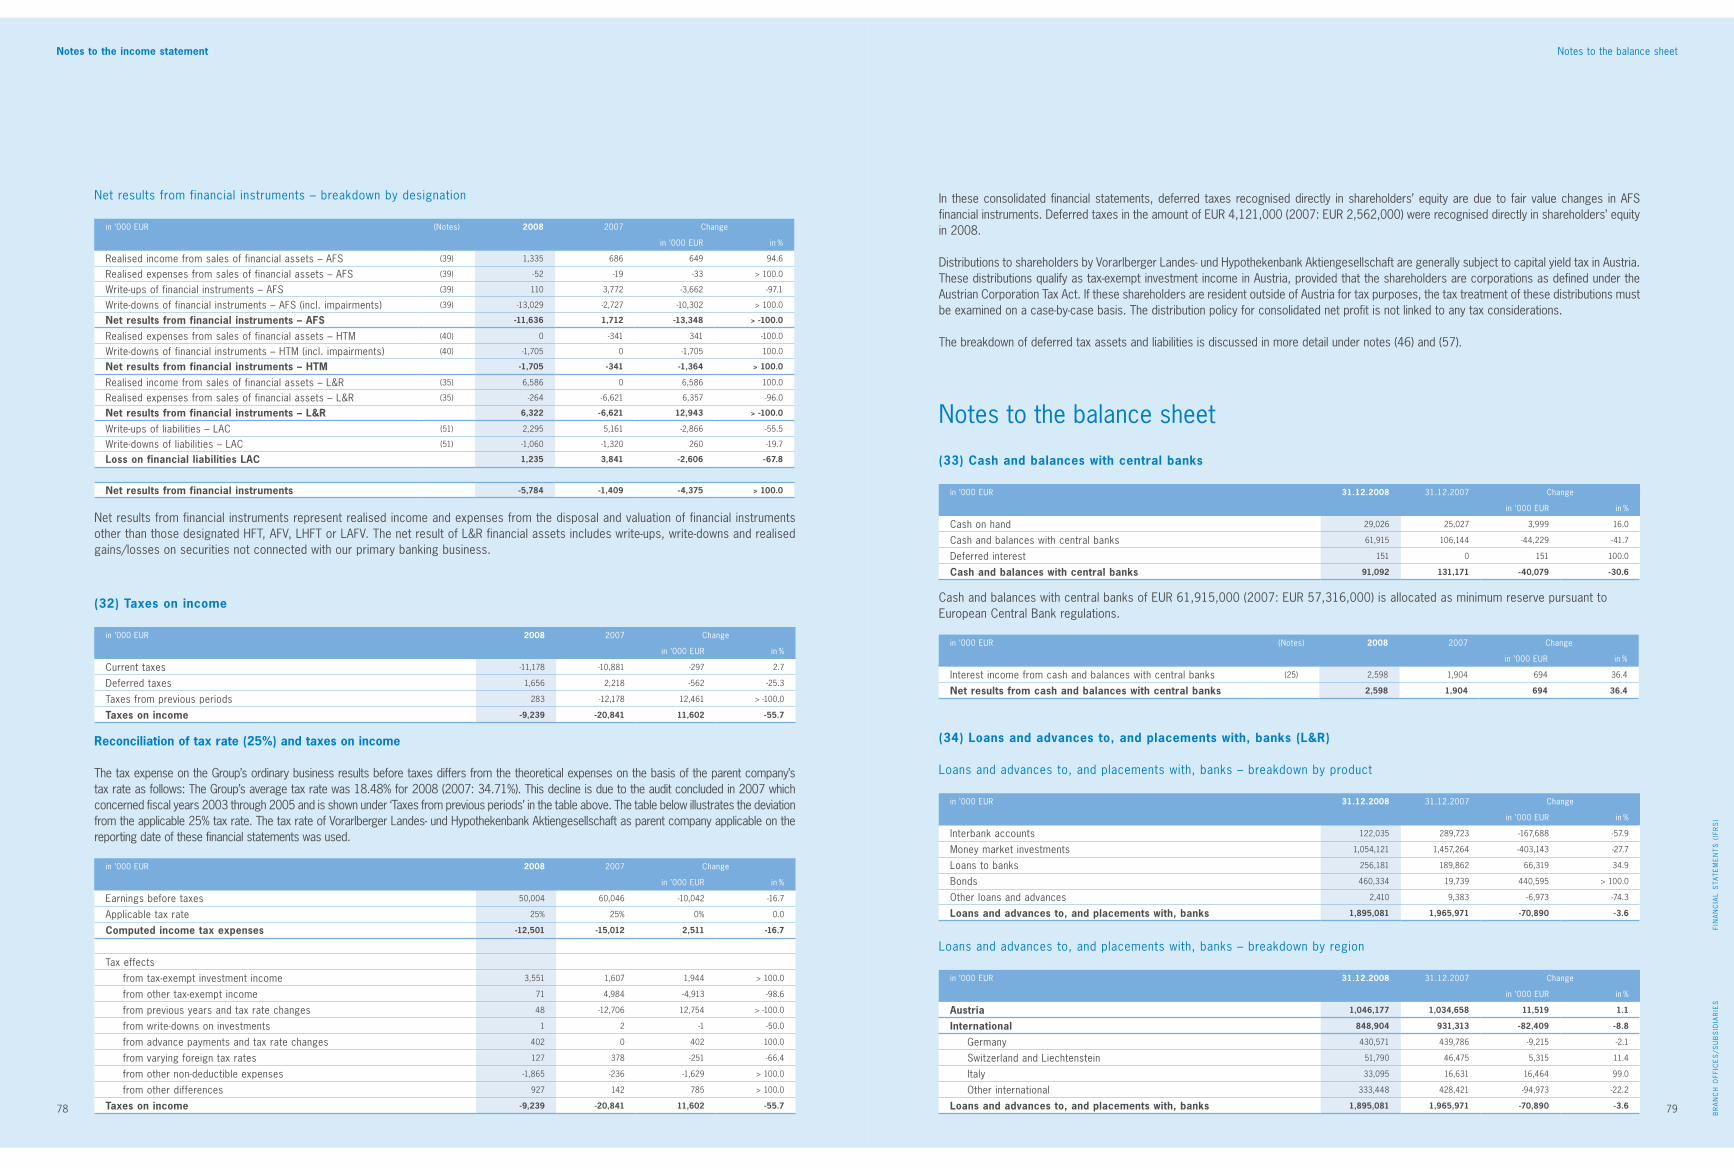
Foreword
78 79
Foreword
FIN
AN
CIA
L S
TAT
EM
EN
TS
(IF
RS
)B
RA
NC
H O
FFIC
ES
/SU
BS
IDIA
RIE
S
79
Notes to the balance sheetNotes to the income statement
(32) Taxes on income
in ’000 EUR 2008 2007 Change
in ’000 EUR in %
Current taxes -11,178 -10,881 -297 2.7
Deferred taxes 1,656 2,218 -562 -25.3
Taxes from previous periods 283 -12,178 12,461 > -100.0
Taxes on income -9,239 -20,841 11,602 -55.7
in ’000 EUR 2008 2007 Change
in ’000 EUR in %
Earnings before taxes 50,004 60,046 -10,042 -16.7
Applicable tax rate 25% 25% 0% 0.0
Computed income tax expenses -12,501 -15,012 2,511 -16.7
Tax effects
from tax-exempt investment income 3,551 1,607 1,944 > 100.0
from other tax-exempt income 71 4,984 -4,913 -98.6
from previous years and tax rate changes 48 -12,706 12,754 > -100.0
from write-downs on investments 1 2 -1 -50.0
from advance payments and tax rate changes 402 0 402 100.0
from varying foreign tax rates 127 378 -251 -66.4
from other non-deductible expenses -1,865 -236 -1,629 > 100.0
from other differences 927 142 785 > 100.0
Taxes on income -9,239 -20,841 11,602 -55.7
(33) Cash and balances with central banks
in ’000 EUR 31.12.2008 31.12.2007 Change
in ’000 EUR in %
Cash on hand 29,026 25,027 3,999 16.0
Cash and balances with central banks 61,915 106,144 -44,229 -41.7
Deferred interest 151 0 151 100.0
Cash and balances with central banks 91,092 131,171 -40,079 -30.6
(34) Loans and advances to, and placements with, banks (L&R)
Loans and advances to, and placements with, banks – breakdown by product
in ’000 EUR 31.12.2008 31.12.2007 Change
in ’000 EUR in %
Interbank accounts 122,035 289,723 -167,688 -57.9
Money market investments 1,054,121 1,457,264 -403,143 -27.7
Loans to banks 256,181 189,862 66,319 34.9
Bonds 460,334 19,739 440,595 > 100.0
Other loans and advances 2,410 9,383 -6,973 -74.3
Loans and advances to, and placements with, banks 1,895,081 1,965,971 -70,890 -3.6
Loans and advances to, and placements with, banks – breakdown by region
in ’000 EUR 31.12.2008 31.12.2007 Change
in ’000 EUR in %
Austria 1,046,177 1,034,658 11,519 1.1
International 848,904 931,313 -82,409 -8.8
Germany 430,571 439,786 -9,215 -2.1
Switzerland and Liechtenstein 51,790 46,475 5,315 11.4
Italy 33,095 16,631 16,464 99.0
Other international 333,448 428,421 -94,973 -22.2
Loans and advances to, and placements with, banks 1,895,081 1,965,971 -70,890 -3.6
Reconciliation of tax rate (25%) and taxes on income
The tax expense on the Group’s ordinary business results before taxes differs from the theoretical expenses on the basis of the parent company’s tax rate as follows: The Group’s average tax rate was 18.48% for 2008 (2007: 34.71%). This decline is due to the audit concluded in 2007 which concerned fiscal years 2003 through 2005 and is shown under ‘Taxes from previous periods’ in the table above. The table below illustrates the deviation from the applicable 25% tax rate. The tax rate of Vorarlberger Landes- und Hypothekenbank Aktiengesellschaft as parent company applicable on the reporting date of these financial statements was used.
Cash and balances with central banks of EUR 61,915,000 (2007: EUR 57,316,000) is allocated as minimum reserve pursuant to European Central Bank regulations.
Notes to the balance sheet
Net results from financial instruments – breakdown by designation
in ’000 EUR (Notes) 2008 2007 Change
in ’000 EUR in %
Realised income from sales of financial assets – AFS (39) 1,335 686 649 94.6
Realised expenses from sales of financial assets – AFS (39) -52 -19 -33 > 100.0
Write-ups of financial instruments – AFS (39) 110 3,772 -3,662 -97.1
Write-downs of financial instruments – AFS (incl. impairments) (39) -13,029 -2,727 -10,302 > 100.0
Net results from financial instruments – AFS -11,636 1,712 -13,348 > -100.0
Realised expenses from sales of financial assets – HTM (40) 0 -341 341 -100.0
Write-downs of financial instruments – HTM (incl. impairments) (40) -1,705 0 -1,705 100.0
Net results from financial instruments – HTM -1,705 -341 -1,364 > 100.0
Realised income from sales of financial assets – L&R (35) 6,586 0 6,586 100.0
Realised expenses from sales of financial assets – L&R (35) -264 -6,621 6,357 -96.0
Net results from financial instruments – L&R 6,322 -6,621 12,943 > -100.0
Write-ups of liabilities – LAC (51) 2,295 5,161 -2,866 -55.5
Write-downs of liabilities – LAC (51) -1,060 -1,320 260 -19.7
Loss on financial liabilities LAC 1,235 3,841 -2,606 -67.8
Net results from financial instruments -5,784 -1,409 -4,375 > 100.0
Net results from financial instruments represent realised income and expenses from the disposal and valuation of financial instruments other than those designated HFT, AFV, LHFT or LAFV. The net result of L&R financial assets includes write-ups, write-downs and realised gains/losses on securities not connected with our primary banking business.
In these consolidated financial statements, deferred taxes recognised directly in shareholders’ equity are due to fair value changes in AFS financial instruments. Deferred taxes in the amount of EUR 4,121,000 (2007: EUR 2,562,000) were recognised directly in shareholders’ equity in 2008.
Distributions to shareholders by Vorarlberger Landes- und Hypothekenbank Aktiengesellschaft are generally subject to capital yield tax in Austria. These distributions qualify as tax-exempt investment income in Austria, provided that the shareholders are corporations as defined under the Austrian Corporation Tax Act. If these shareholders are resident outside of Austria for tax purposes, the tax treatment of these distributions must be examined on a case-by-case basis. The distribution policy for consolidated net profit is not linked to any tax considerations.
The breakdown of deferred tax assets and liabilities is discussed in more detail under notes (46) and (57).
in ’000 EUR (Notes) 2008 2007 Change
in ’000 EUR in %
Interest income from cash and balances with central banks (25) 2,598 1,904 694 36.4
Net results from cash and balances with central banks 2,598 1,904 694 36.4

Foreword
80 81
Foreword
FIN
AN
CIA
L S
TAT
EM
EN
TS
(IF
RS
)B
RA
NC
H O
FFIC
ES
/SU
BS
IDIA
RIE
S
81
Notes to the balance sheetNotes to the balance sheet
(35) Loans and advances to customers (L&R)
Loans and advances to customers – breakdown by product
in ’000 EUR 31.12.2008 31.12.2007 Change
in ’000 EUR in %
Cash advances 462,203 528,502 -66,299 -12.5
Current account credits 1,074,296 770,859 303,437 39.4
Discount credits 1,274 1,746 -472 -27.0
Municipal loans 626,556 658,317 -31,761 -4.8
Mortgage bond loans 1,094,457 981,840 112,617 11.5
Collateralised loans 283,249 254,494 28,755 11.3
Other loans 2,458,195 1,852,117 606,078 32.7
Leasing loans and advances 999,346 828,956 170,390 20.6
Bonds 337,685 21,442 316,243 > 100.0
Other loans and advances 195 6,522 -6,327 -97.0
Loans and advances to customers 7,337,456 5,904,795 1,432,661 24.3
Loans and advances to customers – breakdown by region
in ’000 EUR 31.12.2008 31.12.2007 Change
in ’000 EUR in %
Austria 4,544,531 3,907,388 637,143 16.3
International 2,792,925 1,997,407 795,518 39.8
Germany 875,566 579,554 296,012 51.1
Switzerland and Liechtenstein 650,455 419,461 230,994 55.1
Italy 1,088,665 822,039 266,626 32.4
Other international 178,239 176,353 1,886 1.1
Loans and advances to customers 7,337,456 5,904,795 1,432,661 24.3
Loans and advances to customers – breakdown by maturity
in ’000 EUR 31.12.2008 31.12.2007 Change
in ’000 EUR in %
Repayable on demand 1,755,958 1,012,203 743,755 73.5
With a remaining maturity of
3 months or less 603,648 638,503 -34,855 -5.5
3 months to 1 year 361,494 363,046 -1,552 -0.4
>1 to 5 years 1,517,070 1,203,882 313,188 26.0
> 5 years 3,099,286 2,687,161 412,125 15.3
Loans and advances to customers 7,337,456 5,904,795 1,432,661 24.3
Loans and advances to customers – breakdown by sector
in ’000 EUR 31.12.2008 31.12.2007 Change
in ’000 EUR in %
Public sector 197,100 224,083 -26,983 -12.0
Corporate Customers 4,773,103 3,873,017 900,086 23.2
Private banking 1,491,432 1,392,388 99,044 7.1
Treasury 391,096 78,090 313,006 > 100.0
Other 484,725 337,217 147,508 43.7
Loans and advances to customers 7,337,456 5,904,795 1,432,661 24.3
Loans and advances to customers – breakdown by industry
in ’000 EUR 31.12.2008 31.12.2007 Change
in ’000 EUR in %
Public sector 203,930 221,079 -17,149 -7.8
Manufacturing 733,553 764,508 -30,955 -4.0
Industry 814,944 469,780 345,164 73.5
Trade 388,416 284,141 104,275 36.7
Tourism 305,369 283,007 22,362 7.9
Construction 899,028 834,754 64,274 7.7
Other industries 1,899,469 1,476,923 422,546 28.6
Freelance professions 361,552 361,259 293 0.1
Private households 1,342,188 1,178,384 163,804 13.9
Other 389,007 30,960 358,047 > 100.0
Loans and advances to customers 7,337,456 5,904,795 1,432,661 24.3
Gross and net investments in leasing business
in ’000 EUR 31.12.2008 31.12.2007 Change
in ’000 EUR in %
Gross investment 1,432,741 1,114,422 318,319 28.6
Unearned finance income -433,395 -285,466 -147,929 51.8
Net investments 999,346 828,956 170,390 20.6
Unguaranteed residual values 9,208 9,688 -480 -5.0
Loans and advances to, and placements with, banks – breakdown by maturity
in ’000 EUR 31.12.2008 31.12.2007 Change
in ’000 EUR in %
Repayable on demand 108,294 266,199 -157,905 -59.3
With a remaining maturity of
3 months or less 717,868 1,409,887 -692,019 -49.1
3 months to 1 year 488,665 114,529 374,136 > 100.0
>1 to 5 years 475,946 124,450 351,496 > 100.0
> 5 years 104,308 50,906 53,402 > 100.0
Loans and advances to, and placements with, banks 1,895,081 1,965,971 -70,890 -3.6
Profit from loans and advances to, and placements with, banks
in ’000 EUR (Notes) 2008 2007 Change
in ’000 EUR in %
Interest income from loans and advances to, and placements with, banks (25) 62,048 62,743 -695 -1.1
Net total loans and advances to, and placements with, banks 62,048 62,743 -695 -1.1
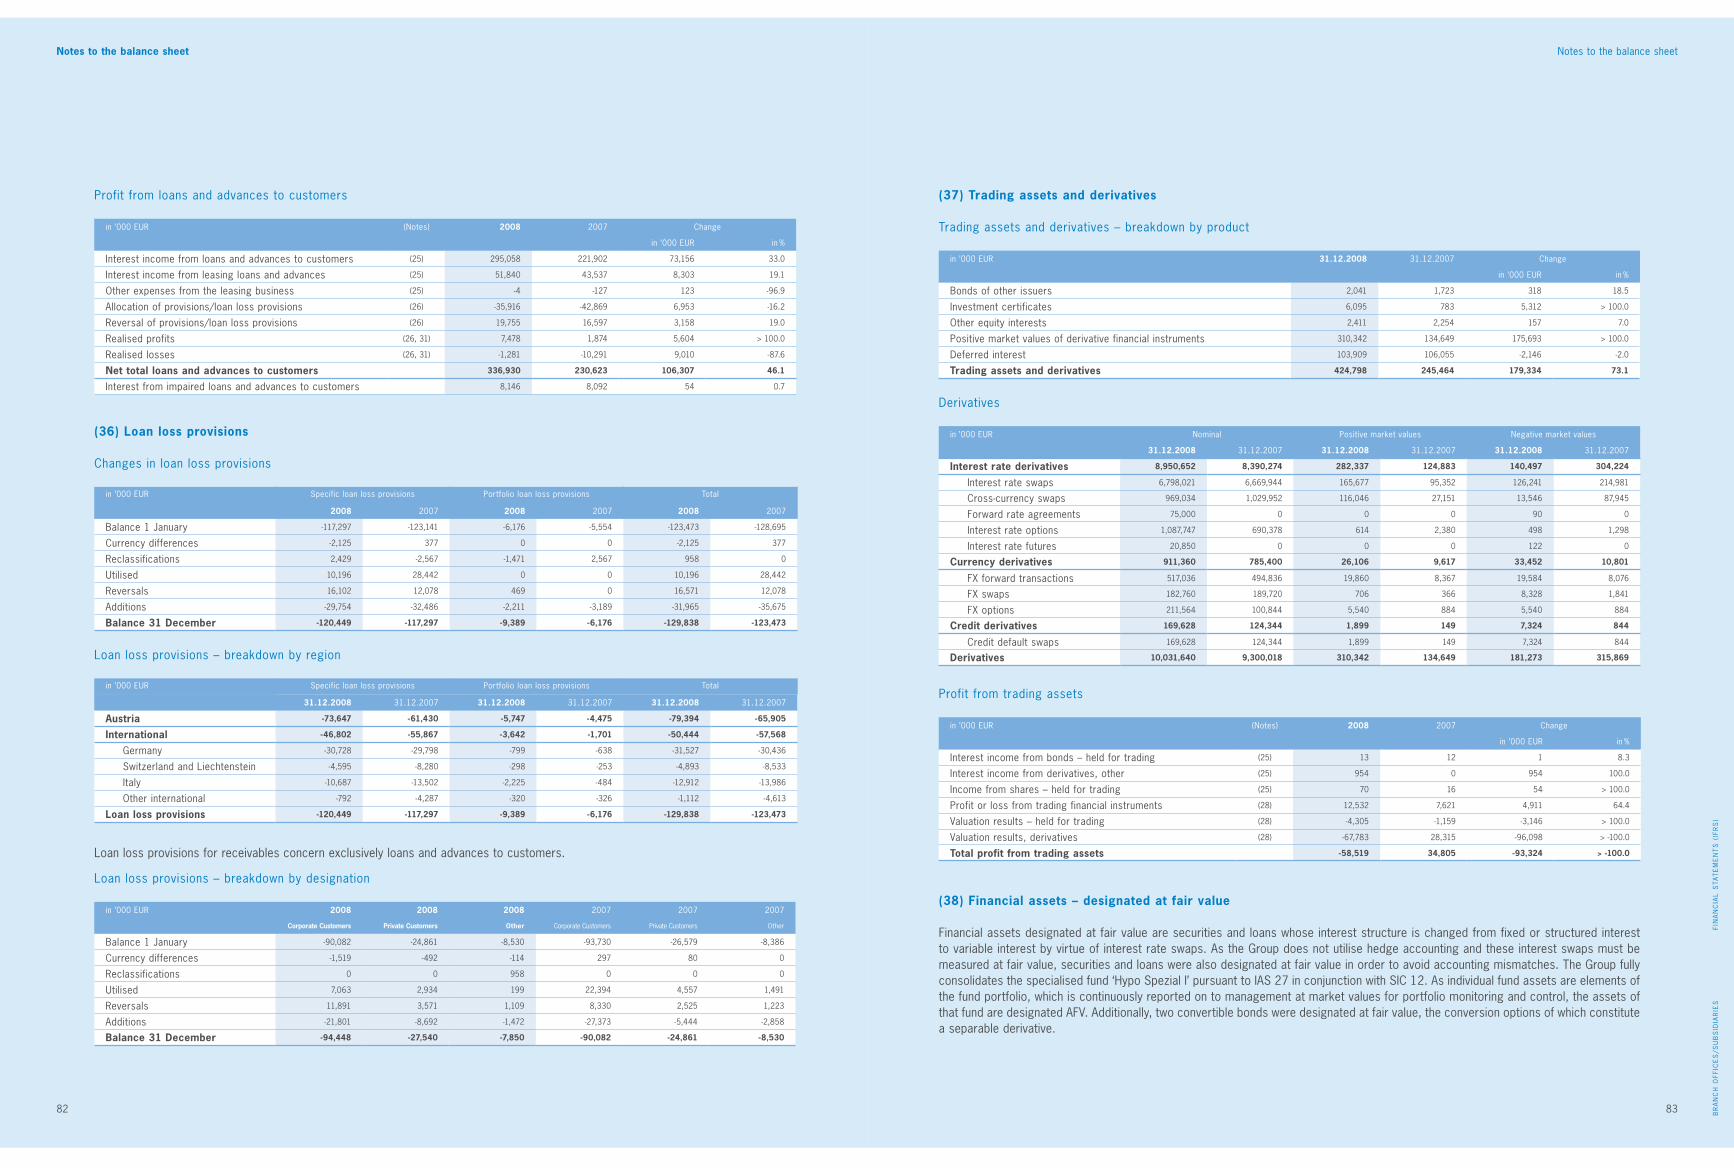
Foreword
82 83
Foreword
FIN
AN
CIA
L S
TAT
EM
EN
TS
(IF
RS
)B
RA
NC
H O
FFIC
ES
/SU
BS
IDIA
RIE
S
83
Notes to the balance sheetNotes to the balance sheet
(37) Trading assets and derivatives
Trading assets and derivatives – breakdown by product
in ’000 EUR 31.12.2008 31.12.2007 Change
in ’000 EUR in %
Bonds of other issuers 2,041 1,723 318 18.5
Investment certificates 6,095 783 5,312 > 100.0
Other equity interests 2,411 2,254 157 7.0
Positive market values of derivative financial instruments 310,342 134,649 175,693 > 100.0
Deferred interest 103,909 106,055 -2,146 -2.0
Trading assets and derivatives 424,798 245,464 179,334 73.1
Profit from trading assets
in ’000 EUR (Notes) 2008 2007 Change
in ’000 EUR in %
Interest income from bonds – held for trading (25) 13 12 1 8.3
Interest income from derivatives, other (25) 954 0 954 100.0
Income from shares – held for trading (25) 70 16 54 > 100.0
Profit or loss from trading financial instruments (28) 12,532 7,621 4,911 64.4
Valuation results – held for trading (28) -4,305 -1,159 -3,146 > 100.0
Valuation results, derivatives (28) -67,783 28,315 -96,098 > -100.0
Total profit from trading assets -58,519 34,805 -93,324 > -100.0
Loan loss provisions – breakdown by region
in ’000 EUR Specific loan loss provisions Portfolio loan loss provisions Total
31.12.2008 31.12.2007 31.12.2008 31.12.2007 31.12.2008 31.12.2007
Austria -73,647 -61,430 -5,747 -4,475 -79,394 -65,905
International -46,802 -55,867 -3,642 -1,701 -50,444 -57,568
Germany -30,728 -29,798 -799 -638 -31,527 -30,436
Switzerland and Liechtenstein -4,595 -8,280 -298 -253 -4,893 -8,533
Italy -10,687 -13,502 -2,225 -484 -12,912 -13,986
Other international -792 -4,287 -320 -326 -1,112 -4,613
Loan loss provisions -120,449 -117,297 -9,389 -6,176 -129,838 -123,473
Derivatives
in ’000 EUR Nominal Positive market values Negative market values
31.12.2008 31.12.2007 31.12.2008 31.12.2007 31.12.2008 31.12.2007
Interest rate derivatives 8,950,652 8,390,274 282,337 124,883 140,497 304,224
Interest rate swaps 6,798,021 6,669,944 165,677 95,352 126,241 214,981
Cross-currency swaps 969,034 1,029,952 116,046 27,151 13,546 87,945
Forward rate agreements 75,000 0 0 0 90 0
Interest rate options 1,087,747 690,378 614 2,380 498 1,298
Interest rate futures 20,850 0 0 0 122 0
Currency derivatives 911,360 785,400 26,106 9,617 33,452 10,801
FX forward transactions 517,036 494,836 19,860 8,367 19,584 8,076
FX swaps 182,760 189,720 706 366 8,328 1,841
FX options 211,564 100,844 5,540 884 5,540 884
Credit derivatives 169,628 124,344 1,899 149 7,324 844
Credit default swaps 169,628 124,344 1,899 149 7,324 844
Derivatives 10,031,640 9,300,018 310,342 134,649 181,273 315,869
Loan loss provisions for receivables concern exclusively loans and advances to customers.
(36) Loan loss provisions
Changes in loan loss provisions
in ’000 EUR Specific loan loss provisions Portfolio loan loss provisions Total
2008 2007 2008 2007 2008 2007
Balance 1 January -117,297 -123,141 -6,176 -5,554 -123,473 -128,695
Currency differences -2,125 377 0 0 -2,125 377
Reclassifications 2,429 -2,567 -1,471 2,567 958 0
Utilised 10,196 28,442 0 0 10,196 28,442
Reversals 16,102 12,078 469 0 16,571 12,078
Additions -29,754 -32,486 -2,211 -3,189 -31,965 -35,675
Balance 31 December -120,449 -117,297 -9,389 -6,176 -129,838 -123,473
(38) Financial assets – designated at fair value
Financial assets designated at fair value are securities and loans whose interest structure is changed from fixed or structured interest to variable interest by virtue of interest rate swaps. As the Group does not utilise hedge accounting and these interest swaps must be measured at fair value, securities and loans were also designated at fair value in order to avoid accounting mismatches. The Group fully consolidates the specialised fund ‘Hypo Spezial I’ pursuant to IAS 27 in conjunction with SIC 12. As individual fund assets are elements of the fund portfolio, which is continuously reported on to management at market values for portfolio monitoring and control, the assets of that fund are designated AFV. Additionally, two convertible bonds were designated at fair value, the conversion options of which constitute a separable derivative.
Profit from loans and advances to customers
in ’000 EUR (Notes) 2008 2007 Change
in ’000 EUR in %
Interest income from loans and advances to customers (25) 295,058 221,902 73,156 33.0
Interest income from leasing loans and advances (25) 51,840 43,537 8,303 19.1
Other expenses from the leasing business (25) -4 -127 123 -96.9
Allocation of provisions/loan loss provisions (26) -35,916 -42,869 6,953 -16.2
Reversal of provisions/loan loss provisions (26) 19,755 16,597 3,158 19.0
Realised profits (26, 31) 7,478 1,874 5,604 > 100.0
Realised losses (26, 31) -1,281 -10,291 9,010 -87.6
Net total loans and advances to customers 336,930 230,623 106,307 46.1
Interest from impaired loans and advances to customers 8,146 8,092 54 0.7
Loan loss provisions – breakdown by designation
in ’000 EUR 2008 2008 2008 2007 2007 2007
Corporate Customers Private Customers Other Corporate Customers Private Customers Other
Balance 1 January -90,082 -24,861 -8,530 -93,730 -26,579 -8,386
Currency differences -1,519 -492 -114 297 80 0
Reclassifications 0 0 958 0 0 0
Utilised 7,063 2,934 199 22,394 4,557 1,491
Reversals 11,891 3,571 1,109 8,330 2,525 1,223
Additions -21,801 -8,692 -1,472 -27,373 -5,444 -2,858
Balance 31 December -94,448 -27,540 -7,850 -90,082 -24,861 -8,530
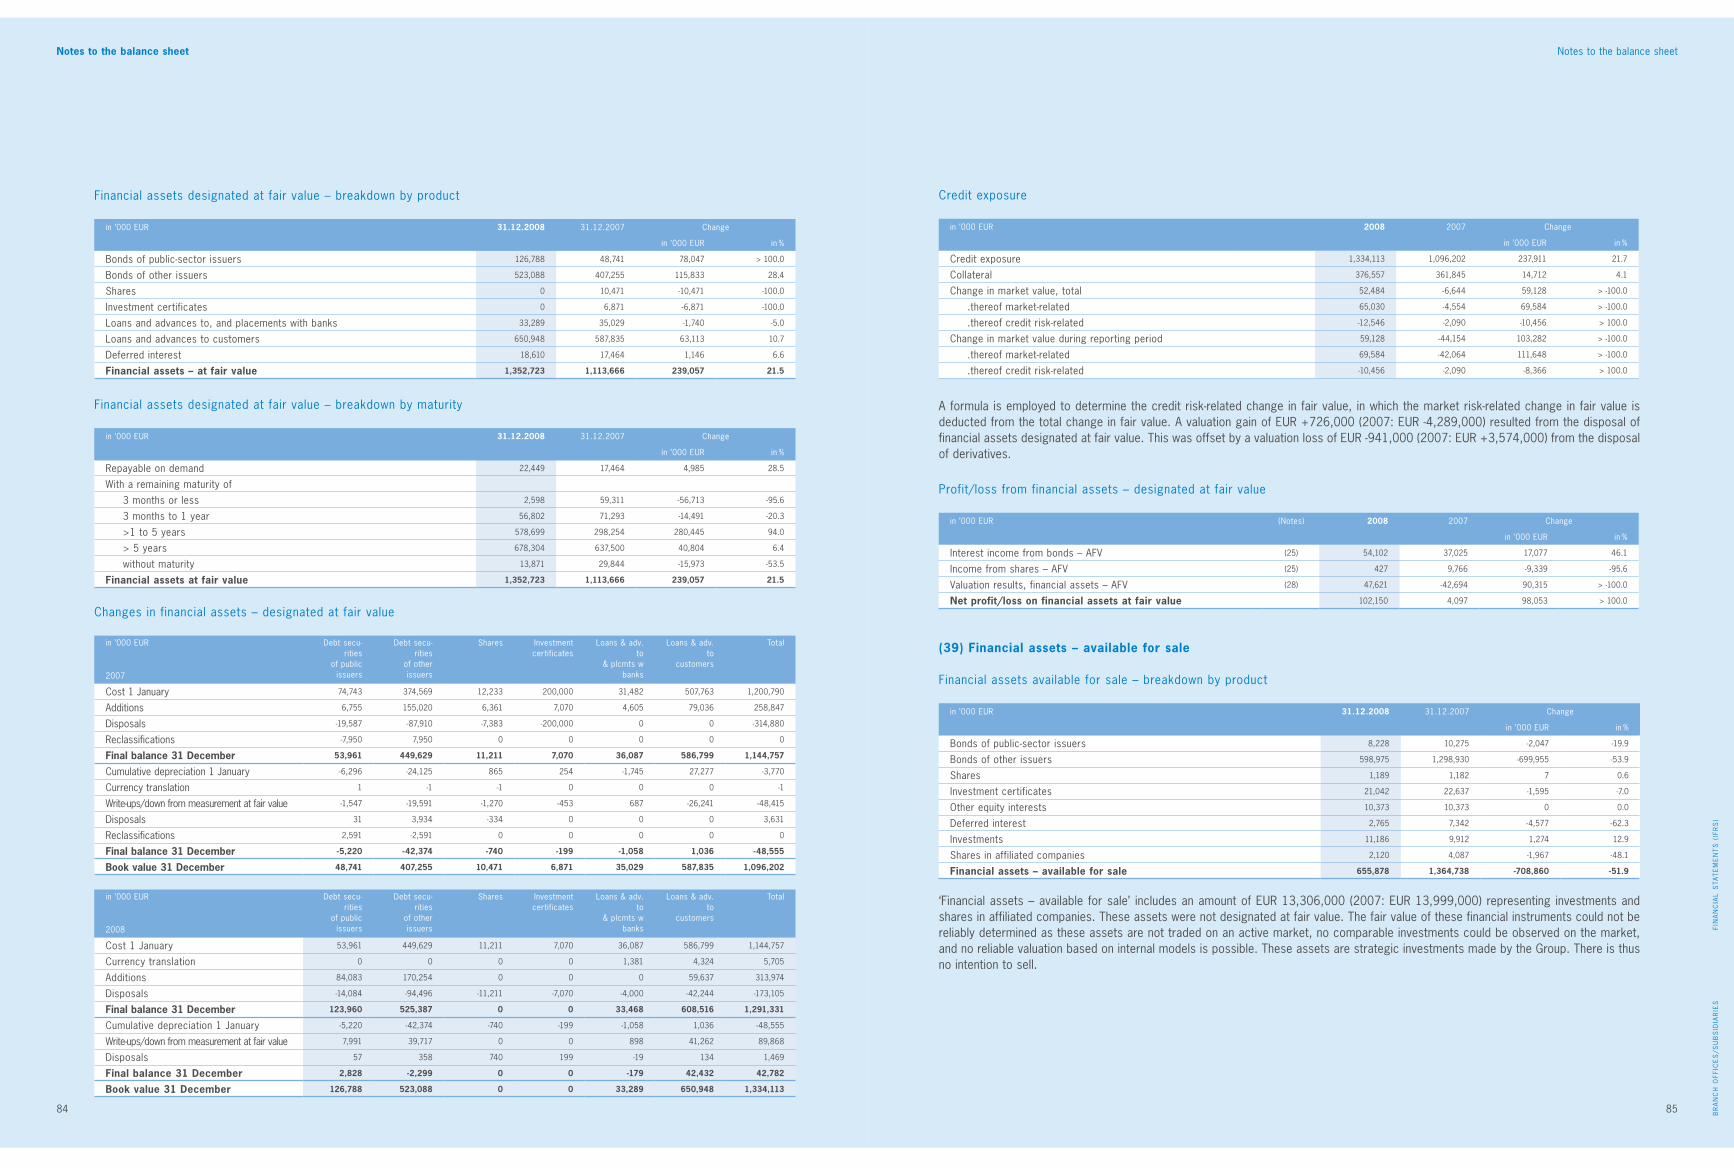
Foreword
84 85
Foreword
FIN
AN
CIA
L S
TAT
EM
EN
TS
(IF
RS
)B
RA
NC
H O
FFIC
ES
/SU
BS
IDIA
RIE
S
85
Notes to the balance sheet Notes to the balance sheet
Profit/loss from financial assets – designated at fair value
in ’000 EUR (Notes) 2008 2007 Change
in ’000 EUR in %
Interest income from bonds – AFV (25) 54,102 37,025 17,077 46.1
Income from shares – AFV (25) 427 9,766 -9,339 -95.6
Valuation results, financial assets – AFV (28) 47,621 -42,694 90,315 > -100.0
Net profit/loss on financial assets at fair value 102,150 4,097 98,053 > 100.0
(39) Financial assets – available for sale
Financial assets available for sale – breakdown by product
in ’000 EUR 31.12.2008 31.12.2007 Change
in ’000 EUR in %
Bonds of public-sector issuers 8,228 10,275 -2,047 -19.9
Bonds of other issuers 598,975 1,298,930 -699,955 -53.9
Shares 1,189 1,182 7 0.6
Investment certificates 21,042 22,637 -1,595 -7.0
Other equity interests 10,373 10,373 0 0.0
Deferred interest 2,765 7,342 -4,577 -62.3
Investments 11,186 9,912 1,274 12.9
Shares in affiliated companies 2,120 4,087 -1,967 -48.1
Financial assets – available for sale 655,878 1,364,738 -708,860 -51.9
Changes in financial assets – designated at fair value
in ’000 EUR Debt secu-rities
of publicissuers
Debt secu-rities
of otherissuers
Shares Investmentcertificates
Loans & adv.to
& plcmts wbanks
Loans & adv.to
customers
Total
2007
Cost 1 January 74,743 374,569 12,233 200,000 31,482 507,763 1,200,790
Additions 6,755 155,020 6,361 7,070 4,605 79,036 258,847
Disposals -19,587 -87,910 -7,383 -200,000 0 0 -314,880
Reclassifications -7,950 7,950 0 0 0 0 0
Final balance 31 December 53,961 449,629 11,211 7,070 36,087 586,799 1,144,757
Cumulative depreciation 1 January -6,296 -24,125 865 254 -1,745 27,277 -3,770
Currency translation 1 -1 -1 0 0 0 -1
Write-ups/down from measurement at fair value -1,547 -19,591 -1,270 -453 687 -26,241 -48,415
Disposals 31 3,934 -334 0 0 0 3,631
Reclassifications 2,591 -2,591 0 0 0 0 0
Final balance 31 December -5,220 -42,374 -740 -199 -1,058 1,036 -48,555
Book value 31 December 48,741 407,255 10,471 6,871 35,029 587,835 1,096,202
in ’000 EUR Debt secu-rities
of publicissuers
Debt secu-rities
of otherissuers
Shares Investmentcertificates
Loans & adv.to
& plcmts wbanks
Loans & adv.to
customers
Total
2008
Cost 1 January 53,961 449,629 11,211 7,070 36,087 586,799 1,144,757
Currency translation 0 0 0 0 1,381 4,324 5,705
Additions 84,083 170,254 0 0 0 59,637 313,974
Disposals -14,084 -94,496 -11,211 -7,070 -4,000 -42,244 -173,105
Final balance 31 December 123,960 525,387 0 0 33,468 608,516 1,291,331
Cumulative depreciation 1 January -5,220 -42,374 -740 -199 -1,058 1,036 -48,555
Write-ups/down from measurement at fair value 7,991 39,717 0 0 898 41,262 89,868
Disposals 57 358 740 199 -19 134 1,469
Final balance 31 December 2,828 -2,299 0 0 -179 42,432 42,782
Book value 31 December 126,788 523,088 0 0 33,289 650,948 1,334,113
Credit exposure
in ’000 EUR 2008 2007 Change
in ’000 EUR in %
Credit exposure 1,334,113 1,096,202 237,911 21.7
Collateral 376,557 361,845 14,712 4.1
Change in market value, total 52,484 -6,644 59,128 > -100.0
.thereof market-related 65,030 -4,554 69,584 > -100.0
.thereof credit risk-related -12,546 -2,090 -10,456 > 100.0
Change in market value during reporting period 59,128 -44,154 103,282 > -100.0
.thereof market-related 69,584 -42,064 111,648 > -100.0
.thereof credit risk-related -10,456 -2,090 -8,366 > 100.0
‘Financial assets – available for sale’ includes an amount of EUR 13,306,000 (2007: EUR 13,999,000) representing investments and shares in affiliated companies. These assets were not designated at fair value. The fair value of these financial instruments could not be reliably determined as these assets are not traded on an active market, no comparable investments could be observed on the market, and no reliable valuation based on internal models is possible. These assets are strategic investments made by the Group. There is thus no intention to sell.
A formula is employed to determine the credit risk-related change in fair value, in which the market risk-related change in fair value is deducted from the total change in fair value. A valuation gain of EUR +726,000 (2007: EUR -4,289,000) resulted from the disposal of financial assets designated at fair value. This was offset by a valuation loss of EUR -941,000 (2007: EUR +3,574,000) from the disposal of derivatives.
Financial assets designated at fair value – breakdown by maturity
in ’000 EUR 31.12.2008 31.12.2007 Change
in ’000 EUR in %
Repayable on demand 22,449 17,464 4,985 28.5
With a remaining maturity of
3 months or less 2,598 59,311 -56,713 -95.6
3 months to 1 year 56,802 71,293 -14,491 -20.3
>1 to 5 years 578,699 298,254 280,445 94.0
> 5 years 678,304 637,500 40,804 6.4
without maturity 13,871 29,844 -15,973 -53.5
Financial assets at fair value 1,352,723 1,113,666 239,057 21.5
Financial assets designated at fair value – breakdown by product
in ’000 EUR 31.12.2008 31.12.2007 Change
in ’000 EUR in %
Bonds of public-sector issuers 126,788 48,741 78,047 > 100.0
Bonds of other issuers 523,088 407,255 115,833 28.4
Shares 0 10,471 -10,471 -100.0
Investment certificates 0 6,871 -6,871 -100.0
Loans and advances to, and placements with banks 33,289 35,029 -1,740 -5.0
Loans and advances to customers 650,948 587,835 63,113 10.7
Deferred interest 18,610 17,464 1,146 6.6
Financial assets – at fair value 1,352,723 1,113,666 239,057 21.5
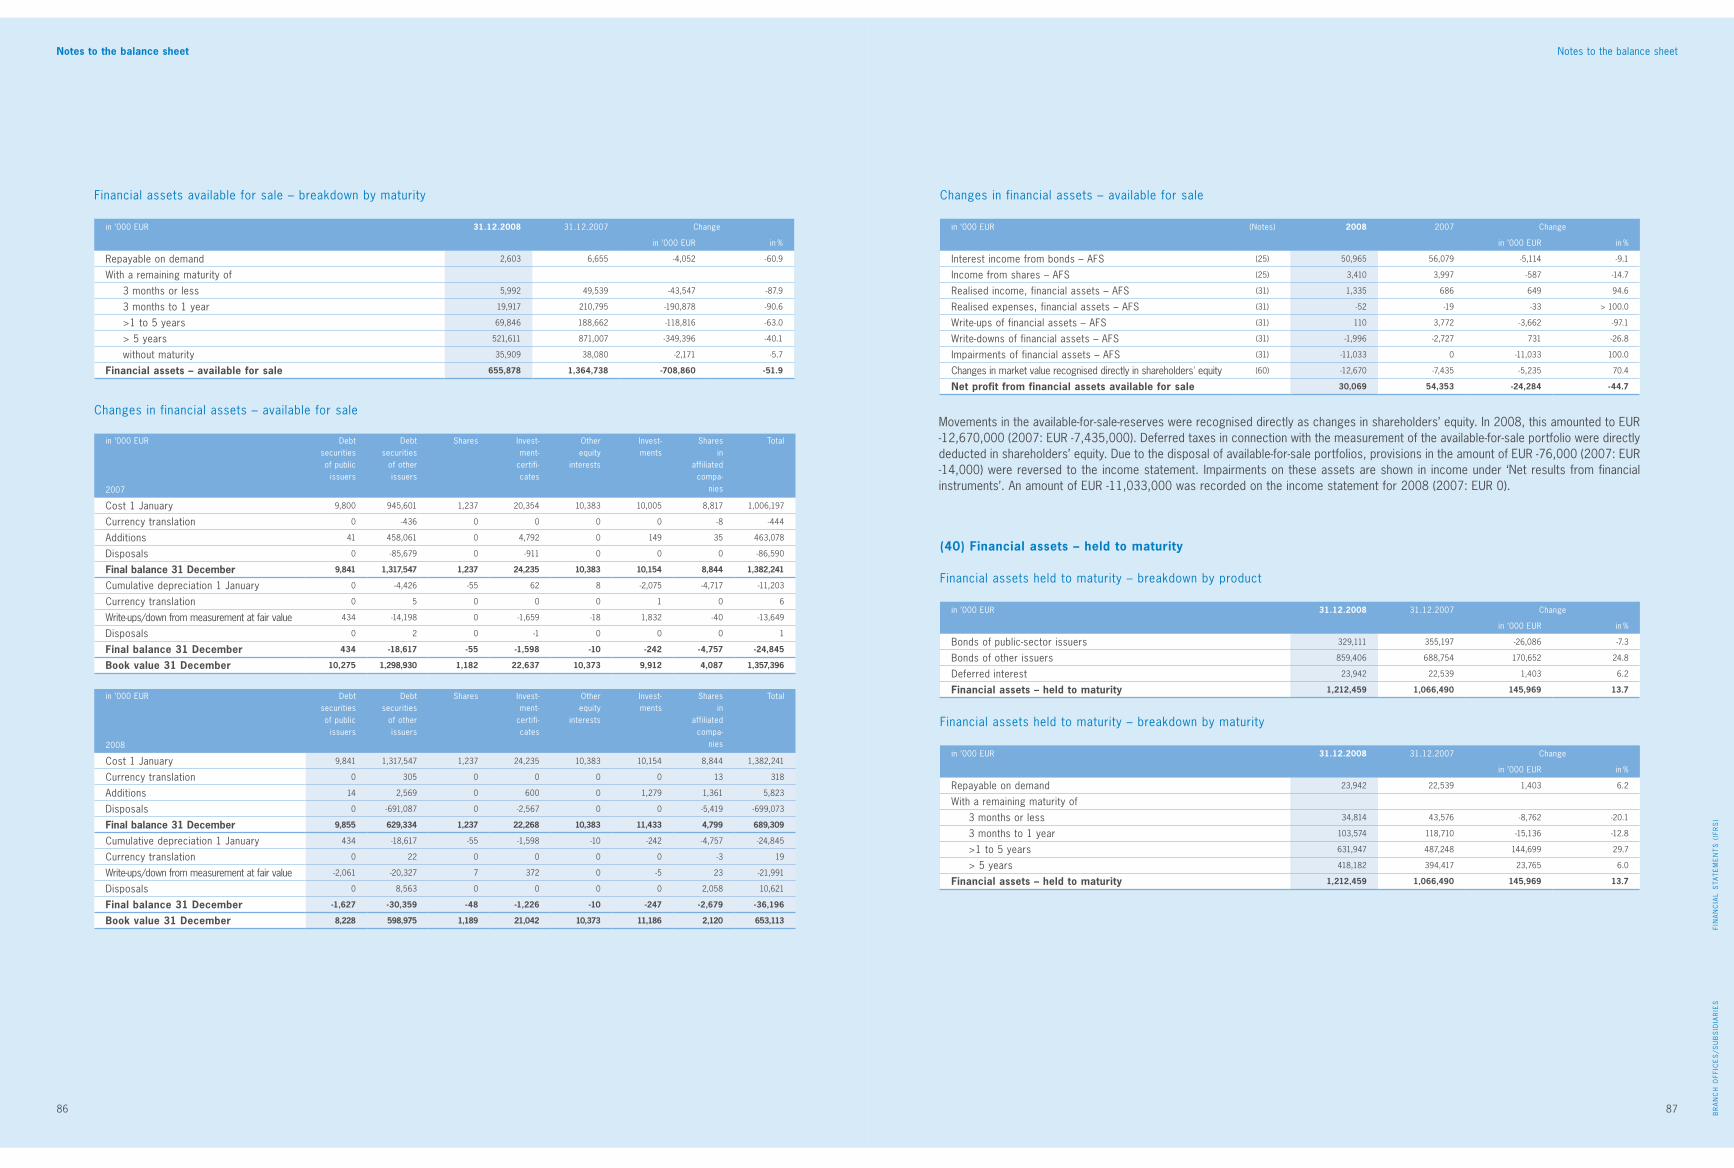
Foreword
86 87
Foreword
FIN
AN
CIA
L S
TAT
EM
EN
TS
(IF
RS
)B
RA
NC
H O
FFIC
ES
/SU
BS
IDIA
RIE
S
87
Notes to the balance sheetNotes to the balance sheet
Financial assets available for sale – breakdown by maturity
in ’000 EUR 31.12.2008 31.12.2007 Change
in ’000 EUR in %
Repayable on demand 2,603 6,655 -4,052 -60.9
With a remaining maturity of
3 months or less 5,992 49,539 -43,547 -87.9
3 months to 1 year 19,917 210,795 -190,878 -90.6
>1 to 5 years 69,846 188,662 -118,816 -63.0
> 5 years 521,611 871,007 -349,396 -40.1
without maturity 35,909 38,080 -2,171 -5.7
Financial assets – available for sale 655,878 1,364,738 -708,860 -51.9
Changes in financial assets – available for sale
in ’000 EUR (Notes) 2008 2007 Change
in ’000 EUR in %
Interest income from bonds – AFS (25) 50,965 56,079 -5,114 -9.1
Income from shares – AFS (25) 3,410 3,997 -587 -14.7
Realised income, financial assets – AFS (31) 1,335 686 649 94.6
Realised expenses, financial assets – AFS (31) -52 -19 -33 > 100.0
Write-ups of financial assets – AFS (31) 110 3,772 -3,662 -97.1
Write-downs of financial assets – AFS (31) -1,996 -2,727 731 -26.8
Impairments of financial assets – AFS (31) -11,033 0 -11,033 100.0
Changes in market value recognised directly in shareholders' equity (60) -12,670 -7,435 -5,235 70.4
Net profit from financial assets available for sale 30,069 54,353 -24,284 -44.7
Financial assets held to maturity – breakdown by maturity
in ’000 EUR 31.12.2008 31.12.2007 Change
in ’000 EUR in %
Repayable on demand 23,942 22,539 1,403 6.2
With a remaining maturity of
3 months or less 34,814 43,576 -8,762 -20.1
3 months to 1 year 103,574 118,710 -15,136 -12.8
>1 to 5 years 631,947 487,248 144,699 29.7
> 5 years 418,182 394,417 23,765 6.0
Financial assets – held to maturity 1,212,459 1,066,490 145,969 13.7
(40) Financial assets – held to maturity
Financial assets held to maturity – breakdown by product
in ’000 EUR 31.12.2008 31.12.2007 Change
in ’000 EUR in %
Bonds of public-sector issuers 329,111 355,197 -26,086 -7.3
Bonds of other issuers 859,406 688,754 170,652 24.8
Deferred interest 23,942 22,539 1,403 6.2
Financial assets – held to maturity 1,212,459 1,066,490 145,969 13.7
Changes in financial assets – available for sale
in ’000 EUR Debt securitiesof public
issuers
Debt securities
of otherissuers
Shares Invest-ment-
certifi-cates
Otherequity
interests
Invest-ments
Sharesin
affiliatedcompa-
nies
Total
2007
Cost 1 January 9,800 945,601 1,237 20,354 10,383 10,005 8,817 1,006,197
Currency translation 0 -436 0 0 0 0 -8 -444
Additions 41 458,061 0 4,792 0 149 35 463,078
Disposals 0 -85,679 0 -911 0 0 0 -86,590
Final balance 31 December 9,841 1,317,547 1,237 24,235 10,383 10,154 8,844 1,382,241
Cumulative depreciation 1 January 0 -4,426 -55 62 8 -2,075 -4,717 -11,203
Currency translation 0 5 0 0 0 1 0 6
Write-ups/down from measurement at fair value 434 -14,198 0 -1,659 -18 1,832 -40 -13,649
Disposals 0 2 0 -1 0 0 0 1
Final balance 31 December 434 -18,617 -55 -1,598 -10 -242 -4,757 -24,845
Book value 31 December 10,275 1,298,930 1,182 22,637 10,373 9,912 4,087 1,357,396
in ’000 EUR Debt securitiesof public
issuers
Debt securities
of otherissuers
Shares Invest-ment-
certifi-cates
Otherequity
interests
Invest-ments
Sharesin
affiliatedcompa-
nies
Total
2008
Cost 1 January 9,841 1,317,547 1,237 24,235 10,383 10,154 8,844 1,382,241
Currency translation 0 305 0 0 0 0 13 318
Additions 14 2,569 0 600 0 1,279 1,361 5,823
Disposals 0 -691,087 0 -2,567 0 0 -5,419 -699,073
Final balance 31 December 9,855 629,334 1,237 22,268 10,383 11,433 4,799 689,309
Cumulative depreciation 1 January 434 -18,617 -55 -1,598 -10 -242 -4,757 -24,845
Currency translation 0 22 0 0 0 0 -3 19
Write-ups/down from measurement at fair value -2,061 -20,327 7 372 0 -5 23 -21,991
Disposals 0 8,563 0 0 0 0 2,058 10,621
Final balance 31 December -1,627 -30,359 -48 -1,226 -10 -247 -2,679 -36,196
Book value 31 December 8,228 598,975 1,189 21,042 10,373 11,186 2,120 653,113
Movements in the available-for-sale-reserves were recognised directly as changes in shareholders’ equity. In 2008, this amounted to EUR -12,670,000 (2007: EUR -7,435,000). Deferred taxes in connection with the measurement of the available-for-sale portfolio were directly deducted in shareholders’ equity. Due to the disposal of available-for-sale portfolios, provisions in the amount of EUR -76,000 (2007: EUR -14,000) were reversed to the income statement. Impairments on these assets are shown in income under ‘Net results from financial instruments’. An amount of EUR -11,033,000 was recorded on the income statement for 2008 (2007: EUR 0).
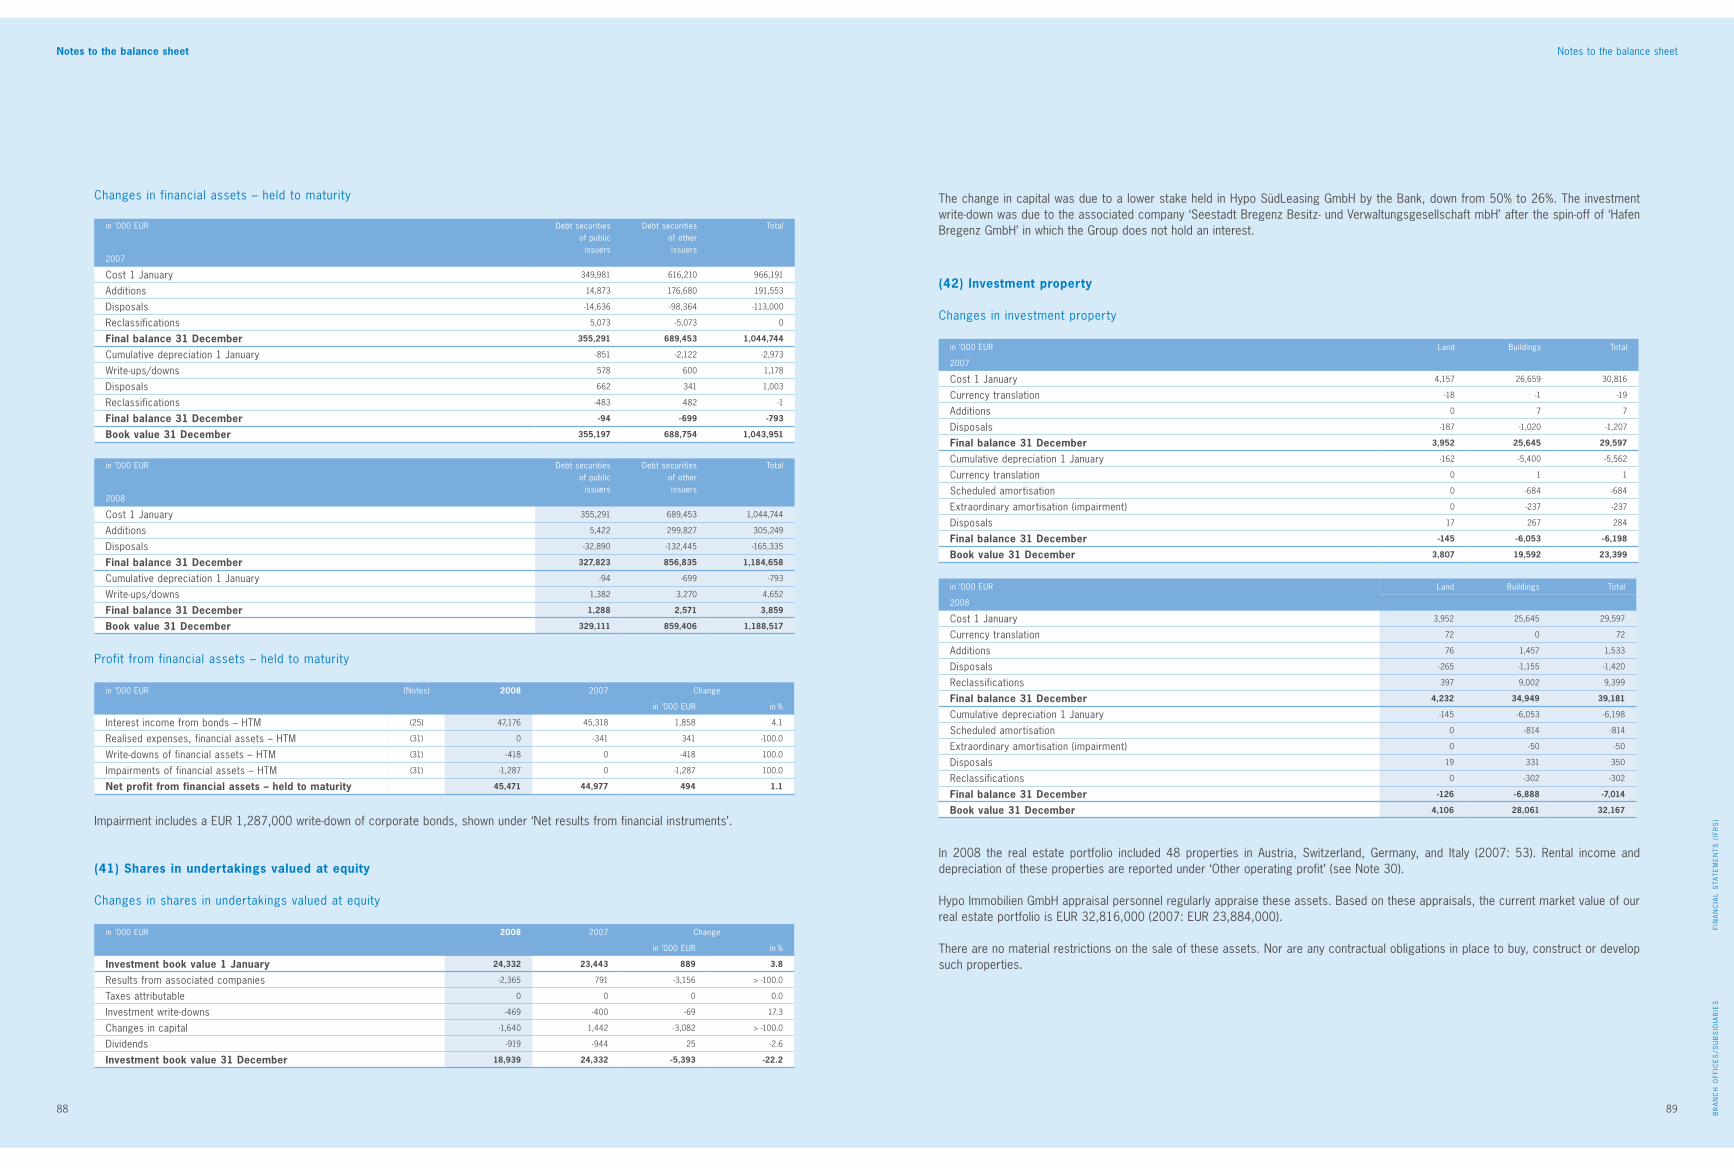
Foreword
88 89
Foreword
FIN
AN
CIA
L S
TAT
EM
EN
TS
(IF
RS
)B
RA
NC
H O
FFIC
ES
/SU
BS
IDIA
RIE
S
89
Notes to the balance sheetNotes to the balance sheet
Profit from financial assets – held to maturity
in ’000 EUR (Notes) 2008 2007 Change
in ’000 EUR in %
Interest income from bonds – HTM (25) 47,176 45,318 1,858 4.1
Realised expenses, financial assets – HTM (31) 0 -341 341 -100.0
Write-downs of financial assets – HTM (31) -418 0 -418 100.0
Impairments of financial assets – HTM (31) -1,287 0 -1,287 100.0
Net profit from financial assets – held to maturity 45,471 44,977 494 1.1
in ’000 EUR Debt securitiesof public
issuers
Debt securitiesof otherissuers
Total
2008
Cost 1 January 355,291 689,453 1,044,744
Additions 5,422 299,827 305,249
Disposals -32,890 -132,445 -165,335
Final balance 31 December 327,823 856,835 1,184,658
Cumulative depreciation 1 January -94 -699 -793
Write-ups/downs 1,382 3,270 4,652
Final balance 31 December 1,288 2,571 3,859
Book value 31 December 329,111 859,406 1,188,517
(42) Investment property
Changes in investment property
in ’000 EUR Land Buildings Total
2007
Cost 1 January 4,157 26,659 30,816
Currency translation -18 -1 -19
Additions 0 7 7
Disposals -187 -1,020 -1,207
Final balance 31 December 3,952 25,645 29,597
Cumulative depreciation 1 January -162 -5,400 -5,562
Currency translation 0 1 1
Scheduled amortisation 0 -684 -684
Extraordinary amortisation (impairment) 0 -237 -237
Disposals 17 267 284
Final balance 31 December -145 -6,053 -6,198
Book value 31 December 3,807 19,592 23,399
in ’000 EUR Land Buildings Total
2008
Cost 1 January 3,952 25,645 29,597
Currency translation 72 0 72
Additions 76 1,457 1,533
Disposals -265 -1,155 -1,420
Reclassifications 397 9,002 9,399
Final balance 31 December 4,232 34,949 39,181
Cumulative depreciation 1 January -145 -6,053 -6,198
Scheduled amortisation 0 -814 -814
Extraordinary amortisation (impairment) 0 -50 -50
Disposals 19 331 350
Reclassifications 0 -302 -302
Final balance 31 December -126 -6,888 -7,014
Book value 31 December 4,106 28,061 32,167
In 2008 the real estate portfolio included 48 properties in Austria, Switzerland, Germany, and Italy (2007: 53). Rental income and depreciation of these properties are reported under ‘Other operating profit’ (see Note 30).
Hypo Immobilien GmbH appraisal personnel regularly appraise these assets. Based on these appraisals, the current market value of our real estate portfolio is EUR 32,816,000 (2007: EUR 23,884,000).
There are no material restrictions on the sale of these assets. Nor are any contractual obligations in place to buy, construct or develop such properties.
(41) Shares in undertakings valued at equity
Changes in shares in undertakings valued at equity
in ’000 EUR 2008 2007 Change
in ’000 EUR in %
Investment book value 1 January 24,332 23,443 889 3.8
Results from associated companies -2,365 791 -3,156 > -100.0
Taxes attributable 0 0 0 0.0
Investment write-downs -469 -400 -69 17.3
Changes in capital -1,640 1,442 -3,082 > -100.0
Dividends -919 -944 25 -2.6
Investment book value 31 December 18,939 24,332 -5,393 -22.2
The change in capital was due to a lower stake held in Hypo SüdLeasing GmbH by the Bank, down from 50% to 26%. The investment write-down was due to the associated company ‘Seestadt Bregenz Besitz- und Verwaltungsgesellschaft mbH’ after the spin-off of ‘Hafen Bregenz GmbH’ in which the Group does not hold an interest.
Impairment includes a EUR 1,287,000 write-down of corporate bonds, shown under ‘Net results from financial instruments’.
Changes in financial assets – held to maturity
in ’000 EUR Debt securitiesof public
issuers
Debt securitiesof otherissuers
Total
2007
Cost 1 January 349,981 616,210 966,191
Additions 14,873 176,680 191,553
Disposals -14,636 -98,364 -113,000
Reclassifications 5,073 -5,073 0
Final balance 31 December 355,291 689,453 1,044,744
Cumulative depreciation 1 January -851 -2,122 -2,973
Write-ups/downs 578 600 1,178
Disposals 662 341 1,003
Reclassifications -483 482 -1
Final balance 31 December -94 -699 -793
Book value 31 December 355,197 688,754 1,043,951
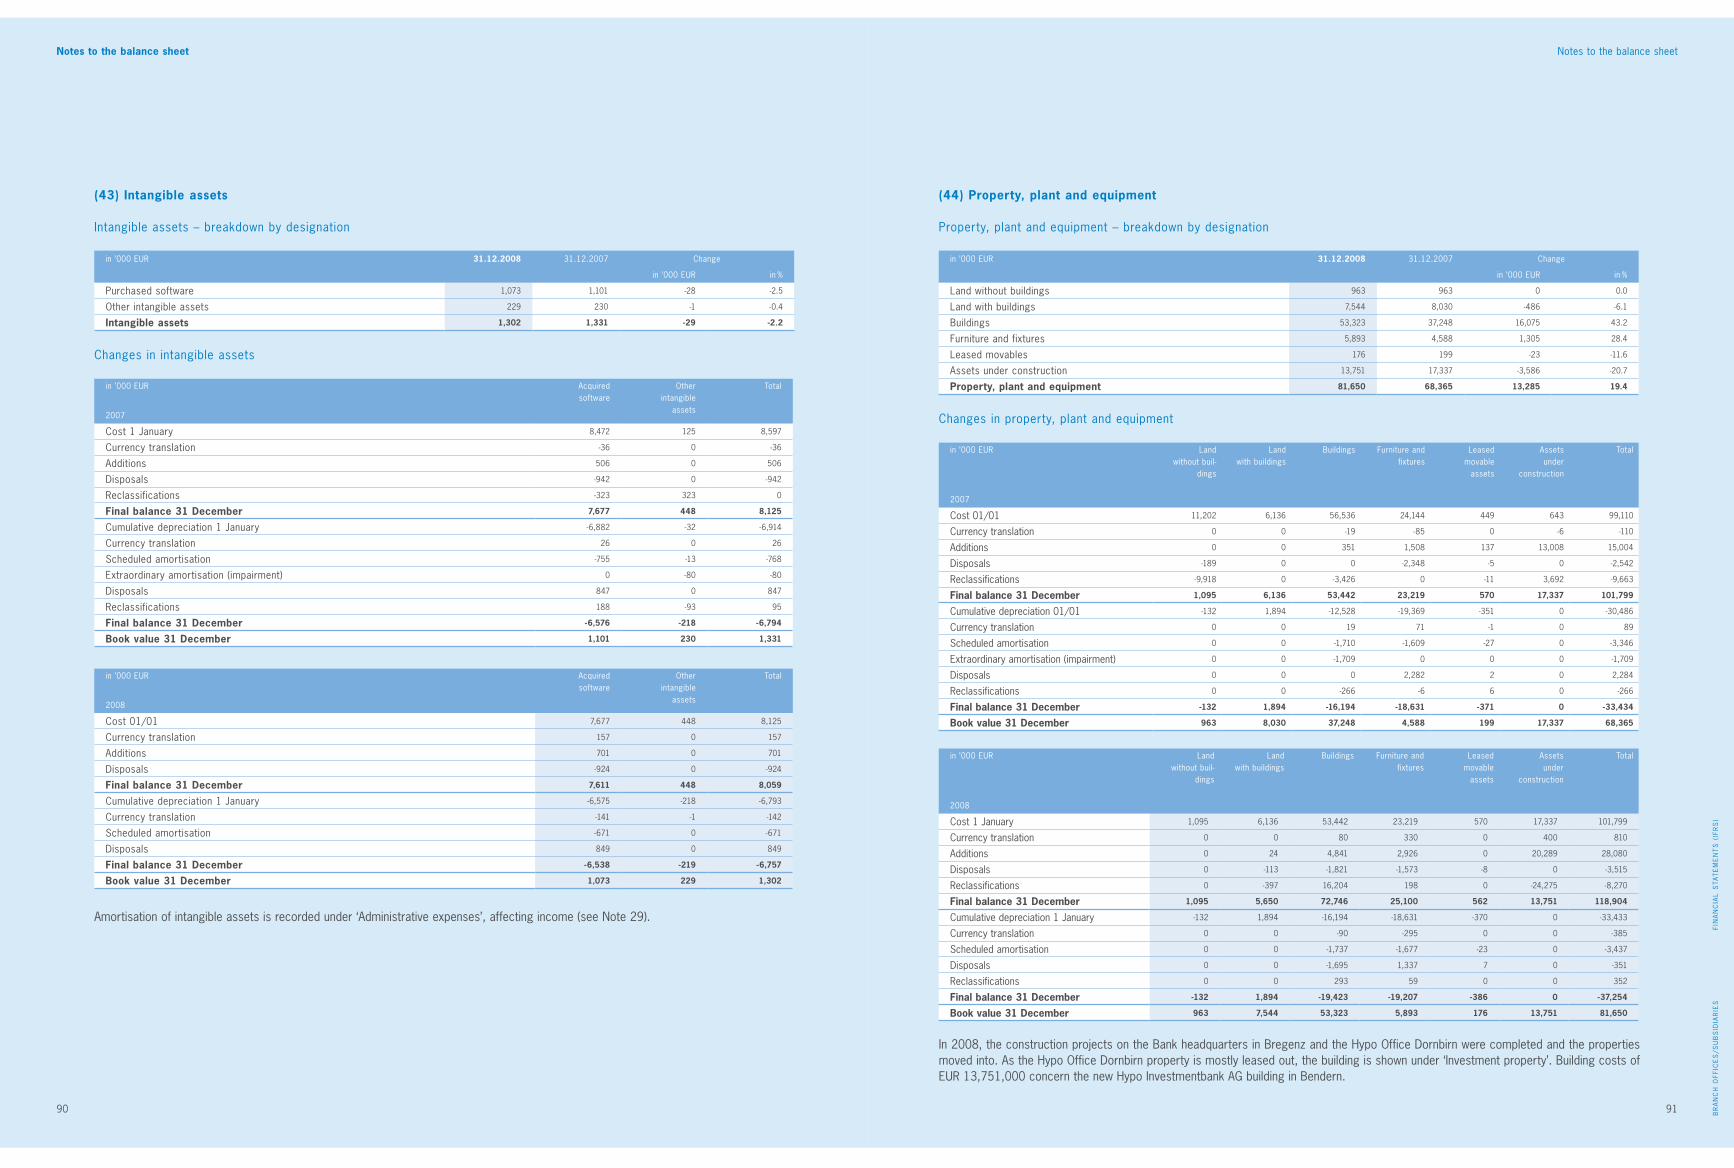
Foreword
90 91
Foreword
FIN
AN
CIA
L S
TAT
EM
EN
TS
(IF
RS
)B
RA
NC
H O
FFIC
ES
/SU
BS
IDIA
RIE
S
91
Notes to the balance sheetNotes to the balance sheet
(43) Intangible assets
Intangible assets – breakdown by designation
in ’000 EUR 31.12.2008 31.12.2007 Change
in ’000 EUR in %
Purchased software 1,073 1,101 -28 -2.5
Other intangible assets 229 230 -1 -0.4
Intangible assets 1,302 1,331 -29 -2.2
Changes in intangible assets
in ’000 EUR Acquiredsoftware
Otherintangible
assets
Total
2007
Cost 1 January 8,472 125 8,597
Currency translation -36 0 -36
Additions 506 0 506
Disposals -942 0 -942
Reclassifications -323 323 0
Final balance 31 December 7,677 448 8,125
Cumulative depreciation 1 January -6,882 -32 -6,914
Currency translation 26 0 26
Scheduled amortisation -755 -13 -768
Extraordinary amortisation (impairment) 0 -80 -80
Disposals 847 0 847
Reclassifications 188 -93 95
Final balance 31 December -6,576 -218 -6,794
Book value 31 December 1,101 230 1,331
in ’000 EUR Acquiredsoftware
Otherintangible
assets
Total
2008
Cost 01/01 7,677 448 8,125
Currency translation 157 0 157
Additions 701 0 701
Disposals -924 0 -924
Final balance 31 December 7,611 448 8,059
Cumulative depreciation 1 January -6,575 -218 -6,793
Currency translation -141 -1 -142
Scheduled amortisation -671 0 -671
Disposals 849 0 849
Final balance 31 December -6,538 -219 -6,757
Book value 31 December 1,073 229 1,302
(44) Property, plant and equipment
Property, plant and equipment – breakdown by designation
in ’000 EUR 31.12.2008 31.12.2007 Change
in ’000 EUR in %
Land without buildings 963 963 0 0.0
Land with buildings 7,544 8,030 -486 -6.1
Buildings 53,323 37,248 16,075 43.2
Furniture and fixtures 5,893 4,588 1,305 28.4
Leased movables 176 199 -23 -11.6
Assets under construction 13,751 17,337 -3,586 -20.7
Property, plant and equipment 81,650 68,365 13,285 19.4
Changes in property, plant and equipment
in ’000 EUR Landwithout buil-
dings
Landwith buildings
Buildings Furniture and fixtures
Leasedmovable
assets
Assetsunder
construction
Total
2007
Cost 01/01 11,202 6,136 56,536 24,144 449 643 99,110
Currency translation 0 0 -19 -85 0 -6 -110
Additions 0 0 351 1,508 137 13,008 15,004
Disposals -189 0 0 -2,348 -5 0 -2,542
Reclassifications -9,918 0 -3,426 0 -11 3,692 -9,663
Final balance 31 December 1,095 6,136 53,442 23,219 570 17,337 101,799
Cumulative depreciation 01/01 -132 1,894 -12,528 -19,369 -351 0 -30,486
Currency translation 0 0 19 71 -1 0 89
Scheduled amortisation 0 0 -1,710 -1,609 -27 0 -3,346
Extraordinary amortisation (impairment) 0 0 -1,709 0 0 0 -1,709
Disposals 0 0 0 2,282 2 0 2,284
Reclassifications 0 0 -266 -6 6 0 -266
Final balance 31 December -132 1,894 -16,194 -18,631 -371 0 -33,434
Book value 31 December 963 8,030 37,248 4,588 199 17,337 68,365
in ’000 EUR Landwithout buil-
dings
Landwith buildings
Buildings Furniture and fixtures
Leasedmovable
assets
Assetsunder
construction
Total
2008
Cost 1 January 1,095 6,136 53,442 23,219 570 17,337 101,799
Currency translation 0 0 80 330 0 400 810
Additions 0 24 4,841 2,926 0 20,289 28,080
Disposals 0 -113 -1,821 -1,573 -8 0 -3,515
Reclassifications 0 -397 16,204 198 0 -24,275 -8,270
Final balance 31 December 1,095 5,650 72,746 25,100 562 13,751 118,904
Cumulative depreciation 1 January -132 1,894 -16,194 -18,631 -370 0 -33,433
Currency translation 0 0 -90 -295 0 0 -385
Scheduled amortisation 0 0 -1,737 -1,677 -23 0 -3,437
Disposals 0 0 -1,695 1,337 7 0 -351
Reclassifications 0 0 293 59 0 0 352
Final balance 31 December -132 1,894 -19,423 -19,207 -386 0 -37,254
Book value 31 December 963 7,544 53,323 5,893 176 13,751 81,650
In 2008, the construction projects on the Bank headquarters in Bregenz and the Hypo Office Dornbirn were completed and the properties moved into. As the Hypo Office Dornbirn property is mostly leased out, the building is shown under ‘Investment property’. Building costs of EUR 13,751,000 concern the new Hypo Investmentbank AG building in Bendern.
Amortisation of intangible assets is recorded under ‘Administrative expenses’, affecting income (see Note 29).

Foreword
92 93
Foreword
FIN
AN
CIA
L S
TAT
EM
EN
TS
(IF
RS
)B
RA
NC
H O
FFIC
ES
/SU
BS
IDIA
RIE
S
93
Notes to the balance sheetNotes to the balance sheet
(46) Deferred tax assets
in ’000 EUR 31.12.2008 31.12.2007 Change
in ’000 EUR in %
from loans and advances to customers 4,224 2,543 1,681 66.1
from loan loss provisions 2,636 2,282 354 15.5
from trading assets and derivatives 0 22 -22 -100.0
from financial assets – at fair value 6,771 5,217 1,554 29.8
from financial assets – available for sale 5,074 2,628 2,446 93.1
from financial assets – held to maturity 53 0 53 100.0
from property, plant and equipment 1,017 1,018 -1 -0.1
from other assets 238 68 170 > 100.0
Deferred tax assets from highervaluation of assets on tax balance sheet 20,013 13,778 6,235 45.3
in ’000 EUR 31.12.2008 31.12.2007 Change
in ’000 EUR in %
from amounts owed to customers 269 338 -69 -20.4
from trading liabilitiess and derivatives 43,429 78,965 -35,536 -45.0
from financial liabilities – at fair value 21,877 3,140 18,737 > 100.0
from provisions 472 455 17 3.7
from social capital 2,605 2,416 189 7.8
Deferred tax assets from lower valuationof liabilities on the tax balance sheet 68,652 85,314 -16,662 -19.5
Deferred tax assets 88,665 99,092 -10,427 -10.5
Deferred tax assets in the amount of EUR 9,221,000 (2007: EUR 6,517,000) mature in more than one year. The Group has unused capitalised loss carryforwards of EUR 2,070,000 (2007: EUR 2,070,000). Deferred taxes arising from the measurement of financial instruments classified as available-for-sale were recognised directly in shareholders’ equity, i.e. with no effect on income. Deferred taxes (tax assets) totalled EUR 6,707,000 in 2008 (2007: EUR 2,577,000 tax assets).
(45) Current tax assets
in ’000 EUR 31.12.2008 31.12.2007 Change
in ’000 EUR in %
Current income tax assets 610 597 13 2.2
Other tax assets 4,345 5,335 -990 -18.6
VAT assets 8,781 15,280 -6,499 -42.5
Current tax assets 13,736 21,212 -7,476 -35.2
VAT assets result predominantly from the VAT treatment of leasing agreements in Italy. VAT on the purchase of assets from lease contracts may not be immediately deducted in Italy. However, VAT payable on current leasing instalments may be set off against these asset items. Tax assets in the amount of EUR 8,162,000 (2007: EUR 14,413,000) mature in more than one year.
Current income tax assets and liabilities are measured at the current applicable rates at which they are due from/to the relevant tax authorities.
(47) Available-for-sale assets
in ’000 EUR 31.12.2008 31.12.2007 Change
in ’000 EUR in %
Land available for sale 10,081 10,214 -133 -1.3
Buildings available for sale 48,367 40,874 7,493 18.3
Other assets available for sale 3 5 -2 -40.0
Assets available for sale 58,451 51,093 7,358 14.4
No current depreciation is applied to these assets. They are subject to impairment when fair value less cost to sell is lower than carrying value. Impairment is recorded under ‘Other operating profit’, which in 2008 totalled EUR 1,538,000 (2007: EUR 200,000).
Cost to sell is an insignificant factor with assets available for sale, as both transaction and utilisation costs to sell are transferred to the buyer. The increase in the present value of cost to sell over time is of minor importance for these consolidated financial statements, and thus was not taken into account. If sale does not take place within one year as planned, the Group does not reclassify the assets to property, plant and equipment, as the ‘assets available for sale’ are not available for Group business purposes.
Changes in assets available for sale
in ’000 EUR Land Buildings Otherassets
Total
2007
Cost 1 January 4,389 56,850 0 61,239
Additions 0 6,717 0 6,717
Disposals -249 -7,092 0 -7,341
Reclassifications 9,918 9,766 11 19,695
Final balance 31 December 14,058 66,241 11 80,310
Cumulative depreciation 1 January -3,854 -14,379 0 -18,233
Scheduled amortisation 1 218 0 219
Extraordinary amortisation (impairment) 0 -200 0 -200
Disposals 9 444 0 453
Reclassifications 0 -11,450 -6 -11,456
Final balance 31 December -3,844 -25,367 -6 -29,217
Book value 31 December 10,214 40,874 5 51,093
in ’000 EUR Land Buildings Otherassets
Total
2008
Cost 1 January 14,058 66,241 11 80,310
Additions 0 16,434 0 16,434
Disposals -154 -2,582 -8 -2,744
Reclassifications 0 -31 0 -31
Final balance 31 December 13,904 80,062 3 93,969
Cumulative depreciation 1 January -3,844 -25,367 -6 -29,217
Scheduled amortisation 0 -14 -2 -16
Extraordinary amortisation (impairment) 0 -1,538 0 -1,538
Disposals 21 728 8 757
Reclassifications 0 -5,504 0 -5,504
Final balance 31 December -3,823 -31,695 0 -35,518
Book value 31 December 10,081 48,367 3 58,451
(48) Other assets
Receivables not related to the banking business (mainly trade receivables) and prepayments and accrued income are shown under ‘Other assets’.
The impairments recorded include properties in South Tyrol, the recoverable amount of which is below the original carrying value.

Foreword
94 95
Foreword
FIN
AN
CIA
L S
TAT
EM
EN
TS
(IF
RS
)B
RA
NC
H O
FFIC
ES
/SU
BS
IDIA
RIE
S
95
Notes to the balance sheetNotes to the balance sheet
(49) Amounts owed to banks (LAC)
Amounts owed to banks – breakdown by product
in ’000 EUR 31.12.2008 31.12.2007 Change
in ’000 EUR in %
Interbank accounts 147,637 35,174 112,463 > 100.0
Money market borrowings 85,620 7,207 78,413 > 100.0
Loans from banks 28,078 46,673 -18,595 -39.8
Other liabilities 8 307 -299 -97.4
Amounts owed to banks 261,343 89,361 171,982 > 100.0
Amounts owed to banks – breakdown by region
in ’000 EUR 31.12.2008 31.12.2007 Change
in ’000 EUR in %
Austria 84,039 53,528 30,511 57.0
International 177,304 35,833 141,471 > 100.0
Germany 19,632 16,338 3,294 20.2
Switzerland and Liechtenstein 26,597 1,693 24,904 > 100.0
Italy 7 89 -82 -92.1
Other international 131,068 17,713 113,355 > 100.0
Amounts owed to banks 261,343 89,361 171,982 > 100.0
(50) Amounts owed to customers (LAC)
Amounts owed to customers – breakdown by product
in ’000 EUR 31.12.2008 31.12.2007 Change
in ’000 EUR in %
Giro deposits 1,356,648 874,847 481,801 55.1
Time deposits 1,210,384 1,311,093 -100,709 -7.7
Savings deposits 661,635 635,372 26,263 4.1
Special-interest savings books 746,084 460,656 285,428 62.0
Amounts owed to customers 3,974,751 3,281,968 692,783 21.1
Amounts owed to banks – breakdown by maturity
in ’000 EUR 31.12.2008 31.12.2007 Change
in ’000 EUR in %
Repayable on demand 70,190 61,092 9,098 14.9
With a remaining maturity of
3 months or less 89,583 5,732 83,851 > 100.0
3 months to 1 year 53,750 1,521 52,229 > 100.0
>1 to 5 years 4,360 21,016 -16,656 -79.3
> 5 years 43,460 0 43,460 100.0
Amounts owed to banks 261,343 89,361 171,982 > 100.0
Loss on amounts owed to banks
in ’000 EUR (Notes) 2008 2007 Change
in ’000 EUR in %
Interest expenses on amounts owed to banks (25) -19,288 -3,094 -16,194 > 100.0
Total loss on amounts owed to banks -19,288 -3,094 -16,194 > 100.0
Amounts owed to customers – breakdown by region
in ’000 EUR 31.12.2008 31.12.2007 Change
in ’000 EUR in %
Austria 2,343,719 1,994,929 348,790 17.5
International 1,631,032 1,287,039 343,993 26.7
Germany 684,232 473,047 211,185 44.6
Switzerland and Liechtenstein 398,010 349,926 48,084 13.7
Italy 12,318 12,247 71 0.6
Other international 536,472 451,819 84,653 18.7
Amounts owed to customers 3,974,751 3,281,968 692,783 21.1
Amounts owed to customers – breakdown by maturity
in ’000 EUR 31.12.2008 31.12.2007 Change
in ’000 EUR in %
Repayable on demand 2,009,850 1,507,700 502,150 33.3
With a remaining maturity of
3 months or less 745,074 998,578 -253,504 -25.4
3 months to 1 year 1,061,745 584,656 477,089 81.6
>1 to 5 years 147,032 176,998 -29,966 -16.9
> 5 years 11,050 14,036 -2,986 -21.3
Amounts owed to customers 3,974,751 3,281,968 692,783 21.1
Amounts owed to customers – breakdown by product
in ’000 EUR 31.12.2008 31.12.2007 Change
in ’000 EUR in %
Public sector 66,253 8,820 57,433 > 100.0
Corporate Customers 1,273,226 1,058,829 214,397 20.2
Private households 2,113,703 1,741,484 372,219 21.4
Treasury 211,080 302,706 -91,626 -30.3
Other 310,489 170,129 140,360 82.5
Amounts owed to customers 3,974,751 3,281,968 692,783 21.1
Amounts owed to customers – breakdown by industry
in ’000 EUR 31.12.2008 31.12.2007 Change
in ’000 EUR in %
Public sector 95,368 82,880 12,488 15.1
Manufacturing 266,839 264,635 2,204 0.8
Industry 147,681 103,186 44,495 43.1
Trade 87,862 79,995 7,867 9.8
Tourism 30,698 23,854 6,844 28.7
Construction 36,553 23,485 13,068 55.6
Other industries 893,599 628,999 264,600 42.1
Freelance professions 161,259 148,447 12,812 8.6
Private households 1,890,778 1,479,226 411,552 27.8
Other 364,114 447,261 -83,147 -18.6
Amounts owed to customers 3,974,751 3,281,968 692,783 21.1
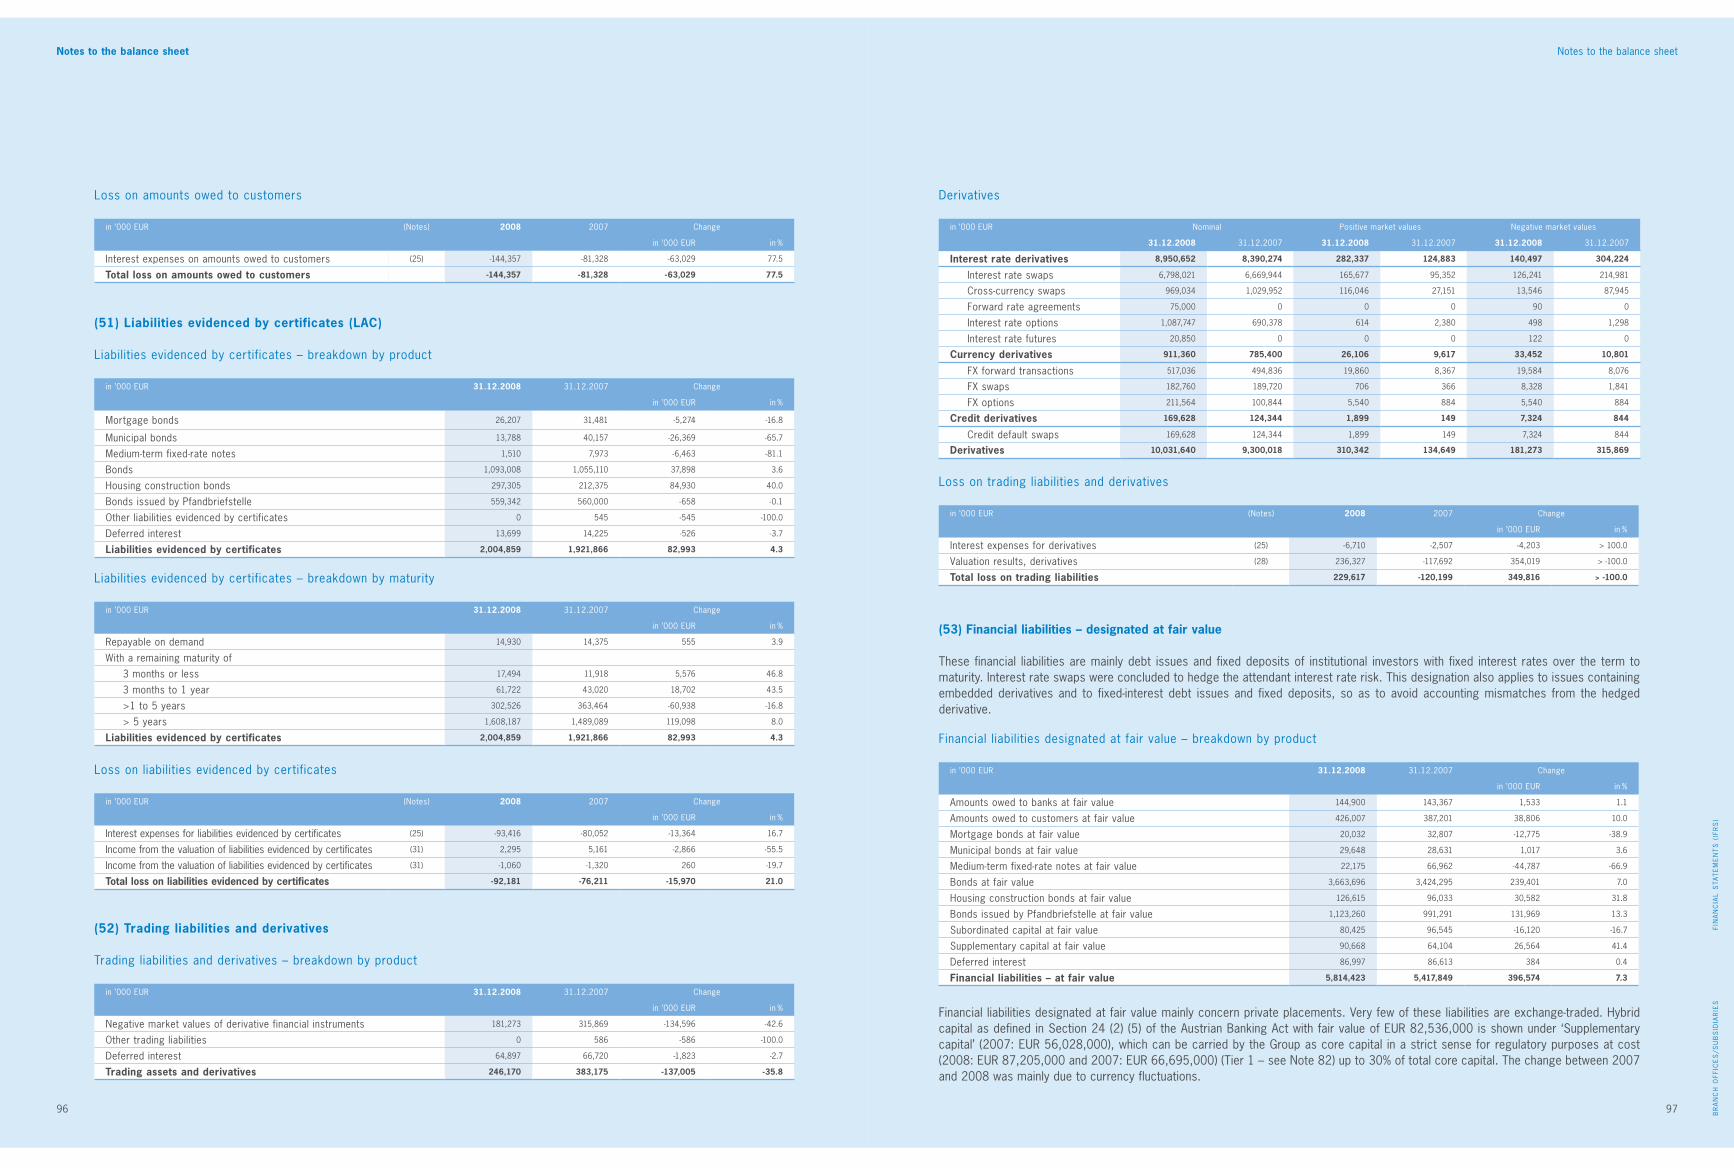
Foreword
96 97
Foreword
FIN
AN
CIA
L S
TAT
EM
EN
TS
(IF
RS
)B
RA
NC
H O
FFIC
ES
/SU
BS
IDIA
RIE
S
97
Notes to the balance sheetNotes to the balance sheet
Loss on amounts owed to customers
in ’000 EUR (Notes) 2008 2007 Change
in ’000 EUR in %
Interest expenses on amounts owed to customers (25) -144,357 -81,328 -63,029 77.5
Total loss on amounts owed to customers -144,357 -81,328 -63,029 77.5
(51) Liabilities evidenced by certificates (LAC)
Liabilities evidenced by certificates – breakdown by product
in ’000 EUR 31.12.2008 31.12.2007 Change
in ’000 EUR in %
Mortgage bonds 26,207 31,481 -5,274 -16.8
Municipal bonds 13,788 40,157 -26,369 -65.7
Medium-term fixed-rate notes 1,510 7,973 -6,463 -81.1
Bonds 1,093,008 1,055,110 37,898 3.6
Housing construction bonds 297,305 212,375 84,930 40.0
Bonds issued by Pfandbriefstelle 559,342 560,000 -658 -0.1
Other liabilities evidenced by certificates 0 545 -545 -100.0
Deferred interest 13,699 14,225 -526 -3.7
Liabilities evidenced by certificates 2,004,859 1,921,866 82,993 4.3
Liabilities evidenced by certificates – breakdown by maturity
in ’000 EUR 31.12.2008 31.12.2007 Change
in ’000 EUR in %
Repayable on demand 14,930 14,375 555 3.9
With a remaining maturity of
3 months or less 17,494 11,918 5,576 46.8
3 months to 1 year 61,722 43,020 18,702 43.5
>1 to 5 years 302,526 363,464 -60,938 -16.8
> 5 years 1,608,187 1,489,089 119,098 8.0
Liabilities evidenced by certificates 2,004,859 1,921,866 82,993 4.3
Loss on liabilities evidenced by certificates
in ’000 EUR (Notes) 2008 2007 Change
in ’000 EUR in %
Interest expenses for liabilities evidenced by certificates (25) -93,416 -80,052 -13,364 16.7
Income from the valuation of liabilities evidenced by certificates (31) 2,295 5,161 -2,866 -55.5
Income from the valuation of liabilities evidenced by certificates (31) -1,060 -1,320 260 -19.7
Total loss on liabilities evidenced by certificates -92,181 -76,211 -15,970 21.0
(52) Trading liabilities and derivatives
Trading liabilities and derivatives – breakdown by product
in ’000 EUR 31.12.2008 31.12.2007 Change
in ’000 EUR in %
Negative market values of derivative financial instruments 181,273 315,869 -134,596 -42.6
Other trading liabilities 0 586 -586 -100.0
Deferred interest 64,897 66,720 -1,823 -2.7
Trading assets and derivatives 246,170 383,175 -137,005 -35.8
Financial liabilities designated at fair value – breakdown by product
in ’000 EUR 31.12.2008 31.12.2007 Change
in ’000 EUR in %
Amounts owed to banks at fair value 144,900 143,367 1,533 1.1
Amounts owed to customers at fair value 426,007 387,201 38,806 10.0
Mortgage bonds at fair value 20,032 32,807 -12,775 -38.9
Municipal bonds at fair value 29,648 28,631 1,017 3.6
Medium-term fixed-rate notes at fair value 22,175 66,962 -44,787 -66.9
Bonds at fair value 3,663,696 3,424,295 239,401 7.0
Housing construction bonds at fair value 126,615 96,033 30,582 31.8
Bonds issued by Pfandbriefstelle at fair value 1,123,260 991,291 131,969 13.3
Subordinated capital at fair value 80,425 96,545 -16,120 -16.7
Supplementary capital at fair value 90,668 64,104 26,564 41.4
Deferred interest 86,997 86,613 384 0.4
Financial liabilities – at fair value 5,814,423 5,417,849 396,574 7.3
Loss on trading liabilities and derivatives
in ’000 EUR (Notes) 2008 2007 Change
in ’000 EUR in %
Interest expenses for derivatives (25) -6,710 -2,507 -4,203 > 100.0
Valuation results, derivatives (28) 236,327 -117,692 354,019 > -100.0
Total loss on trading liabilities 229,617 -120,199 349,816 > -100.0
Financial liabilities designated at fair value mainly concern private placements. Very few of these liabilities are exchange-traded. Hybrid capital as defined in Section 24 (2) (5) of the Austrian Banking Act with fair value of EUR 82,536,000 is shown under ‘Supplementary capital’ (2007: EUR 56,028,000), which can be carried by the Group as core capital in a strict sense for regulatory purposes at cost (2008: EUR 87,205,000 and 2007: EUR 66,695,000) (Tier 1 – see Note 82) up to 30% of total core capital. The change between 2007 and 2008 was mainly due to currency fluctuations.
(53) Financial liabilities – designated at fair value
These financial liabilities are mainly debt issues and fixed deposits of institutional investors with fixed interest rates over the term to maturity. Interest rate swaps were concluded to hedge the attendant interest rate risk. This designation also applies to issues containing embedded derivatives and to fixed-interest debt issues and fixed deposits, so as to avoid accounting mismatches from the hedged derivative.
Derivatives
in ’000 EUR Nominal Positive market values Negative market values
31.12.2008 31.12.2007 31.12.2008 31.12.2007 31.12.2008 31.12.2007
Interest rate derivatives 8,950,652 8,390,274 282,337 124,883 140,497 304,224
Interest rate swaps 6,798,021 6,669,944 165,677 95,352 126,241 214,981
Cross-currency swaps 969,034 1,029,952 116,046 27,151 13,546 87,945
Forward rate agreements 75,000 0 0 0 90 0
Interest rate options 1,087,747 690,378 614 2,380 498 1,298
Interest rate futures 20,850 0 0 0 122 0
Currency derivatives 911,360 785,400 26,106 9,617 33,452 10,801
FX forward transactions 517,036 494,836 19,860 8,367 19,584 8,076
FX swaps 182,760 189,720 706 366 8,328 1,841
FX options 211,564 100,844 5,540 884 5,540 884
Credit derivatives 169,628 124,344 1,899 149 7,324 844
Credit default swaps 169,628 124,344 1,899 149 7,324 844
Derivatives 10,031,640 9,300,018 310,342 134,649 181,273 315,869

Foreword
98 99
Foreword
FIN
AN
CIA
L S
TAT
EM
EN
TS
(IF
RS
)B
RA
NC
H O
FFIC
ES
/SU
BS
IDIA
RIE
S
99
Notes to the balance sheetNotes to the balance sheet
Financial liabilities designated at fair value – breakdown by maturity
in ’000 EUR 31.12.2008 31.12.2007 Change
in ’000 EUR in %
Repayable on demand 94,186 89,511 4,675 5.2
With a remaining maturity of
3 months or less 232,656 85,820 146,836 > 100.0
3 months to 1 year 64,129 115,867 -51,738 -44.7
>1 to 5 years 1,281,650 1,076,310 205,340 19.1
> 5 years 4,058,860 3,994,313 64,547 1.6
without maturity 82,942 56,028 26,914 48.0
Financial liabilities at fair value 5,814,423 5,417,849 396,574 7.3
Profit/loss on financial liabilities – designated at fair value
in ’000 EUR (Notes) 2008 2007 Change
in ’000 EUR in %
Interest expenses on liabilities – LAFV (25) -182,047 -195,947 13,900 -7.1
Valuation results, liabilities – LAFV (28) -226,526 126,239 -352,765 > -100.0
Total loss on financial assets at fair value -408,573 -69,708 -338,865 > 100.0
(54) Provisions
Provisions – breakdown by designation
in ’000 EUR 31.12.2008 31.12.2007 Change
in ’000 EUR in %
Provisions for guarantees/liabilities 48 1,100 -1,052 -95.6
Provisions for credit risks 8,572 2,991 5,581 > 100.0
Provisions for litigation 1,608 5,900 -4,292 -72.7
Provisions for staff 582 586 -4 -0.7
Provisions for other items 459 1,459 -1,000 -68.5
Provisions 11,269 12,036 -767 -6.4
Disclosure of the Bank’s own risk exposure
in ’000 EUR 2008 2007 Change
in ’000 EUR in %
Carrying value 5,727,426 5,331,236 396,190 7.4
Repayment amount 5,631,100 5,461,417 169,683 3.1
Difference between carrying value and repayment amount 96,326 -130,181 226,507 > -100.0
Change in market value, total 96,326 -130,181 226,507 > -100.0
.thereof market-related 120,510 -120,806 241,316 > -100.0
.thereof credit risk-related -24,184 -9,375 -14,809 > 100.0
Change in market value during reoprting period 226,507 -126,240 352,747 > -100.0
.thereof market-related 241,316 -123,115 364,431 > -100.0
.thereof credit risk-related -14,809 -3,125 -11,684 > 100.0
Changes in provisions
in ’000 EUR Guaranteesand liabilities
Creditrisks
Ongoinglitigation
Staff Other Total
2007
Book value 1 January 1,312 4,273 2,620 253 774 9,232
Currency translation 0 -2 0 0 0 -2
Additions 121 3,838 5,810 357 1,935 12,061
Utilised 0 -848 -309 -24 -829 -2,010
Disposals -333 -4,270 -2,221 0 -421 -7,245
Book value 31 December 1,100 2,991 5,900 586 1,459 12,036
in ’000 EUR Guaranteesand liabilities
Creditrisks
Ongoinglitigation
Staff Other Total
2008
Book value 1 January 1,100 2,991 5,900 586 1,459 12,036
Additions 16 3,861 17 0 112 4,006
Utilised 0 -164 -231 -4 -841 -1,240
Disposals -1,068 -2,116 -78 0 -271 -3,533
Other changes 0 4,000 -4,000 0 0 0
Book value 31 December 48 8,572 1,608 582 459 11,269
A formula is employed to determine the credit risk-related change in fair value, in which the market risk-related change in fair value is deducted from the total change in fair value.
In the calculation of the credit risk-related change in fair value, distinction is made between financial instruments backed by the Province of Vorarlberg (issues with maturities through 2017) and those issued without such a guarantee.
Although guarantees and liabilities are not reported, they involve considerable credit risk. Provisions are recognised for customers with deteriorating credit to take default risk into account.
Loan loss provisions are also intended to cover credit risk from unutilised credit lines. Unutilised financing commitments to customers constitute contingent liabilities. Because these items are not reported, the exposure may only be covered through provisions.
Provisions for litigation cover expected litigation and consulting fees as well as estimated payments to the lawsuit claimants. The point at which the relevant provisions are utilised depends on the length of litigation. Historically, provisions for litigation are typically recognised for one to two years.
Staff provisions are for pensions obligations to employees of the Hypo association. As this expenditure is not for Group employees, it is recorded as provisions rather than social capital.
The item ‘Without term to maturity’ includes hybrid capital as per Section 24 (2) (5) of the Austrian Banking Act.

Foreword
100 101
Foreword
FIN
AN
CIA
L S
TAT
EM
EN
TS
(IF
RS
)B
RA
NC
H O
FFIC
ES
/SU
BS
IDIA
RIE
S
101
Notes to the balance sheetNotes to the balance sheet
(55) Social capital
Social capital – breakdown by designation
in ’000 EUR 31.12.2008 31.12.2007 Change
in ’000 EUR in %
Severance pay provisions 8,923 8,061 862 10.7
Pension provisions 5,873 5,874 -1 0.0
Provisions for jubilee benefits 802 710 92 13.0
Social capital 15,598 14,645 953 6.5
Changes in social capital
in ’000 EUR Severanceprovisions
Pensionprovisions
Jubilee benefitsprovisions
Total
2007
Present value at 1 January 7,371 5,967 762 14,100
Current service cost 510 0 62 572
Interest expense 276 213 30 519
Payments -891 -406 -45 -1,342
Actuarial profits/losses 795 100 -99 796
Present value at 31 December 8,061 5,874 710 14,645
in ’000 EUR Severanceprovisions
Pensionprovisions
Jubilee benefitsprovisions
Total
2008
Present value at 1 January 8,061 5,874 710 14,645
Current service cost 482 0 63 545
Interest expense 381 283 35 699
Payments -178 -439 -24 -641
Actuarial profits/losses 177 155 18 350
Present value at 31 December 8,923 5,873 802 15,598
Social capital is not backed by special assets or funding. The net result from the allocation and release of provisions is directly recogni-sed in administrative expenses. We are required by law to hold fixed interest securities backing pension provisions for pension benefits accruing.
Actuarial profits and losses resulting from the adjustment of actuarial assumptions are immediately recorded in income. Pension bene-fits of EUR 440,000 are expected to be paid in 2009.
(56) Current tax liabilities
in ’000 EUR 31.12.2008 31.12.2007 Change
in ’000 EUR in %
Tax provisions 3,507 27,686 -24,179 -87.3
Income tax liabilities 116 519 -403 -77.6
Other tax liabilities 7,663 7,128 535 7.5
Value added tax liabilities 624 716 -92 -12.8
Current income tax liabilities 11,910 36,049 -24,139 -67.0
(57) Deferred tax liabilities
in ’000 EUR 31.12.2008 31.12.2007 Change
in ’000 EUR in %
from loans and advances to customers 90 76 14 18.4
from loan loss provisions 0 500 -500 -100.0
from trading assets and derivatives 55,806 34,299 21,507 62.7
from financial assets – at fair value 16,516 3,853 12,663 > 100.0
from financial assets – available for sale 3,128 3,158 -30 -0.9
from investment property 0 2 -2 -100.0
from intangible assets 53 156 -103 -66.0
from property, plant and equipment 2,270 2,070 200 9.7
from assets available for sale 65 9 56 > 100.0
from other assets 69 69 0 0.0
Deferred tax liabilities from lower valuationof assets on tax balance sheet 77,997 44,192 33,805 76.5
Changes in tax provisions
in ’000 EUR 2008 2007
Book value 01/01 27,686 7,208
Currency translation 215 -33
Additions 1,029 21,504
Utilised -19,931 -976
Disposals -5,492 -17
Book value 31 December 3,507 27,686
Other tax liabilities mature in less than one year.
in ’000 EUR 31.12.2008 31.12.2007 Change
in ’000 EUR in %
from liabilities evidenced by certificates 752 516 236 45.7
from trading liabilitiess and derivatives 0 26,105 -26,105 -100.0
from financial liabilities – at fair value 0 25,128 -25,128 -100.0
from provisions 0 169 -169 -100.0
from other liabilities 657 556 101 18.2
from subordinated and supplementary capital 1,167 0 1,167 100.0
from equity 241 122 119 97.5
Deferred tax liabilities from higher valuationof liabilities on the tax balance sheet 2,817 52,596 -49,779 -94.6
Deferred tax liabilities 80,814 96,788 -15,974 -16.5
Deferred tax liabilities in the amount of EUR 5,692,000 mature in more than one year (2007: EUR 5,675,000). Deferred taxes arising from the measurement of financial instruments classified as available-for-sale were recognised directly in shareholders’ equity, i.e. with no effect on income. These deferred taxes totalled EUR 6,707,000 in 2008 (tax asset) (2007: EUR 2,577,000 – tax asset).
Other tax liabilities include taxes which the Group has to retain for third parties and transfer to the tax authorities. These include capital yield tax on customer deposits and from the deposit business, EU withholding taxes and payroll taxes. These taxes are due and payable in January or February 2009, and were transferred accordingly to the tax authorities. The decline in tax provisions is due to the audit concluded in 2007 related to fiscal years 2003 though 2005.
Current income tax assets and liabilities are measured at the current applicable rates at which they are due from/to the relevant tax authorities.

Foreword
102 103
Foreword
FIN
AN
CIA
L S
TAT
EM
EN
TS
(IF
RS
)B
RA
NC
H O
FFIC
ES
/SU
BS
IDIA
RIE
S
103
Notes to the balance sheetNotes to the balance sheet
in ’000 EUR 31.12.2008 31.12.2007 Change
in ’000 EUR in %
Social security liabilities 986 885 101 11.4
Trade creditors 2,596 1,334 1,262 94.6
Amounts owed to associated companies 2,780 1,729 1,051 60.8
Cheque liabilities 31 0 31 100.0
Prepayments and accrued income 1,902 3,935 -2,033 -51.7
Provisions according to commercial law 3,864 3,766 98 2.6
Bills of exchange payable 0 8 -8 -100.0
Present value adjustment items 0 155 -155 -100.0
Other liabilities 33,866 30,152 3,714 12.3
Other liabilities 46,025 41,964 4,061 9.7
Subordinated and supplementary capital – breakdown by product
in ’000 EUR 31.12.2008 31.12.2007 Change
in ’000 EUR in %
Subordinated capital per § 23 (8) Austrian Banking Act 149,743 150,000 -257 -0.2
Supplementary capital per § 23 (7) Austrian Banking Act 62,490 75,412 -12,922 -17.1
Deferred interest 789 950 -161 -16.9
Subordinated and supplementary capital 213,022 226,362 -13,340 -5.9
Changes in subordinated and supplementary capital
in ’000 EUR 2008 2007 Change
in ’000 EUR in %
Balance 1 January 226,362 207,380 18,982 9.2
New capital raised 26,926 18,877 8,049 42.6
Capital repaid -40,105 -113 -39,992 > 100.0
Change in deferred interest -161 218 -379 > -100.0
Balance 31 December 213,022 226,362 -13,340 -5.9
Subordinated and supplementary capital – breakdown by maturity
in ’000 EUR 31.12.2008 31.12.2007 Change
in ’000 EUR in %
Repayable on demand 789 950 -161 -16.9
With a remaining maturity of
3 months to 1 year 10,923 38,944 -28,021 -72.0
>1 to 5 years 0 11,051 -11,051 -100.0
> 5 years 201,310 175,417 25,893 14.8
Subordinated and supplementary capital 213,022 226,362 -13,340 -5.9
(60) Capital and reserves
Capital and reserves – breakdown by designation
in ’000 EUR 31.12.2008 31.12.2007 Change
in ’000 EUR in %
Shares/share capital 150,000 22,000 128,000 > 100.0
Participation certificate capital 9,000 2,180 6,820 > 100.0
Subscribed capital 159,000 24,180 134,820 > 100.0
Capital reserves – appropriated 27,579 100,342 -72,763 -72.5
Capital reserves 27,579 100,342 -72,763 -72.5
Reserves – statutory 11,954 2,947 9,007 >100.0
Reserve under by-laws 5,569 5,569 0 0.0
Reserves – other 155,041 194,961 -39,920 -20.5
Liability reserve per § 23 (6) Austrian Banking Act 118,399 118,399 0 0.0
Valuation reserve 4,632 4,721 -89 -1.9
Difference capital consolidation -3,316 -3,379 63 -1.9
Profit brought forward 2,789 4,113 -1,324 -32.2
Reserves 295,068 327,331 -32,263 -9.9
Revaluation reserve -20,440 -7,746 -12,694 > 100.0
Reserves from currency translation 1,373 -947 2,320 > -100.0
Valuation reserve from first-time adoption 3,615 3,615 0 0.0
Consolidated net profit 10,800 9,330 1,470 15.8
Minority interests 1,520 1,454 66 4.5
Capital and reserves 478,515 457,559 20,956 4.6
The following capital transactions were conducted in fiscal year 2008:
At the annual meeting of shareholders on 18 June 2008 shareholders resolved to increase Vorarlberger Landes- und Hypothekenbank Aktiengesellschaft’s share capital from retained earnings (EUR 87,542,000 from appropriated reserves and EUR 40,458,000 from other reserves) to EUR 150,000,000.
At the annual meeting of shareholders, it was also resolved to retire outstanding participation capital with a nominal amount of EUR 2,180,000 as of 31 December 2007. The outstanding participation certificate was redeemed at a price of EUR 99.00. The equity instrument (ISIN AT0000698402) was redeemed on 25 November 2008.
A new participation certificate was simultaneously issued in an offering underwritten by Vorarlberger Landesbank-Holding and Landeskreditbank Baden-Württemberg. The new participation certificate does not feature a redemption obligation and investor termination options. Distributions are only made from distributable profit after transfer to reserves on the basis of voting at the annual meeting of shareholders on Managing Board proposals approved by the Supervisory Board. Neither the parent company nor its subsidiaries held any of the new participation capital in treasury at 31 December 2008.
Subscribed capital consists of share capital of EUR 150,000,000 (2007: EUR 22,000,000) and participation certificate capital of EUR 9,000,000 (2007: EUR 2,180,000), both of which are fully paid-in. At 31 December 2008, a total of 1,000,000 (2007: 300,000) participation certificates with a par value of EUR 9.00 (ATS 100.00) and 293,000 (2007: 293,000) shares with a par value of EUR 511,9454 were outstanding.
(58) Other liabilitiesOther liabilities include mainly liabilities unrelated to the banking business (primarily trade creditors), accruals and deferred income, and other provisions as defined by Austrian company law.
(59) Subordinated and supplementary capital (LAC)
In addition to subordinated and supplementary capital recognised in this account, subordinated liabilities voluntarily designated at fair value through profit or loss are reported under ‘Financial liabilities – at fair value’ (see Note 53).
Loss on subordinated and supplementary capital
in ’000 EUR (Notes) 2008 2007 Change
in ’000 EUR in %
Interest expenses on subordinated and supplementary capital (25) -9,809 -8,822 -987 11.2
Total profit/loss from subordinated and supplementary capital -9,809 -8,822 -987 11.2

Foreword
104 105
Foreword
FIN
AN
CIA
L S
TAT
EM
EN
TS
(IF
RS
)B
RA
NC
H O
FFIC
ES
/SU
BS
IDIA
RIE
S
105
Additional IFRS disclosuresNotes to the balance sheet
in ’000 EUR Loans andReceiv-
ables
Assets atFair value
Availablefor Sale
Held toMaturity
Liabilitiesat Cost
Liabilities atFair value
Total
2008
Interest and similar income 411,544 55,566 54,375 47,176 0 0 568,661
Interest and similar expenses -4 0 0 0 -266,870 -188,757 -455,631
Net interest income 411,540 55,566 54,375 47,176 -266,870 -188,757 113,030
Allocation of loan loss provisions -35,916 0 -11,033 -1,287 0 0 -48,236
Reversal of loan loss provisions 19,755 0 0 0 0 0 19,755
Trading result 0 12,532 0 0 0 0 12,532
Valuation result, fair value 0 -24,468 0 0 0 9,801 -14,667
Write-ups 0 0 110 0 2,295 0 2,405
Write-downs 0 0 -1,996 -418 -1,060 0 -3,474
Realised profits 7,478 0 1,335 0 0 0 8,813
Realised losses -1,281 0 -52 0 0 0 -1,333
Net result 401,576 43,630 42,739 45,471 -265,635 -178,956 88,825
Profit/loss recognised in shareholders' equity 0 0 -12,670 0 0 0 -12,670
Interest from impaired assets 8,146 0 0 0 0 0 8,146
(61) Special financial instruments disclosures
in ’000 EUR Loans andReceiv-
ables
Assets atFair value
Availablefor Sale
Held toMaturity
Liabilitiesat Cost
Liabilities atFair value
Total
2007
Interest and similar income 330,086 46,819 60,076 45,318 0 0 482,299
Interest and similar expenses -127 0 0 0 -173,296 -198,454 -371,877
Net interest income 329,959 46,819 60,076 45,318 -173,296 -198,454 110,422
Allocation of loan loss provisions -42,869 0 0 0 0 0 -42,869
Reversal of loan loss provisions 16,597 0 0 0 0 0 16,597
Trading result 0 7,621 0 0 0 0 7,621
Valuation result, fair value 0 -15,539 0 0 0 8,547 -6,992
Write-ups 0 0 3,772 0 5,161 0 8,933
Write-downs 0 0 -2,727 0 -1,320 0 -4,047
Realised profits 1,874 0 686 0 0 0 2,560
Realised losses -10,291 0 -19 -341 0 0 -10,651
Net result 295,270 38,901 61,788 44,977 -169,455 -189,907 81,574
Profit/loss recognised in shareholders' equity 0 0 -7,435 0 0 0 -7,435
Interest from impaired assets 8,092 0 0 0 0 0 8,092
Movements in available-for-sale and currency translation reserves and effects from first-time adoption were recognised directly in changes in shareholders’ equity, i.e. with no effect on income. The corresponding amount in 2008 was EUR -10,374,000 (2007: EUR -7,807,000). Deferred taxes in connection with the measurement of the available-for-sale portfolio were directly deducted in shareholders’ equity. Due to the disposal of available-for-sale portfolios, provisions in the amount of EUR -76,000 (2007: EUR -14,000) were reversed and recognised as income on the income statement. Impairments on these assets are recorded under ‘Net results from financial instruments’ in income. An amount of EUR -11,033,000 (2007: EUR 0) was recorded on the 2008 income statement.
Of consolidated net income after taxes of EUR 40,765,000 (2007: EUR 39,205,000), an amount of EUR 40,381,000 (2007: EUR 38,716,000) is attributable to the shareholders of Vorarlberger Landes- und Hypothekenbank Aktiengesellschaft, and EUR 384,000 (2007: EUR 489,000) to the minority shareholders of the subsidiaries.
The difference from equity consolidation was EUR 3,740,000 (2007: EUR 7,313,000). This difference was allocated to the investment value and reserves respectively. Gains and losses from consolidated companies were recorded in income under ‘Result from equity consolidation’, totalling a net EUR -2,365,000 in 2008 (2007: EUR 791,000 – see Note 41).
Reserves consist of statutory reserves, other reserves, liability reserves pursuant to Section 23 (6) of the Austrian Banking Act, and profit or loss carried forward. The release of the statutory reserve in the amount of EUR 11,954,000 (2007: EUR 2,947,000) is governed under the Austrian Stock Corporation Act. The release of the liability reserve per Section 23 (6) of the Austrian Banking Act in the amount of EUR 118,399,000 (2007: EUR 118,399,000) is governed accordingly by Section 23 (6) of the Austrian Banking Act.
Dividends of Vorarlberger Landes- und Hypothekenbank Aktiengesellschaft
The maximum dividend Vorarlberger Landes- und Hypothekenbank Aktiengesellschaft may distribute is EUR 10,800,000, the amount of net profit recorded on the (single-entity) financial statements pursuant to the Austrian Banking Act or the Austrian Business Corporations Code (2007: EUR 9,330,000).
For 2008, Vorarlberger Landes- und Hypothekenbank Aktiengesellschaft posted a net profit of EUR 43,678,000 (2007: EUR 37,697,000). After EUR 32,878,000 (2007: EUR 28,367,000) being allocated to reserves and profit of EUR 0 brought forward from the previous year (2007: EUR 0), this results in a distributable net profit of EUR 10,800,000 (2007: EUR 9,330,000). It is proposed that a dividend of EUR 30.00 (2007: EUR 30.00) per share be paid on share capital of EUR 150,000,000 (2007: EUR 22,000,000), subject to approval at the annual meeting of shareholders. As the number of shares is 293,000 (2007: 293,000), the total amount of the proposed dividend is EUR 8,790,000 (2007: EUR 8,790,000). The participation certificate pays distributions at specified interest rates from previous-year profits. Because interest rates are fixed retroactively, the amount of dividends payable by the participation certificates cannot be disclosed.
Profit/loss on assets at fair value contains total profit/loss on assets designated at fair value through profit or loss as well as total profit/loss on trading assets (see Notes 37 and 38).
Profit/loss on liabilities at fair value contains total profit/loss on liabilities designated at fair value through profit or loss as well as total profit/or loss of trading liabilities (see Notes 52 and 53).
Additional IFRS disclosures

Foreword
106 107
Foreword
FIN
AN
CIA
L S
TAT
EM
EN
TS
(IF
RS
)B
RA
NC
H O
FFIC
ES
/SU
BS
IDIA
RIE
S
107
Additional IFRS disclosuresAdditional IFRS disclosures
(63) Reclassification of financial instruments
At 1 July 2008 the following reclassifications of financial instruments was recorded.
Fixed-interest securities, 65 in all, for which no active market exists and which the Bank intends and is able to hold to maturity were reclassified from financial assets – available for sale over to loans & receivables under the items ‘loans and advances to, and placements with, banks’ and ‘loans and advances to customers’. These are primarily ABS securities. Management implemented reclassification on 30 October 2008 retroactive to 1 July 2008. The market value measured at this date applies as the new amortised cost basis. Differences between the new amortised cost basis determined and the expected repayment amount are reversed to income on pro rata basis using the effective interest method in ‘Net results from financial instruments’. The revaluation reserves (AFS reserves) available for reclassified securities remain in reserves, and are also reversed to income on a pro rata basis using the effective interest method in ‘Net results from financial instruments’. The applicable interest rate determined at the reclassification date using the new cost basis was 3.36% with a nominal weighting of reclassified securities; the estimated cash flows projected by the Group at the reclassification date total EUR 471,909,000. At 31 December 2008 there were no impairments on the reclassified securities; no sales were transacted during the period under review.
The carrying value and market value of reclassified financial instruments at 31 December 2008 is shown below.
The table below shows gains and losses on reclassified securities resulting from remeasurement at fair value at the reclassification date.
The table below shows the gains and losses from remeasurement of the assets at fair value that would have resulted without reclassification.
The table below shows gains/losses and income/expenses from reclassified financial instruments.
(62) Write-downs and reversal of write-downs
Write-downs
in ’000 EUR 2008 2007 Change
in ’000 EUR in %
Loans and advances to customers -31,965 -35,675 3,710 -10.4
Financial assets – available for sale -11,033 0 -11,033 100.0
Financial assets – held to maturity -1,287 0 -1,287 100.0
Shares in undertakings valued at equity -469 -400 -69 17.3
Investment property 0 -237 237 -100.0
Intangible assets 0 -80 80 -100.0
Property, plant and equipment 0 -1,709 1,709 -100.0
Assets available for sale -1,538 -200 -1,338 > 100.0
Total -46,292 -38,301 -7,991 20.9
Reversal of write-downs
in ’000 EUR 2008 2007 Change
in ’000 EUR in %
Loans and advances to customers 16,571 12,078 4,493 37.2
Total 16,571 12,078 4,493 37.2
in ’000 EUR Book value Market value Amortisedcost
Re-valuation
reserve
Loans and advances to, and placements with, banks 144,352 144,352 144,352 -734
Loans and advances to customers 224,280 224,280 224,280 -4,833
Financial assets – available for sale -368,632 -368,632 -376,055 5,567
Total 0 0 -7,423 0
*) pre-adjusted for deferred tax effects
in ’000 EUR Book value Market value Amortisedcost
Re-valuation
reserve
Loans and advances to, and placements with, banks 92,477 92,266 92,477 -616
Loans and advances to customers 219,451 218,729 219,451 -4,028
Total 311,928 310,995 311,928 -4,644
*) pre-adjusted for deferred tax effects
in ’000 EUR 2008 2007 Change
in ’000 EUR in %
Loans and advances to, and placements with, banks -312 -470 158 -33.6
Loans and advances to customers -2,448 -2,379 -69 2.9
Profit/loss from measurement at fair value *) -2,760 -2,849 89 -3.1
*) recorded in AFS reserves, not through profit or loss, pre-adjusted for deferred tax effects
in ’000 EUR 2008 2007 Change
in ’000 EUR in %
Net interest 27 11 16 > 100.0
Net results from financial instruments -3 -2 -1 50.0
Taxes on income -6 -2 -4 > 100.0
Recorded in AFS reserves, not through profit or loss *) -2,536 -2,848 312 -11.0
Profit/loss – before reclassification -2,518 -2,841 323 -11.0
*) pre-adjusted for deferred tax effects
in ’000 EUR 2008 2007 Change
in ’000 EUR in %
Net interest 27 11 16 > 100.0
Net results from financial instruments -3 -2 -1 50.0
Taxes on income -6 -2 -4 > 100.0
Recorded in AFS reserves, not through profit or loss *) 924 -2,848 3,772 > -100.0
Profit/loss – after reclassification 942 -2,841 3,783 > -100.0
*) pre-adjusted for deferred tax effects

Foreword
108 109
Foreword
FIN
AN
CIA
L S
TAT
EM
EN
TS
(IF
RS
)B
RA
NC
H O
FFIC
ES
/SU
BS
IDIA
RIE
S
109
Additional IFRS disclosuresAdditional IFRS disclosures
(64) Related party disclosures
The following persons and parties are considered related parties:- The owners, as outlined below,- Vorarlberger Landesbank Holding and Austria Beteiligungsgesellschaft mbH,- the members of the Managing and Supervisory Boards of Vorarlberger Landes- und Hypothekenbank Aktiengesellschaft and their clo-
sest relatives,- Managing Directors of consolidated subsidiaries and their closest relatives,- executives of Vorarlberger Landes- und Hypothekenbank Aktiengesellschaft as defined in Section 80 of the Austrian Stock
Corporation Act and their closest relatives,- directors, officers and members of supervisory bodies of major shareholders,- subsidiaries and other companies in which Vorarlberger Landes- und Hypothekenbank Aktiengesellschaft holds an interest.
Advance payments, loans and liabilitiesAt year end, the Bank had granted EUR 2,759,000 (2007: EUR 3,073,000) of advances and loans to and obligations for members of the Managing Board and for managing directors; these loans and advances were granted at customary terms and conditions applicable to Bank staff.
At year end, the Bank had granted EUR 1,306,000 (2007: EUR 3,016,000) of advances and loans to and obligations for members of the Supervisory Board and for enterprises for which these members are personally liable; these loans and advances were granted at the customary terms and conditions applicable to Bank staff.
CompensationAnnual compensation paid to members of the Managing Board consists of a fixed salary plus variable bonus. Some managing directors and executives also received variable compensation determined by the Managing Board on an individual basis. Share-based compensation schemes are not in place.
Vorarlberger Landes- und Hypothekenbank Aktiengesellschaft expended the following compensation amounts in 2008 for three active board members.
Except for the severance pay entitlements discussed under note (55), no other post-termination benefits are payable.
The owners of Vorarlberger Landes- und Hypothekenbank Aktiengesellschaft as at 31 December 2008 were as shown below.
Vorarlberger Landes- und Hypothekenbank Aktiengesellschaft was commissioned by the province of Vorarlberg as a domestic real estate bank to manage the province’s residential housing construction fund. The Bank is paying the province of Vorarlberg a liability commission in the amount of EUR 1,453,000 (2007: EUR 1,453,000). The Group does not maintain permanent business relations with Austria Beteiligungsgesellschaft mbH. Numerous transactions customary in the banking business were conducted with Landesbank Baden-Württemberg.
Vorarlberger Landes- und Hypothekenbank Aktiengesellschaft maintains business relations with affiliated and associated companies in the form of transactions conducted in the course of refinancing and other customary banking business.
(65) Share-based compensation schemes
Longstanding employees of Vorarlberger Landes- und Hypothekenbank Aktiengesellschaft had been granted between 2 and 7 of the now retired participation certificates depending on their length of service. Because the participation certificates were redeemed in 2008, no share-based compensation was paid. No other rights to participation certificates or share options were outstanding in the period under review.
Owners / shareholders Total shareholdings Voting rights
Vorarlberger Landesbank-Holding 74.9997% 74.9997%
Austria Beteiligungsgesellschaft mbH 25.0003% 25.0003%
- Landesbank Baden-Württemberg 16.6669%
- Landeskreditbank Baden-Württemberg Förderbank 8.3334%
Share capital 100.0000% 100.0000%
The table below provides a breakdown of compensation paid to related parties.
in ’000 EUR 2008 2007 Change
in ’000 EUR in %
Managing Board and managing directors 2,292 1,988 304 15.3
Retired Managing Board members and survivors 188 185 3 1.6
Executives 3,541 3,205 336 10.5
Supervisory Board members 202 214 -12 -5.6
Severance pay and pensions
The table below provides a breakdown of expenditure for severance pay and pensions to related parties
in ’000 EUR 2008 2007 Change
in ’000 EUR in %
Managing Board and managing directors 152 104 48 46.2
Pensioners 352 252 100 39.7
Executives 209 502 -293 -58.4
Other active employees 1,401 1,875 -474 -25.3
in ’000 EUR 2008 2007 2008 2007 2008 2007
Base salary Variable compensation Total
Dr. Jodok Simma 264 257 73 42 337 299
Dr. Johannes Hefel 185 180 41 25 226 205
Dr. Michael Grahammer 185 174 41 25 226 199
Managing Board compensation 634 611 155 92 789 703
Business relationships with affiliated companies and investments
in ’000 EURAffiliated companies Investments
Shareholders with
significant influence
31.12.2008 31.12.2007 31.12.2008 31.12.2007 31.12.2008 31.12.2007
Loans and advances to, and placements with, banks 0 0 10,038 14,251 15,307 20,712
Loans and advances to customers 32,596 37,076 399,577 230,764 31,103 22,169
Financial assets 0 0 0 0 19,930 10,000
Loans and advances 32,596 37,076 409,615 245,015 66,340 52,881
Amounts owed to banks 0 0 82 92 25,315 32,015
Amounts owed to customers 1,697 4,387 28,258 14,464 52,054 31,787
Liabilities evidenced by certificates 0 0 0 15,000 0 0
Amounts due 1,697 4,387 28,340 29,556 77,369 63,802

Foreword
110 111
Foreword
FIN
AN
CIA
L S
TAT
EM
EN
TS
(IF
RS
)B
RA
NC
H O
FFIC
ES
/SU
BS
IDIA
RIE
S
111
Additional IFRS disclosuresAdditional IFRS disclosures
(66) Segment reporting
Breakdown by segment
in ’000 EUR Public CorporateCustomers
PrivateCustomers
Leasing andReal estate
FinancialMarkets
CorporateCenter
Total
Net interest income 2008 4,046 49,643 38,730 11,397 4,790 4,424 113,030 2007 4,423 42,677 35,506 12,853 9,970 4,993 110,422
Loan loss provisions 2008 0 -7,511 -4,864 -400 -153 -3,358 -16,286 2007 -20 -15,300 -1,176 -5,077 10 -6,505 -28,068
Net fee and commission income 2008 433 11,346 16,373 458 4,148 9,111 41,869 2007 430 10,954 19,504 -190 4,847 11,179 46,724
Net trading result 2008 18 2,801 2,257 -92 -9,991 2,872 -2,135 2007 2 1,853 1,591 132 -5,026 2,077 629
Administrative expenses 2008 -562 -20,484 -39,198 -9,164 -5,699 -8,756 -83,863 2007 -447 -19,926 -37,785 -6,100 -5,670 -8,161 -78,089
Other operating profit 2008 2 99 176 4,137 -68 1,661 6,007 2007 2 -10 187 4,257 -215 5,225 9,446
Net results from financial instruments 2008 0 0 0 1,303 -7,078 -9 -5,784 2007 0 0 -459 10 3,389 -4,349 -1,409
Result from equity 2008 0 0 0 0 0 -2,834 -2,834 consolidation 2007 0 0 0 0 0 391 391
Results of ordinary 2008 3,937 35,894 13,474 7,639 -14,051 3,111 50,004 business activities 2007 4,390 20,248 17,368 5,885 7,305 4,850 60,046
Total assets 2008 661,370 3,724,772 1,503,831 1,672,660 5,324,183 271,883 13,158,699 2007 702,380 2,971,045 1,393,818 1,310,523 5,316,149 285,707 11,979,622
Total liabilities 2008 174,114 1,116,846 2,738,629 402,758 7,695,051 1,031,301 13,158,699 2007 171,507 916,836 2,280,855 242,321 7,370,693 997,410 11,979,622
Amounts due 2008 141,334 933,961 2,595,101 315,784 7,687,190 1,006,814 12,680,184 2007 134,129 755,315 2,147,267 168,242 7,333,672 983,438 11,522,063
Assessment basis Capital resources per 2008 4,000 3,085,408 823,384 1,307,486 1,429,410 428,513 7,078,201 Section 22 of the Austrian Banking Act 2007 36,393 2,428,861 960,716 939,725 1,652,859 337,493 6,356,047
Attributed equity 2008 253 195,371 52,137 82,791 90,542 27,135 448,229 2007 2,665 147,250 67,839 68,812 115,695 24,661 426,922
Cost/income ratio in % 2008 12.49% 32.06% 68.13% 57.64% -508.39% 48.46% 52.82%2007 9.20% 35.92% 66.54% 35.77% 59.21% 34.77% 46.70%
Return on equity in % 2008 1556.13% 18.37% 25.84% 9.23% -15.52% 11.46% 11.16%2007 164.73% 13.75% 25.60% 8.55% 6.31% 19.67% 14.06%
Breakdown by region
in ’000 EUR Austria Germany Switzerland &Liechtenstein
Italy CEE Other foreigncountries
Total
Net interest income 2008 49,603 16,396 23,520 12,406 691 10,414 113,030 2007 58,951 13,638 18,758 12,215 415 6,445 110,422
Loan loss provisions 2008 -8,992 -4,102 -1,720 -2,087 0 615 -16,286 2007 -10,005 -6,965 -1,032 -10,342 0 276 -28,068
Net fee and commission income 2008 25,013 5,681 8,695 -17 289 2,208 41,869 2007 26,514 7,397 9,908 -19 225 2,699 46,724
Net trading result 2008 5,717 -842 1,233 -42 79 -8,280 -2,135 2007 -847 154 1,619 134 110 -541 629
Administrative expenses 2008 -54,245 -8,222 -11,622 -7,053 -440 -2,281 -83,863 2007 -51,908 -7,850 -10,940 -4,869 -417 -2,105 -78,089
Other operating profit 2008 3,610 13 -24 2,405 0 3 6,007 2007 3,340 -403 131 6,375 -1 4 9,446
Net results from financial instruments 2008 6,604 -1,565 182 0 0 -11,005 -5,784 2007 -1,421 0 12 0 0 0 -1,409
Result from equity 2008 -2,834 0 0 0 0 0 -2,834 consolidation 2007 391 0 0 0 0 0 391
Results of ordinary 2008 24,476 7,359 20,264 5,612 619 -8,326 50,004 business activities 2007 25,015 5,971 18,456 3,494 332 6,778 60,046
The segments of the Vorarlberger Landes- und Hypothekenbank Aktiengesellschaft group are presented in the following.
Public sector: This segment includes income and expenses from business relationships with the Republic of Austria, the Austrian provinces and municipalities and their public-law entities in Austria and abroad. It also includes social security carriers, international organisations and federal businesses, provided they belong to the public sector in accordance with the European Systems of Accounts directive.
Corporate customers:The Corporate customers segment includes customers in manufacturing, industry and trade. This segment includes both large corporations and SMEs. The segment does not include self-employed individuals operating sole proprietorships.
Private customers:This segment includes all employed individuals (private households) and some self-employed individuals (freelancers). The segment’s revenues include income from insurance partners. Not included in the segment are private individuals closely affiliated with a legal entity (corporate customer) as owner or shareholder.
Leasing and real estate:This segment represents subsidiaries engaged in leasing and real estate business.
This category includes financial assets and the trading portfolio, derivative financial instruments, securities underwriting, results from interbank transactions and results from custodian business.
Corporate centre:This business segment includes overhead and investments (except for subsidiaries operating in leasing and real estate) as well as other income and expenses not attributable to other segments.
Transactions and transfer pricing between segments are eliminated in the course of consolidation. Proceeds or costs from transfer services between segments are thus not recognised in segment reporting.
The Group determines the cost-income ratio on the basis of net interest income, net fee and commission income, net trading results, and other operating profit or loss. This income is compared against administrative expenses as a financial metric.
The Group determines the return on equity on the basis of shareholders’ equity at the beginning of the fiscal year without distributable net profit. Shareholders’ equity is compared against operating profit as a financial metric.
Write-downs and reversal of provisions
in ’000 EUR Public CorporateCustomers
PrivateCustomers
Leasing andReal estate
FinancialMarkets
CorporateCenter
Total
Recording of loan loss provisions 2008 0 -21,801 -8,692 -2,890 -12,320 -589 -46,292 2007 -20 -27,373 -5,444 -3,603 0 -1,861 -38,301
Reversal of loan loss provisions 2008 0 11,891 3,571 1,109 0 0 16,571 2007 0 8,330 2,525 433 0 790 12,078
(67) Contingent liabilities and credit risks
Contingent liabilities
in ’000 EUR 31.12.2008 31.12.2007 Change
in ’000 EUR in %
Liabilities from guarantees 522,437 473,860 48,577 10.3
Other contingent liabilities 25,716 22,518 3,198 14.2
Contingent liabilities 548,153 496,378 51,775 10.4
Liabilities from guarantees represent commitments to our customers to accept liabilities for the benefit of third parties. The guarantee holder may assert claims against the Bank in the event the obligor defaults on contractual obligations. The Bank may in turn assert recourse claims against its customer. Contingent liabilities in connection with guarantees are difficult to measure, as obligations thereunder are unpredictable and difficult to estimate. ‘Other contingent liabilities’ consist of certain trust and documentary letter of credit transactions.
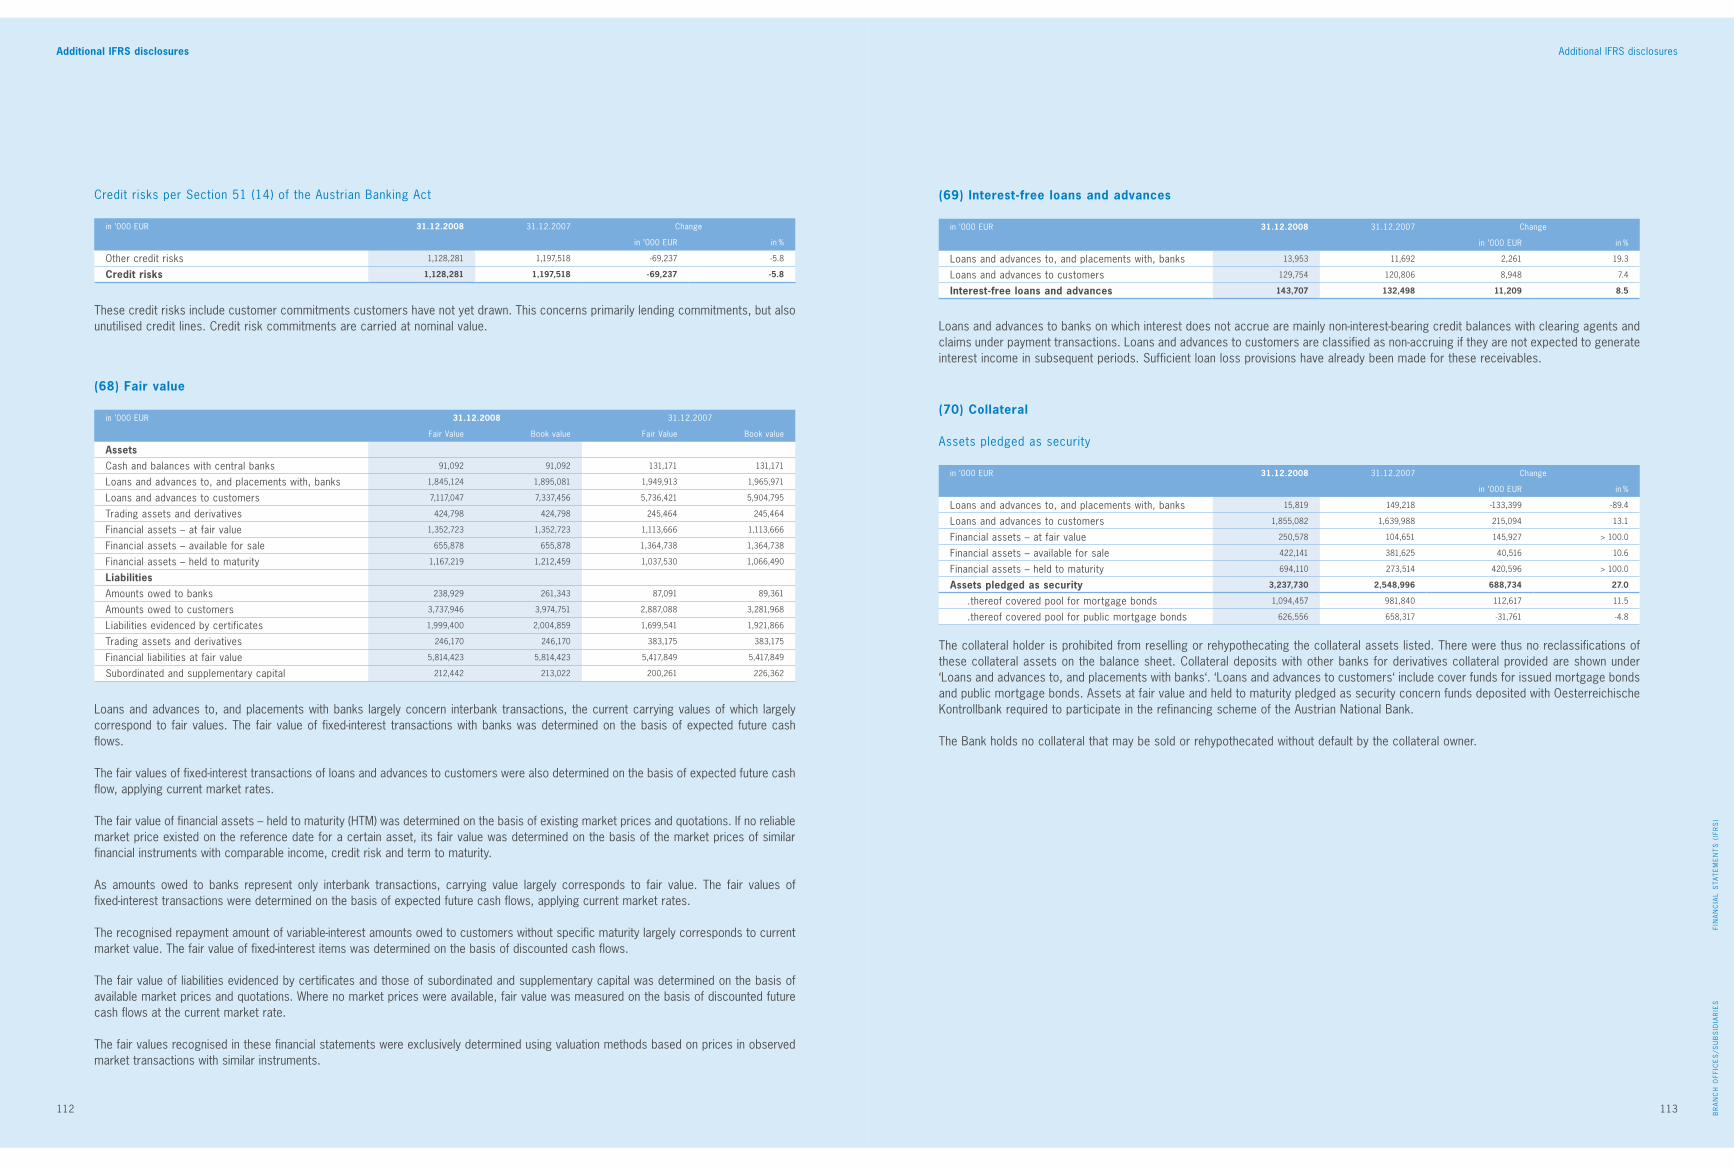
Foreword
112 113
Foreword
FIN
AN
CIA
L S
TAT
EM
EN
TS
(IF
RS
)B
RA
NC
H O
FFIC
ES
/SU
BS
IDIA
RIE
S
113
Additional IFRS disclosuresAdditional IFRS disclosures
(68) Fair value
in ’000 EUR 31.12.2008 31.12.2007
Fair Value Book value Fair Value Book value
AssetsCash and balances with central banks 91,092 91,092 131,171 131,171
Loans and advances to, and placements with, banks 1,845,124 1,895,081 1,949,913 1,965,971
Loans and advances to customers 7,117,047 7,337,456 5,736,421 5,904,795
Trading assets and derivatives 424,798 424,798 245,464 245,464
Financial assets – at fair value 1,352,723 1,352,723 1,113,666 1,113,666
Financial assets – available for sale 655,878 655,878 1,364,738 1,364,738
Financial assets – held to maturity 1,167,219 1,212,459 1,037,530 1,066,490
LiabilitiesAmounts owed to banks 238,929 261,343 87,091 89,361
Amounts owed to customers 3,737,946 3,974,751 2,887,088 3,281,968
Liabilities evidenced by certificates 1,999,400 2,004,859 1,699,541 1,921,866
Trading assets and derivatives 246,170 246,170 383,175 383,175
Financial liabilities at fair value 5,814,423 5,814,423 5,417,849 5,417,849
Subordinated and supplementary capital 212,442 213,022 200,261 226,362
Credit risks per Section 51 (14) of the Austrian Banking Act
in ’000 EUR 31.12.2008 31.12.2007 Change
in ’000 EUR in %
Other credit risks 1,128,281 1,197,518 -69,237 -5.8
Credit risks 1,128,281 1,197,518 -69,237 -5.8
Loans and advances to, and placements with banks largely concern interbank transactions, the current carrying values of which largely correspond to fair values. The fair value of fixed-interest transactions with banks was determined on the basis of expected future cash flows.
The fair values of fixed-interest transactions of loans and advances to customers were also determined on the basis of expected future cash flow, applying current market rates.
The fair value of financial assets – held to maturity (HTM) was determined on the basis of existing market prices and quotations. If no reliable market price existed on the reference date for a certain asset, its fair value was determined on the basis of the market prices of similar financial instruments with comparable income, credit risk and term to maturity.
As amounts owed to banks represent only interbank transactions, carrying value largely corresponds to fair value. The fair values of fixed-interest transactions were determined on the basis of expected future cash flows, applying current market rates.
The recognised repayment amount of variable-interest amounts owed to customers without specific maturity largely corresponds to current market value. The fair value of fixed-interest items was determined on the basis of discounted cash flows.
The fair value of liabilities evidenced by certificates and those of subordinated and supplementary capital was determined on the basis of available market prices and quotations. Where no market prices were available, fair value was measured on the basis of discounted future cash flows at the current market rate.
The fair values recognised in these financial statements were exclusively determined using valuation methods based on prices in observed market transactions with similar instruments.
These credit risks include customer commitments customers have not yet drawn. This concerns primarily lending commitments, but also unutilised credit lines. Credit risk commitments are carried at nominal value.
(69) Interest-free loans and advances
in ’000 EUR 31.12.2008 31.12.2007 Change
in ’000 EUR in %
Loans and advances to, and placements with, banks 13,953 11,692 2,261 19.3
Loans and advances to customers 129,754 120,806 8,948 7.4
Interest-free loans and advances 143,707 132,498 11,209 8.5
Loans and advances to banks on which interest does not accrue are mainly non-interest-bearing credit balances with clearing agents and claims under payment transactions. Loans and advances to customers are classified as non-accruing if they are not expected to generate interest income in subsequent periods. Sufficient loan loss provisions have already been made for these receivables.
The collateral holder is prohibited from reselling or rehypothecating the collateral assets listed. There were thus no reclassifications of these collateral assets on the balance sheet. Collateral deposits with other banks for derivatives collateral provided are shown under ‘Loans and advances to, and placements with banks‘. ‘Loans and advances to customers‘ include cover funds for issued mortgage bonds and public mortgage bonds. Assets at fair value and held to maturity pledged as security concern funds deposited with Oesterreichische Kontrollbank required to participate in the refinancing scheme of the Austrian National Bank.
The Bank holds no collateral that may be sold or rehypothecated without default by the collateral owner.
(70) Collateral
Assets pledged as security
in ’000 EUR 31.12.2008 31.12.2007 Change
in ’000 EUR in %
Loans and advances to, and placements with, banks 15,819 149,218 -133,399 -89.4
Loans and advances to customers 1,855,082 1,639,988 215,094 13.1
Financial assets – at fair value 250,578 104,651 145,927 > 100.0
Financial assets – available for sale 422,141 381,625 40,516 10.6
Financial assets – held to maturity 694,110 273,514 420,596 > 100.0
Assets pledged as security 3,237,730 2,548,996 688,734 27.0
.thereof covered pool for mortgage bonds 1,094,457 981,840 112,617 11.5
.thereof covered pool for public mortgage bonds 626,556 658,317 -31,761 -4.8
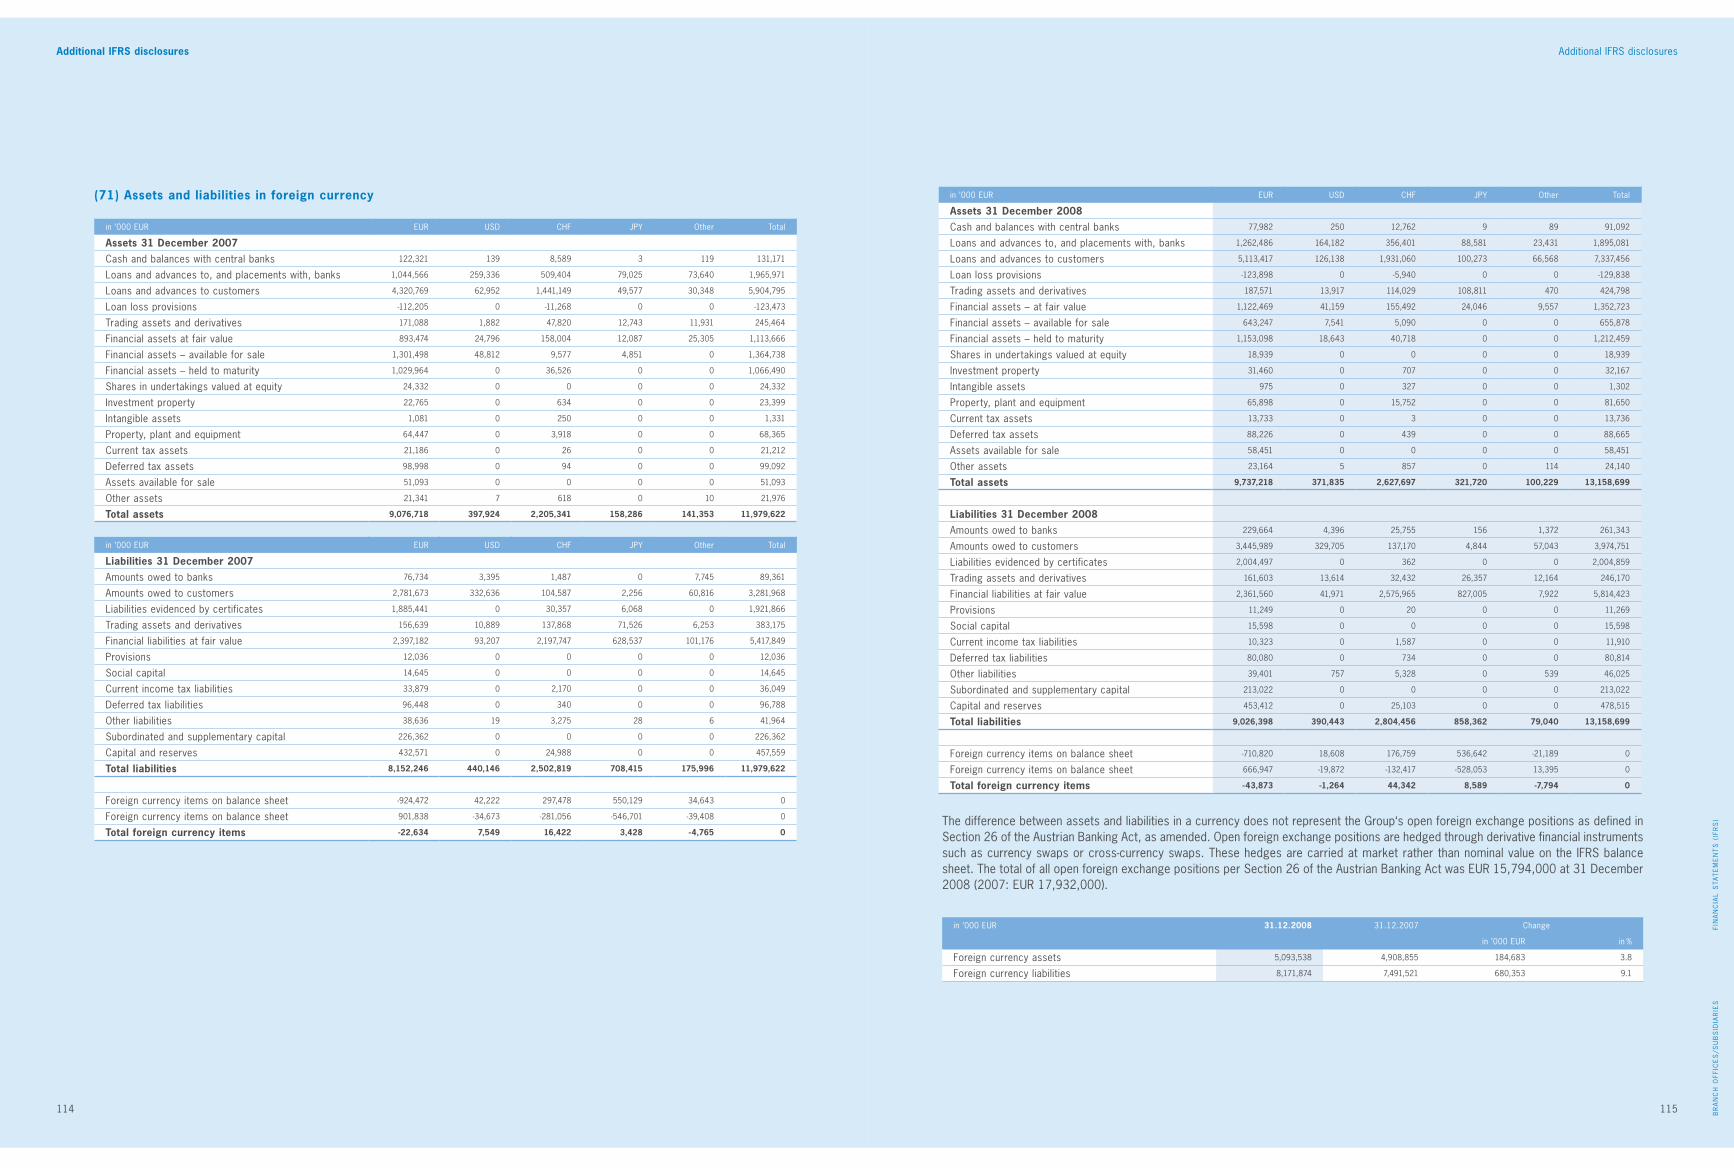
Foreword
114 115
Foreword
FIN
AN
CIA
L S
TAT
EM
EN
TS
(IF
RS
)B
RA
NC
H O
FFIC
ES
/SU
BS
IDIA
RIE
S
115
Additional IFRS disclosuresAdditional IFRS disclosures
(71) Assets and liabilities in foreign currency
in ’000 EUR EUR USD CHF JPy Other Total
Assets 31 December 2007Cash and balances with central banks 122,321 139 8,589 3 119 131,171
Loans and advances to, and placements with, banks 1,044,566 259,336 509,404 79,025 73,640 1,965,971
Loans and advances to customers 4,320,769 62,952 1,441,149 49,577 30,348 5,904,795
Loan loss provisions -112,205 0 -11,268 0 0 -123,473
Trading assets and derivatives 171,088 1,882 47,820 12,743 11,931 245,464
Financial assets at fair value 893,474 24,796 158,004 12,087 25,305 1,113,666
Financial assets – available for sale 1,301,498 48,812 9,577 4,851 0 1,364,738
Financial assets – held to maturity 1,029,964 0 36,526 0 0 1,066,490
Shares in undertakings valued at equity 24,332 0 0 0 0 24,332
Investment property 22,765 0 634 0 0 23,399
Intangible assets 1,081 0 250 0 0 1,331
Property, plant and equipment 64,447 0 3,918 0 0 68,365
Current tax assets 21,186 0 26 0 0 21,212
Deferred tax assets 98,998 0 94 0 0 99,092
Assets available for sale 51,093 0 0 0 0 51,093
Other assets 21,341 7 618 0 10 21,976
Total assets 9,076,718 397,924 2,205,341 158,286 141,353 11,979,622
in ’000 EUR EUR USD CHF JPy Other Total
Liabilities 31 December 2007Amounts owed to banks 76,734 3,395 1,487 0 7,745 89,361
Amounts owed to customers 2,781,673 332,636 104,587 2,256 60,816 3,281,968
Liabilities evidenced by certificates 1,885,441 0 30,357 6,068 0 1,921,866
Trading assets and derivatives 156,639 10,889 137,868 71,526 6,253 383,175
Financial liabilities at fair value 2,397,182 93,207 2,197,747 628,537 101,176 5,417,849
Provisions 12,036 0 0 0 0 12,036
Social capital 14,645 0 0 0 0 14,645
Current income tax liabilities 33,879 0 2,170 0 0 36,049
Deferred tax liabilities 96,448 0 340 0 0 96,788
Other liabilities 38,636 19 3,275 28 6 41,964
Subordinated and supplementary capital 226,362 0 0 0 0 226,362
Capital and reserves 432,571 0 24,988 0 0 457,559
Total liabilities 8,152,246 440,146 2,502,819 708,415 175,996 11,979,622
Foreign currency items on balance sheet -924,472 42,222 297,478 550,129 34,643 0
Foreign currency items on balance sheet 901,838 -34,673 -281,056 -546,701 -39,408 0
Total foreign currency items -22,634 7,549 16,422 3,428 -4,765 0
in ’000 EUR EUR USD CHF JPy Other Total
Assets 31 December 2008Cash and balances with central banks 77,982 250 12,762 9 89 91,092
Loans and advances to, and placements with, banks 1,262,486 164,182 356,401 88,581 23,431 1,895,081
Loans and advances to customers 5,113,417 126,138 1,931,060 100,273 66,568 7,337,456
Loan loss provisions -123,898 0 -5,940 0 0 -129,838
Trading assets and derivatives 187,571 13,917 114,029 108,811 470 424,798
Financial assets – at fair value 1,122,469 41,159 155,492 24,046 9,557 1,352,723
Financial assets – available for sale 643,247 7,541 5,090 0 0 655,878
Financial assets – held to maturity 1,153,098 18,643 40,718 0 0 1,212,459
Shares in undertakings valued at equity 18,939 0 0 0 0 18,939
Investment property 31,460 0 707 0 0 32,167
Intangible assets 975 0 327 0 0 1,302
Property, plant and equipment 65,898 0 15,752 0 0 81,650
Current tax assets 13,733 0 3 0 0 13,736
Deferred tax assets 88,226 0 439 0 0 88,665
Assets available for sale 58,451 0 0 0 0 58,451
Other assets 23,164 5 857 0 114 24,140
Total assets 9,737,218 371,835 2,627,697 321,720 100,229 13,158,699
Liabilities 31 December 2008Amounts owed to banks 229,664 4,396 25,755 156 1,372 261,343
Amounts owed to customers 3,445,989 329,705 137,170 4,844 57,043 3,974,751
Liabilities evidenced by certificates 2,004,497 0 362 0 0 2,004,859
Trading assets and derivatives 161,603 13,614 32,432 26,357 12,164 246,170
Financial liabilities at fair value 2,361,560 41,971 2,575,965 827,005 7,922 5,814,423
Provisions 11,249 0 20 0 0 11,269
Social capital 15,598 0 0 0 0 15,598
Current income tax liabilities 10,323 0 1,587 0 0 11,910
Deferred tax liabilities 80,080 0 734 0 0 80,814
Other liabilities 39,401 757 5,328 0 539 46,025
Subordinated and supplementary capital 213,022 0 0 0 0 213,022
Capital and reserves 453,412 0 25,103 0 0 478,515
Total liabilities 9,026,398 390,443 2,804,456 858,362 79,040 13,158,699
Foreign currency items on balance sheet -710,820 18,608 176,759 536,642 -21,189 0
Foreign currency items on balance sheet 666,947 -19,872 -132,417 -528,053 13,395 0
Total foreign currency items -43,873 -1,264 44,342 8,589 -7,794 0
in ’000 EUR 31.12.2008 31.12.2007 Change
in ’000 EUR in %
Foreign currency assets 5,093,538 4,908,855 184,683 3.8
Foreign currency liabilities 8,171,874 7,491,521 680,353 9.1
The difference between assets and liabilities in a currency does not represent the Group‘s open foreign exchange positions as defined in Section 26 of the Austrian Banking Act, as amended. Open foreign exchange positions are hedged through derivative financial instruments such as currency swaps or cross-currency swaps. These hedges are carried at market rather than nominal value on the IFRS balance sheet. The total of all open foreign exchange positions per Section 26 of the Austrian Banking Act was EUR 15,794,000 at 31 December 2008 (2007: EUR 17,932,000).
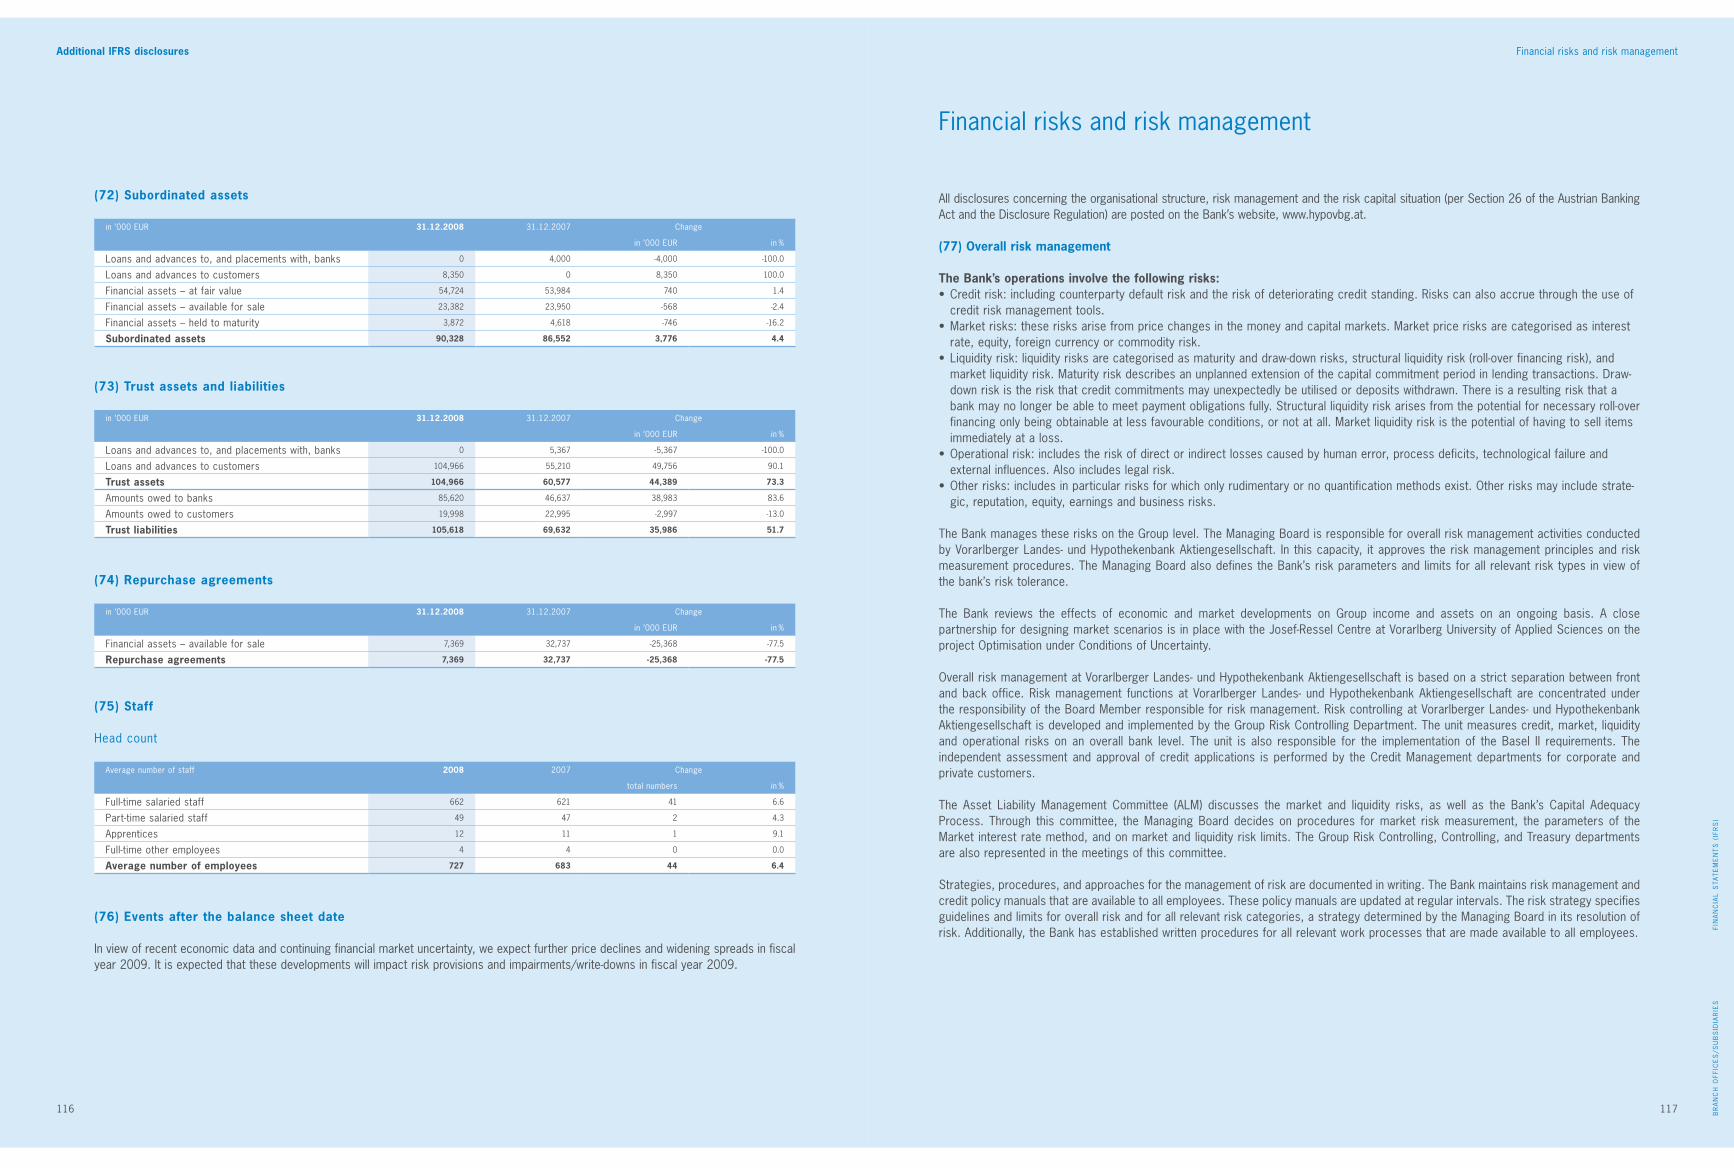
Foreword
116 117
Foreword
FIN
AN
CIA
L S
TAT
EM
EN
TS
(IF
RS
)B
RA
NC
H O
FFIC
ES
/SU
BS
IDIA
RIE
S
117
Financial risks and risk managementAdditional IFRS disclosures
(74) Repurchase agreements
in ’000 EUR 31.12.2008 31.12.2007 Change
in ’000 EUR in %
Financial assets – available for sale 7,369 32,737 -25,368 -77.5
Repurchase agreements 7,369 32,737 -25,368 -77.5
(73) Trust assets and liabilities
in ’000 EUR 31.12.2008 31.12.2007 Change
in ’000 EUR in %
Loans and advances to, and placements with, banks 0 5,367 -5,367 -100.0
Loans and advances to customers 104,966 55,210 49,756 90.1
Trust assets 104,966 60,577 44,389 73.3
Amounts owed to banks 85,620 46,637 38,983 83.6
Amounts owed to customers 19,998 22,995 -2,997 -13.0
Trust liabilities 105,618 69,632 35,986 51.7
(75) Staff
Head count
Average number of staff 2008 2007 Change
total numbers in %
Full-time salaried staff 662 621 41 6.6
Part-time salaried staff 49 47 2 4.3
Apprentices 12 11 1 9.1
Full-time other employees 4 4 0 0.0
Average number of employees 727 683 44 6.4
(76) Events after the balance sheet date
In view of recent economic data and continuing financial market uncertainty, we expect further price declines and widening spreads in fiscal year 2009. It is expected that these developments will impact risk provisions and impairments/write-downs in fiscal year 2009.
Financial risks and risk management
(72) Subordinated assets
in ’000 EUR 31.12.2008 31.12.2007 Change
in ’000 EUR in %
Loans and advances to, and placements with, banks 0 4,000 -4,000 -100.0
Loans and advances to customers 8,350 0 8,350 100.0
Financial assets – at fair value 54,724 53,984 740 1.4
Financial assets – available for sale 23,382 23,950 -568 -2.4
Financial assets – held to maturity 3,872 4,618 -746 -16.2
Subordinated assets 90,328 86,552 3,776 4.4
All disclosures concerning the organisational structure, risk management and the risk capital situation (per Section 26 of the Austrian Banking Act and the Disclosure Regulation) are posted on the Bank’s website, www.hypovbg.at.
(77) Overall risk management
The Bank’s operations involve the following risks:•Creditrisk:includingcounterpartydefaultriskandtheriskofdeterioratingcreditstanding.Riskscanalsoaccruethroughtheuseof
credit risk management tools.•Marketrisks:theserisksarisefrompricechangesinthemoneyandcapitalmarkets.Marketpricerisksarecategorisedasinterest
rate, equity, foreign currency or commodity risk.• Liquidityrisk:liquidityrisksarecategorisedasmaturityanddraw-downrisks,structuralliquidityrisk(roll-overfinancingrisk),and
market liquidity risk. Maturity risk describes an unplanned extension of the capital commitment period in lending transactions. Draw-down risk is the risk that credit commitments may unexpectedly be utilised or deposits withdrawn. There is a resulting risk that a bank may no longer be able to meet payment obligations fully. Structural liquidity risk arises from the potential for necessary roll-over financing only being obtainable at less favourable conditions, or not at all. Market liquidity risk is the potential of having to sell items immediately at a loss.
•Operationalrisk:includestheriskofdirectorindirectlossescausedbyhumanerror,processdeficits,technologicalfailureandexternal influences. Also includes legal risk.
•Otherrisks:includesinparticularrisksforwhichonlyrudimentaryornoquantificationmethodsexist.Otherrisksmayincludestrate-gic, reputation, equity, earnings and business risks.
The Bank manages these risks on the Group level. The Managing Board is responsible for overall risk management activities conducted by Vorarlberger Landes- und Hypothekenbank Aktiengesellschaft. In this capacity, it approves the risk management principles and risk measurement procedures. The Managing Board also defines the Bank’s risk parameters and limits for all relevant risk types in view of the bank’s risk tolerance.
The Bank reviews the effects of economic and market developments on Group income and assets on an ongoing basis. A close partnership for designing market scenarios is in place with the Josef-Ressel Centre at Vorarlberg University of Applied Sciences on the project Optimisation under Conditions of Uncertainty.
Overall risk management at Vorarlberger Landes- und Hypothekenbank Aktiengesellschaft is based on a strict separation between front and back office. Risk management functions at Vorarlberger Landes- und Hypothekenbank Aktiengesellschaft are concentrated under the responsibility of the Board Member responsible for risk management. Risk controlling at Vorarlberger Landes- und Hypothekenbank Aktiengesellschaft is developed and implemented by the Group Risk Controlling Department. The unit measures credit, market, liquidity and operational risks on an overall bank level. The unit is also responsible for the implementation of the Basel II requirements. The independent assessment and approval of credit applications is performed by the Credit Management departments for corporate and private customers.
The Asset Liability Management Committee (ALM) discusses the market and liquidity risks, as well as the Bank’s Capital Adequacy Process. Through this committee, the Managing Board decides on procedures for market risk measurement, the parameters of the Market interest rate method, and on market and liquidity risk limits. The Group Risk Controlling, Controlling, and Treasury departments are also represented in the meetings of this committee.
Strategies, procedures, and approaches for the management of risk are documented in writing. The Bank maintains risk management and credit policy manuals that are available to all employees. These policy manuals are updated at regular intervals. The risk strategy specifies guidelines and limits for overall risk and for all relevant risk categories, a strategy determined by the Managing Board in its resolution of risk. Additionally, the Bank has established written procedures for all relevant work processes that are made available to all employees.

Foreword
118 119
Foreword
FIN
AN
CIA
L S
TAT
EM
EN
TS
(IF
RS
)B
RA
NC
H O
FFIC
ES
/SU
BS
IDIA
RIE
S
119
Financial risks and risk managementFinancial risks and risk management
(78) Market riskThe objective of Asset Liability Management is to optimise the Bank’s management of market risks. The strict separation of trading units and risk controlling ensures an objective assessment of the risks assumed and the early identification of unfavourable developments. Group Risk Controlling assesses risks on a daily basis, reporting review results to the Managing Board and responsible departments.
In the interest of affording customers better service, the Bank maintains a small trading book as per Article 22q of the Austrian Banking Act.
The Bank employs a uniform transfer pricing system to manage the balance sheet structure. The defined reference interest rate determines the allocation of interest income and interest expenses among the branch offices and Treasury. Reference rates are a central management instrument utilised by the Bank, which are defined and reviewed annually by the Managing Board. Reference rates are regularly reviewed and adjusted as necessary, especially in the case of products without a contractual maturity (savings deposits, current accounts).
The Bank utilises two parameters for measuring market risk, which are calculated centrally for the individual bank:- Value at risk- Stress testing- Simulation of maturity transformation result
Value at risk (VaR) represents the maximum probable loss over a specific holding period. The Bank measures VaR using SAP software. This involves historical simulation applying the following parameters:
The VaR limit defines the maximum loss the Bank is prepared to accept under normal market conditions. Each year, the Managing Board sets the global VaR limit in line with ICAAP. In addition, limits are defined for various yield curves, currency pairs and equity position risks.
The Bank performs stress tests to identify loss risks arising under extreme market conditions. The purpose of stress tests is to compensate for the shortcomings of the VaR concept. The absolute results of stress tests for each risk type are added as absolute values, i.e. based on an absolute worst-case scenario. Stress test limits are derived through the Bank’s Capital Adequacy Process. A range of extreme interest rate scenarios (parallel shifts, inversion, steepening) are simulated.
Since June 2008, the Bank has employed risk-adjusted yield curves to calculate present value figures. This move yielded significantly more precise calculation; risk measurement results were inflated previously. In addition to these present value figures, the Bank also runs weekly and monthly gap analyses to monitor reference rates in the money and capital markets.
The chart below shows the Bank’s VaR for each risk type and the change in present value as a result of a 200 basis point shift on the yield curve over the two previous years.
Development VaR (Value at Risk) simulation 200 basis points shift
Parameters for historical simulation
Historical period 250 trading days
Holding period 10 trading days
Confidence level 99%
Hypo Landesbank Vorarlberg Risk Management – organisational chart 31 December 2008
Supervisory Board
Back OfficeCredit management Corporate and Private Customers service – preferred
Managing Board: Back Office Managing Board: Front Office
StrategicResponsibility
OperationalImplementation
Risk measurement/Reporting
Credit committee
ALM Committee
LawParticipation AdministrationCompliance
Treasury
Key personnelSales
Bookkeeping/Controlling
Controlling
InternalAuditingCrisis task force
Group Risk Controlling
10,000,000
0
-10,000,000
-20,000,000
-30,000,000
-40,000,000
-50,000,000
-60,000,000
-70,000,000
EURCHF
JPY SOFWUSD
04.0
1.20
0704
.02.
2007
04.0
3.20
0704
.04.
2007
04.0
5.20
0704
.06.
2007
04.0
7.20
0704
.08.
2007
04.0
9.20
0704
.10.
2007
04.1
1.20
0704
.12.
2007
04.0
1.20
0804
.02.
2008
04.0
3.20
0804
.04.
2008
04.0
5.20
0804
.06.
2008
04.0
7.20
0804
.08.
2008
04.0
9.20
0804
.10.
2008
04.1
1.20
0804
.12.
2008
18,000,000
16,000,000
14,000,000
12,000,000
10,000,000
8,000,000
6,000,000
4,000,000
2,000,000
04.0
1.20
0704
.02.
2007
04.0
3.20
0704
.04.
2007
04.0
5.20
0704
.06.
2007
04.0
7.20
0704
.08.
2007
04.0
9.20
0704
.10.
2007
04.1
1.20
0704
.12.
2007
04.0
1.20
0804
.02.
2008
04.0
3.20
0804
.04.
2008
04.0
5.20
0804
.06.
2008
04.0
7.20
0804
.08.
2008
04.0
9.20
0804
.10.
2008
04.1
1.20
0804
.12.
2008
VaR total
VaR equities
VaR currencies
VaR interest
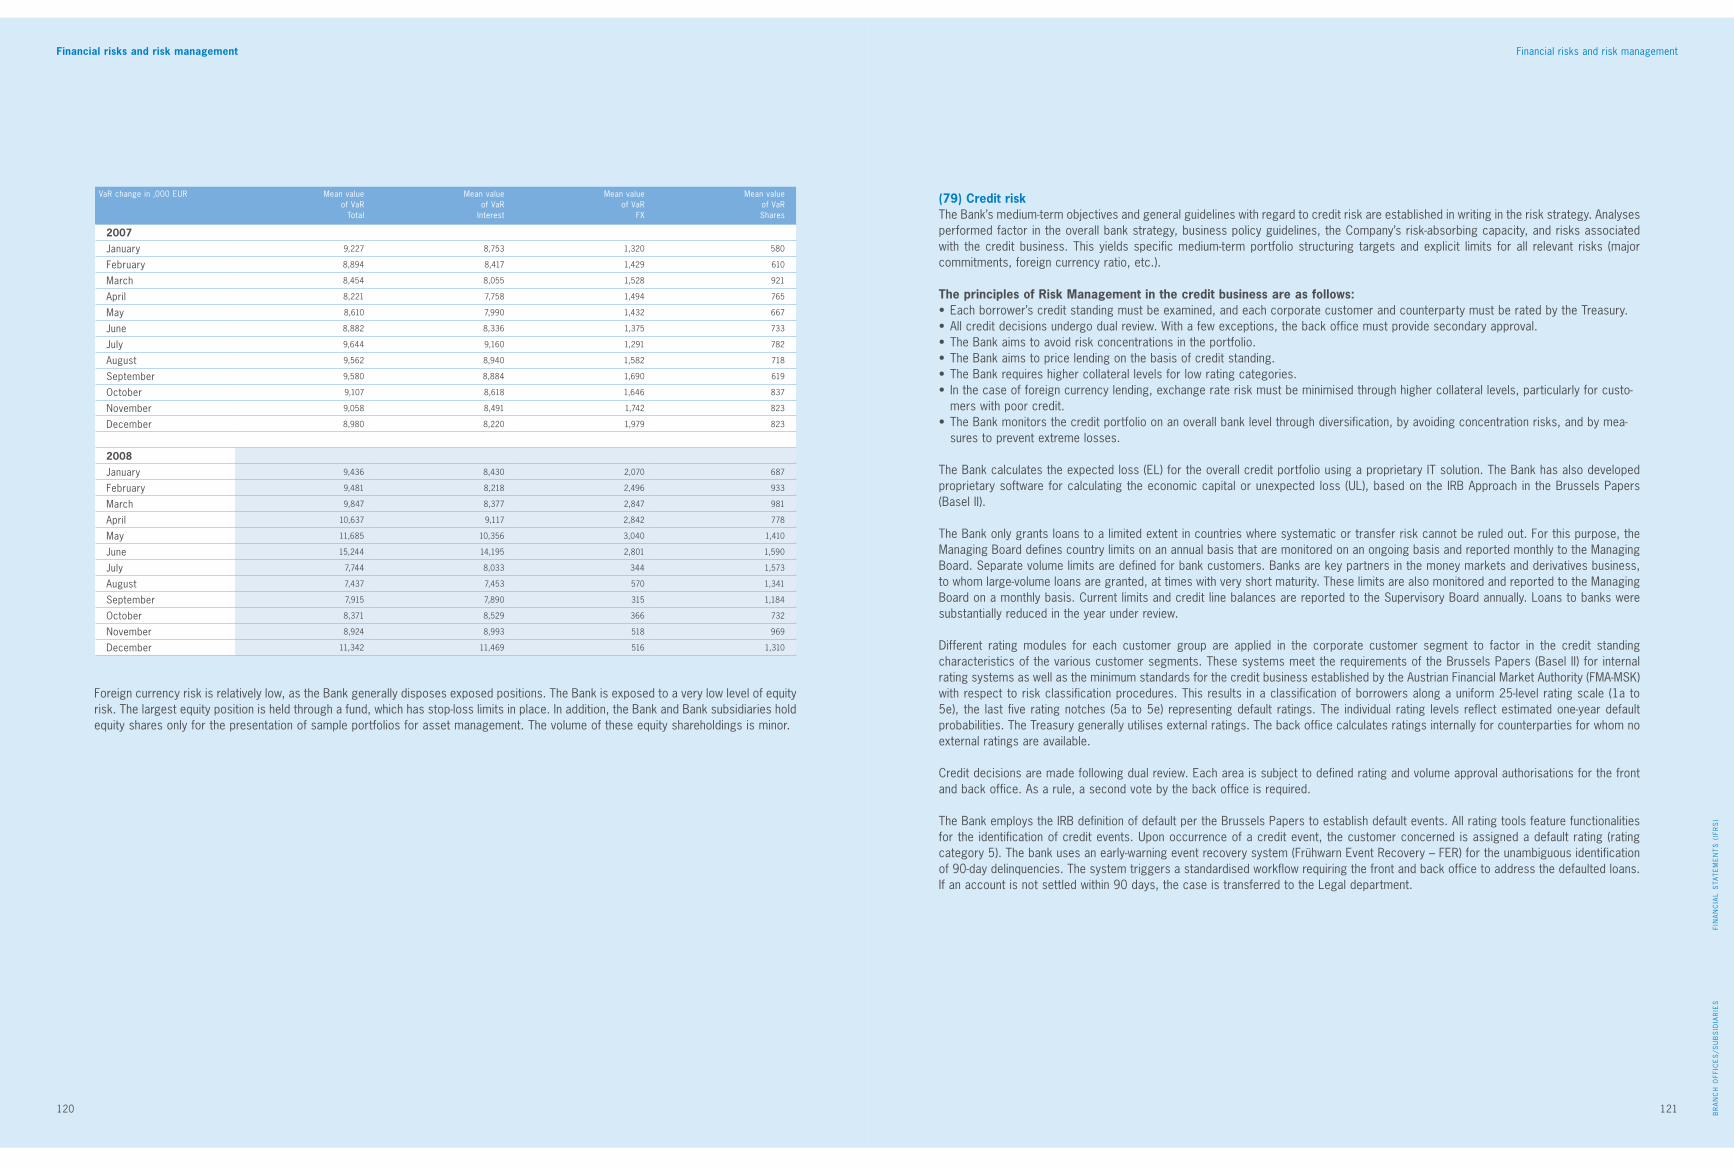
Foreword
120 121
Foreword
FIN
AN
CIA
L S
TAT
EM
EN
TS
(IF
RS
)B
RA
NC
H O
FFIC
ES
/SU
BS
IDIA
RIE
S
121
Financial risks and risk managementFinancial risks and risk management
(79) Credit riskThe Bank’s medium-term objectives and general guidelines with regard to credit risk are established in writing in the risk strategy. Analyses performed factor in the overall bank strategy, business policy guidelines, the Company’s risk-absorbing capacity, and risks associated with the credit business. This yields specific medium-term portfolio structuring targets and explicit limits for all relevant risks (major commitments, foreign currency ratio, etc.).
The principles of Risk Management in the credit business are as follows:• Eachborrower’screditstandingmustbeexamined,andeachcorporatecustomerandcounterpartymustberatedbytheTreasury.• Allcreditdecisionsundergodualreview.Withafewexceptions,thebackofficemustprovidesecondaryapproval.• TheBankaimstoavoidriskconcentrationsintheportfolio.• TheBankaimstopricelendingonthebasisofcreditstanding.• TheBankrequireshighercollaterallevelsforlowratingcategories.• Inthecaseofforeigncurrencylending,exchangerateriskmustbeminimisedthroughhighercollaterallevels,particularlyforcusto-
mers with poor credit.• TheBankmonitorsthecreditportfolioonanoverallbanklevelthroughdiversification,byavoidingconcentrationrisks,andbymea-
sures to prevent extreme losses.
The Bank calculates the expected loss (EL) for the overall credit portfolio using a proprietary IT solution. The Bank has also developed proprietary software for calculating the economic capital or unexpected loss (UL), based on the IRB Approach in the Brussels Papers (Basel II).
The Bank only grants loans to a limited extent in countries where systematic or transfer risk cannot be ruled out. For this purpose, the Managing Board defines country limits on an annual basis that are monitored on an ongoing basis and reported monthly to the Managing Board. Separate volume limits are defined for bank customers. Banks are key partners in the money markets and derivatives business, to whom large-volume loans are granted, at times with very short maturity. These limits are also monitored and reported to the Managing Board on a monthly basis. Current limits and credit line balances are reported to the Supervisory Board annually. Loans to banks were substantially reduced in the year under review.
Different rating modules for each customer group are applied in the corporate customer segment to factor in the credit standing characteristics of the various customer segments. These systems meet the requirements of the Brussels Papers (Basel II) for internal rating systems as well as the minimum standards for the credit business established by the Austrian Financial Market Authority (FMA-MSK) with respect to risk classification procedures. This results in a classification of borrowers along a uniform 25-level rating scale (1a to 5e), the last five rating notches (5a to 5e) representing default ratings. The individual rating levels reflect estimated one-year default probabilities. The Treasury generally utilises external ratings. The back office calculates ratings internally for counterparties for whom no external ratings are available.
Credit decisions are made following dual review. Each area is subject to defined rating and volume approval authorisations for the front and back office. As a rule, a second vote by the back office is required.
The Bank employs the IRB definition of default per the Brussels Papers to establish default events. All rating tools feature functionalities for the identification of credit events. Upon occurrence of a credit event, the customer concerned is assigned a default rating (rating category 5). The bank uses an early-warning event recovery system (Frühwarn Event Recovery – FER) for the unambiguous identification of 90-day delinquencies. The system triggers a standardised workflow requiring the front and back office to address the defaulted loans. If an account is not settled within 90 days, the case is transferred to the Legal department.
Foreign currency risk is relatively low, as the Bank generally disposes exposed positions. The Bank is exposed to a very low level of equity risk. The largest equity position is held through a fund, which has stop-loss limits in place. In addition, the Bank and Bank subsidiaries hold equity shares only for the presentation of sample portfolios for asset management. The volume of these equity shareholdings is minor.
VaR change in ‚000 EUR Mean valueof VaR
Total
Mean valueof VaR
Interest
Mean valueof VaR
FX
Mean valueof VaRShares
2007January 9,227 8,753 1,320 580
February 8,894 8,417 1,429 610
March 8,454 8,055 1,528 921
April 8,221 7,758 1,494 765
May 8,610 7,990 1,432 667
June 8,882 8,336 1,375 733
July 9,644 9,160 1,291 782
August 9,562 8,940 1,582 718
September 9,580 8,884 1,690 619
October 9,107 8,618 1,646 837
November 9,058 8,491 1,742 823
December 8,980 8,220 1,979 823
2008January 9,436 8,430 2,070 687
February 9,481 8,218 2,496 933
March 9,847 8,377 2,847 981
April 10,637 9,117 2,842 778
May 11,685 10,356 3,040 1,410
June 15,244 14,195 2,801 1,590
July 7,744 8,033 344 1,573
August 7,437 7,453 570 1,341
September 7,915 7,890 315 1,184
October 8,371 8,529 366 732
November 8,924 8,993 518 969
December 11,342 11,469 516 1,310

Foreword
122 123
Foreword
FIN
AN
CIA
L S
TAT
EM
EN
TS
(IF
RS
)B
RA
NC
H O
FFIC
ES
/SU
BS
IDIA
RIE
S
123
Financial risks and risk managementFinancial risks and risk management
Regional breakdown by rating
in ’000 EUR RatingCategory
1
RatingCategory
2
RatingCategory
3
RatingCategory
4
RatingCategory
5
Notrated
Total
2007
Vorarlberg 696,805 991,051 1,466,161 94,820 140,392 622,864 4,012,093
Rest of Austria 2,038,785 536,231 903,714 67,029 68,987 161,986 3,776,732
South of Germany 137,187 72,237 169,080 8,846 65,702 83,851 536,903
Switzerland and Liechtenstein 187,124 115,790 75,041 994 19,101 276,746 674,796
Italy 62,270 2,205 900,319 4,797 15,594 1,395 986,580
Rest of Germany 686,384 169,264 107,658 1,440 14,709 129,423 1,108,878
Other foreign countries 1,590,687 331,233 46,258 8,512 396 35,763 2,012,849
Total 5,399,242 2,218,011 3,668,231 186,438 324,881 1,312,028 13,108,831
in ’000 EUR RatingCategory
1
RatingCategory
2
RatingCategory
3
RatingCategory
4
RatingCategory
5
Notrated
Total
2008
Vorarlberg 589,179 934,314 1,697,532 154,078 136,721 650,653 4,162,477
Rest of Austria 2,119,431 649,519 957,705 121,213 64,276 169,496 4,081,640
South of Germany 190,066 114,740 230,760 5,726 61,085 61,281 663,658
Switzerland and Liechtenstein 229,660 167,871 91,877 2,259 20,713 306,849 819,229
Italy 66,314 1,687 1,175,555 12,345 13,482 16,889 1,286,272
Rest of Germany 675,136 263,093 145,404 4,632 14,788 93,422 1,196,475
Other foreign countries 1,638,311 465,869 166,013 13,546 5,974 17,234 2,306,947
Total 5,508,097 2,597,093 4,464,846 313,799 317,039 1,315,824 14,516,698
Segment breakdown by rating
in ’000 EUR Rating class
1
Rating class
2
Rating class
3
Rating class
4
Rating class
5
Notrated
Total
2007
Exposure Corporate Customers 761,073 1,189,650 2,127,738 165,459 262,552 405,498 4,911,970
Private Customers 160 197,064 225,299 16,979 60,479 796,465 1,296,446
Pool 67,016 162,170 1,235,556 4,000 1,850 7,184 1,477,776
Treasury 4,570,993 669,127 79,638 0 0 102,881 5,422,639
Total exposure 5,399,242 2,218,011 3,668,231 186,438 324,881 1,312,028 13,108,831
Unsecured exposure Corporate Customers 504,580 857,121 936,329 36,979 84,547 174,745 2,594,301
Private Customers 143 39,692 89,192 3,439 22,064 236,476 391,006
Pool 66,867 107,563 339,212 4,000 913 6,057 524,612
Treasury 4,461,929 549,127 73,483 0 0 102,881 5,187,420
Total unsecured exposure 5,033,519 1,553,503 1,438,216 44,418 107,524 520,159 8,697,339
in ’000 EUR Rating class
1
Rating class
2
Rating class
3
Rating class
4
Rating class
5
Notrated
Total
2008
Exposure Corporate Customers 834,852 1,682,282 2,288,944 297,720 235,941 403,807 5,743,546
Private Customers 53 119,075 338,793 10,579 65,663 803,616 1,337,779
Pool 74,838 151,986 1,719,914 4,000 10,934 5,103 1,966,775
Treasury 4,598,354 643,752 117,193 1,500 4,500 103,298 5,468,597
Total exposure 5,508,097 2,597,095 4,464,844 313,799 317,038 1,315,824 14,516,697
Unsecured exposure Corporate Customers 579,951 1,286,106 983,482 105,245 77,533 172,548 3,204,865
Private Customers 43 54,354 125,578 3,705 22,175 243,296 449,151
Pool 74,838 85,490 456,195 4,000 5,450 2,756 628,729
Treasury 4,491,197 523,752 110,364 1,500 4,500 103,298 5,234,611
Total unsecured exposure 5,146,029 1,949,702 1,675,619 114,450 109,658 521,898 9,517,356
in ’000 EUR Corporate- Private
2007 Total Customers Customers Pool Treasury
Loans and advances to, and placements with, banks 1,965,971 0 0 458,915 1,507,056
Loans and advances to customers 5,904,795 3,619,036 1,178,384 885,404 221,971
Trading assets and derivatives 245,464 16,908 0 0 228,556
Financial assets at fair value 1,113,666 0 0 0 1,113,666
Financial assets – available for sale 1,364,738 0 0 0 1,364,738
Financial assets – held to maturity 1,066,490 0 0 0 1,066,490
Total carrying value 11,661,124 3,635,944 1,178,384 1,344,319 5,502,477
Credit commitments 1,197,518 1,047,036 97,911 50,021 2,550
Financial guarantee contracts 473,860 230,691 20,151 97,435 125,583
Mutual funds -54,571 0 0 0 -54,571
Investments -13,999 0 0 -13,999 0
Deferred interest -153,400 0 0 0 -153,400
Other changes -1,701 -1,701 0 0 0
Total exposure 13,108,831 4,911,970 1,296,446 1,477,776 5,422,639
in ’000 EUR Corporate- Private
2008 Total Customers Customers Pool Treasury
Loans and advances to, and placements with, banks 1,895,081 0 0 421,672 1,473,409
Loans and advances to customers 7,337,456 4,350,999 1,246,605 1,348,756 391,096
Trading assets and derivatives 424,798 2,111 0 0 422,687
Financial assets at fair value 1,352,723 0 0 0 1,352,723
Financial assets – available for sale 655,878 0 0 0 655,878
Financial assets – held to maturity 1,212,459 0 0 0 1,212,459
Total carrying value 12,878,395 4,353,110 1,246,605 1,770,428 5,508,252
Credit commitments 1,128,281 841,425 76,568 209,277 1,011
Financial guarantee contracts 522,437 357,785 14,606 376 149,670
Mutual funds -41,110 0 0 0 -41,110
Investments -13,306 0 0 -13,306 0
Deferred interest -149,226 0 0 0 -149,226
Other changes *) 191,226 191,226 0 0 0
Total exposure 14,516,697 5,743,546 1,337,779 1,966,775 5,468,597
The Bank takes full account of risks particular to the banking business by adopting a conservative lending approach combined with strict receivables valuation policies and prudent allocation of specific loan loss provisions. Specific provisions in connection with loans and advances to customers and banks are allocated according to uniform Group credit risks standards. Risk provisions are allocated on the basis of assessments of future credit defaults and interest concessions. Loans are subject to review for loss provisioning if certain monitored criteria indicate that interest and principal repayment obligations may not be fully met. The provision amount corresponds with the difference between the carrying value of the credit and the present value of expected future cash flows, less unimpaired discounted collateral. The total amount of risk provisions for receivables on the balance sheet is explicitly charged against loans and advances to, and placements with, banks’ and ‘loans and advances to customers’. Risk provisions for off-balance sheet transactions (guarantees, endorsement liabilities, loan commitments) are shown as loan loss provisions. Non-collectible receivables are written down directly. Amounts collected from written-down receivables are recorded in income.
The subsidiaries generally employ the same rating tools as the parent company. This allows for a uniform assessment of credit risk throughout the Group. The Bank’s total exposure includes balance sheet receivables and contingent liabilities; this metric is employed in internal reporting to allow for realistic assessment of exposure to a customer. The table below provides a year-on-year comparison of balance sheet assets and liabilities by segment.
*) incl. adjustment for inter-group elimination of exposure within Vorarlberger Landes- und Hypothekenbank Aktiengesellschaft

Foreword
124 125
Foreword
FIN
AN
CIA
L S
TAT
EM
EN
TS
(IF
RS
)B
RA
NC
H O
FFIC
ES
/SU
BS
IDIA
RIE
S
125
Financial risks and risk managementFinancial risks and risk management
The Bank designates defaulted loans (rating level 5) as non-performing loans.
The central Group Legal department pursues collection of defaulted accounts and the realisation of collateral. In the reporting period this was pursued in connection with three real estate properties with a cost of EUR 1 million purchased by the Hypo Immobilien GmbH Group.
(80) Liquidity riskThe objective of liquidity management is to ensure the Bank’s operative liquidity at all times while minimising costs associated with maintaining liquidity. The Bank continuously analyses its instruments, markets and assets which can be liquidated for their liquidity-generating potential (tactical liquidity management). Strategic liquidity management allows the Bank to manage the maturity of its assets and liabilities and define a corresponding securities issuance strategy. Monitoring of securities issuances required for each calendar year is performed by way of gap analyses and forecasting. The Bank attempts to identify potential risks by conducting stress testing at regular intervals. In testing, the Bank distinguishes between bank-specific and general liquidity risks. Emergency plans designed to maintain keep the Bank solvent are in place for implementation in the event of a liquidity crisis.
The Bank uses the following management instruments to identify and contain liquidity risks:
Operational- Limitation of weekly liquidity gaps in the money market- Forecasting money market volumes (active and passive)- Percentage of assets and receivables reaching maturity within 3 months (possible redemption of own securities issues is reviewed)
Strategic- Limitation of annual liquidity gaps on the capital market- Forecasting required securities issues per calendar year- Calculation of liquidity value at risk
in ’000 EURVorarlberg
Rest ofAustria
Southof
Germany
Switzerlandand
LiechtensteinItaly
Restof
Germany
Other foreign
countriesTotal2008
Corporate Customers Exposure 104,314 51,074 53,237 13,434 5,301 10,042 688 238,090
Unsecured exposure 35,925 23,462 12,616 2,668 1,095 3,799 78 79,643
Impairment 30,248 12,841 22,421 1,996 2,767 4,325 62 74,660
Private Customers Exposure 33,094 12,748 7,869 7,279 162 4,849 346 66,347
Unsecured exposure 13,254 4,743 1,712 1,731 95 740 124 22,399
Impairment 11,229 5,380 1,904 3,244 103 2,115 111 24,086
Pool Exposure 0 2,469 0 0 8,019 0 446 10,934
Unsecured exposure 0 728 0 0 4,276 0 446 5,450
Impairment 0 424 0 0 3,150 0 0 3,574
Treasury Exposure 0 0 0 0 0 0 4,500 4,500
Unsecured exposure 0 0 0 0 0 0 4,500 4,500
Impairment 0 0 0 0 0 0 0 0
Total Exposure 137,408 66,291 61,106 20,713 13,482 14,891 5,980 319,871
Total Unsecured exposure 49,179 28,933 14,328 4,399 5,466 4,539 5,148 111,992
Total Impairment 41,477 18,645 24,325 5,240 6,020 6,440 173 102,320
Industry breakdown
in ’000 EUR 31.12.2008 31.12.2007 Change
in ’000 EUR in %
Financial intermediaries 6,256,635 5,702,455 554,180 9.7
Public sector 1,514,486 1,492,070 22,416 1.5
Consumers/Private Customers 1,551,374 1,338,572 212,802 15.9
Real estate 1,085,895 1,037,172 48,723 4.7
Services 834,816 852,281 -17,465 -2.0
Trade 625,896 514,950 110,946 21.5
Tourism 332,283 312,722 19,561 6.3
Metal-working industry 324,601 301,603 22,998 7.6
Energy and water supply 354,878 275,458 79,420 28.8
Construction 346,638 273,321 73,317 26.8
Other 290,325 253,057 37,268 14.7
Transport and communications 233,604 200,058 33,546 16.8
Freelance professions 115,320 123,378 -8,058 -6.5
Food, beverages and tobacco 93,963 85,328 8,635 10.1
Textiles 65,006 77,655 -12,649 -16.3
Mineral oil, plastics 134,944 67,663 67,281 99.4
Automotive industry 88,230 63,052 25,178 39.9
Other goods 152,364 59,033 93,331 > 100.0
Agriculture and forestry, mining 61,341 39,285 22,056 56.1
Paper, publishing, printers 47,356 32,105 15,251 47.5
Glass, ceramics, stone 6,742 7,613 -871 -11.4
Total 14,516,697 13,108,831 1,407,866 10.7
Non-performing loans
in ’000 EURVorarlberg
Rest ofAustria
Southof
Germany
Switzerlandand
LiechtensteinItaly
Restof
Germany
Other foreign
countriesTotal2007
Corporate Customers Exposure 108,215 62,296 55,922 12,519 15,556 8,033 9 262,550
Unsecured exposure 38,056 18,536 12,763 3,300 9,745 2,141 7 84,548
Impairment 30,096 13,540 20,930 1,578 6,552 2,511 0 75,207
Private Customers Exposure 31,068 5,950 9,780 6,582 38 6,676 386 60,480
Unsecured exposure 13,065 3,234 1,837 1,358 38 2,382 149 22,063
Impairment 11,812 2,530 2,721 2,782 38 2,205 144 22,232
Pool Exposure 1,110 741 0 0 0 0 0 1,851
Unsecured exposure 606 307 0 0 0 0 0 913
Impairment 400 0 0 0 0 0 0 400
Treasury Exposure 0 0 0 0 0 0 0 0
Unsecured exposure 0 0 0 0 0 0 0 0
Impairment 0 0 0 0 0 0 0 0
Total Exposure 140,393 68,987 65,702 19,101 15,594 14,709 395 324,881
Total Unsecured exposure 51,727 22,077 14,600 4,658 9,783 4,523 156 107,524
Total Impairment 42,308 16,070 23,651 4,360 6,590 4,716 144 97,839
Overdue receivables not rated in default
Days overdue 31.12.2008
Exposure
in ‚000 EUR
31.12.2007
Exposure
in ‚000 EUR
Change
in ’000 EUR in %
< 1 day 13,936,626 12,645,254 1,291,372 10.2
1 to 30 days 202,482 111,422 91,060 81.7
31 to 60 days 43,450 20,240 23,210 > 100.0
61 to 90 days 14,265 7,034 7,231 > 100.0
Total 14,196,823 12,783,950 1,412,873 11.1

Foreword
126 127
Foreword
FIN
AN
CIA
L S
TAT
EM
EN
TS
(IF
RS
)B
RA
NC
H O
FFIC
ES
/SU
BS
IDIA
RIE
S
127
Financial risks and risk managementFinancial risks and risk management
Stress testing- Comparison of crisis liquidity needs versus available liquidity sources
The issuance of foreign-currency bonds and currency transformation through long-term cross-currency swaps are very important for hedging long-term currency risks.
The Bank is aware of the great significance of the capital markets as a source of financing. The Bank deliberately manages the maturity profile of its loans in view of the pending discontinuation of the state Deficiency Guarantee. Regular roadshows are conducted aimed at strengthening existing investor relations and establishing new relationships. The Bank’s securities issuance policy focuses on diversification with respect to instruments and investors.
The Bank currently holds sufficient liquidity in short-term interbank investments to comply with drawn credit commitments (asset draw-down risk) and ensure that the unexpected default on projected payments (maturity risk) does not cause any payment difficulties. Additionally, for funding the Bank currently is making virtually no use of the Austrian National Bank refinancing tender or the money market. Accordingly, there is sufficient liquidity available at all times to avoid a liquidity bottleneck.
(81) Operational riskThe Bank records and classifies operational damage cases in a database. Quality assurance is performed by operational risk managers, who review each damage case. Damage case data is available due to the necessity of recording to conduct proper accounting. Results of database evaluation flow into the quarterly OR report.
In all Bank divisions, operational risks are minimised through clear assignment of responsibilities and the issuance of written work instructions. The Bank has written emergency procedures in place and a crisis manual, which are made accessible to all employees. Employees receive regular training to prepare them for a range of crisis scenarios. The Bank has critically reviewed all internal procedures multiple times as part of functional analysis.
The Bank places great emphasis on data protection and data backup measures, having a range of review and monitoring procedures in place to ensure the confidentiality of the data entrusted. The Internal Audit Department monitors compliance with work instructions at regular intervals, and through special unannounced inspections.
Major transactions and decisions always undergo dual review. Maintaining well-qualified and responsible staff is a major priority for the Bank. The in-house legal department minimises legal risks by drafting contracts meticulously and in consultation with specialised lawyers and university professors.
(82) Consolidated capital resources and capital resources required by the banking supervisory authority
Capital management
The objectives and requirements of Group capital management include:- Compliance with regulatory capital requirements in accordance with Basel II- Maintaining the company as a going concern- Managing dividend distributions to the owners- Maintaining a solid equity capital base to allow further expansion
Capital adequacy is constantly monitored by applying the Basel II guidelines, under consideration of the EU directives adopted by the Republic of Austria. This data for the Group as a whole is reported to the Austrian National Bank on a monthly basis. The FMA regulatory authority requires banks to hold at least 8% of risk-weighted assets and 8% of off-balance sheet transactions and derivatives in qualifying capital resources, valued using the market valuation approach. The Bank met regulatory capital resource requirements both during the year under review and in the previous year.
The Group’s regulatory capital is determined by Group Accounting, consisting of two tiers.
Tier 1 capital: includes share capital, capital reserves, retained earnings, and differences from capital consolidation. The Group’s Tier 1 capital also includes supplementary capital with specific characteristics per Section 24 of the Banking Act (hybrid capital). The carrying values of intangible assets are deducted from Tier 1 capital.
Tier 2 capital: primarily includes supplementary capital bonds with sufficient term to maturity and subordinated securities. Silent reserves not appearing on the balance sheet may also be added to Tier 2 capital.
Eligible capital resources represent the total of Tier 1 plus Tier 2 capital after deducting the carrying value of investments in which a 10% to 50% interest is held. The table below shows required capital resources per the Banking Act that applied for Vorarlberger Landes- und Hypothekenbank Aktiengesellschaft pursuant to Section 30 Banking Act on the 2008 and 2007 balance sheet dates, as well as a breakdown of the Group’s capital resources as of 31 December 2008 and 31 December 2007.
Pillar 2 of Basel II requires banks additionally to establish their capital adequacy on the basis of internal models. This is to ensure in particular that risks are considered for which no capital adequacy requirements are provided under Pillar 1. Such risks include interest rate risk in the non-trading portfolio. The Bank employs the Internal Capital Adequacy Assessment Process (ICAAP) to identify, quantify, aggregate, and monitor all major risks. The Bank calculates the required economic capital for each major risk, allocating capital buffers where calculation is not possible. The available risk coverage potential is distributed across organisational units and risk types in annual planning.
By using the Capital Adequacy Process, the Bank ensures that risk limits are complied with, and that the risks taken are covered by existing coverage potential. The Bank applies a confidence level of 99.95% and a holding period of one year in the Capital Adequacy Process. Correlations between individual risk types are not taken into consideration. The Capital Adequacy Process calculation is performed monthly.
Changes in maturities – money market Assets Liabilities
in ’000 EUR Assets Derivatives Liabilities Derivatives Total
January 2009 1,154,279 185,711 -1,241,062 -190,721 -91,793
February 2009 456,512 213,479 -254,116 -215,865 200,010
March 2009 262,081 150,356 -256,064 -144,324 12,049
April 2009 190,855 72,163 -162,990 -64,866 35,162
May 2009 130,782 115,557 -138,278 -121,463 -13,402
June 2009 225,453 24,231 -207,776 -34,677 7,231
July 2009 133,708 18,224 -178,227 -16,370 -42,665
August 2009 104,459 25,363 -156,879 -25,192 -52,249
September 2009 329,506 42,851 -226,257 -39,461 106,639
October 2009 267,210 24,965 -218,042 -28,974 45,159
November 2009 98,482 156,790 -123,458 -141,049 -9,235
December 2009 189,255 49,140 -232,065 -53,873 -47,543
Changes in maturities – money market Assets Liabilities
in ’000 EUR Assets Derivatives Liabilities Derivatives Total
2009 3,130,820 864,265 -3,089,444 -862,774 42,867
2010 783,771 245,408 -622,295 -206,409 200,475
2011 1,225,465 32,342 -668,315 -29,865 559,627
2012 778,856 32,392 -372,743 -32,366 406,139
2013 884,189 20,316 -529,709 -20,496 354,300
2014 605,223 28,829 -375,947 -24,282 233,823
2015 652,867 11,811 -743,205 -13,240 -91,767
2016 667,660 212,496 -1,117,651 -207,820 -445,315
2017 1,052,878 226,519 -3,560,564 -195,498 -2,476,665
2018 393,794 0 -135,723 0 258,071
2019 309,085 0 -198,244 0 110,841
2020 293,943 0 -80,365 0 213,578
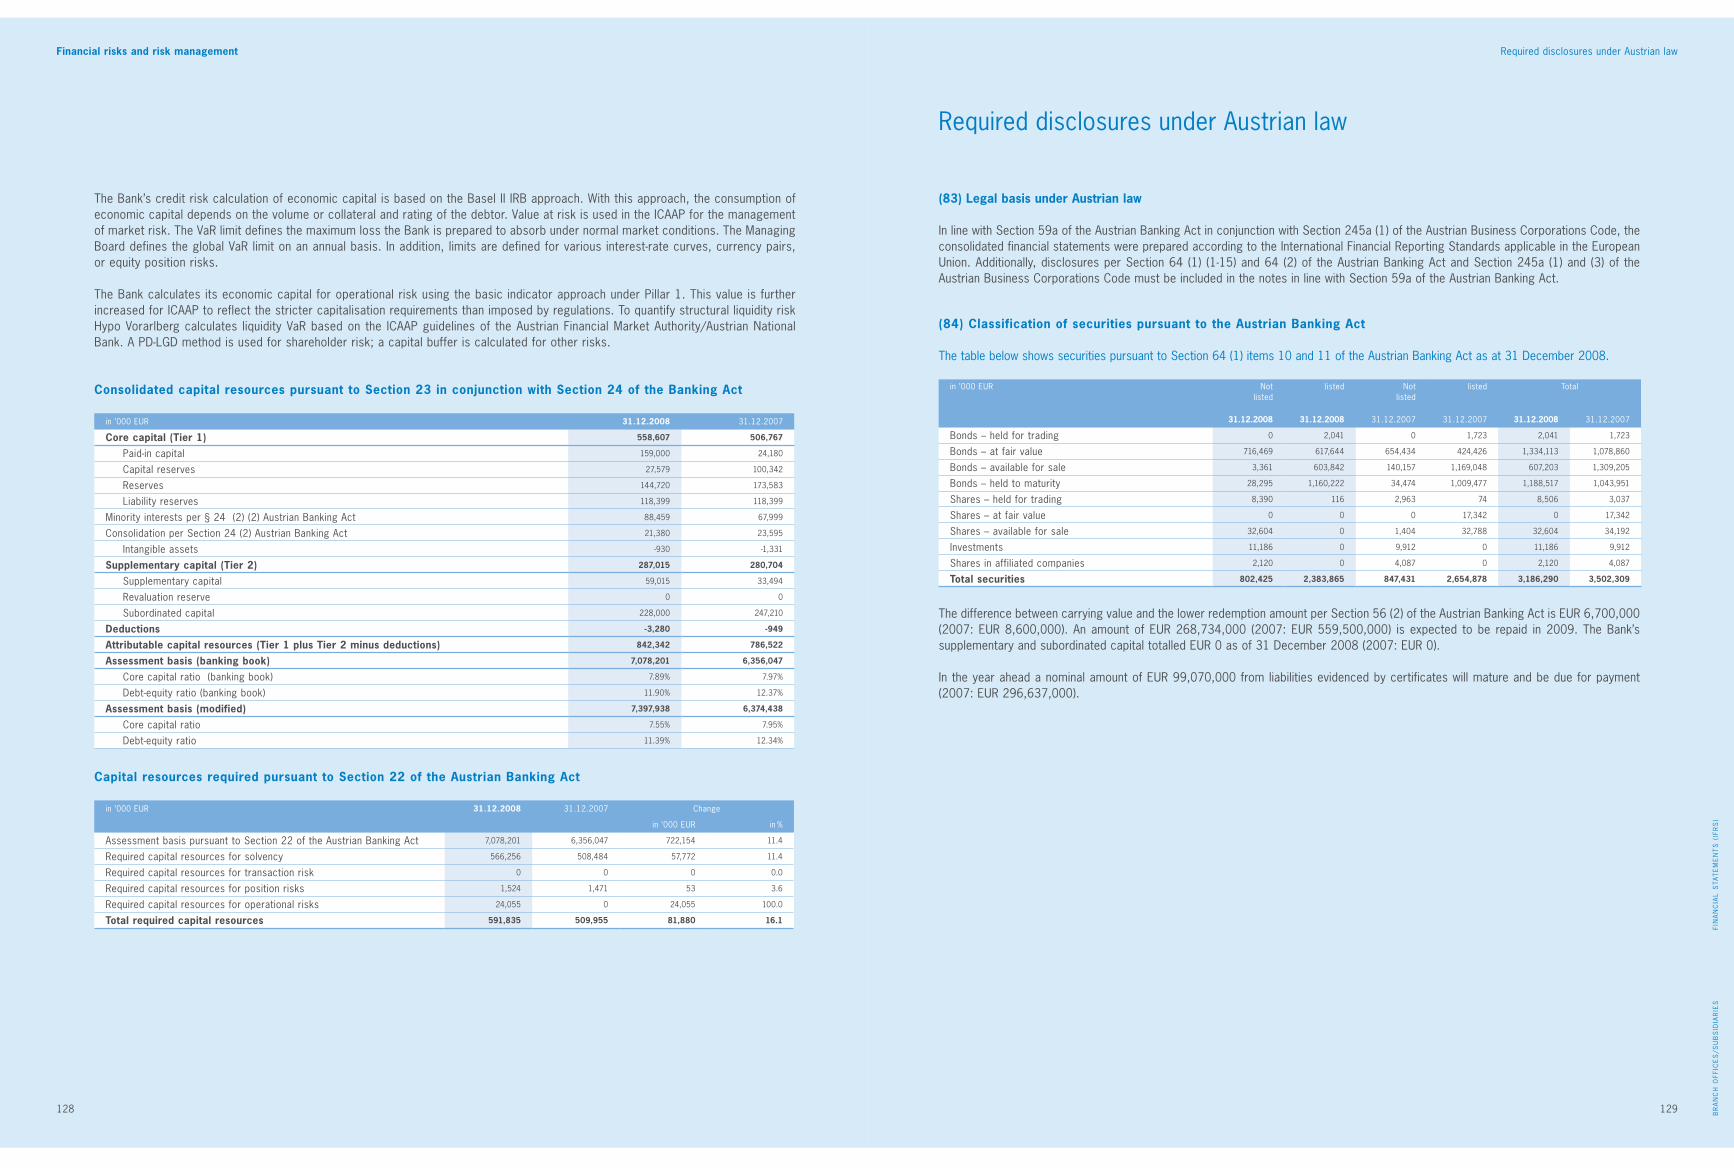
Foreword
128 129
Foreword
FIN
AN
CIA
L S
TAT
EM
EN
TS
(IF
RS
)B
RA
NC
H O
FFIC
ES
/SU
BS
IDIA
RIE
S
129
Required disclosures under Austrian lawFinancial risks and risk management
Capital resources required pursuant to Section 22 of the Austrian Banking Act
in ’000 EUR 31.12.2008 31.12.2007 Change
in ’000 EUR in %
Assessment basis pursuant to Section 22 of the Austrian Banking Act 7,078,201 6,356,047 722,154 11.4
Required capital resources for solvency 566,256 508,484 57,772 11.4
Required capital resources for transaction risk 0 0 0 0.0
Required capital resources for position risks 1,524 1,471 53 3.6
Required capital resources for operational risks 24,055 0 24,055 100.0
Total required capital resources 591,835 509,955 81,880 16.1
The Bank’s credit risk calculation of economic capital is based on the Basel II IRB approach. With this approach, the consumption of economic capital depends on the volume or collateral and rating of the debtor. Value at risk is used in the ICAAP for the management of market risk. The VaR limit defines the maximum loss the Bank is prepared to absorb under normal market conditions. The Managing Board defines the global VaR limit on an annual basis. In addition, limits are defined for various interest-rate curves, currency pairs, or equity position risks.
The Bank calculates its economic capital for operational risk using the basic indicator approach under Pillar 1. This value is further increased for ICAAP to reflect the stricter capitalisation requirements than imposed by regulations. To quantify structural liquidity risk Hypo Vorarlberg calculates liquidity VaR based on the ICAAP guidelines of the Austrian Financial Market Authority/Austrian National Bank. A PD-LGD method is used for shareholder risk; a capital buffer is calculated for other risks.
(83) Legal basis under Austrian law
In line with Section 59a of the Austrian Banking Act in conjunction with Section 245a (1) of the Austrian Business Corporations Code, the consolidated financial statements were prepared according to the International Financial Reporting Standards applicable in the European Union. Additionally, disclosures per Section 64 (1) (1-15) and 64 (2) of the Austrian Banking Act and Section 245a (1) and (3) of the Austrian Business Corporations Code must be included in the notes in line with Section 59a of the Austrian Banking Act.
(84) Classification of securities pursuant to the Austrian Banking Act
The table below shows securities pursuant to Section 64 (1) items 10 and 11 of the Austrian Banking Act as at 31 December 2008.
in ’000 EUR Notlisted
listed Notlisted
listed Total
31.12.2008 31.12.2008 31.12.2007 31.12.2007 31.12.2008 31.12.2007
Bonds – held for trading 0 2,041 0 1,723 2,041 1,723
Bonds – at fair value 716,469 617,644 654,434 424,426 1,334,113 1,078,860
Bonds – available for sale 3,361 603,842 140,157 1,169,048 607,203 1,309,205
Bonds – held to maturity 28,295 1,160,222 34,474 1,009,477 1,188,517 1,043,951
Shares – held for trading 8,390 116 2,963 74 8,506 3,037
Shares – at fair value 0 0 0 17,342 0 17,342
Shares – available for sale 32,604 0 1,404 32,788 32,604 34,192
Investments 11,186 0 9,912 0 11,186 9,912
Shares in affiliated companies 2,120 0 4,087 0 2,120 4,087
Total securities 802,425 2,383,865 847,431 2,654,878 3,186,290 3,502,309
Required disclosures under Austrian law
The difference between carrying value and the lower redemption amount per Section 56 (2) of the Austrian Banking Act is EUR 6,700,000 (2007: EUR 8,600,000). An amount of EUR 268,734,000 (2007: EUR 559,500,000) is expected to be repaid in 2009. The Bank’s supplementary and subordinated capital totalled EUR 0 as of 31 December 2008 (2007: EUR 0).
In the year ahead a nominal amount of EUR 99,070,000 from liabilities evidenced by certificates will mature and be due for payment (2007: EUR 296,637,000).
Consolidated capital resources pursuant to Section 23 in conjunction with Section 24 of the Banking Act
in ’000 EUR 31.12.2008 31.12.2007
Core capital (Tier 1) 558,607 506,767
Paid-in capital 159,000 24,180
Capital reserves 27,579 100,342
Reserves 144,720 173,583
Liability reserves 118,399 118,399
Minority interests per § 24 (2) (2) Austrian Banking Act 88,459 67,999
Consolidation per Section 24 (2) Austrian Banking Act 21,380 23,595
Intangible assets -930 -1,331
Supplementary capital (Tier 2) 287,015 280,704
Supplementary capital 59,015 33,494
Revaluation reserve 0 0
Subordinated capital 228,000 247,210
Deductions -3,280 -949
Attributable capital resources (Tier 1 plus Tier 2 minus deductions) 842,342 786,522
Assessment basis (banking book) 7,078,201 6,356,047
Core capital ratio (banking book) 7.89% 7.97%
Debt-equity ratio (banking book) 11.90% 12.37%
Assessment basis (modified) 7,397,938 6,374,438
Core capital ratio 7.55% 7.95%
Debt-equity ratio 11.39% 12.34%

Foreword
130 131
Foreword
FIN
AN
CIA
L S
TAT
EM
EN
TS
(IF
RS
)B
RA
NC
H O
FFIC
ES
/SU
BS
IDIA
RIE
S
131
Board members Subsidiaries and equity interests
Supervisory Board
Kurt RuppChairmanChairman Managing Board (retired), Bregenz
Norbert MetzlerDeputy Chairman Management Consultant, Alberschwende
Christian BrandCEO of Landeskreditbank, Baden-Württemberg Förderbank, Karlsruhe
Albert BücheleAgriculturist, Hard
Elmar GeigerManaging Director of EHG-Stahlzentrum-West, Dornbirn
Herbert HagerManaging Director of Vorarlberger Medienhaus, Schwarzach
Michael HornDeputy CEO of Landesbank Baden-Württemberg, Stuttgart
Rainer KeckeisDirector of Chamber of Labour Vorarlberg, Feldkirch (until 18 June 2008)
Christian KonzettLawyer, Bludenz
Elke KroisenbrunnerLawyer, Dornbirn (until 18 June 2008)
Klaus MartinProvincial Official (retired), Feldkirch (since 19 June 2008)
Nicolas StiegerLawyer, Bregenz (since 19 June 2008)
Bernhard EggerWorks Council Delegate
Bernhard KöbWorks Council Delegate
Elmar KöckWorks Council Delegate
Veronika MoosbruggerWorks Council Delegate
Rudolf WüstnerWorks Council Delegate
Managing Board
Jodok SimmaCEO, Chairman Managing Board, Bregenz
Johannes HefelMember, Schwarzach
Michael GrahammerMember, Dornbirn
VI. Board members
b) Companies consolidated according to the equity method:
Company name, place Interest held
in %
Capital and reserves
in '000 EUR
Earnings
in '000 EUR
Total assets
in '000 EUR
Date offinancial
statements
Hypo SüdLeasing GmbH, Dornbirn 26.00 % 2,832 -3,083 358,839 31.12.2008
Vorarlberger Kommunalgebäudeleasing Gesellschaft m.b.H., Dornbirn 33.33 % 315 -123 2,049 31.12.2008
VKL II Grundverwertungsgesellschaft m.b.H., Dornbirn 33.33 % 1,273 10 4,132 31.12.2008
VKL III Gebäudeleasing-Gesellschaft m.b.H., Dornbirn 33.33 % 4,720 211 5,084 31.12.2008
VKL IV Leasinggesellschaft mbH, Dornbirn 33.33 % 1,030 -133 40,833 31.12.2008
VKL V Immobilien Leasinggesellschaft m.b.H., Dornbirn 33.33 % 416 -4 24,763 31.12.2008
HyPO EQUITy Unternehmensbeteiligungen AG, Bregenz
zuvor: Hypo Unternehmensbeteiligungen AG 29.99 % 42,867 -5,077 74,371 31.12.2008
‚Seestadt Bregenz‘ Besitz- und Verwaltungsgesellschaft mbH, Bregenz 20.00 % 7,681 248 7,717 31.12.2008
List of selected investments
a) Fully consolidated companies:
Company name, place Interest held
in %
Date of financial
statements
Hypo-Rent Leasing- und Beteiligungsgesellschaft mbH, Bregenz 100.00 % 31.12.2008
Hypo Vorarlberg Capital Finance (Jersey) Limited, GB-St. Helier, Jersey 100.00 % 31.12.2008
LD-Leasing GmbH, Dornbirn 100.00 % 31.12.2008
Hypo Vorarlberg Leasing AG, Bolzano 100.00 % 31.12.2008
Hypo Vorarlberg Holding (Italien) - G.m.b.H, IT-Bozen 100.00 % 31.12.2008
Hypo-Vorarlberg G.m.b.H, IT-Bozen 100.00 % 31.12.2008
IMMOLEAS Grundstücksverwaltungsgesellschaft m.b.H., Dornbirn 100.00 % 31.12.2008
Immoleas II Gebäudeleasinggesellschaft mbH, Dornbirn 100.00 % 31.12.2008
Hypo SüdLeasing GmbH, Dornbirn 100.00 % 31.12.2008
Immoleas IV Leasinggesellschaft m.b.H., Dornbirn 100.00 % 31.12.2008
Hypo Immobilienleasing Gesellschaft m.b.H., Dornbirn 100.00 % 31.12.2008
HERA Grundstücksverwaltungsgesellschaft m.b.H., Dornbirn 100.00 % 31.12.2008
Hypo Informatikgesellschaft m.b.H., Bregenz 100.00 % 31.12.2008
Hypo Immobilien Bankgebäudemanagement GmbH, Dornbirn 100.00 % 31.12.2008
Hypo SüdLeasing GmbH, Dornbirn 100.00 % 31.12.2008
Hypo Investment Bank (Liechtenstein) Aktiengesellschaft 94.50 % 31.12.2008
HyPO EQUITy Management AG (HEMAG) 84.00 % 31.12.2008
VII. Subsidiaries and equity interests
132 133
BR
AN
CH
OFF
ICE
S/S
UB
SID
IAR
IES
Managing Board declaration/Report of the Supervisory Board
We declare that to the best of our knowledge that the consolidated financial statements produced in accordance with applicable accounting principles provide a true and fair view of the Group’s assets and liabilities, financial condition and results of operation, and that the Group management report provides a true and fair view of the same in its treatment of the course of business and the Group’s business performance and position, in addition to presenting material risks and uncertainties potentially affec-ting the Group going forward.
We declare that to the best of our knowledge the parent company financial statements produced in accordance with applicable accounting principles provide a true and fair view of the Company’s assets and liabilities, financial condition and results of operation, and that the Company management report provides a true and fair view of the same in its treatment of the course of business and the Company’s business performance and position, in addition to presenting material risks and uncertainties potenti-ally affecting the Company going forward.
Bregenz, 20 March 2009
The Managing Board
Jodok Simma Johannes Hefel Michael GrahammerChairman Managing Board Managing Board member Managing Board member
The Supervisory Board reviewed on an ongoing basis the managerial activities conducted by the Managing Board for compliance with applicable regulations and the Bank’s articles of association and rules of procedure. The Supervisory Board convened for five meetings in which reports from the Managing Board were discussed on key projects and on the status quo and performance of the Bank and Bank subsidiaries. The Supervisory Board adopted the official estimates for fiscal year 2008 jointly determined by the Supervisory and Managing Boards in view of strategic planning, passing the necessary resolutions accordingly. The Supervisory Board examined and approved transactions submitted by the Managing Board requiring Supervisory Board approval by virtue of applicable regulations and the Bank’s articles of association and rules of procedure. The Supervisory Board oriented its activity around the recommendations outlined in the Corporate Governance Code.
The 2008 financial statements and management report were audited by PwC INTER-TREUHAND GmbH Wirtschaftsprüfungs- und Steuerberatungsgesellschaft, Vienna, the Bank’s auditor appointed by shareholder resolution. The unqualified audit opinion indicates that the financial statements and management report are in compliance with applicable regulations. The Supervisory Board will adopt the relevant formal resolutions upon receiving and carefully reviewing the written audit reports.
Bregenz, March 2009
Chairman Supervisory BoardKurt Rupp
We audited the consolidated financial statements of Vorarlberger Landes- und Hypothekenbank Aktiengesellschaft, Bregenz, for the fiscal year 1 January to 31 December 2008, reviewing Group bookkeeping. Group bookkeeping is the responsibility of Company management, as well as the preparation and content of these consolidated financial statements in accordance with International Financial Reporting Standards as applied in the European Union, and with the supplementary provisions of Section 59a of the Austrian Banking Act in conjunction with Section 245a of the Austrian Corporations Code, and of the Group management report in accordance with Austrian Commercial Code. Our responsibility is to express an opinion on these consolidated financial statements based on our audit, and as to whether the Group management report accords with the consolidated financial statements.
We conducted the audit in accordance with applicable regulations and generally accepted auditing standards in Austria. These standards require that we plan and perform audits in such fashion as to reasonably ensure that the consolidated financial statements are free of material misstatements, allowing assessment of whether the Group management report accords with the consolidated financial statements. In audit planning we drew upon knowledge of the Group’s operations and its economic and legal environment, as well as the expectations about potential errors. The audit included random checking of documentation supporting figures and other data stated in the bookkeeping and the financial statements. The audit also included assessing the accounting principles applied and material estimates made by directors and officers, as well as evaluating the overall presentation of the consolidated financial statements. We believe the audit conducted provides a reasonably sound basis for the opinion given.
No objections were noted in the course of the audit. Based on the audit findings, in our opinion the consolidated financial statements are consistent with applicable regulations and the supplementary provisions in the articles of association, presenting a true and fair view of the Group’s assets and liabilities and financial condition as at 31 December 2008, and of the Group’s results of operations and cash flows for the fiscal year from 1 January to 31 December 2008 in accordance with International Financial Reporting Standards/IFRS as applicable in the European Union and Section 59a of the Austrian Banking Act in conjunction with Section 245a of Austrian Corporations Code. The Group management report accords with the consolidated financial statements.
Vienna, 20 March 2009
PwC INTER-TREUHAND GmbHWirtschaftsprüfungs- undSteuerberatungsgesellschaft
signed:Dorotea-E. RebmannAuditor
Audit opinionManaging Board declaration
Report of the Supervisory Board
Audit opinion
FIN
AN
CIA
L S
TAT
EM
EN
TS
(IF
RS
)
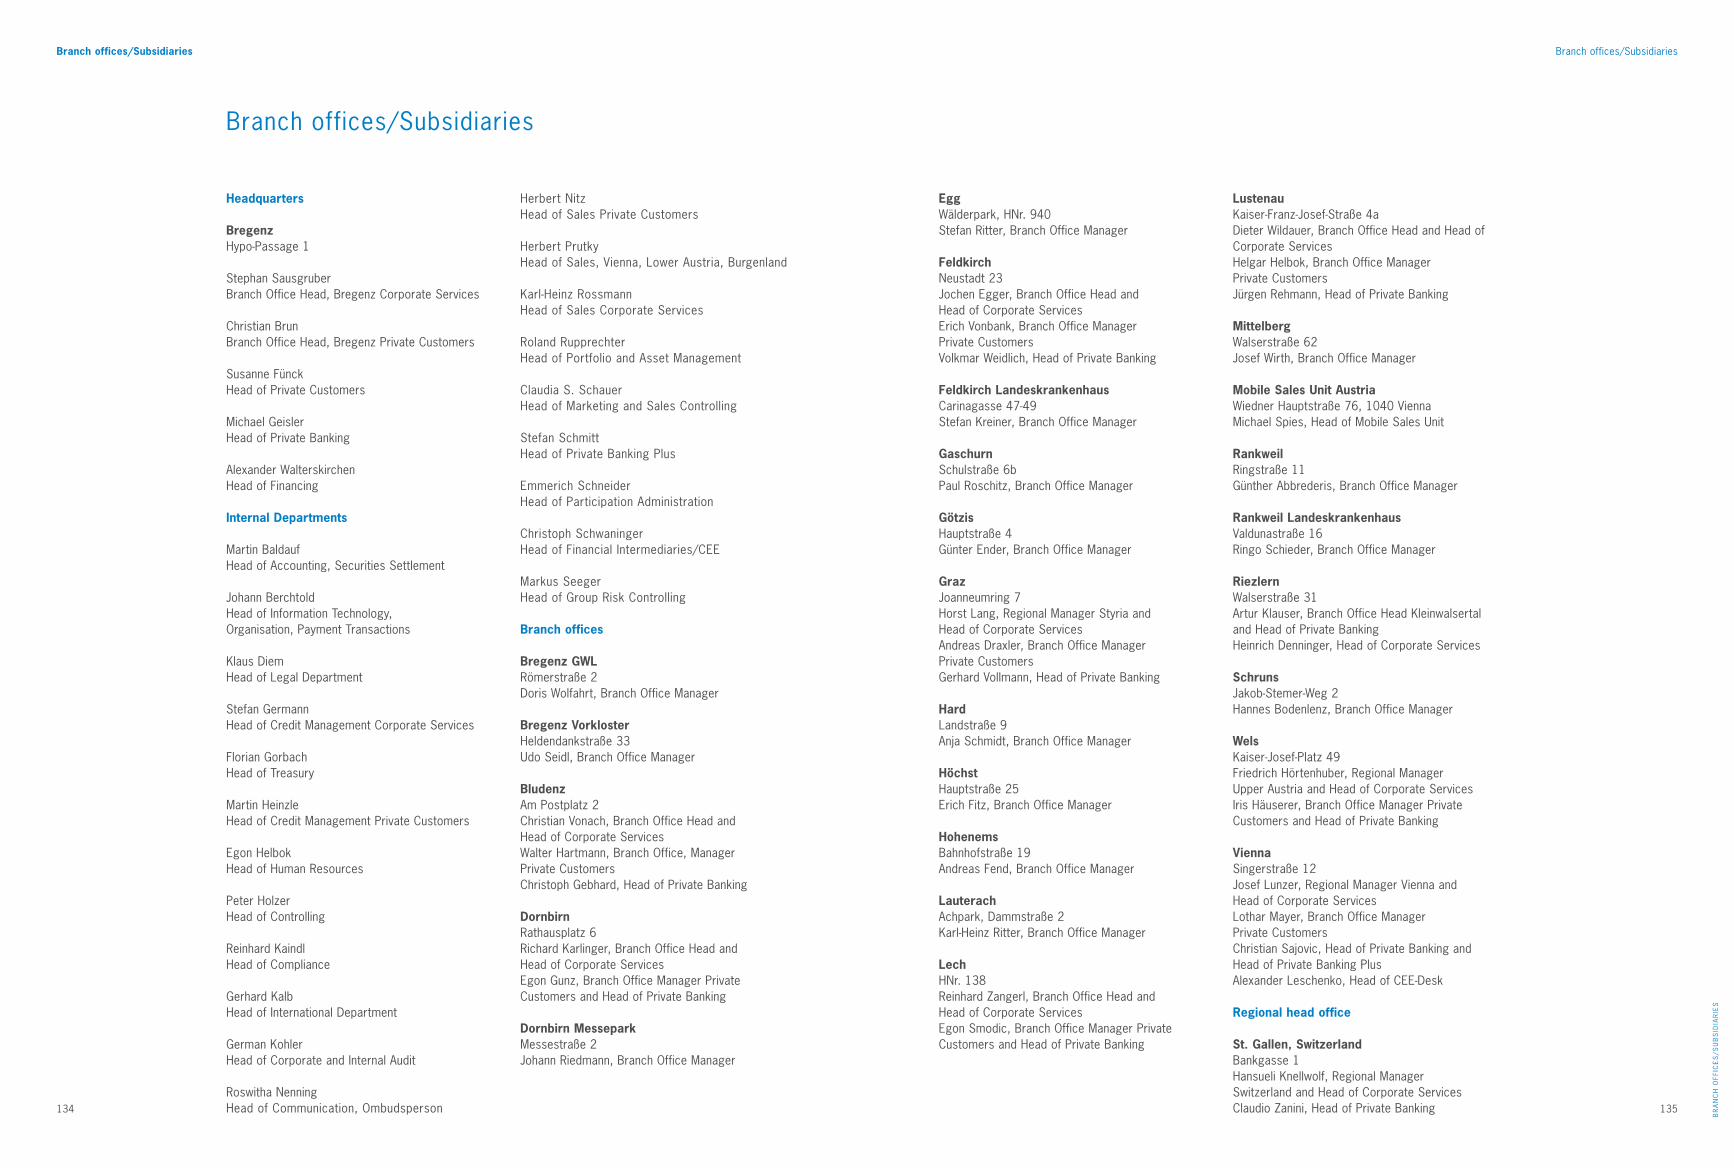
134 135
BR
AN
CH
OFF
ICE
S/S
UB
SID
IAR
IES
Branch offices/Subsidiaries
EggWälderpark, HNr. 940Stefan Ritter, Branch Office Manager
FeldkirchNeustadt 23Jochen Egger, Branch Office Head and Head of Corporate ServicesErich Vonbank, Branch Office Manager Private CustomersVolkmar Weidlich, Head of Private Banking
Feldkirch LandeskrankenhausCarinagasse 47-49Stefan Kreiner, Branch Office Manager
GaschurnSchulstraße 6bPaul Roschitz, Branch Office Manager
GötzisHauptstraße 4Günter Ender, Branch Office Manager
GrazJoanneumring 7Horst Lang, Regional Manager Styria and Head of Corporate ServicesAndreas Draxler, Branch Office Manager Private CustomersGerhard Vollmann, Head of Private Banking
HardLandstraße 9Anja Schmidt, Branch Office Manager
HöchstHauptstraße 25Erich Fitz, Branch Office Manager
HohenemsBahnhofstraße 19Andreas Fend, Branch Office Manager
LauterachAchpark, Dammstraße 2Karl-Heinz Ritter, Branch Office Manager
LechHNr. 138Reinhard Zangerl, Branch Office Head and Head of Corporate ServicesEgon Smodic, Branch Office Manager Private Customers and Head of Private Banking
LustenauKaiser-Franz-Josef-Straße 4aDieter Wildauer, Branch Office Head and Head of Corporate ServicesHelgar Helbok, Branch Office Manager Private CustomersJürgen Rehmann, Head of Private Banking
MittelbergWalserstraße 62Josef Wirth, Branch Office Manager
Mobile Sales Unit AustriaWiedner Hauptstraße 76, 1040 ViennaMichael Spies, Head of Mobile Sales Unit
RankweilRingstraße 11Günther Abbrederis, Branch Office Manager
Rankweil LandeskrankenhausValdunastraße 16Ringo Schieder, Branch Office Manager
RiezlernWalserstraße 31Artur Klauser, Branch Office Head Kleinwalsertal and Head of Private BankingHeinrich Denninger, Head of Corporate Services
SchrunsJakob-Stemer-Weg 2Hannes Bodenlenz, Branch Office Manager
WelsKaiser-Josef-Platz 49Friedrich Hörtenhuber, Regional Manager Upper Austria and Head of Corporate ServicesIris Häuserer, Branch Office Manager Private Customers and Head of Private Banking
ViennaSingerstraße 12Josef Lunzer, Regional Manager Vienna and Head of Corporate ServicesLothar Mayer, Branch Office Manager Private Customers Christian Sajovic, Head of Private Banking and Head of Private Banking PlusAlexander Leschenko, Head of CEE-Desk
Regional head office
St. Gallen, SwitzerlandBankgasse 1Hansueli Knellwolf, Regional Manager Switzerland and Head of Corporate ServicesClaudio Zanini, Head of Private Banking
Headquarters
BregenzHypo-Passage 1
Stephan SausgruberBranch Office Head, Bregenz Corporate Services
Christian BrunBranch Office Head, Bregenz Private Customers
Susanne FünckHead of Private Customers
Michael GeislerHead of Private Banking
Alexander WalterskirchenHead of Financing
Internal Departments
Martin BaldaufHead of Accounting, Securities Settlement
Johann BerchtoldHead of Information Technology, Organisation, Payment Transactions
Klaus DiemHead of Legal Department
Stefan GermannHead of Credit Management Corporate Services
Florian GorbachHead of Treasury
Martin HeinzleHead of Credit Management Private Customers
Egon HelbokHead of Human Resources
Peter HolzerHead of Controlling
Reinhard KaindlHead of Compliance
Gerhard KalbHead of International Department
German KohlerHead of Corporate and Internal Audit
Roswitha NenningHead of Communication, Ombudsperson
Herbert NitzHead of Sales Private Customers
Herbert PrutkyHead of Sales, Vienna, Lower Austria, Burgenland
Karl-Heinz RossmannHead of Sales Corporate Services
Roland RupprechterHead of Portfolio and Asset Management
Claudia S. SchauerHead of Marketing and Sales Controlling
Stefan SchmittHead of Private Banking Plus
Emmerich SchneiderHead of Participation Administration
Christoph SchwaningerHead of Financial Intermediaries/CEE
Markus SeegerHead of Group Risk Controlling
Branch offices
Bregenz GWLRömerstraße 2Doris Wolfahrt, Branch Office Manager
Bregenz VorklosterHeldendankstraße 33Udo Seidl, Branch Office Manager
BludenzAm Postplatz 2Christian Vonach, Branch Office Head and Head of Corporate ServicesWalter Hartmann, Branch Office, Manager Private Customers Christoph Gebhard, Head of Private Banking
DornbirnRathausplatz 6Richard Karlinger, Branch Office Head and Head of Corporate ServicesEgon Gunz, Branch Office Manager Private Customers and Head of Private Banking
Dornbirn MesseparkMessestraße 2Johann Riedmann, Branch Office Manager
Branch offices/Subsidiaries
Branch offices/Subsidiaries
136
Branch offices/Subsidiaries
Subsidiaries in Italy
Hypo Vorarlberg Leasing AGBozenGalileo-Galilei-Straße 10/BMichael Meyer, Delegate Adminstrative Board
Hypo Vorarlberg GmbHBozenGalileo-Galilei-Straße 10/BAlexander Ploner, Manager
Subsidiary bank
Hypo Investment Bank (Liechtenstein) AGGamprin-Bendern, LiechtensteinSchaaner Strasse 27Andreas Insam, CEO, Chairman Managing BoardGerhard Lackinger, Member Managing Board
Ad Global Investment Performance Standards (GIPS®) on page 33:
The centralised portfolio management of Vorarlberger Landes-und Hypothekenbank Aktiengesellschaft having registeredoffices in Bregenz qualifies as a firm within the meaning of theGlobal Investment Performance Standards (GIPS®). The firmcomprises all asset management mandates of private andinstitutional customers that are managed in the context of thebank’s centralised investment process. It does not includedecentralised organisational units and other units of the groupthat operate independently. The firm is in compilance with theGIPS®. For a list of all composites along with a detaileddescription, please contact Vorarlberger Landes- und Hypothekenbank Aktiengesellschaft at: T +43 (0) 50 414-1521 or e-mail us at [email protected].
Subsidiaries in Austria
HYPO EQUITY Management AGBregenzBahnhofstraße 14Harald Pöttinger, Member of the Managing BoardOmer Rehman, Member of the Managing Board
Hypo Immobilien GmbHDornbirnPoststraße 11Wolfgang Bösch, Managing DirectorEmmerich Schneider, Managing Director
Hypo Informatikgesellschaft m.b.H.BregenzSt.-Anna-Straße 1Johann Berchtold, Managing DirectorEgon Helbok, Managing Director
Hypo SüdLeasing GmbHDornbirnPoststraße 11Nora Frischherz, Managing DirectorPeter Scholz, Managing Director
Hypo Versicherungsmakler GmbHDornbirnPoststraße 11Manfred Bösch, Managing Director and Management SpokesmanChristoph Brunner, Managing Director
LD-Leasing GmbHDornbirnPoststraße 11Nora Frischherz, Managing DirectorDietmar Grießer, Managing Director


