Forecasting Tourist Arrivals and Supply and Demand Gap ...
32
Forecasting Tourist Arrivals and Supply and Demand Gap Analysis for Hotel Sector in Addis Ababa, Ethiopia Samuel Liben 1 Matiwos Ensermu 2 Abstract This paper aims to forecast the long term behavior of tourist arrivals and analyze the gap between supply and demand for the hotel/accommodation sector of the city of Addis Ababa. It also intends to provide vital information in regards to the sparse knowledge in the subject of forecasting tourist arrivals in Ethiopia. The research is largely conducted based on the secondary data obtained from the Ministry of Culture and Tourism (MOCT) in the tenth edition of the Policy, Planning, Evaluation and Monitoring Directorate’s bulletin publication on Tourism Statistics (2009-2012),(MOCT, 2013). Theoretical assessments of the requirement of a forecasting process and a critical analysis of available forecasting methods have been carried out to fit the profile of long term tourist arrivals. Based on the assessments and analysis, the Box-Jenkins process was selected. Furthermore, the gap analysis is done using the Funneling Technique. The method has also determined that the annual tourist arrivals for the country in the year 2015 will be 798,157 and for the year of 2020, it is expected to be 1,130,971 and finally in 2025, the annual tourist arrivals are expected to climb to 1,463,743. The use of the Funneling Technique in combination with the Stepped Function Intervention Model establishes a different case scenario (positive, negative and starched intervention) which has then been studied to foresee the relationship between supply and demand of the accommodation sector under different circumstances. Keywords: Forecasting, tourist arrival, X-12-ARIMA, Supply, demand. 1 MBA, Chief Engineer, Hilton Addis Ababa, e: mail: [email protected]; [email protected] 2 PhD, Associate Professor, Addis Ababa University, College of Business and Economics , email: [email protected]
Transcript of Forecasting Tourist Arrivals and Supply and Demand Gap ...

Forecasting Tourist Arrivals and Supply and Demand GapAnalysis for Hotel Sector in Addis Ababa, Ethiopia
Samuel Liben1 Matiwos Ensermu2
AbstractThis paper aims to forecast the long term behavior of tourist arrivals andanalyze the gap between supply and demand for the hotel/accommodationsector of the city of Addis Ababa. It also intends to provide vital informationin regards to the sparse knowledge in the subject of forecasting tourist arrivalsin Ethiopia. The research is largely conducted based on the secondary dataobtained from the Ministry of Culture and Tourism (MOCT) in the tenthedition of the Policy, Planning, Evaluation and Monitoring Directorate’sbulletin publication on Tourism Statistics (2009-2012),(MOCT, 2013).Theoretical assessments of the requirement of a forecasting process and acritical analysis of available forecasting methods have been carried out to fitthe profile of long term tourist arrivals. Based on the assessments and analysis,the Box-Jenkins process was selected. Furthermore, the gap analysis is doneusing the Funneling Technique. The method has also determined that theannual tourist arrivals for the country in the year 2015 will be 798,157 and forthe year of 2020, it is expected to be 1,130,971 and finally in 2025, the annualtourist arrivals are expected to climb to 1,463,743. The use of the FunnelingTechnique in combination with the Stepped Function Intervention Modelestablishes a different case scenario (positive, negative and starchedintervention) which has then been studied to foresee the relationship betweensupply and demand of the accommodation sector under differentcircumstances.
Keywords: Forecasting, tourist arrival, X-12-ARIMA, Supply, demand.
1MBA, Chief Engineer, Hilton Addis Ababa, e: mail: [email protected];[email protected], Associate Professor, Addis Ababa University, College of Business and Economics ,email: [email protected]
Aklilu
Typewritten text
http://dx.doi.org/10.4314/ejbe.v5i2.5

Forecasting Tourist Arrivals and Supply and Demand Gap Analysis
EJBE Vol. 5 No. 2/2015 Page 270
1. Introduction
Tourism is an economic activity of primary value and importance for manycountries. It is increasingly being recognized as a valued mechanism for jobcreation, economic development and poverty reduction. As a result, it is beingpromoted as an important source of economic growth especially in developingcountries. Over the past decades, tourism has experienced a continuedexpansion and diversification, hence becoming one of the largest and rapidlygrowing economic sectors in the world (UNTWO, 2013). UNTWO’spublication on tourism, towards 2030(UNWTO, 2012), shows that tourismoffers a great potential for further expansion in coming decades. Emerging aswell as established destinations can benefit from this opportunity, provided thatthey have adequate conditions and policies with regards to businessenvironment, infrastructure, facilitation, marketing and human resources.Christie and Crompton in their paper have indicted that “The quality ofAfrica’s resource endowment for tourism is exceptional, but most countrieshave only barely developed their tourism potential.” (Christie & Crompton,2001). The continent receives about 5% of all international travelers andtourism receipts (UNTWO, 2012), but tourism is ‘significant’ (>2% of GDPand >5% of exports) in about half of the countries found in Sub-Saharan Africa(SSA). Countries in Africa are now focusing on tourism as a source of growthand diversification. In 2013, Africa had attracted an additional 5% ofinternational tourists which corresponds to 3 million new arrivals. Over all, theregion received 56 million tourists which translate to 5% of the tourists in theworld. North Africa received more than 6% while Sub-Saharan Africa isestimated to have received 5% (UNTWO, 2014).Ethiopia is the site of some of the oldest human settlements in Africa.Recorded history in Ethiopia began around 1000 BC, in the time of KingSolomon and the Queen of Sheba. However, recently discoveries indicate theexistence of a rich prehistory. Evidence of Ethiopia’s culture and history can befound in its ancient monuments, cities, and prehistoric sites while its intangibleculture is reflected in the work of local architects, musicians, writers, artisansand craftsmen (Christie & Crompton, 2001). The country has abundantheritage and tourism resources for which it has been globally highly ranked atthe 38th position, at par with Egypt which is well known globally for itspredominantly heritage based tourism resources, including the majesticpyramids. Despite the high ranking of both destinations in 2008, Egypt has hadmore arrivals than Ethiopia. For instance, there were 12.2 million internationaltourist arrivals in Egypt compared to the 330,000 in Ethiopia (UNTWO, 2012).

Forecasting Tourist Arrivals and Supply and Demand Gap Analysis
EJBE Vol. 5 No. 2/2015 Page 271
Although other factors could explain the difference in arrivals, the deductionalone suggests a great potential for heritage tourism development in Ethiopia.
1.1 Background: Ethiopian Tourism Sector Performance
Ethiopia’s tourism sector is surely growing from the low base of a minimal 1%share of Africa’s tourism market, but it continues to underperform despite itshidden potential with just a total of 596,341 tourist arrivals in 2012 (WBG &MOCT 2012). Despite economic imbalances, such as the high inflation inprevious years and limited access to financing in the private sector, Ethiopia’stourism sector has been showing a positive trend and a steady growth intourism arrivals and receipts (WBG & MOCT, 2012). The industry hasemerged as one of the leading sectors that have the potential of driving theEthiopian economy. It is now the third main source of foreign exchangeearnings in Ethiopia (International Visitor’s Survey, MOCT, 2013). Ethiopia’sNational Growth and Transformation Plan (GTP), active from 2010 to 2015,has set ambitious goals for the tourism sector. Such goals include the increaseof current tourism arrivals to 1 million and a twelve fold increase in tourists’expenditures from 250 million US$ in 2010 to 3 billion US$ by 2015.However, the target seems a bit illusive to be realized within the set timeperiod. The current government sees the sector as a priority and is in theprocess of revising the overall strategic plan. It has also established a newinstitution called Ethiopian Tourist Organization fully dedicated to oversee andcoordinate the sector’s activity.Ethiopia’s comparative advantage as a tourist destination is based on offering asafe, unspoiled, and a relatively unexplored ‘Africa in one country’. WithAddis Ababa serving as a diplomatic capital and a regional hub for air transportwhile the country itself offers attractive complementarities with neighboringdestinations that possess marketability such as Kenya and Tanzania (WBG &MOCT ;2012).
1.2 Problem Statement
The main problem to be addressed here revolves around the lack ofinformation regarding the projection of future tourist (visitor) arrivals. In thecurrent situation, it is difficult to have an idea or an estimate of arrivals for thisyear or the year after, neither there is an idea about the expected arrivals for thenext five years. What is available thus far is the total number of arrivals frompast years. However, such information, at best, is historic. Data of this kind canonly provide limited insight. It does not determine the expected volume of

Forecasting Tourist Arrivals and Supply and Demand Gap Analysis
EJBE Vol. 5 No. 2/2015 Page 272
arrivals for a future period. This information can only show the trend of thepresent situation and is unable to provide the necessary level of detail fordecision making on investments in destination infrastructure which requires along term financial commitment. Furthermore, it is also less than sufficient forpolicymaking.Conflicting arguments and recommendation exist regarding supply anddemand gaps. For example, a case study for a major international hotel chainindicates that it is challenging to get enough information on the sector, butbased on what is available, they have concluded that there is an excess supplyof rooms in Addis Ababa. Whereas other reports claim otherwise, the secondopinion argues that there is a shortage of hotel rooms. MOCT(2009),Gobena&Gudeta (2013) report of multi-link consult for long stay atMarriott Apartment Hotel set up in Addis Ababa.There is also ample evidence in the city that points to investors looking forhotel development sites. This shows that investors believe that the market hasbusiness potential. Significant amounts of resources are invested based onassumptions or personal opinions with a less than satisfactory probing of themarket situation.
1.3 Research Question
The basic research questions are: ‘What will be the expected amount of touristarrivals for the country as opposed to the city of Addis Ababa for the next fiveto ten years?’ and ‘What is the supply and demand relationship of theaccommodation sector in Addis Ababa?’The objectives are:
To study and forecast visitors arrival (Tourist Arrival; TA) to the Cityof Addis Ababa.
Since Addis Ababa is the main hub of the inbound & out bound travel,the forecast could also hold for the country. Therefore the forecast canprovide or fill the vital information gap for tourism especially for thehospitality sector in the country by providing Tourist Arrival (TA), forlonger period.
To predict long-term demand for tourism that will be critical input forpart of the investment project appraisals for tourism relatedinfrastructure such as hotels, roads, air ports.
To make accurate forecasts of demand in the tourism sector of theeconomy which will help policy makers in formulating andimplementing appropriate medium to long term policy and strategy.

Forecasting Tourist Arrivals and Supply and Demand Gap Analysis
EJBE Vol. 5 No. 2/2015 Page 273
Based on the long range forecast analysis, to find out the trend ofdemand for hotel rooms in Addis Ababa.
Based on the demand analysis to find out the gap between the supply &demand for hotel rooms in Addis Ababa
2. Review of Related Literature
2.1 Overview of International Tourism
The United Nations World Tourism Organization (UNWTO) on its update ofthe long term outlook, Tourism Towards 2030 has indicated the future tourismtrends. Growth is reported at a moderate pace in comparison to the previousestimate; it will slow down from 4.2% per year (1980-2000) to 3.3% per year(2010-2030). The growth represents some 43 million more international touristarrivals every year, reaching a total of 1.8 billion arrivals by 2030.At the sametime, UNWTO also announced that the total export earnings generated byinternational tourism in 2013 was 1.4 trillion US$. Receipts earned bydestinations from international tourists grew by 5% to reach 1159 billion US$while an additional 218 billion US$ was earned by international passengertransport. International tourism, including travel and transport, accounts for29% of the world’s Export of service and 6% of the overall export of goodsand services.
Fig 2-1: International Tourist Arrival. Source: UNTWO, 2014.
0
200
400
600
800
1000
1200
1990 1995 2001 2005 2010 2011 2012 2013
Tour
ist A
rriv
al in
Mill
ions
International Tourist Arrival
World
Europe
Asia and the Pacific
Americas
Africa
Subsaharan Africa

Forecasting Tourist Arrivals and Supply and Demand Gap Analysis
EJBE Vol. 5 No. 2/2015 Page 274
Europe is the main tourist generating country in terms of population; Asia,Pacific, America, Middle East and Africa follow suit. On the other hand,Europe still has the highest inbound market share. However, the market sharefor Europe and America show a declining trend while other regions like Asiaand Pacific grow faster (UNTWO, 2012). With regards to long term forecast,UNTWO’s Tourism Highlight 2014 has reconfirmed the earlier long termforecast on Tourism Towards 2030 by upholding the claim that theinternational tourist arrival is expected to increase by 3.3% per year. It alsoindicates that from 2010 to 2030, arrivals in emerging destinations areexpected to increase by 4.4% each year with an increase of twice the rate forthose with advanced economies (+2.2% a year). The market share of emergingeconomies increased from 30% in 1980 to 47% in 2013 and is expected toreach 57% by 2030, an equivalent to over 1 billion international tourist arrivals(UNTWO, 2014). UNTWO revised the growth of international tourist arrivalsfor 2014 to 4%-4.5% from the 3.3% indicated by Tourism towards 2030 andlater on confirmed that the international tourist arrivals for 2014 reached 1, 138million. This is 51 million more than the amount of visitors in 2013, a 4.7%increase. It also indicates that the forecast of the international tourist arrivals of2015 is expected to grow by 3% to 4% (UNTWO, 2015).
Fig 2-2: Tourist Arrival for Africa. Source: UNTWO, 2014.
2.2 Tourism in Africa
As cited by Idowk. K, “Tourism in the African continent has been seen as ameans of enhancing economic growth and development (Kester, 2003) as well

Forecasting Tourist Arrivals and Supply and Demand Gap Analysis
EJBE Vol. 5 No. 2/2015 Page 275
as launching the image of the continent to the outside world. African countrieshave started to tap the potential that is embedded in tourism and hospitalities.According to Kester, tourism has the potential to contribute significantly toeconomic growth and development in Africa (2003). Naude and Saaymanopined that Africa’s cultural and natural resource endowments are such that itought to be benefiting largely from tourism (2004).”Christie and Cromptonbelieve that Africa has “exceptional” tourism potentials and that it isincreasingly contributing to the continent’s gross domestic products (GDP) andexports (Christie & Crompton, 2001).
2.3 Ethiopia’s Tourism Attraction
Ethiopia is well known for its diverse historical, cultural, and naturalattractions. Historically, Ethiopia is quite ancient, having three thousand yearsworth of history. The great stales of Axum prove that the Axumite Empire wasone of the greatest civilizations of the ancient world. The Rock-hewn churchesof Lalibela show the religious civilization and devotion of the late middle ages.The majestic 17th century castles of Gonder hint at the historic wealth of thecountry. Culturally, Ethiopia is teeming with diverse ethnic groups which havetheir own religion, language, culture, and tradition. With regards to the gifts ofnature, Ethiopia offers breathtaking sceneries; embracing all kinds of relief,from the tops of the rugged Semien Mountains to the depths of the DanakilDepression which is more than 100 meters below sea level. In addition to that,Ethiopia is home to the fourth largest zone of biodiversity; it houses numerousunique floras more than any country in Africa. Among the abundant species offauna and flora, 31 mammals, 30 amphibians, 17 birds, 14 reptiles, 4 fish andabout 1000 plant species are endemic to Ethiopia.It is probably the only country in Africa that hosts nine world heritage sites.The most prominent site being the Ethiopian Rift Valley; it is the site of manyfossil findings that attest to it being the ‘cradle of mankind’ where humansstarted to walk upright. On top of all of that, its people are very hospitable andtheir cultures are diversified, a combination that is very suitable for tourismdevelopment. It is a place where nature, culture, and history merge to form atimeless appeal. (MOCT, Ethiopia: A Tourist Paradise).
2.4 Importance of Forecasting for the Tourism Industry
Forecasting tourism demand is important for tourism planning at all levels inthe tourism industry from the government to a single tourist business(Cuhadar.M, 2014). Effective forecasting provides credible and timely

Forecasting Tourist Arrivals and Supply and Demand Gap Analysis
EJBE Vol. 5 No. 2/2015 Page 276
information for tourism managers to balance the market demand with thetourism supply.The value of forecasting lies in its ability to reduce the losscaused by disparities between demand and supply.In order to providesatisfactory services to tourists, destinations need to acquire reliable forecastsof future demand. Accurate forcast of tourism demand are paramount to ensureavailability of such service whereas lack of knowledge on tourist arrivals maylead to missed opportunities or an overestimation of tourism demand (Asaayman& M.Saayman, 2013). Overestimating tourism demand may, forinstance, lead to excessive investment. Thus, forecasting is an integral part ofthe overall strategic planning process in the tourism industry.Forecasting is also highly important for the tourism industry which needsaccurate predictions of demand so that it can plan effectively from season toseason, year to year.This, in turn, improves the efficiency of businesses,increase profits and strengthens economies.
2.5 Forecasting Methods Selection
UNWTO’s report indicates that over the past decades tourism has experiencedcontinuous expansion and diversification. This growth and expansion hasgenerated an interest in tourism forecasting. Accordingly, a number of articleswere published on tourism demand forecasting. Armstrong has published somegeneral guidelines to select forecasting methods. These guidelines comprisemany factors some of which are: convenience, market popularity, structuredjudgment, statistical criteria, relative track records and guidelines from priorresearch (Armstrong, 2001). Some checklists for selecting the best forecastingmethod in a given situation are also recommended as guidelines for selectingforecasting methods (Wang etal, 2006). Fretchling has discussed a modelselection procedure; he proposed preliminary selection criteria to narrow thelist of available methods down to a few key approaches (Fretchling .D.G2001).From both selecting procedures, Armstrong as well as Fretchling, it is possibleto deduct that for a time series data such as tourist arrivals, the recommendedforecasting method is the Quantitative method specifically the Extrapolationmethod. Time series forecasting are also called the extrapolative methods,because they extrapolate from the previous data in the series to predict futuretrends. These models attempt to identify the patterns in the time series thatcause shifts in the forecast variable and to see how they interact. The advantageof such models is that they are relatively simple to estimate, requiring no morethan one data series (Peng Bo, 2012).

Forecasting Tourist Arrivals and Supply and Demand Gap Analysis
EJBE Vol. 5 No. 2/2015 Page 277
However, Extrapolation by itself is no single method it is a comprehensivename for different methods which are applicable to time series. It covers:Naïve, Single Moving Average, Single Exponential Smoothing, DoubleExponential Smoothing and Autoregressive.Time Series Methods
No.
ForecastingMethod
Equation Legend
1 Naïve Ft = At-1………..……………….(1)
Ft = At-1*[1+ [ ( ) ] …(2)Ft = …….…………………(3)
Where:F = forecast value
A = actual valuet = some time periodm = number of periods ina year
2 SimplemovingAverage(SMA)
Ft = (At-1 + At-2 + …At-n) /n Where:F = forecast valueA = actual valuet = some time period
n = number of past timeperiods
3 SingleExponentialsmoothing(SES)
Ft = α × At-1 + (1 – α) × F t-1 Where:F = forecast value
A = actual valuet = some time period
α = smoothing constantbetween 0 and 1
4 Doubleexponentialsmoothing(Brown`sDES)
Y t = αAt-1 + (1-α) Yt-1
Y't= αYt-1 + (1-α) Y’
t-1
Ct= Y t + (Y t – Y’t)
T t= [(1-α)/α]*(Y t -Y’t)
F t + n= Ct + n*T t
Where ;Ft=Forecast at time t:
At = actual value at time t;Y t=SES seriesat time t;Y‘t=DES series at time t;Ct=the intercept;Tt=the slope coefficient;n=the number of forecastperiod;
Naïve

Forecasting Tourist Arrivals and Supply and Demand Gap Analysis
EJBE Vol. 5 No. 2/2015 Page 278
No-change models are used very frequently in tourism demand forecasting and,surprisingly, they often give the most accurate calculations. (UNWTO& ETC,2008)The Naive 1 (or no change) model is the simplest forecasting method for theperiod t is equal to the actual value in the last period (t-1).The Naive 2 modelis version of Naïve which is widely used but a simple model employed whenthere is a continuous trend present in the data. The forecast value for period t isobtained by multiplying the demand over period t-1 by the growth ratebetween the period t-2 and the current period (t- 1). It assumes that growthrates remain unchanged from one time period to the next. (UNWTO & ETC,2008)
Simple Moving Average (SMA)The SMA method uses a simple arithmetic mean to estimate central tendency(UNWTO). Moving average provides a simple method for smoothing the “pasthistory of data”. The idea behind moving average is that observations whichare nearby in time are also likely to be close in value. (Makridakisetal, 1998)The model allows the past values of a variable to determine the forecast valueswith equal weights assigned to the former. The number of lagged observationsincluded in the model determines its responsiveness. The more included are thelagged values, the smoother the forecasts become. If a time series shows widevariations around a trend, including more lagged observations in the SMAmodel will help pick up the trend. However, its main limitation is that it givesequal weight to the demand in each of the most recent periods; it will notprovide good forecast if data has a trend and a seasonal component(Buffa&Sarin, 2011). This may not be realistic, as more recent lagged valuestend to have a much bigger impact on the current values of a time series.Therefore, the SMA method normally generates more accurate forecasts wherethe time series is less volatile.
Intermediate Extrapolation methodsSingle Exponential smoothing (SES)The single exponential smoothing model is applicable when there is no trend orseasonality in the data (Buffa&Sarin, 2011). However, when the trend andseasonality component is absent what remains is the horizontal component oralternatively, the base. Therefore, the key objective in the exponentialsmoothing model is to estimate the base and use that estimate for casting futuredemand (Buffa&Sarin, 2011). In the SES model, the forecast for period t isequal to the forecast for period (t-1) plus a smoothing constant multiplied bythe forecasting error incurred in period (t-1). This is a process of determining

Forecasting Tourist Arrivals and Supply and Demand Gap Analysis
EJBE Vol. 5 No. 2/2015 Page 279
by taking forecast for the previous period and adjusts it using the forecast error.“The new forecast is simply the old forecast plus an adjustment for the errorthat occurred in the last forecast. Here, the error of the past forecast is used tocorrect the next forecast in the direction opposite to that of the error”(Makridakisetal, 1998).
Double exponential smoothing (Brown’s DES)A number of models have been proposed for double exponentialsmoothing.However, the simplest one was Brown’s DES. Brown’s model wasdeveloped to deal with time series that has a linear trend over time (FretchlingD.C, 2001). If there is no trend, it reduces to the SES (Peng Bo, 2012). Theadvantage of DES is that it can capture linear trends up or down and forecastseveral periods ahead. However, it cannot track non-linear trends. It fails tosimulate stepped series well and cannot deal effectively with seasonality(Fretchling D.C, 2001),(UNWTO & ETC, 2008).When it comes to forecasting tourist arrivals, simple and intermediateextrapolation methods have their own drawbacks/limitations. They arecommonly used for short term forecasting; when there is no trend and noseasonality, they are used as a control method when assessing whether otherforecasting methods are worth using (Buffa&Sarin, 2011), (UNWTO & ETC,2008), (Fretchling D.C, 2001). In light of the limitation on simple (basic) aswell as intermediate extrapolative methods, the circumstances lead to the useof an advanced extrapolative method i.e. the Box–Jenkins or Causal approach.However, since the main interest here is to select a model for tourism dataanalysis, the data type is a univariant time series. The appropriate method to beused here is the Box-Jenkins approach. The Box-Jenkins approach by itself is acombination of two forecasting methods which are Auto Regression andMoving Average. Time series models have been widely used for tourismdemand forecasting in the past four decades with the predominance of theintegrated autoregressive moving-average models (ARIMAs) proposed by Boxand Jenkins (1970). Different versions of the ARIMA models have beenapplied in over Sixty percent of the post-2000 studies that utilized the timeseries forecasting techniques (Song & Li, 2010).
2.6 Application Software for Box-Jenkins Methods
Standard computer packages like SAS, SPSS, TRAMO-SEATS (TS), X-12-ARIMA, and statistical packages are available for Box-Jenkins method. Thecomputer package used in this analysis is X-12-ARIMA which is the seasonaladjustment package. It has been one of the leading statistical packages

Forecasting Tourist Arrivals and Supply and Demand Gap Analysis
EJBE Vol. 5 No. 2/2015 Page 280
available for seasonal adjustment methods for use in official statistics in manycountries: United States, Canada, and Europe to state a few. The method isused by most of the leading national statistical institutes, national banks,academics and researchers across the world. X-12-ARIMA is developed by theUnited States (US) Bureau of the Census. The software is comprehensive, withmany options available for tailoring seasonal adjustments to each individualseries. It is made freely available by the US Bureau of the Census.
3. Research Methodology
Under this section, data presentation, preliminary analysis, model identificationand selection, methodology is used and output analysis is presented.
3.1 Data Source Presentation and Analysis
Data Source: The data source for this analysis is the Ministry of Culture andTourism (MOCT), Policy, Planning, Evaluation and Monitoring DirectoratePublication, Tenth Tourism Statistics Bulletin 2009-2012 (MOCT, 2013). Thedata used is Arrival of Tourists at the National Border by Month, from 2006 upto 2012.Source data presentation: the plot of the monthly tourist arrival (MTA)original series is presented here.
Fig 3.1: Original data series plot
The plot of the monthly tourist arrival (MTA) reveals important informationabout the data characteristics. There are periodic picks which are observedfrom time to time. The picks are observed at and around the beginning of each

Forecasting Tourist Arrivals and Supply and Demand Gap Analysis
EJBE Vol. 5 No. 2/2015 Page 281
year followed by a low season. Although it is not as big as the beginning, thereis also a rise in pick before and after midyear periods. This indicates that thereare periods which have a higher arrival rate than other periods within the yearwhich, in turn, gives an indication for the seasonal nature of the observation.The plot also shows a positively increasing behavior with time. This signifiesthe presence of a linear trend component or an increasing mean for the series.On the other hand, it is difficult to pinpoint the observed characteristics of theamplitude of the variation. It is not that clear if the series has increasingseasonal amplitude or it is relatively a constant one. But it is clear that theamplitude variation did not show consistent behavior. It is more of an erraticbehavior where as it shows a reasonable and similar periodic repeating patternwith an increasing trending component.
3.2 Model Identification and Selection
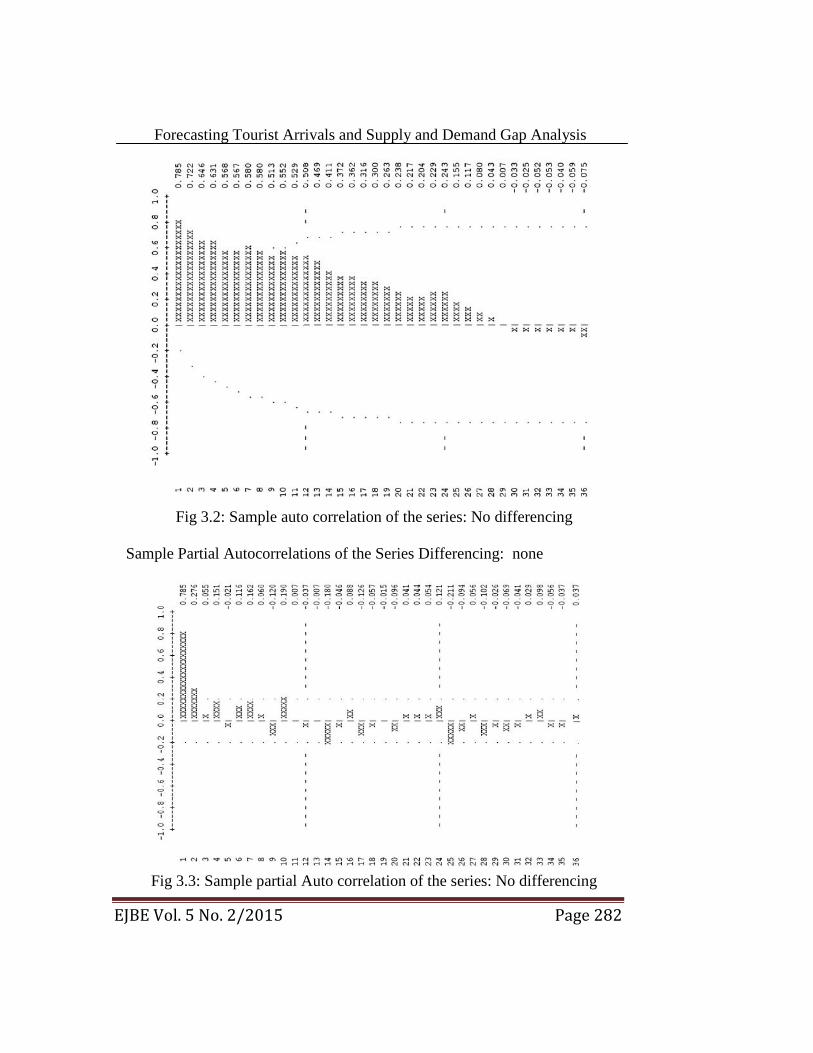
The first step in the analysis of the Box-Jenkins method is the use of the modelidentification procedure. The procedure involves plotting of the initial data.The source data is run to determine the appropriate model. The Box-Jenkinsprocedure requires the data to be stationary. This requires input data to beadjusted to form a stationary series, one whose value may vary more or lessuniformly about the fixed level. But before directly going to this step, oneneeds the answer to this question, “Does the data require being madestationary?” This can be answered by analyzing the plot of the data.The ACFand PACF plot of the series can give indications of whether it is necessary tochange or transform the data into a stationary series. If the initial data seriesdisplay neither trend nor seasonality and residual plot shows values within theconfidence interval. Then the process can be continued without any hindrance.Sample Autocorrelations of the Series Differencing: none
Forecasting Tourist Arrivals and Supply and Demand Gap Analysis
EJBE Vol. 5 No. 2/2015 Page 282
Fig 3.2: Sample auto correlation of the series: No differencing
Sample Partial Autocorrelations of the Series Differencing: none
Fig 3.3: Sample partial Auto correlation of the series: No differencing
Forecasting Tourist Arrivals and Supply and Demand Gap Analysis
EJBE Vol. 5 No. 2/2015 Page 282
Fig 3.2: Sample auto correlation of the series: No differencing
Sample Partial Autocorrelations of the Series Differencing: none
Fig 3.3: Sample partial Auto correlation of the series: No differencing
Forecasting Tourist Arrivals and Supply and Demand Gap Analysis
EJBE Vol. 5 No. 2/2015 Page 282
Fig 3.2: Sample auto correlation of the series: No differencing
Sample Partial Autocorrelations of the Series Differencing: none
Fig 3.3: Sample partial Auto correlation of the series: No differencing

Forecasting Tourist Arrivals and Supply and Demand Gap Analysis
EJBE Vol. 5 No. 2/2015 Page 283
The Auto Correlation Function (ACF) of the series shows a gradual decrease(decay) towards zero. The plot shows significance up to lag 8, although it is notmuch pronounced due to weaker signals, there is an indication that the gradualdecrease shows picks at seasonal lags around lag 12, 10, 11,12, 24.The Partial Auto Correlation Function (PACF) plot shows that there is visiblesignificance at lag 1 and 2 while the rest is within the range of boundaries forthe white noise criteria or not significant from zero. The significance on lagone (1) and lag two (2) may suggest the preferred model to be AR (2).Over all, the plot of the series has provided information about thecharacteristics of the series. The series has an increasing trend, showfluctuation in periods within a year which indicates seasonality, the ACFshows significance up to lag 8 and attenuates gradually towards zero.Therefore, it is possible to conclude that the series is not stationary;as a result,it needs to be differenced and/or transformed.
3.3 Models Selection
Model selection process starts with taking advantage of the auto selectionfeature of X-12-ARIMA. The program is allowed to run on Auto mode; it usesthe log transformation and selects ARIMA (311) (011). The plot for (311)(011) shows significance ACF at lag 4, 5 and 8. PACF shows significance at 4,5 and 12.All the p values show a value less than 0.05 which indicates the poorfit of the model to the data. Therefore, the selected model cannot beconsidered.From the pattern of behavioral investigation of the series for stationarity, it hasbeen observed that the contribution of the log transformation in making theseries stationary is not that visible while the seasonal differencing is critical.On the other hand, the auto model selection uses log transformation. In order torecheck the auto model selection option, the series is run by removing the logtransformation effect. That means auto model selection using differencingonly. However, results show the model selected is the same model (311) (011).It also shows similar p values which are less than 0.05; therefore, it cannot beconsidered as a suitable model. This prompts to check the manual modelselection procedure.In order to choose the most appropriate model, the manual selection process isused to generate an additional model option which will be compared with eachother to find the best model to be used for forecasting. The manual selectionprocess followed a structured system of investigation based on the principle ofparsimony. Each model is checked for fulfilling diagnostic requirements. The

Forecasting Tourist Arrivals and Supply and Demand Gap Analysis
EJBE Vol. 5 No. 2/2015 Page 284
models considered are based upon the observation of the series’ characteristicswhich exhibits strong seasonal component (011) from the earlier test.MODEL 1 - SARIMA (110) (011)12
The result for model (110) (011) shows no significance ACF, however, itsdiagnostic shows LBQ fail at lag 2, significance LBQ 3-4, significanceBPQ=3-4, significant PACF 2, AIC =1392.3906, AICC=1393.7031, P Value <0.05 or 5% at lag 1 and lag 2, as a result, the model is rejected based on thediagnostic result.MODEL 2 - SARIMA (211) (011)12
The plot of the series shows no significant ACF and PACF. All p values aregreater than 0.05 or 5%, AIC Value =1385.8193, AICC Value =1388.1419.This model qualified for consideration.Model 3 - SARIMA (111) (011)12
The plot of the series shows no significant ACF and PACF. All p values aregreater than 0.05 or 5%, AIC Value =1383.8612, AICC Value =1385.6389.Model is qualified for consideration.Model 4- SARIMA (011) (011)12
The plot of the series shows no significant ACF and PACF. All p values aregreater than 0.05 or 5%, AIC VALUE =1381.9061, AICC VALUE=1383.2186. Model is qualified for considerationMODEL 5 -SARIMA (210) (011)12
Diagnostic show LBQ and BPQ FAIL at lag 4, P value at lag 4 = 0.041 whichis less than 0.05 or 5%, AIC VALUE =1387.3385, AICC Value =1389.1162.Model rejected based on diagnostic result.Model 6- SARIMA (312) (011)12
The plot of the series shows no significant ACF and PACF. All p values aregreater than 0.05 or 5%, AIC Value =1385.8193, AICC Value =1388.1419,AAFCE (3yr) = 6.648. Model is qualified for consideration.Model 7 -SARIMA (212) (011)12
The plot of the series shows no significant ACF and PACF, all p values aregreater than 0.05 or 5%.for all df> 0, AIC Value =1387.3709, AICC value=1390.3217. Model is qualified for consideration.MODEL 8 -SARIMA (112) (011)12
The plot shows no significant ACF but it has significant PACF at lag 5,diagnostic show 2 LBQ fail at lag 5 and 6 significant BPQ=1 at lag 5, P valueat lag 5= 0.015,p values at lag 6= 0.046 which are less than the threshold valueof 0.05 or 5%, AIC Value =1395.0968, AICC Value =1396.8746. Model isrejected based on diagnostic result.Model 9-SARIMA (012) (011)12

Forecasting Tourist Arrivals and Supply and Demand Gap Analysis
EJBE Vol. 5 No. 2/2015 Page 285
The plot of the series show no significant ACF and PACF. All p values aregreater than 0.05 or 5%, AIC Value =1383.8648, AICC Value = 1385.6425.Model is qualified for consideration.The list of qualified models for consideration is: (211) (011), (111) (011),(011) (011), (312) (011), (212) (011), and (012)(011).
No. Model offorecasting
(X-12-ARIMA)
AIC AICC Average absolutepercentage % Error(AAPE, last 3 years)
1 (211) (011) 1385.8193 1388.1419 6.56
2 (111) (011) 1383.8612 1385.6389 6.52
3 (011) (011) 1381.9061 1383.2186 6.02
4 (312) (011) 1389.3701 1393.0368 6.64
5 (212) (011) 1387.3709 1390.3217 6.58
6 (012) (011) 1383.8648 1385.6425 5.98
Table 3.1: Qualified ARIMA Models
From the tabulation of the selection parameters, there are competing modelswhich can satisfy the combined parameters of lowest AIC andAAPE.However, the model which fulfills the selection criteria with the lowestAIC value of 1381.9061 among qualified models is (011) (011); it has thelowest AIC and AICC value but has slightly higher AAPE which is 6.02.Model (012) (011) has the lowest AAPE of 5.98 for the last 3 years but its AICis 1383.8646 which is higher than model (011) (011). However, the differencein AAPE values between the models (011) (011) and (012) (011) are not thatsignificant. It only shows a marginal difference of 0.04 which gives a winningedge for model (011) (011). The rest of the models (211) (011), (111) (011),(312) (011), and (212)(011) have a higher AIC value than the main frontrunner models, therefore, they are dropped. As a result, model (011) (011) isselected to be used as the model for the MTA series. For this reason, it is usedin the forecasting process.

Forecasting Tourist Arrivals and Supply and Demand Gap Analysis
EJBE Vol. 5 No. 2/2015 Page 286
Fig 3.4: ACF and PACF of the residual; Model (011) (011)12
3.4 Supply and Demand Gap
The methodology used to determine the supply and demand gap is thefunneling technique; it basically works by decomposing or breaking down thebulk arrival figure into its different elements. It starts with the lump sum arrivalfigures, identifying the city component from the overall arrival, and then itfurther looks into the family and friends visitor element from the city visitors,as this category of visitors are mostly composed of people who have familyand friends. They are not expected to look for accommodation facilities in thecity hotel establishments, however, some portion of this category of visitors isconsidered to use accommodation facilities. This provides the number ofvisitors who are looking for accommodation facilities. The final filtering comesin with identifying the actual room counts required on daily bases which alsorequires considering the possible double occupancy factor.The process enables us to convert the total forecast of annual tourist arrivals ofthe country to visitors who will stay and look for accommodation facilities inthe city. It becomes the basis of the demand for hotel or accommodation roomsfor the city of Addis Ababa.

Forecasting Tourist Arrivals and Supply and Demand Gap Analysis
EJBE Vol. 5 No. 2/2015 Page 287
3.5 Scenario Planning and Intervention3.5.1 Intervention
When a time series data is impacted by extreme change, (the change could bepositive or negative and it could come from external or internal factors) itaffects the mean of the series. Such change is called change due to interventioneffect. It is also called structural change or regime change (Z Ismail, 2009).Change from external factors could be manmade or natural. For instance,external factors could emanate from weather factors, volcanoes, earth quakes,tsunamis, and diseases (Sars, Foot & Mouth, and Ebola). Alternatively, it couldbe manmade interventions like embargos, political/policy change, andterrorism; it could also be due tovarious economic factors like the effect ofeconomic recessions, the increase in economic growth, disposable income andinterventions like policy impact and increased promotion of destinations.The general procedure for an intervention analysis is mostly post impactanalysis which divides the period before and after. Whereas in this case, whatis attempted is the prediction of the impact an intervention has before ithappens; this is done to see the case of a different scenario.
3.5.2 Scenario Planning
This is an attempt to visualize a number of possible futures and consider theirimplications. A major purpose of scenarios is to challenge conventionalthinking and avoid extrapolating into the future in a linear fashion(Makridakisetal, 1998). It works by constructing possible alternative futures, orscenarios. Accordingly, scenario planning coupled with time seriesintervention effect is used to generate the possible alternative scenarios of longterm forecasting of tourist arrivals as it is indicated on the graphs. This part ofthe process complements the quantitative analysis with the judgmental(qualitative aspect) to generate alternative options.
3.6 Output Analysis3.6.1 Output Report
The output of the program using the selected model has produced many tables.In fact, the X-12-ARIMA program has extensive list of outputs; it is notpractical to address all the reports, therefore selected reports are presented.

Forecasting Tourist Arrivals and Supply and Demand Gap Analysis
EJBE Vol. 5 No. 2/2015 Page 288
3.6.2 Presenting Forecasted Series
The selected model (011) (011)12 is used to generate long periods of forecastby re-plugging the result of earlier forecasts as input data for forecasting theunknown future values. This method has created a way to extend the forecaststo distant periods up to year of 2025 which in turn presents the opportunity toget long term forecasts of monthly tourist arrivals (MTA).On the other hand,the Quarterly Tourist Arrivals (QTA) or the quarterly series, made available byfollowing similar rigorous procedures as MTA, has been followed andpresented to complement MTA. The model used for QTA is (210) (011)12.However, it is important to note that there is a challenge in quarterly forecastswhen it comes to extending the forecast period beyond 2020.In general, it is also important to provide a word of caution about attempting
to extend the forecast period. The model cannot be effective when extendingthe time period indefinitely. One of the main issues of model is that it mightnot meet diagnostic requirements. Even a new model might not succeed incomplementing the data properly (experience of the quarterly series showsthis).On the other hand, when one wants to explore the distant future, there isno guaranty that conditions will remain the same; there is always a possibilitythat exogenous factors can change and influence the dependent parameter.
Fig 3.5: X-12-ARIMA Run of MTA source data

Forecasting Tourist Arrivals and Supply and Demand Gap Analysis
EJBE Vol. 5 No. 2/2015 Page 289
Fig 3.6: MTA Forecast, 2016 up to 2020
Fig 3.7: MTA Forecast up to 2025

Forecasting Tourist Arrivals and Supply and Demand Gap Analysis
EJBE Vol. 5 No. 2/2015 Page 290
Fig 3.8: QTA Forecast up to 2020
3.6.3 Interpretation of Output
Original Series: this series of the output shows the typical randomness of thearrival pattern up to end of the actual observed data (2006-2013). The plotexhibits similar repeating patterns. As of 2013 which is the starting point of theforecasting period and extends up to the year of 2025. The repeating pattern isclearly indicated on the adjusted span plot.Seasonally Adjusted Series:the aim of preparing seasonally adjusted series isto adjust or correct the seasonal effect which masks the underlying trend of theseries. The correction is intended to reduce the variability induced by theseasonal component of the data. Therefore, it is natural to exhibit thecharacteristics of the original series with more smoother or subdued variations.The plot also shows this fact as well as showing the randomness which followsthe original series, though it misses certain points of picks and trough. In theforecasted period as of 2013, the seasonally adjusted series shows more smoothlines or linear characteristics this is so because the model representation for theoriginal series has less randomness or variability in this period.Trend: the trend plot of the series exhibits more smooth linear patterns. Thisresults from the characteristics of the underlying growth pattern and trend ofthe series over time. The pattern shows abrupt level changes or shifts in level inthe mid-year of 2011. This change is also observed in the original as well as onthe seasonally adjusted series. The trend line coincides with the seasonallyadjusted series in the forecasted period up to the end of 2025.
Forecasting Tourist Arrivals and Supply and Demand Gap Analysis
EJBE Vol. 5 No. 2/2015 Page 291
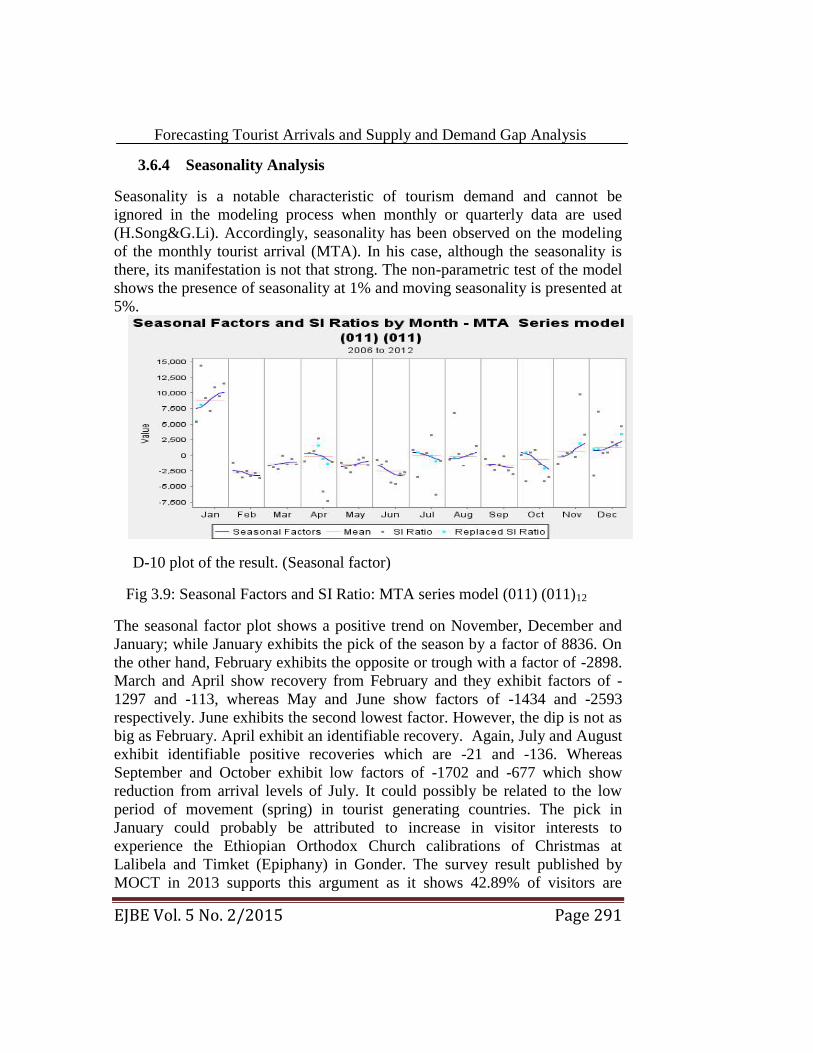
3.6.4 Seasonality Analysis
Seasonality is a notable characteristic of tourism demand and cannot beignored in the modeling process when monthly or quarterly data are used(H.Song&G.Li). Accordingly, seasonality has been observed on the modelingof the monthly tourist arrival (MTA). In his case, although the seasonality isthere, its manifestation is not that strong. The non-parametric test of the modelshows the presence of seasonality at 1% and moving seasonality is presented at5%.
D-10 plot of the result. (Seasonal factor)
Fig 3.9: Seasonal Factors and SI Ratio: MTA series model (011) (011)12
The seasonal factor plot shows a positive trend on November, December andJanuary; while January exhibits the pick of the season by a factor of 8836. Onthe other hand, February exhibits the opposite or trough with a factor of -2898.March and April show recovery from February and they exhibit factors of -1297 and -113, whereas May and June show factors of -1434 and -2593respectively. June exhibits the second lowest factor. However, the dip is not asbig as February. April exhibit an identifiable recovery. Again, July and Augustexhibit identifiable positive recoveries which are -21 and -136. WhereasSeptember and October exhibit low factors of -1702 and -677 which showreduction from arrival levels of July. It could possibly be related to the lowperiod of movement (spring) in tourist generating countries. The pick inJanuary could probably be attributed to increase in visitor interests toexperience the Ethiopian Orthodox Church calibrations of Christmas atLalibela and Timket (Epiphany) in Gonder. The survey result published byMOCT in 2013 supports this argument as it shows 42.89% of visitors are
Forecasting Tourist Arrivals and Supply and Demand Gap Analysis
EJBE Vol. 5 No. 2/2015 Page 292
coming to experience the cultural attractions, whereas 27.73% of visitors areinterested in historical attractions. The increased number of visitors inNovember and December could be attributed to the convenient weather factorin the country at that time. However, despite the same convenient weatherfactor, the trough in February is something which requires furtherinvestigation. Despite Ethiopia’s rainy season, the relative arrival increase inJuly and August could probably be attributed to Tourist Season (summervacation) in tourist generating countries, specifically Europe and USA. Thesame pattern of the monthly variation in arrival (seasonality) is observed in theforecasted period ;however, the value has increased. For example, January hasmore positive pickups whereas February shows a relative reduction in the levelof the trough.
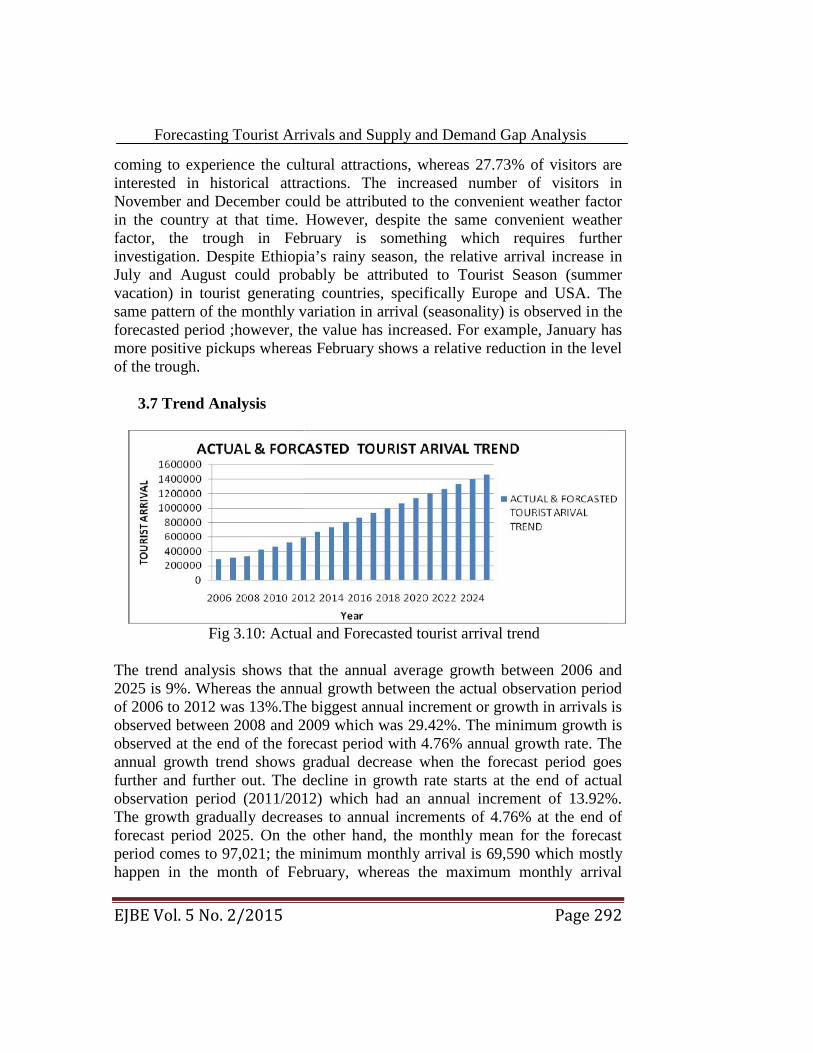
3.7 Trend Analysis
Fig 3.10: Actual and Forecasted tourist arrival trend
The trend analysis shows that the annual average growth between 2006 and2025 is 9%. Whereas the annual growth between the actual observation periodof 2006 to 2012 was 13%.The biggest annual increment or growth in arrivals isobserved between 2008 and 2009 which was 29.42%. The minimum growth isobserved at the end of the forecast period with 4.76% annual growth rate. Theannual growth trend shows gradual decrease when the forecast period goesfurther and further out. The decline in growth rate starts at the end of actualobservation period (2011/2012) which had an annual increment of 13.92%.The growth gradually decreases to annual increments of 4.76% at the end offorecast period 2025. On the other hand, the monthly mean for the forecastperiod comes to 97,021; the minimum monthly arrival is 69,590 which mostlyhappen in the month of February, whereas the maximum monthly arrival
Forecasting Tourist Arrivals and Supply and Demand Gap Analysis
EJBE Vol. 5 No. 2/2015 Page 292
coming to experience the cultural attractions, whereas 27.73% of visitors areinterested in historical attractions. The increased number of visitors inNovember and December could be attributed to the convenient weather factorin the country at that time. However, despite the same convenient weatherfactor, the trough in February is something which requires furtherinvestigation. Despite Ethiopia’s rainy season, the relative arrival increase inJuly and August could probably be attributed to Tourist Season (summervacation) in tourist generating countries, specifically Europe and USA. Thesame pattern of the monthly variation in arrival (seasonality) is observed in theforecasted period ;however, the value has increased. For example, January hasmore positive pickups whereas February shows a relative reduction in the levelof the trough.
3.7 Trend Analysis
Fig 3.10: Actual and Forecasted tourist arrival trend
The trend analysis shows that the annual average growth between 2006 and2025 is 9%. Whereas the annual growth between the actual observation periodof 2006 to 2012 was 13%.The biggest annual increment or growth in arrivals isobserved between 2008 and 2009 which was 29.42%. The minimum growth isobserved at the end of the forecast period with 4.76% annual growth rate. Theannual growth trend shows gradual decrease when the forecast period goesfurther and further out. The decline in growth rate starts at the end of actualobservation period (2011/2012) which had an annual increment of 13.92%.The growth gradually decreases to annual increments of 4.76% at the end offorecast period 2025. On the other hand, the monthly mean for the forecastperiod comes to 97,021; the minimum monthly arrival is 69,590 which mostlyhappen in the month of February, whereas the maximum monthly arrival

Forecasting Tourist Arrivals and Supply and Demand Gap Analysis
EJBE Vol. 5 No. 2/2015 Page 293
comes 124,520 in the month of January. The standard deviation comes to16,009.
3.8 Supply and Demand Gap
To further explain/highlight the methodology used for the supply and demandanalysis, the forecast figure for the years ahead is used as initial input (lumpsum arrival) figure which is then used on the funneling technique. It isdecomposed until it reaches the final and filtered actual room demand. Theprocess enables us to convert the total forecast of annual tourist arrivals of thecountry to visitors who will stay and look for accommodation facilities in thecity. This will become the basis for the hotel or accommodation demand in thecity.
3.8.1 Intervention
The type of intervention considered here is the stepped function which causespermanent level changes. For further clarification on the stepped function, referto the works of Yafee & McGree (2009). The impact is expected to manifestwithin a year, in this case, 2016.The model used is the same model before andafter the impact.
3.8.2 Consideration of Different Scenarios
Tourism is a delicate sector which can be easily impacted by exogenousfactors. Although it is very challenging to predict what is going to happen,from past experiences, it has been observed that exogenous factors haveconsiderable influence on tourist arrivals. Such an influence can come at anytime when one deals with long term forecast. Accordingly, the impact ofexogenous factors in 2014 has affected tourist arrivals in East and SouthAfrican countries like Kenya, Tanzania and South Africa; the observationsfrom these countries have been taken as a learning point. The official releasefrom these countries’ tourism biro, hotel chains, and tour and travel companieshas shown that the Ebola pandemic in West Africa has affected their touristarrivals heavily; in the case of Kenya, this is more aggravated by securityconcerns from Somali extremist groups,,especially in tourist destinations likeMombasa. For example, the Hotel Association of Tanzania representing 195nationwide sites claimed that business is down by 30 to 40 percent for the yearand advanced bookings, mostly for 2015, are 50% lower. Kenya’s SerinaHotels which are high end safari lodges and beach resorts announced bookingis down as much as 30% in 2014. Leisure Tourism(2014),a Netherland based

Forecasting Tourist Arrivals and Supply and Demand Gap Analysis
EJBE Vol. 5 No. 2/2015 Page 294
safari booking has conducted a survey on more than five hundred operators andannounced booking is down by 20 to70 %. South African tour operators andtourism officials have also confirmed the drop on their bookings especiallyfrom Asian travelers. The World Bank also cut the forecast of economicgrowth for sub Saharan Africa from 5.2 to 4.6% (Leisure Tourism, October2014). Considering the implication of such external factors and the sensitivityof the tourism industry, the reduction of 15% from normal trend forecast istaken as the case for worst case scenario.On the same premises, a positiveimpact of 15% increase in tourist arrival is also assumed (Note that thestandard deviation to mean arrival ratio show 16.5%). On the other hand,considering the Ethiopian government’s intention to prop up support for theindustry in the coming years, the third case scenario considers a stretchedgoal.The Ethiopian government’s GTP plan has been aimed to reach more thana million tourist arrivals by 2015. However, the current trends show that it ishighly unlikely that the target will be met. The forecast of this analysis alsoshows that with the current trend it will be challenging to meet the targetwithout some major intervention in the upcoming years. Therefore, thisscenario is a bit of a stretch considering that it takes the current trendforecasted figure for 2025 to be taken as the target to be achieved by 2020.Similar strategic goals are observed in East African countries’ (Kenya,Tanzania, Uganda, and Rwanda) tourism plans. This shows that it is possible toconsider the achievement of such number of arrivals within the set time frame.The fourth case scenario is taken as the forecast of the current trend.
Presenting Room Demand
Fig 3.11: Room demand under different scenario

Forecasting Tourist Arrivals and Supply and Demand Gap Analysis
EJBE Vol. 5 No. 2/2015 Page 295
3.8.3 Establishing Supply Condition
To establish the existing supply condition, it was important to visitstakeholders in tourism and hotel sectors. Accordingly, different governmentand sectorial associations (organizations) were approached. The main sourcesof information used are the Addis Ababa Tourism Office, operating underTrade and Industry Sector, Addis Ababa Investment Bureau,as well as AddisAbaba Hotel Owners Trade Sectorial Association (AHA).The informationobtained from these different sources is examined to establish the current stockof hotel rooms.
The expected annual room supply condition can be indicated below.
Figure 3.12: Expected room supply considering 65% Occupancy

Forecasting Tourist Arrivals and Supply and Demand Gap Analysis
EJBE Vol. 5 No. 2/2015 Page 296
3.9 Gap Analysis
Fig 3.13: Gap analysis: Room supply and demand
The plot of the supply and demand indicates the gap between the supply(available rooms to be rented), presented on the upper side, in relation to thedemand which is presented on the lower side for different scenarios. In allcases, the supply by far outstrips the demand.Presenting the gap between supply and demand for different case scenarios:Supply vs. demand Different casescenario
Year2015 2020 2025
Supply vs. demand gap (actual trend) 1000639 1154101 1307564
Supply vs. demand gap (negativeintervention scenario)
1043291 1265532 1487772
Supply vs. demand gap (positiveintervention scenario)
957986 1042671 1127357
Supply vs. demand gap (stretchedintervention scenario)
894233 947598 1000963
Table 3.2: Supply and demand gap

Forecasting Tourist Arrivals and Supply and Demand Gap Analysis
EJBE Vol. 5 No. 2/2015 Page 297
4. Findings and Conclusions of the Study4.1. FindingsThe result shows that among the list of candidate models, model (011) (011)12
is the most appropriate model to forecast the monthly tourist arrival. Whereasmodel (210) (011)4 is the most appropriate model for forecasting the long termquarterly arrivals to the country. Furthermore, the method has forecasted thatthe annual tourist arrivals to the country in the year 2015 to be798, 157 and in2020 the arrivals are expected to rise to 1,130,971, and finally in 2025 tofurther rise to 1,463,743. By using the funneling technique, it was possible toget accommodation demands. Accordingly, the demand for accommodation inAddis Ababa is projected to be 580,870 in2015, 822,428 in2020 and 1,063,987for the year of 2025. On the other hand, the supply level is established byconsidering the existing inventory of hotel rooms as well as considering thenumber of new hotels which are expected to join the market. In relation to this,the stock of hotel rooms in the city (Addis Ababa) is estimated to be 1,581,509in 2015, 1,976,529 in 2020 and 2,371,551 in the year of 2025. This, in turn, hashelped us to figure out the difference between supply and demand for hotelrooms in the city. The finding shows that the supply of rooms outstrips thedemand for the years 2015, 2020 and 2025. In order to test the supply anddemand relations under different circumstances a stepped function interventionscenario is used to establish different case scenarios (positive, negative, andstarched intervention) which have been investigated to foresee how therelationship between supply and demand of the accommodation sector turnsout. In all cases, the supply is found to be much higher than the demand.
4.2. ConclusionBased on the study findings, there is significant gap between the supply anddemand conditions on accommodation facility in the city of Addis Ababa. Thebalance is in favor of big supply of hotel accommodation not commensurablewith hotel demand for the coming 5 to 10 years.This excess supply of hotel accommodation over predicted tourist arrival overthe coming ten years has significant implication on the operationalperformance of the hotels as well as the one`s preparing to enter the market inthe future. This is an issue, which requires close follow-up from different stakeholders. As a result, it is important to point out that, a lot needs to be done toincrease the number of tourist arrivals to Ethiopia. From the forecasted figures,it is clear that the number of visitors to the country as well as the city of AddisAbaba is relatively small in comparison with the potential of the country aswell as the supply of accommodation facility in the City.

Forecasting Tourist Arrivals and Supply and Demand Gap Analysis
EJBE Vol. 5 No. 2/2015 Page 298
4.3. Recommendation Based on the supply-demand gap analysis of tourist arrival to hotel
accommodation in Addis Ababa City of Ethiopia for the next 10 years, itis recommended that due attention is needed from policy makers,especially from Culture and Tourism Ministry of Ethiopia to promoteEthiopia’s tourist sites to attract more tourists to the country.
It would be more advantageous, if the result figures (the long termforecast of tourist arrival for Addis Ababa, Ethiopia) are verified usingqualitative methods probably through use of Delphi method.
In general extending long term forecast further out is not recommended.Here, the forecast period is extended up to 2025. It is important tohighlight that this is done to indicate direction. However, it is assumedthat forecast figures up to 2020 are reliable.
It is important to update the figures by repeating the work byincorporating raw data from years 2013,2014,and 2015

Forecasting Tourist Arrivals and Supply and Demand Gap Analysis
EJBE Vol. 5 No. 2/2015 Page 299
ReferencesA.saayman & M.saayman (2010). Forecasting tourist arrival in south Africa.
AddisAbaba Culture &Tourism Bureau (AACTB).Addis Ababa investment agency (AAIA)AHA Apr-June; 2014 Addis Ababa hotel owners trade sectorial association
(AHA) quarterly newsletter; vol.1 issue1.Armstrong, 2001; selecting forecasting methods university of Pennsylvania;
Armstrong@ Wharton.upehn.edu.Buffa & Sarin, 1987; Modern Production /operation Management; eight
edition; John Wiley & sons Inc.Christie & Crompton (2001); Tourism in Africa; Africa Region Working Paper
Series No. 12:Christie et al, 2013; Overview Tourism in Africa: Harnessing Tourism for
Growth and Improved Livelihoods, The World Bank:www.worldbank.org/afr/tourism.
Consultant report: Multilink project development solutions; Addis Ababa.Embassy of Japan in Ethiopia :2008 A series of studies on industries in
Ethiopia . (Hotel industry in Ethiopia).FDRE Ministry of Culture & tourism (tourism development policy Aug 2009).Frechtling D.C, 2001; Forecasting tourism demand methods and strategies;
Butterworth Heinemann.Gobena & Gudeta, 2013; Hotel sector investment in Ethiopia Journal of
Business management (JBM) Vol.1 (2). P 35-54; Ref 0520130801. GTPplan, 2010; volume I.
H.Song & G.Li Tourism Demand Modeling and Forecasting A Review ofRecent Research H. Song, School of Hotel and Tourism Management TheHong Kong Polytechnic University Hung Hom, Kowloon Hong KongSAR; Gang Li ,School of Management University of Surrey GuildfordGU2 7XH, UK ; epubs.surrey.ac.uk.
IDOWU.k; APanal data Analysis of Demand for Tourism in Africa;Department of Economics, University of Ibadan Nigeria. 14th AfricaEconomic Society Annual Conference; Cape Town South Africa.
M.Çuhadar, 2014; Modeling and Forecasting in bound Tourism to Istanbul; Acomparative analysis; European Journal of Business and Social Sciences,Vol. 2, No.12.
Makridakisetal, 1998; Forecasting methods and application John Wiley andsons Inc.
WBG & MOCT , 2012; Ethiopia’s tourism sector; strategic paths tocompetitiveness and job creation October 2012;World Bank GroupFinance and Private Sector Development & Ministry of Culture and

Forecasting Tourist Arrivals and Supply and Demand Gap Analysis
EJBE Vol. 5 No. 2/2015 Page 300
Tourism Federal Democratic Republic of Ethiopia.MOCT Ministry of Culture and Tourism; Ethiopia A tourist paradise (booklet)
www.tourismethiopia.gov.et.MOCT, 2013; Tourism statistics bulletin 2009-2012 no 10.MOCT, June 2013; International visitors survey report phase I.MOFED, 2010; Ministry of Finance and economic development; Growth and
Transformation Plan (GTP) 2010/11-2014/15.Peng Bo , 2012; A Meta-Analysis of International Tourism Demand Elasticity
and Forecasting Accuracy; the Hong Kong Polytechnic University Schoolof Hotel and Tourism Managementhttp://www.lib.polyu.edu.hk.
Song et al; Tourism demand modeling and forecasting: how should demand bemeasured?; Tourism Economics, 2010, 16 (1), 63–81; School of Hotel andTourism Management, The Hong Kong Polytechnic University, HungHom, Kowloon, Hong Kong SAR, PR [email protected].
Song, H and G.li ;2010 ;Tourism demand Modeling and forecasting a reviewrecent research
UNWTO & ETC, 2008; Handbook on Tourism Forecasting MethodologiesCopyright © 2008 World Tourism Organization and European TravelCommission.
UNWTO;2012 Global report on aviation , Am report Volume Five.UNWTO;2012 Tourism towards 2030,Global overview.UNWTO;2013 Tourism high light.UNWTO; 2014 Tourism high light.UNWTO, 14May 2014; Press release, PR NO: PR14034; Madrid.UNWTO;2015 World tourism barometer .Volume 13.january 2015.Wang (2006); Rule induction for forecasting method selection: meta-learning
the characteristics of univariate time series; Monash University, Clayton,Victoria 3800, Australia.
Yaffee & McGree, 1999; Introduction to time series analysis and forecastingwith applications of SAS and SPSS academic press, INC.
Z. Ismail et al, 2009; Intervention Model for Analyzing the Impact ofTerrorism to Tourism Industry, Journal of Mathematics and Statistics5(4):322-329.


![Fw: [TELKOMNIKA] #5993: Foreign Tourist Arrivals ... K G Darmaputra Fw: [TELKOMNIKA] #5993: Foreign Tourist Arrivals Forecasting Using Recurrent Neural](https://static.fdocuments.net/doc/165x107/5af6521d7f8b9a8d1c8ec261/fw-telkomnika-5993-foreign-tourist-arrivals-k-g-darmaputra-ikgdarmaputraunudacid.jpg)