Forecasting Realized Variance Using Jumps Andrey Fradkin Econ 201 4/4/2007.
24
Forecasting Realized Variance Using Jumps Andrey Fradkin Econ 201 4/4/2007
-
Upload
simon-perkins -
Category
Documents
-
view
219 -
download
0
Transcript of Forecasting Realized Variance Using Jumps Andrey Fradkin Econ 201 4/4/2007.

Forecasting Realized Variance Using Jumps
Andrey FradkinEcon 2014/4/2007

Introduction
• Theoretical Background• Summary Graphs and Statistics for data• The HAR-RV-CJ Model and regressions using it. • Addition of IV to the regression• Analysis of possible benefits to using IV• Forecasting IV-RV using jumps, do jumps
effect risk premiums?• Future Work 4/4/2007 Andrey Fradkin: Forecasting Realized
Variance 2

Formulas Part 1
4/4/2007 Andrey Fradkin: Forecasting Realized Variance 3
Realized Variation:
Realized Bi-Power Variation:

Formulas Part 2
• Tri-Power Quarticity
• Quad-Power Quarticity
4/4/2007 Andrey Fradkin: Forecasting Realized Variance 4

Formulas Part 3
• Z-statistics (max version)
4/4/2007 Andrey Fradkin: Forecasting Realized Variance 5

Realized Variance and Jumps
4/4/2007 Andrey Fradkin: Forecasting Realized Variance 6

Original HAR-RV-J Model (Taken from Andersen, Bollerslev, Diebold 2006)
4/4/2007 Andrey Fradkin: Forecasting Realized Variance 7

The HAR-RV-CJ Model
4/4/2007 Andrey Fradkin: Forecasting Realized Variance 8

My Regressions – 1 day forward
4/4/2007 Andrey Fradkin: Forecasting Realized Variance 9
Newey-West R^2=.4922rv Coef. Std. Err. t P>t [95% Conf. Interval]
c1 .3216361 .0778881 4.13 0.000 .168826 .4744461c5 .3233613 .1008474 3.21 0.001 .1255069.5212156c22 .2478666 .0625769 3.96 0.000 .1250959.3706373_cons .0000285 .0000103 2.76 0.006 8.21e-06.0000488

Jumps Don’t Matter
4/4/2007 Andrey Fradkin: Forecasting Realized Variance 10
Newey-West R^2=.4985rv Coef. Std. Err. t P>t [95% Conf. Interval]
c1 .3262136 .0755843 4.32 0.000 .177923 .4745042c5 .3091024 .0975148 3.17 0.002 .1177858 .5004191c22 .2419664 .0601737 4.02 0.000 .1239103 .3600226j1 1.584021 .9718173 1.63 0.103 -.3226096 3.490652j5 -.84711691.134404 -0.75 0.455 -3.07273 1.378496j22 3.587264 3.786084 0.95 0.344 -3.840741 11.01527_cons .0000261 .0000101 2.59 0.010 6.35e-06 .0000459

1 day forward using logs
4/4/2007 Andrey Fradkin: Forecasting Realized Variance 11
Newey-West R^2=0.7737 logrv Coef. Std. Err. t P>t [95% Conf.Interval]
logc1 .2407742 .041531 5.80 0.000 .1592938 .3222545logc5 .4396577 .0592865 7.42 0.000 .3233424 .5559731logc22 .2749495 .0418261 6.57 0.000 .19289 .357009_cons -.4548797.1309848 -3.47 0.001 -.7118613 -.1978982
Jump terms are insignificant if added to this regression

Regression 5 days forward
4/4/2007 Andrey Fradkin: Forecasting Realized Variance 12
Newey-WestF5.rv5 Coef. Std. Err. t P>t [95% Conf.Interval]
c1 .1902404 .0405141 4.70 0.000 .1107546 .2697263c5 .3198168 .1070031 2.99 0.003 .1098841 .5297494c22 .2966428 .0782428 3.79 0.000 .1431358 .4501498j1 -.0887148 .4668765 -0.19 0.849 -1.004694 .8272648j5 3.129752 1.447759 2.16 0.031 .2893476 5.970156j22 2.996998 5.738814 0.52 0.602 -8.26216 14.25616_cons .0000419 .0000154 2.71 0.007 .0000116 .0000721
Practically no change in R^2 w/o jumps

My Regressions – 22 day
4/4/2007 Andrey Fradkin: Forecasting Realized Variance 13
Newey-West R^2=.5172 F22.rv22 Coef. Std. Err. t P>t [95% Conf.Interval]
c1 .1216783 .0230143 5.29 0.000 .0765252 .1668314c5 .2577073 .1083063 2.38 0.017 .0452148 .4701998c22 .2752547 .0909278 3.03 0.003 .096858 .4536513j1 .2384794 .2904984 0.82 0.412 -.3314668 .8084255j5 1.570385 2.267699 0.69 0.489 -2.878747 6.019518j22 5.20189 9.937398 0.52 0.601 -14.29488 24.69866_cons .0000799 .000026 3.08 0.002 .000029 .0001308
Practically no change in R^2 w/o jumps

Work on Options Data
• Code for filtering through the many options• Takes the implied volatility of the option that
is closest to the average of the starting and closing price, provided volume is high enough.
• Calculate variables: IVt,t+h=h-1 (IVt+1 + IVt+2 … + IVt+h)
• Difft= IVt-RVt
4/4/2007 Andrey Fradkin: Forecasting Realized Variance 14

Means
• Observations: 1219 Mean RV=.0002635 • Mean IV=.0003173 Mean Diff=.0000523
4/4/2007 Andrey Fradkin: Forecasting Realized Variance 15
Diff

Autocorrelation of Diff
4/4/2007 Andrey Fradkin: Forecasting Realized Variance 16

IV is a better predictor than RV of future RV
4/4/2007 Andrey Fradkin: Forecasting Realized Variance 17
R-squared = 0.5023Root MSE = .00026
Robustrv Coef. Std. Err. t P>t [95% Conf.Interval]
iv1 1.050039 .0962552 10.91 0.000 .8611945 1.238884j1 .6298041 .9092165 0.69 0.489 -1.154003 2.413611_cons -.0000698.0000254 -2.74 0.006 -.0001197 -.0000199
R-squared = 0.4271Root MSE = .00028
Robustrv Coef. Std. Err. t P>t [95% Conf. Interval]
c1 .6478913 .1001823 6.47 0.000 .4513421 .8444406j1 1.897893 .8402938 2.26 0.024 .2493062 3.546479_cons .0000913 .0000223 4.10 0.000 .0000476 .0001351

Is Diff Significant in forecasting RV?
4/4/2007 Andrey Fradkin: Forecasting Realized Variance 18
R-squared = 0.5465Root MSE = .00025
Robustrv Coef. Std. Err. t P>t [95% Conf.Interval]
rv1 1.039644 .0941392 11.04 0.000 .8549505 1.224337L1.Diff .7441405 .1072339 6.94 0.000 .5337562 .9545247_cons -.0000496.0000239 -2.07 0.038 -.0000966 -2.64e-06
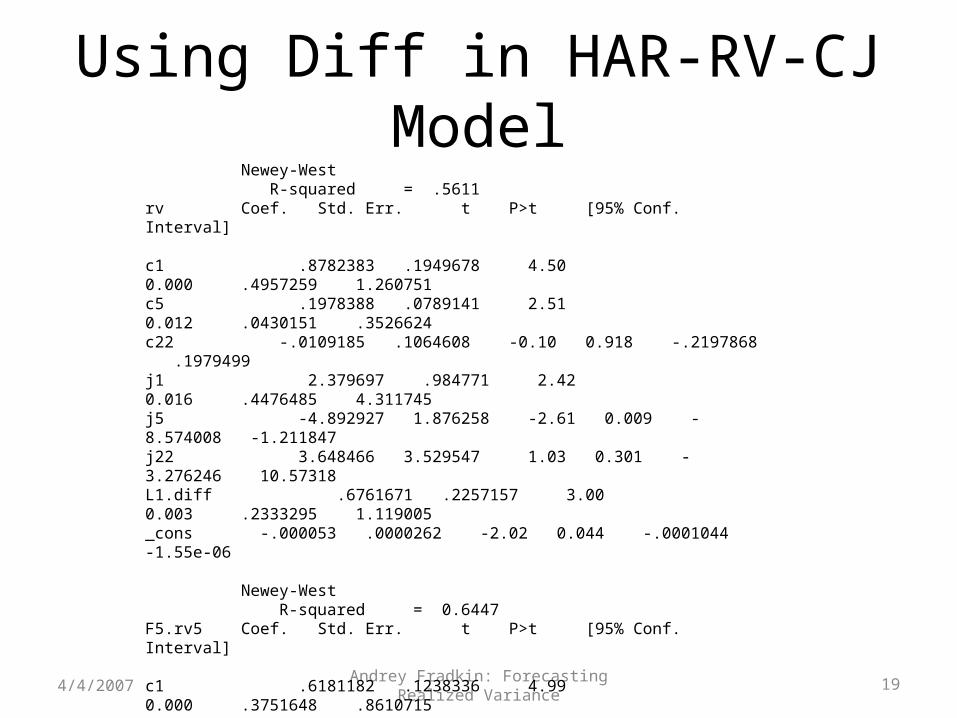
Using Diff in HAR-RV-CJ Model
4/4/2007 Andrey Fradkin: Forecasting Realized Variance 19
Newey-West R-squared = .5611 rv Coef. Std. Err. t P>t [95% Conf. Interval]
c1 .8782383 .1949678 4.50 0.000 .4957259 1.260751c5 .1978388 .0789141 2.51 0.012 .0430151 .3526624c22 -.0109185 .1064608 -0.10 0.918 -.2197868 .1979499j1 2.379697 .984771 2.42 0.016 .4476485 4.311745j5 -4.892927 1.876258 -2.61 0.009 -8.574008 -1.211847j22 3.648466 3.529547 1.03 0.301 -3.276246 10.57318L1.diff .6761671 .2257157 3.00 0.003 .2333295 1.119005_cons -.000053 .0000262 -2.02 0.044 -.0001044 -1.55e-06
Newey-West R-squared = 0.6447 F5.rv5 Coef. Std. Err. t P>t [95% Conf. Interval]
c1 .6181182 .1238336 4.99 0.000 .3751648 .8610715c5 .2326215 .107413 2.17 0.031 .0218843 .4433588c22 .1019241 .0628666 1.62 0.105 -.021416 .2252642j1 .5261682 .5163181 1.02 0.308 -.4868141 1.53915j5 -.0505589 1.846144 -0.03 0.978 -3.672573 3.571455j22 3.228812 5.368064 0.60 0.548 -7.302979 13.7606L1.Diff .5242109 .143786 3.65 0.000 .2421122 .8063096_cons -.0000199 .0000132 -1.51 0.131 -.0000457 5.96e-06

Using Diff in HAR-RV-CJ Model cont.
4/4/2007 Andrey Fradkin: Forecasting Realized Variance 20
Newey-West R-Squared: 0.5676 F22.rv22 Coef. Std. Err. t P>t [95% Conf. Interval]
c1 .4739452 .0803304 5.90 0.000 .31634 .6315504c5 .1862154 .1068758 1.74 0.082 -.0234709 .3959018c22 .115742 .0742476 1.56 0.119 -.0299291 .2614131j1 .7448536 .3328171 2.24 0.025 .0918788 1.397828j5 -1.032086 2.406812 -0.43 0.668 -5.754162 3.689989j22 5.355446 10.28448 0.52 0.603 -14.82233 25.53322L1.diff .4314511 .0938983 4.59 0.000 .247226 .6156761_cons .0000285 .000021 1.36 0.175 -.0000127 .0000696

Predicting Diff Using Jumps
4/4/2007 Andrey Fradkin: Forecasting Realized Variance 21
Newey-West R-squared = 0.1235diff Coef. Std. Err. t P>t [95% Conf. Interval]
c1 -.1973631 .0706515 -2.79 0.005 -.3359759 -.0587504c5 -.1441686 .063503 -2.27 0.023 -.2687566 -.0195806c22 .1650903 .0995486 1.66 0.097 -.0302165 .3603971j1 -1.591713 .8951938 -1.78 0.076 -3.348014 .1645889j5 7.162149 1.46073 4.90 0.000 4.296309 10.02799j22 -3.263902 2.958828 -1.10 0.270 -9.068895 2.541092_cons .0000949 .0000215 4.42 0.000 .0000528 .0001371
Newey-West R-squared = 0.0548F5.diff Coef. Std. Err. t P>t [95% Conf. Interval]
c1 .025571 .0435225 0.59 0.557 -.0598172 .1109593c5 -.3173051 .1317263 -2.41 0.016 -.5757431 -.0588671c22 .2137709 .1007057 2.12 0.034 .0161933 .4113484j1 -.6373502 .8629953 -0.74 0.460 -2.330488 1.055787j5 -1.319912 1.440435 -0.92 0.360 -4.145946 1.506122j22 -2.634389 3.527186 -0.75 0.455 -9.554485 4.285707_cons .0000781 .0000198 3.940.000 .0000392 .0001169

Predicting Diff Using Jumps
4/4/2007 Andrey Fradkin: Forecasting Realized Variance 22
Newey-West R-squared = 0.0072F22.diff Coef. Std. Err. tP>t [95% Conf. Interval]
c1 .0278554 .029698 0.94 0.348 -.0304108 .0861216c5 -.0189465 .0709693 -0.27 0.790 -.1581855 .1202924c22 .0304386 .0706686 0.43 0.667 -.1082103 .1690875j1 .7447953 .23193 3.21 0.001 .289758 1.199833j5 -2.931345 2.05406 -1.43 0.154 -6.961327 1.098638j22 .6472574 5.335948 0.12 0.903 -9.821655 11.11617_cons .0000405 .0000126 3.21 0.001 .0000158 .0000653
Adding or removing jumps does not effect R-Squared

Jumps matter if regressing Diff on IV and Jumps
4/4/2007 Andrey Fradkin: Forecasting Realized Variance 23
Newey-West R-Squared: .1018diff Coef. Std. Err. t P>t [95% Conf. Interval]
iv1 -.5454239 .2838641 -1.92 0.055 -1.102344 .0114957iv5 -.0509571 .1503595 -0.34 0.735 -.3459508 .2440366iv22 .5652849 .1773301 3.19 0.001 .217377 .9131929j1 -1.557493 .9155883 -1.70 0.089 -3.353807 .2388207j5 10.23682 2.056567 4.98 0.000 6.201993 14.27165j22 -9.462402 3.553551 -2.66 0.008 -16.4342 -2.490609_cons .0000605 .0000219 2.76 0.006 .0000175 .0001036
Newey-West R-Squared: .16diff Coef. Std. Err. t P>t [95% Conf. Interval]
L1.diff .2575236 .0986853 2.61 0.009 .0639104 .4511368iv1 -.5944392 .2546254 -2.33 0.020 -1.093995 -.094883iv5 .1370913 .200045 0.69 0.493 -.2553824 .529565iv22 .4336471 .1536846 2.82 0.005 .1321293 .7351649j1 -1.37075 .946662 -1.45 0.148 -3.228031 .4865313j5 8.862341 1.982412 4.47 0.000 4.972993 12.75169j22 -9.133631 2.995484 -3.05 0.002 -15.01055 -3.256713_cons .0000459 .000015 3.06 0.002 .0000165 .0000752

Future Work• Do same regressions on data for other stocks.• Add volatility of SPY to regression terms.• See if there are possible applications of GARCH
models for these regressions.• Experiment with other alphas.
4/4/2007 Andrey Fradkin: Forecasting Realized Variance 24