Fordham Urban Law Journal - Semantic Scholar · FORDHAM URBAN LAW JOURNAL [Vol. XXX of drugs and...
54
Fordham Urban Law Journal Volume 30, Issue 5 2002 Article 3 Reciprocal Effects of Crime and Incarceration in New York City Neighborhoods Jeffrey Fagan * Valerie West † Jan Holland ‡ * Columbia University † Columbia University, Mailman School of Public Health ‡ Columbia University, Mailman School of Public Health Copyright c 2002 by the authors. Fordham Urban Law Journal is produced by The Berkeley Electronic Press (bepress). http://ir.lawnet.fordham.edu/ulj
Transcript of Fordham Urban Law Journal - Semantic Scholar · FORDHAM URBAN LAW JOURNAL [Vol. XXX of drugs and...

Fordham Urban Law JournalVolume 30, Issue 5 2002 Article 3
Reciprocal Effects of Crime and Incarcerationin New York City Neighborhoods
Jeffrey Fagan∗ Valerie West†
Jan Holland‡
∗Columbia University†Columbia University, Mailman School of Public Health‡Columbia University, Mailman School of Public Health
Copyright c©2002 by the authors. Fordham Urban Law Journal is produced by The BerkeleyElectronic Press (bepress). http://ir.lawnet.fordham.edu/ulj

Reciprocal Effects of Crime and Incarcerationin New York City Neighborhoods∗
Jeffrey Fagan, Valerie West, and Jan Holland
Abstract
This Article identifies and estimates the ecological dynamics of increasing spatial and socialconcentration of incarcerated individuals in urban neighborhoods using data from New York Citybetween 1985 and 1997. It argues that this dynamic becomes self-sustaining and reinforcing overtime. In conclusion, the Article discusses how high incarceration rates impact the relationshipsbetween citizens and the law, directly affecting residents and influencing policy preferences ofnon-residents.
KEYWORDS: crime, incarceration, large cities, neighborhoods
∗The Authors are grateful to the New York State Division of Criminal Justice Services and theNew York City Department of HEalth for generously supplying data for this research. TamaraDumanovsky helped conceptualize and launch the project and supervised the assembly of datasets.Nicole Mutter and Carolyn Pinedo provided excellent research assistance.

RECIPROCAL EFFECTS OF CRIME ANDINCARCERATION IN NEW YORK CITY
NEIGHBORHOODSt
Jeffrey Fagan*Valerie West**
Jan Holland***
INTRODUCTION
The concentration of incarceration in social groups and areas hasemerged in the past decade as a topic of research and policy inter-est. This interest was fueled by several factors: persistent contin-ued growth of incarceration through the 1990s, even as crime ratesfell nationally for over seven years;1 persistent racial disparities inincarceration; 2 assessments of the collateral consequences of incar-ceration that potentially aggravate the causal dynamics that lead toelevated crime rates;3 rapid growth in the number of returning pris-
t An earlier version of this Essay was presented at the Twelth AnnualSymposium on Contemporary Urban Challenges entitled "Beyond the Sentence:Post-Incarceration Legal, Social, and Economic Consequences of CriminalConvictions," held at the Fordham University School of Law on February 20, 2003.This research was supported by Grant 85-00-11 from the Russell Sage Foundation,Future of Work Program. All opinions are solely those of the Authors, as are anyerrors. The Substance Abuse Policy Research Program of the Robert Wood JohnsonFoundation provided additional support for this research.
The Authors are grateful to the New York State Division of Criminal JusticeServices and the New York City Department of Health for generously supplying datafor this research. Tamara Dumanovsky helped conceptualize and launch the projectand supervised the assembly of the datasets. Nicole Mutter and Carolyn Pinedoprovided excellent research assistance.
* Professor of Law and Public Health, Columbia University.** Staff Associate, Center for Violence Research and Prevention, Mailman
School of Public Health, Columbia University.*** Staff Associate, Center for Violence Research and Prevention, Mailman
School of Public Health, Columbia University.1. Alfred Blumstein & Allen J. Beck, Population Growth in U.S. Prisons, 1980-
1996, in 26 CRIME AND JUSTICE: A REVIEW OF RESEARCH: PRISONS 17, 54-57(Michael Tonry & Joan Petersilia eds., 1999).
2. MARC MAUER, RACE TO INCARCERATE 118-42 (1999); see Thomas P. Bonzcar& Allen J. Beck, U.S. DEP'T OF JUSTICE, NCJ 160092, LIFETIME LIKELIHOOD OF Go-ING TO STATE OR FEDERAL PRISON 1 (1997), available at http:// www.ojp.usdoj.gov/bjs/pub/pdf/llgsfp.pdf (last visited July 15, 2003).
3. John Hagan & Ronit Dinovitzer, Collateral Consequences of Imprisonment forChildren, Communities, and Prisoners, in 26 CRIME AND JUSTICE: A REVIEW OF RE-SEARCH: PRISONS, supra note 1, at 121-22; Joan Moore, Bearing the Burden: HowIncarceration Policies Weaken Inner-City Communities, in THE UNINTENDED CONSE-
1551

FORDHAM URBAN LAW JOURNAL [Vol. XXX
oners to their communities;4 an influx that may strain social controlin neighborhoods where social and economic disadvantages havealready created acute crime risks.
While there is consistent evidence of the social concentration ofincarceration among poor non-white males, there have been fewstudies of the spatial concentration of incarceration in neighbor-hoods in the nation's large cities. Recent evidence suggests thatthe growing social concentration of incarceration is tied to the spa-tial concentration of incarceration in poor urban neighborhoods.5
In 1996-97, Professor Todd Clear and his colleagues examined theeffects of incarceration admissions and returns in Tallahassee, Flor-ida neighborhoods using a two-wave panel design.6 ProfessorsJames Lynch and William Sabol7 estimated incarceration rates byneighborhood in Baltimore, Maryland, focusing on concentrationof prisoners spatially and temporally.8 These studies show that therisks of going to jail or prison grow over time for persons living inpoor neighborhoods, contributing to the accumulation of social andeconomic adversity for people living in these areas, as well as to theoverall well-being of the neighborhood itself.9 These studies not-withstanding, incarceration has generally been omitted as an eco-logical factor in the production of crime, particularly in research oncrime in neighborhoods.
Yet, there are several reasons to consider incarceration as part ofan ecological dynamic of crime in neighborhoods. High rates ofincarceration can adversely affect the ability of returning prisonersto re-enter labor markets, and thus aggravate social and economicdisadvantages within areas where former inmates are concen-
QUENCES OF INCARCERATION: PAPERS FROM A CONFERENCE ORGANIZED BY THEVERA INSTITUTE OF JUSTICE 67, 72-75 (1996). See generally INVISIBLE PUNISHMENT:
COLLATERAL CONSEQUENCES OF MASS IMPRISONMENT (Marc Mauer & Meda Ches-ney-Lind eds., 2002).
4. Todd R. Clear et al., Incarceration and the Community: The Problem of Re-moving and Returning Offenders, 47 CRIME & DELINQ. 335, 338-39 (2001).
5. Robert J. Sampson & William Julius Wilson, Toward a Theory of Race, Crime,and Urban Inequality, in CRIME AND INEQUALITY 37, 38-41 (John Hagan & Ruth D.Peterson eds., 1995).
6. Todd R. Clear et al., Coercive Mobility and Crime: A Preliminary Examinationof Concentrated Incarceration and Social Disorganization, 20 JUST. Q. 33, 45 (2003).
7. James P. Lynch & William Sabol, Effects of Incarceration on Social Control inCommunities, in THE IMPACT OF INCARCERATION ON FAMILIES AND COMMUNITIES
(Mary Pattillo et al. eds., forthcoming); Dina R. Rose & Todd R. Clear, Incarceration,Social Capital and Crime: Examining the Unintended Consequences of Incarceration,36 CRIMINOLOGY 441, 441 -45 (1998).
8. Lynch & Sabol, supra note 7; Rose & Clear, supra note 7, at 441-45.9. Lynch & Sabol, supra note 7; Rose & Clear, supra note 7, at 441-45.
1552

RECIPROCAL EFFECTS
trated. 10 Incarceration often disrupts family ties and social net-works, aggravating vulnerabilities to crime through compromisesto social control, creating a churning effect on social networks.11
Incarceration destabilizes crime networks and potentially in-troduces systemic violence associated with competition amongcrime groups for territory and market share.1 2 High rates of incar-ceration may also reduce incentives for citizens to participate ininformal social control by reducing the communicative value ofsanctions, de-legitimizing law and legal actors, further invitingcrime, and intensifying the crime-enforcement-incarceration-crimecycle.1 3 Incarceration potentially stigmatizes neighborhoods, com-plicating the ability of residents to access job hiring networks toenter and compete in labor markets, 4 and deterring businessesfrom locating in those areas. 15 These dynamics suggest that incar-ceration is not simply a consequence of neighborhood crime, butinstead may transform into an intrinsic part of the ecological dy-namics of neighborhoods that may actually elevate crime withinneighborhoods. The locus of these effects is at a small social level:within neighborhoods or other small spatial aggregates. Identify-ing and estimating these dynamics is the focus of this Essay.
This Essay uses data from New York City on neighborhood ratesof incarceration in jail or prison in five waves over a twelve-yearperiod beginning in 1985. New York City experienced an epidemic
10. JAMES P. LYNCH & WILLIAM J. SABOL, DID GETTING TOUGH ON CRIME PAY?
(1997); Bruce Western et al., The Labor Market Consequences of Incarceration, 47CRIME & DELINQ. 410, 424 (2001).
11. SARA McLANAHAN & GARY SANDEFUR, GROWING UP WITH A SINGLE PAR-ENT: WHAT HURTS, WHAT HELPS 136-37 (1994); Hagan & Dinovitzer, supra note 3,at 126-28; Sara McLanahan & Larry Bumpass, Intergenerational Consequences ofFamily Disruption, 94 AM. J. Soc. 130, 142-43 (1998).
12. Richard Curtis, The Improbable Transformation of Inner-City Neighborhoods:Crime, Violence, Drugs and Youth in the 1990s, 88 J. CRIM. L. & CRIMINOLOGY 1233,1263-67 (1998). See generally ROBERT JACKALL, WILD COWBOYS: URBAN MARAUD-
ERS AND THE FORCES OF ORDER (1997).13. Jeffrey Fagan & Tracey Meares, Punishment, Deterrence and Social Control:
The Paradox of Punishment in Minority Communities, PUNISHMENT & SOC'Y (forth-coming 2003); Daniel Nagin, Criminal Deterrence Research at the Outset of theTwenty-First Century, 23 CRIME & JUST.: REV. RES. 1, 33-36 (1999); Christopher Ug-gen & Jeff Manza, Democratic Contraction? Political Consequences of Felon Disen-franchisement in the United States, 67 AM. Soc. REV. 777 (2002). See generally JOHNJACKSON, HARLEMWORLD: DOING RACE AND CLASS IN CONTEMPORARY BLACK
AMERICA (2001).14. Mark S. Granovetter The Strength of Weak Ties, 78 AM. J. Soc. 1360, 1371-72
(1973); see MARK S. GRANOVE-rER, GETTING A JOB: A STUDY OF CONTACTS ANDCAREERS 131-38 (1974).
15. Granovetter, supra note 14, at 131-38.
2003] 1553

FORDHAM URBAN LAW JOURNAL [Vol. XXX
of drugs and serious violence that peaked over a decade ago, andthen fell steeply in the ensuing years.' 6 Rates of incarcerationspiked sharply after 1985 as crime rates rose.17 Higher incarcera-tion rates persisted through the 1990s, declining far more slowlythan the sharply falling crime rates.' 8 We show that the use of in-carceration, especially prison, seems to have differential effectsacross the City's neighborhoods and police precincts, and that theoverall excess of incarceration rates over crime rates seems to beconcentrated among non-white males living in the City's poorestneighborhoods.
We then show that neighborhoods with high rates of incarcera-tion invite closer and more punitive police enforcement and parolesurveillance, contributing to the growing number of repeat admis-sions and the resilience of incarceration, even as crime rates fall.Incarceration begets more incarceration, and incarceration also be-gets more crime, which in turn invites more aggressive enforce-ment, which then re-supplies incarceration. These dynamics spiralover time in a reciprocal dynamic that at some tipping point islikely to reach equilibrium. 9 It is, quite literally, a vicious cycle.The dynamic becomes self-sustaining and reinforcing, and contin-ues even as externalities such as labor market dynamics or popula-tion structure undergo significant change, as well as in the face ofdeclining crime rates and receding drug epidemics.
The Essay then examines social, economic, legal, and politicalmechanisms through which spatial concentration transforms aspike in incarceration from an acute external shock into an endur-ing internal feature of the neighborhood fabric, a dynamic processthat then persists regardless of law or policy, and well in excess ofthe supply of criminals. The constant rearrangement of social net-works through removal and return of prisoners becomes a systemicpart of neighborhood life and its social norms. Incarceration cre-ates a supply of both crime and more incarceration. We illustratethe contributions of law and policy to incarceration dynamics thatpersist even in eras of declining crime. When high incarcerationrates are internalized into the ecology of small, homogeneousneighborhoods, it adversely affects the economic fortunes, politicalparticipation, family life, and normative orientation of people liv-
16. Jeffrey Fagan et al., Declining Homicide in New York: A Tale of Two Trends,88 J. CRIM. L. & CRIMINOLOGY 1277, 1277 (1998).
17. Id. at 1285-86.18. Id.19. See infra Part III.A.
1554

RECIPROCAL EFFECTS
ing in the social context of imprisonment and its aftermath. TheEssay concludes with a discussion of how this concentration dis-torts the relationships between citizens and the law, both to thoseliving in areas affected by these dynamics, and those outside whoseviews of these neighborhoods and their residents influence theirpolicy preferences.
I. CRIME AND INCARCERATION IN NEW YORK CITY
Beginning in the 1980s and continuing today, the number of per-sons incarcerated in the United States increased massively, inca-pacitating many criminals and increasing the risks of punishmentfor those still active.20 Between 1975 and 1989, the total annualprison population of the United States nearly tripled, growing from240,593 to 679,623 inmates in custody, an increase of 182 percent. 21
The trend continued uninterrupted through 1996, when the prisonpopulation rose to 1,138,984.22 Put another way, the incarcerationrate rose from about 145 per 100,000 population in 1980, to 445 per100,000 in 1997.23 Both the likelihood of being committed toprison, and the average sentence length once committed, increaseddramatically over that time.24
Incarceration trends in New York City and State have followedsimilar trends.25 New York State's prison population-approxi-mately seventy percent of State inmates come from New YorkCity-is now nearly 70,000, up from 55,000 in 1990.26 And NewYork City's average daily jail inmate population was 17,897 in 1999,which is only slightly lower than the 1990 population of 19,643.27
20. See Blumstein & Beck, supra note 1; Jacquline Cohen & Jose Canela-Cacho,Incarceration and Violent Crime, in 4 UNDERSTANDING AND PREVENTING VIOLENCE296, 298-307 (Albert J. Reiss, Jr. & Jeffrey A. Roth eds., 1994); Steven Levitt, TheEffect of Prison Population Size on Crime Rates: Evidence from Prison OvercrowdingLitigation, 111 Q. J. ECON. 319, 319 (1996).
21. See BUREAU OF JUSTICE STATISTICS, U.S. DEP'T OF JUSTICE, CORRECTIONALPOPULATIONS IN THE UNITED STATES, NCJ-170013 (1999).
22. See Blumstein & Beck, supra note 1, at 22 tbl. 1 (citing data from the Bureauof Justice Statistics and the Bureau of the Census (various years)).
23. Id. at 18. This includes both state and federal prisoners, but excludes personsin county jails.
24. Id.25. See infra note 26 and accompanying text.26. In 1987, seventy-five percent of all New York State prison admissions
originated from cases disposed in New York City, sixty-nine percent in 1990, andsixty-nine percent in 1994. NYS Division of Criminal Justice Services ("DCJS") andNational Corrections Reporting Program ("NCRP").
27. New York City Department of Correction ("DOC") website, at http://www.ci.nyc.ny.us/html/doc/home.html (last visited July 15, 2003).
20031 1555

FORDHAM URBAN LAW JOURNAL [Vol. XXX
Rates of incarceration in New York City have been largely unaf-fected by the City's dramatic declines in crime.28 Since 1990, whencrime rates began to drop, the number of people receivingsentences of incarceration in the city-either prison or jail-hashovered between 78,000 and 96,000.29 In fact, the number of peo-ple sentenced to incarceration in 1990-the height of the City'smost recent crime wave-is comparable to the number in 1997(92,261 and 93,141, respectively), despite the fact that by 1997crime counts were at an eight year low.3" Between 1990 and 1997,the city experienced a fifty percent decline in the number of indexcrimes, yet the number of prison sentences imposed declined byonly nineteen percent.
The increase in incarceration may be attributed to aggressive en-forcement of drug laws, especially street-level enforcement, result-ing in large numbers of felony arrests of retail drug sellers.3 Forover a decade, drug-related offenses have accounted for an increas-ing proportion of prison admissions: from just twelve percent of allNew York State prison admissions in 1985, to thirty-one percent in1990, to thirty-eight percent in 1996.32 Despite the dramatic de-creases in crime in New York City,33 drug-related arrests have con-tinued to increase,3 4 and continue to incarcerate large numbers of
28. Over the past decade, New York City has experienced a steady decline incrime rates that ranks among the largest decreases of any American city. The totalnumber of homicides dropped from a record high of 2,262 in 1990 to 606 in 1998-thelowest homicide count since 1964. As the number of homicides declined steadily,other serious crime also decreased, but not at the same rate. Overall, the total num-ber of index crimes in New York City dropped by fifty percent between 1990 and1997, and violent crimes dropped by forty-seven percent. Felony arrests dropped byonly twelve percent and misdemeanor arrests increased by seventy-three percent inthe same period, however, despite the dramatic decrease in overall crime numbers.
29. Division of Criminal Justice Services, New York State, Selection for CriminalJustice Indicators, at http://criminaljustice.state.ny.us/crimnet/ojsa/areastat/areast.htm(last visited July 15, 2003).
30. Id.31. See Blumstein & Beck, supra note 1, at 30; see also MICHAEL TONRY, MALIGN
NEGLECT: RACE, CRIME, AND PUNISHMENT IN AMERICA 81 (1995).32. BUREAU OF JUSTICE STATISTICS, U.S. DEP'T OF JUSTICE, NATIONAL CORREC-
TIONS REPORTING PROGRAM, 1985 (1997) [hereinafter NATIONAL CORRECTIONS RE-PORTING PROGRAM, 1985]; BUREAU OF JUSTICE STATISTICS, U.S. DEP'T OF JUSTICE,NATIONAL CORRECTIONS REPORTING PROGRAM, 1990 (1997) [hereinafter NATIONALCORRECTIONS REPORTING PROGRAM, 1990]; BUREAU OF JUSTICE STATISTICS, U.S.DEP'T OF JUSTICE, NATIONAL CORRECTIONS REPORTING PROGRAM, 1996 (1998)[hereinafter NATIONAL CORRECTIONS REPORTING PROGRAM, 1996].
33. ANDREW KARMEN, NEW YORK MURDER MYSTERY 1-13 (2000); Fagan et al.,supra note 16, at 1277.
34. From 1990 to 1997, misdemeanor drug arrests in New York City were steadilyincreasing-accounting for twenty-seven percent of all misdemeanor arrests in 1990
1556

RECIPROCAL EFFECTS
New York City residents-11,600 entered New York State prisonson drug-related offenses in 1995, compared with 9,345 in 1990.35
Because these inmates are likely to serve longer sentences, drugoffenders comprised a growing proportion of the City's and State'sincarcerated population.
Table 1 shows the dynamics of crime, enforcement, prosecution,and sentencing that have contributed to incarceration growth be-ginning in 1985, the year before the onset of the crack epidemic inNew York, and continuing through 1997, when crime had declinedsharply in the City.36 The table shows that the number and rate ofprison sentences (per arrest and per conviction) rose at a fasterpace than did crime from 1985 through 1990, and then declinedmore slowly than did crime from 1991 through 1997. 37 Reportedindex crimes, including violent felonies and major property crimes,rose by nearly eighteen percent from 1985 through 1990, but felonyarrests rose by nearly forty percent and felony prosecutions grewby eighty percent during this period. 8
Drug cases accounted for the majority of the increase in prosecu-tions, perhaps motivated by the increased opportunities for incar-ceration created by legislation lowering the thresholds for felonydrug convictions and mandating prison sentences for "predicate"felony offenders with prior felony convictions. 39 Even as convic-
to thirty-one percent in 1997. During the same period, felony drug arrests remainedrelatively stable-accounting for approximately thirty-two percent of all felony ar-rests. Division of Criminal Justice Services, New York State, Criminal Justice Indica-tors By Percent Change New York City: 1990-1997, at http://criminaljustice.state.ny.us/crimnet/ojsa/areastat/areast.htm (last visited July 15, 2003).
35. Id.36. New York City's crime decline has been well documented and studied exten-
sively. See, e.g., KARMEN, supra note 33, at 1233-38; GEORGE L. KELLING & WIL-
LIAM H. SOUZA JR., Do POLICE MATTER? AN ANALYSIS OF THE IMPACT OF NEWYORK CITY'S POLICE REFORMS 1 (2001), available at http://www.manhattan-institute.org/cr_22.pdf (last visited July 15, 2003); Curtis, supra note 12, at 1241-42; Fagan et al.,supra note 16, at 1277. There are disagreements over the sources of the decline. Cur-tis attributes the decline to shrinking demand for drugs, while Karmen attributes thedecline to the interaction of social forces including employment, demography, andpolicing strategy. Fagan et al. view the crime decline as indexed to an epidemic of gunviolence that receded sharply after 1991. Kelling and Souza see the crime decline asthe result of aggressive policing of social and physical disorder, which in turn hadprophylactic effects on crime rates.
37. See Tbl. 1.38. See Tbl. 1.39. Susan N. Herman, Measuring Culpability by Measuring Drugs? Three Reasons
to Re-evaluate the Rockefeller Drug Laws, 63 ALB. L. REV. 777, 788 (2000); MichaelZ. Letwin, Report from the Front Line: The Bennett Plan, Street-Level Drug Enforce-ment in New York City, and the Legalization Debate, 18 HOFSTRA L. REV. 795, 821(1990); Lisa R. Nakdai, Are New York's Rockefeller Drug Laws Killing the Messenger
2003] 1557

FORDHAM URBAN LAW JOURNAL [Vol. XXX
TABLE 1CRIME, ARREST, AND PUNISHMENT, NEW YORK CITy, 1985-97
1% Change % Change % Change1985 1990 1995 1997 1985-90 1985-97 1990-97
Reported Crime
Total Index Crimes 602,945 711,556 442,532 356,573 18.0 (40.9) (49.9)
Violent Crimes 135,305 174,689 114,180 92,866 29.1 (31.4) (46.8)
% Violent Crimes 22.4 24.6 25.9 26 9.8 16.1 5.7
Arrests
Felony Arrests 106,530 148,171 135,128 130,309 39.1 22.3 (12.1)
Felony Drug Arrests 21,008 47,838 43,697 41,728 127.7 98.6 (12.8)
% Felony Drug Arrests 19.7 32.3 32.3 32 64.0 62.4 (0.9)
Felony Arrests per IndexCrime 0.177 0.208 0.305 0.365 17.5 106.2 75.5
Misdemeanor Arrests 127,222 118,634 181,565 204,979 (6.8) 61.1 72.8
Misdemeanor DrugArrests 34,899 33,056 52,892 63,879 (5.3) 83.0 93.2% Misdemeanor Drug
Arrests 27.4 27.9 29.1 31.2 1.8 13.9 11.8
Prosecution
Felony Prosecution-Indictments 30,416 54,837 42,758 37,041 80.3 21.8 (32.5)
Violent 15,745 19,714 13,064 11,239 25.2 (28.6) (43.0)
% Violent CrimeProsecutions 51.8 36 30.6 30.3 (30.5) (41.5) (15.8)
Drug 7,702 27,071 22,377 18,964 251.5 146.2 (29.9)
% Felony DrugProsecutions 25.3 49.4 52.3 51.2 95.3 102.4 3.6
Convictions 150,080 159,411 175,203 203,797 6.2 35.8 27.8
Convictions per 100Felony Arrests 140.88 107.58 129.66 156.39 (23.6) 11.0 45.4
Sentences 75,264 92,261 79,845 93,141 22.6 23.8 1.0
Prison 10,802 20,420 18,353 16,490 89.0 52.7 (19.2)
Jail 61,839 66,035 55,957 71,508 6.8 15.6 8.3
Jail + Probation 2,623 5,806 5,535 5,143 121.3 96.1 (11.4)
Incarceration Ratios
Prison Sentences per 100Index Crimes 1.79 2.86 4.15 4.62 59.8 158.1 61.5
Prison Sentences per 100Felony Prosecutions 35.5 37.2 42.9 44.5 4.8 25.4 19.6
Prison Sentences per 100Convictions 7.2 12.8 10.5 8.8 77.8 22.2 (31.3)
Jail Sentences per 100Misdemeanor Arrests 50.7 60.6 33.9 37.4 19.5 (26.2) (38.3)
Source: New York State Division of Criminal Justice Services, various years
1558

RECIPROCAL EFFECTS
tions remained relatively stable, prison sentences nearly doubledduring that time, from 10,802 to 20,420.40 It appears, then, thatsentencing accounted for the growth in imprisonment during thistime, with prison sentences growing at a faster rate than the crimerate, the felony complaint rate, and the rate of convictions. In gen-eral, the period of 1985 to 1990 saw sharp increases in index crimes,felony arrests, prosecutions, and incarceration. Index crimes, fel-ony arrest, and prosecutions receded dramatically, however, after1990. Incarceration did not follow this dramatic recession.
The effects of the predicate felony law can be seen in Table 2.We analyzed the prior criminal records of a twenty-five percentsample of prison admissions of convicted offenders from New YorkCity over five waves from 1985-96. 1 The percent of new prisonadmissions with prior arrests, prior convictions, and prior jailsentences rose only slightly over the period.42 For example, forty-eight percent of prison admissions in 1985 had prior jail sentences;by 1996, fifty-five percent had prior jail sentences. New prison ad-missions with prior prison sentences, however, rose nearly fifty per-cent from 1985 to 1996, from twenty-six percent in 1985, to thirty-nine percent in 1996. Over time, the prison admissions were drawnfrom the ranks of previously incarcerated prisoners. The recyclingof prisoners was a driving force in maintaining high prison popula-tions even in an era of sharply declining crime rates.
A. Drugs and Incarceration
The increase in incarceration nationally has been attributed inlarge part to aggressive enforcement of drug laws, especially street-level enforcement resulting in large numbers of felony arrests ofretail drug sellers.43 For over a decade, drug-related offenses haveaccounted for an increasing proportion of prison admissions: fromjust twelve percent of all New York State prison admissions in1985, to thirty-one percent in 1990, to thirty-eight percent in 1996.44
for the Sake of the Message?, 30 HOFSTRA L. REV. 557, 560 (2001); see infra Part ILA,on predicate felon sentencing laws.
40. See Tbl. 1.41. See infra Part ILA, for a discussion of the sampling and data collection
methods.42. See Tbl. 1.43. See Blumstein & Beck, supra note 1, at 30; see also TONRY, supra note 31, at
97-104.44. NATIONAL CORRECTIONs REPORTING PROGRAM, 1985, supra note 32; NA-
TIONAL CORRECTIONS REPORTING PROGRAM, 1990, supra note 32; NATIONAL COR-
RECTIONS REPORTING PROGRAM, 1996, supra note 32.
2003] 1559

1560 FORDHAM URBAN LAW JOURNAL [Vol. XXX
TABLE 2PROPORTION OF PRISON ADMISSIONS BY PRIOR CRIMINAL JUSTICE
INVOLVEMENT, 1985-96
Prior Jail Prior PrisonYear Prior Arrests Prior Convictions Sentences Sentences
1985 .77
1987 .77
1990 .78
1993 .80
1996 .80
.67 .48 .26
.68 .51 .24
.68 .53 .26
.71 .55 .38
.72 .55 .39
Source: New York State Division of Criminal Justice Services, Twenty-Five PercentSample of Prison Admissions over Five Waves, 1985-96
Despite the dramatic decreases in crime in New York City,4 5 drug-related arrests have continued to increase, 46 and continue to incar-cerate large numbers of New York City residents-11,600 enteredNew York State prisons on drug-related offenses in 1995, com-pared with 9,345 in 1990.47 Because these inmates are likely toserve longer sentences, drug offenders make up an increasing pro-portion of the City's and State's incarcerated population.
Table 1 shows that from 1985-97, most of the growth in felonyarrest and prosecution was for drug offenses, which were the pri-mary targets of sentencing legislation during this time.48 Felonydrug arrests more than doubled during this period, while misde-meanor drug arrests remained stable. Table 1 also shows that fel-ony drug prosecutions rose by nearly 250 percent from 1985 to1990, a pace twice as great as the rise in felony drug arrests. Al-though convictions rose far more slowly during this time, the rateof prison sentences per one hundred convictions rose from 7.2 to12.8,49 an increase of more than seventy-five percent. From 1990-97, this rate declined by 31.3 percent while the crime rate in NewYork City fell by half. Since drug offenses accounted for much ofthe growth in prosecution, it is safe to assume that the rise in prison
45. KARMEN, supra note 33, at 1-14; Fagan et al., supra note 16, at 1277.46. From 1990 to 1997, misdemeanor drug arrests in New York City were steadily
increasing-accounting for twenty-one percent of all misdemeanor arrests in 1990 tothirty-one percent in 1997. During the same period, felony drug arrests remainedrelatively stable-accounting for approximately thirty percent of all felony arrests.Division of Criminal Justice Services, New York State, Criminal Justice Indicators ByPercent Change New York City: 1990-1997, at http://criminaljustice.state.ny.us/crimnet/ojsa/areastat/areast.htm (last visited July 15, 2003).
47. Id.48. See Tbl. 149. See Tbl. 1

RECIPROCAL EFFECTS
sentences per conviction was due mainly to the growth of drugconvictions.
Several features of drug law and policy contributed to the dispro-portionate share of drug offenders among the newly incarcerated.First, New York implemented a series of intensive street-level en-forcement initiatives during this time, each focusing on aggressivebuy-and-bust tactics to snare drug sellers and some buyers. Oneinitiative was Operation Pressure Point ("OPP"), launched in themid-1980s, focusing on outdoor retail drug markets in the LowerEast Side neighborhood of Manhattan.5 0 Following the onset ofthe crack epidemic, a second initiative replicated the PressurePoint strategy in neighborhoods across the City.51 In 1988, a rela-tively small Crack Squad within the Narcotics Division of the NewYork City Police Department ("NYPD") was expanded to becomethe Tactical Narcotic Teams ("TNT"). 52 TNT teams were deployedmainly in minority neighborhoods where the visible crack trademade an inviting target that produced thousands of felony drug ar-rests.5 3 These were among the poorest neighborhoods in the City,with median incomes well below the poverty line, and areas wherenon-whites lived under conditions of intense racial segregation. 4
Second, drug sentencing laws were amended during this time tomandate longer sentences for possession of even small amounts ofcocaine.55 By 1987, the New York State legislature had enactedbroad changes in sentencing for many drug offenses, includingmandatory incarceration and lengthened sentences for even smallamounts of drugs.56 "Predicate felony" laws passed during this
50. LYNN ZIMMER, OPERATION PRESSURE POINT 4-7 (occasional paper of N.Y.U.Center for Crime and Justice 1987).
51. MICHELE SVIRIDOFF ET AL., VERA INST. OF JUSTICE, THE NEIGHBORHOOD
EFFECTS OF STREET-LEVEL DRUG ENFORCEMENT: TACTICAL NARCOTICS TEAMS IN
NEW YORK 11-40 (1992).52. Id.53. Jeffrey Fagan & Ko-lin Chin, Initiation into Crack and Cocaine: A Tale of Two
Epidemics, 16 CONTEMP. DRUG PROBS. 579, 608-09 (1989).54. Sviridoff et al., supra note 51.55. SVIRIDOFF ET AL., supra note 51; Fagan & Chin, supra note 53; Letwin, supra
note 39, at 804 n. 57; see STEVEN BELENKO, CRACK AND THE EVOLUTION OF ANTI-DRUG POLICY 115-54 (1993).
56. See N.Y. PENAL LAW § 220 (McKinney 1998); WILLIAM C. DONNINO, PRAC-
TICE COMMENTARIES (McKinney 1989). With respect to cocaine, in 1988, "criminalpossession of a controlled substance in the fifth degree" was amended to add theknowing and unlawful possession of "five hundred milligrams or more of cocaine." L.1988, c. 178; N.Y. PENAL LAW § 220.05(5). The purpose of the amendment was totake into account the widely-used form of cocaine known as "crack." Crack is a con-centrated form of cocaine which is exceptionally potent and addictive. The desiredeffect from the use of the crack may be obtained by the use of a substantially smaller
2003] 1561

FORDHAM URBAN LAW JOURNAL [Vol. XXX
time also contributed to the rise in imprisonment by mandatingprison sentences for felony offenders with any prior felony convic-tion.57 In addition to the already harsh, proscriptive, and inflexible"Rockefeller Drug Laws,"5 8 the predicate felony statutes, in prac-tice, elevated the prison population by indexing the incarcerationrate to the arrest rate, thus denying judicial discretion in sentencingrepeat offenders.5 9 The effects of the predicate felony statuteslanded most heavily on both drug offenders and violent offend-ers.6" The intersection of these policies, fueled by calls for evertougher enforcement of penalties against drug dealers, was the en-
quantity than would be required to obtain the same effect from the traditional form ofcocaine. Thus, crack is generally sold to users in vials containing a small quantity ofthe drug. To the extent the distinction between misdemeanor and felony possessionrests philosophically on a distinction between minor use and either significant use orthe likelihood that the possessor was selling or sharing the drug, the aggregate weightstandard for cocaine was deemed unrealistically high as the threshold for liability forfelony possession of crack. Thus, criminal possession of a controlled substance in thefifth degree, a class D felony, was amended to encompass the possession of 500 milli-grams or more of cocaine. In part because of the chemical properties of crack, andbecause of a growing belief that liability for possession of a controlled substanceshould be based solely on the quantity of the drug possessed, liability for the posses-sion of the 500 milligrams of cocaine is premised on the "pure" or actual weight of thedrug, not the aggregate weight of the substance containing the drug. The remainingcrimes of criminal possession and sale of cocaine, however, utilize the aggregate stan-dard. Cf N.Y. PENAL LAW §§ 220.06(5), .09(1), .16(12), .18(1), .21(1).
57. See id. § 70.06(1). The law defines a predicate felony offender as a secondviolent felony offender whose previous felony conviction occurred within the past tenyears. Prior felony convictions which resulted in a suspended sentence, a probationsentence, a sentence of conditional or unconditional discharge, or any other sentence,were considered eligible for predicate felony sentencing upon a second felony convic-tion. Sentencing for predicate felons reverts to the minimum standards
58. Id. §§ 220.00-.65. The 1973 Act distinguished between degrees of possessionand sale by weight of the prohibited substance. This was a departure from previouslaws that classified only certain drugs such as heroin, morphine, and cocaine into de-grees, which were differentiated by the quantity of the preparation, compound, mix-ture, or substance containing the drug. Under this system, drug offenses are gradedaccording to the dangerousness and the quantity of the drug involved. Dangerousnessof a drug is determined by consulting detailed schedules of controlled substances, withthe drugs considered most harmful listed in Schedule I, and those classified as theleast harmful in Schedule V. The 1973 Act made the possession or sale of a specifiedamount of a broader variety of drugs a felony, thus, three categories of drug posses-sion and three categories of sale required mandatory imprisonment carrying mini-mum ranges of one year to life (A-III), six years to life (A-II), or fifteen years to life(A-I).
59. See, e.g., Gerard E. Lynch, Sentencing Eddie, 91 J. CRIM. L. & CRIMINOLOGY
547, 550-51 (2001) (presenting a rich case study illustrating the tensions between theintent and impact of structured sentencing laws that deny judges the latitude to weighculpability in the context of complex life histories of repeat drug offenders).
60. Herman, supra note 39, at 777-79.
1562

RECIPROCAL EFFECTS
gine behind New York's historic expansion of its prison populationduring this time.61
The increasing share of prison admissions for drug crimes can beseen in Figure 1. We analyzed the conviction charge for a twentyfive percent sample of prison admissions of convicted offendersfrom New York City over five waves from 1985-96.62 The percentthat were convicted on drug sale charges nearly tripled from 1985to 1996: from 16.9 to 47.9 percent.63 For drug possession, the in-crease was more than double: from 5.4 to 11.2 percent. 64 The pro-portion convicted for violent crimes declined by more than halfduring the same period: from 47.5 to 21.5 percent. The decline forproperty crimes was also nearly fifty percent. Drug enforcementwas the engine for the growth and then the stability of incarcera-tion in New York City for over a decade, even as other felonycrime rates declined sharply. The durability of drug enforcementas a source of prison populations over time and across distinctlydifferent crime "eras" suggests that just as incarceration shifts froman externality to an endogenous feature of neighborhood social or-ganization, so too does drug enforcement become an endogenousfeature of the social organization and political economy of lawenforcement.
B. Incarceration Growth and Declining CrimeTable 1 shows that even as crime began its historic decline in
New York City in 1991 and accelerated by 1994, drug arrests re-mained at their 1990 levels, and convictions for drug sale and pos-session continued to fuel incarceration rates. From 1990 to 1995,reported index crimes declined by nearly forty percent: from711,556 to 442,532. Within two more years, index crimes droppedfurther to 356,573, an overall decline of nearly fifty percent from itspeak in 1990. Yet, felony arrests declined by twelve percent, only afraction of the decline in crime.
The engine for the growth and stability of the incarceration ratewas the replacement of drug enforcement programs such as OPPand TNT with new initiatives that embedded politically populartheories of Zero Tolerance and Order Maintenance Policing 65 into
61. Letwin, supra note 39, at 803-04.62. See infra Part II.A., for a description of research methods.63. See infra Fig. 1.64. See infra Fig. 1,65. Jeffrey Fagan & Garth Davies, Street Stops and Broken Windows: Terry, Race,
and Disorder in New York City, 28 FORDHAM URB. L.J. 457, 467 (2000); Debra Liv-ingston, Police Discretion and the Quality of Life in Public Places: Courts, Communi-
2003] 1563

FORDHAM URBAN LAW JOURNAL
FIGURE 1.PERCENT OF PRISON ADMISSIONS BY OFFENSE TYPE, NEW
YORK CITY, 1985-86
Source: New York State, Division of Criminal Justice Services,Twenty-Five Percent Sample of Prison Admissions, various years.
drug enforcement. Drug arrests remained at a persistently highlevel, even as arrests for other crimes, including violent felonies,declined sharply.66 Policy preferences dictated this course of ac-tion. For example, Operation Condor, launched in 1999, was aninitiative of the NYPD that used overtime pay to motivate police
ties, and the New Policing, 97 COLUM. L. REV. 551, 556 n.14 (1997); Sarah E. Waldeck,Cops, Community Policing, and the Social Norms Approach to Crime Control. ShouldOne Make Us More Comfortable with the Others?, 34 GA. L. REV. 1253, 1273 (2000);see Judith Greene, Zero-Tolerance: A Case Study of Police Policies and Practices inNew York City, 45 CRIME & DELINQ. 171, 173 (1999).
[Bratton quickly] introduced new management tools, techniques and tech-nology, ... and moved quickly to decentralize authority and to wrest deci-sion-making power away from headquarters brass and move it out to theprecinct and borough commands. He broke down a maze of bureaucraticbarriers-pushing, prodding, and (when necessary) replacing personnel. Hewas able to integrate many of the police functions previously held by special-ized units to empower patrol officers to move directly to address drug andgun crimes in the neighborhoods they serve.
Id.; see also ELI SILVERMAN, NYPD BATTLES CRIME: INNOVATIVE STRATEGIES INPOLICING 153-54 (1999).
66. See supra note 63 and accompanying text.
1564 [Vol. XXX

RECIPROCAL EFFECTS
officers to use both buy-and-bust tactics and reverse stings to makedrug arrests.67 At its height, the program paid for an additional1,000 officers on the street each day.68 As in other zero-tolerancepolicies, Condor was designed to detect more serious offendersamong drug purchasers and sellers who were caught in Condor'sstings.69
Operation Condor produced tens of thousands of drug arrestsacross the City each year, but its tactics raised complaints from mi-nority citizens about its racial disproportionality, and the excessiveuse of the full criminal justice process (including the use of pretrialdetention rather than summons) for low-level drug offenderswhose crimes were mostly non-violent and who posed a minimalpublic safety threat.70 Large numbers of individuals were broughtin on drug charges ranging from misdemeanor marijuana posses-sion to possession of controlled substances (powder cocaine, crack,or heroin). 71 The death of Patrick Dorismond, an unarmed citizenapproached by Condor officers who tried to sell him marijuana,during an Operation Condor arrest, heightened racial tensions be-tween minority citizens and the police.72
Accordingly, the felony arrest rate per index crime rose by sev-enty-five percent from 1990 to 1997, a product of policy preferencefor aggressive law enforcement and narrow prosecutorial discretionthat led to formal and full criminal processing for nearly all ar-rests. 73 While prosecutions declined by nearly a third during thisperiod, the rate of convictions per arrest rose by more than forty-five percent.7 4 Thus, as the supply of arrestees and felony defend-ants grew smaller, the number of persons sentenced to prison de-clined by 19.2 percent from 1990 to 1997. 75 The imbalance indeclines-incarceration declining more slowly than the crime
67. William Rushbaum, Police Suspend Extra Patrols for 10 Days, N.Y. TIMES,Oct. 12, 2000, at B1.
68. Id.69. Id.70. Id.; see also Christopher Ketcham, Roach Motel, SALON, Oct. 17, 2002, at http:/
/archive.salon.com/mwt/feature/2002/10/17/jail-time/index-np.html (last visited July15, 2003).
71. Rushbaum, supra note 67, at B1.72. Jeffrey Rosen, Excessive Force: Why Patrick Dorismond Didn't Have To Die,
NEW REPUBLIC, Apr. 10, 2000, at 24.73. For a description of this type of processing, see Ketcham, supra note 70; see
also WILLIAM BRATrON & PETER KNOBLER, TURNAROUND: How AMERICA'S TopCop REVERSED THE CRIME EPIDEMIC 224-30 (1998). Full processing included book-ing, fingerprinting, and detention, in lieu of issuing desk appearance tickets.
74. See Tbl. 1.75. See Tbl. 1.
2003] 1565
FORDHAM URBAN LAW JOURNAL [Vol. XXX
rate-again reflects the narrowing of discretion in sentencing andthe continuing rise in incarcerations per felony prosecution.
II. EMPIRICAL RESEARCH
Here, we present empirical analyses of the impact of incarcera-tion on crime and subsequent incarceration at two levels of aggre-gation: police precinct and neighborhood. Neighborhood isimportant in the social regulation of both legal and illegal behav-ior;76 also because of this, it is the locus at which criminogenic fac-tors exert their influence on the everyday lives of neighborhoodresidents.77 Police precinct is also relevant and important becausethe social organization of law enforcement functions at this level.Policies are implemented and managed within precincts, and citi-zens interact with police assigned to specific precincts. 78 Accord-ingly, we assess the reciprocal effects of crime and incarceration atboth the level of neighborhood and police precinct.
The research proceeds in three stages. First, we show graphicallythe changing patterns and concentration of incarceration first inpolice precincts and then in neighborhoods. Next, we estimate sta-tistical models to assess the effects of incarceration on crime andsubsequent incarceration over time. The models estimate the en-dogeneity of incarceration and its effects on neighborhood crimerates in five waves over a twelve year period beginning in 1985.Incarceration patterns and practices affect neighborhoods by bothremoving and returning individuals to the community. In someneighborhoods, it is not uncommon for certain residents to cyclebetween the prison system and their communities several times.79
We then elaborate the components of this dynamic by includinglaw enforcement measures as factors that produce the supply ofpersons for incarceration at each level of aggregation. Accord-ingly, we examine how law-enforcement patterns-specifically
76. Robert J. Sampson et al., Neighborhoods and Violent Crime: A MultilevelModel of Collective Efficacy, 277 SCIENCE 918, 918 (1997); Robert J. Sampson &Stephen W. Raudenbusch, Systemic Social Observation of Public Spaces: A NewLook at Disorder in Urban Neighborhoods, 105 AM. J. Soc. 603, 604 (1999).
77. See Sampson et al., supra note 76, at 918; see also RALPH B. TAYLOR, BREAK-ING AWAY FROM BROKEN WINDOWS 7-17 (2000); Ralph Taylor & Jeannette Coving-ton, Neighborhood Changes in Ecology and Violence, 26 CRIMINOLOGY 553, 554-57(1988).
78. See BRATTON & KNOBLER, supra note 73, at 229-30.79. D.J. Silton, Note, U.S. Prisons and Racial Profiling: A Covertly Racist Nation
Rides a Vicious Cycle, 20 LAW & INEQ. 53, 65 (2002).
1566

RECIPROCAL EFFECTS
those aimed at combating drug-related crime-contribute with so-cial structural factors to influence patterns of incarceration.
A. Research Design
We constructed a longitudinal panel of incarceration and crimein New York City police precincts and census tracts for the periodfrom 1985 to 1996. We obtained a twenty-five percent sample of allindividuals sentenced to prison and a five percent sample of all jailsentences for cases with dispositions in New York City for theyears 1985, 1987, 1990, 1993, and 1996. This yielded an annual sam-ple of prison sentences of 2,000 to 4,000 individuals, and an annualsample of jail sentences of 3,000 to 4,000 individuals.
Records of persons admitted to prisons or jails were geocodedby residential address of the incarcerated person. Geocoded casesand crime counts were aggregated to each spatial unit. Rates ofcrime and incarceration were then computed for each spatial unit.Census tracts were aggregated into seventy-five police precinctsand 295 neighborhoods, spatial units constructed based on aschema, developed by Professors Kenneth Jackson and John Man-beck,80 of interviews with neighborhood residents and physical ex-amination of naturally occurring neighborhood boundaries."' Thefinal sample of neighborhoods is 276, after eliminating areas withno population, such as parks and heavily industrialized areas. 2
We use pooled data methods to establish neighborhood-year andprecinct-year data points8 3 to approximate a linear panel. Poolingthe data for each aggregation unit across years has the advantageof increasing the sample size for each model to N(T-1) cases, whereN represents the total number of neighborhoods (or precincts), andT represents the number of years of data in the model. With N=75police precincts, pooling the data over years greatly increases the
80. KENNETH T. JACKSON & JOHN B. MANBECK, THE NEIGHBORHOODS OF
BROOKLYN Xii-Xvi (1998).81. See generally Infoshare Online, at http://www.infoshare.org (last visited July
15, 2003), for neighborhood indicators and boundary maps depicting these relativelynew spatial units.
82. Each neighborhood comprises several census tracts. Jackson and Manbeckdrew these boundaries based on an exhaustive process of interviews with local re-sidents and their own observation of physical boundaries. The final sample of neigh-borhoods is 276, after elimination of areas with no population, such as parks andheavily industrialized areas. See Infoshare Online, supra note 81, for neighborhoodindicators and boundary maps depicting these relatively new spatial units.
83. Lois W. SAYRS, POOLED TIME SERIES ANALYSIS 7-79 (1989).
2003] 1567

FORDHAM URBAN LAW JOURNAL [Vol. XXX
sample size.84 This method assumes, however, that the varianceover the pool, in this case across waves, is constant for the incarcer-ation rates in each neighborhood. This is likely not the case here.In order to account for variation over time, we treat time as both afixed effect for each year to represent the variance unique to eachcross-section, or year, and also as a random effect to estimate spe-cific year-by-year changes. We include interactions of each predic-tor by time to further specify the role of time in the series.
B. The Spatial Concentration of Incarceration in New York
We begin by showing the spatial concentration of incarcerationin New York City neighborhoods, and its changes over time.Emerging research in a few cities shows that incarceration has beenspatially concentrated in specific neighborhoods. In New YorkCity, arrests and incarcerations, both for drug and non-drug crimes,have long been spatially concentrated in the poorest neighbor-hoods.86 A study completed more than a decade ago, in the midstof the City's incarceration run-up from the mid-1980s, showed thatjust seven of New York City's fifty-five community board districtsaccounted for over seventy-two percent of all the State's prison-ers.87 The City's patterns of racial residential segregation 88 all butensures that the effects of racially-skewed street-level police en-forcement will translate into racially and spatially concentrated in-carceration in the City's poorest minority neighborhoods.
To illustrate the spatial concentration of incarceration and itspersistence over time in specific areas of New York, we drew mapsshowing the concentration of incarceration over time. Figure 2shows the concentration of incarceration by police precincts atthree points in time: 1985, 1990, and 1996. Figure 3 shows the
84. There are 276 neighborhoods, but we treat these similarly to facilitate compar-isons across models.
85. LYNCH & SABOL, supra note 10; Clear et al., supra note 6, at 46.86. Francis X. Clines, Ex-inmates Urge Return to Areas of Crime To Help, N.Y.
TIMES, Dec. 23, 1992, at Al.87. Id. The seven neighborhoods are Community Districts, which are fifty-five
administrative units responsible for channeling community views into citywide poli-cymaking. The seven areas are: the Lower East Side, the South Bronx, Harlem,Brownsville, Bedford-Stuyvesant, East New York, and South Jamaica. According tothe Department of City Planning, these were among the poorest areas of the City in1990. See New York City Department of City Planning, Community District Profiles,at http://www.ci.nyc.ny.us/html/dcp/html/lucds/cdstart.html (last visited July 15, 2003).
88. Frank F. DeGiovanni & Lorraine C. Minnite, Patterns of NeighborhoodChange, in DUAL CITY: RESTRUCTURING NEW YORK 267, 290-94 (John H. Mol-lenkopf & Manuel Castells eds., 1991).
1568

RECIPROCAL EFFECTS
changes in incarceration rates per neighborhood for the same threetime periods. Each spatial unit is meaningful in understanding theconcentration of crime and enforcement. Neighborhoods reflectsmall social areas where the effects of local social and economiccontexts are influential both on social control and on crime oppor-tunities.8 9 Precincts are the administrative unit at which enforce-ment policies are implemented and managed, and also wherepolice units form small organizational cultures and knowledge oflocal crime problems and actors.90
Both figures show that from 1985 to 1990, incarceration ratesspread outward from a small number of precincts or neighbor-hoods, and also intensified in the areas with the highest incarcera-tion rates five years earlier. By 1996, when crime rates haddeclined across neighborhoods and police precincts in the City, in-carceration remained very high in most of the areas where it washighest in 1990, and declined only slightly in a few others.91 Therewere virtually no precincts nor neighborhoods with high incarcera-tion rates in 1990 that became low incarceration areas by 1996.92In some areas, such as Washington Heights (in the northwest partof Manhattan) and southeastern Queens, incarceration rates roseduring this period of general crime decline.93 Overall, both figuresshow the stability of incarceration from 1990 to 1996, a period dur-ing which felony crimes declined by nearly fifty percent.
C. The Growth and Concentration of Incarceration and Crime
To identify the factors that contribute to the growth or recessionof incarceration, we completed several multivariate statistical mod-els to show how incarceration in one year might predict incarcera-tion rates in the following and later years. In these models, wecontrolled for population, crime and arrest rates, factors that pro-duce the supply of persons eligible for incarceration. Next, weused a similar procedure to estimate the effects of incarceration inone year on crime in the next and later years. In these models, wetreated jail and prison admissions as predictors of crime counts inprecincts and homicide rates in neighborhoods.
89. Robert J. Sampson et al., Assessing "Neighborhood Effects": Social Processesand New Directions in Research, 28 ANN. REV. Soc. 443, 443 (2002).
90. Id.91. See Figs. 2 & 3.92. See Figs. 2 & 3.93. See Figs. 2 & 3.
2003] 1569

FORDHAM URBAN LAW JOURNAL [Vol. XXX
Incarceration counts, offset by the area population, are esti-mated as a function of the social and economic characteristics ofthe area plus drug arrest activity (lagged by one wave). Similarly,homicide counts, offset by the area population, are estimated as afunction of the same neighborhood characteristics and crime con-texts. We log the population, crime counts, and drug arrest mea-sures. Separate models are estimated for jail, prison, and totalincarceration. Because of the contributions of jail to subsequentimprisonment,94 we include jail admissions as a predictor for theprison incarceration models.
We include drug arrests in both groups of models, although fordifferent reasons. We include drug arrests in models of incarcera-tion because they have been directly implicated in several studiesand accounts as contributors to the magnitude and concentrationof incarceration. 95 We include drug arrests in models of violence atthe neighborhood level because of the strong and persistent evi-dence of the contribution of drug problems, including both con-sumption and marketing, to the increase in homicides and otherviolent crimes in New York City from 1986-97.96
94. See Figs. 2 & 3.95. Blumstein & Beck, supra note 1.96. BELENKO, supra note 55, at 71-87. The concept of "contingent causation"
moderates Goldstein's construction of "systemic violence" as violence associated withdrug market disputes. See Paul Goldstein, The Drugs/Violence Nexus: A TripartiteConceptual Framework, 15 J. DRUG ISSUES 493,502-03 (1985); Paul J. Goldstein et al.,Drug-Related Homicide in New York: 1984 and 1988, 38 CRIME & DELINQ. 459, 460(1992); FRANKLIN E. ZIMRING & GORDON HAWKINS, CRIME Is NOT THE PROBLEM:
LETHAL VIOLENCE IN AMERICA 148-49 (1997). Zimring and Hawkins introduced theconcept of "contingent causation" to explain the difference between illicit drug mar-keting in Europe and in the United States. In Europe, illicit drug marketing rarelyprovokes systemic violence, except perhaps at the wholesale level of distribution. Instreet-level retail markets, such violence is virtually absent in most European coun-tries. ZIMRING & HAWKINS, supra, at 148-49. The prevalence of "systemic violence"in American retail drug markets suggests that there are unique contextual conditionsin which Americans buy and sell illicit drugs that are conducive to violence. See NOR-
MAN ZINBERG, DRUG, SET AND SETTING: THE BASIS FOR CONTROLLED INTOXICANTUSE 135-71 (1984); Jeffrey Fagan, Interactions Among Drugs, Alcohol, and Violence:Dilemmas and Frameworks for Public Health Policy, 12 HEALTH AFFAIRS 65 (1993)(discussing the role of social contexts in explaining the drugs-violence relationship);Graham C. Ousey & Matthew R. Lee, Examining Race Differences in the Illicit DrugMarket-Homicide Relationship, 40 CRIMINOLOGY 73, 73 (2002); John K. Watters etal., Causality, Context, And Contingency: Relationships Between Drug Abuse And De-linquency, 12 CONTEMP. DRUG PROBS. 351, 360-64 (1985) (showing how the effects ofcertain drugs vary according to the social context and the makeup of the social groupin which drug use take place).
1570

RECIPROCAL EFFECTS
1. Model Estimation Procedures
The general analytic model was a mixed effects repeated mea-sures Poisson regression model with an overdispersion parameteradjustment and an autoregressive covariance structure.97 Since thedependent variable in each analysis is a count of either incarcera-tion or homicide events, each model is specified according to aPoisson distribution.98 All effects except time are fixed; time isboth a random effect to account for the panel structure of the data,and a fixed effect to account for the specific year within the panel.The latter estimation is important because of specific period effectsnested in the model, including the sharp increase and decline inseveral of the predictors (especially crime) over the panel.
Time is specified in three ways. First, in order to determine thedirect influence of the years comprising the study, time is treated asa fixed effect. Second, we estimated between spatial units (pre-cincts, neighborhoods) in the dependent variables over time bytreating time as random effect and interacting it with each of thepredictors. Finally, we captured variation within tracts over timeby also using time as a repeated measure. We use a first orderautoregressive covariance structure to estimate within-unit changeover time. All models were run using the GLIMMIX macro in theSAS Generalized Linear Model procedure.99
2. Data Sources and Measures
Data sources for the research are shown in Table 3. In additionto the counts and locations of persons incarcerated in each year ofthe panel, we constructed a set of socio-economic indicia of neigh-borhood or precinct social structure from 1990 census data. Weused 1990 since it is the mid-point of the time series for analysis ofincarceration trends, and treat these factors as fixed effects when
97. R.C. LITTELL ET AL., SAS SYSTEM FOR MIXED MODELS 97, 445 (1996); JudithSinger, Using SAS PROC MIXED to Fit Multilevel Models, Hierarchical Models, andIndividual Growth Models, 24 J. EDUC. & BEHAV. STAT. 323, 347-48 (1998).
98. A potential difficulty with the Poisson specification lies with the assumptionthat the variance is equal to the mean, a condition often encountered in event (count)data that are customarily overdispersed (where the variance exceeds the mean, asoften is the case when there are large numbers of zeros in the observations). Theoverdispersion correction addresses this limitation. See, e.g., D. Wayne Osgood, Pois-son-Based Regression Analysis of Aggregate Crime Rates, 16 J. QUANTITATIVE CRIMI-
NOLOGY 21, 22-30 (2000); see also Amy V. D'Unger et al., Gender Differences inDelinquent/Criminal Offending: Results from Mixed Poisson Regression Analyses, 18J. QUANTITATIVE CRIMINOLOGY 349, 358-59 (2002).
99. The procedure is PROC MIXED, applying the GLIMMIX macro for generalizedlinear models with mixed effects. See, e.g., Singer, supra note 97.
2003] 1571

FORDHAM URBAN LAW JOURNAL [Vol. XXX
analyzing incarceration trends and effects. The variables repre-sented constructs that were derived from an integration of severaltheories of crime within cities, including Bursik and Grasmick, 10
Sampson and Wilson, 101 Taylor and Covington,' 0 2 and Krivo andPeterson.'0 3 Variables were computed at the census tract level, andthen aggregated or recomputed for both the neighborhood and po-lice precinct boundaries.
We use measures of crime as base rates of the supply of individu-als available for incarceration. This measure varied depending onthe spatial unit of analysis. For precinct-level analyses, the crimemeasure was the number of felony crimes reported by citizens tothe New York City Police Department for each of the study years.For neighborhoods, we used homicide victimization as an alternatemeasure of crime, since the number of reported crimes is not avail-able in New York City for such geographically smaller areas. Spa-tially disaggregated data on felony crimes and arrests are not madeavailable to the public by the police department in New YorkCity. 10 4 Thus, for neighborhoods we used the number of homicidevictimizations, aggregated from census tracts, as a proxy of crimegenerally.
0 5
100. See generally ROBERT J. BURSIK, JR. & HAROLD G. GRASMICK, NEIGHBOR-
HOODS AND CRIME: THE DIMENSIONS OF EFFECTIVE COMMUNITY CONTROL (1993).101. See generally Robert J. Sampson & William Julius Wilson, Toward a Theory of
Race, Crime, and Urban Inequality, in CRIME & INEQUALITY, supra note 5, at 37.102. See generally Taylor & Covington, supra note 77.103. See generally Lauren J. Krivo & Ruth D. Peterson, The Structural Context of
Homicide: Accounting for Racial Differences in Process, 65 AM. Soc. REV. 547 (2000).104. Beginning in 1994, the New York City Police Department launched a comput-
erized crime mapping system, COMPSTAT. See BRA-T-ON & KNOBLER, supra note73, at 233-39. Crime data before that date cannot be located to specific addressesother than through manual geocoding of complaint and arrest records, or manual cod-ing of the records of arrestees. Even after the launch of COMPSTAT, this data wasunavailable for research purposes, but was used internally for strategic analysis ofenforcement practices. One reason is that the spatial coordinates were obtained onlyfor the initial crime complaint, which often was unverified at the time it was incorpo-rated into the database. NYPD officials were reluctant to release this data, becausemany of the complaints had not been investigated. For example, a complaint of agunshot might turn out on investigation to be a car backfiring. Or a burglary couldsimply be a missing personal item that was later recovered. Once verified, complaintswere entered into the city's crime counts, but for unstated reasons, the geographicalcoordinates of the crime location were not carried forward or aggregated.
105. See Michael D. Maltz, Which Homicides Decreased? Why?, 88 J. CRIM. L. &CRIMINOLOGY 1489, 1490 (1998) (discussing general reliability of changes in homiciderates as as a proxy for changes in local crime rates); see also MICHAEL D. MALTZ, U.S.DEP'T OF JUSTICE, NCJ-177615, BRIDGING GAPS IN POLICE CRIME DATA 4-9 (1999),available at http://www.ojp.usdoj.gov/bjs/pub/pdf/bgpcd.pdf (last visited July 15, 2003).
1572

2003] RECIPROCAL EFFECTS 1573
TABLE 3DATA DOMAINS AND SOURCES
Variable Data Source Description
Jail and Prison New York State Divi- Five Percent Sample of Jail Admissions,Admissions sion of Criminal Jus- Twenty Percent Sample of Prison Admis-
tice Services, sions,TRENDS file Five Periods from 1985-96.
Defendant residential address geocoded tocensus tract, neighborhood, and police pre-cinct
Drug Arrests New York State Divi- Ten Percent Sample of Felony Drugsion of Criminal Jus- Arrestees from 1985-96,tice Services, Charged with any of five drug charges:TRENDS file Sale or possession of controlled substances,
Sale or possession of marijuana,Or possession of drug paraphernalia.Defendant residential address geocoded tocensus tract, neighborhood, and police pre-cinct.
Homicide Victimiza- New York City Case level data from Vital Statisticstion Rate Department of records on homicide victimizations from
Health, Vital Statis- 1985-96.tics Place of residence recorded, and geocoded
to census tract, police precinct, or neigh-borhood.
Felony Complaint New York City Police UCR felony complaints by type of crimeRates Department, Office by precinct, 1985-97
of Management,Analysis and Plan-ning
Population, Housing New York City New York City Department of City Plan-and Economic Vari- Department of City ning Population Division downloadableables Planning data, at http://www.nyc.gov/html/dcp/html/
census/popdiv.htmlAlso, www.infoshare.org, New York Cityfiles
Population and Social 1990 Census Data U.S. Bureau of the Census, Summery TapeCharacteristics File 3A.
To address the specific and theoretically significant contributionof drug enforcement on incarceration,1°6 we constructed a time se-ries on drug arrests as a measure of the intensity of drug enforce-ment.10 7 This time series was created by obtaining a ten percentsample of drug arrests from 1985-97 from the New York State Divi-sion of Criminal Justice Services.?° Each arrest record was ge-
106. See Blumstein & Beck, supra note 1, at 41; see also MAUER, supra note 2;TONRY, supra note 31, at 81-82.
107. Eric Baumer et al., The Influence of Crack Cocaine on Robbery, Burglary, and
Homicide Rates: A Cross-City, Longitudinal Analysis, 35 J. RES. CRIME & DELINQ.316, 329-30 (1998); Ousey & Lee, supra note 96, at 95-96.
108. For a description of the methods for this specific data source, see JEFFREY
FAGAN & GARTH DAVIES, SUBSTANCE ABUSE POLICY RESEARCH PROGRAM, ROB-

FORDHAM URBAN LAW JOURNAL [Vol. XXX
ocoded to the residential address of the arrestee and then assignedto each type of spatial unit.
3. Results
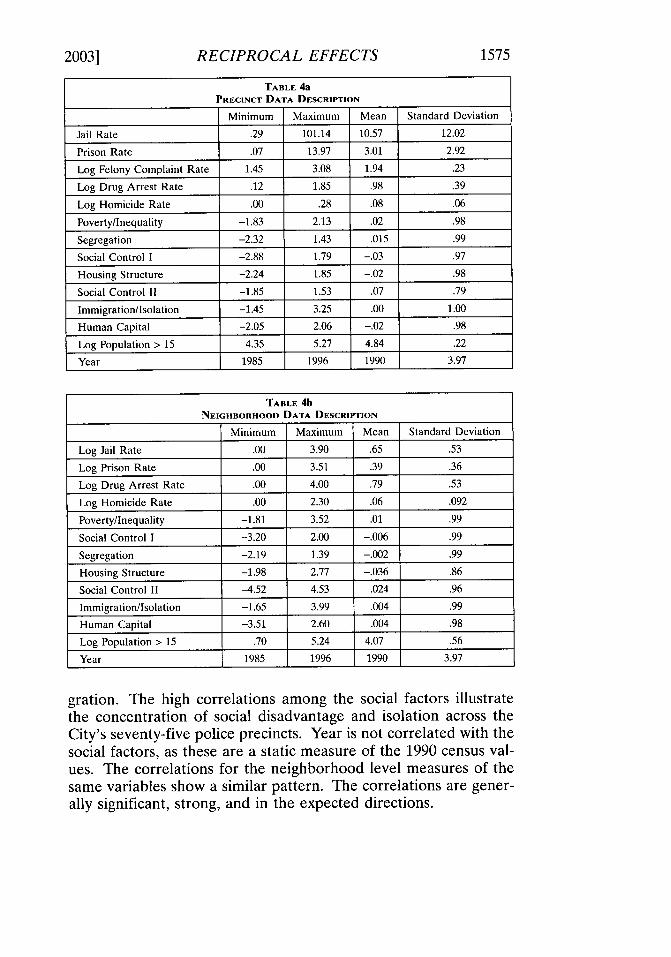
a. Descriptive Statistics
Means and standard deviations for variables at both the precinctand neighborhood levels are shown in Tables 4a and 4b. Predict-ably, rates of felony crimes, drug arrests, homicide victimization,and both prison and jail incarceration are highly skewed for bothlevels of aggregation. Social factors are normally distributed, al-though missing data creates some divergence from the typical dis-tribution of rotated factor scores.
We then used principal components factor analysis with varimaxrotation to reduce these measures to a more parsimonious set con-sistent with theory. We repeated this process for both precinctsand neighborhoods. We created nine factors and constructed fac-tor scores from the loadings of each variable in the factor. Eachmeasure within a factor contributes its weight to the overall factorscore based on its coefficient. Table 5a shows the construction ofdimensions of social structure within police precincts. Nearly allthe factors are internally consistent and well-correlated. In Table5a, seven factors each explain over seventy percent of the variance;only one factor-segregation-is relatively weak. We adjust forthis weakness in model estimation by including a separate predic-tor for non-white population. The results are surprisingly strong,given the size and socially heterogeneous composition of policeprecincts in New York City.10 9
Table 5b shows similar results for factors constructed at theneighborhood level. Eight of the neighborhood factors each ex-plain over seventy percent of the variance. Only one factor-oneof the social control dimensions-is weak. We adjust for the weak-ness in this factor by including measures of population size in themodels estimating incarceration and models estimating crimetrends.
The correlations among these factors are shown in Table 6a forprecincts and 6b for neighborhoods. The correlations in Table 4aare all generally high and in the predicted directions. The jail andprison rates are correlated with all the social factors except immi-
ERT WOOD JOHNSON FOUND., THE EFFECTS OF DRUG ENFORCEMENT ON THE RISE
AND FALL OF HOMICIDES IN NEw YORK CITY, 1985-95, FINAL REPORT 9-11 (2002).109. See Tb. 5a.
1574
2003] RECIPROCAL EFFECTS 1575
TABLE 4aPRECINCT DATA DESCRIPTION
Minimum Maximum Mean Standard Deviation
Jail Rate .29 101.14 10.57 12.02
Prison Rate .07 13.97 3.01 2.92
Log Felony Complaint Rate 1.45 3.08 1.94 .23
Log Drug Arrest Rate .12 1.85 .98 .39
Log Homicide Rate .00 .28 .08 .06
Poverty/Inequality -1.83 2.13 .02 .98
Segregation -2.32 1.43 .015 .99
Social Control I -2.88 1.79 -. 03 .97
Housing Structure -2.24 1.85 -. 02 .98
Social Control II -1.85 1.53 .07 .79
Immigration/Isolation -1.45 3.25 .00 1.00
Human Capital -2.05 2.06 -. 02 .98
Log Population > 15 4.35 5.27 4.84 .22
Year 1985 1996 1990 3.97
TABLE 4bNEIGHBORHOOD DATA DESCRIPTION
Minimum Maximum Mean Standard Deviation
Log Jail Rate .00 3.90 .65 .53
Log Prison Rate .00 3.51 .39 .36
Log Drug Arrest Rate .00 4.00 .79 .53
Log Homicide Rate .00 2.30 .06 .092
Poverty/Inequality -1.81 3.52 .01 .99
Social Control I -3.20 2.00 -. 006 .99
Segregation -2.19 1.39 -. 002 .99
Housing Structure -1.98 2.77 -. 036 .86
Social Control II -4.52 4.53 .024 .96
Immigration/Isolation -1.65 3.99 .004 .99
Human Capital -3.51 2.60 .004 .98
Log Population > 15 .70 5.24 4.07 .56
Year 1985 1996 1990 3.97
gration. The high correlations among the social factors illustratethe concentration of social disadvantage and isolation across theCity's seventy-five police precincts. Year is not correlated with thesocial factors, as these are a static measure of the 1990 census val-ues. The correlations for the neighborhood level measures of thesame variables show a similar pattern. The correlations are gener-ally significant, strong, and in the expected directions.

1576 FORDHAM URBAN LAW JOURNAL [Vol. XXX
TABLE 5aPRECINCT FACTOR COMPOSITION
% ExplainedRotated Eigenvalue Variance
Deprivation/Poverty 1.96 97.77
Households with Public AssistanceIncome .99
Households with Income Below Poverty .99
Poverty/Inequality 2.42 80.71
Households with Public AssistanceIncome .95
Households with Income Below Poverty .96
Labor Market/Human Capital I 3.40 84.91
College Grads-Persons 25 & Over 0.88
Labor Force Participation-Persons 16 &Over 0.94
Employment Rate-Persons 16 & Over 0.95
Skilled Occupation-Persons 16 & Over 0.91
Labor Market/Human Capital 11 3.52 87.98
% At Least High School Grad-Persons25 & Over 0.94
Labor Force Participation-Persons 16 &Over 0.95
Employment Rate-Persons 16 & Over 0.97
Skilled Occupation-Persons 16 & Over 0.91
Segregation 1.11 55.34
Racial Fragmentation Index 0.74
Percent Nonwhite 0.74
Social Control I-Supervision 2.27 75.77
% Youth Population (5-15) 0.87
% Female Headed Households withChildren <18 0.82
Supervision Ratio (25-64 by 5-24) -0.91
Social Control II-Anonymity 1.31 65.71
Population-1990 0.81
Residential Mobility-Same House as1985 0.81
Immigration/Isolation 1.60 79.56
Foreign Born 0.89
Linguistic Isolation 0.89
Housing Structure 1.74 86.97
Percent Rental Housing 0.93
Housing Density (Persons per Room) 0.93

2003] RECIPROCAL EFFECTS 1577
TABLE 5bNEIGHBORHOOD FACTOR COMPOSITION
% ExplainedRotated Eigenvalue Variance
Deprivation/Poverty 1.96 97.89
Households with Public AssistanceIncome 0.99
Households with Income Below Poverty 0.99
Poverty/Inequality 2.20 73.29
Households with Public AssistanceIncome 0.97
Households with Income Below Poverty 0.95
Gini for Household Income 0.61
Labor Market/Human Capital I 3.14 78.43
College Grads-Persons 25 & Over 0.88
Labor Force Participation-Persons 16 &Over 0.88
Employment Rate-Persons 16 & Over 0.92
Skilled Occupation-Persons 16 & Over 0.86
Labor Market/Human Capital II 3.16 79.08
% At Least High School Grad-Persons25 & Over 0.90
Labor Force Participation-Persons 16 &Over 0.88
Employment Rate-Persons 16 & Over 0.93
Skilled Occupation-Persons 16 & Over 0.85
Segregation 1.51 75.62
Racial Fragmentation Index 0.87
Percent Nonwhite 0.87
Social Control I-Supervision 2.34 77.88
% Youth Population (5-15) 0.94
% Female Headed Households withChildren <18 0.85
Supervision Ratio (25-64 by 5-24) - 0.86
Social Control II-Anonymity 1.04 52.16
Population-1990 0.72
Residential Mobility-Same House as1985 0.72
Immigration/Isolation 1.64 81.86
Foreign Born 0.91
Linguistic Isolation 0.91
Housing Structure 1.61 80.61
Percent Rental Housing 0.90
Housing Density (Persons per Room) 0.90

FORDHAM URBAN LAW JOURNAL [Vol. XXX1578
-. *I I I I.. . . . . .. . . . . .. . . . . .a , -I

RECIPROCAL EFFECTS2003] 1579

FORDHAM URBAN LAW JOURNAL [Vol. XXX
As an introduction to the distributions of dependent variablesand critical predictors, we show in Table 7 the trends in crime andincarceration in New York City for each study year in the 1985-96interval. Drug arrests rose as non-drug felony crime complaintsdeclined. 110 Prison and jail admissions rose through 1993 beforedeclining in the 1996 panel.111 The decline in incarceration was farshallower than the decline in felony complaints, and more closelymirrored the overall pattern of growth for drug arrests.11 2 Homi-cides declined precipitously starting after 1990 in New York City," 3
as shown in this table.' 1 4
TABLE 7INCARCERATION AND CRIME, 1985-96
Non-Drug Felony Jail PrisonYear Complaints Drug Arrests* Homicides Admissions** Admissions***
1985 535,885 46,000 1,312 53,380 9,676
1987 494,038 64,340 1,371 59,340 13,480
1990 573,813 64,760 1,978 51,600 19,224
1993 476,048 54,900 1,655 38,200 18,456
1996 325,413 76,540 844 44,420 15,044
*Based on a 10% sample **Based on a 5% sample ***Based on a 25% sample
b. Model Estimates
In this Section, we report model estimates for trends in incarcer-ation and crime over the 1985-86 interval. The results arepresented in four sets of models. First, we estimate models of in-carceration growth at both the precinct and neighborhood level.Separate models are estimated for jail and prison. Then, we esti-mate incarceration growth within neighborhoods. Both models in-clude predictors for crime, but with different crime measures. Andboth models also use the adult population (persons over the age offifteen years) as the offset to compute an incarceration rate. Thethird and fourth sets of models estimate the effects of incarcerationon crime trends. Again, we estimate separate models for jail andprison, but with different measures of crime for precincts andneighborhoods. All models include controls for drug arrests andsocial structural conditions within neighborhoods and precincts.
110. See Tbl. 7.111. See Tbl. 7.112. See Tbl. 7.113. See KARMEN, supra note 33, at 20-23; Fagan et al., supra note 16, at 1277.114. See Tbl. 7.
1580

RECIPROCAL EFFECTS
We again use the adult population as the offset to estimate a crimerate. We use the natural log of the crime and arrest measures.Drug arrests and crime are lagged by one year in each model toestimate its effects on homicides or violence in the subsequentyear. We also report exponentiated coefficients to illustrate themagnitude of the effects of the predictors on the dependentvariables.
i. Incarceration Growth
The results for precincts are shown in Table 8 and for neighbor-hoods in Table 9. In the precinct models in Table 8, the jail andprison models differ in several ways. In the jail model, the non-drug felony crime complaint rate and the drug arrest rates are bothsignificant predictors of between-precinct differences.' 1 5 The effectsizes for both felony complaint rates and drug arrest rates are quitehigh, and suggest the concentration over time of jail admissions inprecincts with high crime rates. Among the structural factors, onlythe human capital predictor is significant.'16 The interaction termssuggest that differences in jail rates over time are predicted (nega-tively) only by changing non-drug felony arrest rates." 7 Jail ratesappear to increase over time with declining felony complaintrates,' 18 a suggestion of the endogeneity of jail admissions as a so-cial ecological feature of some precincts that operates indepen-dently from serious crime. 19
After controlling for jail admissions, none of the crime factorspredict between-precinct differences in imprisonment. 20 Amongthe social structural factors, only social control (supervision)predicts imprisonment.12 ' The interaction of time and drug arrestssuggests that imprisonment rates within precincts over time are in-fluenced by higher drug arrest rates. Higher drug arrest rates fuelprison admissions over time, after controlling for both other crimefactors and social structural conditions. Even in eras of decliningnon-drug crimes, the continued application of intensive street-level
115. See Tbl. 6.116. See Tbl. 6.117. See Tbl. 6.118. See Thl. 6.119. The policy engines for this dynamic-New York City's Order Maintenance
Policing strategy-only began in 1994, so there is no simple policy-level explanationfor the incorporation of jail as an ecological dynamic in these precincts. This dynamic,however, was highly racialized during these years. See, e.g., Fagan & Davies, supranote 65, at 462-64.
120. See Tbl. 8.121. See Tbl. 8.
2003] 1581

1582 FORDHAM URBAN LAW JOURNAL [Vol. XXX
TABLE 8POISSON REGRESSION OF INCARCERATION BY PRECINCT CRIME & SOCIAL STRUCTURE,
NEW YORK Crrv, 1985-96
Jail Prison
Estimate t p(t) Exp(B) Estimate t p(t) Exp(B)
Intercept -19.97 -3.93 0.000 -12.61 -2.26 c 0.000Time 0.143 2.52 c 1.154 0.041 0.66 1.042
Jail One Year Lag -0.002 -1.54 0.996
(Log) FelonyComplaint Rate* 3.097 3.35 a 8.559 1.871 1.67 3.658(Log) HomicideRate -1.165 -0.28 0.312 2.788 0.67 16.25
(Log) DrugArrest Rate* 1.804 2.03 c 3.492 -1.584 -1.80 0.334Poverty/Inequality 0.432 0.25 1.541 -0.985 -0.56 0.373
Segregation -0.346 -0.60 0.708 0.834 1.51 2.303Social Control 1 0.602 0.74 1.826 2.190 2.74 b 8.927Housing Structure 0.562 0.56 1.754 -0.472 -0.46 0.624Social Control II -0.279 -0.48 0.756 -0.549 -0.89 0.578
Immigration/Cultural Isolation 0.255 0.45 1.290 -0.584 -1.03 0.558Human Capital II 2.416 2.12 c 11.20 -0.385 -0.32 0.681
Interactions withTime
Jail One Year Lag 0.2E5 1.64 1.000
(Log) FelonyComplaint Rate* -0.032 -3.04 b 0.969 -0.017 -1.38 0.983
(Log) HomicideRate 0.016 0.35 1.016 -0.028 -0.62 0.972(Log) DrugArrest Rate* -0.016 -1.57 0.984 0.023 2.29 c 1.023Poverty/Inequality 0.6E3 0.03 1.001 0.015 0.76 1.015Segregation 0.006 0.90 1.006 -0.007 -1.15 0.993
Social Control I -0.008 -0.91 0.992 -0.021 -2.41 0.979Housing Structure -0.004 -0.38 0.996 0.004 0.33 b 1.004
Social Control II 0.003 0.41 1.003 0.006 0.84 1.006
Immigration/Cultural Isolation -0.005 -3.83 0.995 0.006 0.99 1.006Human Capital II -0.025 -1.96 0.975 0.006 0.44 1.0062 Log Likelihood 322.3 301.5
N=370
a = p< 001, b = p<.01, c = p<.05 * per 1000 population 15 and above
drug enforcement results in higher rates of imprisonment withinneighborhoods over time.
The results of the neighborhood models shown in Table 9 differfrom the precinct models. Recall, however, that the crime measureused here is the homicide victimization rate, not the felony com-

2003] RECIPROCAL EFFECTS 1583
TABLE 9
POISSON REGRESSION OF INCARCERATION BY NEIGHBORHOOD CRIME AND SOCIAL
STRUCTURE, NEW YORK Crrv, 1985-96
Jail Prison
Estimate t p(t) Exp(B) Estimate t p(t) Exp(B)
Intercept -6.996 -2.19 0.001 -4.810 -1.31 0.008
Time 0.008 0.22 1.008 -0.029 -0.71 0.971
Jail Lagged OneYear 0.001 3.39 a 1.000
(Log) HomicideRate 1.538 0.43 4.66 -0.691 -0.25 0.501
(Log) DrugArrest Rate* 2.612 3.57 a 6.114 -1.565 -2.78 b 0.337
Poverty/Inequality 2.420 1.66 11.23 -0.635 -0.54 0.530
Social Control I -1.236 -1.69 0.291 1.417 2.46 b 4.124
Segregation -0.538 -0.70 0.584 1.235 2.10 c 3.437
Housing Structure -0.018 -0.02 0.981 0.474 0.54 1.606
Social Control II 0.760 -2.82 b 0.468 -0.234 -1.15 0.768
Immigration/Cultural Isolation 0.311 0.63 1.364 -0.871 -2.30 c 0.419
Human Capital II 2.598 2.53 b 13.44 0.269 0.32 1.308
Interactions withTime
Jail Lagged OneYear 0 1.000
(Log) HomicideRate -0.014 -0.36 0.986 0.009 0.29 1.009
(Log) DrugArrest Rate* -0.024 -2.94 b 0.976 0.022 3.41 a 1.022
Poverty/Inequality -0.019 -1.14 0.982 0.013 0.98 1.013
Social Control I 0.011 1.37 1.011 -0.013 -2.05 c 0.987
Segregation 0.009 1.08 1.009 -0.010 -1.51 0.990
Housing Structure 0.001 0.09 1.001 -0.006 -0.65 0.994
Social Control II 0.008 2.66 b 1.008 0.003 1.12 1.003
Immigration/Cultural Isolation -0.006 -1.01 0.995 0.009 2.20 c 1.009
Human Capital II -0.026 -2.25 c 0.975 0.1E3 0.02 1.000
2 Log Likelihood 3873.2 3135.5
N=1380
a = p< 001, b = p<.01, c = p<.05 * per 1000 population 15 and above
plaint rate. With this in mind, Table 9 shows that the drug arrestrate is a significant predictor of neighborhood differences in jailadmissions.122 Neighborhoods with greater anonymity and higherhuman capital also have higher jail admission rates. 23 These fac-
122. See Tbl. 9.123. See Thl. 9.
FORDHAM URBAN LAW JOURNAL [Vol. XXX
tors are suggestive of some of the rapidly gentrifying neighbor-hoods in the City during this time.'24
The negative coefficient for the interaction of time with drug ar-rests suggests that jail admissions increase over time within neigh-borhoods with declining drug arrest rates. The coefficient for thisinteraction was in the same direction in the precinct model, butthere it was not significant.12 5 Here, at a finer unit of spatial reso-lution, the interaction becomes significant. The increase in jail ad-missions over time as drug arrests decline again suggests theendogeneity of jail as an embedded social ecological factor in poorneighborhoods.
The prison models suggest a similar dynamic, though manifestedthrough drug arrests. Jail admissions this time are positively associ-ated with prison rates, 126 suggesting the cascading effects of jail onprison admissions in smaller social areas. The exponentiated coef-ficient, however, is 1.00013, a very small effect. The drug arrestrate negatively predicts prison admissions, and here the effect sizeis quite large.127 This may be an artifact of model specification,since the jail predictor may capture the effects of drug arrests. Sev-eral social structural factors are significant, including social control(weak supervision), racial segregation, and low levels of immigrantpopulations. Assuming that drug arrests are expressed in the jailpredictor, it appears that imprisonment is embedded in neighbor-hoods with high rates of jail admission, a process that itself seemsto be driven largely by drug arrests, and in the absence of strongstructural influences.
This trend becomes apparent from the significant and positiveinteraction of time with drug arrests. Similar to the precinct model,prison admissions increase over time within neighborhoods withhigher drug arrest rates. This occurs during a period of rising incar-ceration overall but (for at least the latter half of the period) de-clining crime rates. The slopes for social control are also significantbut negative, suggesting that as social control (supervision) in-creases over time, prison admissions decline. The interaction ofimmigration with prison suggests that prison admissions are grow-
124. See TbI. 9.125. See Tbl. 8.126. See TbI. 9.127. See TbI. 9.
1584

RECIPROCAL EFFECTS
ing over time in neighborhoods with larger Latino populations, theCity's largest immigrant population.128
ii. Incarceration and Crime
To assess the effects of incarceration on crime, we estimatedmodels at both the precinct and neighborhood levels. Crime ratesin the precinct models were measured by non-drug felony crimecomplaint rates, and using homicide victimization rates in theneighborhood models. Both were measures logged in the analyses.Jail and prison admissions (logged) were included in each model aspredictors and lagged by one year. Interactions with time were in-cluded to estimate within-unit change over time. The results areshown in Tables 10 and 11.
Table 10 shows that there are positive and significant effects ofincarceration on felony complaint rates at the precinct level, con-trolling for social structural factors. 129 Over time, the effect of jailadmissions is significant and positive, and the exponentiated coef-ficent (2.20) suggests that the effect is large. 130 Segregation (nega-tive) and human capital (positive) also significantly predict felonycomplaint rates at the neighborhood level,'131 although these factorsmay mask broad within-precinct differences across neighborhoods.The time interactions show that felony complaint rates within pre-cincts decline over time with higher jail admissions.1 32 The patternof interactions with social structural characteristics suggests thatjail admissions tend to increase over time within precincts withhigher rates of poverty, more racially segregated precincts, andprecincts with lower rates of human capital.
The models for the effects of prison admissions on subsequentcrime at the precinct level show similar patterns. There are posi-tive and significant effects of prison admissions on felony arrestrates at the precinct level, controlling for social structural fac-tors.1 33 Again, the effect size is relatively large: each prison admis-sion increases the likelihood of a felony crime complaint by a
128. In 2000, persons from Central and Latin America comprised fifty-three per-cent of the New York City residents who were born outside the United States. SeeN.Y. CITY DEP'T OF CITY PLANNING, POPULATION Div., NYC2000: RESULTS FROM
THE 2000 CENSUS: SOCIOECONOMIC CHARACTERISTICS 1 (2000), available at http:/Iwww.nyc.gov/html/dcp/pdf/census/sociopp.pdf (last visited July 15, 2003).
129. See Tbl. 10.130. See Tbl. 10.131. See Tbl. 10.132. See Tbl. 10.133. See Tbl. 10.
2003] 1585
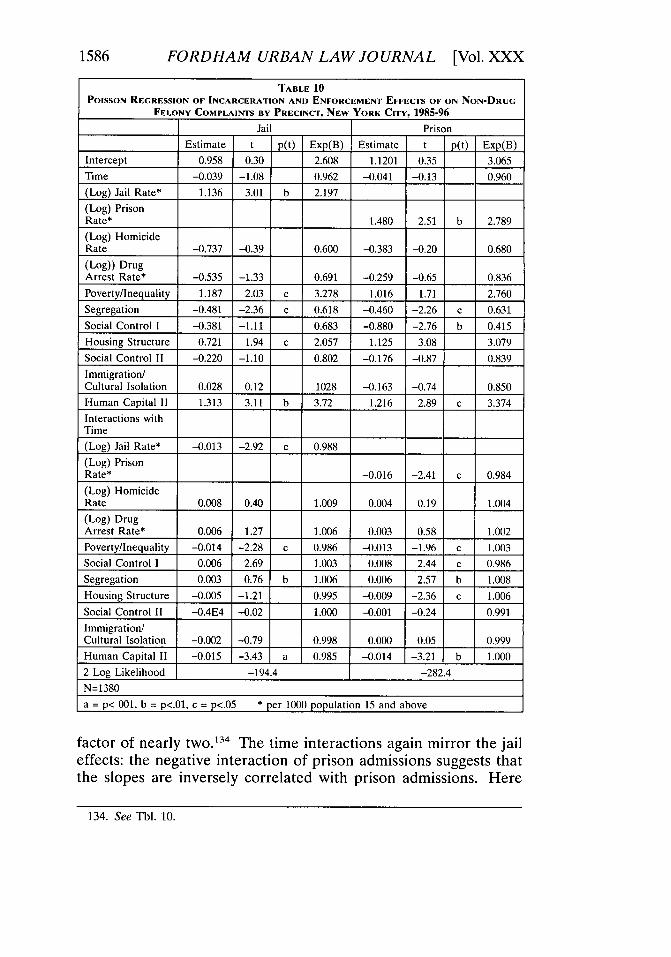
1586 FORDHAM URBAN LAW JOURNAL [Vol. XXX
TABLE 10POISSON REGRESSION OF INCARCERATION AND ENFORCEMENT EFFECTS OF ON NON-DRUG
FELONY COMPLAINTS BY PRECINCT, NEW YORK CITY, 1985-96Jail Prison
Estimate t p(t) Exp(B) Estimate t p(t) Exp(B)Intercept 0.958 0.30 2.608 1.1201 0.35 3.065
Time -0.039 -1.08 0.962 -0.041 -0.13 0.960
(Log) Jail Rate* 1.136 3.01 b 2.197
(Log) PrisonRate* 1.480 2.51 b 2.789
(Log) HomicideRate -0.737 -0.39 0.600 -0.383 -0.20 0.680
(Log)) DrugArrest Rate* -0.535 -1.33 0.691 -0.259 -0.65 0.836
Poverty/Inequality 1.187 2.03 c 3.278 1.016 1.71 2.760
Segregation -0.481 -2.36 c 0.618 -0.460 -2.26 c 0.631
Social Control I -0.381 -1.11 0.683 -0.880 -2.76 b 0.415
Housing Structure 0.721 1.94 c 2.057 1.125 3.08 3.079
Social Control Ii -0.220 -1.10 0.802 -0.176 -0.87 0.839
Immigration/Cultural Isolation 0.028 0.12 1028 -0.163 -0.74 0.850Human Capital I1 1.313 3.11 b 3.72 1.216 2.89 c 3.374
Interactions withTime
(Log) Jail Rate* -0.013 -2.92 c 0.988
(Log) PrisonRate* -0.016 -2.41 c 0.984
(Log) HomicideRate 0.008 0.40 1.009 0.004 0.19 1.004
(Log) DrugArrest Rate* 0.006 1.27 1.006 0.003 0.58 1.002
Poverty/Inequality -0.014 -2.28 c 0.986 -0.013 -1.96 c 1.003
Social Control 1 0.006 2.69 1.003 0.008 2.44 c 0.986
Segregation 0.003 0.76 b 1.006 0.006 2.57 b 1.008
Housing Structure -0.005 -1.21 0.995 -0.009 -2.36 c 1.006
Social Control II -0.4E4 -0.02 1.000 -0.001 -0.24 0.991
Immigration/Cultural Isolation -0.002 -0.79 0.998 0.000 0.05 0.999Human Capital II -0.015 -3.43 a 0.985 -0.014 -3.21 b 1.000
2 Log Likelihood -194.4 -282.4
N=1380
a = p< 001, b = p<.01, c = p<.05 * per 1000 population 15 and above
factor of nearly two. 134 The time interactions again mirror the jaileffects: the negative interaction of prison admissions suggests thatthe slopes are inversely correlated with prison admissions. Here
134. See Tbl. 10.

2003] RECIPROCAL EFFECTS 1587
TABLE 11POISSON REGRESSION OF INCARCERATION ON HOMICIDE VICTIMIZATION RATES BY
NEIGHBORHOOD, NEW YORK CITY, 1985-96
Jail Prison
Estimate t p(t) Exp(B) Estimate t p(t) Exp(B)
Intercept -1.148 -0.24 0.317 -1.615 -. 034 0.19
Time -0.030 -0.57 0.970 -0.024 -0.45 0.976
Jail Rate* 0.787 0.46 2.196
Prison Rate* 3.286 1.27 26.72
(Log) DrugArrest Rate* 2.308 1.24 1 10.05 2.261 1.20 9.594Poverty/Inequality 0.543 0.35 1.721 0.789 0.52 2.200
Social Control I -0.749 -1.03 0.473 -0.838 -1.16 0.433
Segregation -0.773 -1.07 0.462 -1.049 -1.46 0.350
Housing Structure 1.906 1.78 6.727 1.795 1.67 6.017
Social Control II 1.039 3.72 c 2.827 0.988 3.52 a 2.685
Immigration/Cultural Isolation -0.052 -0.11 0.950 0.114 0.25 1.121
Human Capital II 0.731 0.65 2.078 0.918 0.83 2.505
Interactions withTime
Jail Rate* -0.006 -0.29 0.994
Prison Rate* -0.033 -1.14 0.967
(Log) DrugArrest Rate* -0.024 1.14 0.976 -0.024 -1.10 0.977
Poverty/Inequality -0.001 -0.05 0.999 -0.003 -0.17 0.997
Social Control I 0.012 1.49 1.012 0.015 1.83 1.015
Segregation 0.012 1.49 1.012 0.013 1.64 1.014Housing Structure -0.022 -1.80 0.979 -0.020 -1.69 0.980
Social Control II -0.006 -2.01 c 0.994 -0.006 -1.80 0.994
Immigration/Cultural Isolation 0.002 0.29 1.001 -0.001 -0.09 1.000
Human Capital II -0.004 -0.35 0.996 -0.006 -0.52 0.994
2 Log Likelihood 3873.2 3477.1
N=1380
a = p< 001, b = p<.01, c = p<.05 * per 1000 population 15 and above
the effect size is small (.98), suggesting that this may be an ecologi-cal echo of declining crime rates during the latter half of the timeseries. The pattern of interaction with the social factors suggeststhe concentration of imprisonment within precincts are character-ized by several dimensions of social disadvantage.
Table 11 shows similar analyses, at the neighborhood level.Here, we predict homicide victimization rates at the neighborhoodlevel from jail and prison rates one year earlier, controlling fordrug enforcement and social structural characteristics of neighbor-

FORDHAM URBAN LAW JOURNAL [Vol. XXX
hoods. There are no effects of jail or prison rates in neighborhoodson homicide victimization. This most likely reflects the low baserates of homicide, especially in the later years in the series whenhomicides were sharply lower than in previous decades. Unfortu-nately, more localized crime measures are difficult to obtain. Amore precise estimate of these effects might be obtained eitherfrom the use of addressable crime complaint and arrest data, orthrough a recurring household survey that would capture crimevictimization.
IV. THE ENDOGENEITY OF INCARCERATION
When Professors Robert Bursik, Jr., and Harold Grasmick ad-vanced their systemic theory of neighborhood and crime, they re-garded social control as essential to regulating crime rates.135
Social control is the product of social interactions that express andenforce social norms. 36 Social control is exerted not only by re-sidents, but also transients or temporary residents, including thoseentering neighborhoods for work or visits. 137 The latter groupshares liability for their community, though theirs is far more lim-ited.' 38 Bursik and Grasmick carefully structured a dynamic theoryof social control, incorporating social ties and interactions amongneighborhood residents. 39 They showed the interdependence be-tween social structure and social control, illustrating how strains ofeveryday life can compromise the participation of local residents insocial regulation. 140 Like many others, however, they did not con-sider incarceration to be an endogenous factor in social control. 4'Others, however, such as Professor Dina Rose and her co-authors,have done so, both empirically and theoretically. 42 Professor Jef-frey Morenoff and his colleagues show that social organization andsocial control are spatially embedded processes that influenceneighborhood-level variations in violence.143 Thus, rising and con-
135. BURSIK & GRASMIK, supra note 100, at 66.136. See id. at 13-16; Tracey L. Meares & Dan M. Kahan, Law and (Norms of)
Order in the Inner City, 32 LAW & Soc'v REV. 805, 830-32 (1998); Sampson & Wilson,supra note 101, at 45-48.
137. BURSIK & GRASMIK, supra note 100, at 13-16.138. See, e.g., ALBERT HUNTER, SYMBOLIC COMMUNITIES 178-79 (1974).139. BURSIK & GRASMIK, supra note 100, at 60-90.140. See id.141. See id.142. Dina A. Rose & Todd R. Clear, Incarceration, Social Capital, and Crime: Im-
plications for Social Disorganization Theory, 36 CRIMINOLOGY 441, 467-70 (1998).143. Jeffrey D. Morenoff et al., Neighborhood Inequality, Collective Efficacy, and
the Spatial Dynamics of Urban Violence, 39 CRIMINOLOGY 517, 550-53 (2001).
1588

RECIPROCAL EFFECTS
centrated rates of incarceration not only become a part of thefabric of poor communities, already susceptible to crime, but alsothey compromise the limited forms of social control that poor com-munities can mount. These dynamics are discussed below.
A. Incarceration and Social Regulation
In this Essay, we contribute evidence that incarceration providesa steady supply of offenders for more incarceration. We show thatover a relatively long time period, and across very different levelsof crime citywide and within neighborhoods, incarceration trendsfirst unfold as closely tied to crime, and then over the interval, be-come somewhat independent of crime. As this cycle spirals for-ward, incarceration threatens to become endogenous in theseneighborhoods, or "grown from within," seeping into and perma-nently staining the social and psychological fabric of neighborhoodlife in poor neighborhoods of New York and many other cities. In-carceration thus is part of the ecological backdrop of childhood so-cialization, whose effects are multiplied by grinding poverty, andan everyday contingency, particularly for young men, as they navi-gate the transition from adolescence to adulthood. 144 As the risksof going to jail or prison grow over time for persons living in theseareas, their prospects for marriage or earning a living and family-sustaining wage diminish as the incarceration rates around themrise, closing off social exits into productive social roles.'4 5 Overtime, incarceration creates more incarceration in a spiralingdynamic.
The spatial concentration of incarceration distorts neighborhoodsocial ecology and attenuates the neighborhood's economic for-tunes through four social mechanisms that further embed incarcer-ation into neighborhood life. First, the link between incarcerationand unemployment exists not only at the individual level, butthrough socially mediated processes that ensue from concentrationeffects. In research on prison inmates in London in the late nine-teenth century, for example, Professors John Hagan and AlbertoPalloni show that incarceration tends to complicate efforts of ex-offenders to forge social links to legal work, increasing theirchances of further incarceration. 146 Being imprisoned has a perma-
144. See, e.g., ADRIAN NICOLE LEBLANC, RANDOM FAMILY (2003).145. Jeffrey Fagan & Richard Freeman, Crime and Work, 25 CRIME & JUST. 225,
239 (1999).146. John Hagan & Alberto Palloni, The Social Reproduction of a Criminal Class in
Working Class London, circa 1950-80, 96 AM. J. Soc. 265, 293 (1990).
15892003]

FORDHAM URBAN LAW JOURNAL [Vol. XXX
nent effect on wages: those who have been incarcerated are likelynot only to have reduced wage income, but the effect of imprison-ment increases as workers get older.'47 This economic handicap ismultiplied when ex-inmates are concentrated spatially, as their ac-cess to job networks are attenuated by the homogeneity of theirsocial networks and exclusion from social networks of workingpeople. The path from incarceration to irregular employment tocrime is made wider and more efficient by the closure of access tolegal job networks.'48
Second, concentrated incarceration compromises social controlin a few ways. Incarceration increases the number of single-parenthouseholds within these neighborhoods.' 49 Families are strained toexert control and supervision of their own children and other fami-lies' children in their neighborhoods. While some removals of in-mates may decrease strain on families' financial and emotionalwell-being, the removal of one parent or caretaker often createsfinancial strains and limits access to child care and other resourcesthat are essential to the economic survival of the urban poor.150 Inneighborhood life, the decrease in the number of older males inthese neighborhoods weakens the general social control of childrenand especially adolescents, easing their entry into criminal net-works. The concentration of incarceration strains citizens' relation-ships to law generally, and reduces their incentives to participate insocial control.'151 For example, Professor Daniel Nagin suggeststhat the social meaning of criminal sanctions is eroded by the con-
147. Bruce Western, The Impact of Incarceration on Wage Mobility and Inequality,67 AM. Soc. REV. 526 (2002). For a qualitative description of the experience of re-turning from jail or prison, and the difficulties of connecting to jobs, see MARTA NEL-SON ET AL., VERA INST. OF JUSTICE, THE FIRST MONTH OUT: POST-INCARCERATIONEXPERIENCES IN NEW YORK CITY (1999).
148. Western, supra note 147, at 547.149. Hagan & Dinovitzer, supra note 3, at 123-24.150. See LEBLANC, supra note 144, at 132-33. (portraying the strains on child su-
pervision that result when one parent is sent off to prison). See Philip Genty, DamageTo Family Relationships as a Collateral Consequence of Parental Incarceration, 30FORDHAM URB. L.J. 1671, 1675 (2003) (discussing the adverse impacts of incarcera-tion on family structure and parenting behavior, noting that "the limited reduced con-tact between incarcerated parents and their children has a long-lasting and damagingimpact upon the parent-child relationship."). Professor Genty reports that the num-ber of orders issued under the Adoption and Safe Families Act ("ASFA," Pub. L. No.105-98, codified at 42 U.S.C. §§ 670-679a) terminating the parental rights of incarcer-ated inmates rose from 260 in 1997 to 909 in 2001. Professor Genty states that this is avery conservative estimate, because systematic is not kept on this indicator and theestimates were obtained by a Lexis search of court orders.
151. Nagin, supra note 13, at 33-36.
1590

RECIPROCAL EFFECTS
centration of "stigmatized" persons within neighborhoods, leadingto both defiance of social norms and "counterdeterrence."1 52
Third, the concentration of ex-offenders within social areas canalso deplete the area's social capital, and complicate efforts of ex-inmates to forge links to legitimate employment. Removal of mento prison has a churning effect on illegal labor queues; in the con-text of limited access to legal work, the replacement process is effi-cient.153 These effects accrue above the individual effects ofeconomic disenfranchisement. 54 Moreover, concentrations of ex-inmates can further stigmatize areas and deter businesses from hir-ing locally or locating in such areas. 155 These dynamics suggest thatthe spatial concentration of incarceration can sustain an ecologicaldynamic that will mediate the individual outcomes of ex-offendersreturning to those neighborhoods, and influence the life course ofyounger residents entering the labor force.
Voter disenfranchisement of convicted felons creates a fourthdynamic that adversely affects the political economy of neighbor-hoods with high incarceration rates. Patterns of racial residentialsegregation and the concentration of incarceration in poor,predominantly minority neighborhoods in New York and other cit-ies, ensure that disenfranchisement will limit the ability of residentsof those neighborhoods to influence local services and policies thatboth directly and indirectly affect crime and social control. Theinability to influence political processes weakens leverage and ac-cess to important services that can moderate the risks of crime,from educational resources to trash removal and recreation. 56 In-carceration policy is embedded in a political process that benefits
152. Id. at 5; John Hagan, The Social Embeddedness of Crime and Unemployment,31 CRIMINOLOGY 465, 486-87 (1993); Tracey L. Meares, Social Organization and DrugLaw Enforcement, 35 AM. CRIM. L. REV. 191, 211-17 (1998); Meares & Kahan, supranote 136, at 819.
153. See Hagan, supra note 152, at n.24; see also MARTIN SANCHEZ-JANKOWSKI,
ISLANDS IN THE STREET: GANGS AND THE AMERICAN URBAN SOCIETY (1991); JohnHagedorn, Gang Violence in the Post-Industrial Era, in YOUTH VIOLENCE 365, 374(Michael Tonry & Mark Moore eds., 1998).
154. Jeffrey Grogger, The Effects of Arrests on the Employment and Earnings ofYoung Men, 110 Q. J. ECON. 51, 61-66 (1995); see generally Fagan & Freeman, supranote 145, at 235-36.
155. WILLIAM JULIUS WILSON, WHEN WORK DISAPPEARS: THE WORLD OF THE
NEW URBAN POOR 46 (1996)156. Mark E. Thompson, Don't Do the Crime If You Ever Intend to Vote Again:
Challenging the Disenfranchisement of Ex-Felons as Cruel and Unusual Punishment,33 SETON HALL L. REV. 167, 178-79 (2002).
2003] 1591

FORDHAM URBAN LAW JOURNAL [Vol. XXX
both corrections professionals and lawmakers. 57 Convicted felonsare disqualified from several forms of political participation andcitizenship: jury service, the right to vote, and the right to holdelective office.' 58 In some states, disenfranchisement is time-lim-ited, but in some other states felons are disenfranchised for life. 59
While lawmakers may derive political benefits from sustaininghigh rates of incarceration, the accumulation of disenfranchisedvoters in their districts defangs putative re-election challenges. Inthis way, disenfranchisement weakens political leverage over bothstate law and local policies that might moderate the practices thatintensify incarceration patterns. Disenfranchisement further de-prives residents of opportunities to engage in the social practice oflaw through activities such as jury duty, and motivates "resistance"to everyday citizen-law interactions such as cooperation in investi-gations.160 Finally, the racial-spatial concentration of incarcerationintensifies racial residential segregation, depressing real estate val-
157. In New York, state legislators and the Governor received large campaign con-tributions from private corrections contractors, they are provided personal servicessuch as chauffeurs, and are assigned campaign workers (from the contractors' pay-rolls) for their re-election campaigns. See Clifford Levy, Favors Heaped onLawmakers Raise Scrutiny, N.Y. TIMES, Feb. 17, 2003, at Al (showing that privatecontractors, such as the Correctional Services Corporation ("CCA"), currently havecontracts of $22 million to operate adult correctional facilities for the State of NewYork). According to the New York Times report, approximately $30,000 in campaigncontributions was given to the Republican State Committee both by CCA and privatecontributions made by CCA on behalf of its employees. In addition to gifts, campaigncontributions and logistical support, several state legislators living in New York Cityreceived free transportation back and forth to the state capital in Albany, approxi-mately 150 miles from the City, in vans used by corrections officers to shuttle prison-ers back and forth to court hearings in the City. In exchange for these services, letterswere written in 1997-98, for example, to the Governor's Office requesting that thecontracts to CCA be continued or expanded. See JOEL DYER, THE PERPETUAL PRIS-ONER MACHINE: How AMERICA PROFITS FROM CRIME 273-74 (2000). CaliforniaGovernor Gray Davis proposed a $40 million increase for the Corrections Depart-ment's $5.3 billion budget for the coming fiscal year, and further proposed building anew death row at San Quentin Prison at a cost of $220 million. The state faces abudget shortfall of $15 for the fiscal year. See John M. Broder, No Hard Time forPrison Budgets, N.Y. TIMES, Jan. 19, 2003, § 4, at 5.
158. 28 U.S.C. § 1865(b)(5) (1994) (disqualifying persons convicted of a crime pun-ishable by imprisonment for more than one year from jury service); Developments inthe Law-One Person, No Vote: The Law of Felon Disenfranchisement, 115 HARV. L.REV. 1939, 1940 (2002)
159. MAUER, supra note 2, at 186-87; Brian Pinaire et al., Barred from the Vote:Public Attitudes Toward the Disenfranchisement of Felons, 30 FORDHAM URB. L.J.1519, 1525 (2003).
160. Thompson, supra note 156, at 176-77.
1592

RECIPROCAL EFFECTS
ues and frustrating residents' efforts to build capital through homeownership.1
6 1
Denying felons the right to vote and other privileges, then, is notsimply a recurring form of stigma, infamia, or punishment. 62
When incarceration rates reach such a critical mass that ex-felonsmay alter elections, the fates not only of those persons, but also ofthe persons who live near them also are harmed. The effects ofdisenfranchisement on political outcomes is yet another dimensionof the endogeneity of incarceration in poor neighborhoods, and itscapacity for self-replication. The exclusion of felons from politicalparticipation exacts a political and economic cost for them and fortheir neighbors in the social areas where incarceration rates arehighest.
B. Incarceration, Law, and Policy
As incarceration policies have grown steadily over the past quar-ter century, there has been very little analysis of the implications ofalternative policies. Stochastic models have been available for de-cades to estimate an optimum level of incarceration that might bal-ance the fiscal and due process constraints of imprisonment with itscrime control benefits. 6 3 Yet the limited body of systematic analy-sis pales in contrast to the scale of imprisonment. And, almostnone of the research on imprisonment addresses its larger role inlegal or social control of crime.
Accordingly, we raise in this Essay several points that clarify therole of incarceration in a systemic theory of crime, law, and socialcontrol. First, the negative interaction of time and various mea-sures of law enforcement on incarceration rates suggests that earlyin the time interval, when crime rates are increasing, drug enforce-ment contributed to crime, but these effects wane over time ascrime declines but incarceration remains constant. At some tip-ping point incarceration transitions from an externality in local so-cial networks to become integrated in social networks and anessential part of the dynamics of social control. The constant rear-rangement of social networks through removal and return of pris-oners threatens to become a systemic part of neighborhood life.
161. Id. at 177-79162. George Fletcher, Disenfranchisement as Punishment: Reflections on the Racial
Use of Infamia, 46 UCLA L. REV. 1895, 1902 (1999).163. Alfred J. Blumstein & Daniel Nagin, On the Optimum Use of Incarceration for
Crime Control, 26 OPERATIONS RES. 381, 395-97 (1978); see Alfred J. Blumstein et al.,The Dynamics of a Homeostatic Punishment Process, 67 J. CRIM. L. & CRIMINOLOGY
317, 330 (1977).
2003] 1593

FORDHAM URBAN LAW JOURNAL [Vol. XXX
Second, the analyses at the precinct level show the sensitivity ofincarceration to enforcement practices that are implemented andmanaged at this larger and more socially heterogeneous unit ofanalysis. Incarceration is the product of policies that are set andadministered at a political and political-economic level beyondneighborhoods. Neighborhoods exist within these larger adminis-trative units, and in New York City, there often are several neigh-borhoods within each precinct. 164 When considering incarcerationeffects, and estimating the interdependency of crime and incarcera-tion within neighborhoods, conceptual and analytic models shouldconsider the nested structure of effects-policing is managed athigher levels of aggregation than is the locus of effects of local so-cial networks, while larger citywide effects represent an evenhigher level of aggregation. How we re-conceptualize the conven-tional approaches to studying neighborhood context should antici-pate a nested model of social and political effects whoseconsequences exert influences up and down the causal chain.
Third, data limitations of this study point to directions for furtherresearch. Conclusions about the effects of incarceration on crimeat finer units of spatial and social resolution will require more ex-tensive measurement. The importance of events in adjacent areaswill also require that estimates of spatial convergence and autocor-relation be included in models estimating localized dynamics of in-carceration and crime. In addition to improved measurement ofcrime in small areas, the effects of "structural covariates" of crimeare highly dependent on the unit of aggregation. The interpreta-tion of these effects is sensitive to the unit of spatial and socialaggregation, and errors of interpretation could arise from such mis-specification. In this study, we see evidence that at some tippingpoint, incarceration remains stable or continues to increase even ascrime-the supply of individuals for incarceration-remains con-stant or declines. Accordingly, more refined measures of the inci-dence versus the prevalence of incarceration at the local level arenecessary to make sense of the "churning effect" of incarcerationboth on crime and on social control.
Fourth, the dynamics of the jail population differ from the dy-namics of imprisonment, and estimates of incarceration effectsmust account for the unique but related effects of each. In twomodels, we see that the jail admission rate contributes to the im-prisonment rate, suggesting a cascading effect of jail on prison. But
164. See BRATTON & KNOBLER, supra note 73, at 229-30; JACKSON & MANBECK,
supra note 80, at xii-xvi.
1594

RECIPROCAL EFFECTS
the dynamics are likely to be more complicated than a simple cas-cade of incarceration. Jail populations leave and return to neigh-borhoods more frequently, exerting a churning effect on localsocial control through social disorder and low-level crime. Theseeffects also may invite more enforcement, raising the prospect ofcloser surveillance of other criminal activity, and increasing the riskof detection and incarceration.
Finally, two dimensions of law are critical factors in the produc-tion and internalization of incarceration within precincts. One isthe obvious effect of drug laws and the policy and organizationalincentives to aggressively enforce them. And the second are predi-cate felony laws that mandate incarceration after a person's firstfelony conviction. Drug arrests often produce felony convictions,which then establish criminal histories that increase the likelihoodof incarceration upon a subsequent arrest. Drug arrests were im-portant contributors to incarceration early in the panel, but theireffects diminished over time. The return of prisoners to communi-ties who may be rearrested guarantees their return to prison whenthey carry a prior felony conviction. Together with heightened pa-role surveillance and drug testing, the frameworks of enforcementand sentencing laws are powerful engines that drive incarceration,even as crime rates generally are in decline. Just as police practicesand management become part of an ecological dynamic of incar-ceration, the broader legal context also seems to be endogenous tothe dynamics that produce pockets of concentrated incarcerationthat endure over time.
CONCLUSION
The social exclusion of America's correctional population posesa challenge to democracy that demands political and social atten-tion. Only recently has a civic debate begun on the political andsocial consequences of the production of incarceration. 165 Re-search also has lead to reflection on the laws and policies that sus-
165. See, e.g., Human Rights Watch, Drugs & Human Rights, Reform the Rocke-feller Drug Laws (2002), at http://www.hrw.org/campaigns/drugs/ (last visited July 15,2003); see also Michelle Goldberg, Reforming Rockefeller Drug Laws, ALTERNET.
ORG, Aug. 6, 2002, at http://www.alternet.org/story.html?StorylD=13774 (last visitedJuly 15, 2003) (quoting former Republican State Senator John Dunne, author of the"Rockefeller Drug Laws," stating that these laws have been a ". . .well documentedfailure."); Lara Jakes & John Caher, Draconian Drug Laws No Panacea, ALBANY
TIMES UNION, May 9, 1999, at Al; Michael Massing, The Elephant in the Room, SA-LON, Feb. 22, 2003, at http://archive.salon.com/health/feature/2000/02/22/massing/in-dex.html (last visited July 15, 2003).
2003] 1595
FORDHAM URBAN LAW JOURNAL [Vol. XXX
tain incarceration over time and detach it from the social problemsit was meant to address. 166 With nearly two million Americans in-carcerated in American jails and prisons, a debate on the intended,unintended, and collateral consequences of this policy is long over-due. Such a debate is now underway in many state legislaturesacross the country;167 at least one state, Michigan, has eliminatedits mandatory minimum drug sentences,'168 and several other statesare actively considering revising mandatory minimum laws. 169 Sucha debate is critical to the political and social health of the nation.
166. See, e.g., Ernest Drucker, Population Impact of Mass Incarceration Under NewYork's Rockefeller Drug Laws: An Analysis of Years of Life Lost, 79 J. URB. HEALTH:BULL. N.Y. ACAD. MED. 1 (2002), available at http://www.nyam.org/publications/on-line/pdf/rockefeller.pdf (last visited July 15, 2003).
167. See Michigan to Drop Minimum Sentence Rules for Drug Crimes, N.Y. TIMEs,Dec. 26, 2002, at A26.
168. See Anand Giridharadas, National Briefing: Midwest: Michigan: RevisingMandatory Minimums, N.Y. TIMES, Feb. 28, 2003, at A23 (stating that Michigan's newsentencing guidelines have eliminated mandatory minimum ten year sentences for of-fenses involving fifty to 224 grams of a controlled substance, and twenty year mini-mum sentences for amounts over 225 grams); see also Michigan to Drop MinimumSentence Rules for Drug Crimes, supra note 167, at A26.
169. See supra note 166 and accompanying text. Legislation has been introduced inConnecticut, Indiana, Iowa, Kansas, Louisiana, Missouri, New Jersey, and North Car-olina that would reduce or eliminate mandatory minimums.
1596

RECIPROCAL EFFECTS
APPENDIX ADATA SOURCES AND MEASURES
CRIMINAL HISTORIES AND INCARCERATION RECORDS
Incarceration and criminal history data were obtained from theNew York State Division of Criminal Justice Services ("DCJS").All records were geocoded by residential address of the inmate,and aggregated to census tract, neighborhood, 17° and police pre-cinct. Each inmate record includes demographic data (age, race,gender), case characteristics (arrest charge category, case disposi-tion, and sentence length).
CRIME RATES
Data on crime rates by precinct were obtained from New YorkCity Police Department records of felony crime complaints for1985-96. Crimes were reported in specific crime categories (mur-der, aggravated assaults, robbery, motor vehicle theft, etc.), and ag-gregated into felony violence, felony property, and other felonycrimes. Crimes are compiled on forms consistent with UniformCrime Report crime categories.171 Crime-specific and crime-gen-eral rates per 1,000 population were computed for each precinct.
HOMICIDE RATES
We use homicide victimization rates as an alternate measure ofcriminal activity for analyses at the neighborhood level. In NewYork City prior to 1994, general crime arrest and report indicatorsare available only for administrative units of aggregation such aspolice precincts. 172 Address records for homicide victimization,however, are available for each year in the series. The victim's res-idence was geocoded into spatial coordinates, and assigned to hier-archically organized spatial units: census block group, census tract,neighborhood, and police precinct. 73 Once aggregated, measures
170. JACKSON & MANBECK, supra note 80, at xii-xv; see supra note 82 on neighbor-hood boundaries. See http://www.infoshare.org (last visited July 15, 2000), for specificboundary maps and demographic information about the neighborhood boundaries.
171. U.S. Dep't of Justice, Fed. Bureau of Investigation, Uniform Crime Reports,available at http://www.fbi.gov/ucr/ucrarticle.htm (last visited July 15, 2003).
172. See supra note 104 and accompanying text; see also BRATrON & KNOBLER,supra note 73, at 233-39.
173. We use victim residence as a proxy for event location, based on a comparisonof the distance from victim residence to location of the body. This data was availablefrom records of the New York City Medical Examiner, and was analyzed for a sub-sample of homicide victimizations of males eighteen to thirty-five years of age. Thetwo addresses were geocoded and the distance computed for each case. Approxi-
2003] 1597

FORDHAM URBAN LAW JOURNAL [Vol. XXX
are computed including the number and rate of homicides eachyear in the series, disaggregated by method (firearm versus other)and demographic categories (gender, race, and age).
DRUG ENFORCEMENT
We include drug arrests in the model as a measure of drug en-forcement. Despite weaknesses in the reliability of drug arrests asa measure of drug markets, 74 these limitations may be more sali-ent for cross-city research and less vulnerable to within-city neigh-borhood variation. Also, several studies provide evidence thatdrug arrests are reasonable proxies for overall drug enforcementactivity and also for drug market activity. 175
NEIGHBORHOOD INDICATORS: SOCIAL STRUCTURE, ECONOMIC
STATUS, AND SOCIAL CONTROL
We included measures of social and economic factors that re-flected contemporary theory regarding "place" and violence, theo-ries that incorporate not just the structural deficits of social areasbut also their dynamic processes of social control. We selectednineteen tract-level variables from the 1990 Census files, andsorted them into seven separate dimensions that reflected thesetheoretical domains. These variables are classified into constructsthat reflect dimensions of ecological or neighborhood risk. Dimen-sions include: poverty, racial residential segregation, social control,population mobility (anonymity), labor force participation, housingstructure, and immigration.
* SOCIAL CONTROL-We computed two dimensions of socialcontrol. The first captured the extent of supervision of youngpeople within neighborhoods, including: 1) the concentrationof youth population; 2) the percent of female-headed house-holds with young children; and 3) the ratio of youths to adults.
mately sixty percent of the homicide victims were killed within two miles of theirhomes, and an additional twenty percent were killed within two miles of home. Sincevictim residence was available for the full sample of homicides, we used victim resi-dence as a proxy for the location of the event. The proximity of event and residencesuggested that error in assignment of individuals to locations would be small and ran-domly distributed. Also, much of the error in this distribution would be accounted forby the use of spatial autocorrelation of events in surrounding tracts.
174. See, e.g., TONRY, supra note 31, at 83-104 (discussing the politicization of drugarrest data).
175. Baumer et al., supra note 107, at 325-26; Ousey & Lee, supra note 96, at 80;Richard Rosenfield & Scott Decker, Are Arrest Statistics a Valid Measure of IllicitDrug Use? The Relationship between Criminal Justice and Public Health Indicators ofCocaine, Heroin, and Marijuana Use, 16 JUST. Q. 685, 696-97 (1999).
1598
RECIPROCAL EFFECTS
The second dimension examined population size and change,including: 1) the overall size of the population; and 2) residen-tial stability and turnover, based on length of residence.
" POVERTY-We computed three indicators of poverty: 1) per-centage of households with incomes below the poverty level;2) percent of households receiving public assistance; and 3) aGini coefficient to measure inequality of household income ofthat tract relative to other tracts in the City.
" LABOR MARKET PARTICIPATION-Labor market participa-tion and human capital within the tract were measured withseveral variables: 1) employment rates; 2) percent employedin professional or managerial jobs; 3) the percent of the adultpopulation over twenty-five with a high school education; and4) the overall labor force participation rate (i.e., those work-ing and those seeking work).
" RACIAL RESIDENTIAL SEGREGATION-We used a measure ofracial fragmentation to characterize segregation and popula-tion heterogeneity within census tracts.176
* HOUSING STRUCTURE AND MARKET CONDITIONS-Three
dimensions of housing were computed: 1) vacancy rates: thepercentage of vacant housing units; 2) overcrowding: themean number of persons per room in residential units; and 3)the percent of housing units that are owner-occupied orrented.
• IMMIGRATION-Two dimensions of immigration include lin-guistic isolation and whether the head of the household wasforeign-born.
176. Residential racial fragmentation is computed as 1 - ((%black)2 + (%white)2 +(%Hispanic)2 + (%other)2 ). See CHARLES LEWIS TAYLOR & MICHAEL C. HUDSON,WORLD HANDBOOK OF POLITICAL AND SOCIAL INDICATORS 216 (2d ed. 1972).
2003] 1599

3
I As r
00,

*
I ]ill
I"
i+

I
'~1ii
- ii
lE1O[iEE
+
. L ~iii
8