for the year ended 31 March 2018
34
23 July 2018 This presentation is available at www.eskom.co.za/IR2018 Eskom group annual results for the year ended 31 March 2018
Transcript of for the year ended 31 March 2018

23 July 2018 This presentation is available at www.eskom.co.za/IR2018
Eskom group annual results for the year ended 31 March 2018

Contents
From “business as usual” to
“transition towards
sustainability”
Key priorities to position
Eskom for growth
Conclusion
Operational performance
Financial performance

From “business as usual” to
“transition towards sustainability”

• Eskom has experienced difficult years following leadership and governance
instability
• A new board and leadership team was appointed to clean up, stabilise,
and set Eskom up for future growth
• Despite experiencing a difficult year:
o Improved liquidity
o Continued improvement in operational performance
o Advancement in governance and control systems
• A strategic review is being undertaken in partnership with the shareholder
to build the Eskom of the future
3
There will be pressure until FY2020, as we transition towards financial and
operational sustainability, requiring resolute, tough and decisive leadership
Stabilisation for transition to a sustainable future

Pre-January 2018: business as usual
• Lack of long-term integrated strategy
• Skewed towards compliance, minimum
strategic engagement
• Compounding this is poor performance
o Qualified audit opinion
o Allegations of corruption and
mismanagement
o Governance challenges
o Negative investor sentiment
• Procrastination on decisions and actions
by all stakeholders
• Leadership instability
o 10 CEOs in 10 years
o 6 Boards in 10 years
New Minister of Public Enterprises in 2018 emphasised the importance of alignment of
the shareholder compact, Corporate Plan and business strategy
• Dislocation between operations and
government expectations (statement of
intent, corporate plans & shareholder
compacts)
“The overall financial performance of the
business had been good, with the Design-
to-Cost strategy showing positive results
as reflected by an increase in revenue…”
Minister of Public Enterprises, June
2017
4
From “business as usual” to “transition towards sustainability”
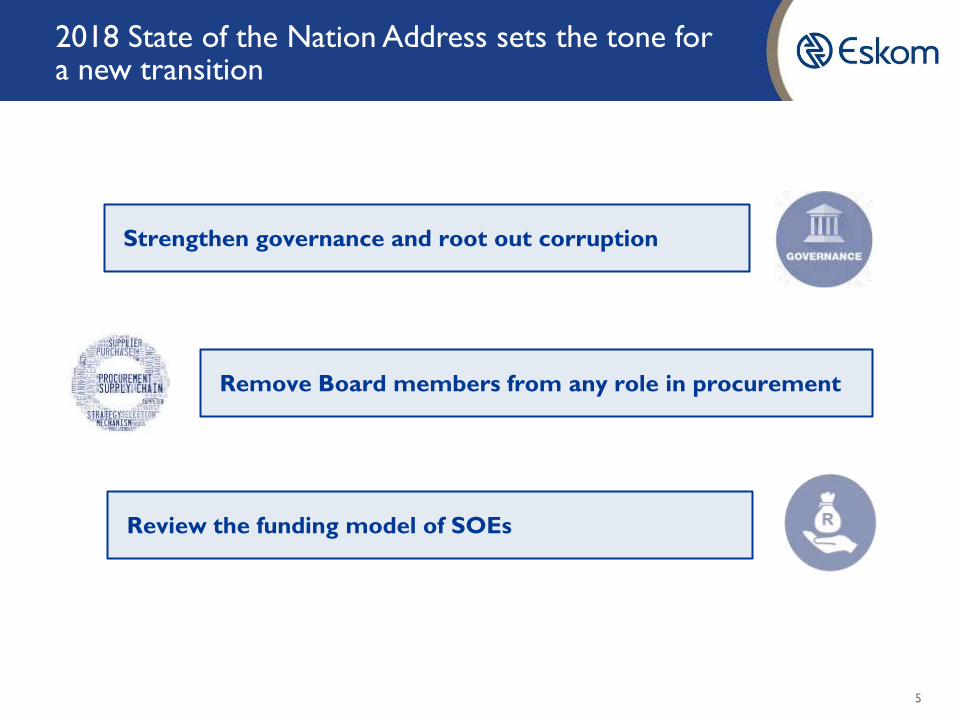
Strengthen governance and root out corruption
5
2018 State of the Nation Address sets the tone for a new transition
Review the funding model of SOEs
Remove Board members from any role in procurement

January 2018: Eskom
transition
• Appointment of new
Board
• Immediate Board focus:
1. Clean up
2. Stabilisation
• Transition from
“business as usual” to
the Eskom of the future
• Noting Eskom’s size,
challenges, complexity
and role in the
economy, the Board
approved a three-
person top team
comprising a GCE,
CFO and COO
Key decisions by the Board
Governance
Corporate
Plan
Financial
sustainability
• Committed to the highest level of governance
• Reviewing the purpose, mandate and powers of all
sub-committees
• Decision making by board sub-committees
temporarily elevated to the board
• Concerns raised regarding 2017 Corporate Plan
o Debt to increase from R387 billion to
R600 billion within four years
o Gearing increasing from 72% to 80%
• Permission from the shareholder to submit a
one-year plan
• Emphasis to be placed on maximising revenue and
containing costs
• Challenge NERSA decision in court – 2018/19
tariff increase insufficient
6
Transition from “business as usual” approach towards sustainability
Key priorities to position
Eskom for growth

Clean up
Reposition Eskom as the most trusted state-owned entity
• Instill transparent and effective governance
• Initiative to address qualified audit identified more irregular expenses
Improve financial health
• 21% increase in EBITDA from R37.5 billion in FY2017 to R45.4 billion in
FY2018
• RCA determination of R32.7 billion
• Improved liquidity by raising R57 billion since January 2018
• Capex and opex reduction to achieve financial viability
Future Eskom
to grow the
business
Stabilise
Efficiency
optimisation
Prepare for growth - New initiatives to increase EBITDA
• Target 500MW additional demand
• Reduce arrear debt
• Manage risk of increasing coal costs
• Optimise staff productivity levels
Become an innovative and data-driven utility
• Grow new markets and products while retaining and growing existing clients
• Achieve long-term sustainability and developmental mandate
• Sustainable business model for Eskom
8
Driving key priorities to position Eskom for growth

10 implicated senior executives exited. Finalisation of outstanding disciplinary hearings relating to senior executives being accelerated
11 criminal cases opened, five of which involve nine senior executives
Total of 1 049 outstanding disciplinary cases since April 2018, of which 628 have been finalised, resulting in 75 employee exits
239 whistle-blowing cases investigated, 122 of which have been concluded. Disciplinary process is under way in respect of 67 confirmed cases
Remedial action has been taken against 25 staff doing business with Eskom; 7 exited
Lifestyle audits of senior management in progress. There is effective declaration of interest
Investigated all irregular supplier contracts (so far five no longer doing business with Eskom – the amount spent with these companies in the past three years was R2.3 billion). Recovered R902 million from McKinsey; pursuing interest recovery
Cooperating with eight regulatory bodies conducting major investigations 1
1. National Treasury procurement investigations, Zondo Commission, Hawks, SIU, Parliamentary Inquiry, National Director of Public Prosecutions, Standing
Committee on Public Accounts and SAPS
CLEAN UP: GOVERNANCE
9
Significant progress towards becoming a trusted SOC

Improved liquidity Financial viability
• Raised R57 billion since January 2018
• Raised 22% to date of R72 billion borrowing
requirement for 2018/19
• Firm commitment to increase funding to
62% of 2018/19 borrowing requirement
• Discussion with lender at advance stage; will
increase funding to more than 80% of
2018/19 borrowing requirement
• In addition, firm commitment to secure
34% of R56 billion funding for 2019/20
borrowing requirement
• Growing investor appetite for Eskom bonds
Reprioritise capex
• Restricted capex to R45 billion over the
next five years, a saving of R55 billion
• Risks and tradeoffs have been identified
to mitigate against impact of capex
reduction
Reduced opex
• Restrict total operating cost to below
inflation, releasing efficiencies of
R11 billion per annum
• Kept maintenance at current levels
However this is not sufficient, and tough decisions are required
Initiatives identified to increase EBITDA margin to 35% by optimising capex, opex and
maintenance, while improving productivity and efficiency
10
STABILISE LIQUIDITY
Efforts are improving liquidity and financial viability to achieve positive shift in investor confidence

Grow sales
• Stimulate sales by developing new products and services and optimising tariffs
• Confirmed 3.5 TWh sales growth initiatives, resulting in R2.9 billion additional revenue over two years, with nine deals signed
• Target revenue recovery of R600 million per annum
• Accelerate customer connections
• Intensify credit management
• Collect additional R1 billion per annum from municipalities
• Together with Government, seek solutions to solve municipal arrear debt
• Installation of prepaid meters to continue
Manage risk of increasing coal costs
• Prioritisation of capex investments into cost-plus mines
• Optimisation of logistics costs, including migration from road to rail
• Collaboration with state-owned mining company
Reduce arrear debt
Optimise productivity levels
• Holistic review and robust stakeholder discussions to identify optimal productivity improvement solutions
11
EFFICIENCY OPTIMISATION
Key initiatives to drive growth and efficiency
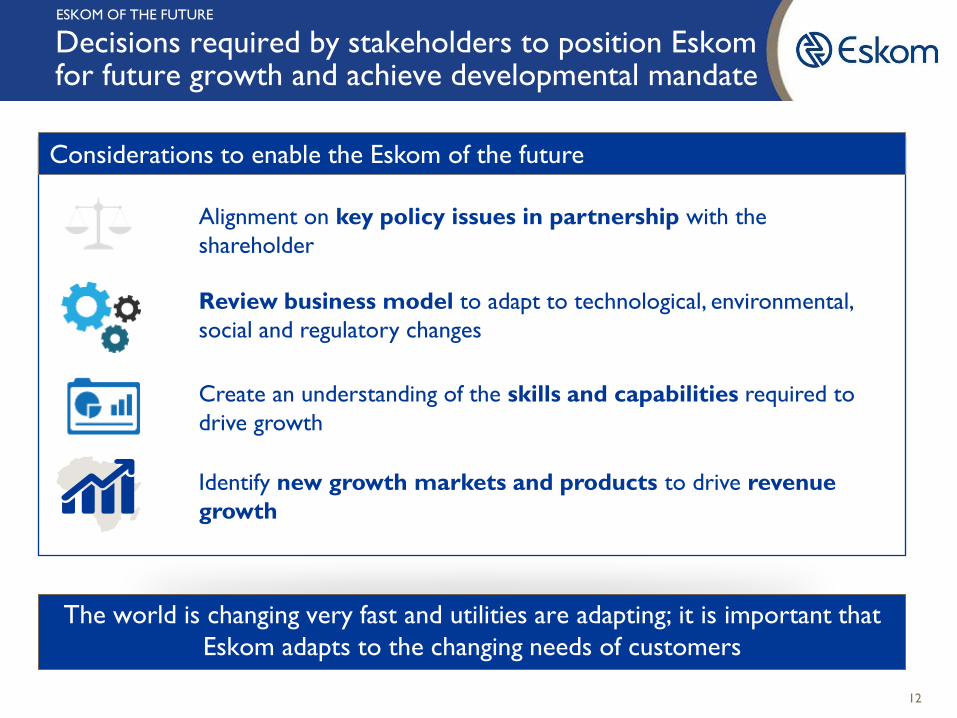
Review business model to adapt to technological, environmental,
social and regulatory changes
Alignment on key policy issues in partnership with the
shareholder
Considerations to enable the Eskom of the future
Create an understanding of the skills and capabilities required to
drive growth
Identify new growth markets and products to drive revenue
growth
The world is changing very fast and utilities are adapting; it is important that
Eskom adapts to the changing needs of customers
12
ESKOM OF THE FUTURE
Decisions required by stakeholders to position Eskom for future growth and achieve developmental mandate

Operational performance

• Generation plant availability improved from 77.3%
to 78%
• Significant improvement in environmental
performance:
o Particulate emissions from 0.30 to
0.27kg/MWhSO
o Water usage from 1.42 to 1.30l/kWhSO
• Transmission achieved best performance in 10
years: system minutes lost improved from 3.8 to 2.1
• Distribution network improvement
o (SAIFI1) improved from 18.9 to 18.7 events
o (SAIDI2) improved from 38.9 to 38.8 hours
• Reviewed Medupi and Kusile dates
o Three units of Medupi and one unit of Kusile in
commercial operation, with combined installed
capacity of 3 181MW
• 2 510MVA transformer capacity installed; 722km of
high-voltage transmission lines commissioned
15
20
25
30
35
40
45
1.5
2.0
2.5
3.0
3.5
4.0
2016 2015 2014 2017 2013 2018
SAIFI
SAIDI System minutes lost for events < 1 minute
7877
71
7475
78 78
75
83838482
65
70
75
80
85
2017 2018 2013 2015 2014 2016
EUF % EAF %
Plant availability & utilisation
Network performance
%
Minutes Events/hours
1. System average interruption frequency index 2. System average interruption duration index 14
Operational performance continues to improve

• 215 519 households connected (2017:
207 436)
• More than one million households
connected since 2013
• Lost-time injury rate improved to 0.23
(2017: 0.39), the best since 2008
• Regrettably, Eskom suffered three
employee fatalities (2017: four) and 12
contractor fatalities (2017: six)
• B-BBEE attributable spend of 80%
• Spend with black-owned suppliers of 45%
• Employment of female employees in senior
management positions 38% (2017: 37%)
• Coal stock remains a focus area to achieve
adequate levels
200
100
180
120
140
220
160
1 000
0
800
1 200
200
400
600
2018 2017 2016 2015 2014 2013
Cummulative Annual
Electrification
Number 000 Number 000
15
Operational performance continues to improve

Financial performance

Overview of financial performance
17
• EBITDA of R45.4 billion (2017: R37.5 billion)
• Net loss after tax of R2.3 billion
(2017: R0.9 billion profit)
• Net cash from operations of
R37.6 billion (2017: R45.8 billion)
• Liquid assets of R22.3 billion
(2017: R32.5 billion)
• 22% of funding requirement for 2018/19
secured to date
• Modified audit opinion

Public Finance
Management Act, 1999
International Financial
Reporting Standards
State-owned company
• An external auditor expresses an
opinion about the fairness of the
financial position and financial
performance of an entity:
• Unmodified: a true and fair view of the
entity’s operations
• Modified
o Qualified: auditors take exception to a
certain accounting application
o Adverse: a conflict between the auditor
and entity
o Disclaimer: no opinion due to
limitations by the entity
The purpose of the PFMA is to regulate
financial management of expenditure, and
ensure assets and liabilities of entities are
managed efficiently and effectively
• Irregular expenditure: expenditure other
than unauthorised expenditure, incurred in
contravention of or that is not in
accordance with a requirement of any
applicable legislation or policy
• Fruitless and wasteful expenditure:
expenditure which was made in vain and
would have been avoided had reasonable
care been exercised
18
Eskom complies with IFRS and PFMA reporting
requirements and is audited on that basis

March 2017
September 2017
(interim review) March 2018
IFRS
Going concern
PFMA n/a
Independent auditors’ opinions
Modified
(1) Prior year restatement due to non-accounting for assets built by customers
(2) Uncertainty that may cast significant doubt on the group’s ability to continue
as a going concern (similar to emphasis of matter)
(3) Incomplete reporting of irregular expenditure
(4) No reporting requirement at half-year
(5) Incomplete reporting of irregular expenditure, fruitless and wasteful
expenditure and losses due to criminal conduct
(2)
(4) Unmodified
Emphasis of matter (2)
(3) (5)
(1)
19
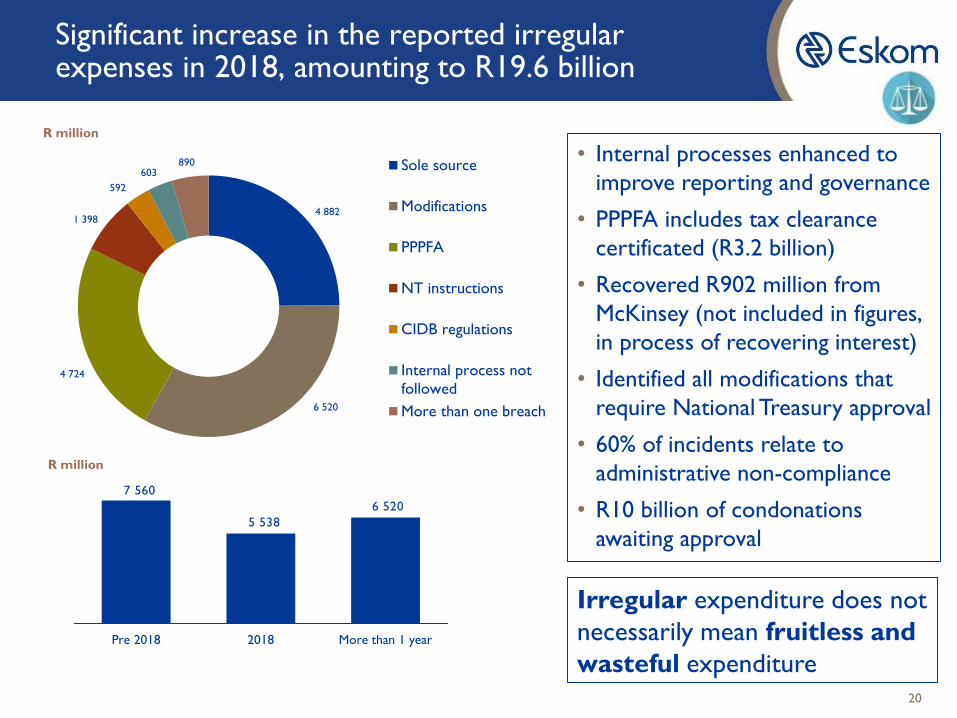
Significant increase in the reported irregular expenses in 2018, amounting to R19.6 billion
4 882
6 520
4 724
1 398
592
603 890 Sole source
Modifications
PPPFA
NT instructions
CIDB regulations
Internal process not
followed
More than one breach
R million
R million
• Internal processes enhanced to
improve reporting and governance
• PPPFA includes tax clearance
certificated (R3.2 billion)
• Recovered R902 million from
McKinsey (not included in figures,
in process of recovering interest)
• Identified all modifications that
require National Treasury approval
• 60% of incidents relate to
administrative non-compliance
• R10 billion of condonations
awaiting approval
6 520
5 538
7 560
Pre 2018 2018 More than 1 year
Irregular expenditure does not
necessarily mean fruitless and
wasteful expenditure 20

R billion
March
2018
March
2017
YoY %
change
Revenue 177 177 –
Other income 1 2 (13)
Primary energy (85) (83) (3)
Net employee benefit expenses (29) (33) 11
Net impairment loss (1) (2) 67
Other expenses (18) (24) 23
EBITDA (Profit before depreciation
and amortisation and net fair value loss) 45 38 21
Depreciation and amortisation
expenses (23) (20) (14)
Net fair value loss on financial
instruments and embedded
derivatives
(2) (2) (3)
Net finance cost
(23) (14) (61)
(Loss)/profit before tax (3) 1
Income tax – –
Net (loss)/profit for the year (2) 1
21
• Sales down by 0.9%;
revenue up by 0.8%
• Primary energy cost
contained
• Employee benefit costs and
operating expenses lower
due to decrease in
provisions
• Depreciation growth due
to commissioning of new
assets and power station
units
• Finance costs linked to less
costs capitalised and
growth in borrowings
Income statement for the year ended 31 March 2018

R billion March 2018
March 2017
YoY % change
Property, plant and equipment and intangible assets 635 593 7
Working capital 46 44 14
Liquid assets 23 33 (31)
Other assets 36 41 (5)
Total assets 739 710 4
Equity 170 176 (4)
Debt securities and borrowings 389 355 9
Working capital 44 52 (15)
Other liabilities 136 127 8
Total equity and liabilities 739 710 4
Financial position at 31 March
22

23
R billion
March
2018
March
2017
YoY %
change
Net cash from operating activities 38 46 (18)
Cash required for debt servicing (44) (36) (22)
Net cash movement before investment activities (7) 10
Cash flow used in investment activities (55) (62) 11
Cash flow from financing activities 58 44 32
Net decrease in cash and cash equivalents (4) (8)
1.0
Provisions Advance receipts
/ payments
EBITDA
2.0
45.4
0.6
Derivative
instruments
1.7
2.4
Cash from
operations
Working capital
37.6
Other
Cash flow statement for the year ended 31 March 2018

Ratio March
2018
March
2017
EBITDA margin, % 25.9 21.4
Cash interest cover, ratio 1.22 1.73
Debt service cover, ratio 0.87 1.37
Gross debt/EBITDA, ratio 9.71 10.84
Debt/equity (including long-
term provisions), ratio 2.52 2.11
Gearing, % 72 68
Free funds from operations as
% of gross debt, % 1 9.09 11.69
Free funds from operations as
% of total capex, % 1 77.84 75.11
1. Shareholder compact definition
12
14
16
18
20
22
24
26
25
20
15
35
45
10
5
0
-5
40
30
50
2018 2017 2016 2015 2014 2013
Net profit after tax (Rbn)
EBITDA (Rbn)
EBITDA margin (%)
Profitability
50
52
54
56
58
60
62
64
66
68
70
72
1,6
1,2
1,8
2,4
2,2
2,0
2,6
1,4
1,0
2018 2016 2017 2015 2014 2013
Gearing
Debt/equity
Solvency
24
Most financial ratios deteriorated and are expected to deteriorate further before improving

Overview of capital expenditure
25
Total Eskom funded capital expenditure
R billion
• Total Eskom group funded capital
of R47 billion (2017: R56 billion)
with R28 billion used to expand
the asset base and R17 billion
spent on existing assets
• Department of Energy funded
electrification capex of
R3.4 billion (not included in
graph)
2837
30 31 3428
30
1820
19
17
29
0
10
20
30
40
50
60
70
1
2017
2
2016
2
2015 2018
0
2014
3
2013
2
New asset base (Rbn)
Existing asset base (Rbn)
Other (Rbn)
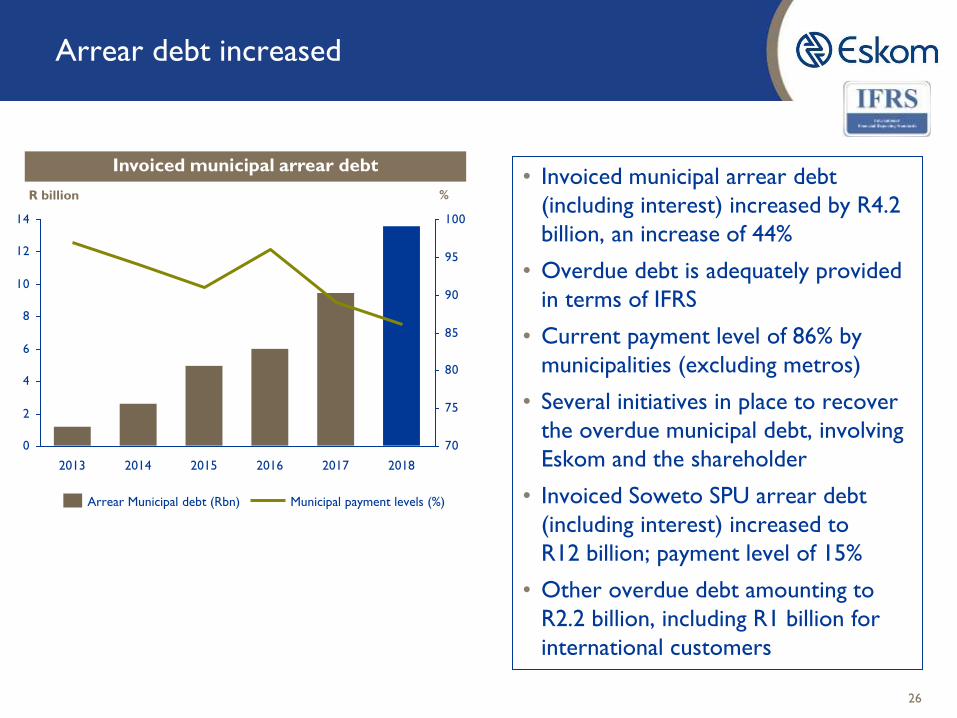
• Invoiced municipal arrear debt
(including interest) increased by R4.2
billion, an increase of 44%
• Overdue debt is adequately provided
in terms of IFRS
• Current payment level of 86% by
municipalities (excluding metros)
• Several initiatives in place to recover
the overdue municipal debt, involving
Eskom and the shareholder
• Invoiced Soweto SPU arrear debt
(including interest) increased to
R12 billion; payment level of 15%
• Other overdue debt amounting to
R2.2 billion, including R1 billion for
international customers
Arrear debt increased
Invoiced municipal arrear debt
0
2
4
6
8
10
12
14
70
75
80
85
90
95
100
2018 2017 2016 2015 2014 2013
Municipal payment levels (%) Arrear Municipal debt (Rbn)
R billion %
26

• The external auditors raised an emphasis of matter on Eskom’s status
as a going concern in their review for the six months ended
30 September 2017
• The steps taken by the shareholder and the Board boosted investor
confidence, and the liquidity position improved since January 2018
• Eskom continues to face significant financial and liquidity challenges in
the short to medium term, mainly due to the high debt burden, low
sales growth and increased finance costs
• Eskom is awaiting the outcomes of the liquidation of the R32.7 billion
RCA balance and the MYPD 4 decision, which influences future
revenue streams
• The auditors raised uncertainty that may cast significant doubt on the
group’s ability to continue as a going concern
Liquidity and going concern
27

28
17
75
350
58
275
Remaining Unallocated
portion
Under
negotiation
Portion
allocated
Total
Government
Guarantee
R billion
Guarantee utilisation allocation
20
6
12
27
2019 2020 2022 2021
Nominal maturities of guaranteed debt
R billion
• Eskom successfully raised R57 billion for the
year ended 31 March 2018
• R43 billion of this was raised between
January and March 2018
R billion
Funding
plan Committed
DFIs 15.3 8.8
ECAs 5.8 1.0
International bonds 20.0 –
Domestic bonds and
notes > 1 year 13.0 5.5
Domestic bonds and
notes < 1 year 10.0 0.8
Structured products 8.0 –
Total funding 72.1 16.1
% secured 22%
Eskom has secured 22% of funding for 2018/19 financial year to date

Summary of financial performance
29
• Liquidity position improved since January 2018
• Improved investor sentiment
• EBITDA and EBITDA margin % increased
• However, reported a net loss due to increased
depreciation and finance costs
• Reduced cash from operations
• Most financial ratios deteriorated and are expected
to deteriorate further, before stabilising and
improving
• Additional work is required to ensure continued
and enhanced PFMA reporting
• Financial performance needs to improve to ensure
financial sustainability

Conclusion

• Liquidity improved, operational performance continues to improve
• We are committed to turning around this institution
• Need for alignment between the shareholder compact, Corporate Plan and business
operations
• Shareholder support for Board and management
• The transition towards financial and operational sustainability requires resolute,
tough and decisive leadership
• A strategic review is being undertaken to re-energise, shift direction and set a firm
foundation for Eskom’s growth:
o Strengthening Eskom’s financial position and balance sheet
o Reviewing the business model to respond to global energy industry changes
o Growing the business into new markets and products
o Improving trust and restoring labour, investor and stakeholder confidence
o Reviewing the IPP and coal strategy
31
Eskom is transitioning towards sustainability

Eskom Contractor
Academy Top three position in the 2017
community upliftment category
Awarded the 2017
Technology Transfer Award
for research conducted on
the 765kV insulator project
Most attractive key
occupation (electrical
engineers) from engineering
professionals
The Foundation, with the
University of Limpopo, won
the Africa Gold Award and
Overall Global Thematic
Award in Norway, for
entrepreneurship and for
enterprise skills development
National and international recognition for best performance
32

This presentation does not constitute or form part of and should not be construed as, an offer to sell, or the solicitation or
invitation of any offer to buy or subscribe for or underwrite or otherwise acquire, securities of Eskom Holdings SOC Ltd
(Eskom), any holding company or any of its subsidiaries in any jurisdiction or any other person, nor an inducement to enter
into any investment activity. No part of this presentation, nor the fact of its distribution, should form the basis of, or be relied
on in connection with, any contract or commitment or investment decision whatsoever. This presentation does not constitute a
recommendation regarding any securities of Eskom or any other person.
Certain statements in this presentation regarding Eskom’s business operations may constitute “forward looking statements”. All
statements other than statements of historical fact included in this presentation, including, without limitation, those regarding
the financial position, business strategy, management plans and objectives for future operations of Eskom are forward looking
statements.
Forward-looking statements are not intended to be a guarantee of future results, but instead constitute Eskom’s current
expectations based on reasonable assumptions. Forecasted financial information is based on certain material assumptions. These
assumptions include, but are not limited to continued normal levels of operating performance and electricity demand in the
Customer Services, Distribution and Transmission divisions and operational performance in the Generation and Primary Energy
divisions consistent with historical levels, and incremental capacity additions through the Group Capital division at investment
levels and rates of return consistent with prior experience, as well as achievements of planned productivity improvements
throughout the business activities.
Actual results could differ materially from those projected in any forward-looking statements due to risks, uncertainties and
other factors. Eskom neither intends to nor assumes any obligation to update or revise any forward-looking statements,
whether as a result of new information, future events or otherwise.
In preparation of this document certain publicly available data was used. While the sources used are generally regarded as
reliable the content has not been verified. Eskom does not accept any responsibility for using any such information.
Disclaimer
33