Year ended March 31, 2015
50
ANNUAL REPORT 2015 Year ended March 31, 2015
Transcript of Year ended March 31, 2015

Nippon Light Metal Holdings Company, Ltd.
NYK Tennoz Building, 2-20, Higashi-Shinagawa 2-chome
Shinagawa-ku, Tokyo 140-8628, Japan
http://www.nikkeikinholdings.co.jp
Printed in Japan
ANNUAL REPORT 2015Year ended March 31, 2015
NIPPO
N LIG
HT M
ETAL H
OLD
ING
S COM
PAN
Y, LTD. A
NN
UA
L REPORT 2015
005_0600701372709.indd 1 2015/09/09 15:41:39

47
2012 20122013 20132014 2014 20142015 2015 2015
Billions of yen Years ended March 31
Net Sales
Billions of yen Years ended March 31
Operating Profit
Billions of yen As of March 31
Total Assets
2010 2010 20102011 2012 2013 2011 2011
Nippon Light Metal Company, Ltd.
Nippon Light Metal Holdings Company, Ltd.
Nippon Light Metal Company, Ltd.
Nippon Light Metal Holdings Company, Ltd.
Nippon Light Metal Company, Ltd.
Nippon Light Metal Holdings Company, Ltd.
600
450
300
150
0
600
450
300
150
0
30
24
18
12
6
0
Corporate DataProfile
Consolidated Financial Highlight
Cautionary Statement
This annual report contains various projections and estimates. Important factors that could alter these projections and estimates include
changes in the balance of aluminum supply and demand, fluctuations in the price of aluminum ingot and foreign exchange rates, as well
as shifts in Japanese government policies and regulations. The Company cautions, therefore, that the projections and estimates contained
herein involve risk and uncertainty, and that actual results could differ materially from those expressed or implied.
Since its establishment, the NLM Group has been Japan’s sole fully integrated aluminum manufacturer
offering varieties of products ranging from aluminum raw material to fabricated products.
Aluminum has properties that make it a superb industrial material: it is lightweight and has
excellent processability, corrosion resistance, thermal conductivity, and recyclability. Nippon Light
Metal applies its core strengths — a wealth of knowledge about aluminum and its characteristics and
technological capabilities that have been developed over many years — to supply a highly diversified
range of products to a number of key industrial sectors, including the automotive, electrical and
electronics, information and telecommunication, environment, safety, energy, construction, railroad,
and food products industries.
By carrying on development of new applications for aluminum and aluminum materials, the
NLM Group is to continue to support customers in wide-ranging industrial sectors and contribute to
improving the quality of people’s lives and protection of the environment.
2014 2015 2015
Millions of yenThousands ofU.S. dollars
For the year:Net sales ¥402,829 ¥431,477 $3,590,555 Operating profit 12,617 19,305 160,648 Net income 5,128 9,645 80,261
At year-end:Total assets 432,538 457,277 3,805,251 Net assets 121,194 137,385 1,143,255 Short-term borrowings and long-term debt, including bonds and capital lease obligation 202,619 192,594 1,602,680
Head Office
NYK Tennoz Building2-20, Higashi-Shinagawa 2-chomeShinagawa-ku, Tokyo 140-8628, Japanhttp://www.nikkeikinholdings.co.jpPhone: 81-3-5461-8601Fax: 81-3-5461-8681
Established
October 1. 2012
Paid-In Capital
¥39,085 million
Shares of Common Stock
Authorized: 2,000,000,000Issued: 545,126,049
Number of Shareholders
52,706
Stock Exchange Listings
Tokyo
Transfer Agent of Common Stock
Sumitomo Mitsui Trust Bank, Ltd.
Last Shareholders’ Meeting
June 24, 2015
Major Shareholders
(Ratio of Stock Holding)Japan Trustee Services Bank, Ltd.(trust accounts)(6.6%)
The Master Trust Bank of Japan, Ltd.(trust accounts)(6.5%)
The Dai-ichi Mutual Life Insurance Co.(3.7%)
Nikkei-Keiyu-Kai(2.9%)
The Light Metal Educational Foundation, Inc.(2.7%)
Asahi Mutual Life Insurance Co.(2.3%)
Mizuho Bank, Ltd.(2.1%)
Japan Trustee Services Bank,Ltd(trust accounts 9)(1.9%)
CBNY DFA International Small Cap Value Portfolio(1.7%)
Sumitomo Mitsui Trust Bank, Ltd.(1.7%)
(As of March 31, 2015)
Nippon Light Metal Holdings Company, Ltd. and its consolidated subsidiaries Years ended March 31
005_0600701372709.indd 2 2015/09/09 15:41:40

Nippon Light Metal Holdings Company, Ltd. Nippon Light Metal Holdings Company, Ltd. Nippon Light Metal Holdings Company, Ltd.
Net Income per Share = (Net Income - Amount not attributable to common shareholders) / Average Number of Shares Outstanding
Net Assets per Share = (Net Assets-Minority interests in consolidated subsidiaries) / Number of Shares Outstanding at Year-end
Net Income per Share Net Assets per Share Cash Dividends per Share
Yen Years ended March 31 Yen Years ended March 31 Yen As of March 31
2010 2010 20102011 2011 20112012 2012 20122013 2013 20132014 2014 20142015 2015 2015
Nippon Light Metal Company, Ltd. Nippon Light Metal Company, Ltd. Nippon Light Metal Company, Ltd.250.0
200.0
150.0
100.0
50.0
0
25.0
20.0
15.0
10.0
5.0
0
5.0
4.0
3.0
2.0
1.0
0
1
Consolidated Financial Highlights ................................................................................................................To Our Shareholders .......................................................................................................................................NLM Group Topics ..........................................................................................................................................Special Feature ............................................................................................................................................... Corporate Governance And Internal Control Systems .............................................................................NLM Group Environmental Activities .........................................................................................................NLM Group .......................................................................................................................................................Review Of Operations.....................................................................................................................................Consolidated Six-Year Summary ..................................................................................................................Financial Review .............................................................................................................................................Consolidated Balance Sheets ......................................................................................................................Consolidated Statements Of Income ...........................................................................................................Consolidated Statements Of Comprehensive Income ..............................................................................Consolidated Statements Of Changes In Net Assets ...............................................................................Consolidated Statements Of Cash Flows ....................................................................................................Notes To Consolidated Financial Statements ............................................................................................Report Of Independent Auditors ..................................................................................................................Overseas Network ..........................................................................................................................................Directors And Officers ...................................................................................................................................Corporate Data ................................................................................................................................................
C22568
101112161820222324252644454647
Contents
2014 2015 2015
yen U.S. dollars
Per share data (yen and dollars):Net income —basic ¥ 9.43 ¥ 17.74 $ 0.15
—diluted 9.04 15.59 0.13 Cash dividends 4.00 5.00 0.04 Net assets 203.03 223.27 1.86
Stock information (TSE) (yen and dollars):Stock price:
High ¥ 164 ¥ 193 $ 1.61 Low 95 132 1.10
Note: U.S. dollar amounts have been translated, for convenience only, at the exchange rate of ¥120.17 = U.S.$1.00. See Note 2 of the Notes to the Consolidated Financial Statements.
010_0600701372709.indd 1 2015/09/08 14:39:54

2
Ichiro Okamoto, President & CEO Takashi Ishiyama, Chairman of the Board and director
To Our Shareholders
I would like to take this opportunity to extend my sincere gratitude to
our shareholders for their continued support of our business operations.
I hereby report on the operating results for Nippon Light Metal Holdings
Company, Ltd. (“NLM Holdings”) for fiscal 2014 (the year from April 1,
2014 to March 31, 2015).
010_0600701372709.indd 2 2015/09/08 14:39:56

3
Overview of Fiscal 2014
During the year under review, the environment in the
domestic aluminum industry saw decrease in shipments
for construction-related fields as a reaction to the surge in
demand ahead of the consumption tax hike. Demand for the
transport industry, especially for ordinary vehicles, remained
stagnant while exports increased due to yen depreciation
and there was strong demand for trucks amid the post-
quake reconstruction. As a result, overall aluminum demand
increased from that of the previous year.
Under these circumstances, the Group has strived to
maximize its consolidated profit in accordance with the
following three basic policies in the Mid-Term Management
Plan (fiscal 2013 to fiscal 2015) and completed the second
year of the Plan in March 2015.
1) Business development through strategies by region and by sector
2) Creation of growth drivers through new products and businesses
3) Strengthening of corporate culture
Fiscal 2014 was marked as the year when the sales volume
in the Alumina, Chemicals and Aluminum Ingot segment,
Aluminum Sheet and Extrusions segment and the truck
outfitting business increased, leading to a sales increase of the
Group. Also in terms of profits, both consolidated operating
profit and consolidated ordinary profit greatly exceeded those
of the previous year due to the increase of sales volume and
also due to the robust performance of affiliates accounted for
by the equity method.
Consequently, consolidated net sales for the year under
review increased 7.1% year on year, to ¥431.5 billion.
Consolidated operating profit and consolidated ordinary profit
increased 53.0% and 61.8% year on year, to ¥19.3 billion
and ¥20.6 billion, respectively. Consolidated net income
increased 88.1% year on year to ¥9.6 billion. The NLM Group
transitioned to a holding company format in October 2012
and fiscal 2014 demonstrates the best performance in the
three years since the transition.
Year-end dividend payment will be ¥5 per share, ¥1 greater
than year-end dividend payments for the previous year.
Overview by Business Segment
Sales in the Alumina, Chemicals and Aluminum Ingot
segment increased 8.4% year on year, to ¥114.3 billion, while
operating profit increased 108.1% year on year, to ¥6.1billion.
This was attributable to increase in both revenue and profit
in the Alumina and Chemicals segment, expanded sales
volume in overseas markets for the secondary alloy business,
the core of the Aluminum Ingot segment, particularly backed
by a strong demand in China, and the rise in sales prices in
conjunction with the rising price of Aluminum Ingots.
Sales in the Aluminum Sheet and Extrusions segment
increased 16.2% year on year, to ¥82.8 billion, while operating
profit increased 58.5% year on year, to ¥4.2 billion. In the
Aluminum Sheet segment, sales of products in electrical
machinery and electronics-related fields, particularly sales
of thick plates for semiconductor and LCD manufacturing
equipment remained robust. In the Aluminum Extrusions
segment, shipments for trucks, automobiles in China and
solar panel racks were strong. The significant rise in profit
is the result of, in addition to the increase in sales volume,
rationalization of the burden of product pricing implemented
in the face of the surge in raw material prices.
Sales in the Fabricated Products and Others segment
increased 4.4% year on year, to ¥138.1 billion, while
operating profit increased 6.6% year on year, to ¥7.7 billion.
This is because demand for trucks remained strong in the
truck outfitting business due to the replacement of vehicles
purchased at the time of tightening of emissions regulations
and increase in logistics volume in line with the economic
recovery in the domestic market, as well as earthquake
recovery demand.
Sales in Aluminum Foil, Powder and Paste segment
increased 2.6% year on year to ¥96.2billion, while
010_0600701372709.indd 3 2015/09/08 14:39:56

4
operating profit increased 44.8% year on year, to ¥4.2
billion. This is a result of cost reduction efforts such as
concentrating production and sales sites to China, greatly
improving profitability, increased sales of fabricated foil for
pharmaceutical packaging and plain foil for lithium ion
battery surfaces increased in the Aluminum Foil segment,
and expanded exports in the Powder and Paste segment,
despite sales in the Solar segment being below the levels of the
previous year.
Key Topics during Fiscal 2014
In July 2014, we took a stake in a local company in Thailand
and started its business as “Fruehauf Mahajak Co., Ltd.,”
which manufactures and sells bodies and other parts
for various kinds of automobiles to capture the business
opportunity in Thailand and neighboring countries where
an uninterrupted series of storage and distribution activities
for fresh agricultural produce and frozen food, so-called cold
chain logistics are expanding. This is the second overseas
production site following the one in China in the truck
outfitting business.
In January 2015, we acquired additional shares of Toyo
Rikagaku Kenkyusho, which we had acquired 23.6% of its
shares in November 2013, to convert it into a subsidiary and
enhance the business in fabrication fields of the Group’s
Aluminum Sheet segment. (Please refer to NLM Group Topics in page 6 for details.)
Outlook for Fiscal 2015
With regard to the Japanese economy for fiscal 2015, a
gradual recovery is expected with rallied corporate earnings
mainly in the exports industry due to the depreciating yen,
as well as steady progress in personal consumption through
improvement in the employment and income situation. As
for the overseas economy, a solid recovery is expected for
the U.S. economy while there are concerns over slowdowns
of economic growth in China and Southeast Asia and the
volatility of raw material and fuel costs. Consequently, a
slight increase in demand for aluminum products is expected
compared to fiscal 2014.
In these circumstances, the next fiscal year is projected to
register net sales of ¥460.0 billion, operating profit of ¥22.5
billion, and ordinary profit of ¥21.0 billion.
Also, we would like to announce herewith, that Takashi
Ishiyama has assumed the position of Chairman of the
Board and Director, and Ichiro Okamoto has succeeded the
position of President and CEO. I would like to ask for the
continuous support of our shareholders in these efforts, just
as we will do everything in our power to further develop the
NLM Group.
June 2015
Chairman of the Board and director
Takashi Ishiyama
President & CEO
Ichiro Okamoto
010_0600701372709.indd 4 2015/09/08 14:39:57
5
In January 2015, Nippon Light Metal Company, Ltd. (hereinafter “NLM”) made an additional acquisition of stocks in Toyo Rikagaku Kenkyusho Co., Ltd. (hereinafter “Toyo Rika”) and turned it into a subsidiary (total investment ratio of 51.6%).
Toyo Rika is a general manufacturer of metal fabrication with integrated production lines handling die design, pressing, welding, assembly, and surface treatment. NLM had acquired 23.6% of the outstanding shares of Toyo Rika in November 2013.
Moving forward, through the integration of Toyo Rika’s management resources in Japan and China and the NLM Group’s business network and management resources in Japan and overseas, NLM will accelerate strategic measures in areas such as the automotive sector and the electric and electronic sectors, creating customer value from a new viewpoint.
—Strengthening cooperation in technology, development, and sales —
NLM Turns Toyo Rikagaku Kenkyusho into Subsidiary
NLM Group Topics
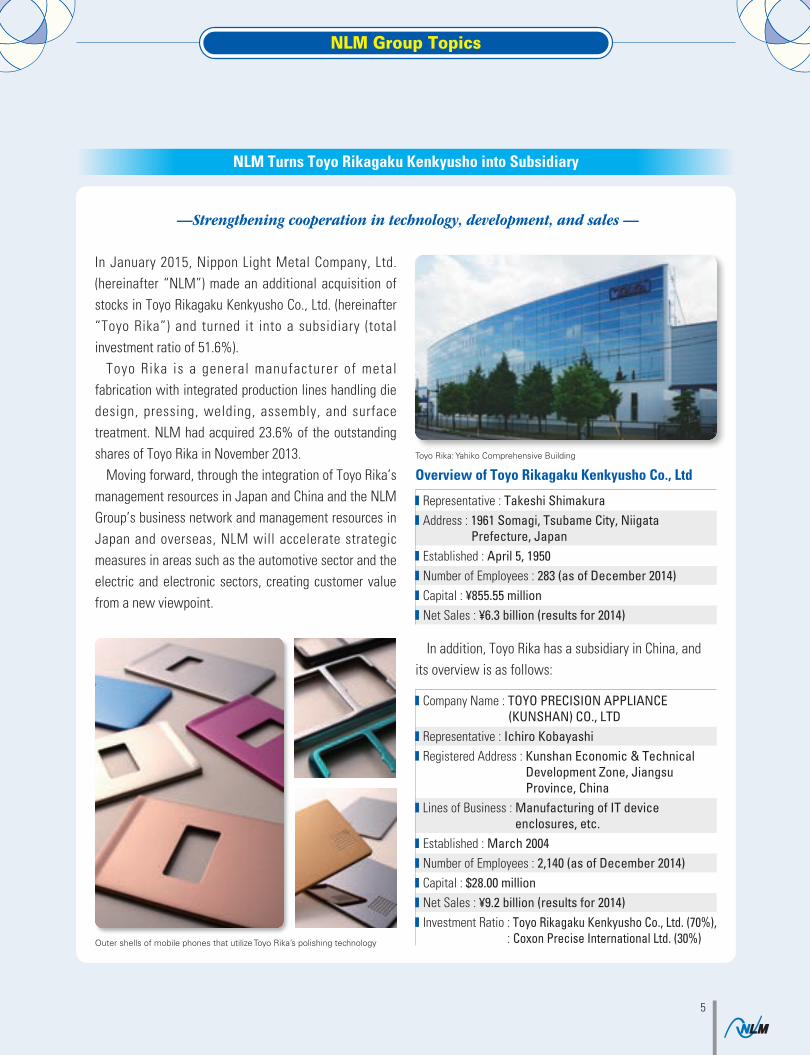
Outer shells of mobile phones that utilize Toyo Rika’s polishing technology
Toyo Rika: Yahiko Comprehensive Building
Overview of Toyo Rikagaku Kenkyusho Co., Ltd
Representative : Takeshi ShimakuraAddress : 1961 Somagi, Tsubame City, Niigata Prefecture, JapanEstablished : April 5, 1950Number of Employees : 283 (as of December 2014)Capital : ¥855.55 millionNet Sales : ¥6.3 billion (results for 2014)
In addition, Toyo Rika has a subsidiary in China, and its overview is as follows:
Company Name : TOYO PRECISION APPLIANCE (KUNSHAN) CO., LTDRepresentative : Ichiro KobayashiRegistered Address : Kunshan Economic & Technical Development Zone, Jiangsu Province, ChinaLines of Business : Manufacturing of IT device enclosures, etc.Established : March 2004Number of Employees : 2,140 (as of December 2014)Capital : $28.00 millionNet Sales : ¥9.2 billion (results for 2014)Investment Ratio : Toyo Rikagaku Kenkyusho Co., Ltd. (70%), : Coxon Precise International Ltd. (30%)
010_0600701372709.indd 5 2015/09/08 14:40:00
6
Special Feature : A Message from the New President and CEO
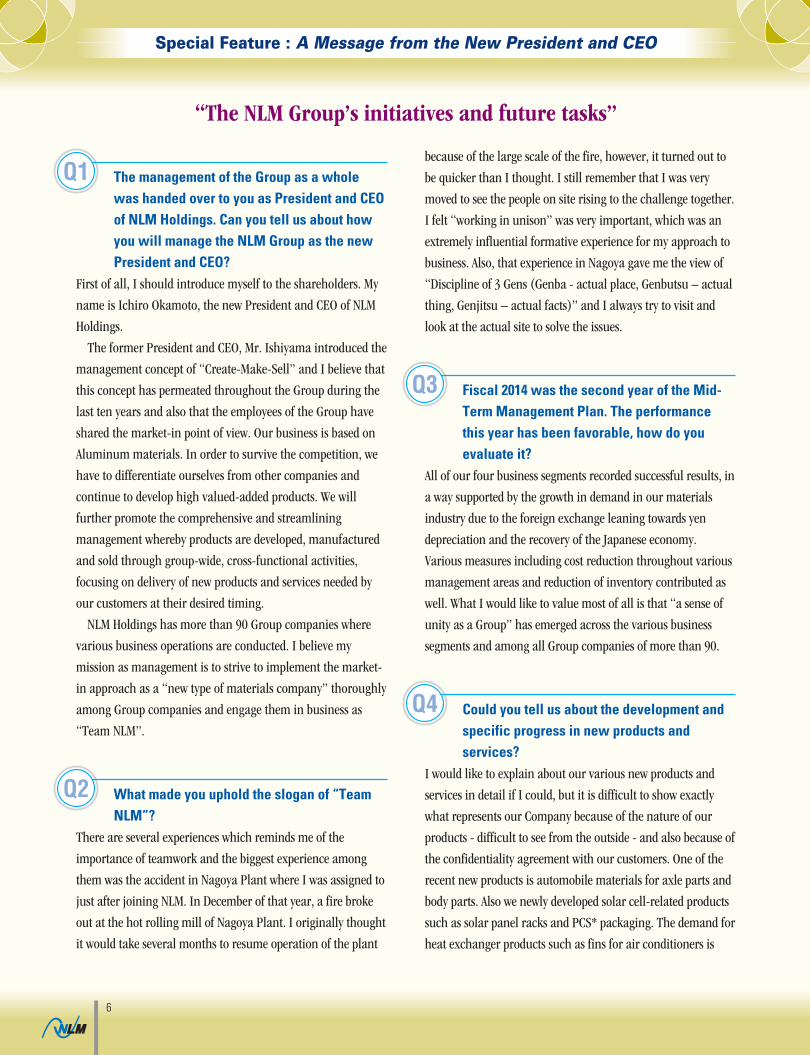
“The NLM Group’s initiatives and future tasks”
The management of the Group as a whole was handed over to you as President and CEO of NLM Holdings. Can you tell us about how you will manage the NLM Group as the new President and CEO?
First of all, I should introduce myself to the shareholders. My
name is Ichiro Okamoto, the new President and CEO of NLM
Holdings.
The former President and CEO, Mr. Ishiyama introduced the
management concept of “Create-Make-Sell” and I believe that
this concept has permeated throughout the Group during the
last ten years and also that the employees of the Group have
shared the market-in point of view. Our business is based on
Aluminum materials. In order to survive the competition, we
have to differentiate ourselves from other companies and
continue to develop high valued-added products. We will
further promote the comprehensive and streamlining
management whereby products are developed, manufactured
and sold through group-wide, cross-functional activities,
focusing on delivery of new products and services needed by
our customers at their desired timing.
NLM Holdings has more than 90 Group companies where
various business operations are conducted. I believe my
mission as management is to strive to implement the market-
in approach as a “new type of materials company” thoroughly
among Group companies and engage them in business as
“Team NLM”.
What made you uphold the slogan of “Team NLM”?
There are several experiences which reminds me of the
importance of teamwork and the biggest experience among
them was the accident in Nagoya Plant where I was assigned to
just after joining NLM. In December of that year, a fire broke
out at the hot rolling mill of Nagoya Plant. I originally thought
it would take several months to resume operation of the plant
because of the large scale of the fire, however, it turned out to
be quicker than I thought. I still remember that I was very
moved to see the people on site rising to the challenge together.
I felt “working in unison” was very important, which was an
extremely influential formative experience for my approach to
business. Also, that experience in Nagoya gave me the view of
“Discipline of 3 Gens (Genba - actual place, Genbutsu – actual
thing, Genjitsu – actual facts)” and I always try to visit and
look at the actual site to solve the issues.
Fiscal 2014 was the second year of the Mid-Term Management Plan. The performance this year has been favorable, how do you evaluate it?
All of our four business segments recorded successful results, in
a way supported by the growth in demand in our materials
industry due to the foreign exchange leaning towards yen
depreciation and the recovery of the Japanese economy.
Various measures including cost reduction throughout various
management areas and reduction of inventory contributed as
well. What I would like to value most of all is that “a sense of
unity as a Group” has emerged across the various business
segments and among all Group companies of more than 90.
Could you tell us about the development and specific progress in new products and services?
I would like to explain about our various new products and
services in detail if I could, but it is difficult to show exactly
what represents our Company because of the nature of our
products - difficult to see from the outside - and also because of
the confidentiality agreement with our customers. One of the
recent new products is automobile materials for axle parts and
body parts. Also we newly developed solar cell-related products
such as solar panel racks and PCS* packaging. The demand for
heat exchanger products such as fins for air conditioners is
Q1
Q3
Q2
Q4
010_0600701372709.indd 6 2015/09/08 14:40:00

7
growing significantly. Take PCs or TVs for example,
contemporary home appliances all generate a great amount of
heat and require cooling devices. Cooling devices are beginning
to be installed in smaller electrical products, boosting our
products as well. *PCS: Power Conditioning System
What does NLM Holdings aim at in the next Mid-Term Management Plan?
First of all, we have to achieve the current Mid-Term
Management Plan with the coming fiscal year, the final year of
the Plan. On top of that, we should integrate more and more
intelligence in our products and make the market for such
products larger to survive as a Japanese manufacturer. The
market-in strategy, which we have been implementing for more
than a decade, aims to develop integrated products with added
value to existing materials. Many new products and new
businesses have been created under this strategy. I would like
draw a plan in the next Mid-Term Management Plan to set up a
system within the Group to create more of such integrated
products. We will discuss what steps shall be taken to realize such
a system thoroughly within the following six months. The next
Mid-Term Management Plan will be released in Spring 2016.
Could you tell us your strategy on overseas business?
The current overseas net sales account for around 20% of total
net sales while the overseas profit has come to exceed 20%.
Since we have made significant investments in overseas
business under the current Mid-Term Management Plan, we
will focus on collecting the fruit, i.e. the profits of existing
investments rather than further expanding investment. After
that stage, we will expand our overseas business where NLM
Group can utilize its strength.
Could you tell us about your view on improvement of shareholder value and profit allocation to shareholders, and measures to increase ROE?
We will be actively committed to improvement of shareholder
value and returns to shareholders. To realize these objectives,
we first of all need to generate a large amount of profit,
enabling sufficient payment of dividends to shareholders.
We have been utilizing Return on Capital Employed (ROCE)
as a key indicator to evaluate the profitability per asset. ROCE
is similar to ROE but includes interest-bearing debt.
We have not decided whether we will position
ROE as a key management indicator, but we will
aim at continuously enhancing corporate value by
promoting selection and concentration in our
business and increasing
capital efficiency.
Q5
Q7
Q6
Ichiro Okamoto President and CEO
•1956 Born in Okayama Prefecture
•1981 Completed the Master’s Course in Metallurgy at Kyoto University Graduate School, and joined Nippon Light Metal Company, Ltd. (“NLM”) in the same year
•2006 Officer of NLM and promoted to Director and Executive Officer in 2009
•2012 Director of the Company (NLM Holdings)
•2013 President and CEO of NLM (to present), and assumed President and CEO of the Company in June 2015
010_0600701372709.indd 7 2015/09/08 14:40:03

Accountingaudit
Audit bystatutoryauditors
Accountingauditor
General Meeting of Shareholders
Board of DirectorsDirectors
Outside directors
President and CEO
Executive Committee
Internalaudit
Auditing Office
Audit reports/ Information exchange
Operations, subsidiaries and affiliates
Executive officers
Board ofStatutoryAuditors
Statutoryauditors
Outsideauditors
Appointment / removal
Appointment / removal
Appointment / removalAppointment / removal
Appointment/ removal
Audit reports Audit reports
Information exchange Information exchange
Reports andproposals
NLM’s CORPORATE GOVERNANCE STRUCTURE
Subcommittees under theExecutive Committee• Compliance Committee• CSR Committee• Quality Committee• Environment Committee, etc.
8
1. Summary of Corporate Governance
NLM considers the development of a corporate governance system one of its most important management priorities, as this system
helps ensure trust in management by stakeholders, including shareholders, business partners, employees and local communities.
NLM has adopted an executive officer system. The Board of Directors consists of 12 directors, of whom two are outside
directors. This system enables agile management and sufficient deliberation by the Board of Directors. To clarify the roles
and responsibilities of directors and executive officers and ensure that their tasks are conducted appropriately, their term of
office is set to be one year. 12 Board of Directors meetings were held in fiscal 2014.
To examine important matters that affect the entire Group from multiple perspectives, NLM has set up an Executive Committee
under the Board of Directors. This committee consists of the president and CEO, senior executives and executive officers and
directors of subsidiaries who concurrently serve as NLM directors. The Executive Committee meets at least twice a month.
NLM has also adopted a statutory auditor system. The Board of Statutory Auditors consists of five statutory auditors, of
whom three are outside auditors. Auditors are independent and play a key role in corporate governance by attending Board
of Directors and other important internal meetings.
Support Systems for Outside Directors and Outside Statutory AuditorsThe Planning Department and the Legal Department, which jointly serve as the secretariat for the Board of Directors,
circulate preparatory handouts to directors and auditors. The secretariat also elaborates on issues of particular importance
prior to meetings.
The Auditors Office provides staff to assist the auditors.
Corporate Governance and Internal Control Systems
010_0600701372709.indd 8 2015/09/08 14:40:03

9
2.
Accounting AuditsIn fiscal 2013, Ernst & Young ShinNihon LLC conducted accounting audits based on the Companies Act and the Financial
Instruments and Exchange Act of Japan.
Summary of Implementation of Internal Control Systems
To fulfill its corporate governance obligations, NLM takes as another management priority the development of internal
control systems for all NLM Group employees. Such systems affect all of NLM’s business processes, ensuring risk
management, compliance with laws and ordinances and ongoing work efficiency.
At a meeting on March 14, 2008, the Board of Directors resolved to partially amend the basic policy on the
implementation of the Internal Control Systems, in order to achieve the Company’s goals stipulated in the Group
management policy. We will continue to move forward with the implementation of the systems, while revising the policy as
necessary.
Establishment of the Compliance Code and the Internal Whistle-Blower SystemIn July 2004, NLM established the Compliance Committee, chaired by the president and CEO, to clarify its corporate social
responsibility and to implement effective internal compliance systems. On April 1, 2006, NLM also established the Group
Compliance Code, which is posted on the Group Intranet. At the same time, a leaflet containing this code was distributed to
all members of Group companies. Concurrently, an internal whistle-blower system was created.
NLM considers important the creation of an atmosphere that fosters the frank exchange of opinions among officers and
employees about workplace compliance and encourages its top-of-mind significance. Each year, NLM holds more than 900
compliance meetings that are attended by employees.
Establishment of Group Risk Management RegulationsAs part of its risk management system, in May 2006 NLM established the Group Risk Management Regulations. These
regulations specify departmental responsibilities and risk management guidelines, segmented by risk significance into 1)
product and service defects, 2) environmental problems, 3) disasters (natural and accidental) and 4) information system
problems.
Establishment of Regulations Concerning the Preservation and Management of Documents Containing Important DecisionsIn accordance with corporate regulations, NLM appropriately stores and manages information on the execution of
duties by directors, which is disclosed to statutory auditors upon request. On May 29, 2006, NLM established the
Regulations Concerning the Preservation and Management of Documents Containing Important Decisions. These
regulations establish criteria for the storage and management of documents at each NLM Group company, including
those concerning Executive Committee decisions, committee minutes and departmental decisions, such as approval
applications, data and addenda.
010_0600701372709.indd 9 2015/09/08 14:40:04

NIPPON LIGHT METAL HOLDINGS
Environment Office EnvironmentalCommittee
President & CEO
Subsidiaries SitesTwenty fourth companies
Exective Committee
2020Target
20132012201120102005Base Line
12
12.8
2014
12.714.0
17.720.1
21.8
PJ
2020Target
20132012201120102005Base Line
k to
n-C
O2
972
695
2014
748745779871
1,143 Down 15%
310
438
2,053
SCOPE 1
SCOPE 2
SCOPE 3
break downCategory
1 1,995
2 10
3 31
4 11
5 5
6 0
7 1
(k ton-CO2)
10
Nippon Light Metal Group fully recognizes the influence the operation of our business has on the environment.
To reduce that burden, the Group implements a "Plan, Do, Check, Action" environmental management system.
Environmental Management System
The Environment Committee is responsible for discussing and
determining environmental management policies. The
committee consists of executive officers and division managers
from Nippon Light Metal Holdings and the presidents of
affiliated companies.
Energy Consumption
Environmental Audit
The Environment Office conduct regular environmental
audits for all sites in addition to ISO14001. The audit process
consists of double procedures: documentation review and
on-site inspection which is implemented with a period of once
every three years. In 2014, Waste Management and Public
Cleansing Act were focused on. These results are
communicated to the Director in charge and the Auditors.
Material Balance
FY2014 energy consumption were similar to the previous year
INPUT FY2014 FY2013 FY2012
Electricity (PJ) 7.5 7.8 8.2Fuel (PJ) 5.2 5.0 5.8
Change in Greenhouse Gas Emissions
SCOPE 3
OUTPUT FY2014 FY2013 FY2012
Greenhouse Gas (kton-CO2) 748 695 745SOx (ton) 370 379 372NOx (ton) 480 396 380Discharged Water (Mm3) 26.3 27.9 29.0COD (ton) 93 110 101Disposed-landfill- (kton) 2.0 2.2 3.5
Recycled/ Reduced (kton) 40.7 34.3 28.6
NLM Group Environmental Activities
010_0600701372709.indd 10 2015/09/08 14:40:04
11
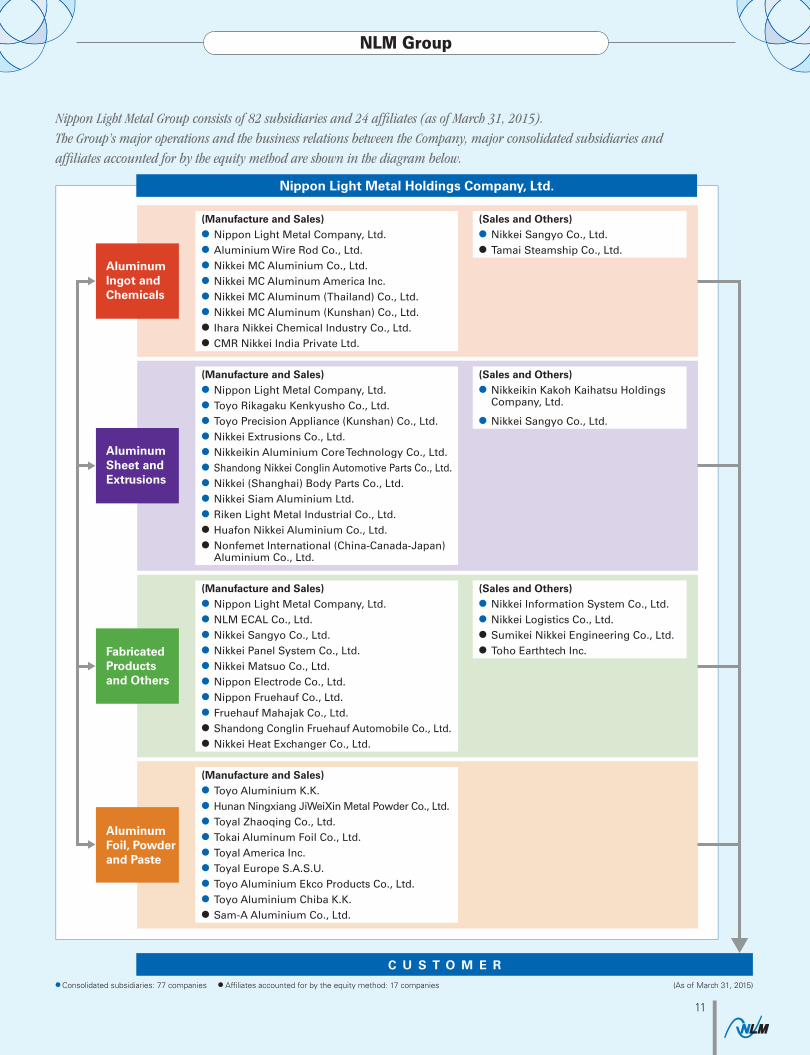
NLM Group
(Manufacture and Sales)● Nippon Light Metal Company, Ltd.● Aluminium Wire Rod Co., Ltd.● Nikkei MC Aluminium Co., Ltd.● Nikkei MC Aluminum America Inc.● Nikkei MC Aluminum (Thailand) Co., Ltd.● Nikkei MC Aluminum (Kunshan) Co., Ltd.● Ihara Nikkei Chemical Industry Co., Ltd.● CMR Nikkei India Private Ltd.
(Manufacture and Sales)● Nippon Light Metal Company, Ltd.● Toyo Rikagaku Kenkyusho Co., Ltd.● Toyo Precision Appliance (Kunshan) Co., Ltd.● Nikkei Extrusions Co., Ltd.● Nikkeikin Aluminium Core Technology Co., Ltd.● Shandong Nikkei Conglin Automotive Parts Co., Ltd.● Nikkei (Shanghai) Body Parts Co., Ltd.● Nikkei Siam Aluminium Ltd.● Riken Light Metal Industrial Co., Ltd.● Huafon Nikkei Aluminium Co., Ltd.● Nonfemet International (China-Canada-Japan) Aluminium Co., Ltd.
(Manufacture and Sales)● Nippon Light Metal Company, Ltd.● NLM ECAL Co., Ltd.● Nikkei Sangyo Co., Ltd.● Nikkei Panel System Co., Ltd.● Nikkei Matsuo Co., Ltd.● Nippon Electrode Co., Ltd.● Nippon Fruehauf Co., Ltd.● Fruehauf Mahajak Co., Ltd.● Shandong Conglin Fruehauf Automobile Co., Ltd.● Nikkei Heat Exchanger Co., Ltd.
(Manufacture and Sales)● Toyo Aluminium K.K.● Hunan Ningxiang JiWeiXin Metal Powder Co., Ltd.● Toyal Zhaoqing Co., Ltd.● Tokai Aluminum Foil Co., Ltd.● Toyal America Inc.● Toyal Europe S.A.S.U.● Toyo Aluminium Ekco Products Co., Ltd.● Toyo Aluminium Chiba K.K.● Sam-A Aluminium Co., Ltd.
(Sales and Others)● Nikkei Sangyo Co., Ltd.● Tamai Steamship Co., Ltd.
(Sales and Others)● Nikkeikin Kakoh Kaihatsu Holdings
Company, Ltd.
● Nikkei Sangyo Co., Ltd.
(Sales and Others)● Nikkei Information System Co., Ltd.● Nikkei Logistics Co., Ltd.● Sumikei Nikkei Engineering Co., Ltd.● Toho Earthtech Inc.
AluminumIngot andChemicals
Nippon Light Metal Holdings Company, Ltd.
C U S T O M E R
AluminumSheet andExtrusions
FabricatedProductsand Others
AluminumFoil, Powderand Paste
Nippon Light Metal Group consists of 82 subsidiaries and 24 affiliates (as of March 31, 2015). The Group’s major operations and the business relations between the Company, major consolidated subsidiaries and affiliates accounted for by the equity method are shown in the diagram below.
● Consolidated subsidiaries: 77 companies ● Affiliates accounted for by the equity method: 17 companies (As of March 31, 2015)
010_0600701372709.indd 11 2015/09/08 14:40:04

(Millionsof Yen)
’15’15 ’14’14 ’13’13
(Millionsof Yen)
Consolidated Operating ProfitNet Sales
150,000
120,000
90,000
60,000
30,000
0
7,500
6,000
4,500
3,000
1,500
0
Principal Products
• Aluminum
• Aluminum hydroxide
• Chemicals (chemical products)
• Caustic soda
• Chlorinated chemical products
• Aluminum ingot
• Aluminum alloys
114,339Millions of Yen
ConsolidatedNet Sales
ConsolidatedNet Sales
26.5%
12
Profile Alumina and Chemicals segment produce aluminum hydroxide, alumina and chemicals
used in various fields. These products are used as raw materials for flame retardants, ceramics and
other products and as industrial materials in paper and pulp manufacturing. Aluminum Ingot seg-
ment manufacture various kinds of aluminum alloys and enjoy an excellent
reputation for the development of high-performance alloys in response to
customer requirements.
● Overview of results for fiscal 2014
In the Alumina and Chemicals segment, with regard to the mainstay
alumina and aluminum hydroxide products among alumina-
related products, shipments of coagulants, refractory materials and
shipments in electrical machinery and electronics-related fields
remained robust for both domestic market and exports. In terms
of chemicals, sales of organic chlorine products were on par with
the levels of the previous year, however, shipments of caustic soda
products and inorganic chlorine products were strong, causing sales
for the segment overall to exceed the levels of the previous year.
In terms of profits, an increase in sales volume and efforts on
reductions in fixed costs resulted in improving profits compared with
the previous year, however, due to a rise of raw material costs caused
by yen depreciation, the situation remained severe.
In the Aluminum Ingot segment, although shipments of the
mainstay secondary alloy products for automotive applications
decreased in Japan, sales volume grew in overseas market thanks
to the strong demand in the Chinese market. Additionally, sales
prices rose mostly in tandem with raw material prices which serve
as its benchmark, resulting in an increase in sales compared to the
previous year and a significant increase in profits as well.
As a result, Alumina, Chemicals and Aluminum Ingot segment
sales increased 8.4%, or ¥8,851 million year on year, to ¥114,339
million (¥105,488 million for the previous year), and operating profit
increased 108.1%, or ¥3,152 million year on year, to ¥6,069 million
(¥2,917 million for the previous year).
Review of Operations
Aluminum Ingot and Chemicals
Aluminum Billet
010_0600701372709.indd 12 2015/09/08 14:40:05

Applications
• Automobile
• Transport
• Electronics
• Industrial
• Building materials and infrastructure materials
Principal Products
• Automobile suspension parts • Lead-free cut aluminum alloy
• Quick freezing coagulated powder extruded materials
• High-intensity molded aluminum sheet
• Large structural materials for railway rolling stock
• Flap for trucks
• Thick plate for semiconductor and LCD manufacturingequipment • Foil stock • Photosensitive drum materials
• Printing roll • Industrial materials
• Aluminum honeycomb panel • Scaffolding
• Building materials
Consolidated Operating ProfitNet Sales
100,000
75,000
50,000
25,000
0
(Millionsof Yen)
(Millionsof Yen)
’13’14’13 ’14 ’15’15
6,000
4,500
3,000
1,500
0
ConsolidatedNet Sales
82,823Millions of Yen
ConsolidatedNet Sales
ConsolidatedNet Sales
19.2%
13
Profile The NLM Group’s aluminum sheet and extrusions are used in a wide range
of market sectors, for instance for automotive parts and railway cars in the transport industry
and for semiconductor and liquid crystal manufacturing equipment and photosensitive
drums in the electrical machinery and electronics industries. The Group applies technologies
and expertise accumulated over many years to actively develop products that meet user
needs and provides customers with high-performance sheets and extrusions.
● Overview of results for fiscal 2014
In the Aluminum Sheet segment, although shipments of foil stock
slumped, sales of thick plates for semiconductor, LCD manufacturing
equipment and railway increased significantly. Also, shipments of
construction materials, transport-related, mainly for truck outfitting,
battery cases in electrical machinery and electronics-related fields
and PC cases remained robust. As a result, sales volume exceeded
those of the previous year. Sales prices elevated in conjunction with
the price of Aluminum Ingots, which is an indicator in terms of price.
Converting Toyo Rikagaku Kenkyusho Co., Ltd. to a subsidiary in
January 2015 also contributed to increase in sales, leading to sales
levels well above those of the previous year.
In terms of profits, expanded sales improved product mix resulted
in an increase in profits compared with the previous year.
In the Aluminum Extrusions segment, with regard to the transport-
related products, which form the mainstay of the segment, sales
for automobile in domestic market and railway cars decreased
while shipments of van and truck outfitting increased and sales
for automobile in China recorded solid growth. The effect of the
consumption tax hike was partly seen in building materials-related
shipments while sales contracts for solar panel racks expanded
following the previous year and sales for electrical machinery and
electronics-related fields and industrial equipment-related fields
recorded an increase as well, enabling sales of the overall segment to
exceed the levels of the previous year.
In terms of profits, rising raw material prices were a burden, but
rationalization of prices, in addition to increase in sales volume, lead
to improvement compared with the previous year.
As a result, Aluminum Sheet and Extrusion segment sales increased
16.2%, or ¥115,49 million, to ¥82,823 million (¥71,274 million
for the previous year). Operating profit increased 58.5%, or ¥1,562
million, to ¥4,230 million (¥2,668 million for the previous year).
As mentioned above, in January 2015, Nippon Light Metal Company,
Ltd. (“NLM”), a subsidiary of the Company, additionally acquired
28.0% of the outstanding shares of Tokyo Rikagaku Kenkyusho Co.,
Ltd. of which it had acquired a 23.6% stake in November 2013, and
converted it to a subsidiary. We have been striving to enhance the
business in fabrication fields through the combination of NLM’s
knowledge in raw materials and the fabrication technologies of Toyo
Rikagaku Kenkyusho Co., Ltd. Converting it to a subsidiary enables us
to deploy domestic and overseas network and management resources
of the two companies in an integrated manner and to generate
further synergy.
Review of Operations
Aluminum Sheet and Extrusions
010_0600701372709.indd 13 2015/09/08 14:40:05

Consolidated Operating ProfitNet Sales Applications
• Automobile
• Transport
• Electronics
• Building materials
and infrastructure
materials
• Food and lifestyle
8,000
6,000
4,000
2,000
0
Principal Products
• Cast and forged parts for automobiles
• Heat exchangers for automobiles
• Van truck bodies and trailers
• Anodized foil for electrolytic capacitors
• Clean rooms
• Landscape engineering products
• Solid truss structural materials (Aluminum truss)
• Plant package for communication base stations
• Panels for commercial refrigerators and freezers
160,000
120,000
80,000
40,000
0
(Millionsof Yen)
(Millionsof Yen)
’13’13 ’14’14 ’15’15
138,088Millions of Yen
ConsolidatedNet Sales
ConsolidatedNet Sales
32.0%
14
Profile The NLM Group includes several companies that handle distinctive fabricated products.
In particular, Nippon Fruehauf’s truck bodies and Nikkei Panel
System’s commercial refrigerators and freezer panels enjoy an
excellent reputation for quality, and are market share leaders in their respective fields.
In addition, the Group provides familiar aluminum fabricated products, including anodized
aluminum foil for aluminum electrolytic capacitors, automotive parts, and carbon products.
● Overview of results for fiscal 2014
In the Transport-Related segment, sales in the truck outfitting
business exceeded the previous year with high levels of demand for
trucks following the previous year, thanks to the replacement of
vehicles purchased at the time of tightening of emissions regulations
and earthquake recovery demand, as well as increase of logistics
backed by the economic recovery in the domestic market.
In July 2014, Fruehauf Mahajak Co., Ltd., which manufactures
and sells bodies for various types of automobiles and heat insulating
panels, was established in Thailand as a joint venture with a
local company. Increase in logistics is expected in Thailand and
neighboring countries such as a rise in demand of frozen food, etc.
By contributing to the expansion of the cold chain, we will strive for
further business development.
In the area of capacitors for car air conditioners, sales of the mainstay
mini vehicles products were strong thanks to strong sales of mini vehicles
in Japan, leading to sales levels exceeding those of the previous year.
The Shaped Parts segment saw a drop in demand year on year
resulting from a decrease in the number of automobile units
manufactured in Japan. However, sales were on par with the levels of
the previous year as a result of marketing efforts of new products.
In the Electronic Materials segment, although there was a
temporary decrease in demand for anodized aluminum foil for
aluminum electrolytic capacitors in the latter half of the year due
to adjustments in inventory, demand in the first half of the year
increased both in the fields of industrial equipment and consumer
equipment, and increase was seen in sales contracts with improved
price competitiveness among customers backed by yen depreciation,
enabling sales to exceed levels of the previous year.
In the Panel System segment, with regard to shipments of industrial
refrigerators and freezers, small systems for stores such as convenience
stores were strong following the previous year while shipments of large
systems for plants that process food products and low temperature
distribution warehouses decreased due to the consumption tax hike.
With regard to clean rooms, demand declined, particularly in the
semiconductors and precision equipment fields. As a result, overall
segment sales were below the levels of the previous year.
In the Carbon Product segment, shipments for unshaped materials
for electrodes greatly declined while shipments of carbon blocks
and cathodes for blast furnaces and electric furnaces for steel and
aluminum smelters, the sector’s major products, increased thanks
to yen depreciation which boosted exports, leading to sales levels
exceeding those of the previous year.
As a result, sales in the Fabricated Products and Others segment
increased 4.4%, or ¥5,827 million, to ¥138,088 million (¥132,261
million for the previous year). Operating profit increased 6.6%, or ¥480
million, to ¥7,224 million (¥7,704 million for the previous year).
Review of Operations
Fabricated Products and Others
010_0600701372709.indd 14 2015/09/08 14:40:07

Consolidated Operating ProfitNet Sales
4,500
3,000
1,500
0
-1,500
Applications
• Food and lifestyle
• Electronics
• Automobile
• Environmental / Energy
Principal Products
• Aluminum foil
• Aluminum foil for electrolytic capacitors
• Powder and paste
• Back sheets for solar cells
• Electrode ink for solar cells
120,000
90,000
60,000
30,000
0
(Millionsof Yen)
(Millionsof Yen)
’13’13 ’14’14 ’15’15
96,227Millions of Yen
ConsolidatedNet Sales
ConsolidatedNet Sales
22.3%
15
Profile The core company in this segment is Toyo Aluminium K.K. The company has estab-
lished its position as the leading manufacturer by using the features of aluminum to develop a
wide range of products beneficial to society, industry and daily life, including packaging for
food and pharmaceutical products, electronics, aluminum pastes, and materials for solar cells.
Expanding into new fields based on our own technology, we are marketing various kinds and
types of materials and products of high functionality in both domestic and overseas markets.
● Overview of results for fiscal 2014
In the Aluminum Foil segment, shipments of high-purity aluminum
foil for electrolytic capacitors showed a gradual recovery in the
domestic market although sales of new products remained sluggish
and exports decreased. Demand of standard foil remained stagnant
particularly for the food products field, however, shipments of
fabricated foil for pharmaceutical packaging and plain foil for
lithium ion battery surfaces were solid, causing sales for the segment
overall to exceed the levels of the previous year.
In the Powder and Paste segment, shipments of mainstay
aluminum paste for use in automobile paint declined in domestic
market and shipments for inks used for beverage containers also
decreased, while shipments of powder-related products were strong
and imports increased as well thanks to yen depreciation, resulting in
an increase in sales compared to the previous year.
In the Solar segment, shipments of back sheets for solar cells
remained sluggish in the first half of the year due to deteriorating
credit among users in China, however, shipments in the second
half increased significantly since development of new customers
progressed and the credit issue in China was gradually resolved.
However, shipments of functional ink for solar cells remained
stagnant throughout the year, and price of both products dropped
due to intensifying competition, leading to sales levels of the overall
segment to become significantly below the previous year. On the other
hand, in terms of profits, situation improved significantly as a result
of efforts in cost reduction such as raising local supply rate of raw
materials under the new structure where production and sales sites
were concentrated to China.
As a result, sales in the Aluminum Foil, Powder and Paste segment
increased 2.6%, or ¥2,421 million, to ¥96,227 million (¥93,806
million for the previous year). Operating profit increased 44.8%, or
¥1,294 million, to ¥4,183 million (¥2,889 million for the previous
year).
Review of Operations
Aluminum Foil
Aluminum Foil, Powder and Paste
010_0600701372709.indd 15 2015/09/08 14:40:07

Nippon Light Metal Company, Ltd.
Nippon Light Metal Holdings Company, Ltd.
Millions of yen Years ended March 31
Gross Profit and Gross Profit Margin
Gross ProfitGross Profit Margin
100,000
60,000
80,000
40,000
20,000
20 %
12
16
8
4
0 02014 20152010 2011 2012 2013
Nippon Light Metal Company, Ltd.
Nippon Light Metal Holdings Company, Ltd.
2010 2011 2012 2013
Millions of yen Years ended March 31
Interest-bearing Debt
240,000
160,000
200,000
120,000
80,000
40,000
2014 20150
Nippon Light Metal Company, Ltd.
Nippon Light Metal Holdings Company, Ltd.
Millions of yen Years ended March 31
Free Cash Flows
2010 2011 2012 2013 2014 2015
30,000
20,000
25,000
15,000
10,000
-5,000
5,000
0
Nippon Light Metal Company, Ltd.
2010 2011
(Millions of yen)
Financial ResultsNet Sales ................................................................................................. ¥460,681 ¥429,433Gross Profit ............................................................................................ 81,885 78,166Gross Profit Margin (%) ........................................................................ 17.8 18.2Operating Profit (Loss) .......................................................................... 7,673 24,724Ordinary Profit (Loss) ........................................................................... 2,682 18,529Net Income (Loss) .................................................................................. 2,084 11,040
Segment InformationNet Sales:
Aluminum Ingot and Chemicals ..................................................... 88,141 107,397Aluminum Sheet and Extrusions..................................................... 58,399 69,458Fabricated Products and Others ...................................................... 106,060 136,095Building Materials ............................................................................ 115,680 —Aluminum foil, powder and paste ................................................... 92,401 116,483Total .................................................................................................. 460,681 429,433
Operating Profit (Loss):Aluminum Ingot and Chemicals ..................................................... 3,425 6,783Aluminum Sheet and Extrusions..................................................... (362) 4,604Fabricated Products and Others ...................................................... 3,849 5,738Building Materials ............................................................................ (1,776) —Aluminum foil, powder and paste ................................................... 5,140 10,245Elimination or corporate items ....................................................... (2,603) (2,646)Total .................................................................................................. 7,673) 24,724
Financial PositionCurrent Assets......................................................................................... 258,839 221,956Property, plant and equipment ............................................................. 165,612 143,767Intangible assets .................................................................................... 5,147 4,458Investments and other assets ................................................................ 51,424 44,704Current liabilities .................................................................................. 249,184 182,703Long-term liabilities .............................................................................. 138,714 127,425Shareholders’ equity (Note 3) ............................................................... 87,245 98,272Total accumulated other comprehensive income (Note 3) ................. 1,507 463Minority interests in consolidated Subsidiaries (Note 3) ..................... 4,372 6,022Interest-bearing Debt (Note 2) .............................................................. 221,720 190,760
Cash FlowsCash Flows from Operating Activities .................................................... 26,388 26,479
Depreciation and Amortization ....................................................... 20,717 15,831Cash Flows from Investing Activities ..................................................... (15,792) 964
Capital Expenditures ........................................................................ 14,197 15,363Cash Flows from Financing Activities ................................................... (8,880) (30,726)
Per Share Data (yen and dollars)Net Income (Loss) - basic ...................................................................... ¥ 3.83 ¥ 20.29 - diluted .................................................................... 3.63 —Net Assets (Note 3) ................................................................................. 163.13 181.51Cash Dividends ....................................................................................... — 2.00
IndicesReturn on Capital Employed (ROCE)(%) .................................................... 2.2 7.9Return on Equity (ROE)(%).................................................................. 2.4 11.8Equity Ratio (%) .................................................................................... 18.5 23.8
OthersNumber of Shares Outstanding (thousands) .................................................. 545,126 545,126R&D Expenditures ................................................................................. 5,085 4,798Number of Employees ............................................................................ 12,854 9,739
Note 1: U.S. dollar amounts have been translated, for convenience only, at the exchange rate of ¥120.17 = U.S.$1.00. See Note 2 of the Notes to the Consolidated Financial Statements.
Note 2: Interest-bearing Debt = Long-term debt and Short-term borrowings, excluding capital lease obligations + Notes discounted + Notes endorsed
Note 3: Numbers used for the year ended March 2010 have been revised according to the current segment categories.
16
Consolidated Six-Year SummaryNippon Light Metal Holdings Company, Ltd. and its consolidated subsidiaries Years ended March 31
010_0600701372709.indd 16 2015/09/08 14:40:08

Nippon Light Metal Company, Ltd.
Nippon Light Metal Holdings Company, Ltd.
% Years ended March 31
Return on Equity (ROE)
20152010 2011 2012 2013 2014
12
6
8
10
0
4
2
Nippon Light Metal Company, Ltd.
Nippon Light Metal Holdings Company, Ltd.
Millions of yen Years ended March 31
R&D Expenditures
2010 2011 2012 2013 201520140
6,000
5,000
4,000
3,000
2,000
1,000
0
17
Nippon Light Metal Holdings Company, Ltd.
2012 2013 2014 2015 2015
(Millions of yen)
(Thousands ofU.S. dollars)
(Note 1)
¥403,009 ¥371,887 ¥402,829 ¥431,477 $3,590,555 67,559 62,715 69,003 76,987 640,651
16.8 16.9 17.1 17.8 17.813,665 8,154 12,617 19,305 160,648
9,709 6,873 12,730 20,600 171,4242,856 3,355 5,128 9,645 80,261
99,560 93,902 105,488 114,339 951,47770,618 63,161 71,274 82,823 689,215
127,972 126,218 132,261 138,088 1,149,105— — — — —
104,859 88,606 93,806 96,227 800,758403,009 371,887 402,829 431,477 3,590,555
5,227 3,273 2,917 6,069 50,5031,569 1,675 2,668 4,230 35,2006,392 6,974 7,224 7,704 64,109
— — — — —3,402 (771) 2,889 4,183 34,849
(2,925) (2,997) (3,081) (2,881) (23,975)13,665 8,154 12,617 19,305 160,648
225,200 217,648 226,807 248,906 2,071,282149,919 153,238 150,901 153,235 1,275,152
6,601 6,338 5,022 4,543 37,80540,951 42,562 49,808 50,593 421,012
192,070 182,173 181,520 202,220 1,682,783121,752 122,989 129,824 117,672 979,213100,033 102,297 105,787 111,791 930,274
434 2,851 4,629 9,631 80,1448,382 9,476 10,778 15,963 132,837
187,697 188,844 198,668 188,990 1,572,689
19,537 18,030 18,148 11,780 98,02817,040 16,259 16,435 16,406 136,523
(18,289) (14,025) (18,998) (7,119) (59,241)23,167 17,121 14,001 15,869 132,055(6,915) (5,175) 5,762 (17,581) (146,301)
¥ 5.25 ¥ 6.17 ¥ 9.43 ¥ 17.74 $ 0.15 — — — 15.59 0.13
184.71 193.33 203.03 223.27 1.862.00 3.00 4.00 5.00 0.04
4.9 3.7 5.8 8.2 0002.9 3.3 4.8 8.3 000
23.8 25.0 25.5 26.6 000
545,126 545,126 545,126 545,126 0004,902 5,063 4,984 4,495 $ 37,405
10,041 10,392 10,438 13,335 000
Nippon Light Metal Company, Ltd.
Nippon Light Metal Holdings Company, Ltd.
% Years ended March 31
Return on Capital Employed (ROCE)
9
3
6
-3
-62010 2011 2012 2013 2014 2015
0
011_0600701372709.indd 17 2015/09/08 14:58:25

18
OverviewThe Japanese economy during fiscal 2014 (the year ended March 31, 2015) experienced a moderate recovery trend. Chief factors were a pickup in corporate earnings particularly among exporters, and in capital investment as well as an improvement in employment and income environment, which were attributable to economic stability in addition to persistent yen depreciation.
Overall domestic demand for aluminum products rose year on year. This was attributable to increase in exports owing to yen depreciation, and demand for trucks in connection with the reconstruction demand following the Great East Japan Earthquake, although shipments of aluminum for construction materials fell in a correction following the last-minute demand prior to the consumption tax hike, and sluggish growth in demand from exporters of standard-class automobiles.
Given these circumstances, the Group took measures to maximize consolidated earnings in line with the three basic policies under the new Mid-Term Management Plan (from fiscal 2013 to fiscal 2015), which is now into its second year. The three basic policies are as set out below.
1. Business development through strategies by region and by sector2. Creation of growth drivers through new products and businesses3. Strengthening of corporate cultureSpecific measures included an additional acquisition of shares in
Toyo Rikagaku Kenkyusho Co. Ltd., for which the Company took a stake in during the previous year, converting it into a subsidiary. The aim of this move was to strengthen processing operations which serves as a basis for development of the Group’s aluminum sheet businesses.
Furthermore, the development in Thailand and surrounding countries of cold chain, a transportation network of frozen and refrigerated food products, prompted us to take a stake in a local company and launch manufacture and sales businesses for a range of automotive body parts and for heat insulation panels.
In addition, the Group is taking proactive measures to step up the earnings capabilities of overseas businesses, including a decision to upgrade production facilities at local joint ventures to meet increasing demand for aluminum products for subway cars of which development is under way in China.
With regard to business results for the fiscal year ended March 31, 2015, both revenue and profit increased as indicated below. This was due to an increase in sales volumes for products and businesses such as the Alumina, Chemicals and Aluminum Ingot segment, the Aluminum Sheet and Extrusions segment, and the truck outfitting business. On the profit front, positive factors included a steady performance of equity method affiliates, and upward momentum in the aluminum ingot market prices which serve as a benchmark for sales prices.
Note: Numbers used for the year ended March 2010 have been revised according to the current segment categories. Numbers used for the year ended March 2010 do not include numbers form the Building Materials segment.
Nippon Light Metal Company, Ltd.
Nippon Light Metal Holdings Company, Ltd.
Nippon Light Metal Company, Ltd.
Nippon Light Metal Holdings Company, Ltd.
Nippon Light Metal Company, Ltd.
Nippon Light Metal Holdings Company, Ltd.
Aluminum Ingot and ChemicalsAluminum Sheet and ExtrusionsFabricated Products and OthersAluminum Foil, Powder and Paste
Billions of yen Years ended March 31
Net Sales By Segment
Billions of yen As of March 31 % As of March 31
Total Net Assets Equity Ratio
2011 2012 2013 2011 20112012 20122013 20132014 2014 20142015 2015 20150
30
24
18
12
6
0
500
400
300
200
100
0
150
90
120
60
30
Financial Review
011_0600701372709.indd 18 2015/09/08 14:58:25

19
Overview of Consolidated Business Performance (Millions of yen)
Fiscal yearunder review
The year endedMarch 31, 2015
Fiscal yearunder review
The year endedMarch 31, 2014
Changes in Comparison
(Decrease in brackets)Changes
[Percent changes]
Net sales 431,477 402,829 28,648 [7.1%]
Operating profit 19,305 12,617 6,688 [53.0%]
Ordinary profit 20,600 12,730 7,870 [61.8%]
Net income 9,645 5,128 4,517 [88.1%]
Net income per share (Yen) 17.74 9.43 8.31 [88.1%]
Earnings and ExpensesNLM Holdings’ consolidated net sales for the fiscal year under review increased 7.1% year on year to ¥431.5 billion ($3,591 million). For sales and other financial performance by business segment, please see the Review of Operations on pages xx to xx.
The cost of sales was ¥354.5 billion ($2,950 million), and the cost of sales ratio was 82.2%. Selling, general and administrative expenses were ¥57.7 billion ($480 million). As a result, operating profit increased 53.0% year on year to ¥19.3 billion ($161 million).
Non-operating income totaled ¥6.7 billion ($56 million) during the year under review. Equity in earnings of affiliates increased 33.2% year on year to ¥2.1 billion ($17 million) and dividend income rose 31.3% year on year to ¥1.0 billion ($8.2 million). Non-operating expenses were ¥5.4 billion ($44.8 million). As a result, ordinary profit rose 61.8% year on year to ¥20.6 billion ($171.4 million).
Special gains totaled ¥3.9 billion ($32 million), reflecting recording of a gain on refund of investment securities due to capital reduction in the amount of ¥1.8 billion ($15.3 million) due to a partial refund of the invested capital in the completed overseas smelter project. Special losses were ¥8.3 billion ($69 million). This was due partly to loss on impairment of fixed assets of ¥6.2 billion ($52 million) in the alumina business of the Alumina and Chemicals segment.
As a result, income before income taxes and minority interests during the period under review was ¥16.2 billion ($135 million). Corporate, inhabitant and business taxes amounted to ¥4.2 billion ($35 million) and deferred income taxes during the fiscal year under review were ¥1 billion ($9 million). Income before minority interests was ¥11.0 billion ($91 million).
As a result of the above, net income in the fiscal year under review increased 88.1% year on year to ¥9.6 billion ($80 million). The average number of shares outstanding fell from 543,865 thousand in the previous year to 543,835 thousand. Accordingly, net income per share rose from ¥9.4 in the previous year to ¥17.7 ($0.15). The annual cash dividend per share increased by ¥1.0 year on year to ¥5.0 ($0.04), by resolution at the General Meeting of Shareholders held on June 24, 2015.
Overview of Consolidated Balance Sheets (Millions of yen)
March 31, 2015 March 31, 2014Changes in comparison
Total assets 457,277 432,538 24,739
Total liabilities 319,892 311,344 8,548
Net assets 137,385 121,194 16,191
Equity ratio (%) 26.6 25.5 1.1
Assets, Liabilities and Shareholders’ EquityTotal assets as of March 31, 2015 increased ¥24.7 billion year on year to ¥457.2 billion ($3,805 million). Total liabilities increased ¥8.5 billion year on year to ¥319.9 billion ($2,662 million). Interest-bearing debt decreased ¥9.7 billion year on year to ¥189.0 billion.
Total net assets increased ¥16.2 billion year on year to ¥137.4 billion ($1,143 million), thanks primarily to an increase in retained earnings due to the recording of net income in the fiscal year under review. Net assets per share increased ¥20.24 year on year to ¥223.27 ($1.86), while the equity ratio rose 1.1 percentage point year on year to 26.6%.
Cash FlowsCash and cash equivalents on a consolidated basis as of March 31, 2015 fell ¥12.2 billion to ¥29.4 billion ($245 million).
Net cash provided by operating activities totaled ¥11.8 billion ($98 million). This was primarily due to recording net income before income taxes and minority interests, and depreciation and amortization. Net cash used in investing activities was ¥7.1 billion ($59 million). The main outflows were payments for purchases of fixed assets. Net cash used in financing activities totaled ¥17.6 billion ($146 million). The main outflows were ¥26.8 billion ($223 million) in repayments of long-term debt.
Outlook for Fiscal 2015With regard to the Japanese economy for fiscal 2015, a moderate recovery is expected to continue, supported by recovery in corporate earnings centered on export sectors, which is led by the depreciation trend of the yen, and by an upturn in personal consumption due to improvement in the employment and income environment. However, with regard to overseas, concerns remain such as slower economic growth in China and South East Asia and significant volatility in crude oil and other fuel prices, despite prospects of solid recovery in the U.S. economy.
In light of the above, we forecast a slight increase in demand for aluminum products.
Our forecasts for the year ending March 31, 2016 are net sales of ¥460.0 billion, operating profit of ¥22.5 billion, ordinary profit of ¥21.0 billion, and net income attributable to the parent or its shareholders of ¥13.0 billion. We expect net income per share to total ¥23.90 and dividend per share of ¥5.0.
011_0600701372709.indd 19 2015/09/08 14:58:25

20
March 31,2014 2015 2015
Assets (Millions of yen)(Thousands of
U.S. dollars) (Note 3)
Current assets:
Cash and deposits (Notes 4 and 7) ¥ 41,654 ¥ 29,823 $ 248,173
Notes and accounts receivable – trade (Note 7) 119,503 133,976 1,114,887
Finished products 21,501 27,865 231,880
Work-in-progress, including costs related to construction-type contracts 14,756 16,979 141,292
Raw material and supplies 15,469 22,808 189,798
Deferred tax assets (Note 10) 4,507 5,008 41,674
Other current assets 10,505 13,465 112,049
Allowance for doubtful accounts (1,088) (1,018) (8,471)
Total current assets 226,807 248,906 2,071,282
Property, plant and equipment (Note 6):
Land 54,698 54,997 457,660
Buildings and structures 127,607 131,397 1,093,426
Machinery and equipment 259,352 272,900 2,270,949
Tools, furniture and fixtures 29,219 31,451 261,721
Construction-in-progress 4,096 5,158 42,923
Accumulated depreciation (324,071) (342,668) (2,851,527)
Total property, plant and equipment 150,901 153,235 1,275,152
Intangible assets:
Goodwill 1,262 1,006 8,371
Other intangible assets (Note 6) 3,760 3,537 29,434
Total intangible assets 5,022 4,543 37,805
Investments and other assets:
Investment securities (Notes 5, 6 and 7) 34,460 36,899 307,057
Deferred tax assets (Note 10) 10,602 9,146 76,109
Other assets 5,222 5,035 41,899
Allowance for doubtful accounts (476) (487) (4,053)
Total investments and other assets 49,808 50,593 421,012
Total assets ¥ 432,538 ¥ 457,277 $3,805,251
Nippon Light Metal Holdings Company, Ltd. and consolidated subsidiaries
Consolidated Balance Sheets
011_0600701372709.indd 20 2015/09/08 14:58:25

21
March 31,2014 2015 2015
Liabilities and net assets (Millions of yen)(Thousands of
U.S. dollars) (Note 3)
Current liabilities:Short-term borrowings (Notes 6 and 7) ¥ 62,217 ¥ 70,108 $ 583,407Current portion of long-term debt (Notes 6 and 7) 29,434 26,562 221,037Notes and accounts payable – trade (Note 7) 63,279 69,060 574,686Income taxes payable 2,287 2,392 19,905Other current liabilities 24,303 34,098 283,748
Total current liabilities 181,520 202,220 1,682,783
Long-term liabilities:Long-term debt (Notes 6 and 7) 110,968 95,924 798,236Liabilities for retirement benefits (Note 9) 17,130 18,797 156,420Deferred tax liabilities on land revaluation surplus (Notes 10 and 12) 452 410 3,412Other long-term liabilities (Notes 6, 7 and 10) 1,274 2,541 21,145
Total long-term liabilities 129,824 117,672 979,213Total liabilities 311,344 319,892 2,661,996
Net assets:Shareholders’ equity:
Common stock:Authorized: 2,000,000,000 shares Issued: 545,126,049 shares 39,085 39,085 325,248
Additional paid-in capital 11,179 11,179 93,027Retained earnings 55,633 61,639 512,932Treasury stock, at cost (1,285,818 shares in 2014 and1,295,748 shares in 2015) (110) (112) (933)
Total shareholders’ equity 105,787 111,791 930,274Accumulated other comprehensive income:
Net unrealized gains on securities (Note 5) 2,399 3,493 29,067Net unrealized losses on hedges (Note 13) (10) (25) (209)Revaluation surplus (Note 12) 145 145 1,207Foreign currency translation adjustments 2,978 6,198 51,577Remeasurements of defined benefits plans (883) (180) (1,498)
Total accumulated other comprehensive income 4,629 9,631 80,144Minority interests in consolidated subsidiaries 10,778 15,963 132,837
Total net assets 121,194 137,385 1,143,255Contingent liabilities (Note 15) Total liabilities and net assets ¥432,538 ¥457,277 $3,805,251
The accompanying notes are an integral part of these financial statements.
011_0600701372709.indd 21 2015/09/08 14:58:25

22
March 31,2014 2015 2015
(Millions of yen)(Thousands of
U.S. dollars) (Note 3)
Net sales ¥402,829 ¥431,477 $3,590,555Cost of sales (Note 14) 333,826 354,490 2,949,904
Gross profit 69,003 76,987 640,651Selling, general and administrative expenses (Note 14) 56,386 57,682 480,003
Operating profit 12,617 19,305 160,648Non-operating income:
Interest income 72 83 691Dividend income 753 989 8,230Equity in earnings of affiliates 1,574 2,097 17,450Foreign exchange gains 691 1,045 8,696Rental income 628 666 5,542Other 1,285 1,795 14,937
Total non-operating income 5,003 6,675 55,546Non-operating expenses:
Interest expense 2,725 2,382 19,822Rental expense 436 539 4,485Other 1,729 2,459 20,463
Total non-operating expenses 4,890 5,380 44,770Ordinary profit 12,730 20,600 171,424
Special gains:Gain on refund of investment securities due to capital reduction — 1,845 15,353Gain on sales of fixed assets (Note 14) — 1,397 11,625Gain on negative goodwill — 604 5,026
Total special gains — 3,846 32,004Special losses:
Loss on impairment of fixed assets (Note 16) — 6,201 51,602Cost of corrective measures for products — 920 7,656Environmental expenses 744 573 4,768Loss on step acquisitions — 569 4,735Loss on closing plant (Note 16) 996 — —Loss on disposal of fixed assets (Note 17) 612 — —
Total special losses 2,352 8,263 68,761Income before income taxes and minority interests 10,378 16,183 134,667
Income taxes (Note 10):Current 3,484 4,161 34,626Deferred 406 1,049 8,729
3,890 5,210 43,355Income before minority interests 6,488 10,973 91,312
Minority interests in net income of consolidated subsidiaries 1,360 1,328 11,051Net income ¥ 5,128 ¥ 9,645 $ 80,261
Per share of common stock (Note 18):(Yen) (U.S. dollars)
(Note 3)
Net asset ¥ 203.03 ¥ 223.27 $ 1.86 Net income 9.43 17.74 0.15Cash dividends 4.00 5.00 0.04
The accompanying notes are an integral part of these financial statements.
Nippon Light Metal Holdings Company, Ltd. and consolidated subsidiaries
Consolidated Statements of Income
011_0600701372709.indd 22 2015/09/08 14:58:25

23
March 31,2014 2015 2015
(Millions of yen)(Thousands of
U.S. dollars) (Note 3)
Income before minority interests ¥6,488 ¥10,973 $ 91,312
Other comprehensive income
Net unrealized gains on securities 876 1,104 9,187
Net unrealized gains (losses) on hedges 13 (15) (125)
Foreign currency translation adjustments 1,223 2,317 19,281
Remeasurements of defined benefit plans — 761 6,333
Equity of other comprehensive income of affiliates 892 1,524 12,682
Total other comprehensive income (Note 8) 3,004 5,691 47,358
Comprehensive income ¥9,492 ¥16,664 $ 138,670
Attributable to:
Shareholders of the parent ¥7,789 ¥14,647 $ 121,886
Minority interests 1,703 2,017 16,784
¥9,492 ¥16,664 $ 138,670
The accompanying notes are an integral part of these financial statements.
Nippon Light Metal Holdings Company, Ltd. and consolidated subsidiaries
Consolidated Statements of Comprehensive Income
011_0600701372709.indd 23 2015/09/08 14:58:25

24
2014Shareholders’ equity Accumulated other comprehensive income
Common stock
Additional paid-in capital
Retained earnings
Treasury stock,at cost
Net unrealized gains on securities
Net unrealized gains on hedges
Revaluation surplus
(Note 12)
Foreign currency
translation adjustments
Remeasurements of defined
benefits plans
Minority interests in
consolidatedsubsidiaries
Total net assets
(Millions of yen)Balance at April 1, 2013 ¥39,085 ¥11,179 ¥52,137 ¥(104) ¥1,504 ¥(23) ¥145 ¥1,225 ¥ — ¥ 8,382 ¥108,849
Cumulative effects of changes in accounting policies
Restated balance at the beginning of the year 39,085 11,179 52,137 (104) 1,504 (23) 145 1,225 — 9,476 114,624Net income 5,128 5,128Cash dividends (1,632) (1,632)Change in retained earnings due to mergers between
consolidated and non-consolidated subsidiaries Net increase in treasury stock (6) (6)Net unrealized gains on securities (Note 5) 895 895Net unrealized gains on hedges 13 13Foreign currency translation adjustments 1,753 1,753Remeasurements of defined benefits plans (883) (883)Net increase in minority interests in
consolidated subsidiaries 1,302 1,302
Balance at March 31, 2014 ¥39,085 ¥11,179 ¥55,633 ¥(110) ¥2,399 ¥(10) ¥145 ¥2,978 ¥ (883) ¥ 10,778 ¥121,194
2015Shareholders’ equity Accumulated other comprehensive income
Common stock
Additional paid-in capital
Retained earnings
Treasury stock,at cost
Net unrealized gains on securities
Net unrealized gains on hedges
Revaluation surplus
(Note 12)
Foreign currency
translation adjustments
Remeasurements of defined
benefits plans
Minority interests in
consolidatedsubsidiaries
Total net assets
(Millions of yen)Balance at April 1, 2014 ¥ 39,085 ¥ 11,179 ¥ 55,633 ¥ (110) ¥ 2,399 ¥ (10) ¥ 145 ¥ 2,978 ¥ (883) ¥ 10,778 ¥ 121,194
Cumulative effects of changes in accounting policies (1,557) (1,557)
Restated balance at the beginning of the year 39,085 11,179 54,076 (110) 2,399 (10) 145 2,978 (883) 10,778 119,637Net income 9,645 9,645Cash dividends (2,176) (2,176)Change in retained earnings due to mergers between
consolidated and non-consolidated subsidiaries 94 94
Net increase in treasury stock (2) (2)Net unrealized gains on securities (Note 5) 1,094 1,094Net unrealized gains on hedges (15) (15)Foreign currency translation adjustments 3,220 3,220Remeasurements of defined benefits plans 703 703Net increase in minority interests in
consolidated subsidiaries 5,185 5,185
Balance at March 31, 2015 ¥ 39,085 ¥ 11,179 ¥ 61,639 ¥ (112) ¥ 3,493 ¥ (25) ¥ 145 ¥ 6,198 ¥ (180) ¥ 15,963 ¥ 137,385
2015Shareholders’ equity Accumulated other comprehensive income
Common stock
Additional paid-in capital
Retained earnings
Treasury stock,at cost
Net unrealized gains on securities
Net unrealized gains on hedges
Revaluation surplus
(Note 12)
Foreign currency
translation adjustments
Remeasurements of defined
benefits plans
Minority interests in
consolidatedsubsidiaries
Totalnet assets
(Thousands of U.S. dollars) (Note 3)Balance at April 1, 2014 $ 325,248 $ 93,027 $ 462,954 $ (915) $ 19,963 $ (83) $ 1,207 $ 24,782 $ (7,348) $ 89,690 $ 1,008,525
Cumulative effects of changes in accounting policies (12,957) (12,957)
Restated balance at the beginning of the year 325,248 93,027 449,997 (915) 19,963 (83) 1,207 24,782 (7,348) 89,690 995,568Net income 80,261 80,261Cash dividends (18,108) (18,108)Change in retained earnings due to mergers between
consolidated and non-consolidated subsidiaries 782 782
Net increase in treasury stock (18) (18)Net unrealized gains on securities (Note 5) 9,104 9,104Net unrealized gains on hedges (126) (126)Foreign currency translation adjustments 26,795 26,795Remeasurements of defined benefits plans 5,850 5,850Net increase in minority interests in
consolidated subsidiaries 43,147 43,147
Balance at March 31, 2015 $ 325,248 $ 93,027 $ 512,932 $ (933) $ 29,067 $ (209) $ 1,207 $ 51,577 $ (1,498) $ 132,837 $1,143,255
The accompanying notes are an integral part of these financial statements.
Nippon Light Metal Holdings Company, Ltd. and consolidated subsidiaries
Consolidated Statements Of Changes In Net Assets
011_0600701372709.indd 24 2015/09/08 14:58:26

25
March 31,2014 2015 2015
(Millions of yen)
(Thousands of U.S. dollars)
(Note 3)
Cash flows from operating activitiesIncome before income taxes and minority interests ¥ 10,378 ¥ 16,183 $ 134,667Depreciation and amortization 16,435 16,406 136,523Loss on impairment of fixed assets — 6,201 51,602Cost of corrective measures for products — 920 7,656Environmental expenses 744 573 4,768Loss on step acquisitions — 569 4,735Loss on closing plant 996 — —Loss on disposal of fixed assets 612 — —Gain on refund investment securities due to capital reduction — (1,845) (15,353)Gain on sales of fixed assets — (1,397) (11,625)Gain on negative goodwill — (604) (5,026)Increase in allowance for doubtful accounts (169) (43) (358)Decrease in liability for retirement benefit (744) (185) (1,539)Interest and dividend income (825) (1,072) (8,921)Interest expense 2,725 2,382 19,822Equity in earnings of affiliates (1,574) (2,097) (17,450)Increase in notes and accounts receivable – trade (4,264) (10,412) (86,644)(Increase) decrease in inventories 3,571 (12,811) (106,607)Increase (decrease) in notes and accounts payable – trade (132) 846 7,040Other (4,587) 4,310 35,865
Subtotal 23,166 17,924 149,155Interest and dividend income received 1,037 1,602 13,331Interest paid (2,733) (2,462) (20,488)Income taxes paid (3,322) (5,284) (43,970)
Net cash provided by operating activities 18,148 11,780 98,028Cash flows from investing activities
Payments into time deposits (51) (380) (3,162)Proceeds from withdrawal of time deposits 59 414 3,445Payments for purchases of fixed assets (13,972) (13,062) (108,696)Proceeds from sales of fixed assets 138 2,077 17,284Payments for purchases of investment securities (4,558) (916) (7,623)Proceeds from refund of investment securities due to capital reduction — 3,686 30,673Proceeds from acquisition of shares of subsidiaries resulting into change
in scope of consolidation — 1,190 9,903
Payments of loans receivable (224) (272) (2,263)Collection of loans receivable 31 16 133Other (421) 128 1,065
Net cash used in investing activities (18,998) (7,119) (59,241)Cash flows from financing activities
Net increase (decrease) in short-term borrowings (3,063) 4,896 40,742Proceeds from long-term debt 21,435 10,236 85,179Repayments of long-term debt (23,984) (26,774) (222,801)Proceeds from issuance of bonds 15,000 — —Redemption of bonds (173) (2,000) (16,643)Cash dividends paid (1,622) (2,165) (18,016)Cash dividends paid to minority interests (460) (555) (4,618)Other (1,371) (1,219) (10,144)
Net cash provided by (used in) financing activities 5,762 (17,581) (146,301)Effect of exchange rate changes on cash and cash equivalents 723 744 6,191Net increase (decrease) in cash and cash equivalents 5,635 (12,176) (101,323)Cash and cash equivalents at beginning of the year 35,962 41,597 346,151Increase in cash and cash equivalents resulting from merger with
unconsolidated subsidiaries — 12 100
Cash and cash equivalents at end of the year (Note 4) ¥ 41,597 ¥ 29,433 $ 244,928The accompanying notes are an integral part of these financial statements.
Nippon Light Metal Holdings Company, Ltd. and consolidated subsidiaries
Consolidated Statements of Cash Flows
011_0600701372709.indd 25 2015/09/08 14:58:26

26
1. SIGNIFICANT ACCOUNTING POLICIES(a) Basis of presentation
The accompanying consolidated financial statements of Nippon Light Metal Holdings Company, Ltd. (the “Company”) and its consolidated subsidiaries are prepared on the basis of accounting principles generally accepted in Japan, which are different in certain respects as to the application and disclosure requirements of International Financial Reporting Standards, and are compiled from the consolidated financial statements prepared by the Company as required by the Financial Instruments and Exchange Law of Japan. The notes to the consolidated financial statements include certain financial information which is not required under accounting principles generally accepted in Japan, but is presented herein as additional information. The accompanying consolidated financial statements include certain reclassifications for the purpose of presenting them in a form familiar to readers outside Japan.
(b) Principles of consolidation and accounting for investments in affiliatesThe accompanying consolidated financial statements include the accounts of the Company and, with minor exceptions, companies substantially controlled by the Company. All significant intercompany transactions and accounts have been eliminated in consolidation. Investments in equity securities issued by unconsolidated subsidiaries and affiliates are accounted for by the equity method, except that investments in certain unconsolidated subsidiaries and affiliates are stated at cost because the effect of application of the equity method would be immaterial. The difference between the cost and the underlying net assets of investments in consolidated subsidiaries or affiliates accounted for by the equity method has been allocated to identifiable assets based on fair value at the respective dates of acquisition. Any unassigned residual amount is recognized as goodwill and amortized by the straight-line method over an estimated useful life, with the exception of minor amounts which are charged to income in the year of acquisition.
(c) Translation of foreign currenciesAll monetary assets and liabilities denominated in foreign currencies, whether long-term or short-term, are translated into Japanese yen at the exchange rates prevailing at the balance sheet date. The resulting gains and losses are included in net loss for the year. Assets and liabilities of foreign subsidiaries and affiliates are translated into Japanese yen at the exchange rates prevailing at the balance sheet date. Income statement accounts for the year are translated into Japanese yen using the average exchange rates during the year. The resulting translation adjustments are accounted for as foreign currency translation adjustments, except for the minority interest portion which is allocated to minority interests in consolidated subsidiaries.
(d) Cash and cash equivalents
Cash and cash equivalents in the consolidated statements of cash flows comprise of cash in hand, bank deposits available for withdrawal on demand and short-term investments with an original maturity of three months or less and which are exposed to a minor risk of fluctuation in value.
(e) Inventories
Inventories are principally stated at cost, determined by the moving average method, except that the specific identification method is applied to costs related to construction-type contracts. In addition, the amount of Balance Sheet is calculated by write-down method based on descent of profitability.
(f) Investment securitiesSecurities other than equity securities issued by subsidiaries and affiliates are classified into held-to-maturity securities or available-for-sale securities. Held-to-maturity securities are stated at amortized cost. Available-for-sale securities for which market quotations are available are stated at fair value with net unrealized gains or losses being included in net assets, net of the related taxes. Available-for-sale securities for which market quotations are not available are stated at cost. Realized gains and losses on sales are determined using the average cost method and are included in net income for the year. In cases where the fair value of held-to-maturity securities or available-for-sale securities has declined significantly and such impairment is other than temporary, such securities are written down to fair value and the resulting losses are charged to income for the year.
Nippon Light Metal Holdings Company, Ltd. and consolidated subsidiaries
Notes to Consolidated Financial Statements
011_0600701372709.indd 26 2015/09/08 14:58:26

27
(g) Allowance for doubtful accountsAllowance for doubtful accounts is estimated by applying the average percentage of actual bad debts in the past to the balance of receivables. In addition, an amount deemed necessary to cover non-collectible receivables is provided on an individual account basis.
(h) Property, plant and equipment and depreciation
Property, plant and equipment are stated at cost. Depreciation is computed principally using the straight-line method at rates based on the estimated useful lives of the respective assets, ranging from 2 years to 60 years for buildings and structures, and from 2 years to 22 years for machinery and equipment.
(i) Intangible assets
Intangible assets are amortized by the straight-line method over their respective estimated useful lives. Expenditure relating to computer software developed for internal use is charged to income as incurred, except in cases where it contributes to the generation of income or future cost savings. In these cases, it is capitalized and amortized using the straight-line method over its estimated useful life, which is no longer than 5 years.
(j) Retirement benefits1) The retirement benefit obligation for employees is attributed to each period by the straight-line method over the estimated years of service
of the eligible employees.2) Prior service cost is being amortized as incurred mainly by the straight-line method over the period of 15 years which is shorter than the
average remaining number of years of service of the employees. Unrecognized actuarial gain or loss is amortized by the declining-balance method over a period of 12 years from the year following that in which it arises, except for unrecognized costs with respect to employees who retired under the early retirement program which were fully amortized at the time of the employees’ retirement.
(k) Lease transactions
Finance leases without options to transfer ownership of the leased assets to the lessee are accounted for as ordinary sale and purchase transactions. These leased assets are depreciated to their respective salvage value of zero using the straight-line method over a period of leasing term. Finance leases with options to transfer ownership of the leased assets to the lessee are depreciated by the same method applied to the fixed assets owned by the Company.
(l) Income taxesThe income taxes of the Company and its domestic consolidated subsidiaries consist of corporate income taxes, local inhabitants’ taxes and enterprise taxes. The Company and its wholly-owned domestic subsidiaries use the Japanese consolidated taxation system. The Company and its consolidated subsidiaries apply the deferred tax accounting method. Deferred tax assets and liabilities are determined using the asset and liability approach, and recognized for temporary differences between the tax bases of assets and liabilities and those as reported in the consolidated financial statements.
(m) DerivativesAll derivatives are stated at fair value with changes in fair value being included in net income for the year in which they arise, except for derivatives designated as hedging instruments. The Company and its consolidated subsidiaries use derivatives to reduce their exposure to fluctuation in foreign exchange rates, interest rates, and the prices of aluminum ingot in the market. Derivatives designated as hedging instruments are principally forward foreign exchange contracts, interest rate swap contracts and aluminum ingot forward contracts. The underlying hedged items are trade accounts receivable and payable, long-term bank loans and sales or purchases of aluminum ingot. Gains and losses arising from changes in fair value of derivatives designated as hedging instruments are deferred and included in net income in the same period in which the corresponding gains and losses on the underlying hedged items or transactions are recognized. The Company and its consolidated subsidiaries use interest rate swaps to hedge their interest rate risk exposure. The related interest differentials paid or received under the interest rate swap agreements are recognized in interest expense over the term of the agreements. The Company and its consolidated subsidiaries evaluate the effectiveness of their hedging activities by reference to the accumulated gains or losses on the hedging instruments and the underlying hedged items from the commencement of the hedges.
(n) Research and development costsResearch and development costs are charged to income as incurred.
011_0600701372709.indd 27 2015/09/08 14:58:26

28
(o) Appropriation of retained earningsAppropriation of retained earnings is reflected in the consolidated financial statements for the year in which the appropriation is approved at an ordinary general meeting of shareholders. The Company’s retained earnings consist of unappropriated retained earnings and a legal reserve as required by the Corporation Law of Japan. The Corporation Law provides that an amount equal to 10% of distributions from unappropriated retained earnings paid by the Company and its Japanese subsidiaries be appropriated to the legal reserve. Such appropriations are no longer required when the total amount of additional paid-in capital and the legal reserve equals 25% of their respective stated capital. Under the Corporation Law, the Company is permitted to transfer to unappropriated retained earnings the portion of its statutory reserve (additional paid-in capital and the legal reserve) in excess of 25% of common stock upon approval at a shareholders’ meeting. Any such transferred portion is available for dividend distribution.
(p) Net income per shareBasic net income per share of common stock, presented in the accompanying consolidated statements of income, is computed based on the weighted average number of shares outstanding during each year. Diluted net income per share reflects the potential dilution that could occur if securities were converted into common stock. Diluted net income per share of common stock assumes full conversion of the outstanding convertible bonds at the time of issuance with an applicable adjustment for the related interest expense on a net of tax basis.
(q) ReclassificationsCertain reclassifications of previously reported amounts have been made to conform them to the current year’s classifications.
2. ACCOUNTING CHANGEThe Company and its domestic subsidiaries adopted Section 35 of “Accounting Standard for Retirement Benefits” (ASBJ Statement No. 26 of May 17, 2012) and the main clause of Section 67 of “Guidance on Accounting Standard for Retirement Benefits” (ASBJ Guidance No. 25 of March 26, 2015) effective from April 1, 2014. As a result, the methods for calculating the retirement benefit obligation and service cost have been revised in the following respects: the method for attributing projected benefits to each period has been changed from the straight-line method to the benefit formula method, and the method for determining the discount rate has been changed to use a single weighted-average discount rate reflecting the expected timing and amount of benefit payments. The cumulative effect of changing the method for calculating the retirement benefit obligation and service cost was recognized by adjusting retained earnings at April 1, 2014, in accordance with the transitional treatment provided in Paragraph 37 of Accounting Standard for Retirement Benefits. As a result, the liability for retirement benefits increased by ¥2,320 million ($19,305 thousand) and retained earnings decreased by ¥1,557 million ($12,957 thousand) at April 1, 2014.
3. U.S. DOLLAR AMOUNTSThe rate of ¥120.17 = U.S.$1, the approximate exchange rate prevailing at March 31, 2015, has been used for the purpose of presenting the U.S. dollar amounts in the accompanying consolidated financial statements. These amounts are included solely for the convenience of the reader. Accordingly, they should not be construed as representations that yen amounts actually represent, or have been or could be readily converted, realized or settled in U.S. dollars at that rate.
4. CASH AND CASH EQUIVALENTSA reconciliation of cash and cash equivalents in the accompanying consolidated statements of cash flows to cash and deposits disclosed in the accompanying consolidated balance sheets at March 31, 2014 and 2015 is summarized as follows:
2014 2015 2015
(Millions of yen)(Thousands of U.S. dollars)
Cash and deposits ¥41,654 ¥29,823 $248,173
Time deposits with maturities in excess of 3 months (57) (390) (3,245)
Cash and cash equivalents ¥41,597 ¥29,433 $244,928
Notes to Consolidated Financial Statements
011_0600701372709.indd 28 2015/09/08 14:58:26

29
5. INVESTMENT SECURITIES(a) Available-for-sale securities with available market quotationsThe aggregate cost, carrying amount and gross unrealized gains and losses of available-for-sale securities comprising equity securities with available market quotations at March 31, 2014 and 2015 was as follows:
2014 2015 2015
(Millions of yen)(Thousands of U.S. dollars)
Cost ¥2,823 ¥2,895 $24,091
Unrealized gains 3,413 4,723 39,303
Unrealized losses (83) (19) (158)
Carrying amount ¥6,153 ¥7,599 $63,236
(b) Sales of available-for-sale securitiesThe realized gains on sales of available-for-sale securities for the years ended March 31, 2014 and 2015 was as follows:
2014 2015 2015
(Millions of yen)(Thousands of U.S. dollars)
Sales proceeds ¥45 ¥109 $907
Realized gains on sales 35 87 724
Realized losses on sales 5 — —
6. SHORT-TERM BORROWINGS AND LONG-TERM DEBTShort-term borrowings at March 31, 2015 bore interest at annual rates ranging from 0.00% to 7.20% and mainly consisted of bank loans and short-term notes maturing at various dates within one year. Long-term debt at March 31, 2014 and 2015 comprised the following:
2014 2015 2015
(Millions of yen)(Thousands of U.S. dollars)
Loans, principally from banks and insurance companies due from 2016 to 2072 with interest rates ranging from 0.32% to 6.90%:
Secured ¥ 8,691 ¥ 6,521 $ 54,265
Unsecured 106,942 93,440 777,564
Convertible bonds due December 10, 2018 (*1) 15,000 15,000 124,823
Unsecured 2.70% bonds due March 29, 2072, redeemable before due date 3,200 3,200 26,629
Unsecured 1.03% bonds due September 30, 2014, redeemable before due date 2,000 — —
Unsecured 1.50% bonds due June 1, 2017, redeemable before due date 618 721 6,000
Capital lease obligations due from 2015 to 2029 with interest rates ranging from 1.17% to 7.20% 3,951 3,604 29,992
140,402 122,486 1,019,273Less: portion due within one year (29,434) (26,562) (221,037)
Total long-term debt ¥ 110,968 ¥ 95,924 $ 798,236
(*1) The details of the convertible bonds due December 10, 2018 are summarized as follows:Stock type to be issued: Common stockIssue price per stock acquisition right: NoneInitial exercise price: ¥200 per shareTotal issue price: ¥15,000 millionExercisable period of stock acquisition rights: From December 23, 2013 to November 26, 2018
011_0600701372709.indd 29 2015/09/08 14:58:26
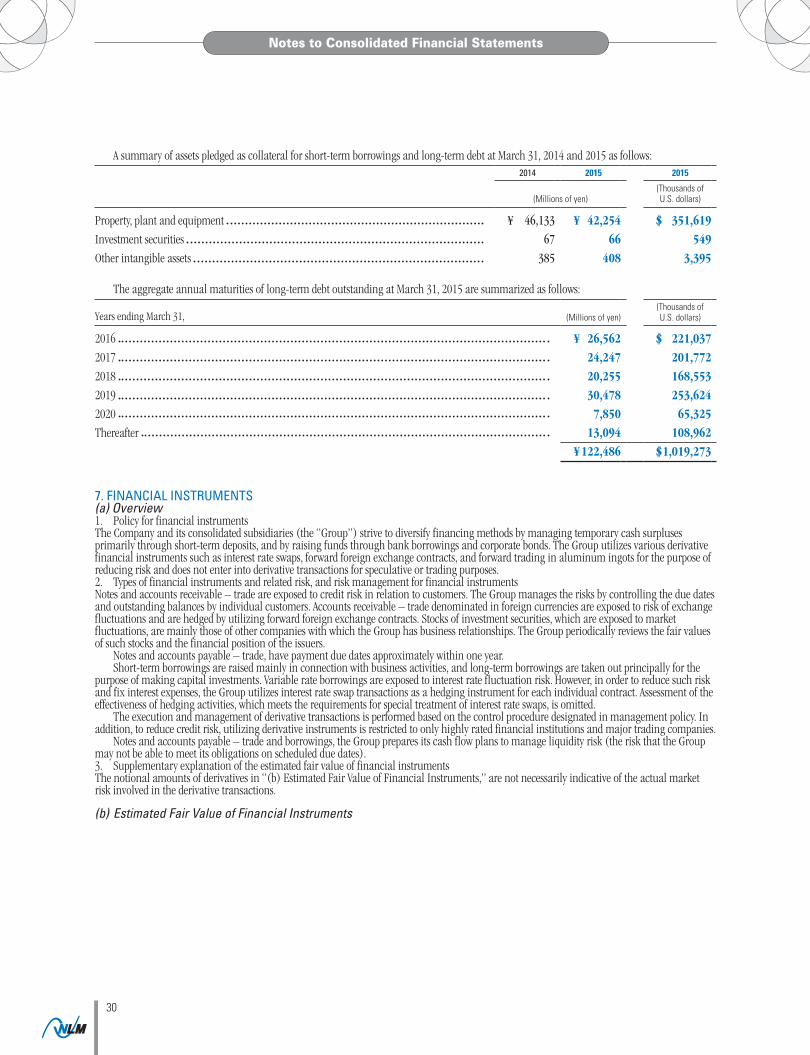
30
A summary of assets pledged as collateral for short-term borrowings and long-term debt at March 31, 2014 and 2015 as follows:2014 2015 2015
(Millions of yen)(Thousands of U.S. dollars)
Property, plant and equipment ¥ 46,133 ¥ 42,254 $ 351,619
Investment securities 67 66 549
Other intangible assets 385 408 3,395
The aggregate annual maturities of long-term debt outstanding at March 31, 2015 are summarized as follows:
Years ending March 31, (Millions of yen)(Thousands of U.S. dollars)
2016 ¥ 26,562 $ 221,037
2017 24,247 201,772
2018 20,255 168,553
2019 30,478 253,624
2020 7,850 65,325
Thereafter 13,094 108,962
¥ 122,486 $ 1,019,273
7. FINANCIAL INSTRUMENTS(a) Overview1. Policy for financial instrumentsThe Company and its consolidated subsidiaries (the “Group”) strive to diversify financing methods by managing temporary cash surpluses primarily through short-term deposits, and by raising funds through bank borrowings and corporate bonds. The Group utilizes various derivative financial instruments such as interest rate swaps, forward foreign exchange contracts, and forward trading in aluminum ingots for the purpose of reducing risk and does not enter into derivative transactions for speculative or trading purposes.2. Types of financial instruments and related risk, and risk management for financial instrumentsNotes and accounts receivable – trade are exposed to credit risk in relation to customers. The Group manages the risks by controlling the due dates and outstanding balances by individual customers. Accounts receivable – trade denominated in foreign currencies are exposed to risk of exchange fluctuations and are hedged by utilizing forward foreign exchange contracts. Stocks of investment securities, which are exposed to market fluctuations, are mainly those of other companies with which the Group has business relationships. The Group periodically reviews the fair values of such stocks and the financial position of the issuers. Notes and accounts payable – trade, have payment due dates approximately within one year. Short-term borrowings are raised mainly in connection with business activities, and long-term borrowings are taken out principally for the purpose of making capital investments. Variable rate borrowings are exposed to interest rate fluctuation risk. However, in order to reduce such risk and fix interest expenses, the Group utilizes interest rate swap transactions as a hedging instrument for each individual contract. Assessment of the effectiveness of hedging activities, which meets the requirements for special treatment of interest rate swaps, is omitted. The execution and management of derivative transactions is performed based on the control procedure designated in management policy. In addition, to reduce credit risk, utilizing derivative instruments is restricted to only highly rated financial institutions and major trading companies. Notes and accounts payable – trade and borrowings, the Group prepares its cash flow plans to manage liquidity risk (the risk that the Group may not be able to meet its obligations on scheduled due dates).3. Supplementary explanation of the estimated fair value of financial instrumentsThe notional amounts of derivatives in “(b) Estimated Fair Value of Financial Instruments,” are not necessarily indicative of the actual market risk involved in the derivative transactions.
(b) Estimated Fair Value of Financial Instruments
Notes to Consolidated Financial Statements
011_0600701372709.indd 30 2015/09/08 14:58:26

31
The carrying value of financial instruments on the consolidated balance sheets as of March 31, 2014 and 2015 and estimated fair value is as follows:
2014
Carrying Value *1 Estimated Fair Value *1 Difference
(Millions of yen)
(1) Cash and deposits ¥ 41,654 ¥ 41,654 ¥ —
(2) Notes and accounts receivable – trade 119,503 119,503 —
(3) Investment securities
Stocks of subsidiaries and affiliates 4,146 1,574 (2,572)
Other securities 6,153 6,153 —
(4) Notes and accounts payable-trade (63,279) (63,279) —
(5) Short-term borrowings *2 (62,217) (62,217) —
(6) Bonds (20,818) (20,083) 735
(7) Long-term borrowings *2 (115,633) (115,956) (323)
(8) Derivatives (29) (29) —
*1 Liabilities are shown in parenthesis.*2 The current portion of long-term borrowings is included in long-term borrowings.The carrying value of financial instruments on the consolidated balance sheets as of March 31, 2014 and 2015 and estimated fair value is as follows:
2015
Carrying Value *1 Estimated Fair Value *1 Difference
(Millions of yen)
(1) Cash and deposits ¥ 29,823 ¥ 29,823 ¥ —(2) Notes and accounts receivable – trade 133,976 133,976 —
(3) Investment securities
Stocks of subsidiaries and affiliates 4,696 2,264 (2,432)
Other securities 7,599 7,599 —
(4) Notes and accounts payable-trade (69,060) (69,060) —
(5) Short-term borrowings *2 (70,108) (70,108) —
(6) Bonds (18,921) (18,359) 562
(7) Long-term borrowings *2 (99,961) (100,273) (312)
(8) Derivatives (43) (43) —
2015
Carrying Value *1 Estimated Fair Value *1 Difference
(Thousands of U.S. dollars)
(1) Cash and deposits $ 248,173 $ 248,173 $ —(2) Notes and accounts receivable – trade 1,114,887 1,114,887 —
(3) Investment securities
Stocks of subsidiaries and affiliates 39,078 18,840 (20,238)
Other securities 63,235 63,235 —
(4) Notes and accounts payable-trade (574,686) (574,686) —
(5) Short-term borrowings *2 (583,407) (583,407) —
(6) Bonds (157,452) (152,775) 4,677
(7) Long-term borrowings *2 (831,830) (834,426) (2,596)
(8) Derivatives (358) (358) —
*1 Liabilities are shown in parenthesis.*2 The current portion of long-term borrowings is included in long-term borrowings.
011_0600701372709.indd 31 2015/09/08 14:58:26

32
Notes1. Method for determining the estimated fair value of financial instruments and other matters related to securities and derivative transactions
(1) Cash and deposits, (2) Notes and accounts receivable – trade Since these items are settled in a short period of time, their carrying value approximates fair value.(3) Investment securities
The fair value of stocks is based on quoted market prices. For information on securities classified by holding purpose, refer to Note 5 “Investment Securities.”
(4) Notes and accounts payable – trade, (5) Short-term borrowingsSince these items are settled in a short period of time, their carrying value approximates fair value.
(6) BondsThe fair value of bonds is based on the present value of the total of principal and interest discounted by an interest rate determined taking into account the remaining period of each bond and current credit risk.
(7) Long-term borrowingsThe fair value of long-term borrowings is based on the present value of the total of principal and interest discounted by the interest rate to be applied if similar new borrowings were entered into.
(8) DerivativesRefer to Note 13, “Derivatives” of the notes the consolidated financial statements.
2. Unlisted stock of ¥24,161 million and ¥24,604 million ($204,743 thousand) as of March 31, 2014 and 2015 are not included in “(3) Investment securities” because no quoted market prices are available and it is extremely difficult to measure the fair value.
3. The redemption schedule for receivables and marketable securities with maturities at March 31, 2014 and 2015 are as follows:
2014
Due within one year
Due after one year but within five years
Due after five years but within ten years
Due after ten years
(Millions of yen)
Cash and deposits ¥ 41,621 ¥ — ¥ — ¥ —
Notes and accounts receivable-trade 119,503 — — —
Investment securities
Held-to-maturity securities
Government and municipal bonds 2 7 4 —
Corporate debt securities — 10 — —
¥ 161,126 ¥ 17 ¥ 4 ¥ —
2015
Due within one year
Due after one year but within five years
Due after five years but within ten years
Due after ten years
(Millions of yen)
Cash and deposits ¥ 29,777 ¥ — ¥ — ¥ —
Notes and accounts receivable-trade 133,976 — — —
Investment securities
Held-to-maturity securities
Government and municipal bonds 2 7 3 —
Corporate debt securities — — — —
¥ 163,755 ¥ 7 ¥ 3 ¥ —
Notes to Consolidated Financial Statements
011_0600701372709.indd 32 2015/09/08 14:58:26

33
2015
Due within one year
Due after one year but within five years
Due after five years but within ten years
Due after ten years
(Thousands of U.S. dollars)
Cash and deposits $ 247,791 $ — $ — $ —
Notes and accounts receivable-trade 1,114,887 — — —
Investment securities
Held-to-maturity securities
Government and municipal bonds 17 58 25 —
Corporate debt securities — — — —
$1,362,695 $ 58 $ 25 $ —
4. The redemption schedule for bonds and long-term borrowings at March 31, 2014 and 2015 are as follows:2014
Due within one year
Due after one year but within five years
Due after five years
(Millions of yen)
Bonds ¥ 2,000 ¥ 15,618 ¥ 3,200
Long-term borrowings 26,384 79,814 9,435
¥ 28,384 ¥ 95,432 ¥ 12,635
2015
Due within one year
Due after one year but within five years
Due after five years
(Millions of yen)
Bonds ¥ — ¥ 15,721 ¥ 3,200
Long-term borrowings 25,710 65,012 9,239
¥ 25,710 ¥ 80,733 ¥ 12,439
2015
Due within one year
Due after one year but within five years
Due after five years
(Thousands of U.S. dollars)
Bonds $ — $ 130,823 $ 26,629
Long-term borrowings 213,947 541,000 76,883
$ 213,947 $ 671,823 $ 103,512
011_0600701372709.indd 33 2015/09/08 14:58:27

34
8. OTHER COMPREHENSIVE INCOMEEach component of other comprehensive income for the year ended March 31, 2014 and 2015 were as follows:
2014 2015 2015
(Millions of yen)(Thousands of U.S. dollars)
Unrealized gains on securities:Amount arising during the year ¥ 1,335 ¥ 1,411 $ 11,742Reclassification adjustments for gains and losses realized in net income 2 — —Before-tax amount 1,337 1,411 11,742Tax benefit (461) (307) (2,555)Net-of-tax amount 876 1,104 9,187
Unrealized gains (losses) on hedges: Amount arising during the year (3) 77 641Reclassification adjustments for gains and losses realized in net income 20 (96) (799)Before-tax amount 17 (19) (158)Tax benefit (4) 4 33Net-of-tax amount 13 (15) (125)
Foreign currency translation adjustments:Amount arising during the year 1,223 2,317 19,281
Remeasurements of defined benefit plans:Amount arising during the year — 869 7,231Reclassification adjustments for gains and losses realized in net income — (342) (2,846)Before-tax amount — 527 4,385Tax benefit — 234 1,948Net-of-tax amount — 761 6,333
Equity of other comprehensive income of affiliates:Amount arising during the year 892 1,524 12,682
Total other comprehensive income ¥ 3,004 ¥ 5,691 $ 47,358
9. RETIREMENT BENEFIT PLANSThe Company and its domestic subsidiaries have defined benefit corporate pension plans and a lump-sum payment retirement benefit plans covering substantially all employees in Japan. Additional benefits may be granted to employees according to the conditions under which termination of employment occurs. Certain consolidated subsidiaries use the simplified method for calculation of retirement benefit obligation. Certain foreign subsidiaries have defined contribution pension plans. The changes in the retirement benefit obligation during the years ended March 31, 2014 and 2015 are as follows:
2014 2015 2015
(Millions of yen)(Thousands of U.S. dollars)
Balance at the beginning of the year ¥ 31,294 ¥ 31,391 $ 261,222Cumulative effects of changes in accounting policies — 2,320 19,306
Restated balance at the beginning of the year 31,294 33,711 280,528Increase by acquisition of a consolidated subsidiary — 983 8,180Service cost 1,451 1,868 15,545Interest cost 445 442 3,678Actuarial gain or loss (48) 451 3,753Retirement benefits paid (1,751) (1,639) (13,639)Others — 444 3,694
Balance at the end of the year ¥ 31,391 ¥ 36,260 $ 301,739
Notes to Consolidated Financial Statements
011_0600701372709.indd 34 2015/09/08 14:58:27
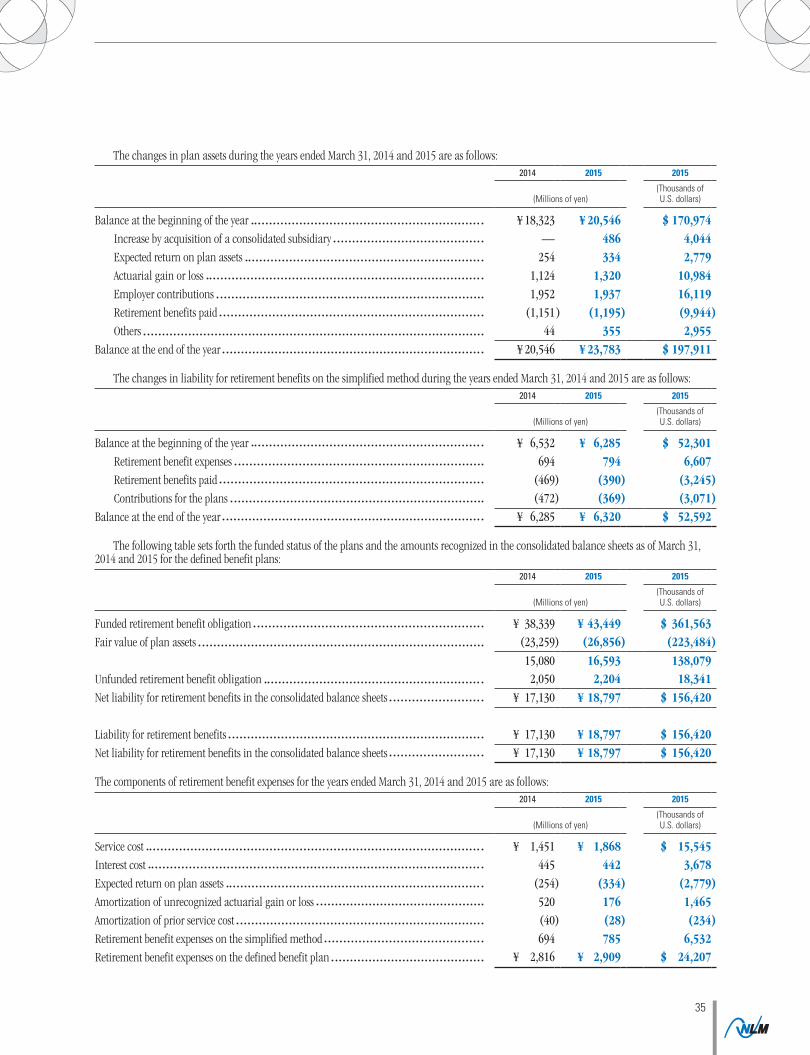
35
The changes in plan assets during the years ended March 31, 2014 and 2015 are as follows:2014 2015 2015
(Millions of yen)(Thousands of U.S. dollars)
Balance at the beginning of the year ¥ 18,323 ¥ 20,546 $ 170,974Increase by acquisition of a consolidated subsidiary — 486 4,044Expected return on plan assets 254 334 2,779Actuarial gain or loss 1,124 1,320 10,984Employer contributions 1,952 1,937 16,119Retirement benefits paid (1,151) (1,195) (9,944)Others 44 355 2,955
Balance at the end of the year ¥ 20,546 ¥ 23,783 $ 197,911
The changes in liability for retirement benefits on the simplified method during the years ended March 31, 2014 and 2015 are as follows:2014 2015 2015
(Millions of yen)(Thousands of U.S. dollars)
Balance at the beginning of the year ¥ 6,532 ¥ 6,285 $ 52,301Retirement benefit expenses 694 794 6,607Retirement benefits paid (469) (390) (3,245)Contributions for the plans (472) (369) (3,071)
Balance at the end of the year ¥ 6,285 ¥ 6,320 $ 52,592
The following table sets forth the funded status of the plans and the amounts recognized in the consolidated balance sheets as of March 31, 2014 and 2015 for the defined benefit plans:
2014 2015 2015
(Millions of yen)(Thousands of U.S. dollars)
Funded retirement benefit obligation ¥ 38,339 ¥ 43,449 $ 361,563Fair value of plan assets (23,259) (26,856) (223,484)
15,080 16,593 138,079Unfunded retirement benefit obligation 2,050 2,204 18,341Net liability for retirement benefits in the consolidated balance sheets ¥ 17,130 ¥ 18,797 $ 156,420
Liability for retirement benefits ¥ 17,130 ¥ 18,797 $ 156,420Net liability for retirement benefits in the consolidated balance sheets ¥ 17,130 ¥ 18,797 $ 156,420
The components of retirement benefit expenses for the years ended March 31, 2014 and 2015 are as follows:2014 2015 2015
(Millions of yen)(Thousands of U.S. dollars)
Service cost ¥ 1,451 ¥ 1,868 $ 15,545Interest cost 445 442 3,678Expected return on plan assets (254) (334) (2,779)Amortization of unrecognized actuarial gain or loss 520 176 1,465Amortization of prior service cost (40) (28) (234)Retirement benefit expenses on the simplified method 694 785 6,532Retirement benefit expenses on the defined benefit plan ¥ 2,816 ¥ 2,909 $ 24,207
011_0600701372709.indd 35 2015/09/08 14:58:27

36
The components of retirement benefits liability adjustments included in other comprehensive income (before tax effect) for the years ended March 31, 2014 and 2015 are as follows:
2014 2015 2015
(Millions of yen)(Thousands of U.S. dollars)
Prior service cost ¥ — ¥ 78 $ 649
Actuarial loss — (605) (5,035)
Total ¥ — ¥ (527) $ (4,386)
Remeasurements of defined benefits plans included in accumulated other comprehensive income (before tax effect) as of March 31, 2014 and 2015 as follows:
2014 2015 2015
(Millions of yen)(Thousands of U.S. dollars)
Unrecognized prior service cost ¥ (330) ¥ (252) $ (2,097)
Unrecognized actuarial gain or loss 1,203 598 4,976
Total ¥ 873 ¥ 346 $ 2,879
The fair value of plan assets, by major category, as a percentage of total plan assets as of March 31, 2014 and 2015 as follows:2014 2015
General account 34% 32%Domestic bonds 17% 21%Foreign stocks 16% 15%Domestic stocks 15% 13%Foreign bonds 8% 9%Others 10% 10%Total 100% 100%
The total fair value of plan assets includes 4% and 3% of the retirement benefit trust set to the corporate pension plan at March 31, 2014 and 2015 separately. The expected return on assets has been estimated based on the anticipated allocation to each asset class and the expected long-term returns on assets held in each category. The assumptions used in accounting for the above plans were as follows:
2014 2015
Discount rate 1.5% 1.0%Expected rate of return on plan assets 1.5% 1.0%
Required contribution of the consolidated subsidiaries for the defined contribution pension plans as of March 31, 2014 and 2015 as follows:2014 2015 2015
(Millions of yen)(Thousands of U.S. dollars)
Required contribution ¥ 2 ¥ 3 $ 25
The Company and its domestic consolidated subsidiaries have defined benefit corporate pension plans and a non-contributory plan covering
Notes to Consolidated Financial Statements
011_0600701372709.indd 36 2015/09/08 14:58:27

37
10. INCOME TAXESSignificant components of deferred tax assets and liabilities at March 31, 2014 and 2015 were as follows:
2014 2015 2015
(Millions of yen)(Thousands of U.S. dollars)
Deferred tax assets:Tax loss carry forwards ¥ 19,614 ¥ 15,249 $ 126,895Net defined benefit liabilities 5,943 6,243 51,951Unrealized intercompany loss 3,254 2,906 24,182Accrued bonuses 1,840 1,679 13,972Allowance for doubtful accounts 1,812 1,702 14,163Loss on disposal of fixed assets 918 827 6,882Other 9,377 10,201 84,889
Total deferred tax assets 42,758 38,807 322,934Valuation allowance (23,942) (21,087) (175,476)Total deferred tax assets, net of valuation allowance 18,816 17,720 147,458Deferred tax liabilities:
Unrealized gain on securities (1,187) (1,494) (12,432)Revaluation gain on subsidiaries (1,134) (1,029) (8,563)Unrealized intercompany profit (1,061) (962) (8,005)Negative Goodwill (390) — —Other (417) (809) (6,732)
Total deferred tax liabilities (4,189) (4,294) (35,733)Net deferred tax assets ¥ 14,627 ¥ 13,426 $ 111,725
Deferred tax assets and liabilities that comprise net deferred tax assets are included in the accompanying consolidated balance sheets as follows:2014 2015 2015
(Millions of yen)(Thousands of U.S. dollars)
Deferred tax assets (current assets) ¥ 4,507 ¥ 5,008 $ 41,674Deferred tax assets (investments and other assets) 10,602 9,146 76,109Other long-term liabilities (482) (728) (6,058)
In addition to the above, the Company recorded deferred tax liabilities on land revaluation surplus of ¥452 million and ¥410 million ($3,412 thousand) at March 31, 2014 and 2015 separately. A reconciliation of the differences between the statutory income tax rate and the effective income tax rate for the years ended March 31, 2014 and 2015 was summarized as follows:
2014 2015
Statutory income tax rate —% 35.6%Increase (decrease) in taxes resulting from:
Decrease in deferred tax assets due to a change in tax rate 11.9Amortization of goodwill 1.5Permanent non-deductible expenses 1.1Inhabitant taxes per capita 1.0Valuation allowance (12.9)Equity in earnings of affiliates (4.6)Other ) (1.4)
Effective income tax rate % 32.2%
Since the difference between the statutory income tax rate and effective income tax rate was equal or less than 5% of the statutory income tax rate, the reconciliation for the year ended March 31, 2014 is not presented.
011_0600701372709.indd 37 2015/09/08 14:58:27
38
The “Act for Partial Amendment of the Income Tax Act, etc.”(ACT No. 9 of 2015) and the “Act for Partial Amendment of the Local Tax Act, etc.” (Act No. 2 of 2015) were promulgated on March 31, 2015. As a result, the effective statutory tax rate used to measure the Company’s deferred tax assets and liabilities was changed from 35.6% to 33.1% and 32.3% for the temporary differences expected to be realized or settled in the year beginning April 1, 2015 and for the temporary differences expected to be realized or settled from April 1, 2016, respectively. The effect of the announced reduction of the effective statutory tax rate was to decrease deferred tax assets, after offsetting deferred tax liabilities, by ¥685 million ($5,700 thousand) and deferred tax liabilities on land revaluation surplus by ¥42 million ($350 thousand), and increase deferred income tax expense by ¥831 million ($6,915 thousand), net unrealized gains on securities by ¥150 million ($1,248 thousand), increase net unrealized gains on hedges by ¥0 million ($0 thousand), and remeasurements of defined benefit plans by ¥34 million ($283 thousand) as of the year ended March 31, 2015. Deductible amount is limited to 65% of taxable income in the year beginning on or after April 1, 2015 and 50% in the year beginning on or after April 1, 2017. The effective of this change was to decrease deferred tax assets by ¥1,097 million ($9,129 thousand) and increase deferred income tax expense by ¥1,097 million ($9,129 thousand).
11. APPROPRIATIONS OF RETAINED EARNINGSThe following appropriation was approved at the ordinary general meeting of shareholders of the Company held on June 24, 2015:
(Millions of yen) (Thousands of U.S. dollars)
Cash dividends ¥2,720 $22,635
The Company is required to obtain the approval of shareholders at an ordinary general meeting of shareholders for appropriations of retained earnings in conformity with the Corporation Law. Appropriations of retained earnings are, therefore, not reflected in the consolidated financial statements for the year to which they relate but are recorded in the consolidated financial statements in the subsequent year after shareholders’ approval has been obtained.
12. REVALUATION SURPLUSA consolidated subsidiary of the Company revalued its land used for business purposes in accordance with the Land Revaluation Law, when it was an affiliate. As a result of this revaluation, the Company recognized its portion of the affiliate’s revaluation surplus and the related deferred tax liabilities.
13. DERIVATIVESIn the normal course of business, the Company and its consolidated subsidiaries utilize various derivative financial instruments in order to manage the exposure resulting from fluctuation in foreign currency exchange rates, interest rates and the prices of aluminum ingot in the market. The Company and its consolidated subsidiaries do not hold or issue derivative financial instruments for trading purposes.
14. NOTES TO CONSOLIDATED STATEMENT OF INCOMEInventoriesThe amount of inventories written down due to a decline in profitability for the years ended March 31, 2014 and 2015 was ¥(227) million and ¥173 million ($1,440 thousand), respectively which is included in cost of sales.Selling, general and administrative expenses
2014 2015 2015
(Millions of yen)(Thousands of U.S. dollars)
Freight charges ¥11,142 ¥11,487 $ 95,590
Salaries, allowances and bonuses 16,412 16,808 139,869
Research and DevelopmentResearch and development costs charged to cost of sales and selling, general and administrative expenses for the years ended March 31, 2014 and 2015 was ¥4,984 million and ¥4,495 ($37,405 thousand), respectively.Gain on sales of fixed assets
2014 2015 2015
(Millions of yen)(Thousands of U.S. dollars)
Land ¥ — ¥1,397 $11,625
15. CONTINGENT LIABILITIESContingent liabilities at March 31, 2015 amounted to ¥960 million ($7,989 thousand) for loans guaranteed and other guarantees given in the ordinary course of business.
Notes to Consolidated Financial Statements
011_0600701372709.indd 38 2015/09/08 14:58:27
39
16. LOSS ON IMPAIRMENT OF FIXED ASSETSThe domestic consolidated subsidiaries recognized ¥412 million of loss on impairment of fixed assets included in loss on closing plant in the consolidated statements of income, of which the significant items for the year ended March 31, 2014 were as follows:
2014
Location Major use Asset category (Millions of yen)
Shizuoka City,Shizuoka Prefecture
Operating assets Buildings and structures ¥ 165Machinery and equipment 108
Fukuroi City,Shizuoka Prefecture
Operating assets Buildings and structures ¥ 132Machinery and equipment 7Tools, furniture and fixtures 0
The domestic consolidated subsidiaries recognized an impairment loss of ¥273 million for the aluminum electrolytic business in Shizuoka City, Shizuoka Prefecture and the carry amounts of the relevant assets were written down to the memorandum value because of exiting from its business. The domestic consolidated subsidiaries recognized an impairment loss of ¥139 million for the operating of the secondary aluminum alloy business in Fukuroi City, Shizuoka Prefecture and carry amounts of the relevant assets were written down to the memorandum value because the plant has exited from the business. The domestic consolidated subsidiaries has grouped the operating assets by the independent operating division which generates cash flows, the rental assets by administrative business division and idle assets by individual asset itself. The domestic consolidated subsidiaries recognized ¥6,201 million ($51,602 thousand) of loss on impairment of fixed assets in the consolidated statements of income, of which the significant items for the year ended March 31, 2015 were as follows:
2015
Location Major use Asset category (Millions of yen)(Thousands ofU.S. dollars)
Shizuoka City,Shizuoka Prefecture
Operating assets Machinery and equipment ¥ 2,870 $ 23,883Buildings and structures 2,455 20,429Others 19 158
¥ 5,344 $ 44,470
Since the cash flows generated from operating activities resulting from the use of the groups of assets have been continuously negative, the consolidated subsidiaries recognized an impairment loss of ¥5,344 million ($44,470 thousand) after noting a sign of impairment and evaluating a necessity of the impairment loss. The recoverable amounts of the asset groups were measured at their respective value in use and cash flows were calculated at a discount rate of 3.5%. The consolidated subsidiaries has grouped the operating assets by the independent operating division which generates cash flows, the rental assets by administrative business division and idle assets by individual asset itself.
17. LOSS ON DISPOSAL OF FIXED ASSETS2014 2015 2015
(Millions of yen)(Thousands of U.S. dollars)
Software ¥612 ¥ — $ —
18. AMOUNTS PER SHARENet income and net assets per share for the years ended and as of March 31, 2014 and 2015 were summarized as follows:1. Policy for financial instruments
2014 2015
(Millions of shares)
Weighted average number of shares 543,865 543,835
Effect of convertible bonds 23,219 75,000
Diluted number of shares 567,084 618,835
011_0600701372709.indd 39 2015/09/08 14:58:27

40
2. Net income per share2014 2015 2015
(Millions of yen)(Thousands of U.S. dollars)
Net income ¥ 5,128 ¥ 9,645 $ 80,261
2014 2015 2015
(yen) (U.S. dollars)
Net income per share ¥ 9.43 ¥ 17.74 $ 0.15Diluted net income per share ¥ 9.04 ¥ 15.59 $ 0.13
3. Net asset per share2014 2015 2015
(Millions of yen)(Thousands of U.S. dollars)
Total net assets ¥ 121,194 ¥ 137,385 $ 1,143,255
Less: minority interestss (10,778) (15,963) (132,837)
Net assets attributable to shares of common stocks ¥ 110,416 ¥ 121,422 $ 1,010,418
2014 2015 2015
(yen) (U.S. dollars)
Net assets per share ¥ 203.03 ¥ 223.27 $ 1.86
19. BUSINESS COMBINATION(a) Business combination through acquisition
1) Name of acquired companies and outline of businessName of acquired companiesToyo Rikagaku Kenkyusho Co., Ltd (hereinafter referred to as “Toyo Rika”) and its subsidiary, Toyo Precision Appliance (Kunshan) Co., LtdOutline of businessManufacturing and sales of various metal products and metal surface treatment
2) Reason for business combinationTo lead synergistic benefits through the greater use of the Company group’s business network and management resources in Japan and overseas and of Toyo Rika’s management resources in Japan and China. The Company group and Toyo Rika will reinforce their partnership through strategic initiatives, including integration of their resources.
3) Date of business combinationJanuary 20, 2015
4) Legal form of business combinationAcquisition of shares for cash consideration
5) Post-business combination company nameNo change
6) Percentage of voting shared acquired
Voting rights held immediately before stock acquisition 25.3%
Percentage of additional voting rights acquired on the date of business combination 26.3%
Voting rights after stock acquisition 51.6%
7) Main basis for determining acquired companyThe Company acquired shares with cash.
(b) The acquired companies are included in the consolidated financial statements from January 1, 2015 to March 31, 2015
Notes to Consolidated Financial Statements
011_0600701372709.indd 40 2015/09/08 14:58:27

41
(c) Cost of acquisition and its components
(Millions of yen)(Thousands of U.S. dollars)
The fair value of common stock of Toyo Rika held immediately before stock acquisition ¥ 647 $ 5,384
The fair value of additional common stock of Toyo Rika acquired on the date of business combination 716 5,958
Acquisition cost of the acquired company ¥ 1,363 $ 11,342
(d) The difference between acquisition cost of the acquired company and the total costs of stock acquisition transactions
(Millions of yen)(Thousands of U.S. dollars)
Loss on step acquisitions ¥ 569 $ 4,735
(e) Amount of gain on negative goodwill and the reason for occurrence1) Amount of gain on negative goodwill
¥604 million ($5,026 thousand)2) Reason for occurrence
The difference between the Company’s interests in the acquired company’s equity and the acquisition cost.(f) Amount of assets acquired and liabilities assumed on the day of the acquisition
1) Assets
(Millions of yen)(Thousands of U.S. dollars)
Current assets ¥ 7,491 $ 62,337
Non-current assets 7,900 65,740
Total assets ¥ 15,391 $ 128,077
2) Liabilities
(Millions of yen)(Thousands of U.S. dollars)
Current liabilities ¥ 7,233 $ 60,190
Long-term liabilities 2,392 19,905
Total liabilities ¥ 9,625 $ 80,095
011_0600701372709.indd 41 2015/09/08 14:58:27

42
20. SEGMENT INFORMATIONThe reportable segments are components of the Company and its consolidated subsidiaries, for which their discrete financial information is available, and whose operating results are regularly reviewed by the Board of Directors to make decisions about resources to be allocated to the segments and assess their performance. The Company and its consolidated subsidiaries operate within four distinct business segments mainly in Japan: “Aluminum ingot and chemicals,” “Aluminum sheet and extrusions,” “Fabricated products and others” and “Aluminum foil, powder and paste.” The “Aluminum ingot and chemicals” segment supplies aluminum remelted ingot used for various industrial materials, and produces a wide spectrum of alumina and alumina hydrates ranging from raw materials to basic materials for ceramic compounds. The “Aluminum sheet and extrusions” segment produces sheet, coil, and extrusion products consisting primarily of shapes, tubes and rods. The “Fabricated products and others” segment produces a variety of products which include wing bodies for transport vehicles, automobile components and electronic materials. The “Aluminum foil, powder and paste” segment produces aluminum foil and aluminum powder used for various fields, such as daily necessaries, energy, electronics and automobile. “Corporate items” includes unallocated operating expenses and corporate assets not specifically related to reportable segments. Reportable segment information for the years ended March 31, 2014 and 2015 was as follows:
2014
The reportable segments
Aluminum ingot and chemicals
Aluminum sheet and extrusions
Fabricated products
and others
Aluminum foil, powder and paste
Adjustment(Note 1) Consolidated
(Millions of yen)
Net sales Customers ¥ 105,488 ¥ 71,274 ¥ 132,261 ¥ 93,806 ¥ — ¥ 402,829Intersegment 39,064 19,273 10,164 541 (69,042) —
Total 144,552 90,547 142,425 94,347 (69,042) 402,829Operating profit ¥ 2,917 ¥ 2,668 ¥ 7,224 ¥ 2,889 ¥ (3,081) ¥ 12,617Segment assets ¥ 113,979 ¥ 87,469 ¥ 132,355 ¥ 98,424 ¥ 311 ¥ 432,538Depreciation and amortization ¥ 4,156 ¥ 4,014 ¥ 3,296 ¥ 4,818 ¥ 151 ¥ 16,435Amortization of goodwill ¥ — ¥ — ¥ — ¥ 682 ¥ — ¥ 682Loss on impairment of fixed assets ¥ 412 ¥ — ¥ — ¥ — ¥ — ¥ 412Investment in equity-method affiliates ¥ 3,543 ¥ 6,509 ¥ 4,506 ¥ 3,045 ¥ – ¥ 17,603Capital expenditures ¥ 3,141 ¥ 4,163 ¥ 3,247 ¥ 3,153 ¥ 297 ¥ 14,001
(Note 1).Adjustments amounts are as follows.1)Adjustments of ¥(3,081) million in segment profit are general corporate expenses.2)Adjustments of ¥311 million in segment assets include ¥(32,023) million in the elimination of transactions between segments and
¥32,334 million in corporate assets.3)Adjustments of ¥151 million in depreciation and amortization expenses have primarily to do with corporate assets.4)Adjustments of ¥297 million for capital expenditures are the increase in corporate assets.
2015
The reportable segments
Aluminum ingot and chemicals
Aluminum sheet and extrusions
Fabricated products
and others
Aluminum foil, powder and paste
Adjustment(Note 1) Consolidated
(Millions of yen)
Net sales Customers ¥ 114,339 ¥ 82,823 ¥ 138,088 ¥ 96,227 ¥ — ¥ 431,477Intersegment 47,570 22,383 11,040 572 (81,565) —
Total 161,909 105,206 149,128 96,799 (81,565) 431,477Operating profit ¥ 6,069 ¥ 4,230 ¥ 7,704 ¥ 4,183 ¥ (2,881) ¥ 19,305Segment assets ¥ 119,824 ¥118,974 ¥ 136,224 ¥101,476 ¥ (19,221) ¥ 457,277Depreciation and amortization ¥ 4,292 ¥ 4,004 ¥ 3,601 ¥ 4,335 ¥ 174 ¥ 16,406Amortization of goodwill ¥ — ¥ — ¥ 19 ¥ 653 ¥ — ¥ 672Loss on impairment of fixed assets ¥ 5,443 ¥ — ¥ 84 ¥ 674 ¥ — ¥ 6,201Investment in equity-method affiliates ¥ 4,010 ¥ 7,953 ¥ 5,276 ¥ 3,411 ¥ — ¥ 20,650Capital expenditures ¥ 3,529 ¥ 5,269 ¥ 3,440 ¥ 3,458 ¥ 173 ¥ 15,869
Notes to Consolidated Financial Statements
011_0600701372709.indd 42 2015/09/08 14:58:27

43
2015
The reportable segments
Aluminum ingot and chemicals
Aluminum sheet and extrusions
Fabricated products and
others
Aluminum foil, powder and paste
Adjustment(Note 1) Consolidated
(Thousands of U.S. dollars)
Net salesCustomers $ 951,477 $ 689,215 $ 1,149,105 $ 800,758 $ — $ 3,590,555 Intersegment 395,856 186,261 91,870 4,760 (678,747) —
Total 1,347,333 875,476 1,240,975 805,518 (678,747) 3,590,555Operating profit $ 50,503 $ 35,200 $ 64,109 $ 34,809 $ (23,975) $ 160,648 Segment assets $ 997,121 $ 990,047 $ 1,133,594 $ 844,437 $ (159,948) $ 3,805,251 Depreciation and amortization $ 35,716 $ 33,319 $ 29,966 $ 36,074 $ 1,448 $ 136,523 Amortization of goodwill $ — $ — $ 158 $ 5,434 $ — $ 5,592 Loss on impairment of fixed assets $ 45,294 $ — $ 699 $ 5,609 $ — $ 51,602 Investment in equity-method affiliates $ 33,369 $ 66,181 $ 43,904 $ 28,386 $ — $ 171,840 Capital expenditures $ 29,367 $ 43,846 $ 28,626 $ 28,776 $ 1,440 $ 132,055
(Note 1).Adjustments amounts are as follows.1)Adjustments of ¥(2,881) million ($(23,975) thousands) in segment profit are general corporate expenses.2)Adjustments of ¥(19,221) million ($(159,948) thousands) in segment assets include ¥(38,099) million ($(317,043) thousands) in the
elimination of transactions between segments and ¥18,878 million ($157,095 thousands) in corporate assets.3)Adjustments of ¥174 million ($1,448 thousands) in depreciation and amortization expenses have primarily to do with corporate assets.4)Adjustments of ¥173 million ($1,440 thousands) for capital expenditures are the increase in corporate assets
Geographical sales for the years ended March 31, 2014 and 2015 were summarized as follows:2014 2015 2015
Japan Other Total Japan Other Total Japan Other Total
(Millions of yen) (Millions of yen) (Thousands of U.S. dollars)
¥335,035 ¥67,794 ¥402,829 ¥349,752 ¥81,725 ¥431,477 $2,910,477 $680,078 $3,590,555
Geographical property, plant and equipment for the year ended March 31, 2014 and 2015 were summarized as follows:2014 2015 2015
Japan Other Total Japan Other Total Japan Other Total
(Millions of yen) (Millions of yen) (Thousands of U.S. dollars)
¥135,067 ¥15,834 ¥150,901 ¥129,381 ¥23,854 ¥153,235 $1,076,650 $198,502 $1,275,152
011_0600701372709.indd 43 2015/09/08 14:58:27

44
Report Of Independent Auditors
011_0600701372709.indd 44 2015/09/08 14:58:28

45
OVERSEAS SUBSIDIARIES AND AFFILIATES
East AsiaNikkei MC Aluminum(Kunshan) Co., Ltd.Kunshan, ChinaPhone: 86-512-5763-1946Aluminum alloys(85%)
Nikkei (Shanghai) Body Parts Co., Ltd. Shanghai, ChinaPhone: 86-21-5986-9388Automobile components(100%)
Nikkei (Shanghai) International Trading Co., Ltd. Shanghai, ChinaPhone: 86-21-6236-9658Sales and marketing bases(100%)
NI Nikkei Shenzhen Co., Ltd.Shenzhen, ChinaPhone: 86-755-2650-5656Automobile components(55%)
Nonfemet International (China-Canada-Japan) Aluminium Co., Ltd.Shenzhen, ChinaPhone: 86-755-2661-1569Extrusion(18%)
Toyal Zhaoqing Co., Ltd.Zhaoqing, ChinaPhone: 86-758-3602-160Aluminum paste(90%)
Toyo Tokai Aluminium Hanbai (Shanghai) Co., Ltd.Shanghai, ChinaPhone: 86-21-5257-4116Trading and marketing(100%)
Sam-A Aluminium Co., Ltd.Seoul, KoreaPhone: 82-02-3458-0600Aluminum foil, paste(33%)
North AmericaNikkei MC Aluminum America Inc.Indiana, U.S.A.Phone: 1-812-342-1141Aluminum alloys(60%)
Toyal America Inc.Illinois, U.S.A.Phone: 1-630-505-2160Aluminum powder and paste(100%)
EuropeToyal Europe Société par Actions Simplifiée UnipersonnelleAccous, FrancePhone: 33-0559983535Aluminum powder and paste(100%)
Southeast AsiaNikkei MC Aluminum(Thailand) Co., Ltd.ThailandPhone: 66-3852-2296-9Aluminum alloys(79%)
Nikkei Siam Aluminium LimitedThailandPhone: 66-2-529-5299Aluminum sheet, foil(100%)
Nikkei SingaporeAluminium Pte. Ltd.SingaporePhone: 65-6293-3770Trading and marketing(100%)
(As of July 31, 2015)
Overseas Network
011_0600701372709.indd 45 2015/09/08 14:58:28
46
Directors
Chairman of the Board and director
Takashi Ishiyama
President
Representative Director
Ichiro Okamoto
President and CEO of Nippon Light Metal Co., Ltd
Directors
Toshihide Murakami
Yasunori Okamoto
Mikio Shimizu
President and Representative Director of Nikkeikin
Kakoh Kaihatsu Holdings Company, Ltd.
Masao Imasu
Hiroshi Yamamoto
President and CEO of Toyo Aluminium K.K.
Koji Ueno
President and CEO of Nippon Fruehauf Co., Ltd.
Hiroyasu Hiruma
President and CEO of Nikkei Panel System Co., Ltd.
Shozo Hamamura
President and CEO of Nikkei MC Aluminium Co., Ltd.
Masato Ono*1
Ryoichi Hayashi*1
*1 Outside Director
Audit & Supervisory Board Member
Tadashi Asahi
Nobuo Matsumoto
Koji Fukui
Yuzuru Fujita*2
Katsuo Wajiki*2
Yasuo Yuki*2
*2 Outside Member
Officers
Takashi Hara
Masamichi Ueda
Hirokazu Takatoku
Minoru Sotoike
Hideki Amimura
Takayuki Tsuchida
(As of June 24, 2015)
Directors And Officers
011_0600701372709.indd 46 2015/09/08 14:58:28
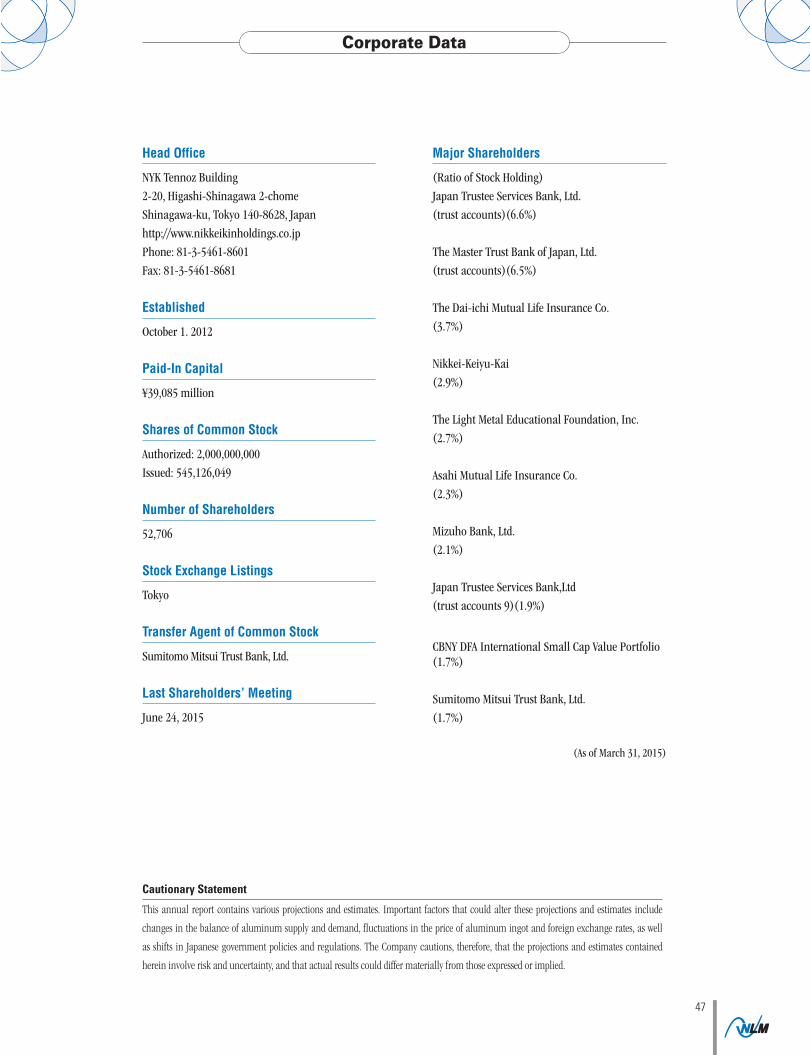
47
2012 20122013 20132014 2014 20142015 2015 2015
Billions of yen Years ended March 31
Net Sales
Billions of yen Years ended March 31
Operating Profit
Billions of yen As of March 31
Total Assets
2010 2010 20102011 2012 2013 2011 2011
Nippon Light Metal Company, Ltd.
Nippon Light Metal Holdings Company, Ltd.
Nippon Light Metal Company, Ltd.
Nippon Light Metal Holdings Company, Ltd.
Nippon Light Metal Company, Ltd.
Nippon Light Metal Holdings Company, Ltd.
600
450
300
150
0
600
450
300
150
0
30
24
18
12
6
0
Corporate DataProfile
Consolidated Financial Highlight
Cautionary Statement
This annual report contains various projections and estimates. Important factors that could alter these projections and estimates include
changes in the balance of aluminum supply and demand, fluctuations in the price of aluminum ingot and foreign exchange rates, as well
as shifts in Japanese government policies and regulations. The Company cautions, therefore, that the projections and estimates contained
herein involve risk and uncertainty, and that actual results could differ materially from those expressed or implied.
Since its establishment, the NLM Group has been Japan’s sole fully integrated aluminum manufacturer
offering varieties of products ranging from aluminum raw material to fabricated products.
Aluminum has properties that make it a superb industrial material: it is lightweight and has
excellent processability, corrosion resistance, thermal conductivity, and recyclability. Nippon Light
Metal applies its core strengths — a wealth of knowledge about aluminum and its characteristics and
technological capabilities that have been developed over many years — to supply a highly diversified
range of products to a number of key industrial sectors, including the automotive, electrical and
electronics, information and telecommunication, environment, safety, energy, construction, railroad,
and food products industries.
By carrying on development of new applications for aluminum and aluminum materials, the
NLM Group is to continue to support customers in wide-ranging industrial sectors and contribute to
improving the quality of people’s lives and protection of the environment.
2014 2015 2015
Millions of yenThousands ofU.S. dollars
For the year:Net sales ¥402,829 ¥431,477 $3,590,555 Operating profit 12,617 19,305 160,648 Net income 5,128 9,645 80,261
At year-end:Total assets 432,538 457,277 3,805,251 Net assets 121,194 137,385 1,143,255 Short-term borrowings and long-term debt, including bonds and capital lease obligation 202,619 192,594 1,602,680
Head Office
NYK Tennoz Building2-20, Higashi-Shinagawa 2-chomeShinagawa-ku, Tokyo 140-8628, Japanhttp://www.nikkeikinholdings.co.jpPhone: 81-3-5461-8601Fax: 81-3-5461-8681
Established
October 1. 2012
Paid-In Capital
¥39,085 million
Shares of Common Stock
Authorized: 2,000,000,000Issued: 545,126,049
Number of Shareholders
52,706
Stock Exchange Listings
Tokyo
Transfer Agent of Common Stock
Sumitomo Mitsui Trust Bank, Ltd.
Last Shareholders’ Meeting
June 24, 2015
Major Shareholders
(Ratio of Stock Holding)Japan Trustee Services Bank, Ltd.(trust accounts)(6.6%)
The Master Trust Bank of Japan, Ltd.(trust accounts)(6.5%)
The Dai-ichi Mutual Life Insurance Co.(3.7%)
Nikkei-Keiyu-Kai(2.9%)
The Light Metal Educational Foundation, Inc.(2.7%)
Asahi Mutual Life Insurance Co.(2.3%)
Mizuho Bank, Ltd.(2.1%)
Japan Trustee Services Bank,Ltd(trust accounts 9)(1.9%)
CBNY DFA International Small Cap Value Portfolio(1.7%)
Sumitomo Mitsui Trust Bank, Ltd.(1.7%)
(As of March 31, 2015)
Nippon Light Metal Holdings Company, Ltd. and its consolidated subsidiaries Years ended March 31
005_0600701372709.indd 2 2015/09/09 15:41:40
Nippon Light Metal Holdings Company, Ltd.
NYK Tennoz Building, 2-20, Higashi-Shinagawa 2-chome
Shinagawa-ku, Tokyo 140-8628, Japan
http://www.nikkeikinholdings.co.jp
Printed in Japan
ANNUAL REPORT 2015Year ended March 31, 2015
NIPPO
N LIG
HT M
ETAL H
OLD
ING
S COM
PAN
Y, LTD. A
NN
UA
L REPORT 2015
005_0600701372709.indd 1 2015/09/09 15:41:39